




UPDATE: Natural Gas Inventory -89 bcf vs -83 bcf Expected

FREE Breaking News Alerts from StreetInsider.com!
StreetInsider.com Top Tickers, 10/7/2026
- Wall Street ends lower, off record highs, as Treasury yields climb
- Want to be a stock market bear? BCA says watch potential U.S. tax increases
- SpaceX seeks $40bn in financing for Nvidia chip purchase
- Chip stock could soar nearly 200%, analyst says: "If you don’t buy it, they will"
- Musk rules out TSMC role in Terafab operations; Intel gains
 Tweet
Tweet Share
Share E-mail
- Natural Gas Inventory -89 bcf vs -83 bcf Expected
Working gas in storage was 2,356 Bcf as of Friday, February 17, 2017, according to EIA estimates. This represents a net decrease of 89 Bcf from the previous week. Stocks were 261 Bcf less than last year at this time and 156 Bcf above the five-year average of 2,200 Bcf. At 2,356 Bcf, total working gas is within the five-year historical range.
| Stocks billion cubic feet (Bcf) | Year ago (02/17/16) | 5-year average (2012-16) | |||||||||||||||||||||||
| Region | 02/17/17 | 02/10/17 | net change | implied flow | Bcf | % change | Bcf | % change | |||||||||||||||||
| East | 431 | 479 | -48 | -48 | 528 | -18.4 | 472 | -8.7 | |||||||||||||||||
| Midwest | 612 | 642 | -30 | -30 | 658 | -7.0 | 532 | 15.0 | |||||||||||||||||
| Mountain | 146 | 150 | -4 | -4 | 147 | -0.7 | 137 | 6.6 | |||||||||||||||||
| Pacific | 206 | 205 | 1 | 1 | 256 | -19.5 | 240 | -14.2 | |||||||||||||||||
| South Central | 961 | 969 | -8 | -8 | 1,029 | -6.6 | 819 | 17.3 | |||||||||||||||||
| Salt | 328 | 332 | -4 | -4 | 282 | 16.3 | 201 | 63.2 | |||||||||||||||||
| Nonsalt | 633 | 636 | -3 | -3 | 747 | -15.3 | 618 | 2.4 | |||||||||||||||||
| Total | 2,356 | 2,445 | -89 | -89 | 2,617 | -10.0 | 2,200 | 7.1 | |||||||||||||||||
For information on sampling error in this report, see Estimated Measures of Sampling Variability table below.
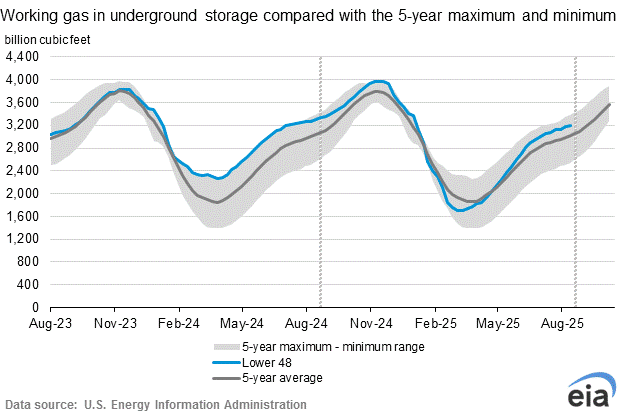
Note: The shaded area indicates the range between the historical minimum and maximum values for the weekly series from 2012 through 2016. The dashed vertical lines indicate current and year-ago weekly periods.
Serious News for Serious Traders! Try StreetInsider.com Premium Free!
You May Also Be Interested In
- Crude Inventory Fell 3.2 Million Barrels Last Week - EIA
- MBA Mortgage Applications -4.2% vs -6% Prior
- Crude Inventory 0.9M Barrels Last Week - EIA
Create E-mail Alert Related Categories
Commodities, ETFs, Economic DataSign up for StreetInsider Free!
Receive full access to all new and archived articles, unlimited portfolio tracking, e-mail alerts, custom newswires and RSS feeds - and more!
