




UPDATE: Natural Gas Inventory +37 bcf vs +45 bcf Expected

FREE Breaking News Alerts from StreetInsider.com!
StreetInsider.com Top Tickers, 10/8/2026
- S&P 500, Nasdaq end lower as crude prices jump, chip stocks weigh
- Oil rises 4% on revived Middle East worries, Hurricane Isaias supply disruption
- Chipotle, Starbucks shares volatile after report of potential takeover
- Why Citi says the Fed could be setting up for a dovish surprise
- Alphabet shares rise as Google pushes Gemini deeper into enterprise AI
 Tweet
Tweet Share
Share E-mail
- Natural Gas Inventory +37 bcf vs +45 bcf Expected
Working gas in storage was 3,140 Bcf as of Friday, June 24, 2016, according to EIA estimates. This represents a net increase of 37 Bcf from the previous week. Stocks were 582 Bcf higher than last year at this time and 637 Bcf above the five-year average of 2,503 Bcf. At 3,140 Bcf, total working gas is above the five-year historical range.
| Stocks billion cubic feet (Bcf) | Year ago (06/24/15) | 5-year average (2011-15) | |||||||||||||||||||||||
| Region | 06/24/16 | 06/17/16 | net change | implied flow | Bcf | % change | Bcf | % change | |||||||||||||||||
| East | 632 | 612 | 20 | 20 | 544 | 16.2 | 569 | 11.1 | |||||||||||||||||
| Midwest | 742 | 724 | 18 | 18 | 538 | 37.9 | 575 | 29.0 | |||||||||||||||||
| Mountain | 198 | 194 | 4 | 4 | 154 | 28.6 | 144 | 37.5 | |||||||||||||||||
| Pacific | 315 | C | 318 | -3 | 2 | C | 333 | -5.4 | 297 | 6.1 | |||||||||||||||
| South Central | 1,253 | 1,255 | -2 | -2 | 990 | 26.6 | 918 | 36.5 | |||||||||||||||||
| Salt | 360 | 366 | -6 | -6 | 293 | 22.9 | 238 | 51.3 | |||||||||||||||||
| Nonsalt | 893 | 890 | 3 | 3 | 696 | 28.3 | 680 | 31.3 | |||||||||||||||||
| Total | 3,140 | C | 3,103 | 37 | 42 | C | 2,558 | 22.8 | 2,503 | 25.4 | |||||||||||||||
C=Reclassification. | |||||||||||||||||||||||||
Non-flow-related adjustments decreased working gas stocks by approximately 5 Bcf in the Pacific region for the week ending June 24, 2016. The implied flow for the week is an increase of 42 Bcf to working gas stocks. (See Notes and Definitions for more information on "implied flow.")
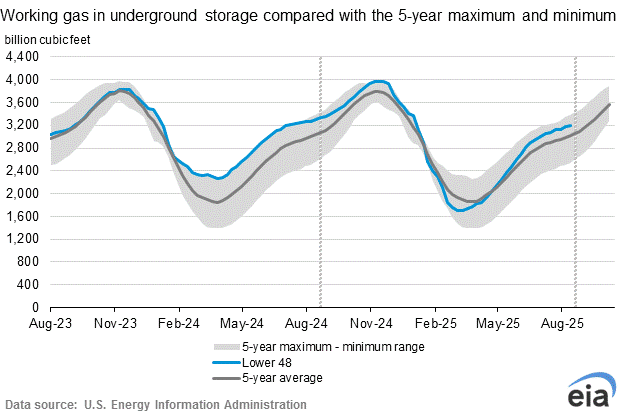
Note: The shaded area indicates the range between the historical minimum and maxim
Serious News for Serious Traders! Try StreetInsider.com Premium Free!
You May Also Be Interested In
- Natural Gas Inventory 85 bcf vs 81 bcf Expected
- Some Said Inflation Risks Had Become More Skewed To Upside - FOMC Minutes
- Hurricane Isaias forces Gulf oil and gas production shutdowns
Create E-mail Alert Related Categories
Commodities, ETFs, Economic DataSign up for StreetInsider Free!
Receive full access to all new and archived articles, unlimited portfolio tracking, e-mail alerts, custom newswires and RSS feeds - and more!
