

Form 8-K LyondellBasell Industrie For: Oct 24
 Tweet
Tweet Share
Share�
�
SECURITIES AND EXCHANGE COMMISSION
WASHINGTON, DC 20549
�
�
FORM 8-K
�
�
CURRENT REPORT
Pursuant to Section�13 or 15(d)
of the Securities Exchange Act of 1934
Date of Report (Date of earliest event reported): October�24, 2014
�
�
LYONDELLBASELL INDUSTRIES N.V.
(Exact Name of Registrant as Specified in Charter)
�
�
�
| The Netherlands | � | 001-34726 | � | 98-0646235 |
| (State or Other Jurisdiction of Incorporation) |
� | (Commission File Number) |
� | (IRS Employer Identification No.) |
�
| 1221 McKinney St., Suite 300 Houston, Texas USA 77010 |
� | 4th Floor, One Vine Street London W1J0AH The United Kingdom |
� | Stationsplein 45 3013 AK Rotterdam The Netherlands |
(Addresses of principal executive offices)
�
| (713) 309-7200 | � | +44 (0)207 220 2600 | � | +31 (0)10 275 5500 |
(Registrant�s telephone numbers, including area codes)
(Former Name or Former Address, if Changed Since Last Report)
�
�
Check the appropriate box below if the Form 8-K filing is intended to simultaneously satisfy the filing obligation of the registrant under any of the following provisions:
�
| � | Written communications pursuant to Rule 425 under the Securities Act (17 CFR 230.425) |
�
| � | Soliciting material pursuant to Rule 14a-12 under the Exchange Act (17 CFR 240.14a-12) |
�
| � | Pre-commencement communications pursuant to Rule 14d-2(b) under the Exchange Act (17 CFR 240.14d-2(b)) |
�
| � | Pre-commencement communications pursuant to Rule 13e-4(c) under the Exchange Act (17 CFR 240.13e-4(c)) |
�
�
�
| Item�2.02. | Results of Operations and Financial Condition. |
LyondellBasell Industries N.V. (the �Company�) has issued a press release this morning, October�24, 2014, announcing its earnings for the quarter ended September�30, 2014, a copy of which is furnished herewith as Exhibit 99.1.
�
| Item�7.01. | Regulation FD Disclosure. |
The Company is holding a conference call to discuss its third quarter 2014 results on October�24, 2014. Information about the call can be found in the press release furnished herewith as Exhibit 99.1.
A copy of the slide materials to be discussed on the conference call, which will be available at the time of the teleconference and afterwards, are furnished herewith as Exhibit 99.2. The slides can be accessed on the Company�s website at www.lyondellbasell.com.
�
| Item�9.01. | Financial Statements and Exhibits. |
(d) Exhibits
99.1 Press Release dated October�24, 2014
99.2 Presentation � LyondellBasell Industries N.V. Third Quarter 2014 Earnings
SIGNATURES
Pursuant to the requirements of the Securities Exchange Act of 1934, the registrant has caused this report to be signed on its behalf by the undersigned, hereunto duly authorized.
�
| � | LYONDELLBASELL INDUSTRIES N.V. | |||||
| Date: October�24, 2014 | � | �� | By: | �� | /s/ Craig B. Glidden | |
| � | �� | �� | Craig B. Glidden | |||
| � | �� | �� | Executive Vice President | |||
Exhibit Index
�
| Exhibit |
�� | Description |
| 99.1 | �� | Press Release dated October 24, 2014 |
| 99.2 | �� | Presentation � LyondellBasell Industries N.V. Third Quarter 2014 Earnings |
Exhibit 99.1
�
| NEWS RELEASE � HOUSTON and LONDON, October�24, 2014 |
� |

|
LyondellBasell Reports Record Third-Quarter 2014 Results
Third-Quarter 2014 Highlights
�
| � | � | � | Second consecutive quarter of record earnings |
�
| � | � | � | Diluted earnings per share of $2.46 |
�
| � | � | � | Income from continuing operations of $1.3 billion |
�
| � | � | � | EBITDA of $2.0 billion |
�
| � | � | � | O&P Americas segment achieved EBITDA exceeding $1.1 billion |
�
| � | � | � | Announced the development of two new growth projects during the quarter |
�
| � | � | � | $5.4 billion of share repurchases and dividends year to date |
�
| � | � | � | Repurchased approximately 12�million shares during the third quarter |
LyondellBasell Industries (NYSE: LYB) today announced earnings from continuing operations for the third quarter 2014 of $1.3 billion, or $2.46 diluted earnings per share. Third quarter 2014 EBITDA was $2.0 billion. The quarter includes a $45 million non-cash charge for the impact of a lower of cost or market (LCM) inventory adjustment. The increase from the second quarter 2014 was primarily due to increased earnings in our Olefins and Polyolefins � Americas segment.
Comparisons with the prior quarter and third quarter 2013 are shown below:
Table 1 - Earnings Summary
�
| � | �� | Three Months Ended | � | �� | Nine Months Ended | � | ||||||||||||||
| � | �� | September�30, | � | �� | June�30, | � | �� | September�30, | � | �� | September�30, | � | ||||||||
| Millions of U.S. dollars (except share data) |
�� | 2014 | � | �� | 2014 | � | �� | 2013 | � | �� | 2014 | � | �� | 2013 | � | |||||
| Sales and other operating revenues |
�� | $ | 12,066 | � | �� | $ | 12,117 | � | �� | $ | 11,152 | � | �� | $ | 35,318 | � | �� | $ | 32,924 | � |
| Net income(a) |
�� | � | 1,257 | � | �� | � | 1,176 | � | �� | � | 851 | � | �� | � | 3,377 | � | �� | � | 2,678 | � |
| Income from continuing operations(b) |
�� | � | 1,260 | � | �� | � | 1,173 | � | �� | � | 854 | � | �� | � | 3,376 | � | �� | � | 2,683 | � |
| Diluted earnings per share (U.S. dollars): |
�� | �� | �� | �� | �� | |||||||||||||||
| Net income(c) |
�� | � | 2.45 | � | �� | � | 2.23 | � | �� | � | 1.50 | � | �� | � | 6.38 | � | �� | � | 4.66 | � |
| Income from continuing operations(b) |
�� | � | 2.46 | � | �� | � | 2.22 | � | �� | � | 1.51 | � | �� | � | 6.38 | � | �� | � | 4.67 | � |
| Diluted share count (millions) |
�� | � | 512 | � | �� | � | 527 | � | �� | � | 567 | � | �� | � | 529 | � | �� | � | 575 | � |
| EBITDA(d) |
�� | � | 2,035 | � | �� | � | 1,941 | � | �� | � | 1,531 | � | �� | � | 5,644 | � | �� | � | 4,768 | � |
�
| (a) | Includes net loss attributable to non-controlling interests and income (loss) from discontinued operations, net of tax. See Table 10. |
| (b) | Please see Table 11 for charges and benefits to income from continuing operations. |
| (c) | Includes diluted earnings per share attributable to discontinued operations. |
| (d) | See the end of this release for an explanation of the Company�s use of EBITDA and Table 8 for reconciliations of EBITDA to net income and income from continuing operations. |
�
| LyondellBasell Industries | �� | 1 | �� | |
| www.lyondellbasell.com | �� | �� |
�We are pleased to deliver a second consecutive quarter of record earnings, and our best quarter ever. During the third quarter we achieved diluted earnings per share from continuing operations of $2.46 and, for the first time, EBITDA exceeded $2 billion. Our Olefins and Polyolefins- Americas segment generated EBITDA in excess of $1.1 billion during the quarter. A tight U.S. ethylene market helped drive the record earnings,� said Jim Gallogly, LyondellBasell Chief Executive Officer.
�In addition to our strong earnings, we continue to return cash to our shareholders. During the quarter, dividends and share repurchases totaled $1.6 billion. We repurchased approximately 12�million shares during the third quarter, and approximately 46�million shares year to date. Since the first share repurchase program was started in May 2013, we have repurchased approximately 73�million shares, or approximately 13 percent of the shares outstanding,� continued Gallogly.
�Industry fundamentals remained strong during the quarter, and we continue to make progress on our investment program. Late in the quarter we initiated production from the 800�million pound per year La Porte ethylene expansion. This is the first of multiple ethylene expansions by the company, putting us well ahead of new greenfield plants pursued by others in the industry. In addition, we announced the development of two new growth projects, a further expansion of our Channelview olefins complex and a new U.S. Gulf Coast PO/TBA plant. Both projects take advantage of the favorable environment for North American raw materials, and the PO/TBA plant leverages our proprietary technology. These projects demonstrate that LyondellBasell has continued organic growth opportunities,� Gallogly added.
OUTLOOK
�Despite declines in crude oil prices, U.S. industry fundamentals remained favorable through the first weeks of October. Domestic ethylene and polyolefins pricing remained strong, and we continued to benefit from favorable NGL pricing. Our fourth quarter results should be favorably impacted by the new La Porte ethylene capacity. Additionally, our refinery should begin receiving shipments of Canadian crude from the Flanagan South pipeline. However, we historically experience margin compression in products such as oxyfuels in winter months and slower polyolefin demand around the holiday season. Recent crude oil price declines are expected to ultimately impact domestic margins but today�s tight market conditions may delay the timing of potential declines. We are watching to see how this develops. Given favorable NGL prices, our domestic assets remain significantly advantaged,� Gallogly noted.
LYONDELLBASELL BUSINESS RESULTS DISCUSSION BY REPORTING SEGMENT
LyondellBasell manages operations through five operating segments: 1) Olefins and Polyolefins � Americas; 2) Olefins and Polyolefins � Europe, Asia and International; 3) Intermediates and Derivatives; 4) Refining; and 5) Technology.
�
| LyondellBasell Industries | �� | 2 | �� | |
| www.lyondellbasell.com | �� | �� |
Olefins and Polyolefins - Americas (O&P-Americas) � The primary products of this segment include ethylene and its co-products (propylene, butadiene and benzene), polyethylene, polypropylene and Catalloy process resins.
Table 2 - O&P�Americas Financial Overview
�
| � | �� | Three Months Ended | � | �� | Nine�Months�Ended | � | ||||||||||||||
| � | �� | September�30, | � | �� | June�30, | � | �� | September�30, | � | �� | September�30, | � | ||||||||
| Millions of U.S. dollars |
�� | 2014 | � | �� | 2014 | � | �� | 2013 | � | �� | 2014 | � | �� | 2013 | � | |||||
| Operating income |
�� | $ | 1,068 | � | �� | $ | 898 | � | �� | $ | 759 | � | �� | $ | 2,622 | � | �� | $ | 2,452 | � |
| EBITDA |
�� | � | 1,157 | � | �� | � | 978 | � | �� | � | 841 | � | �� | � | 2,871 | � | �� | � | 2,690 | � |
Three months ended September�30, 2014 versus three months ended June�30, 2014 � The segment achieved record EBITDA results in the third quarter of 2014. EBITDA increased $179 million versus the second quarter 2014. Third quarter results include a $45 million non-cash LCM charge generated from a decline in inventory valuation. Compared to the prior period, olefins results increased approximately $220 million. This increase was largely driven by an increase in the average ethylene price of approximately eight cents per pound during the period. Third quarter ethylene sales volumes increased despite being negatively impacted by the delayed restart of the La Porte olefins plant. Combined polyolefin results decreased by approximately $40 million from the second quarter 2014. Strong demand was offset by a decrease in the ethylene to polyethylene price spread of seven cents per pound. Joint venture equity income was stable quarter on quarter.
Three months ended September�30, 2014 versus three months ended September�30, 2013 � EBITDA increased $316 million versus the third quarter 2013. The third quarter 2014 included a $45 million non-cash LCM charge. Olefins results increased approximately $260 million compared to the prior year period. Margins benefited from lower NGL costs and an approximately nine cents per pound higher average price of ethylene compared to the prior year period. Ethylene demand improved primarily from increased internal polyethylene production. Polyethylene results increased by approximately $35 million as volume improved by approximately 15 percent. Polypropylene results increased by approximately $10 million primarily from higher margins. Joint venture equity income decreased by $1 million.
�
| LyondellBasell Industries | �� | 3 | �� | |
| www.lyondellbasell.com | �� | �� |
Olefins and Polyolefins - Europe, Asia, International (O&P-EAI) � The primary products of this segment include ethylene and its co-products (propylene and butadiene), polyethylene, polypropylene, global polypropylene compounds, Catalloy process resins and polybutene-1 resins.
Table 3 - O&P�EAI Financial Overview
�
| � | �� | Three Months Ended | � | �� | Nine�Months�Ended | � | ||||||||||||||
| � | �� | September�30, | � | �� | June�30, | � | �� | September�30, | � | �� | September�30, | � | ||||||||
| Millions of U.S. dollars |
�� | 2014 | � | �� | 2014 | � | �� | 2013 | � | �� | 2014 | � | �� | 2013 | � | |||||
| Operating income |
�� | $ | 223 | � | �� | $ | 190 | � | �� | $ | 78 | � | �� | $ | 638 | � | �� | $ | 360 | � |
| EBITDA |
�� | � | 343 | � | �� | � | 319 | � | �� | � | 204 | � | �� | � | 1,018 | � | �� | � | 724 | � |
Three months ended September�30, 2014 versus three months ended June�30, 2014 � EBITDA increased $24 million versus the second quarter 2014. Olefins results increased by approximately $35 million primarily due to lower production costs. Approximately 55 percent of our ethylene production was sourced from advantaged raw materials. Ethylene operating rates were 95 percent during the third quarter. Combined polyolefin results increased by approximately $15 million. Combined polypropylene compounds and polybutene-1 results declined approximately $15 million as volume declined approximately 6 percent from lower seasonal demand. Equity income from joint ventures decreased by $7 million from the second quarter 2014 primarily as a result of planned and unplanned maintenance.
Three months ended September�30, 2014 versus three months ended September�30, 2013 � EBITDA increased $139 million versus the third quarter 2013. Olefins results increased by approximately $85 million primarily as a result of higher margins from processing advantaged feedstocks, lower naphtha, higher operating rates, and improved co-product values. Combined polyolefin results increased approximately $50 million primarily as a result of higher margins. Polypropylene compounds and polybutene-1 results decreased by approximately $10 million from the prior year period. Equity income from joint ventures increased $8 million from the third quarter 2013.
�
| LyondellBasell Industries | �� | 4 | �� | |
| www.lyondellbasell.com | �� | �� |
Intermediates and Derivatives (I&D) � The primary products of this segment include propylene oxide (PO) and its co-products (styrene monomer, tertiary butyl alcohol (TBA), isobutylene and tertiary butyl hydroperoxide), and derivatives (propylene glycol, propylene glycol ethers and butanediol), acetyls (acetic acid, vinyl acetate monomer and methanol), ethylene oxide and its derivatives, and oxyfuels.
Table 4 - I&D Financial Overview
�
| � | �� | Three Months Ended | � | �� | Nine�Months�Ended | � | ||||||||||||||
| � | �� | September�30, | � | �� | June�30, | � | �� | September�30, | � | �� | September�30, | � | ||||||||
| Millions of U.S. dollars |
�� | 2014 | � | �� | 2014 | � | �� | 2013 | � | �� | 2014 | � | �� | 2013 | � | |||||
| Operating income |
�� | $ | 321 | � | �� | $ | 375 | � | �� | $ | 371 | � | �� | $ | 1,012 | � | �� | $ | 979 | � |
| EBITDA |
�� | � | 383 | � | �� | � | 430 | � | �� | � | 427 | � | �� | � | 1,188 | � | �� | � | 1,138 | � |
Three months ended September�30, 2014 versus three months ended June�30, 2014 � EBITDA decreased $47 million versus the second quarter 2014. Results for PO and PO derivatives increased by approximately $25 million. Increased PO volumes and higher PO derivative margins drove the increase. Intermediate chemicals results decreased by approximately $50 million. Lower styrene results and unplanned outages at our ethylene oxide and methanol plants were responsible for the decline. Oxyfuels results declined by approximately $20 million due to lower sales volumes. Equity income from joint ventures increased by $3 million.
Three months ended September�30, 2014 versus three months ended September�30, 2013 � EBITDA decreased $44 million compared to the third quarter 2013. Results for PO and PO derivatives increased by approximately $30 million as a result of higher volumes and better pricing as a result of tight PO supply. Intermediate chemicals results were lower by approximately $55 million despite higher methanol volume. Styrene raw material margins declined approximately 13 cents per pound from strong third quarter 2013 margins. Oxyfuels results decreased by approximately $30 million. Equity income from joint ventures decreased $4 million from the third quarter 2013.
�
| LyondellBasell Industries | �� | 5 | �� | |
| www.lyondellbasell.com | �� | �� |
Refining � The primary products of this segment include gasoline, diesel fuel, heating oil, jet fuel, and petrochemical raw materials.
Table 5 - Refining Financial Overview
�
| � | �� | Three Months Ended | � | � | Nine�Months�Ended | � | ||||||||||||||
| � | �� | September�30, | � | �� | June�30, | � | �� | September�30, | � | � | September�30, | � | ||||||||
| Millions of U.S. dollars |
�� | 2014 | � | �� | 2014 | � | �� | 2013 | � | � | 2014 | � | �� | 2013 | � | |||||
| Operating income (loss) |
�� | $ | 67 | � | �� | $ | 95 | � | �� | ($ | 37 | )� | � | $ | 248 | � | �� | ($ | 70 | )� |
| EBITDA |
�� | � | 110 | � | �� | � | 137 | � | �� | � | 8 | � | � | � | 376 | � | �� | � | 48 | � |
Three months ended September�30, 2014 versus three months ended June�30, 2014 � EBITDA decreased $27 million versus the second quarter 2014. The refinery processed 264,000 barrels per day, up 7,000 barrels per day from the prior quarter. Compared to the prior quarter, the Maya 2-1-1 benchmark crack spread declined by $2.66 per barrel, averaging $24.35 per barrel. The corresponding Houston refinery spread experienced a smaller decline due primarily to favorable crude purchases relative to Maya. Hydrodesulfurization unit maintenance lowered finished product yields resulting in lower margins. The cost of Renewable Identification Numbers (RINs) to meet U.S. renewable fuel standards was relatively unchanged versus the second quarter 2014.
Three months ended September�30, 2014 versus three months ended September�30, 2013 � EBITDA increased $102 million versus the third quarter 2013. The refinery processed 14,000 barrels per day more than the prior year period. Compared to the third quarter 2013, the Maya 2-1-1 benchmark spread increased $1.13 per barrel. The refinery also benefited from better margins on secondary products, such as propylene, naphtha, and NGLs. The cost of RINs decreased by approximately $10 million compared to the same quarter last year.
�
| LyondellBasell Industries | �� | 6 | �� | |
| www.lyondellbasell.com | �� | �� |
Technology � The principal products of the Technology segment include polyolefin catalysts and production process technology licenses and related services.
Table 6 - Technology Financial Overview
�
| � | �� | Three Months Ended | � | �� | Nine�Months�Ended | � | ||||||||||||||
| � | �� | September�30, | � | �� | June�30, | � | �� | September�30, | � | �� | September�30, | � | ||||||||
| Millions of U.S. dollars |
�� | 2014 | � | �� | 2014 | � | �� | 2013 | � | �� | 2014 | � | �� | 2013 | � | |||||
| Operating income |
�� | $ | 26 | � | �� | $ | 56 | � | �� | $ | 35 | � | �� | $ | 142 | � | �� | $ | 124 | � |
| EBITDA |
�� | � | 41 | � | �� | � | 71 | � | �� | � | 52 | � | �� | � | 188 | � | �� | $ | 177 | � |
Three months ended September�30, 2014 versus three months ended June�30, 2014 � EBITDA decreased by $30 million from lower licensing results.
Three months ended September�30, 2014 versus three months ended September�30, 2013 � EBITDA decreased by $11 million from lower licensing results.
Capital spending and cash balances
Capital expenditures, including growth projects, maintenance turnarounds, catalyst and information technology-related expenditures, were $338 million in the third quarter 2014. Our cash and short-term securities balance was $2.9 billion at September�30, 2014. We repurchased approximately 12�million of our outstanding ordinary shares and paid $358 million in dividends during the third quarter of 2014. There were 504�million common shares outstanding as of September�30th.
CONFERENCE CALL
LyondellBasell will host a conference call October�24 at 11 a.m. ET. Participants on the call will include Chief Executive Officer Jim Gallogly, Executive Vice President and Chief Financial Officer Karyn Ovelmen, Senior Vice President - Strategic Planning and Transactions Sergey Vasnetsov, and Vice President of Investor Relations Doug Pike.
The toll-free dial-in number in the U.S. is 888-677-1826. For international numbers, go to www.lyb.com/teleconference, for a complete listing of toll-free numbers by country. The pass code for all numbers is 1231245.
A replay of the call will be available from 2 p.m. ET October�24 until November�24 at 11 p.m. ET. The replay dial-in numbers are 800-947-6627 (U.S.) and +1 203-369-3974 (international). The pass code for each is 3675.
The slides that accompany the call will be available at http://www.lyb.com/earnings.
�
| LyondellBasell Industries | �� | 7 | �� | |
| www.lyondellbasell.com | �� | �� |
ABOUT LYONDELLBASELL
LyondellBasell (NYSE: LYB) is one of the world�s largest plastics, chemical and refining companies and a member of the S&P 500. LyondellBasell (www.lyb.com) manufactures products at 55 sites in 18 countries. LyondellBasell products and technologies are used to make items that improve the quality of life for people around the world including packaging, electronics, automotive parts, home furnishings, construction materials and biofuels.
FORWARD-LOOKING STATEMENTS
The statements in this release and the related teleconference relating to matters that are not historical facts are forward-looking statements. These forward-looking statements are based upon assumptions of management which are believed to be reasonable at the time made and are subject to significant risks and uncertainties. Actual results could differ materially based on factors including, but not limited to, the business cyclicality of the chemical, polymers and refining industries; the availability, cost and price volatility of raw materials and utilities, particularly the cost of oil, natural gas, and associated natural gas liquids; competitive product and pricing pressures; labor conditions; our ability to attract and retain key personnel; operating interruptions (including leaks, explosions, fires, weather-related incidents, mechanical failure, unscheduled downtime, supplier disruptions, labor shortages, strikes, work stoppages or other labor difficulties, transportation interruptions, spills and releases and other environmental risks); the supply/demand balances for our and our joint ventures� products, and the related effects of industry production capacities and operating rates; our ability to achieve expected cost savings and other synergies; our ability to successfully execute projects and growth strategies; legal and environmental proceedings; tax rulings, consequences or proceedings; technological developments, and our ability to develop new products and process technologies; potential governmental regulatory actions; political unrest and terrorist acts; risks and uncertainties posed by international operations, including foreign currency fluctuations; and our ability to comply with debt covenants and service our debt. Additional factors that could cause results to differ materially from those described in the forward-looking statements can be found in the �Risk Factors� section of our Form 10-K for the year ended December�31, 2013, which can be found at www.lyb.com on the Investor Relations page and on the Securities and Exchange Commission�s website at www.sec.gov.
NON-GAAP MEASURES
This release makes reference to certain �non-GAAP� financial measures, such as EBITDA, as defined in Regulation G of the U.S. Securities Exchange Act of 1934, as amended. We report our financial results in accordance with U.S. generally accepted accounting principles, but believe that certain non-GAAP financial measures, such as EBITDA, provide useful supplemental information to investors regarding the
�
| LyondellBasell Industries | �� | 8 | �� | |
| www.lyondellbasell.com | �� | �� |
underlying business trends and performance of the company�s ongoing operations and are useful for period-over-period comparisons of such operations. These non-GAAP financial measures should be considered as a supplement to, and not as a substitute for, or superior to, the financial measures prepared in accordance with GAAP.
EBITDA, as presented herein, may not be comparable to a similarly titled measure reported by other companies due to differences in the way the measure is calculated. We calculate EBITDA as income from continuing operations plus interest expense (net), provision for (benefit from) income taxes, and depreciation�& amortization. EBITDA should not be considered an alternative to profit or operating profit for any period as an indicator of our performance, or as alternative to operating cash flows as a measure of our liquidity.
Quantitative reconciliations of EBITDA to net income, the most comparable GAAP measure, are provided in Table 8 at the end of this release.
OTHER FINANCIAL MEASURE PRESENTATION NOTES
This release contains time sensitive information that is accurate only as of the time hereof. Information contained in this release is unaudited and subject to change. LyondellBasell undertakes no obligation to update the information presented herein except to the extent required by law.
###
Source: LyondellBasell Industries
�
| Media�Contact: | �� | George Smalley +1 713-309-7575 |
| Investor�Contact: | �� | Douglas J. Pike +1 713-309-7141 |
�
| LyondellBasell Industries | �� | 9 | �� | |
| www.lyondellbasell.com | �� | �� |
Table 7 - Reconciliation of Segment Information to Consolidated Financial Information
�
| � | � | 2013 | � | � | 2014 | � | ||||||||||||||||||||||||||||||
| (Millions of U.S. dollars) |
� | Q1 | � | � | Q2 | � | � | Q3 | � | � | Q4 | � | � | Total | � | � | Q1 | � | � | Q2 | � | � | Q3 | � | � | YTD | � | |||||||||
| Sales and other operating revenues: |
� | � | � | � | � | � | � | � | � | |||||||||||||||||||||||||||
| Olefins�& Polyolefins - Americas |
� | $ | 3,244 | � | � | $ | 3,251 | � | � | $ | 3,315 | � | � | $ | 3,279 | � | � | $ | 13,089 | � | � | $ | 3,357 | � | � | $ | 3,462 | � | � | $ | 3,750 | � | � | $ | 10,569 | � |
| Olefins�& Polyolefins - Europe, Asia, International |
� | � | 3,800 | � | � | � | 3,708 | � | � | � | 3,594 | � | � | � | 3,583 | � | � | � | 14,685 | � | � | � | 3,778 | � | � | � | 4,069 | � | � | � | 3,995 | � | � | � | 11,842 | � |
| Intermediates�& Derivatives |
� | � | 2,282 | � | � | � | 2,217 | � | � | � | 2,452 | � | � | � | 2,521 | � | � | � | 9,472 | � | � | � | 2,429 | � | � | � | 2,706 | � | � | � | 2,691 | � | � | � | 7,826 | � |
| Refining |
� | � | 2,468 | � | � | � | 3,077 | � | � | � | 3,177 | � | � | � | 2,976 | � | � | � | 11,698 | � | � | � | 2,756 | � | � | � | 3,250 | � | � | � | 3,146 | � | � | � | 9,152 | � |
| Technology |
� | � | 134 | � | � | � | 132 | � | � | � | 124 | � | � | � | 142 | � | � | � | 532 | � | � | � | 136 | � | � | � | 144 | � | � | � | 107 | � | � | � | 387 | � |
| Other |
� | � | (1,259 | )� | � | � | (1,282 | )� | � | � | (1,510 | )� | � | � | (1,363 | )� | � | � | (5,414 | )� | � | � | (1,321 | )� | � | � | (1,514 | )� | � | � | (1,623 | )� | � | � | (4,458 | )� |
| � | � |
� |
� | � | � |
� |
� | � | � |
� |
� | � | � |
� |
� | � | � |
� |
� | � | � |
� |
� | � | � |
� |
� | � | � |
� |
� | � | � |
� |
� | |
| Continuing Operations |
� | $ | 10,669 | � | � | $ | 11,103 | � | � | $ | 11,152 | � | � | $ | 11,138 | � | � | $ | 44,062 | � | � | $ | 11,135 | � | � | $ | 12,117 | � | � | $ | 12,066 | � | � | $ | 35,318 | � |
| � | � |
� |
� | � | � |
� |
� | � | � |
� |
� | � | � |
� |
� | � | � |
� |
� | � | � |
� |
� | � | � |
� |
� | � | � |
� |
� | � | � |
� |
� | |
| Operating income (loss): |
� | � | � | � | � | � | � | � | � | |||||||||||||||||||||||||||
| Olefins�& Polyolefins - Americas |
� | $ | 821 | � | � | $ | 872 | � | � | $ | 759 | � | � | $ | 801 | � | � | $ | 3,253 | � | � | $ | 656 | � | � | $ | 898 | � | � | $ | 1,068 | � | � | $ | 2,622 | � |
| Olefins�& Polyolefins - Europe, Asia, International |
� | � | 93 | � | � | � | 189 | � | � | � | 78 | � | � | � | 17 | � | � | � | 377 | � | � | � | 225 | � | � | � | 190 | � | � | � | 223 | � | � | � | 638 | � |
| Intermediates�& Derivatives |
� | � | 323 | � | � | � | 285 | � | � | � | 371 | � | � | � | 321 | � | � | � | 1,300 | � | � | � | 316 | � | � | � | 375 | � | � | � | 321 | � | � | � | 1,012 | � |
| Refining |
� | � | (17 | )� | � | � | (16 | )� | � | � | (37 | )� | � | � | 92 | � | � | � | 22 | � | � | � | 86 | � | � | � | 95 | � | � | � | 67 | � | � | � | 248 | � |
| Technology |
� | � | 50 | � | � | � | 39 | � | � | � | 35 | � | � | � | 33 | � | � | � | 157 | � | � | � | 60 | � | � | � | 56 | � | � | � | 26 | � | � | � | 142 | � |
| Other |
� | � | (3 | )� | � | � | (5 | )� | � | � | 1 | � | � | � | ��� | � | � | � | (7 | )� | � | � | (3 | )� | � | � | (1 | )� | � | � | 1 | � | � | � | (3 | )� |
| � | � |
� |
� | � | � |
� |
� | � | � |
� |
� | � | � |
� |
� | � | � |
� |
� | � | � |
� |
� | � | � |
� |
� | � | � |
� |
� | � | � |
� |
� | |
| Continuing Operations |
� | $ | 1,267 | � | � | $ | 1,364 | � | � | $ | 1,207 | � | � | $ | 1,264 | � | � | $ | 5,102 | � | � | $ | 1,340 | � | � | $ | 1,613 | � | � | $ | 1,706 | � | � | $ | 4,659 | � |
| � | � |
� |
� | � | � |
� |
� | � | � |
� |
� | � | � |
� |
� | � | � |
� |
� | � | � |
� |
� | � | � |
� |
� | � | � |
� |
� | � | � |
� |
� | |
| Depreciation and amortization: |
� | � | � | � | � | � | � | � | � | |||||||||||||||||||||||||||
| Olefins�& Polyolefins - Americas |
� | $ | 75 | � | � | $ | 69 | � | � | $ | 73 | � | � | $ | 76 | � | � | $ | 293 | � | � | $ | 73 | � | � | $ | 74 | � | � | $ | 84 | � | � | $ | 231 | � |
| Olefins�& Polyolefins - Europe, Asia, International |
� | � | 77 | � | � | � | 76 | � | � | � | 78 | � | � | � | 56 | � | � | � | 287 | � | � | � | 70 | � | � | � | 67 | � | � | � | 65 | � | � | � | 202 | � |
| Intermediates�& Derivatives |
� | � | 48 | � | � | � | 50 | � | � | � | 50 | � | � | � | 56 | � | � | � | 204 | � | � | � | 55 | � | � | � | 56 | � | � | � | 55 | � | � | � | 166 | � |
| Refining |
� | � | 36 | � | � | � | 37 | � | � | � | 45 | � | � | � | 42 | � | � | � | 160 | � | � | � | 42 | � | � | � | 42 | � | � | � | 42 | � | � | � | 126 | � |
| Technology |
� | � | 17 | � | � | � | 20 | � | � | � | 16 | � | � | � | 22 | � | � | � | 75 | � | � | � | 16 | � | � | � | 15 | � | � | � | 16 | � | � | � | 47 | � |
| Other |
� | � | ��� | � | � | � | 2 | � | � | � | ��� | � | � | � | ��� | � | � | � | 2 | � | � | � | ��� | � | � | � | ��� | � | � | � | ��� | � | � | � | ��� | � |
| � | � |
� |
� | � | � |
� |
� | � | � |
� |
� | � | � |
� |
� | � | � |
� |
� | � | � |
� |
� | � | � |
� |
� | � | � |
� |
� | � | � |
� |
� | |
| Continuing Operations |
� | $ | 253 | � | � | $ | 254 | � | � | $ | 262 | � | � | $ | 252 | � | � | $ | 1,021 | � | � | $ | 256 | � | � | $ | 254 | � | � | $ | 262 | � | � | $ | 772 | � |
| � | � |
� |
� | � | � |
� |
� | � | � |
� |
� | � | � |
� |
� | � | � |
� |
� | � | � |
� |
� | � | � |
� |
� | � | � |
� |
� | � | � |
� |
� | |
| EBITDA: (a) |
� | � | � | � | � | � | � | � | � | |||||||||||||||||||||||||||
| Olefins�& Polyolefins - Americas |
� | $ | 898 | � | � | $ | 951 | � | � | $ | 841 | � | � | $ | 883 | � | � | $ | 3,573 | � | � | $ | 736 | � | � | $ | 978 | � | � | $ | 1,157 | � | � | $ | 2,871 | � |
| Olefins�& Polyolefins - Europe, Asia, International |
� | � | 225 | � | � | � | 295 | � | � | � | 204 | � | � | � | 115 | � | � | � | 839 | � | � | � | 356 | � | � | � | 319 | � | � | � | 343 | � | � | � | 1,018 | � |
| Intermediates�& Derivatives |
� | � | 373 | � | � | � | 338 | � | � | � | 427 | � | � | � | 354 | � | � | � | 1,492 | � | � | � | 375 | � | � | � | 430 | � | � | � | 383 | � | � | � | 1,188 | � |
| Refining |
� | � | 20 | � | � | � | 20 | � | � | � | 8 | � | � | � | 134 | � | � | � | 182 | � | � | � | 129 | � | � | � | 137 | � | � | � | 110 | � | � | � | 376 | � |
| Technology |
� | � | 66 | � | � | � | 59 | � | � | � | 52 | � | � | � | 55 | � | � | � | 232 | � | � | � | 76 | � | � | � | 71 | � | � | � | 41 | � | � | � | 188 | � |
| Other |
� | � | 3 | � | � | � | (11 | )� | � | � | (1 | )� | � | � | 2 | � | � | � | (7 | )� | � | � | (4 | )� | � | � | 6 | � | � | � | 1 | � | � | � | 3 | � |
| � | � |
� |
� | � | � |
� |
� | � | � |
� |
� | � | � |
� |
� | � | � |
� |
� | � | � |
� |
� | � | � |
� |
� | � | � |
� |
� | � | � |
� |
� | |
| Continuing Operations |
� | $ | 1,585 | � | � | $ | 1,652 | � | � | $ | 1,531 | � | � | $ | 1,543 | � | � | $ | 6,311 | � | � | $ | 1,668 | � | � | $ | 1,941 | � | � | $ | 2,035 | � | � | $ | 5,644 | � |
| � | � |
� |
� | � | � |
� |
� | � | � |
� |
� | � | � |
� |
� | � | � |
� |
� | � | � |
� |
� | � | � |
� |
� | � | � |
� |
� | � | � |
� |
� | |
| Capital, turnarounds and IT deferred spending: |
� | � | � | � | � | � | � | � | � | |||||||||||||||||||||||||||
| Olefins�& Polyolefins - Americas |
� | $ | 122 | � | � | $ | 122 | � | � | $ | 218 | � | � | $ | 183 | � | � | $ | 645 | � | � | $ | 231 | � | � | $ | 306 | � | � | $ | 208 | � | � | $ | 745 | � |
| Olefins�& Polyolefins - Europe, Asia, International |
� | � | 63 | � | � | � | 46 | � | � | � | 44 | � | � | � | 76 | � | � | � | 229 | � | � | � | 33 | � | � | � | 27 | � | � | � | 45 | � | � | � | 105 | � |
| Intermediates�& Derivatives |
� | � | 106 | � | � | � | 141 | � | � | � | 119 | � | � | � | 77 | � | � | � | 443 | � | � | � | 45 | � | � | � | 52 | � | � | � | 50 | � | � | � | 147 | � |
| Refining |
� | � | 93 | � | � | � | 67 | � | � | � | 36 | � | � | � | 13 | � | � | � | 209 | � | � | � | 32 | � | � | � | 20 | � | � | � | 27 | � | � | � | 79 | � |
| Technology |
� | � | 7 | � | � | � | 6 | � | � | � | 7 | � | � | � | 10 | � | � | � | 30 | � | � | � | 2 | � | � | � | 6 | � | � | � | 6 | � | � | � | 14 | � |
| Other |
� | � | ��� | � | � | � | 5 | � | � | � | (1 | )� | � | � | 1 | � | � | � | 5 | � | � | � | ��� | � | � | � | 4 | � | � | � | 2 | � | � | � | 6 | � |
| � | � |
� |
� | � | � |
� |
� | � | � |
� |
� | � | � |
� |
� | � | � |
� |
� | � | � |
� |
� | � | � |
� |
� | � | � |
� |
� | � | � |
� |
� | |
| Total |
� | � | 391 | � | � | � | 387 | � | � | � | 423 | � | � | � | 360 | � | � | � | 1,561 | � | � | � | 343 | � | � | � | 415 | � | � | � | 338 | � | � | � | 1,096 | � |
| Deferred charges included above |
� | � | ��� | � | � | � | ��� | � | � | � | ��� | � | � | � | ��� | � | � | � | ��� | � | � | � | ��� | � | � | � | ��� | � | � | � | ��� | � | � | � | ��� | � |
| � | � |
� |
� | � | � |
� |
� | � | � |
� |
� | � | � |
� |
� | � | � |
� |
� | � | � |
� |
� | � | � |
� |
� | � | � |
� |
� | � | � |
� |
� | |
| Continuing Operations |
� | $ | 391 | � | � | $ | 387 | � | � | $ | 423 | � | � | $ | 360 | � | � | $ | 1,561 | � | � | $ | 343 | � | � | $ | 415 | � | � | $ | 338 | � | � | $ | 1,096 | � |
| � | � |
� |
� | � | � |
� |
� | � | � |
� |
� | � | � |
� |
� | � | � |
� |
� | � | � |
� |
� | � | � |
� |
� | � | � |
� |
� | � | � |
� |
� | |
�
| (a) | See Table 8 for EBITDA calculation. |
�
| LyondellBasell Industries | �� | 10 | �� | |
| www.lyondellbasell.com | �� | �� |
Table 8 - EBITDA Calculation
�
| � | �� | 2013 | � | � | 2014 | � | ||||||||||||||||||||||||||||||
| (Millions of U.S. dollars) |
�� | Q1 | � | � | Q2 | � | � | Q3 | � | � | Q4 | � | �� | Total | � | � | Q1 | � | � | Q2 | � | � | Q3 | � | � | YTD | � | |||||||||
| Net income attributable to the Company shareholders |
�� | $ | 901 | � | � | $ | 929 | � | � | $ | 853 | � | � | $ | 1,174 | � | �� | $ | 3,857 | � | � | $ | 945 | � | � | $ | 1,178 | � | � | $ | 1,258 | � | � | $ | 3,381 | � |
| Net income (loss) attributable to non-controlling interests |
�� | � | (1 | )� | � | � | (2 | )� | � | � | (2 | )� | � | � | 1 | � | �� | � | (4 | )� | � | � | (1 | )� | � | � | (2 | )� | � | � | (1 | )� | � | � | (4 | )� |
| (Income) loss from discontinued operations, net of tax |
�� | � | 6 | � | � | � | (4 | )� | � | � | 3 | � | � | � | 2 | � | �� | � | 7 | � | � | � | (1 | )� | � | � | (3 | )� | � | � | 3 | � | � | � | (1 | )� |
| �� | � |
� |
� | � | � |
� |
� | � | � |
� |
� | � | � |
� |
� | �� | � |
� |
� | � | � |
� |
� | � | � |
� |
� | � | � |
� |
� | � | � |
� |
� | |
| Income from continuing operations |
�� | � | 906 | � | � | � | 923 | � | � | � | 854 | � | � | � | 1,177 | � | �� | � | 3,860 | � | � | � | 943 | � | � | � | 1,173 | � | � | � | 1,260 | � | � | � | 3,376 | � |
| Provision for income taxes |
�� | � | 357 | � | � | � | 410 | � | � | � | 339 | � | � | � | 30 | � | �� | � | 1,136 | � | � | � | 383 | � | � | � | 425 | � | � | � | 434 | � | � | � | 1,242 | � |
| Depreciation and amortization |
�� | � | 253 | � | � | � | 254 | � | � | � | 262 | � | � | � | 252 | � | �� | � | 1,021 | � | � | � | 256 | � | � | � | 254 | � | � | � | 262 | � | � | � | 772 | � |
| Interest expense, net |
�� | � | 69 | � | � | � | 65 | � | � | � | 76 | � | � | � | 84 | � | �� | � | 294 | � | � | � | 86 | � | � | � | 89 | � | � | � | 79 | � | � | � | 254 | � |
| �� | � |
� |
� | � | � |
� |
� | � | � |
� |
� | � | � |
� |
� | �� | � |
� |
� | � | � |
� |
� | � | � |
� |
� | � | � |
� |
� | � | � |
� |
� | |
| EBITDA |
�� | $ | 1,585 | � | � | $ | 1,652 | � | � | $ | 1,531 | � | � | $ | 1,543 | � | �� | $ | 6,311 | � | � | $ | 1,668 | � | � | $ | 1,941 | � | � | $ | 2,035 | � | � | $ | 5,644 | � |
| �� | � |
� |
� | � | � |
� |
� | � | � |
� |
� | � | � |
� |
� | �� | � |
� |
� | � | � |
� |
� | � | � |
� |
� | � | � |
� |
� | � | � |
� |
� | |
�
| LyondellBasell Industries | �� | 11 | �� | |
| www.lyondellbasell.com | �� | �� |
Table 9 - Selected Segment Operating Information
�
| � | � | 2013 | � | � | 2014 | � | ||||||||||||||||||||||||||||||
| � | � | Q1 | � | � | Q2 | � | � | Q3 | � | � | Q4 | � | � | Total | � | � | Q1 | � | � | Q2 | � | � | Q3 | � | � | YTD | � | |||||||||
| Olefins and Polyolefins - Americas |
� | � | � | � | � | � | � | � | � | |||||||||||||||||||||||||||
| Volumes (million pounds) |
� | � | � | � | � | � | � | � | � | |||||||||||||||||||||||||||
| Ethylene produced |
� | � | 2,337 | � | � | � | 2,412 | � | � | � | 2,111 | � | � | � | 2,156 | � | � | � | 9,016 | � | � | � | 1,979 | � | � | � | 1,721 | � | � | � | 2,301 | � | � | � | 6,001 | � |
| Propylene produced |
� | � | 624 | � | � | � | 529 | � | � | � | 652 | � | � | � | 646 | � | � | � | 2,451 | � | � | � | 611 | � | � | � | 648 | � | � | � | 559 | � | � | � | 1,818 | � |
| Polyethylene sold |
� | � | 1,396 | � | � | � | 1,389 | � | � | � | 1,378 | � | � | � | 1,409 | � | � | � | 5,572 | � | � | � | 1,406 | � | � | � | 1,451 | � | � | � | 1,577 | � | � | � | 4,434 | � |
| Polypropylene sold |
� | � | 565 | � | � | � | 637 | � | � | � | 669 | � | � | � | 642 | � | � | � | 2,513 | � | � | � | 614 | � | � | � | 632 | � | � | � | 681 | � | � | � | 1,927 | � |
| Benchmark Market Prices |
� | � | � | � | � | � | � | � | � | |||||||||||||||||||||||||||
| West Texas Intermediate crude oil (USD per barrel) |
� | � | 94.43 | � | � | � | 94.17 | � | � | � | 105.80 | � | � | � | 97.60 | � | � | � | 98.06 | � | � | � | 98.61 | � | � | � | 102.99 | � | � | � | 97.25 | � | � | � | 99.62 | � |
| Light Louisiana Sweet (�LLS�) crude oil (USD per barrel) |
� | � | 113.86 | � | � | � | 104.64 | � | � | � | 109.94 | � | � | � | 101.12 | � | � | � | 107.31 | � | � | � | 104.36 | � | � | � | 105.55 | � | � | � | 101.03 | � | � | � | 103.63 | � |
| Natural gas (USD per million BTUs) |
� | � | 3.45 | � | � | � | 4.22 | � | � | � | 3.68 | � | � | � | 3.70 | � | � | � | 3.78 | � | � | � | 5.01 | � | � | � | 4.74 | � | � | � | 4.19 | � | � | � | 4.65 | � |
| U.S. weighted average cost of ethylene production (cents/pound) |
� | � | 13.8 | � | � | � | 15.7 | � | � | � | 16.6 | � | � | � | 18.6 | � | � | � | 16.2 | � | � | � | 20.0 | � | � | � | 17.1 | � | � | � | 14.5 | � | � | � | 17.1 | � |
| U.S. ethylene (cents/pound) |
� | � | 48.0 | � | � | � | 46.3 | � | � | � | 45.8 | � | � | � | 46.5 | � | � | � | 46.7 | � | � | � | 48.3 | � | � | � | 47.2 | � | � | � | 51.8 | � | � | � | 49.1 | � |
| U.S. polyethylene [high density] (cents/pound) |
� | � | 66.7 | � | � | � | 68.7 | � | � | � | 71.7 | � | � | � | 75.0 | � | � | � | 70.5 | � | � | � | 76.3 | � | � | � | 77.0 | � | � | � | 78.0 | � | � | � | 77.1 | � |
| U.S. propylene (cents/pound) |
� | � | 75.0 | � | � | � | 63.3 | � | � | � | 68.3 | � | � | � | 68.2 | � | � | � | 68.7 | � | � | � | 73.3 | � | � | � | 69.7 | � | � | � | 70.8 | � | � | � | 71.3 | � |
| U.S. polypropylene [homopolymer] (cents/pound) |
� | � | 88.0 | � | � | � | 76.2 | � | � | � | 82.3 | � | � | � | 82.2 | � | � | � | 82.2 | � | � | � | 88.3 | � | � | � | 84.7 | � | � | � | 86.3 | � | � | � | 86.4 | � |
| Olefins and Polyolefins - Europe, Asia, International |
� | � | � | � | � | � | � | � | � | |||||||||||||||||||||||||||
| Volumes (million pounds) |
� | � | � | � | � | � | � | � | � | |||||||||||||||||||||||||||
| Ethylene produced |
� | � | 912 | � | � | � | 991 | � | � | � | 984 | � | � | � | 930 | � | � | � | 3,817 | � | � | � | 989 | � | � | � | 1,024 | � | � | � | 1,039 | � | � | � | 3,052 | � |
| Propylene produced |
� | � | 577 | � | � | � | 610 | � | � | � | 597 | � | � | � | 568 | � | � | � | 2,352 | � | � | � | 582 | � | � | � | 617 | � | � | � | 629 | � | � | � | 1,828 | � |
| Polyethylene sold |
� | � | 1,206 | � | � | � | 1,314 | � | � | � | 1,212 | � | � | � | 1,167 | � | � | � | 4,899 | � | � | � | 1,275 | � | � | � | 1,363 | � | � | � | 1,284 | � | � | � | 3,922 | � |
| Polypropylene sold |
� | � | 1,657 | � | � | � | 1,821 | � | � | � | 1,612 | � | � | � | 1,531 | � | � | � | 6,621 | � | � | � | 1,509 | � | � | � | 1,707 | � | � | � | 1,633 | � | � | � | 4,849 | � |
| Benchmark Market Prices (�0.01 per pound) |
� | � | � | � | � | � | � | � | � | |||||||||||||||||||||||||||
| Western Europe weighted average cost of ethylene production |
� | � | 36.2 | � | � | � | 29.3 | � | � | � | 34.9 | � | � | � | 38.5 | � | � | � | 34.7 | � | � | � | 32.9 | � | � | � | 34.3 | � | � | � | 31.5 | � | � | � | 32.9 | � |
| Western Europe ethylene |
� | � | 58.6 | � | � | � | 54.4 | � | � | � | 55.0 | � | � | � | 55.1 | � | � | � | 55.8 | � | � | � | 54.7 | � | � | � | 52.8 | � | � | � | 54.1 | � | � | � | 53.9 | � |
| Western Europe polyethylene [high density] |
� | � | 61.2 | � | � | � | 56.8 | � | � | � | 57.9 | � | � | � | 57.1 | � | � | � | 58.2 | � | � | � | 56.1 | � | � | � | 54.8 | � | � | � | 55.4 | � | � | � | 55.5 | � |
| Western Europe propylene |
� | � | 50.6 | � | � | � | 47.9 | � | � | � | 49.6 | � | � | � | 49.9 | � | � | � | 49.5 | � | � | � | 51.3 | � | � | � | 52.2 | � | � | � | 51.9 | � | � | � | 51.8 | � |
| Western Europe polypropylene [homopolymer] |
� | � | 59.1 | � | � | � | 56.1 | � | � | � | 58.1 | � | � | � | 58.2 | � | � | � | 57.9 | � | � | � | 59.9 | � | � | � | 61.3 | � | � | � | 61.4 | � | � | � | 60.9 | � |
| Intermediates and Derivatives |
� | � | � | � | � | � | � | � | � | |||||||||||||||||||||||||||
| Volumes (million pounds) |
� | � | � | � | � | � | � | � | � | |||||||||||||||||||||||||||
| Propylene oxide and derivatives |
� | � | 683 | � | � | � | 665 | � | � | � | 665 | � | � | � | 729 | � | � | � | 2,742 | � | � | � | 772 | � | � | � | 726 | � | � | � | 768 | � | � | � | 2,266 | � |
| Ethylene oxide and derivatives |
� | � | 260 | � | � | � | 277 | � | � | � | 294 | � | � | � | 346 | � | � | � | 1,177 | � | � | � | 262 | � | � | � | 319 | � | � | � | 211 | � | � | � | 792 | � |
| Styrene monomer |
� | � | 703 | � | � | � | 589 | � | � | � | 756 | � | � | � | 832 | � | � | � | 2,880 | � | � | � | 683 | � | � | � | 870 | � | � | � | 933 | � | � | � | 2,486 | � |
| Acetyls |
� | � | 431 | � | � | � | 470 | � | � | � | 506 | � | � | � | 510 | � | � | � | 1,917 | � | � | � | 683 | � | � | � | 592 | � | � | � | 613 | � | � | � | 1,888 | � |
| TBA Intermediates |
� | � | 434 | � | � | � | 357 | � | � | � | 425 | � | � | � | 442 | � | � | � | 1,658 | � | � | � | 416 | � | � | � | 391 | � | � | � | 461 | � | � | � | 1,268 | � |
| Volumes (million gallons) |
� | � | � | � | � | � | � | � | � | |||||||||||||||||||||||||||
| MTBE/ETBE |
� | � | 185 | � | � | � | 235 | � | � | � | 241 | � | � | � | 222 | � | � | � | 883 | � | � | � | 188 | � | � | � | 266 | � | � | � | 245 | � | � | � | 699 | � |
| Benchmark Market Margins (cents per gallon) |
� | � | � | � | � | � | � | � | � | |||||||||||||||||||||||||||
| MTBE - Northwest Europe |
� | � | 104.9 | � | � | � | 88.4 | � | � | � | 86.8 | � | � | � | 37.8 | � | � | � | 79.1 | � | � | � | 63.4 | � | � | � | 90.7 | � | � | � | 111.8 | � | � | � | 86.4 | � |
| Refining |
� | � | � | � | � | � | � | � | � | |||||||||||||||||||||||||||
| Volumes (thousands of barrels per day) |
� | � | � | � | � | � | � | � | � | |||||||||||||||||||||||||||
| Heavy crude oil processing rate |
� | � | 173 | � | � | � | 265 | � | � | � | 250 | � | � | � | 239 | � | � | � | 232 | � | � | � | 247 | � | � | � | 257 | � | � | � | 264 | � | � | � | 256 | � |
| Benchmark Market Margins |
� | � | � | � | � | � | � | � | � | |||||||||||||||||||||||||||
| Light crude oil - 2-1-1 |
� | � | 11.53 | � | � | � | 14.63 | � | � | � | 12.63 | � | � | � | 12.67 | � | � | � | 12.89 | � | � | � | 13.18 | � | � | � | 17.29 | � | � | � | 14.20 | � | � | � | 14.90 | � |
| Light crude oil - Maya differential |
� | � | 11.17 | � | � | � | 6.95 | � | � | � | 10.59 | � | � | � | 11.65 | � | � | � | 10.05 | � | � | � | 15.08 | � | � | � | 9.72 | � | � | � | 10.15 | � | � | � | 11.64 | � |
Source: LYB and third party consultants
Note: Benchmark market prices for U.S. and Western Europe polyethylene and polypropylene reflect discounted prices.
�
| LyondellBasell Industries | �� | 12 | �� | |
| www.lyondellbasell.com | �� | �� |
Table 10 - Unaudited Income Statement Information
�
| � | � | 2013 | � | � | 2014 | � | ||||||||||||||||||||||||||||||
| (Millions of U.S. dollars) |
� | Q1 | � | � | Q2 | � | � | Q3 | � | � | Q4 | � | � | Total | � | � | Q1 | � | � | Q2 | � | � | Q3 | � | � | YTD | � | |||||||||
| Sales and other operating revenues |
� | $ | 10,669 | � | � | $ | 11,103 | � | � | $ | 11,152 | � | � | $ | 11,138 | � | � | $ | 44,062 | � | � | $ | 11,135 | � | � | $ | 12,117 | � | � | $ | 12,066 | � | � | $ | 35,318 | � |
| Cost of sales |
� | � | 9,153 | � | � | � | 9,496 | � | � | � | 9,690 | � | � | � | 9,601 | � | � | � | 37,940 | � | � | � | 9,577 | � | � | � | 10,255 | � | � | � | 10,118 | � | � | � | 29,950 | � |
| Selling, general and administrative expenses |
� | � | 213 | � | � | � | 208 | � | � | � | 220 | � | � | � | 229 | � | � | � | 870 | � | � | � | 186 | � | � | � | 215 | � | � | � | 211 | � | � | � | 612 | � |
| Research and development expenses |
� | � | 36 | � | � | � | 35 | � | � | � | 35 | � | � | � | 44 | � | � | � | 150 | � | � | � | 32 | � | � | � | 34 | � | � | � | 31 | � | � | � | 97 | � |
| � | � |
� |
� | � | � |
� |
� | � | � |
� |
� | � | � |
� |
� | � | � |
� |
� | � | � |
� |
� | � | � |
� |
� | � | � |
� |
� | � | � |
� |
� | |
| Operating income |
� | � | 1,267 | � | � | � | 1,364 | � | � | � | 1,207 | � | � | � | 1,264 | � | � | � | 5,102 | � | � | � | 1,340 | � | � | � | 1,613 | � | � | � | 1,706 | � | � | � | 4,659 | � |
| Income from equity investments |
� | � | 59 | � | � | � | 43 | � | � | � | 61 | � | � | � | 40 | � | � | � | 203 | � | � | � | 61 | � | � | � | 68 | � | � | � | 64 | � | � | � | 193 | � |
| Interest expense, net |
� | � | (69 | )� | � | � | (65 | )� | � | � | (76 | )� | � | � | (84 | )� | � | � | (294 | )� | � | � | (86 | )� | � | � | (89 | )� | � | � | (79 | )� | � | � | (254 | )� |
| Other income (expense), net |
� | � | 6 | � | � | � | (9 | )� | � | � | 1 | � | � | � | (13 | )� | � | � | (15 | )� | � | � | 11 | � | � | � | 6 | � | � | � | 3 | � | � | � | 20 | � |
| � | � |
� |
� | � | � |
� |
� | � | � |
� |
� | � | � |
� |
� | � | � |
� |
� | � | � |
� |
� | � | � |
� |
� | � | � |
� |
� | � | � |
� |
� | |
| Income from continuing operations before income taxes |
� | � | 1,263 | � | � | � | 1,333 | � | � | � | 1,193 | � | � | � | 1,207 | � | � | � | 4,996 | � | � | � | 1,326 | � | � | � | 1,598 | � | � | � | 1,694 | � | � | � | 4,618 | � |
| Provision for income taxes |
� | � | 357 | � | � | � | 410 | � | � | � | 339 | � | � | � | 30 | � | � | � | 1,136 | � | � | � | 383 | � | � | � | 425 | � | � | � | 434 | � | � | � | 1,242 | � |
| � | � |
� |
� | � | � |
� |
� | � | � |
� |
� | � | � |
� |
� | � | � |
� |
� | � | � |
� |
� | � | � |
� |
� | � | � |
� |
� | � | � |
� |
� | |
| Income from continuing operations |
� | � | 906 | � | � | � | 923 | � | � | � | 854 | � | � | � | 1,177 | � | � | � | 3,860 | � | � | � | 943 | � | � | � | 1,173 | � | � | � | 1,260 | � | � | � | 3,376 | � |
| Income (loss) from discontinued operations, net of tax |
� | � | (6 | )� | � | � | 4 | � | � | � | (3 | )� | � | � | (2 | )� | � | � | (7 | )� | � | � | 1 | � | � | � | 3 | � | � | � | (3 | )� | � | � | 1 | � |
| � | � |
� |
� | � | � |
� |
� | � | � |
� |
� | � | � |
� |
� | � | � |
� |
� | � | � |
� |
� | � | � |
� |
� | � | � |
� |
� | � | � |
� |
� | |
| Net income |
� | � | 900 | � | � | � | 927 | � | � | � | 851 | � | � | � | 1,175 | � | � | � | 3,853 | � | � | � | 944 | � | � | � | 1,176 | � | � | � | 1,257 | � | � | � | 3,377 | � |
| Net (income) loss attributable to non-controlling interests |
� | � | 1 | � | � | � | 2 | � | � | � | 2 | � | � | � | (1 | )� | � | � | 4 | � | � | � | 1 | � | � | � | 2 | � | � | � | 1 | � | � | � | 4 | � |
| � | � |
� |
� | � | � |
� |
� | � | � |
� |
� | � | � |
� |
� | � | � |
� |
� | � | � |
� |
� | � | � |
� |
� | � | � |
� |
� | � | � |
� |
� | |
| Net income attributable to the Company shareholders |
� | $ | 901 | � | � | $ | 929 | � | � | $ | 853 | � | � | $ | 1,174 | � | � | $ | 3,857 | � | � | $ | 945 | � | � | $ | 1,178 | � | � | $ | 1,258 | � | � | $ | 3,381 | � |
| � | � |
� |
� | � | � |
� |
� | � | � |
� |
� | � | � |
� |
� | � | � |
� |
� | � | � |
� |
� | � | � |
� |
� | � | � |
� |
� | � | � |
� |
� | |
�
| LyondellBasell Industries | �� | 13 | �� | |
| www.lyondellbasell.com | �� | �� |
Table 11 - Charges (Benefits) Included in Income from Continuing Operations
�
| � | � | 2013 | � | � | 2014 | � | ||||||||||||||||||||||||||||||
| Millions of U.S. dollars (except share data) |
� | Q1 | � | � | Q2 | � | � | Q3 | � | � | Q4 | � | � | Total | � | � | Q1 | � | � | Q2 | � | � | Q3 | � | � | YTD | � | |||||||||
| Pretax charges (benefits): |
� | � | � | � | � | � | � | � | � | |||||||||||||||||||||||||||
| Impairments |
� | $ | ��� | � | � | $ | ��� | � | � | $ | ��� | � | � | $ | 10 | � | � | $ | 10 | � | � | $ | ��� | � | � | $ | ��� | � | � | $ | ��� | � | � | $ | ��� | � |
| Insurance settlement |
� | � | ��� | � | � | � | ��� | � | � | � | ��� | � | � | � | (25 | )� | � | � | (25 | )� | � | � | ��� | � | � | � | ��� | � | � | � | ��� | � | � | � | ��� | � |
| Settlement of environmental indemnification agreement |
� | � | ��� | � | � | � | ��� | � | � | � | ��� | � | � | � | ��� | � | � | � | ��� | � | � | � | (52 | )� | � | � | ��� | � | � | � | ��� | � | � | � | (52 | )� |
| Loss on sale of investment |
� | � | ��� | � | � | � | ��� | � | � | � | ��� | � | � | � | 16 | � | � | � | 16 | � | � | � | ��� | � | � | � | ��� | � | � | � | ��� | � | � | � | ��� | � |
| Lower of cost or market inventory adjustment |
� | � | ��� | � | � | � | ��� | � | � | � | ��� | � | � | � | ��� | � | � | � | ��� | � | � | � | ��� | � | � | � | ��� | � | � | � | 45 | � | � | � | 45 | � |
| � | � |
� |
� | � | � |
� |
� | � | � |
� |
� | � | � |
� |
� | � | � |
� |
� | � | � |
� |
� | � | � |
� |
� | � | � |
� |
� | � | � |
� |
� | |
| Total pretax charges (benefits) |
� | � | ��� | � | � | � | ��� | � | � | � | ��� | � | � | � | 1 | � | � | � | 1 | � | � | � | (52 | )� | � | � | ��� | � | � | � | 45 | � | � | � | (7 | )� |
| Provision for (benefit from) income tax related to these items |
� | � | ��� | � | � | � | ��� | � | � | � | ��� | � | � | � | 4 | � | � | � | 4 | � | � | � | ��� | � | � | � | ��� | � | � | � | (17 | )� | � | � | (17 | )� |
| � | � |
� |
� | � | � |
� |
� | � | � |
� |
� | � | � |
� |
� | � | � |
� |
� | � | � |
� |
� | � | � |
� |
� | � | � |
� |
� | � | � |
� |
� | |
| After-tax effect of net charges (benefits) |
� | $ | ��� | � | � | $ | ��� | � | � | $ | ��� | � | � | $ | 5 | � | � | $ | 5 | � | � | $ | (52 | )� | � | $ | ��� | � | � | $ | 28 | � | � | $ | (24 | )� |
| � | � |
� |
� | � | � |
� |
� | � | � |
� |
� | � | � |
� |
� | � | � |
� |
� | � | � |
� |
� | � | � |
� |
� | � | � |
� |
� | � | � |
� |
� | |
| Effect on diluted earnings per share |
� | $ | ��� | � | � | $ | ��� | � | � | $ | ��� | � | � | $ | ��� | � | � | $ | ��� | � | � | $ | 0.09 | � | � | $ | ��� | � | � | $ | (0.05 | )� | � | $ | 0.04 | � |
�
| LyondellBasell Industries | �� | 14 | �� | |
| www.lyondellbasell.com | �� | �� |
Table 12 - Unaudited Cash Flow Information
�
| � | � | 2013 | � | � | 2014 | � | ||||||||||||||||||||||||||||||
| (Millions of U.S. dollars) |
� | Q1 | � | � | Q2 | � | � | Q3 | � | � | Q4 | � | � | Total | � | � | Q1 | � | � | Q2 | � | � | Q3 | � | � | YTD | � | |||||||||
| Net cash provided by operating activities |
� | $ | 799 | � | � | $ | 1,246 | � | � | $ | 1,116 | � | � | $ | 1,674 | � | � | $ | 4,835 | � | � | $ | 801 | � | � | $ | 1,797 | � | � | $ | 1,434 | � | � | $ | 4,032 | � |
| Net cash used in investing activities |
� | � | (408 | )� | � | � | (389 | )� | � | � | (438 | )� | � | � | (367 | )� | � | � | (1,602 | )� | � | � | (2,011 | )� | � | � | (246 | )� | � | � | (638 | )� | � | � | (2,895 | )� |
| Net cash provided by (used in) financing activities |
� | � | (234 | )� | � | � | (508 | )� | � | � | 452 | � | � | � | (1,299 | )� | � | � | (1,589 | )� | � | � | (550 | )� | � | � | (2,217 | )� | � | � | (1,621 | )� | � | � | (4,388 | )� |
�
| LyondellBasell Industries | �� | 15 | �� | |
| www.lyondellbasell.com | �� | �� |
Table 13 - Unaudited Balance Sheet Information
�
| � | � | March�31, | � | � | June�30, | � | � | September�30, | � | � | December�31, | � | � | March�31, | � | � | June�30, | � | � | September�30, | � | |||||||
| (Millions of U.S. dollars) |
� | 2013 | � | � | 2013 | � | � | 2013 | � | � | 2013 | � | � | 2014 | � | � | 2014 | � | � | 2014 | � | |||||||
| Cash and cash equivalents |
� | $ | 2,879 | � | � | $ | 3,233 | � | � | $ | 4,414 | � | � | $ | 4,450 | � | � | $ | 2,702 | � | � | $ | 2,030 | � | � | $ | 1,185 | � |
| Restricted cash |
� | � | 6 | � | � | � | 2 | � | � | � | 4 | � | � | � | 10 | � | � | � | 3 | � | � | � | 2 | � | � | � | ��� | � |
| Short-term investments |
� | � | ��� | �� | � | � | ��� | � | � | � | ��� | �� | � | � | ��� | �� | � | � | 1,402 | � | � | � | 1,299 | � | � | � | 1,544 | � |
| Accounts receivable, net |
� | � | 3,878 | � | � | � | 4,023 | � | � | � | 4,041 | � | � | � | 4,030 | � | � | � | 4,141 | � | � | � | 4,264 | � | � | � | 4,105 | � |
| Inventories |
� | � | 5,270 | � | � | � | 5,197 | � | � | � | 5,382 | � | � | � | 5,279 | � | � | � | 5,589 | � | � | � | 5,326 | � | � | � | 5,359 | � |
| Prepaid expenses and other current assets |
� | � | 622 | � | � | � | 577 | � | � | � | 784 | � | � | � | 830 | � | � | � | 1,156 | � | � | � | 784 | � | � | � | 739 | � |
| � | � |
� |
� | � | � |
� |
� | � | � |
� |
� | � | � |
� |
� | � | � |
� |
� | � | � |
� |
� | � | � |
� |
� | |
| Total current assets |
� | � | 12,655 | � | � | � | 13,032 | � | � | � | 14,625 | � | � | � | 14,599 | � | � | � | 14,993 | � | � | � | 13,705 | � | � | � | 12,932 | � |
| Property, plant and equipment, net |
� | � | 7,779 | � | � | � | 7,979 | � | � | � | 8,223 | � | � | � | 8,457 | � | � | � | 8,556 | � | � | � | 8,740 | � | � | � | 8,600 | � |
| Investments and long-term receivables: |
� | � | � | � | � | � | � | |||||||||||||||||||||
| Investment in PO joint ventures |
� | � | 401 | � | � | � | 409 | � | � | � | 423 | � | � | � | 421 | � | � | � | 424 | � | � | � | 418 | � | � | � | 397 | � |
| Equity investments |
� | � | 1,607 | � | � | � | 1,622 | � | � | � | 1,615 | � | � | � | 1,629 | � | � | � | 1,693 | � | � | � | 1,702 | � | � | � | 1,690 | � |
| Other investments and long-term receivables |
� | � | 421 | � | � | � | 231 | � | � | � | 164 | � | � | � | 64 | � | � | � | 62 | � | � | � | 58 | � | � | � | 54 | � |
| Goodwill |
� | � | 582 | � | � | � | 588 | � | � | � | 598 | � | � | � | 605 | � | � | � | 605 | � | � | � | 602 | � | � | � | 576 | � |
| Intangible assets, net |
� | � | 999 | � | � | � | 966 | � | � | � | 934 | � | � | � | 904 | � | � | � | 870 | � | � | � | 838 | � | � | � | 799 | � |
| Other assets |
� | � | 233 | � | � | � | 221 | � | � | � | 229 | � | � | � | 619 | � | � | � | 624 | � | � | � | 593 | � | � | � | 583 | � |
| � | � |
� |
� | � | � |
� |
� | � | � |
� |
� | � | � |
� |
� | � | � |
� |
� | � | � |
� |
� | � | � |
� |
� | |
| Total assets |
� | $ | 24,677 | � | � | $ | 25,048 | � | � | $ | 26,811 | � | � | $ | 27,298 | � | � | $ | 27,827 | � | � | $ | 26,656 | � | � | $ | 25,631 | � |
| � | � |
� |
� | � | � |
� |
� | � | � |
� |
� | � | � |
� |
� | � | � |
� |
� | � | � |
� |
� | � | � |
� |
� | |
| Current maturities of long-term debt |
� | $ | 1 | � | � | $ | 1 | � | � | $ | 1 | � | � | $ | 1 | � | � | $ | 3 | � | � | $ | 3 | � | � | $ | 2 | � |
| Short-term debt |
� | � | 115 | � | � | � | 114 | � | � | � | 114 | � | � | � | 58 | � | � | � | 58 | � | � | � | 55 | � | � | � | 56 | � |
| Accounts payable |
� | � | 3,217 | � | � | � | 3,324 | � | � | � | 3,241 | � | � | � | 3,572 | � | � | � | 3,642 | � | � | � | 3,690 | � | � | � | 3,431 | � |
| Accrued liabilities |
� | � | 1,217 | � | � | � | 1,047 | � | � | � | 1,528 | � | � | � | 1,299 | � | � | � | 1,477 | � | � | � | 1,310 | � | � | � | 1,460 | � |
| Deferred income taxes |
� | � | 557 | � | � | � | 550 | � | � | � | 494 | � | � | � | 580 | � | � | � | 540 | � | � | � | 570 | � | � | � | 685 | � |
| � | � |
� |
� | � | � |
� |
� | � | � |
� |
� | � | � |
� |
� | � | � |
� |
� | � | � |
� |
� | � | � |
� |
� | |
| Total current liabilities |
� | � | 5,107 | � | � | � | 5,036 | � | � | � | 5,378 | � | � | � | 5,510 | � | � | � | 5,720 | � | � | � | 5,628 | � | � | � | 5,634 | � |
| Long-term debt |
� | � | 4,307 | � | � | � | 4,306 | � | � | � | 5,774 | � | � | � | 5,776 | � | � | � | 6,766 | � | � | � | 6,766 | � | � | � | 6,753 | � |
| Other liabilities |
� | � | 2,306 | � | � | � | 2,325 | � | � | � | 2,278 | � | � | � | 1,839 | � | � | � | 1,838 | � | � | � | 1,851 | � | � | � | 1,795 | � |
| Deferred income taxes |
� | � | 1,277 | � | � | � | 1,312 | � | � | � | 1,472 | � | � | � | 1,659 | � | � | � | 1,677 | � | � | � | 1,623 | � | � | � | 1,574 | � |
| Stockholders� equity |
� | � | 11,641 | � | � | � | 12,032 | � | � | � | 11,874 | � | � | � | 12,478 | � | � | � | 11,791 | � | � | � | 10,753 | � | � | � | 9,843 | � |
| Non-controlling interests |
� | � | 39 | � | � | � | 37 | � | � | � | 35 | � | � | � | 36 | � | � | � | 35 | � | � | � | 35 | � | � | � | 32 | � |
| � | � |
� |
� | � | � |
� |
� | � | � |
� |
� | � | � |
� |
� | � | � |
� |
� | � | � |
� |
� | � | � |
� |
� | |
| Total liabilities and stockholders� equity |
� | $ | 24,677 | � | � | $ | 25,048 | � | � | $ | 26,811 | � | � | $ | 27,298 | � | � | $ | 27,827 | � | � | $ | 26,656 | � | � | $ | 25,631 | � |
| � | � |
� |
� | � | � |
� |
� | � | � |
� |
� | � | � |
� |
� | � | � |
� |
� | � | � |
� |
� | � | � |
� |
� | |
�
| LyondellBasell Industries | �� | 16 | �� | |
| www.lyondellbasell.com | �� | �� |
 lyondellbasell.com
Jim Gallogly, Chief Executive Officer
Karyn Ovelmen, Chief Financial Officer
Sergey Vasnetsov, SVP �
Strategic Planning and Transactions
Doug Pike, VP �
Investor Relations
Third-Quarter 2014 Earnings
Exhibit� 99.2 |
 lyondellbasell.com
Cautionary Statement
2
The
statements
in
this
presentation
relating
to
matters
that
are
not
historical
facts
are
forward-looking
statements.
These
forward-looking statements are based upon assumptions of management which are
believed to be reasonable at the time made and are subject to significant
risks and uncertainties. Actual results could differ materially based on factors including, but not
limited to, the business cyclicality of the chemical, polymers and refining
industries; the availability, cost and price volatility of raw materials and
utilities, particularly the cost of oil, natural gas, and associated natural gas liquids; competitive product and
pricing pressures; labor conditions; our ability to attract and retain key
personnel; operating interruptions (including leaks, explosions, fires,
weather-related incidents, mechanical failure, unscheduled downtime, supplier disruptions, labor shortages,
strikes, work stoppages or other labor difficulties, transportation interruptions,
spills and releases and other environmental risks);
the
supply/demand
balances
for
our
and
our
joint
ventures�
products,
and
the
related
effects
of
industry
production
capacities and operating rates; our ability to achieve expected cost savings and
other synergies; our ability to successfully execute projects and growth
strategies; legal and environmental proceedings; tax rulings and changes in laws, regulations or
treaties, consequences or proceedings; technological developments, and our ability
to develop new products and process technologies; potential governmental
regulatory actions; political unrest and terrorist acts; risks and uncertainties posed by
international operations, including foreign currency fluctuations; and our ability
to comply with debt covenants and service our debt.� Additional factors
that could cause results to differ materially from those described in the forward-looking statements can
be found in the �Risk Factors�
section of our Form 10-K for the year ended December 31, 2013, which can be
found at www.lyondellbasell.com
on
the
Investor
Relations
page
and
on
the
Securities
and
Exchange
Commission�s
website
at
www.sec.gov.
The illustrative results or returns of growth projects are not in any way intended
to be, nor should they be taken as, indicators or guarantees of performance.
The assumptions on which they are based are not projections and do not necessarily represent the
Company�s expectations and future performance. You should not rely on
illustrated results or returns or these assumptions as being indicative of
our future results or returns. This presentation contains time sensitive
information that is accurate only as of the date hereof.� Information contained in this
presentation is unaudited and is subject to change.� We undertake no
obligation to update the information presented herein except as required by
law. |
 lyondellbasell.com
Information Related to Financial Measures
3
We have included EBITDA in this presentation, which is a non-GAAP measure, as
we believe that EBITDA
is
a
measure
commonly
used
by
investors.
However,
EBITDA,
as
presented
herein,
may
not
be
comparable to a similarly titled measure reported by other companies due to
differences in the way the measure is calculated.
We calculate EBITDA as income from continuing operations plus interest
expense (net), provision for (benefit from) income taxes, and depreciation &
amortization. EBITDA should not be considered an alternative to profit or
operating profit for any period as an indicator of our performance, or as an
alternative to operating cash flows as a measure of our liquidity. See Table 8 of
our accompanying earnings release for reconciliations of EBITDA to net income and
income from continuing operations.
While
we
also
believe
that
free
cash
flow
(FCF)
and
book
capital
are
measures
commonly
used
by
investors,
free
cash
flow
and
book
capital,
as
presented
herein,
may
not
be
comparable
to
similarly
titled
measures reported by other companies due to differences in the way the measures are
calculated. For purposes of this presentation, free cash flow means net cash
provided by operating activities minus capital
expenditures
and
book
capital
means
total
debt
plus
stockholders�
equity
plus
minority
interests. |
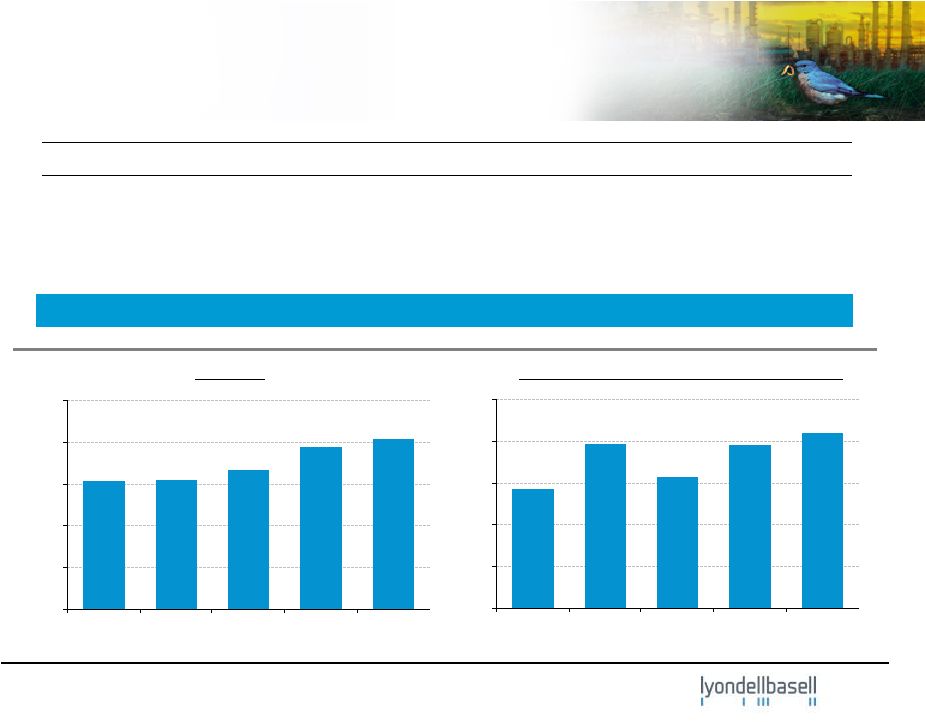 Highlights
4
EBITDA
LTM
EBITDA
�
$7,187
million
LTM
EPS
�
$8.49
per
share
($ in millions)
Income from Continuing Operations
500
1,000
1,500
2,000
$2,500
3Q'13
4Q'13
1Q'14
2Q'14
3Q'14
300
600
900
1,200
$1,500
3Q'13
4Q'13
1Q'14
2Q'14
3Q'14
($ in millions, except per share data)
3Q'14
2Q'14
3Q'13
EBITDA
$2,035
$1,941
$1,531
Income from Continuing Operations
$1,260
$1,173
$854
Diluted Earnings ($ / share) from Continuing Operations
$2.46
$2.22
$1.51
lyondellbasell.com |
 lyondellbasell.com
LyondellBasell Safety Performance
5
1) Includes employees and contractors.
Safety -
Injuries per 200,000 Hours Worked
(1)
0.0
0.1
0.2
0.3
0.4
0.5
2009
2010
2011
2012
2013
2014 Q3
YTD |
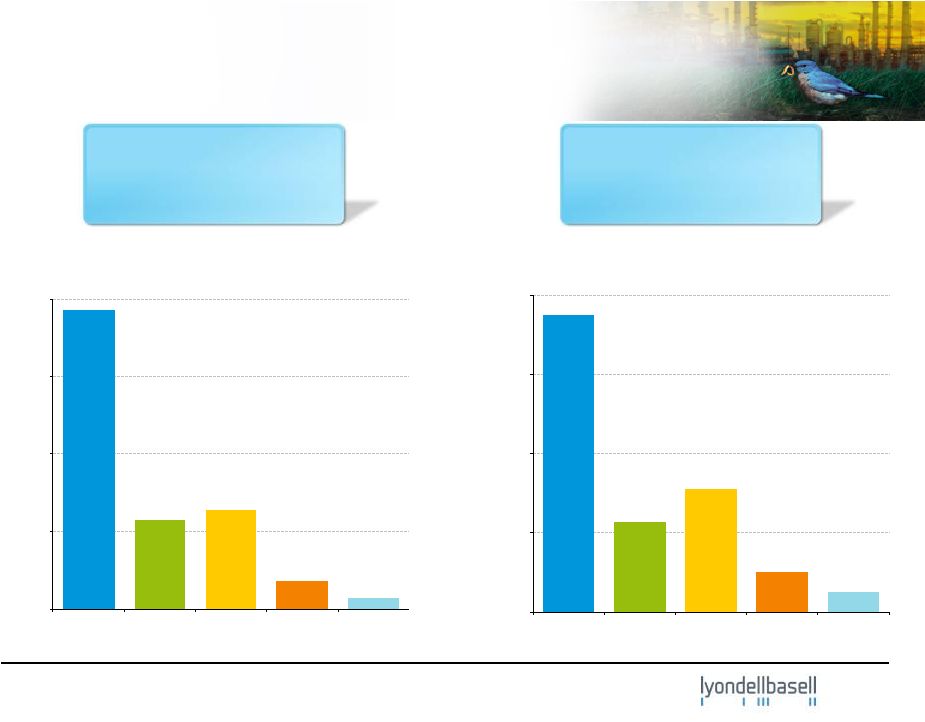 lyondellbasell.com
Third Quarter 2014 and Last Twelve Months (LTM)
Segment EBITDA
6
LTM Sept. 2014 EBITDA
$7,187 million
LTM Sept. 2014 Operating Income
$5,923 million
Q3�14 EBITDA
$2,035 million
Q3�14 Operating Income
$1,706 million
($ in millions)
($ in millions)
LTM September 2014 EBITDA
Third Quarter 2014 EBITDA
300
600
900
$1,200
Olefins &
Polyolefins -
Americas
Olefins &
Polyolefins -
EAI
Intermediates
& Derivatives
Refining
Technology
1,000
2,000
3,000
$4,000
Olefins &
Polyolefins -
Americas
Olefins &
Polyolefins -
EAI
Intermediates
& Derivatives
Refining
Technology |
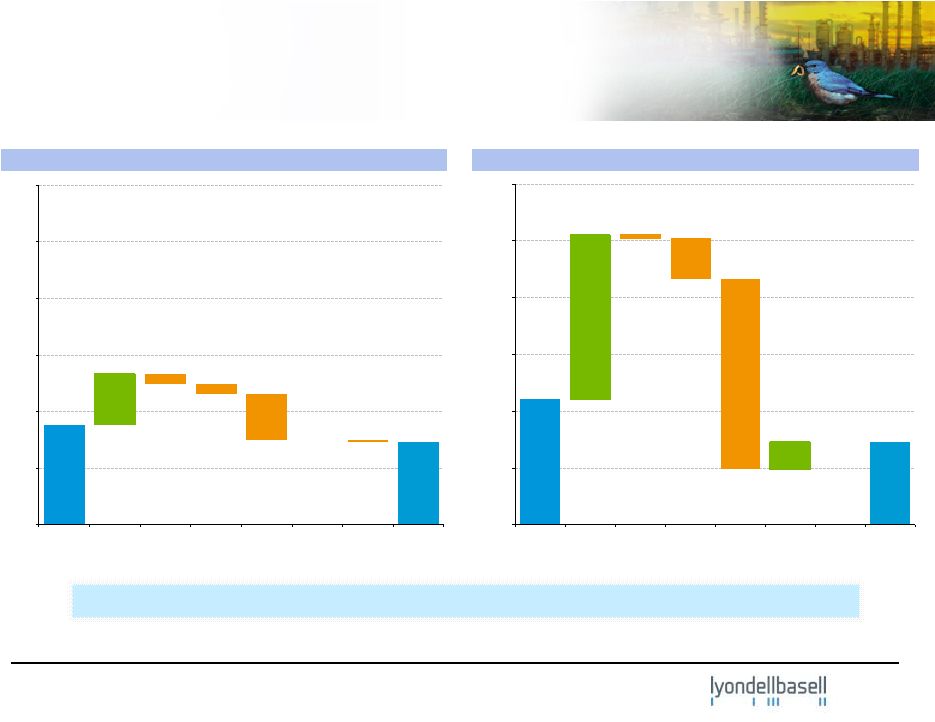 $3,529
$2,929
0
2,000
4,000
6,000
8,000
10,000
$12,000
Q3 2014
Beginning
Balance
CF from
Operations
excl.
Working
Capital
Working
Capital
Changes
Capex
Dividends &
Share
Repurchases
Net Debt
Borrowings
Other
Q3 2014
Ending
Balance
$4,414
$2,929
0
2,000
4,000
6,000
8,000
10,000
$12,000
Q4 2013
Beginning
Balance
CF from
Operations
excl.
Working
Capital
Working
Capital
Changes
Capex
Dividends &
Share
Repurchases
Net Debt
Borrowings
Other
Q3 2014
Ending
Balance
Cash Flow
7
1) Beginning and ending cash balances include cash and short-term securities; 2)
Includes� accounts receivable, inventories and accounts payable; 3) Includes capital and maintenance turnaround spending.
($ in millions)
Q3 2014
LTM September 2014
(3)
(2)
(1)
(2)
(1)
(3)
(1)
(1)
~ $6.7 billion in dividends and share repurchases in the LTM September 2014
lyondellbasell.com |
 Strong Cash Generation,
Share Repurchases & Dividends
8
Cash From Operations
Dividends & Share Repurchases
($ in millions)
($ in millions)
~ 12 million shares repurchased during
Q3�2014 and ~ 73 million shares
repurchased as of Sept. 30, 2014
Key Statistics
1) Cash balances include cash and short-term securities.
Snapshot at September 30, 2014
LTM FCF:� $4.3 billion
LTM Capex:� $1.5 billion
Cash
(1)
:� $2.9 billion
Total Debt/LTM EBITDA: 0.9x
Total Debt/Book Capital: 41%
lyondellbasell.com
1,000
2,000
3,000
4,000
5,000
6,000
$7,000
2011
2012
2013
LTM Sept 2014
Capex
Free Cash Flow
1,000
2,000
3,000
4,000
5,000
6,000
$7,000
2011
2012
2013
LTM Sep 2014
Interim Dividends
Special Dividends
Share Repurchases |
 0
15
30
45
60
Ethane Margin
Naphtha Margin
HDPE Margin
Ethylene/HDPE Chain
Olefins & Polyolefins �
Americas
Highlights
and
Business
Drivers
�
3Q�14
9
U.S. Olefins
�
Net sales and internal consumption
increased ~80 MM lbs.
�
Ethylene price higher by ~8�/lb
�
Lower NGL costs
Polyethylene
�
Spread down ~7�/lb
�
Volumes up ~9%
Polypropylene (includes Catalloy)
�
Spread relatively unchanged
�
Volumes up ~11%
Ethylene Chain Margins
(1)
EBITDA
Performance vs. 2Q�14
Polypropylene Margins
(1)
($ in millions)
1) Source: Quarterly average industry data from third party consultants; 2) The
direction of the arrows reflects our underlying business metrics. (2)
3Q�13
2Q�14
3Q�14
Oct�14
(cents / lb)
(cents / lb)
200
400
600
800
1,000
$1,200
3Q'13
4Q'13
1Q'14
2Q'14
3Q'14
0.0
1.5
3.0
4.5
6.0
3Q'13
2Q'14
3Q'14
Oct'14
lyondellbasell.com
EBITDA
Margin
Volume |
 Olefins & Polyolefins �
Europe, Asia, International
Highlights and Business Drivers �
3Q�14
10
EU Olefins
�
Higher naphtha margin
�
Advantaged feedstocks ~55%
�
Operating rate ~95%
Polyethylene
�
Margins up slightly
�
Volumes down ~5%
Polypropylene (includes Catalloy)
�
Margins up slightly
�
Volumes down ~3%
JV equity income �
maintenance
European Ethylene Chain Margins
(1)
EBITDA
Performance vs. 2Q�14
European Polypropylene Margins
(1)
(cents / lb)
(cents / lb)
1) Source: Quarterly average data from third party
consultants; 2) The direction of the arrows reflects our underlying business metrics.
($ in millions)
(2)
100
200
300
$400
3Q'13
4Q'13
1Q'14
2Q'14
3Q'14
(10)
5
20
35
50
3Q'13
2Q'14
3Q'14
Oct'14
Naphtha Margin
HDPE Margin
Ethylene/HDPE Chain
(4)
(2)
0
2
4
3Q'13
2Q'14
3Q'14
Oct'14
EBITDA
Margin
Volume
lyondellbasell.com |
 Intermediates & Derivatives
Highlights and Business Drivers �
3Q�14
11
EBITDA
Propylene Oxide and Derivatives
�
PO derivative margins higher
�
PO volume up
Intermediates
�
Styrene margins� down ~3�/lb
�
Volume stable
Oxyfuels
�
Volumes down ~7%
EBITDA
Margin
Volume
Performance vs. 2Q�14
($ in millions)
EU MTBE Raw Material Margins (per Platts)
(1)
(cents / gallon)
P-Glycol Raw Material Margins (per Chemdata)
(1)
1) Data represents quarterly average; 2) The direction of the
arrows reflects our underlying business metrics.
(2)
(cents / lb)
100
200
300
400
$500
3Q'13
4Q'13
1Q'14
2Q'14
3Q'14
0
20
40
60
3Q13
2Q14
3Q14
4Q14 E
0
40
80
120
160
3Q'13
2Q'14
3Q'14
Oct'14
lyondellbasell.com |
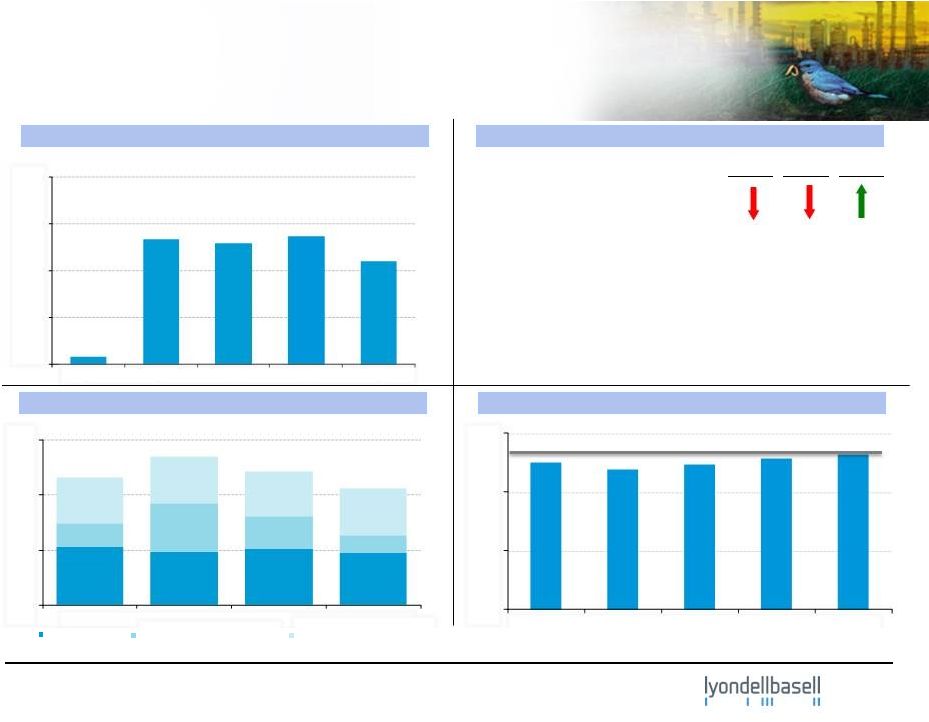 Refining Highlights and Business Drivers �
3Q�14
12
Houston Refinery
�
Maya 2-1-1:� $24.35 per bbl, down
$2.66 from 2Q�14
�
Crude throughput: 264 MBPD
�
Cost of RINs flat
�
Scheduled hydrodesulfurization
maintenance during the quarter
EBITDA
Performance vs. 2Q�14
EBITDA
Margin
Volume
($ in millions)
1) Light Louisiana Sweet (LLS) is the referenced light crude. Data represents
quarterly average; 2) The direction of the arrows reflects our underlying business metrics.
Capacity = 268 MBPD
Refining Spreads (per Platts)
(1)
Refining Throughput
(2)
($ / bbl)
(MBPD)
lyondellbasell.com
50
100
150
$200
3Q'13
4Q'13
1Q'14
2Q'14
3Q'14
0
10
20
30
3Q'13
2Q'14
3Q'14
Oct'14
Lt-Hvy (LLS-Maya)
Lt-Gasoline
(USGC
RBOB
-
LLS)
Lt-ULSD
(USGC
ULSD
-
LLS)
0
100
200
300
3Q'13
4Q'13
1Q'14
2Q'14
3Q'14 |
 Third Quarter Summary and Outlook
13
U.S. industry conditions remain
favorable, but lower crude price and
seasonal factors expected to
negatively impact the fourth quarter
O&P Americas expected to benefit
from the La Porte expansion
We expect typical seasonal trends in
O&P EAI, Oxyfuel margins, and de-icer
volume
Refining expected to benefit from
Canadian crude
Third Quarter Summary
Near-Term Outlook
Record earnings driven by record
O&P Americas results
O&P Americas re-started the La Porte
olefins plant early in the quarter and
completed the� ethylene expansion
project late in the quarter
Announced the development of two
new large growth projects
Additional Channelview expansion (adding
550MM lbs. of ethylene in 2017)
New Gulf Coast PO TBA plant (2019)
Financial strategy on track with ~12
million shares repurchased during
the quarter;� $1.6 billion in share
repurchases and dividends during
the quarter
lyondellbasell.com |
Serious News for Serious Traders! Try StreetInsider.com Premium Free!
You May Also Be Interested In
- Composition of the Nomination Committee of Orion Corporation
- Offentliggørelse af prospekt samt formue og investorer for afdelingen HP Invest Bolig i Investeringsforeningen Wealth Invest
- Medigene AG reports Financial Results and Business Update for Q1 2024
Create E-mail Alert Related Categories
SEC FilingsSign up for StreetInsider Free!
Receive full access to all new and archived articles, unlimited portfolio tracking, e-mail alerts, custom newswires and RSS feeds - and more!
