

Form 6-K CATALYST PAPER CORP For: Sep 30
 Tweet
Tweet Share
ShareFORM 6-K
SECURITIES AND EXCHANGE COMMISSION
Washington, D.C. 20549
Report of Foreign Private Issuer
Pursuant to Rule 13a-16 or 15d-16
under the Securities Exchange Act of 1934
For the month of November 2016
Commission File No. 000-49751
CATALYST PAPER CORPORATION
(Translation of registrant's name into English)
2nd Floor, 3600 Lysander Lane
Richmond
British Columbia, Canada V7B 1C3
(Address of principal executive offices)
Indicate by check mark whether the registrant files or will file annual reports under cover of Form 20-F or Form 40-F.
|
Form 20-F ☒
|
Form 40-F ☐
|
Indicate by check mark if the registrant is submitting the Form 6-K in paper as permitted by Regulation S-T Rule 101(b)(1).
|
Yes ☐
|
No ☒
|
Indicate by check mark if the registrant is submitting the Form 6-K in paper as permitted by Regulation S-T Rule 101(b)(7).
|
Yes ☐
|
No ☒
|
Indicate by check mark whether the registrant by furnishing the information contained in this Form is also thereby furnishing the information to the Commission pursuant to Rule 12g3-2(b) under the Securities Exchange Act of 1934.
|
Yes ☐
|
No ☒
|
If "Yes" is marked, indicate below the file number assigned to the registrant in connection with Rule 12g3-2(b): _________
SIGNATURES
Pursuant to the requirements of the Securities Exchange Act of 1934, the registrant has duly caused this report to be signed on its behalf by the undersigned, thereunto duly authorized.
|
|
CATALYST PAPER CORPORATION
|
|
|
|
|
|
|
|
|
Date: November 8, 2016
|
By:
|
/s/ James Isaac
|
|
|
|
|
James Isaac
Corporate Legal Counsel & Corporate Secretary
|
|
|
|
|
|
|
EXHIBIT INDEX
|
Exhibit
Number
|
|
Description of Exhibit
|
|
|
|
|
|
|
|
|
| 99.2 | MD&A and Financials | |
| 99.3 | CEO | |
| 99.4 | CFO |
 |
 |

November 8, 2016
Catalyst reports significantly improved operating results for the third quarter
Richmond, (BC) – Catalyst Paper Corporation (TSX: CYT) today reported significantly improved operating results for the quarter ended September 30, 2016 despite a non-cash impairment write-down of $186.4 million on fixed assets at our Powell River, Port Alberni and Crofton paper mills resulting in a $185.0 million net loss in the quarter. Excluding the non-cash impairment write-down and other significant items in the quarter, Catalyst reported net earnings before these items of $7.6 million. This compared to a net loss of $26.6 million and a net loss before specific items of $27.3 million in the previous quarter.
Other significant specific items in the quarter included $3.1 million in professional fees and duties related to the countervailing duty on exports to the United States of supercalendered paper and a $2.8 million foreign exchange loss on U.S. dollar denominated debt.
Adjusted Earnings Before Interest Tax Depreciation and Amortization (EBITDA) was $31.9 million and adjusted EBITDA before specific items was $35.3 million in the third quarter. This compares to adjusted EBITDA of negative $5.3 million and adjusted EBITDA before specific items of negative $1.1 million in the previous quarter.
Year-to-date adjusted EBITDA of $43.7 million was $10.1 million higher than the $33.6 million adjusted EBITDA reported in the same period last year.
In the third quarter, the company generated free cash flow of $9.8 million. The liquidity at quarter end was $77.5 million.
"We improved our operating financial performance," said Joe Nemeth, President & Chief Executive Officer. "The improvement in performance includes step change cost reduction while simultaneously growing the top line to provide Catalyst sustainable earnings levels."
Quarter Highlights
The company delivered significant third quarter savings through its Opportunities for Improvement (OFI) Program, with $63.1 million achieved year-to-date. Revitalization, cost management, product mix optimization and supply chain initiatives are key components of the OFI Program.
Maintenance spending in the quarter included a power boiler shutdown at the Rumford mill.
During the quarter, the lawsuits that were filed against Catalyst by the Halalt First Nation, as well as by Sunvault Energy Inc. and Aboriginal Power Corp., were discontinued. As a result, the company is now able to focus on improving its long-term relationship with the Halalt First Nation.
1
In recognition of the company's role in helping to establish the Great Bear Rainforest, Catalyst was one of several organizations recognized in September with a prestigious EarthCare Award, presented by the Sierra Club U.S. The EarthCare Award honours individuals or organizations that have made a unique contribution to international environmental protection and conservation.
|
SELECTED FINANCIAL INFORMATION
|
||||||||||||||||||||||||||||||||||||
| 2016 | 2015 | |||||||||||||||||||||||||||||||||||
|
(In millions of Canadian dollars, except where
|
||||||||||||||||||||||||||||||||||||
|
otherwise stated)
|
YTD
|
Q3
|
Q2
|
Q1
|
Total
|
Q4
|
Q3
|
Q2
|
Q1
|
|||||||||||||||||||||||||||
|
Sales
|
$
|
1,473.9
|
$
|
502.7
|
$
|
460.8
|
$
|
510.4
|
$
|
1,991.1
|
$
|
510.8
|
$
|
542.6
|
$
|
458.4
|
$
|
479.3
|
||||||||||||||||||
|
Operating earnings (loss)
|
(184.1
|
)
|
(168.2
|
)
|
(18.6
|
)
|
2.7
|
(12.7
|
)
|
(2.2
|
)
|
23.8
|
(34.0
|
)
|
(0.3
|
)
|
||||||||||||||||||||
|
Depreciation and amortization
|
41.4
|
13.7
|
13.3
|
14.4
|
61.4
|
17.3
|
15.0
|
14.8
|
14.3
|
|||||||||||||||||||||||||||
|
Impairment
|
186.4
|
186.4
|
-
|
-
|
-
|
-
|
-
|
-
|
-
|
|||||||||||||||||||||||||||
|
Adjusted EBITDA
|
43.7
|
31.9
|
(5.3
|
)
|
17.1
|
48.7
|
15.1
|
38.8
|
(19.2
|
)
|
14.0
|
|||||||||||||||||||||||||
|
– before specific items
|
51.9
|
35.3
|
(1.1
|
)
|
17.7
|
86.7
|
19.8
|
41.2
|
9.7
|
16.0
|
||||||||||||||||||||||||||
|
Net earnings (loss)
|
(194.7
|
)
|
(185.0
|
)
|
(26.6
|
)
|
16.9
|
(49.4
|
)
|
(26.3
|
)
|
(12.9
|
)
|
(32.4
|
)
|
22.2
|
||||||||||||||||||||
|
– before specific items
|
(24.8
|
)
|
7.6
|
(27.3
|
)
|
(5.1
|
)
|
(28.0
|
)
|
(10.0
|
)
|
8.4
|
(13.8
|
)
|
(12.6
|
)
|
||||||||||||||||||||
|
Adjusted EBITDA margin
|
3.0
|
%
|
6.3
|
%
|
(1.2
|
%)
|
3.3
|
%
|
2.4
|
%
|
3.0
|
%
|
7.2
|
%
|
(4.2
|
%)
|
2.9
|
%
|
||||||||||||||||||
|
– before specific items
|
3.5
|
%
|
7.0
|
%
|
(0.2
|
%)
|
3.5
|
%
|
4.4
|
%
|
3.9
|
%
|
7.6
|
%
|
2.1
|
%
|
3.3
|
%
|
||||||||||||||||||
|
Net earnings (loss) per share (in dollars)
|
||||||||||||||||||||||||||||||||||||
|
– basic and diluted
|
$
|
(13.43
|
)
|
$
|
(12.76
|
)
|
$
|
(1.84
|
)
|
$
|
1.17
|
$
|
(3.41
|
)
|
$
|
(1.82
|
)
|
$
|
(0.89
|
)
|
$
|
(2.23
|
)
|
$
|
1.53
|
|||||||||||
|
– before specific items
|
(1.71
|
)
|
0.52
|
(1.88
|
)
|
(0.35
|
)
|
(1.93
|
)
|
(0.69
|
)
|
0.58
|
(0.95
|
)
|
(0.87
|
)
|
||||||||||||||||||||
|
(In thousands of tonnes)
|
||||||||||||||||||||||||||||||||||||
|
Sales
|
1,611.9
|
556.7
|
512.4
|
542.8
|
2,134.3
|
541.9
|
570.8
|
511.1
|
510.5
|
|||||||||||||||||||||||||||
|
Production
|
1,613.9
|
557.2
|
523.0
|
533.7
|
2,136.8
|
545.6
|
558.2
|
494.8
|
538.2
|
|||||||||||||||||||||||||||
Market Update
Overall, market conditions continued to be challenging in the third quarter. With the exception of the demand for coated free sheet (CFS), North American demand decreased for all of our paper grades compared to the same quarter last year. Negative market conditions were addressed by optimizing product mix to increase our market share of higher margin CFS and coated one side (C1S), and reducing basis weights. C1S specialty paper volumes have increased by more than 50 per cent compared to the same period last year and are tracking well ahead of this year's projections.
We also focused on developing and commercializing new products for growth specialty markets. In September, we were pleased to announce the launch of Glide Graphics, one of the new specialty grades that we successfully commercialized in 2016. Glide Graphics was specifically developed for large-size graphic applications used in transportation, fleet and vehicle graphics, as well as commercial graphics. Glide Graphics is the first in a series of release liner base papers for North American pressure sensitive markets.
Demand for NBSK pulp was steady through the quarter, with prices continuing to trade in a narrow range.
The United States Department of Commerce recently extended its deadline by nine days to deliver the preliminary results of the expedited review of Canadian imports of supercalendered (SC) paper to the U.S. The preliminary results are now expected to be public on November 17, 2016.
2
KGI/Recapitalization Proposal Update
On October 31, 2016, Catalyst announced that securityholders of the company representing about 70% of the company's outstanding common shares and 87% of its US$260 million 11% PIK Toggle Senior Secured Notes due 2017 (the "Notes") agreed to support a proposed alternative recapitalization plan in the event that Kejriwal Group International's (KGI) acquisition of Catalyst is not completed. The recapitalization plan is designed to address the upcoming debt maturities of the company and improve its liquidity.
Key components of the alternative recapitalization plan contemplated in the Recapitalization Support Agreement include:
| · |
the conversion of the Notes, including accrued and unpaid interest until November 1, 2016, into (i) a term loan in the principal amount of US$135 million with a maturity 5 years from the issuance date, and 12% interest to be paid-in-kind during year one, with the possibility thereafter of partial payment-in-kind at the Company's option, and (ii) common shares of the Company representing 95% of the outstanding number thereof after giving effect to such conversion; and
|
| · |
the conversion to equity of the interest that is scheduled to be paid on the Notes on November 1, 2016, and the deferral of any payment of interest accruing subsequent to November 1, 2016 on the Notes until the implementation of the alternative recapitalization plan at which time such accrued interest will be added to the principal amount of the term loan.
|
The implementation of the alternative recapitalization plan would not affect any of Catalyst's contractual relationships with its trade vendors or any amounts owing to them. Catalyst intends to continue to operate its business and satisfy its obligations to its service providers, suppliers, contractors and employees in the ordinary course of business as it pursues the alternative recapitalization plan.
The completion of the alternative recapitalization plan is subject to certain conditions including the extension of the maturity of the existing credit facilities of Catalyst and the extension of waivers granted by the lenders under such credit facilities as a result of the recapitalization plan, and securityholder, regulatory, TSX and court approvals. There can be no assurance that these will be satisfied, or that this or any other proposed transaction or plan will be approved or consummated, and if so on what additional or amended terms to those described herein.
Catalyst is open to reaching agreement with a purchaser such as KGI who can contribute funds to enhance the continuing operations of Catalyst, or to restructure its capital in order to be able to move forward with its business with enhanced liquidity.
Catalyst and KGI did not enter into definitive documentation in connection with the KGI acquisition proposal by the outside date contemplated in the previously disclosed support agreement among KGI and certain company securityholders. As a result, that agreement may be terminated, although no such action has yet been taken, and discussions are continuing regarding the KGI acquisition proposal. If agreement is reached with KGI in respect of an acquisition, Catalyst may submit it concurrently with the alternative recapitalization plan to its securityholders.
Catalyst will work to finalize all necessary documentation and steps, including a plan of arrangement and related proceedings under the Canada Business Corporations Act. Additional disclosure will be provided in the management information circular that will be prepared and delivered to securityholders in connection with special meetings thereof to be called. The company will issue a news release when the record and meeting dates for such special meetings have been determined.
"Both options strengthen the company's financial position, provide Catalyst with certainty for the future, and enable the company to pursue its transformational initiatives," said Mr. Nemeth.
3
Outlook
In spite of market challenges and major maintenance spending at the Rumford mill, we expect fourth quarter results to contribute positively to full year EBITDA. Additionally, a market price increase of US$50 per short ton for supercalendered paper and US$40 per short ton for coated groundwood paper was announced effective November 1. We maintain our focus on those things within our control, including striving to deliver top quartile operational performance in the areas of safety, productivity and cost management, while growing the top line through product mix improvements and higher-value specialty paper growth.
-30-
Further Quarterly Results Materials
This release, along with the full Management Discussion & Analysis, Financial Statements and accompanying notes are available on our web site at www.catalystpaper.com/Investors. This material is also filed with SEDAR in Canada and EDGAR in the United States.
About Catalyst Paper
Catalyst Paper manufactures diverse papers such as coated freesheet, coated one side (C1S), flexible and industrial packaging, coated and uncoated groundwood, newsprint, directory, as well as market pulp. Customers include retailers, publishers, commercial printers and converters of specialty applications in North America, Latin America, the Pacific Rim and Europe. With five mills across North America, Catalyst has annual production capacity of 2.3 million tonnes. Catalyst is headquartered in Richmond, British Columbia, Canada, and has been ranked by Corporate Knights magazine for the 10th consecutive year as one of the 50 Best Corporate Citizens in Canada.
Forward-Looking Statement
Certain statements in this news release, including, without limitation, the statements describing a proposed transaction with KGI involving the securities of Catalyst, the alternative recapitalization plan and the timeline for such transactions and their impact on the Company, the expected contribution of fourth quarter results to full year EBITDA, delivery of top quartile performance and growing the top line are forward-looking statements within the meaning of Canadian and United States securities laws.
These forward-looking statements are based on certain assumptions and are subject to risks and uncertainties that may cause actual results to differ materially from those contained in these statements, including (i) that the terms relating to the potential transaction with KGI are subject to the execution of definitive agreements, and the alternative recapitalization plan and the potential transaction with KGI are subject to the agreements, consents and/or waivers of third party lenders and other stakeholders, court and regulatory approvals and other material conditions, (ii) the results of negotiations, including among Catalyst and securityholders, relating to potential transactions and the actual terms thereof, (iii) the failure to complete a definitive transaction or to satisfy any court or regulatory requirement, closing condition or consent or extension of waiver that may be required in connection with any potential transaction, and (iv) other factors beyond the control of Catalyst. Accordingly, there can be no assurance that any transaction referred to in such forward-looking statements will be entered into or completed. These factors should be considered carefully and the reader should not place undue reliance on the forward-looking statements. Certain forward-looking statements also reflect management's current views and are based on certain assumptions including, without limitation, assumptions as to future economic conditions, demand for products, levels of advertising, product pricing, ability to achieve operating and labour cost reductions, currency fluctuations, production flexibility and related courses of action, responses from applicable regulatory entities and other factors management believes are appropriate.
4
Such forward looking statements are subject to risks and uncertainties that may cause actual results to differ materially from those contained in these statements, including those risks and uncertainties identified under the heading "Risks and Uncertainties" in Catalyst's Management's Discussion and Analysis contained in Catalyst's annual report for the year ended December 31, 2015 and also the additional risks and uncertainties listed under the heading "Risks and Uncertainties" in Catalyst's Management's Discussion and Analysis for the quarter ended September 30, 2016, each available on the company's website at www.catalystpaper.com/investors and at www.sedar.com. These forward-looking statements are made as of the date of this press release and, other than as required by applicable securities laws, Catalyst does not intend to or assume any obligation to update or revise these forward-looking statements, whether as a result of new information, future events or otherwise.
For more information:
Gerrie Kotze
Vice President, Finance
(604) 247-4425
5

CATALYST PAPER CORPORATION
THIRD QUARTER INTERIM REPORT
FOR THE THREE AND NINE MONTHS ENDED
SEPTEMBER 30, 2016
KGI/Recapitalization Proposal Update
On October 31, 2016, Catalyst announced that it had entered into a support agreement with its Principal Securityholders related to the proposed alternative recapitalization plan. Key components of the plan are included in the October 31, 2016 news release, which also stated that Catalyst and Kejriwal Group International (KGI) did not enter into definitive documentation in connection with the KGI acquisition proposal by the outside date contemplated in the previously disclosed support agreement among KGI and certain company securityholders. As a result, that agreement may be terminated, although no such action has yet been taken, and discussions are continuing regarding the KGI acquisition proposal. If agreement is reached with KGI in respect of an acquisition, Catalyst may submit it concurrently with the alternative recapitalization plan to its securityholders.
We are working to finalize all necessary documentation and steps, including a plan of arrangement and related proceedings under the Canada Business Corporations Act. Additional disclosure will be provided in an upcoming management information circular. We will issue a news release when the record and meeting dates for such special meetings have been determined.
Both options strengthen the company's financial position, provide Catalyst with certainty for the future, and enable the company to pursue its transformational initiatives.
Outlook
In spite of market challenges and major maintenance spending at the Rumford mill, we expect fourth quarter results to contribute positively to full year EBITDA. Additionally, a market price increase of US$50 per short ton for supercalendered paper and US$40 per short ton for coated groundwood paper was announced effective November 1. We will maintain our focus on those things within our control, including striving to deliver top quartile operational performance in the areas of safety, productivity and cost management, while growing the top line through product mix improvements and higher-value specialty paper growth.

Joe Nemeth
President & Chief Executive Officer
2
|
MANAGEMENT'S DISCUSSION AND ANALYSIS
|
4
|
|
|
1.
|
OVERVIEW AND HIGHLIGHTS
|
7
|
|
2.
|
SEGMENTED RESULTS
|
15
|
|
3.
|
LIQUIDITY AND CAPITAL RESOURCES
|
23
|
|
4.
|
CONTINGENCIES
|
25
|
|
5.
|
SUMMARY OF QUARTERLY RESULTS
|
26
|
|
6.
|
NON-GAAP MEASURES
|
26
|
|
7.
|
CRITICAL ACCOUNTING POLICIES AND ESTIMATES
|
29
|
|
8.
|
CHANGES IN ACCOUNTING POLICIES
|
31
|
|
9.
|
IMPACT OF ACCOUNTING PRONOUNCEMENTS AFFECTING FUTURE PERIODS
|
31
|
|
10.
|
RISKS AND UNCERTAINTIES
|
31
|
|
11.
|
SENSITIVITY ANALYSIS
|
34
|
|
12.
|
OUTLOOK
|
34
|
|
13.
|
DISCLOSURE CONTROLS AND INTERNAL CONTROL OVER FINANCIAL REPORTING
|
35
|
|
CONSOLIDATED FINANCIAL STATEMENTS
|
36
|
|
3
MANAGEMENT'S DISCUSSION AND ANALYSIS
The following management's discussion and analysis (MD&A) of Catalyst Paper Corporation (the company, we, us, and our) should be read in conjunction with our unaudited interim consolidated financial statements for the three and nine month periods ended September 30, 2016 and September 30, 2015 and our audited annual consolidated financial statements for the year ended December 31, 2015 and the notes thereto, which have been prepared in accordance with generally accepted accounting principles (GAAP) in the United States (U.S.). Additional information about the company, including our most recent Annual Information Form is available on our website at www.catalystpaper.com, or the Canadian Securities Administrator's electronic filing website at www.sedar.com.
Throughout this discussion, references are made to certain measures that are not measures of performance under U.S. GAAP, including operating earnings, adjusted EBITDA, adjusted EBITDA before specific items, average delivered cash costs per tonne before specific items, net earnings (loss) before specific items, net earnings (loss) per share before specific items, free cash flow and cash flows provided (used) by operations before changes in non-cash working capital. We believe that these non-GAAP measures are useful in evaluating our performance. These non-GAAP measures are defined and reconciled to their nearest GAAP measure in section 6, Non-GAAP measures.
In this MD&A, unless otherwise indicated, all dollar amounts are expressed in Canadian dollars. The term "dollars" and the symbols "$" and "CDN$" refer to Canadian dollars and the term "U.S. dollars" and the symbol "US$" refer to United States dollars.
In this MD&A, the term "tonne" and the symbol "MT" refer to a metric tonne and the term "ton" or the symbol "ST" refer to a short ton, a measure of weight equal to 0.9072 metric tonne. Use of these symbols is in accordance with industry practice.
The information in this report is as of November 8, 2016 which is the date of filing in conjunction with our press release announcing our results for the third quarter of 2016. Disclosure contained in this document is current to November 8, 2016 unless otherwise stated.
4
CAUTIONARY STATEMENT REGARDING FORWARD-LOOKING STATEMENTS
Certain statements and information in this MD&A are not based on historical facts and constitute forward-looking statements or forward-looking information within the meaning of Canadian securities laws and the U.S. Private Securities Litigation Reform Act of 1995 (forward-looking statements), including but not limited to, statements about our strategy, plans, future operating performance, contingent liabilities and outlook.
Forward-looking statements:
| · |
Are statements that address or discuss activities, events or developments that we expect or anticipate may occur in the future;
|
| · |
Can be identified by the use of words such as "believe", "expect", "anticipate", "intend", "plan", "likely", "predicts", "estimates", "forecasts", and similar words or phrases or the negative of such words or phrases;
|
| · |
Reflect our current beliefs, intentions or expectations based on certain assumptions and estimates, including those identified below, which could prove to be significantly incorrect:
|
| – |
Our ability to develop, manufacture and sell new products and services that meet the needs of our customers and gain commercial acceptance;
|
| – |
Our ability to continue to sell our products and services in the expected quantities at the expected prices and expected times;
|
| – |
Our ability to successfully obtain cost savings from our cost reduction initiatives;
|
| – |
Our ability to implement business strategies and pursue opportunities;
|
| – |
Expected cost of goods sold;
|
| – |
Expected component supply costs and constraints;
|
| – |
Expected foreign exchange and tax rates.
|
| · |
While considered reasonable by management, are inherently subject to known and unknown risks and uncertainties and other factors that could cause actual results or events to differ from historical or anticipated results or events. These risk factors and others are discussed in the MD&A. Certain of these risks are:
|
| – |
The impact of general economic conditions in the countries in which we do business;
|
| – |
Conditions in the capital markets and our ability to obtain financing and refinance existing debt;
|
| – |
Market conditions and demand for our products (including declines in advertising and circulation);
|
| – |
The implementation of trade restrictions in jurisdictions where our products are marketed;
|
| – |
Fluctuations in foreign exchange or interest rates;
|
| – |
Raw material prices (including wood fibre, chemicals and energy);
|
| – |
The effect of, or change in, environmental and other governmental regulations;
|
| – |
Uncertainty relating to labour relations;
|
| – |
The availability of qualified personnel;
|
| – |
Legal proceedings;
|
| – |
The effects of competition from domestic and foreign producers;
|
| – |
The risk of natural disaster and other factors many of which are beyond our control.
|
As a result, no assurance can be given that any of the events or results anticipated by such forward-looking statements will occur or, if they do occur, what benefit they will have on our operations or financial condition. Readers are cautioned not to place undue reliance on these forward-looking statements. These forward-looking statements are made as of the date of this MD&A. We disclaim any intention or obligation to update or revise any forward-looking statements, whether as a result of new information, future events or otherwise, except as required by law.
5
Forward-looking statements also include, without limitation, the statements describing a proposed transaction with KGI involving the securities of Catalyst, the alternative recapitalization plan and the timeline for such transactions and their impact on the company.
These forward-looking statements are based on certain assumptions and are subject to risks and uncertainties that may cause actual results to differ materially from those contained in these statements, including (i) that the terms relating to the potential transaction with KGI are subject to the execution of definitive agreements, and the alternative recapitalization plan and the potential transaction with KGI are subject to the agreements, consents and waivers of third party lenders and other stakeholders, court and regulatory approvals and other material conditions, (ii) the results of negotiations, including among Catalyst and securityholders, relating to potential transactions and the actual terms thereof, (iii) the failure to complete a definitive transaction or to satisfy any court or regulatory requirement, closing condition or consent or extension of waiver that may be required in connection with any potential transaction, and (iv) other factors beyond the control of Catalyst. Accordingly, there can be no assurance that any transaction referred to in such forward-looking statements will be entered into or completed. These factors should be considered carefully and the reader should not place undue reliance on the forward-looking statements. These forward-looking statements are made as of the date of this press release and, other than as required by applicable securities laws, Catalyst does not intend to or assume any obligation to update or revise these forward-looking statements, whether as a result of new information, future events or otherwise.
6
| 1. |
OVERVIEW AND HIGHLIGHTS
|
BUSINESS OVERVIEW
We are the largest producer of mechanical printing papers in western North America and the largest producer of coated groundwood paper in North America. Our business is comprised of four business segments: coated paper, uncoated paper, newsprint, and pulp. Coated paper includes coated freesheet (CFS), coated groundwood (CGW), and coated one-sided specialty (C1S) paper. Uncoated paper includes uncoated mechanical (UM), directory paper and uncoated free sheet (UFS). We are the only producer of CGW paper and soft calender (SC) paper in western North America. We operate three paper mills in British Columbia (B.C.) in Crofton, Port Alberni, and Powell River and two paper mills in the U.S. in Rumford, Maine and Biron, Wisconsin.
Our Crofton and Rumford mills each include two-line kraft pulp operations. Our Crofton mill produces kraft pulp primarily to market and sell into the Asian market, while our Rumford mill produces kraft pulp primarily as furnish used to manufacture the mill's coated paper products.
More information about our business segments, product profile and our geographic sales distribution is provided on pages 7 to 9 of our 2015 Annual Report. Our production capacity by mill and product line is summarized in the following table:
|
Coated Paper 1
|
Uncoated Paper 1
|
Newsprint 1
|
Market
Pulp |
Total
|
|||||||||||
|
Mill Location
|
Number Of Paper Machines
|
CFS
|
CGW
|
C1S
|
UM
|
UFS
|
Directory
|
Newsprint
|
Market
Pulp |
||||||
|
Crofton, B.C. 4
|
2
|
–
|
–
|
–
|
–
|
–
|
–
|
350,000
|
377,000 2
|
727,000
|
|||||
|
Port Alberni, B.C.
|
2
|
–
|
224,000
|
–
|
–
|
–
|
116,000
|
–
|
–
|
340,000
|
|||||
|
Powell River, B.C. 5
|
2
|
–
|
–
|
–
|
350,000
|
–
|
–
|
–
|
–
|
350,000
|
|||||
|
Rumford, ME 6
|
3
|
213,000
|
176,000
|
70,000
|
–
|
15,000
|
–
|
–
|
93,000 3
|
567,000
|
|||||
|
Biron, WI
|
2
|
–
|
335,000
|
–
|
–
|
–
|
–
|
–
|
–
|
335,000
|
|||||
|
Total capacity (tonnes)
|
11
|
213,000
|
735,000
|
70,000
|
350,000
|
15,000
|
116,000
|
350,000
|
470,000
|
2,319,000
|
|||||
|
% of total capacity
|
9%
|
32%
|
3%
|
15%
|
1%
|
5%
|
15%
|
20%
|
100%
|
||||||
| 1 |
Capacities expressed in the above tables can vary as we are able to switch production between products, particularly CGW, CFS, C1S and machine-finished uncoated grades.
|
| 2 |
Total pulp capacity at Crofton is 407,000 tonnes, of which 377,000 tonnes are designated as market pulp with the remaining 30,000 tonnes being consumed internally.
|
| 3 |
Total pulp capacity at Rumford is 485,000 tonnes, of which 93,000 tonnes are designated as market pulp with the remaining 392,000 tonnes being consumed internally.
|
| 4 |
No. 1 paper machine at Crofton remains indefinitely curtailed since 2010.
|
| 5 |
No. 9 paper machine at Powell River remains indefinitely curtailed since 2014.
|
| 6 |
No. 12 paper machine at Rumford resumed production in the quarter on an intermittent basis after being indefinitely curtailed on September 1, 2015.
|
THIRD QUARTER OVERVIEW
BUSINESS OVERVIEW
We achieved strong operating results for the third quarter reflecting improved productivity and good cost control across our operations, reduced maintenance costs and strong seasonal sales. Maintenance spending was low as there were no major maintenance outages in the quarter.
We continued our focus on cost reduction through revitalization of our five mills. For the nine months ended September 30, 2016, we have realized savings of $63.1 million under our Opportunities for Improvement (OFI) program which includes mill revitalization, product mix optimization and supply chain initiatives.
Our results were favourably impacted by a fair value adjustment to our phantom share unit (PSU) plan for key executives, directors and employees due primarily to the significant change in our common share price in the quarter, resulting in the recognition of a recovery of $2.5 million non-cash adjustment in selling, general and administrative expense in the quarter.
We recognized a non-cash impairment write-down of $186.4 million on fixed assets at our Powell River, Port Alberni and Crofton paper mills in the quarter.
7
FINANCIAL PERFORMANCE
We recorded net loss of $185.0 million and net earnings before specific items of $7.6 million in Q3. This compared to a net loss of $26.6 million and a net loss before specific items of $27.3 million, respectively, in Q2. Significant specific items in Q3 included a non-cash impairment charge on fixed assets, professional fees and duties related to a countervailing action filed against the company, and a foreign exchange loss on the translation of U.S. dollar denominated debt. Significant specific items in the prior quarter included the cost and production impact of a waterline breach at our Crofton mill (net of insurance recovery), professional fees and duties related to a countervailing action filed against the company, a net settlement gain related to the negotiated settlement with Verso Corporation and a foreign exchange loss on the translation of U.S. dollar denominated debt.
Adjusted EBITDA was $31.9 million and adjusted EBITDA before specific items was $35.3 million in Q3 compared to adjusted EBITDA of negative $5.3 million and adjusted EBITDA before specific items of negative $1.1 million in Q2. For YTD 2016, adjusted EBITDA was $43.7 million compared to $33.6 million for the prior year. Refer to section 6, Non-GAAP measures, for additional information on specific items in the reported financial results.
SELECTED FINANCIAL INFORMATION
|
(In millions of Canadian dollars, except where
|
2016
|
2015
|
||||||||
|
otherwise stated)
|
YTD
|
Q3
|
Q2
|
Q1
|
Total
|
Q4
|
Q3
|
Q2
|
Q1
|
|
|
Sales
|
$1,473.9
|
$ 502.7
|
$ 460.8
|
$ 510.4
|
$ 1,991.1
|
$ 510.8
|
$ 542.6
|
$ 458.4
|
$ 479.3
|
|
|
Operating earnings (loss)
|
(184.1)
|
(168.2)
|
(18.6)
|
2.7
|
(12.7)
|
(2.2)
|
23.8
|
(34.0)
|
(0.3)
|
|
|
Depreciation and amortization
|
41.4
|
13.7
|
13.3
|
14.4
|
61.4
|
17.3
|
15.0
|
14.8
|
14.3
|
|
|
Impairment
|
186.4
|
186.4
|
-
|
-
|
-
|
-
|
-
|
-
|
-
|
|
|
Adjusted EBITDA 1
|
43.7
|
31.9
|
(5.3)
|
17.1
|
48.7
|
15.1
|
38.8
|
(19.2)
|
14.0
|
|
|
– before specific items 1
|
51.9
|
35.3
|
(1.1)
|
17.7
|
86.7
|
19.8
|
41.2
|
9.7
|
16.0
|
|
|
Net earnings (loss)
|
(194.7)
|
(185.0)
|
(26.6)
|
16.9
|
(49.4)
|
(26.3)
|
(12.9)
|
(32.4)
|
22.2
|
|
|
– before specific items 1
|
(24.8)
|
7.6
|
(27.3)
|
(5.1)
|
(28.0)
|
(10.0)
|
8.4
|
(13.8)
|
(12.6)
|
|
|
Adjusted EBITDA margin 1
|
3.0%
|
6.3%
|
(1.2%)
|
3.3%
|
2.4%
|
3.0%
|
7.2%
|
(4.2%)
|
2.9%
|
|
|
– before specific items 1
|
3.5%
|
7.0%
|
(0.2%)
|
3.5%
|
4.4%
|
3.9%
|
7.6%
|
2.1%
|
3.3%
|
|
|
Net earnings (loss) per share (in dollars)
|
||||||||||
|
– basic and diluted
|
$ (13.43)
|
$(12.76)
|
$ (1.84)
|
$ 1.17
|
$ (3.41)
|
$ (1.82)
|
$ (0.89)
|
$ (2.23)
|
$ 1.53
|
|
|
– before specific items 1
|
(1.71)
|
0.52
|
(1.88)
|
(0.35)
|
(1.93)
|
(0.69)
|
0.58
|
(0.95)
|
(0.87)
|
|
|
(In thousands of tonnes)
|
||||||||||
|
Sales
|
1,611.9
|
556.7
|
512.4
|
542.8
|
2,134.3
|
541.9
|
570.8
|
511.1
|
510.5
|
|
|
Production
|
1,613.9
|
557.2
|
523.0
|
533.7
|
2,136.8
|
545.6
|
558.2
|
494.8
|
538.2
|
|
| 1 |
Refer to section 6, Non-GAAP measures.
|
8
MARKET OVERVIEW

| * |
Uncoated mechanical is comprised of high-gloss and standard grades.
|
Overall, market conditions remained challenging in the third quarter of 2016. North American demand decreased for all of our paper grades except CFS from the third quarter of 2015. Operating rates were negatively impacted by an increase in imports in the quarter. Average benchmark prices for coated and uncoated paper were lower compared to the second quarter, while newsprint pricing increased.
Global NBSK demand increased by 0.8% compared to the third quarter of 2015. The average NBSK benchmark pulp price for China decreased 3.6% to US$595 per tonne compared to the prior quarter.
Alternative Recapitalization Plan
On October 31, 2016, the company announced that it has entered into a support agreement (Recapitalization Support Agreement) with securityholders (the Supporting Parties) representing about 70% of the company's outstanding common shares (Common Shares) and 87% of its PIK Toggle Senior Secured Notes due on October 30, 2017 (Senior Secured Notes) in respect of an alternative recapitalization plan (Alternative Recapitalization).
Key components of the Alternative Recapitalization contemplated in the Recapitalization Support Agreement include:
| · |
the conversion of the Senior Secured Notes, including accrued and unpaid interest until November 1, 2016, into (i) a term loan in the principal amount of US$135 million with a maturity 5 years from the issuance date, and 12% interest to be paid in payment-in-kind during year one, with the possibility thereafter of partial payment-in-kind at the company's option, and (ii) common shares of the company representing 95% of the outstanding number thereof after giving effect to such conversion (New Common Shares); and
|
| · |
the conversion to equity of the interest that was scheduled to be paid on the Senior Secured Notes on November 1, 2016, and the deferral of any payment of interest accruing subsequent to November 1, 2016 on the Senior Secured Notes until the implementation of the Alternative Recapitalization at which time such accrued interest will be added to the principal amount of the term loan.
|
9
The completion of the Alternative Recapitalization is subject to certain conditions including the extension of the maturity of the existing credit facilities of Catalyst and the extension of waivers granted by the lenders under such credit facilities as a result of the recapitalization plan, and securityholder, regulatory, TSX and court approvals. There can be no assurance that these conditions will be satisfied, or that this or any other proposed transaction or plan will be approved or consummated, and if so on what additional or amended terms to those described herein. Discussions are ongoing to seek the support of the Alternative Recapitalization by additional securityholders representing approximately 10% of the outstanding Common Shares.
The implementation of the Alternative Recapitalization would not affect any of the company's contractual relationships with its trade vendors or any amounts owing to them. The company intends to continue to operate its business and satisfy its obligations to its service providers, suppliers, contractors and employees in the ordinary course of business as it pursues the Alternative Recapitalization.
The parties to the Recapitalization Support Agreement have also agreed to cooperate in structuring and negotiating an additional component of the Alternative Recapitalization under which Common Shares not held by the securityholder parties thereto would be exchanged for cash consideration, subject to certain conditions, including so as to permit the company to cease to be a reporting issuer under applicable securities laws. The completion of any such additional component would not be a condition to the implementation of the Alternative Recapitalization. There can be no assurance that such a transaction will be proposed and if so at what price.
On October 31, 2016, the company filed a petition with the Supreme Court of British Columbia seeking the issuance of various orders in order to facilitate the implementation of a recapitalization transaction, including the deferral of the November 1, 2016 interest payment on the Senior Secured Notes, and to preserve the status quo for the duration of the recapitalization process, all through a plan of arrangement providing for the Alternative Recapitalization Plan in accordance with the Canada Business Corporations Act. On October 31, 2016, the company also obtained waivers from its lenders in respect of defaults that would have occurred as a result the filing of such petition and related proceedings, and as a result of the deferral of the payment of interest that was due on November 1, 2016 to holders of Senior Secured Notes. The waivers are in force until November 30, 2016, unless further extended by the lenders as part of negotiations related to the extension of the maturity of the credit facilities in connection with the alternative recapitalization process.
If implemented, the Alternative Recapitalization will improve its financial position and alleviate substantial doubt about the company's ability to continue as a going concern.
The company is open to reaching agreement with a purchaser such as KGI who can contribute funds to enhance the continuing operations of the company, or to restructure its capital in order to be able to move forward with its business with enhanced liquidity. If an agreement is reached with KGI in respect of the acquisition of Catalyst by KGI, the company may submit it concurrently with the Alternative Recapitalization to its securityholders.
Please see section "Cautionary Statement Regarding Forward-Looking Statements" for additional information on the assumptions and the risk and uncertainties related to the Alternative Recapitalization Plan.
KGI Transaction
On May 23, 2016, the company's Board of directors received a copy of an expression of intent among KGI and the company's four largest shareholders holding or controlling approximately 79% of its outstanding common shares, that include Mudrick Capital Management, L.P., Cyrus Capital Partners, L.P., Oaktree Capital Management, L.P. and Stonehill Capital Management LLC (Principal Securityholders) in respect of a potential acquisition of the company by KGI (KGI Transaction).
On June 30, 2016, the company's Board of directors was advised that the Principal Securityholders entered into a support agreement with KGI (Support Agreement). The company is not a party to the support agreement, nor has it been a party to the discussions that led to it.
Pursuant to the support agreement, the Principal Securityholders have committed to support and vote in favour of the KGI Transaction, which would be implemented by way of a plan of arrangement under the Canada Business Corporations Act, the terms of which would include:
| · |
Common shares held by minority shareholders would be acquired by KGI;
|
10
STRATEGY UPDATE
Our objective is to return to profitability and maximize cash flows by focusing on reducing manufacturing costs and optimizing our brands and customer base. Additional information related to our corporate strategy, including key performance drivers and indicators, can be found on pages 14 to 21 of our 2015 Annual Report.
2016 Key Objectives
The following is an update on our third quarter progress towards our 2016 key objectives:
Social:
| · |
Safety: reduce medical incident rate by a minimum of 20% compared to the prior year
|
| – |
We took a step back on safety performance in the quarter with LTI of 1.29 (1.24 prior year average) and MIR of 3.06 (2.52 prior year average).
|
| – |
Year-to-date, our LTI of 0.92 and MIR of 2.41 continue to track lower than the prior year.
|
| · |
Improve employee performance through adoption of incentive pay plans for both hourly and salaried employees that are aligned to company objectives
|
| – |
The salaried incentive plan objectives and measures are aligned to the company objectives and are updated annually.
|
| · |
Implement a new performance management system for salaried employees
|
| – |
The company implemented role-based competencies aligned to Catalyst's Operating Philosophy as part of its new performance management system for salaried employees.
|
| · |
Design and implement a new operator technical training program to support learning and higher productivity
|
| – |
The HR team developed a high-level implementation plan to revitalize operator technical training following the completion of a learning system gap analysis and the identification of a system/content vendor. The plan includes an estimate of key deliverables, resources required, anticipated costs and an implementation timeframe.
|
| · |
Utilize change management techniques and enhanced internal communications to increase employee awareness, alignment and move further forward to a culture of ownership and accountability
|
| – |
In Q3, Catalyst trained senior HR and Safety leaders in the company's adopted change management protocol which is designed to speed up and improve the adoption of change. Projects and process changes throughout the company have been identified as suitable opportunities.
|
Financial:
| · |
Deliver positive free cash flow results by increasing operating earnings, reducing overhead costs, and further optimizing our capital structure
|
| – |
Adjusted EBITDA was $31.9 million and liquidity increased by $3.0 million in the quarter to $77.5 million as of September 30, 2016.
|
| – |
Free cash flow of $9.8 million reflected our strong EBITDA performance and relatively low capital spending, partially offset by higher cash contributions to employee future benefits in the quarter.
|
| – |
The higher contributions to employee future benefits reflected a top-up on our US defined benefit pension plan that covers certain hourly employees. This increase raised our contribution for the year to the required annual contribution level.
|
| – |
Capital expenditures in the current quarter of $3.1 million were primarily invested in maintenance of business and profit adding assets.
|
| – |
We increased our maximum borrowing base under our ABL Facility by $25.0 million to $250.0 million.
|
| · |
Increase the value of benefits realized under the company's OFI program from the prior year
|
| – |
We've realized $63.1 million in savings under our OFI program for the year to September 30, 2016.
|
| – |
These savings include mill revitalization, product mix optimization and supply chain initiatives.
|
| · |
Improve cost competitiveness and productivity through revitalization of our five mills
|
| – |
We have realized over $60.0 million in year-to-date savings under our revitalization program.
|
| – |
We are tracking ahead of schedule realizing identified savings at our U.S. paper mills, and are driving additional savings at our Canadian mills and corporate functions.
|
12
| · |
Implement the Alternative Recapitalization Plan
|
| – |
Our Term Loan and ABL Facility are due on July 31, 2017, and our Senior Secured Notes are due on October 30, 2017, unless previously refinanced.
|
| – |
The Alternative Recapitalization would reduce the indebtedness of the company under the Senior Secured Notes and improve its liquidity. The Alternative Recapitalization Plan is conditional upon the extension of the maturity of the Term Loan and ABL Facility.
|
Commercial:
| · |
Optimize our product mix by increasing our market share of higher-margin coated freesheet and coated one-sided specialty paper, and reducing the basis weight of our other paper grades
|
| – |
We continue to achieve strong sales mix in our CFS and C1S product lines.
|
| – |
Third quarter sales were 14% higher for CFS and on track for 64% increase for C1S year-over year.
|
| – |
Sales of UFS, our newest product line, are on track for continued growth.
|
| · |
Expand our product offering through new product development by commercializing and growing market share in a variety of specialty paper products
|
| – |
In September 2016, Catalyst officially launched its new Glide Graphics release liner product family at the Labelexpo Americas conference in Rosemont, Illinois.
|
| – |
FDA compliance achieved for the paper machine no. 10 and no. 11 assets at our Powell River mill, further enhancing our capabilities to participate in food markets.
|
| – |
Working with key customers, we are actively developing unique product solutions for numerous specialty applications.
|
Environmental/ Corporate Social Responsibility:
| · |
Work with community stakeholders to identify and implement strategic initiatives that mutually benefit our mills and the communities they operate in
|
| – |
We worked proactively with community stakeholders to address the ongoing drought conditions in the Cowichan Valley. This involved the installation of 20 pumps to move water from Lake Cowichan into the Cowichan River to maintain a minimal flow rate. Seasonal rains returned in time to recharge Lake Cowichan so that pumps were ultimately not required.
|
| – |
Projects continuing at most mills which will improve their emissions profile.
|
| · |
Develop and implement a Corporate Social Responsibility (CSR) strategy
|
| – |
Strategy is now completed and implementation is underway to be finished by Q4 2016.
|
| – |
Catalyst was named one of Canada's top 50 best corporate citizens by Corporate Knights for the 10th consecutive year.
|
| · |
Strengthen Catalyst's standing with mill communities and with First Nations
|
| – |
A First Nations strategy was developed and is now being implemented.
|
| · |
Adhere to high international standards for transparency and reporting of performance on social, governance and environmental factors
|
| – |
Released 2015 Sustainability Reporting using improved metrics for fibre and self-generated electricity.
|
| – |
Completed data sharing on Environmental Paper Assessment Tool with GreenBlue.
|
| – |
Completed data sharing on Carbon Disclosure Project relating to carbon, water and forest fibre use.
|
CONSOLIDATED RESULTS OF OPERATIONS
SALES
Q3 2016 vs. Q2 2016
Sales revenues increased by 9.1% reflecting higher sales volumes due to seasonality and improved production, the positive impact of a weaker Canadian dollar, and higher average transaction prices for pulp, newsprint, directory and CFS, partially offset by lower average transaction prices for UM and CGW.
Q3 2016 vs. Q3 2015
Sales revenues decreased by 7.3% reflecting lower sales volumes, lower average transaction prices for all paper and pulp grades except newsprint and the negative impact of a stronger Canadian dollar.
13
2016 YTD vs. 2015 YTD
Sales revenues remained flat due to lower average transaction prices for paper and pulp and reduced sales volumes for uncoated paper, newsprint and pulp, partially offset by the positive impact of a weaker Canadian dollar and higher sales volumes for coated paper. The increase in coated paper sales reflects the impact of market curtailment taken in 2015.
ADJUSTED EBITDA
The following table provides variances between periods for adjusted EBITDA:
|
ADJUSTED EBITDA
|
||||||||||||
|
(In millions of Canadian dollars)
|
Q2 2016
|
Q3 2015
|
2015 YTD
|
|||||||||
|
Adjusted EBITDA in comparative period 1
|
$
|
(5.3
|
)
|
$
|
38.8
|
$
|
33.6
|
|||||
|
Paper prices
|
(1.6
|
)
|
(23.7
|
)
|
(67.9
|
)
|
||||||
|
Pulp prices
|
1.3
|
(6.4
|
)
|
(31.0
|
)
|
|||||||
|
Impact of Canadian dollar
|
2.4
|
(2.1
|
)
|
23.9
|
||||||||
|
Volume and mix
|
10.7
|
0.8
|
6.0
|
|||||||||
|
Distribution costs
|
0.6
|
3.6
|
14.0
|
|||||||||
|
Furnish and other conversion costs
|
4.5
|
9.9
|
32.1
|
|||||||||
|
Power and fuel costs
|
0.2
|
7.2
|
19.1
|
|||||||||
|
Labour costs
|
3.9
|
2.3
|
5.8
|
|||||||||
|
Maintenance costs
|
12.0
|
(4.1
|
)
|
4.2
|
||||||||
|
Selling, general and administrative
|
4.6
|
0.8
|
(1.7
|
)
|
||||||||
|
Lower of cost or market impact on inventory, net of inventory change
|
(1.0
|
)
|
(2.0
|
)
|
(1.5
|
)
|
||||||
|
Power generation
|
1.4
|
1.3
|
3.6
|
|||||||||
|
Other, net
|
(1.8
|
)
|
5.5
|
3.5
|
||||||||
|
Adjusted EBITDA in Q3 and YTD 2016 1
|
$
|
31.9
|
$
|
31.9
|
$
|
43.7
|
||||||
| 1 |
Refer to section 6, Non-GAAP measures.
|
OPERATING EARNINGS (LOSS)
Q3 2016 vs. Q2 2016
Operating earnings decreased by $149.6 million primarily due to an impairment charge of $186.4 million and higher depreciation and amortization expense of $0.4 million, partially offset by higher adjusted EBITDA of $37.2 million.
Q3 2016 vs. Q3 2015
Operating earnings decreased by $192.0 million primarily due to an impairment charge of $186.4 million and lower adjusted EBITDA of $6.9 million, partially offset by lower depreciation and amortization expense of $1.3 million.
2016 YTD vs. 2015 YTD
Operating earnings decreased by $173.6 million primarily due to an impairment charge of $186.4 million, partially offset by higher adjusted EBITDA of $10.1 million and lower depreciation and amortization expense of $2.7 million.
NET EARNINGS (LOSS)
Q3 2016 vs. Q2 2016
Net earnings decreased by $158.4 million primarily due to lower after-tax operating earnings of $149.6 million, lower other income after tax of $5.7 million and a $2.2 million higher after-tax foreign exchange loss on the translation of U.S. dollar denominated debt.
14
Q3 2016 vs. Q3 2015
Net earnings decreased by $172.1 million primarily due to lower after-tax operating earnings of $192.0 million, partially offset by $21.2 million lower after-tax foreign exchange loss on the translation of U.S. dollar denominated debt.
2016 YTD vs. 2015 YTD
Net earnings decreased by $171.6 million primarily due to lower after-tax operating earnings of $173.6 million, an impairment charge of $186.4 million, prior year adjustments for an after-tax bargain purchase gain of $43.9 million related to the acquisition of the U.S. paper mills and an income tax recovery of $28.8 million, partially offset by an after-tax settlement gain related to a negotiated settlement with Verso Corporation in Q2 2016 of $5.5 million, and an after-tax foreign exchange gain on the translation of U.S. dollar denominated debt of $19.2 million compared to an after-tax loss of $46.1 million in the prior year.
| 2. |
SEGMENTED RESULTS
|
|
COATED PAPER
|
||||||||||||||||||||||||
|
Three months
|
Nine months
|
|||||||||||||||||||||||
|
(In millions of Canadian dollars, except
|
ended September 30,
|
ended September 30,
|
||||||||||||||||||||||
|
where otherwise stated)
|
2016
|
2015
|
Change
|
2016
|
2015
|
Change
|
||||||||||||||||||
|
Sales
|
$
|
273.8
|
$
|
287.9
|
$
|
(14.1
|
)
|
$
|
798.5
|
$
|
760.6
|
$
|
37.9
|
|||||||||||
|
Operating earnings (loss)
|
(46.3
|
)
|
9.1
|
(55.4
|
)
|
(34.9
|
)
|
(27.0
|
)
|
(7.9
|
)
|
|||||||||||||
|
Depreciation and amortization
|
4.7
|
6.0
|
(1.3
|
)
|
14.5
|
17.3
|
(2.8
|
)
|
||||||||||||||||
|
Impairment
|
55.2
|
-
|
55.2
|
55.2
|
-
|
55.2
|
||||||||||||||||||
|
Adjusted EBITDA 1
|
13.6
|
15.1
|
(1.5
|
)
|
34.7
|
(9.7
|
)
|
44.4
|
||||||||||||||||
|
– before specific items 1
|
13.6
|
15.1
|
(1.5
|
)
|
34.7
|
11.3
|
23.4
|
|||||||||||||||||
|
Adjusted EBITDA margin 1
|
5.0
|
%
|
5.2
|
%
|
(0.2
|
%)
|
4.3
|
%
|
(1.3
|
%)
|
5.6
|
%
|
||||||||||||
|
– before specific items 1
|
5.0
|
%
|
5.2
|
%
|
(0.2
|
%)
|
4.3
|
%
|
1.5
|
%
|
2.8
|
%
|
||||||||||||
|
(In thousands of tonnes)
|
||||||||||||||||||||||||
|
Sales
|
258.4
|
253.6
|
4.8
|
738.1
|
696.4
|
41.7
|
||||||||||||||||||
|
Production
|
248.4
|
205.1
|
43.3
|
732.8
|
702.8
|
30.0
|
||||||||||||||||||
| 1 |
Refer to section 6, Non-GAAP measures.
|

15
SEGMENT OVERVIEW
North American demand for CGW decreased by 5.9% while CFS demand increased by 4.2% from the third quarter of 2015. Demand continued to be impacted by reduced advertising pages in magazines and a decrease in catalogues being mailed out. Operating rates were negatively impacted in the third quarter by a sharp increase in imports. Average benchmark prices for coated no. 5 declined by 3.9% to US$740 per short ton, and for coated no. 3 declined by 2.3% to US$855 per short ton compared to the previous quarter. A US$40 per short ton price increase was announced for CGW no. 4 and no. 5 paper, effective November 1, 2016.
OPERATIONAL PERFORMANCE
The following chart summarizes the operating performance of our coated paper segment:

| * |
Average delivered cash costs per tonne consist of cost of sales, excluding depreciation and amortization, and including the impact of SG&A and restructuring costs.
|
Q3 2016 vs. Q3 2015
| · |
Sales volume increased by 4,800 tonnes due to higher production in the quarter.
|
| · |
Average sales revenue decreased by $75 per tonne due to lower average transaction prices and the negative impact of a stronger Canadian dollar.
|
| · |
Average delivered cash costs decreased by $69 per tonne due to lower kraft pulp, fibre, steam fuel, coating and labour costs, partially offset by higher chemical costs. Manufacturing costs of the U.S. paper mills continue to be reduced by savings under our revitalization program.
|
2016 YTD vs. 2015 YTD
| · |
Sales volume increased by 41,700 tonnes primarily due to the impact of market curtailment in Q2 2015 and the inclusion for the U.S. paper mills of sales in 2015 only from the date of acquisition of January 7, 2015.
|
| · |
Average sales revenue decreased by $10 per tonne due to lower average transaction prices, partially offset by the positive impact of a weaker Canadian dollar.
|
| · |
Average delivered cash costs decreased by $71 per tonne due to lower kraft pulp, steam fuel, electric power, maintenance and labour costs, partially offset by higher chemical costs.
|
16
|
UNCOATED PAPER
|
||||||||||||||||||||||||
|
Three months
|
Nine months
|
|||||||||||||||||||||||
|
(In millions of Canadian dollars, except
|
ended September 30,
|
ended September 30,
|
||||||||||||||||||||||
|
where otherwise stated)
|
2016
|
2015
|
Change
|
2016
|
2015
|
Change
|
||||||||||||||||||
|
Sales
|
$
|
88.9
|
$
|
95.2
|
$
|
(6.3
|
)
|
$
|
267.5
|
$
|
285.0
|
$
|
(17.5
|
)
|
||||||||||
|
Operating loss
|
(83.8
|
)
|
-
|
(83.8
|
)
|
(97.5
|
)
|
(8.0
|
)
|
(89.5
|
)
|
|||||||||||||
|
Depreciation and amortization
|
6.0
|
6.3
|
(0.3
|
)
|
18.1
|
18.8
|
(0.7
|
)
|
||||||||||||||||
|
Impairment
|
81.2
|
-
|
81.2
|
81.2
|
-
|
81.2
|
||||||||||||||||||
|
Adjusted EBITDA 1
|
3.4
|
6.3
|
(2.9
|
)
|
1.7
|
10.8
|
(9.1
|
)
|
||||||||||||||||
|
– before specific items 1
|
6.5
|
8.7
|
(2.2
|
)
|
10.3
|
18.7
|
(8.4
|
)
|
||||||||||||||||
|
Adjusted EBITDA margin 1
|
3.8
|
%
|
6.6
|
%
|
(2.8
|
%)
|
0.6
|
%
|
3.8
|
%
|
(3.2
|
%)
|
||||||||||||
|
– before specific items 1
|
7.3
|
%
|
9.1
|
%
|
(1.8
|
%)
|
3.9
|
%
|
6.6
|
%
|
(2.7
|
%)
|
||||||||||||
|
(In thousands of tonnes)
|
||||||||||||||||||||||||
|
Sales
|
106.4
|
104.9
|
1.5
|
312.6
|
316.3
|
(3.7
|
)
|
|||||||||||||||||
|
Production
|
111.7
|
104.2
|
7.5
|
323.3
|
308.6
|
14.7
|
||||||||||||||||||
| 1 |
Refer to section 6, Non-GAAP measures.
|

SEGMENT OVERVIEW
North American demand for UM paper decreased by 8.8% compared to the third quarter of 2015. UM paper demand continues to be negatively impacted by reduced advertising and page count in the retail sector. The average benchmark prices for soft-calendered A grade (SC-A) declined by 3.4% to US$720 per short ton compared to the previous quarter. A US$50 per short ton price increase was announced for SC paper, effective November 1, 2016. North American directory demand decreased by 15.5% in Q3. Effective February 1, 2016, RISI discontinued reporting an average benchmark price for directory paper.
17
OPERATIONAL PERFORMANCE
The following chart summarizes the operating performance of our uncoated paper segment:
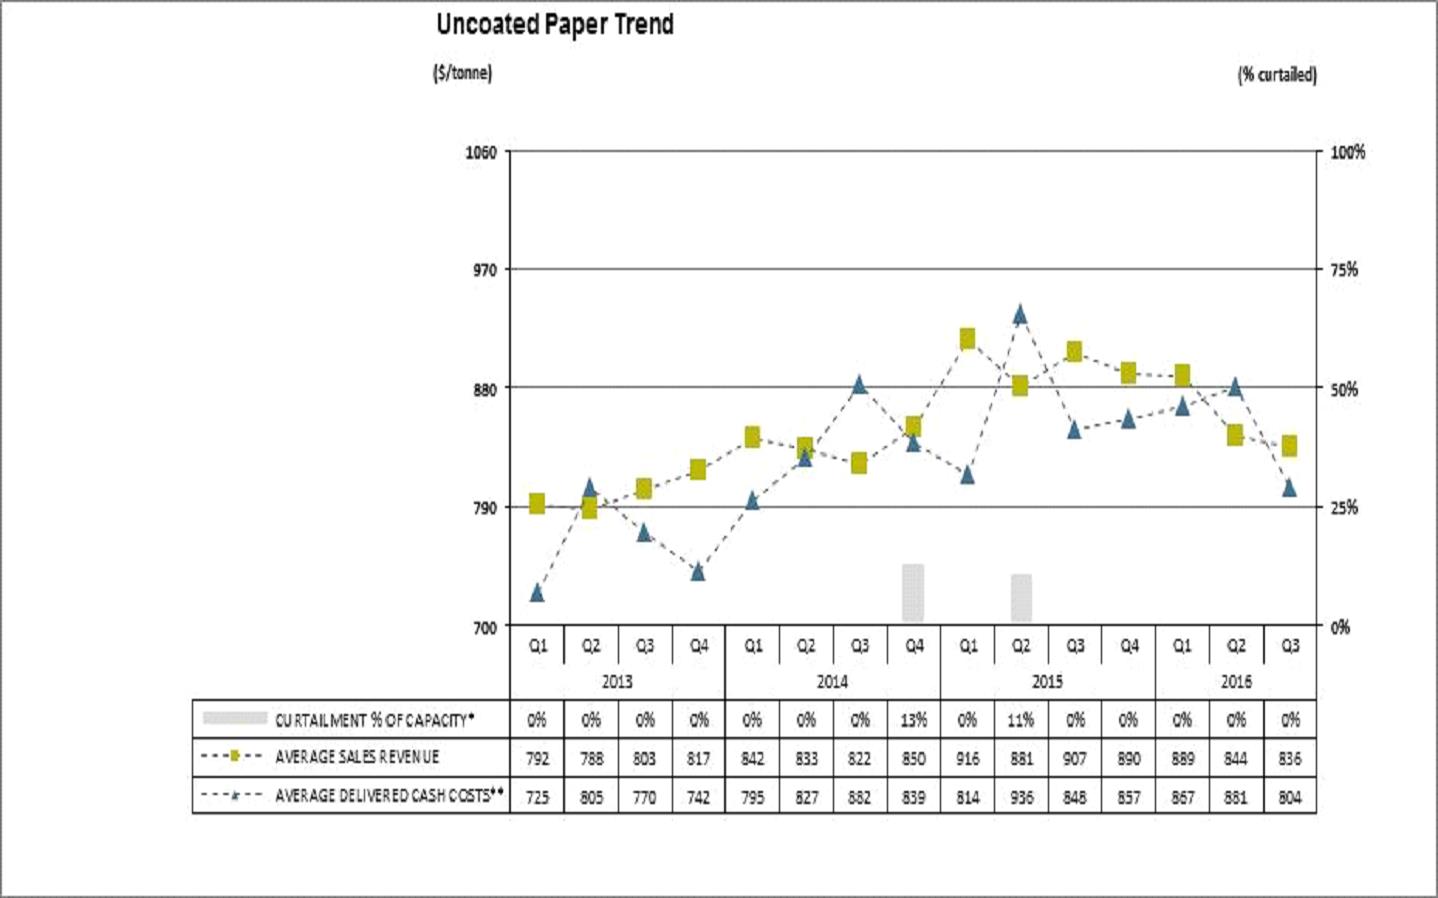
| * |
Average delivered cash costs per tonne consist of cost of sales, excluding depreciation and amortization, and including the impact of SG&A and restructuring costs.
|
Q3 2016 vs. Q3 2015
| · |
Sales volume increased by 1,500 tonnes.
|
| · |
Average sales revenue decreased by $71 per tonne due to lower average transaction prices and the negative impact of a stronger Canadian dollar. Transaction prices were negatively impacted by the imposition of countervailing duties on U.S. exports of SC Paper.
|
| · |
Average delivered cash costs decreased by $44 per tonne due to lower electric power, steam fuel, kraft and maintenance costs.
|
2016 YTD vs. 2015 YTD
| · |
Sales volume decreased by 3,700 tonnes reflecting the continued decline in uncoated paper demand.
|
| · |
Average sales revenue decreased $45 per tonne due to lower average transaction prices, partially offset by the positive impact of a weaker Canadian dollar.
|
| · |
Average delivered cash costs decreased by $17 per tonne due to lower kraft pulp and electric power costs, and improved production partly reflecting market curtailment taken in Q2 2015.
|
18
|
NEWSPRINT
|
||||||||||||||||||||||||
|
Three months
|
Nine months
|
|||||||||||||||||||||||
|
(In millions of Canadian dollars, except
|
ended September 30,
|
ended September 30,
|
||||||||||||||||||||||
|
where otherwise stated)
|
2016
|
2015
|
Change
|
2016
|
2015
|
Change
|
||||||||||||||||||
|
Sales
|
$
|
55.5
|
$
|
63.0
|
$
|
(7.5
|
)
|
$
|
161.6
|
$
|
179.9
|
$
|
(18.3
|
)
|
||||||||||
|
Operating loss
|
(48.0
|
)
|
(2.3
|
)
|
(45.7
|
)
|
(59.3
|
)
|
(8.3
|
)
|
(51.0
|
)
|
||||||||||||
|
Depreciation and amortization
|
1.9
|
1.9
|
-
|
5.6
|
5.3
|
0.3
|
||||||||||||||||||
|
Impairment
|
50.0
|
-
|
50.0
|
50.0
|
-
|
50.0
|
||||||||||||||||||
|
Adjusted EBITDA 1
|
4.0
|
(0.4
|
)
|
4.4
|
(3.7
|
)
|
(3.0
|
)
|
(0.7
|
)
|
||||||||||||||
|
– before specific items 1
|
4.1
|
(0.4
|
)
|
4.5
|
(3.9
|
)
|
(1.7
|
)
|
(2.2
|
)
|
||||||||||||||
|
Adjusted EBITDA margin 1
|
7.2
|
%
|
(0.6
|
%)
|
7.8
|
%
|
(2.3
|
%)
|
(1.7
|
%)
|
(0.6
|
%)
|
||||||||||||
|
– before specific items 1
|
7.4
|
%
|
(0.6
|
%)
|
8.0
|
%
|
(2.4
|
%)
|
(0.9
|
%)
|
(1.5
|
%)
|
||||||||||||
|
(In thousands of tonnes)
|
||||||||||||||||||||||||
|
Sales
|
78.8
|
92.6
|
(13.8
|
)
|
232.6
|
264.0
|
(31.4
|
)
|
||||||||||||||||
|
Production
|
86.6
|
92.4
|
(5.8
|
)
|
240.9
|
258.1
|
(17.2
|
)
|
||||||||||||||||
| 1 |
Refer to section 6, Non-GAAP measures.
|
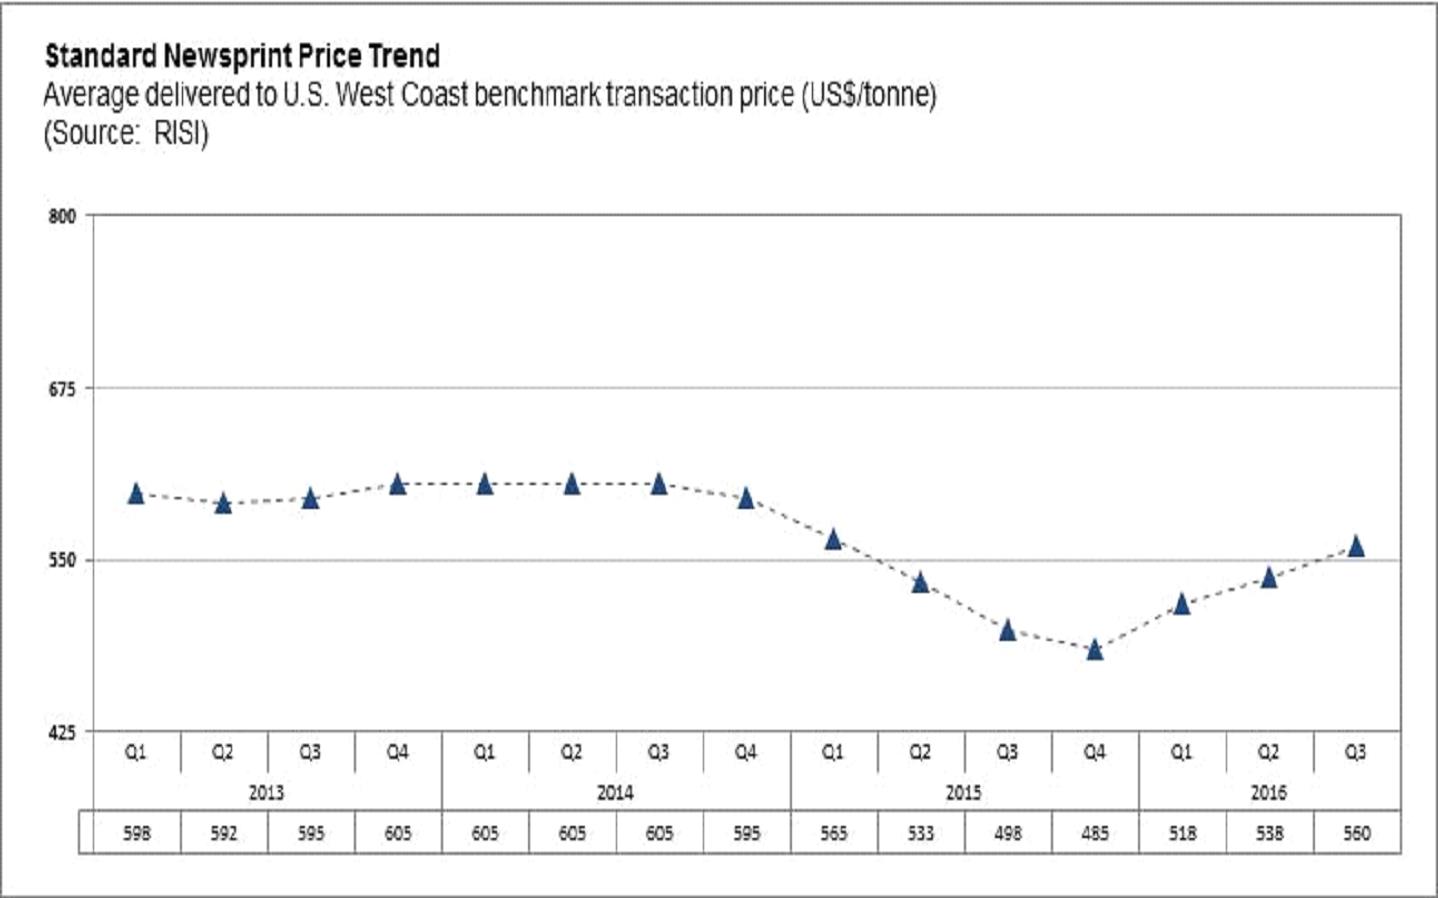
SEGMENT OVERVIEW
Total North American demand for newsprint decreased by 4.2% compared to the third quarter of 2015 in part due to lower newspaper print advertising and declining circulation. The average Q3 North American newsprint benchmark price increased by 4.1% to US$560 per tonne compared to the previous quarter.
19
OPERATIONAL PERFORMANCE
The following chart summarizes the operating performance of our newsprint segment:

| * |
Although C1 remains indefinitely curtailed, it is not included in our 2016 capacity table.
|
| ** |
Average delivered cash costs per tonne consist of cost of sales, excluding depreciation and amortization, and including the impact of SG&A and restructuring costs.
|
Q3 2016 vs. Q3 2015
| · |
Sales volume decreased by 13,800 tonnes due to reduced production in the quarter and lower demand from certain export regions.
|
| · |
Average sales revenue increased by $24 per tonne reflecting higher average transaction prices.
|
| · |
Average delivered cash costs decreased $31 per tonne due to lower distribution, fibre, electric power and steam fuel costs.
|
2016 YTD vs. 2015 YTD
| · |
Sales volume decreased by 31,400 tonnes in line with the reduction in production volumes and reduced demand from certain export regions.
|
| · |
Average sales revenue increased by $13 per tonne due to the positive impact of a weaker Canadian dollar, partially offset by lower average transaction prices.
|
| · |
Average delivered cash costs increased by $18 per tonne primarily due to incremental maintenance and labour spending and the production impact of planned and unplanned maintenance shuts at the Crofton mill, including a total mill outage in the second quarter.
|
20
PULP
The pulp segment continues to consist of NBSK pulp that we produce at our Crofton mill. The kraft pulp that we produce at our Rumford mill is used primarily in the production of specialty paper at Rumford, while our Canadian pulp is produced primarily to be marketed and sold into Asia. The revenue and cost related to market pulp produced at Rumford are therefore not reported under the pulp operating segment, and will be treated as a corporate adjustment outside of our segmented results.
|
Three months
|
Nine months
|
|||||||||||||||||||||||
|
(In millions of Canadian dollars, except
|
ended September 30,
|
ended September 30,
|
||||||||||||||||||||||
|
where otherwise stated)
|
2016
|
2015
|
Change
|
2016
|
2015
|
Change
|
||||||||||||||||||
|
Sales
|
$
|
72.1
|
$
|
70.7
|
$
|
1.4
|
$
|
194.2
|
$
|
208.9
|
$
|
(14.7
|
)
|
|||||||||||
|
Operating earnings
|
12.1
|
17.9
|
(5.8
|
)
|
17.6
|
36.3
|
(18.7
|
)
|
||||||||||||||||
|
Depreciation and amortization
|
0.7
|
0.7
|
-
|
2.0
|
2.1
|
(0.1
|
)
|
|||||||||||||||||
|
Adjusted EBITDA 1
|
12.8
|
18.6
|
(5.8
|
)
|
19.6
|
38.4
|
(18.8
|
)
|
||||||||||||||||
|
– before specific items 1
|
13.0
|
18.6
|
(5.6
|
)
|
19.4
|
41.5
|
(22.1
|
)
|
||||||||||||||||
|
Adjusted EBITDA margin 1
|
17.8
|
%
|
26.3
|
%
|
(8.5
|
%)
|
10.1
|
%
|
18.4
|
%
|
(8.3
|
%)
|
||||||||||||
|
– before specific items 1
|
18.0
|
%
|
26.3
|
%
|
(8.3
|
%)
|
10.0
|
%
|
19.9
|
%
|
(9.9
|
%)
|
||||||||||||
|
(In thousands of tonnes)
|
||||||||||||||||||||||||
|
Sales
|
94.9
|
85.1
|
9.8
|
254.1
|
256.0
|
(1.9
|
)
|
|||||||||||||||||
|
Production
|
92.8
|
94.6
|
(1.8
|
)
|
251.9
|
262.2
|
(10.3
|
)
|
||||||||||||||||
| 1 |
Refer to section 6, Non-GAAP measures.
|
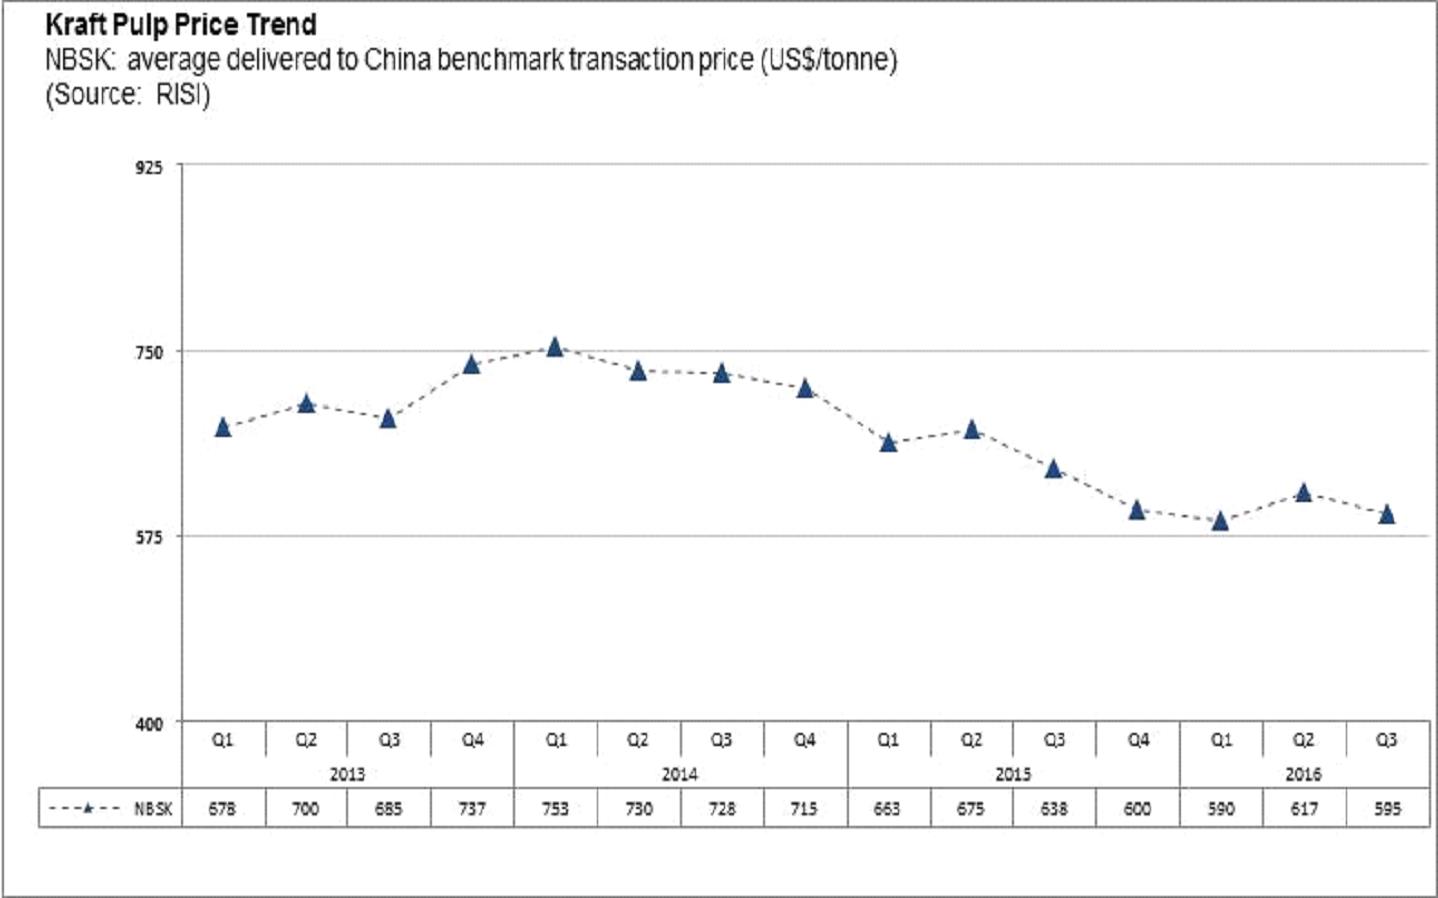
SEGMENT OVERVIEW
Global NBSK demand increased by 0.8% compared to the third quarter of 2015. The average NBSK benchmark pulp price for China decreased 3.6% to US$595 per tonne compared to the previous quarter.
21
OPERATIONAL PERFORMANCE
The following chart summarizes the operating performance of our pulp segment:

| * |
Average delivered cash costs per tonne consist of cost of sales, excluding depreciation and amortization, and including the impact of SG&A and restructuring costs.
|
Q3 2016 vs. Q3 2015
| · |
Sales volume increased by 9,800 tonnes reflecting a delayed shipment in the third quarter of 2015.
|
| · |
Average sales revenue decreased by $72 per tonne due to lower average transaction prices and the negative impact of a stronger Canadian dollar. The price decline was due mostly to weaker operating rates resulting from an increase in pulp production capacity.
|
| · |
Average delivered cash costs increased by $13 per tonne reflecting higher steam fuel, electric power and maintenance costs.
|
2016 YTD vs. 2015 YTD
| · |
Sales volume decreased by 1,900 tonnes.
|
| · |
Average sales revenue decreased by $52 per tonne due to lower average transaction prices, partially offset by the positive impact of a weaker Canadian dollar.
|
| · |
Average delivered cash costs increased by $21 per tonne due to increased chemical, steam fuel and maintenance costs. Planned and unplanned maintenance shuts at the Crofton mill, including a total mill outage in the second quarter, resulted in incremental maintenance and labour spending and reduced production.
|
22
| 3. |
LIQUIDITY AND CAPITAL RESOURCES
|
SELECTED FINANCIAL INFORMATION
|
Three months
|
Nine months
|
|||||||||||||||||||||||
|
(In millions of Canadian dollars, except
|
ended September 30,
|
ended September 30,
|
||||||||||||||||||||||
|
where otherwise stated)
|
2016
|
2015
|
Change
|
2016
|
2015
|
Change
|
||||||||||||||||||
|
Cash flows provided (used) by operations
|
||||||||||||||||||||||||
|
before changes in non‑cash working capital
|
$
|
10.8
|
$
|
20.0
|
$
|
(9.2
|
)
|
$
|
(3.6
|
)
|
$
|
(6.9
|
)
|
$
|
3.3
|
|||||||||
|
Changes in non-cash working capital
|
(22.6
|
)
|
(32.9
|
)
|
10.3
|
(10.2
|
)
|
(19.1
|
)
|
8.9
|
||||||||||||||
|
Cash flows provided (used) by:
|
||||||||||||||||||||||||
|
Operations
|
(11.8
|
)
|
(12.9
|
)
|
1.1
|
(13.8
|
)
|
(26.0
|
)
|
12.2
|
||||||||||||||
|
Investing activities
|
(3.1
|
)
|
2.2
|
(5.3
|
)
|
(18.6
|
)
|
(92.7
|
)
|
74.1
|
||||||||||||||
|
Financing activities
|
13.1
|
7.0
|
6.1
|
30.6
|
112.8
|
(82.2
|
)
|
|||||||||||||||||
|
Capital spending
|
(3.1
|
)
|
(2.9
|
)
|
(0.2
|
)
|
(18.5
|
)
|
(24.4
|
)
|
5.9
|
|||||||||||||
|
Depreciation and amortization
|
13.7
|
15.0
|
(1.3
|
)
|
41.4
|
44.1
|
(2.7
|
)
|
||||||||||||||||
|
Impairment
|
186.4
|
-
|
186.4
|
186.4
|
-
|
186.4
|
||||||||||||||||||
|
Capital spending as % of depreciation
|
||||||||||||||||||||||||
|
and amortization
|
23
|
%
|
19
|
%
|
4
|
%
|
45
|
%
|
55
|
%
|
(10
|
%)
|
||||||||||||
|
Net debt to net capitalization at September 301
|
272
|
%
|
131
|
%
|
141
|
%
|
272
|
%
|
131
|
%
|
141
|
%
|
||||||||||||
| 5. |
SUMMARY OF QUARTERLY RESULTS
|
The following table highlights selected financial information for the eight consecutive quarters ending September 30, 2016:
ADJUSTED EBITDA AND ADJUSTED EBITDA BEFORE SPECIFIC ITEMS
Adjusted EBITDA as defined equates to operating earnings (loss) plus depreciation and amortization and impairment and other closure costs. Adjusted EBITDA margin and adjusted EBITDA margin before specific items are defined as adjusted EBITDA and adjusted EBITDA before specific items as a percentage of sales.
Specific items are items that do not arise from the company's day-to-day operating, investing and financing activities, or items that are subject to material volatility based on factors outside of management's control. Specific items include: restructuring costs; incidents that significantly impact operations and related insurance proceeds; and gains, losses and expenses related to activities that arise outside of the scope of the company's normal business activities.
These measures enable comparison of consolidated and segment operating results between periods without regard to debt service, income taxes, capital expenditure requirements, and specific items. These measures are provided to improve comparability between periods by eliminating the impact of financing (interest), accounting (depreciation) and specific items on our results.
RECONCILIATION TO NET EARNINGS (LOSS)
|
2016
|
2015
|
|||||||||||||||||||||||||||||||||||
|
(In millions of Canadian dollars)
|
YTD
|
Q3
|
Q2
|
Q1
|
Total
|
Q4
|
Q3
|
Q2
|
Q1
|
|||||||||||||||||||||||||||
|
Net earnings (loss)
|
$
|
(194.7
|
)
|
$
|
(185.0
|
)
|
$
|
(26.6
|
)
|
$
|
16.9
|
$
|
(49.4
|
)
|
$
|
(26.3
|
)
|
$
|
(12.9
|
)
|
$
|
(32.4
|
)
|
$
|
22.2
|
|||||||||||
|
Depreciation and amortization
|
41.4
|
13.7
|
13.3
|
14.4
|
61.4
|
17.3
|
15.0
|
14.8
|
14.3
|
|||||||||||||||||||||||||||
|
Impairment
|
186.4
|
186.4
|
-
|
-
|
-
|
-
|
-
|
-
|
-
|
|||||||||||||||||||||||||||
|
Foreign exchange (gain) loss on long-term debt
|
(19.2
|
)
|
2.8
|
0.6
|
(22.6
|
)
|
57.7
|
11.6
|
24.0
|
(5.5
|
)
|
27.6
|
||||||||||||||||||||||||
|
Bargain purchase gain
|
-
|
-
|
-
|
-
|
(43.9
|
)
|
-
|
(1.7
|
)
|
(2.9
|
)
|
(39.3
|
)
|
|||||||||||||||||||||||
|
Other (income) expense, net
|
(7.4
|
)
|
1.0
|
(4.7
|
)
|
(3.7
|
)
|
0.9
|
(1.2
|
)
|
2.5
|
(2.6
|
)
|
2.2
|
||||||||||||||||||||||
|
Interest expense, net
|
37.2
|
13.0
|
12.1
|
12.1
|
49.4
|
12.3
|
13.5
|
11.3
|
12.3
|
|||||||||||||||||||||||||||
|
Income tax expense (recovery)
|
-
|
-
|
-
|
-
|
(27.4
|
)
|
1.4
|
(1.6
|
)
|
(1.9
|
)
|
(25.3
|
)
|
|||||||||||||||||||||||
|
Adjusted EBITDA
|
$
|
43.7
|
$
|
31.9
|
$
|
(5.3
|
)
|
$
|
17.1
|
$
|
48.7
|
$
|
15.1
|
$
|
38.8
|
$
|
(19.2
|
)
|
$
|
14.0
|
||||||||||||||||
|
Specific items
|
||||||||||||||||||||||||||||||||||||
|
Restructuring costs
|
-
|
-
|
-
|
-
|
1.8
|
0.2
|
0.3
|
0.7
|
0.6
|
|||||||||||||||||||||||||||
|
Market curtailment
|
-
|
-
|
-
|
-
|
11.7
|
-
|
-
|
11.7
|
-
|
|||||||||||||||||||||||||||
|
Crofton oxygen plant outage (insurance recovery)
|
(2.7
|
)
|
-
|
-
|
(2.7
|
)
|
4.4
|
-
|
-
|
4.4
|
-
|
|||||||||||||||||||||||||
|
Rumford recovery boiler upgrade
|
-
|
-
|
-
|
-
|
11.0
|
-
|
-
|
11.0
|
-
|
|||||||||||||||||||||||||||
|
Professional fees and duties on countervailing action
|
8.6
|
3.1
|
2.2
|
3.3
|
7.7
|
4.5
|
2.1
|
1.1
|
-
|
|||||||||||||||||||||||||||
|
Crofton waterline breach, net of insurance recovery
|
2.3
|
0.3
|
2.0
|
-
|
-
|
-
|
-
|
-
|
-
|
|||||||||||||||||||||||||||
|
Acquisition costs related to U.S. paper mills
|
-
|
-
|
-
|
-
|
1.4
|
-
|
-
|
-
|
1.4
|
|||||||||||||||||||||||||||
|
Total specific items
|
8.2
|
3.4
|
4.2
|
0.6
|
38.0
|
4.7
|
2.4
|
28.9
|
2.0
|
|||||||||||||||||||||||||||
|
Adjusted EBITDA before specific items
|
$
|
51.9
|
$
|
35.3
|
$
|
(1.1
|
)
|
$
|
17.7
|
$
|
86.7
|
$
|
19.8
|
$
|
41.2
|
$
|
9.7
|
$
|
16.0
|
|||||||||||||||||
27
NET EARNINGS (LOSS) BEFORE SPECIFIC ITEMS
Specific items are items that do not arise from the company's day-to-day operating, investing and financing activities, or items that are subject to material volatility based on factors outside of management's control. Specific items include: foreign exchange gain or loss on long-term debt; gain or loss on cancellation of long-term debt; asset-impairment and other closure costs; restructuring costs; incidents that significantly impact operations and related insurance proceeds; and gains, losses and expenses related to activities that arise outside of the scope of the company's normal business activities.
The exclusion of specific items from net earnings (loss) facilitates the comparison of financial results between periods.
RECONCILIATION TO NET EARNINGS (LOSS)
28
FREE CASH FLOW
Free cash flow excludes working capital and certain other sources and uses of cash, which are disclosed in the consolidated statements of cash flows. This measure allows us to assess our ability to generate funds to repay debt and assists in cash flow forecasting.
RECONCILIATION TO CASH PROVIDED BY OPERATING ACTIVITIES LESS CASH USED BY INVESTING ACTIVITIES
The company conducts its impairment test at the asset group level. Asset groups of the company, defined as operating segments or one reporting level lower, are its five paper mills and one pulp mill.
Estimates of future cash flows and fair value require judgments, assumptions and estimates that may change over time. Due to the variables associated with judgments and assumptions used in these tests, the precision and accuracy of estimates of impairment charges are subject to significant uncertainties and may change significantly as additional information becomes known. The carrying value of long-lived assets represented approximately 34.0% of total assets as at September 30, 2016. If future developments were to differ adversely from management's best estimate of key assumptions and associated cash flows, the company could potentially experience future material impairment charges.
We recognized an impairment write-down of $186.4 million on the property, plant and equipment of the Powell River, Port Alberni and Crofton paper mills as of September 30, 2016. Continued declines in current and forecasted pulp and paper prices that may negatively impact future operating costs and profitability accelerated in 2016 due to extremely competitive North American market conditions for paper, increased paper imports into North America supported by the strong US dollar and rapid depreciation of the Euro, and anticipated capacity increases from late 2016 through 2017 for pulp that are expected to adversely impact operating rates and prices. These deteriorating commercial factors, individually and in aggregate, were identified as potential impairment indicators for long-lived assets as at September 30, 2016.
The company conducted step (i) of the impairment test to determine whether the carrying value of its long-lived assets were recoverable. The net carrying amount of assets did not exceed the projected undiscounted future cash flows for certain asset groups. The company conducted step (ii) of the impairment test and wrote the property, plant and equipment of the Powell River, Port Aberni and Crofton paper asset groups down to their respective fair values. The impairment write-down was pushed down to the buildings and equipment of the respective asset groups on a pro rata basis based on the net book values of buildings and equipment prior to recognition of the impairment. The impairment write-down was not allocated to the book value of land.
Estimates of future cash flows used to test the recoverability of long-lived assets included key assumptions related to foreign exchange rates, forecast product prices, market supply and demand, estimated useful life of the long-lived assets, production levels, production costs, inflation, and capital spending. The assumptions were derived from information generated internally and external published reports and forecasts. Product sales prices and foreign exchange assumptions for the fourth quarter of 2016 to 2020 were based on management's best estimates incorporating independent market information as well as analysis of historical data, trends and cycles. Product sales prices and foreign exchange assumptions for the 2021 trend year were based on independent, published market forecasts. A discount rate of 10.5% was used, reflecting current market assessments of the time value of money and the risks particular to the company's assets.
Pension and Post-Retirement Benefits
Effective January 1, 2016, the company elected to refine the approach for determining the service cost and interest cost components of the net defined benefit cost that will be recognized on pension and other post-retirement benefit programs. Historically, the company had estimated the service and interest cost components by applying a single weighted-average discount rate derived from the yield curve used to measure the benefit obligation at the beginning of the period. The company has elected to utilize a full yield curve approach to estimate these components by applying specific spot rates along the yield curve used in the determination of the benefit obligation to the relevant projected cash flows. The company made this change to improve the correlation between projected benefit cash flows and the corresponding yield curve spot rates and to provide a more precise measurement of interest costs. This change does not affect the measurement of total benefit obligations as the change in interest cost is completely offset in the actuarial loss reported in the period. The company has accounted for this change as a change in estimates and, accordingly, has accounted for it prospectively beginning in the first quarter of 2016. Based on current economic conditions, we estimate the service cost and interest cost for those plans will be reduced by approximately $3.8 million in 2016 as a result of the change.
Property, Plant and Equipment
We adjusted the estimated remaining economic life of certain assets as of December 31, 2015, based on a review of the physical condition and expected future operational and commercial lives of our major classes of assets. The estimated impact on annual depreciation from the adjustment is a $6.0 million reduction.
30
A description of our risks and uncertainties can be found on pages 52 to 61 of our 2015 Annual Report and such description is incorporated by reference into this MD&A.
In addition, the following list outlines some of the risks associated with the Alternative Recapitalization:
The consummation of the Alternative Recapitalization may not occur, including pursuant to a termination of the Recapitalization Support Agreement
The company will not complete the Alternative Recapitalization unless and until all conditions precedent to the Alternative Recapitalization, some of which are not under the company's control, are satisfied or waived. Even if the Alternative Recapitalization is completed, it may not be completed on the schedule or in the manner anticipated. Accordingly, securityholders participating in the Alternative Recapitalization may receive different treatment under the Alternative Recapitalization from that contemplated and/or have to wait longer than expected to receive their New Common Shares. If the Alternative Recapitalization is not completed on the timeline or terms anticipated, the company may incur additional expenses.
Although the Supporting Parties have agreed in the Recapitalization Support Agreement to vote in favor of the Alternative Recapitalization, there can be no assurance that other creditors, securityholders or third parties will not seek to challenge, oppose or delay the Alternative Recapitalization, or the ability to implement the Alternative Recapitalization under the CBCA, nor can there be any assurance that such parties would not be successful in such challenge, opposition or delay.
The Recapitalization Support Agreement may be terminated by the company or the Supporting Parties in certain circumstances. Accordingly, there is no certainty, nor can the company provide any assurance, that the Recapitalization Support Agreement will not be terminated by either the company or the Supporting Parties before the completion of the Alternative Recapitalization, which may result in the Alternative Recapitalization not proceeding.
In the event that the company does not complete the Alternative Recapitalization, the inability of the company to secure the additional capital required to service its financial obligations and maintain its resource and asset value will likely have a material adverse effect on the company. As a result, if the Alternative Recapitalization is not implemented, the company's secured creditors may take steps to exercise remedies available to them under their security and to enforce against the company's assets, including the potential for the appointment of a receiver under the Bankruptcy and Insolvency Act.
Potential effect of the Alternative Recapitalization
There can be no assurance as to the effect of the Alternative Recapitalization on the company's relationships with its suppliers, customers, purchasers or contractors or lenders, nor can there be any assurance as to the effect on such relationships of any delay in the completion of the Alternative Recapitalization, or the effect of whether the Alternative Recapitalization is completed under the CBCA or the Company is required to proceed with another statutory procedure. To the extent that any of these events result in the tightening of payment or credit terms, increases in the price of supplied goods, or the loss of a major supplier, customer, purchaser or contractor, or of multiple other suppliers, customers, purchasers or contractors, this could have a material adverse effect on the company's business, financial condition, liquidity and results of operations.
The Alternative Recapitalization may not improve the financial condition of the company
The Alternative Recapitalization is intended to enhance the company's liquidity and provide it with continued financial flexibility. However, the foregoing is contingent on many assumptions that may prove to be incorrect, including without limitation:
| · |
the ability of the company to succeed in continuing to implement its business plan;
|
| · |
that the decline in print revenues and of the demand for the company's newsprint, uncoated mechanical and coated mechanical papers will not accelerate beyond what is currently anticipated;
|
| · |
that general economic conditions will not deteriorate beyond currently anticipated levels;
|
| · |
that the company's consolidated sales and relationships with suppliers, advertisers, users, customers, purchasers and contractors will not be materially adversely affected while the Alternative Recapitalization is underway or as a result of such Alternative Recapitalization; and
|
| · |
the company's continued ability to manage costs.
|
Should any of those assumptions not materialize, the Alternative Recapitalization may not have the effect of providing the company with the financial flexibility expected or required to implement its business plan.
32
After the Alternative Recapitalization, the Supporting Parties will own a significant number of the New Common Shares and their interests may conflict with the interests of other Shareholders and reduce liquidity
Following the completion of the Alternative Recapitalization, the Supporting Parties will hold approximately 80% of the New Common Shares. Accordingly, each of the Supporting Parties would have a significant vote in any matter coming before a vote of shareholders. The interests of the Supporting Parties in the company's business, operations and financial condition from time to time may not be aligned with, or may conflict with, the interests of other holders of New Common Shares. In addition, the significant holdings of the Supporting Parties may reduce the liquidity of the New Common Shares.
The company may be unable to continue as a going concern
If the Alternative Recapitalization is not implemented, the company will not be able to generate sufficient cash flow from its operations to meet its obligations and as such the company will be unable to continue as a going concern. The significant decline in demand for newsprint has constrained the company's ability to generate cash flow in a context where the company has a significant debt burden. There can be no assurance that the company will be able to obtain additional capital on terms acceptable to the company or at all. The inability to secure additional capital required to meet the company's financial obligations under the ABL Facility and the Term Loan would have a material adverse effect on the company's financial condition and its ability to continue as a going concern.
The non-implementation of the Alternative Recapitalization could create liquidity risks and force the company to pursue other alternatives that could have a more negative effect on the company
If the Alternative Recapitalization is not implemented and business operations of the company continue at their current levels, the Company may not be able to generate sufficient cash flows to service, repay or refinance its outstanding indebtedness when it matures without raising additional capital. In the current market conditions and the company's financial condition, the company can give no assurance that additional capital will be available on favorable terms, or at all. If the company defaults under the terms of certain of its indebtedness, the noteholders could declare all outstanding principal and interest to be due and payable, the company's lenders could terminate their commitments to loan money and foreclose against the assets securing such borrowings and the company could be forced into bankruptcy or liquidation. Further, in the event that the Alternative Recapitalization is not implemented, the company may be required to pursue other alternatives that could have a more negative effect on the company and its stakeholders, including non-consensual proceedings under creditor protection legislation.
33
| 11. |
SENSITIVITY ANALYSIS
|
Our earnings are sensitive to fluctuations in product prices, foreign exchange, energy and fibre costs as described on page 62 to 63 of our 2015 Annual Report and summarized in the following table:
|
(In millions of Canadian dollars, except per share amounts)
|
Adjusted
EBITDA1
|
Net
Earnings2
|
Earnings
per Share
|
|||||||||
|
Product prices 3
|
||||||||||||
|
A US$10 per tonne change in the sales price of:
|
||||||||||||
|
Uncoated Paper
|
$
|
6
|
$
|
4
|
$
|
0.28
|
||||||
|
Coated Paper
|
13
|
10
|
0.69
|
|||||||||
|
Newsprint
|
4
|
3
|
0.21
|
|||||||||
|
Pulp
|
5
|
4
|
0.25
|
|||||||||
|
Foreign exchange 4
|
||||||||||||
|
A US$0.01 change in the U.S. dollar relative to the Canadian dollar
|
10
|
7
|
0.49
|
|||||||||
|
Energy cost sensitivity 5
|
||||||||||||
|
A 5% change in the price of:
|
||||||||||||
|
Natural gas and oil – direct purchases
|
1
|
1
|
0.06
|
|||||||||
|
Electricity – direct purchases
|
9
|
7
|
0.46
|
|||||||||
|
Coal – direct purchases
|
1
|
1
|
0.06
|
|||||||||
|
Freight cost sensitivity
|
||||||||||||
|
A US$5/bbl change in the price of West Texas Int. (WTI) Oil
|
1
|
1
|
0.06
|
|||||||||
|
Fibre sensitivity 5
|
||||||||||||
|
A US$5 per unit change in the price of:
|
||||||||||||
|
Wood chips (Bdt)
|
17
|
13
|
0.87
|
|||||||||
| 1 |
Refer to section 6, Non-GAAP measures.
|
| 2 |
Based on an expected tax rate of 26%.
|
| 3 |
Based on annualized sales of Q3 2016 and foreign exchange rate of US$0.77.
|
| 4 |
Based on Q3 2016 annualized net cash flows and a movement to US$0.78 from US$0.77 and excluding our hedging program and the impact of the translation of U.S. dollar-denominated debt.
|
| 5 |
Based on Q3 2016 annualized consumption levels and an exchange rate of US$0.77.
|
| 12. |
OUTLOOK
|
Markets
The market for printing and writing papers in North America continues to be under pressure. Competition among both domestic and offshore producers, ongoing electronic substitution and paper conservation moves by publishers contribute to the challenging market conditions. For coated and uncoated paper, we expect that pricing in the latter half of the fourth quarter will be supported by the announced November 1st price increases of US$50 per short ton for SC paper and US$40 per short ton for CGW no. 4 and no. 5 paper. For newsprint, stable pricing is anticipated for the balance of the year. Pulp prices are expected to decline in the fourth quarter due to anticipated increases in capacity and supply.
Operations
Fourth quarter earnings are expected to be supported by strong seasonal sales while being negatively impacted by heavy maintenance spending. Major maintenance spending will include recovery and power boiler shuts at the Rumford mill. We expect to realize continued savings across our operations under our revitalization and OFI programs.
34
The following table summarizes major planned maintenance shutdown costs and related production downtime for 2016:
|
Q1
|
Q2
|
Q3
|
Q4
|
Total
|
|||||||||||
|
Mill Location
|
Mtce
|
Mtce
|
Mtce
|
Mtce
|
Mtce
|
||||||||||
|
Tonnage
|
Cost
|
Tonnage
|
Cost
|
Tonnage
|
Cost
|
Tonnage
|
Cost
|
Tonnage
|
Cost
|
||||||
|
Impact
|
($mm)
|
Impact
|
($mm)
|
Impact
|
($mm)
|
Impact
|
($mm)
|
Impact
|
($mm)
|
||||||
|
Alberni
|
|||||||||||||||
|
Other
|
-
|
0.7
|
-
|
-
|
-
|
0.1
|
-
|
0.7
|
-
|
1.5
|
|||||
|
Boilers
|
-
|
-
|
-
|
-
|
-
|
0.3
|
-
|
1.8
|
-
|
2.1
|
|||||
|
Crofton
|
|||||||||||||||
|
TMO
|
-
|
-
|
7,200
|
3.0
|
-
|
-
|
-
|
-
|
7,200
|
3.0
|
|||||
|
Capital
|
-
|
-
|
7,900
|
-
|
-
|
-
|
-
|
-
|
7,900
|
-
|
|||||
|
Pulp
|
-
|
-
|
12,200
|
4.6
|
-
|
-
|
-
|
-
|
12,200
|
4.6
|
|||||
|
Boilers
|
-
|
3.8
|
-
|
-
|
-
|
-
|
-
|
-
|
-
|
3.8
|
|||||
|
Powell
|
|||||||||||||||
|
Boilers
|
-
|
0.2
|
-
|
2.8
|
-
|
-
|
-
|
-
|
-
|
3.0
|
|||||
|
Biron
|
|||||||||||||||
|
Boilers
|
-
|
-
|
-
|
-
|
-
|
-
|
-
|
-
|
-
|
-
|
|||||
|
Rumford
|
|||||||||||||||
|
Capital
|
-
|
-
|
-
|
-
|
-
|
-
|
1,500
|
-
|
1,500
|
-
|
|||||
|
Pulp
|
-
|
-
|
-
|
-
|
-
|
-
|
4,800
|
9.6
|
4,800
|
9.6
|
|||||
|
Boilers
|
-
|
-
|
-
|
-
|
-
|
4.2
|
-
|
2.9
|
-
|
7.1
|
|||||
|
Other
|
-
|
-
|
-
|
-
|
-
|
-
|
-
|
1.0
|
-
|
1.0
|
|||||
|
Total
|
-
|
$ 4.7
|
27,300
|
$ 10.4
|
-
|
$ 4.6
|
6,300
|
$ 16.0
|
33,600
|
$ 35.7
|
|||||
Capital spending is expected to be in the $30 to $35 million range in 2016.
Liquidity, Debt Maturities and Covenants
We do not currently anticipate any significant uses of cash in Q4 other than for our operations, working capital fluctuations, property tax payments and pension funding contributions.
| 13. |
DISCLOSURE CONTROLS AND INTERNAL CONTROL OVER FINANCIAL REPORTING
|
A summary of our regulatory requirements for the evaluation of internal controls and subsequent reporting of the results of that evaluation can be found on page 66 of our 2015 Annual Report. Based on an evaluation of the design and operation of the company's disclosure controls and procedures conducted under the supervision and with the participation of management, our chief executive officer and chief financial officer concluded that such disclosure controls and procedures (as defined in Canada under National Instrument 52-109 and in Rules 13a-15(e) and 15d-15(e) under the United States Securities Exchange Act of 1934), were effective as at December 31, 2015.
We did not make any changes in internal controls over financial reporting during the most recent three and nine month periods ended September 30, 2016 that have materially affected, or are reasonably likely to materially affect, our internal control over financial reporting.
The company's Audit Committee, as part of its oversight role, has reviewed and recommended the approval of this MD&A to the Board of Directors. The Board of Directors has read and approved this MD&A.
35
CONSOLIDATED BALANCE SHEETS
|
September 30,
|
December 31,
|
|||||||
|
(Unaudited and in millions of Canadian dollars)
|
2016
|
2015
|
||||||
|
Assets
|
||||||||
|
Current assets
|
||||||||
|
Cash and cash equivalents
|
$
|
6.5
|
$
|
8.3
|
||||
|
Accounts receivable (note 6)
|
189.2
|
185.1
|
||||||
|
Inventories (note 7)
|
258.7
|
256.2
|
||||||
|
Prepaids and other (note 8)
|
11.9
|
5.5
|
||||||
|
Assets held for sale
|
0.7
|
1.5
|
||||||
|
467.0
|
456.6
|
|||||||
|
Property, plant and equipment (note 9)
|
241.9
|
456.9
|
||||||
|
Other assets (note 10)
|
2.9
|
2.0
|
||||||
|
$
|
711.8
|
$
|
915.5
|
|||||
|
Liabilities
|
||||||||
|
Current liabilities
|
||||||||
|
Accounts payable and accrued liabilities (note 11)
|
$
|
243.8
|
$
|
244.5
|
||||
|
Current portion of long-term debt (note 12)
|
165.1
|
3.2
|
||||||
|
408.9
|
247.7
|
|||||||
|
Long-term debt (note 12)
|
344.0
|
491.0
|
||||||
|
Employee future benefits (note 13)
|
252.9
|
267.1
|
||||||
|
Other long-term obligations (note 14)
|
23.7
|
26.4
|
||||||
|
1,029.5
|
1,032.2
|
|||||||
|
Equity (Deficiency)
|
||||||||
|
Shareholders' equity (deficiency)
|
||||||||
|
Common stock: no par value; unlimited shares authorized; issued
|
144.9
|
144.9
|
||||||
|
and outstanding: 14,527,571 shares
|
||||||||
|
(December 31, 2015 – 14,527,571 shares)
|
||||||||
|
Preferred stock: par value determined at time of issue; authorized
|
-
|
-
|
||||||
|
100,000,000 shares; issued and outstanding: nil shares
|
||||||||
|
Deficit
|
(479.2
|
)
|
(284.5
|
)
|
||||
|
Accumulated other comprehensive income
|
16.6
|
22.9
|
||||||
|
(317.7
|
)
|
(116.7
|
)
|
|||||
|
$
|
711.8
|
$
|
915.5
|
|||||
Going concern (note 1)
Contingencies (note 19)
Subsequent events (notes 1 and 12)
The accompanying notes are an integral part of the unaudited interim consolidated financial statements.
On behalf of the Board:
|
|
 |
|
Joe Nemeth
|
Walter Jones
|
|
Director
|
Director
|
36
CONSOLIDATED STATEMENTS OF LOSS
|
Three months
|
Nine months
|
|||||||||||||||
|
(Unaudited and in millions of Canadian dollars, except where otherwise stated)
|
ended September 30,
|
ended September 30,
|
||||||||||||||
|
|
2016
|
2015
|
2016
|
2015
|
||||||||||||
|
Sales
|
$
|
502.7
|
$
|
542.6
|
$
|
1,473.9
|
$
|
1,480.3
|
||||||||
|
Operating expenses
|
||||||||||||||||
|
Cost of sales, excluding depreciation and amortization
|
458.3
|
490.2
|
1,387.5
|
1,405.0
|
||||||||||||
|
Depreciation and amortization
|
13.7
|
15.0
|
41.4
|
44.1
|
||||||||||||
|
Selling, general and administrative
|
12.5
|
13.3
|
42.7
|
40.1
|
||||||||||||
|
Restructuring
|
-
|
0.3
|
-
|
1.6
|
||||||||||||
|
Impairment and other closure costs (note 5)
|
186.4
|
-
|
186.4
|
-
|
||||||||||||
|
670.9
|
518.8
|
1,658.0
|
1,490.8
|
|||||||||||||
|
Operating earnings (loss)
|
(168.2
|
)
|
23.8
|
(184.1
|
)
|
(10.5
|
)
|
|||||||||
|
Interest expense, net
|
(13.0
|
)
|
(13.5
|
)
|
(37.2
|
)
|
(37.1
|
)
|
||||||||
|
Foreign exchange gain (loss) on long-term debt
|
(2.8
|
)
|
(24.0
|
)
|
19.2
|
(46.1
|
)
|
|||||||||
|
Other income (expense), net (note 15)
|
(1.0
|
)
|
(0.8
|
)
|
7.4
|
41.8
|
||||||||||
|
Loss before income taxes
|
(185.0
|
)
|
(14.5
|
)
|
(194.7
|
)
|
(51.9
|
)
|
||||||||
|
Income tax recovery (note 16)
|
-
|
(1.6
|
)
|
-
|
(28.8
|
)
|
||||||||||
|
Net loss
|
$
|
(185.0
|
)
|
$
|
(12.9
|
)
|
$
|
(194.7
|
)
|
$
|
(23.1
|
)
|
||||
|
Basic and diluted net loss per share (in dollars)
|
(12.76
|
)
|
(0.89
|
)
|
(13.43
|
)
|
(1.59
|
)
|
||||||||
|
Weighted average number of company common
|
14.5
|
14.5
|
14.5
|
14.5
|
||||||||||||
|
shares outstanding (in millions)
|
||||||||||||||||
CONSOLIDATED STATEMENTS OF COMPREHENSIVE LOSS
|
Three months
|
Nine months
|
|||||||||||||||
|
ended September 30,
|
ended September 30,
|
|||||||||||||||
|
(Unaudited and in millions of Canadian dollars)
|
2016
|
2015
|
2016
|
2015
|
||||||||||||
|
Net loss
|
$
|
(185.0
|
)
|
$
|
(12.9
|
)
|
$
|
(194.7
|
)
|
$
|
(23.1
|
)
|
||||
|
Other comprehensive income (loss), net of tax
|
||||||||||||||||
|
(expense) recovery:
|
||||||||||||||||
|
Foreign currency translation adjustments
|
||||||||||||||||
|
Gross amount
|
0.6
|
4.3
|
(6.3
|
)
|
6.2
|
|||||||||||
|
Tax (expense) recovery
|
-
|
-
|
-
|
-
|
||||||||||||
|
Net amount
|
0.6
|
4.3
|
(6.3
|
)
|
6.2
|
|||||||||||
|
Other comprehensive income (loss), net of tax
|
0.6
|
4.3
|
(6.3
|
)
|
6.2
|
|||||||||||
|
Comprehensive loss
|
$
|
(184.4
|
)
|
$
|
(8.6
|
)
|
$
|
(201.0
|
)
|
$
|
(16.9
|
)
|
||||
The accompanying notes are an integral part of the unaudited interim consolidated financial statements.
38
CONSOLIDATED STATEMENTS OF DEFICIENCY
57
FORM 52-109F2
CERTIFICATION OF INTERIM FILINGS
FULL CERTIFICATE
I, Joe Nemeth, President and Chief Executive Officer, Catalyst Paper Corporation, certify the following:
| 1. |
Review: I have reviewed the interim financial statements and interim MD&A (together, the "interim filings") of Catalyst Paper Corporation (the "issuer") for the interim period ended September 30, 2016.
|
| 2. |
No misrepresentations: Based on my knowledge, having exercised reasonable diligence, the interim filings do not contain any untrue statement of a material fact or omit to state a material fact required to be stated or that is necessary to make a statement not misleading in light of the circumstances under which it was made, with respect to the period covered by the interim filings.
|
| 3. |
Fair presentation: Based on my knowledge, having exercised reasonable diligence, the interim financial statements together with the other financial information included in the interim filings fairly present in all material respects the financial condition, results of operations and cash flows of the issuer, as of the date of and for the periods presented in the interim filings.
|
| 4. |
Responsibility: The issuer's other certifying officer(s) and I are responsible for establishing and maintaining disclosure controls and procedures (DC&P) and internal control over financial reporting (ICFR), as those terms are defined in National Instrument 52-109 Certification of Disclosure in Issuers' Annual and Interim Filings, for the issuer.
|
| 5. |
Design: Subject to the limitations, if any, described in paragraphs 5.2 and 5.3, the issuer's other certifying officer(s) and I have, as at the end of the period covered by the interim filings
|
| (a) |
designed DC&P, or caused it to be designed under our supervision, to provide reasonable assurance that
|
| (i) |
material information relating to the issuer is made known to us by others, particularly during the period in which the interim filings are being prepared; and
|
| (ii) |
information required to be disclosed by the issuer in its annual filings, interim filings or other reports filed or submitted by it under securities legislation is recorded, processed, summarized and reported within the time periods specified in securities legislation; and
|
| (b) |
designed ICFR, or caused it to be designed under our supervision, to provide reasonable assurance regarding the reliability of financial reporting and the preparation of financial statements for external purposes in accordance with the issuer's GAAP.
|
| 5.1 |
Control framework: The control framework the issuer's other certifying officer(s) and I used to design the issuer's ICFR is that published by the Committee of Sponsoring Organizations of the Treadway Commission (COSO).
|
| 5.2 |
N/A
|
|
5.3
|
Limitation on scope of design: The issuer has disclosed in its interim MD&A
|
| (a) |
the fact that the issuer's other certifying officer(s) and I have limited the scope of our design of DC&P and ICFR to exclude controls, policies and procedures of a variable interest entity in which the issuer has an interest; and
|
| (b) |
summary financial information about the proportionately consolidated entity, variable interest entity or business that the issuer acquired that has been proportionately consolidated or consolidated in the issuer's financial statements.
|
| 6. |
Reporting changes in ICFR: The issuer has disclosed in its interim MD&A any change in the issuer's ICFR that occurred during the period beginning July 1, 2016 and ended on September 30, 2016 that has materially affected, or is reasonably likely to materially affect, the issuer's ICFR.
|
Date: November 8, 2016
|
"Joe Nemeth"
|
|
|
Joe Nemeth
|
|
|
President and Chief Executive Officer
|
|
FORM 52-109F2
CERTIFICATION OF INTERIM FILINGS
FULL CERTIFICATE
I, Gerrie Kotze, Vice President, Finance, Catalyst Paper Corporation, certify the following:
| 1. |
Review: I have reviewed the interim financial statements and interim MD&A (together, the "interim filings") of Catalyst Paper Corporation (the "issuer") for the interim period ended September 30, 2016.
|
| 2. |
No misrepresentations: Based on my knowledge, having exercised reasonable diligence, the interim filings do not contain any untrue statement of a material fact or omit to state a material fact required to be stated or that is necessary to make a statement not misleading in light of the circumstances under which it was made, with respect to the period covered by the interim filings.
|
| 3. |
Fair presentation: Based on my knowledge, having exercised reasonable diligence, the interim financial statements together with the other financial information included in the interim filings fairly present in all material respects the financial condition, results of operations and cash flows of the issuer, as of the date of and for the periods presented in the interim filings.
|
| 4. |
Responsibility: The issuer's other certifying officer(s) and I are responsible for establishing and maintaining disclosure controls and procedures (DC&P) and internal control over financial reporting (ICFR), as those terms are defined in National Instrument 52-109 Certification of Disclosure in Issuers' Annual and Interim Filings, for the issuer.
|
| 5. |
Design: Subject to the limitations, if any, described in paragraphs 5.2 and 5.3, the issuer's other certifying officer(s) and I have, as at the end of the period covered by the interim filings
|
| (a) |
designed DC&P, or caused it to be designed under our supervision, to provide reasonable assurance that
|
| (i) |
material information relating to the issuer is made known to us by others, particularly during the period in which the interim filings are being prepared; and
|
| (ii) |
information required to be disclosed by the issuer in its annual filings, interim filings or other reports filed or submitted by it under securities legislation is recorded, processed, summarized and reported within the time periods specified in securities legislation; and
|
| (b) |
designed ICFR, or caused it to be designed under our supervision, to provide reasonable assurance regarding the reliability of financial reporting and the preparation of financial statements for external purposes in accordance with the issuer's GAAP.
|
| 5.1 |
Control framework: The control framework the issuer's other certifying officer(s) and I used to design the issuer's ICFR is that published by the Committee of Sponsoring Organizations of the Treadway Commission (COSO).
|
| 5.2 |
N/A
|
|
5.3
|
Limitation on scope of design: The issuer has disclosed in its interim MD&A
|
| (a) |
the fact that the issuer's other certifying officer(s) and I have limited the scope of our design of DC&P and ICFR to exclude controls, policies and procedures of a variable interest entity in which the issuer has an interest; and
|
| (b) |
summary financial information about the proportionately consolidated entity, variable interest entity or business that the issuer acquired that has been proportionately consolidated or consolidated in the issuer's financial statements.
|
| 6. |
Reporting changes in ICFR: The issuer has disclosed in its interim MD&A any change in the issuer's ICFR that occurred during the period beginning July 1, 2016 and ended on September 30, 2016 that has materially affected, or is reasonably likely to materially affect, the issuer's ICFR.
|
Date: November 8, 2016
|
"Gerrie Kotze"
|
|
|
Gerrie Kotze
|
|
|
Vice President, Finance
|
|
Serious News for Serious Traders! Try StreetInsider.com Premium Free!
You May Also Be Interested In
- Dicello Levitt LLP Announces Investor Class Action Lawsuit Filed Against QuidelOrtho Corp. f/k/a Quidel Corp. (NASDAQ: QDEL) And Lead Plaintiff Deadline
- ADSK INVESTOR ALERT: ROSEN, TOP RANKED INVESTOR COUNSEL, Encourages Autodesk, Inc. Investors to Secure Counsel Before Important Deadline in Securities Class Action First Filed by the Firm – ADSK
- CIDARA Therapeutics ALERT: Bragar Eagel & Squire, P.C. is Investigating Cidara Therapeutics, Inc. on Behalf of Cidara Therapeutics Stockholders and Encourages Investors to Contact the Firm
Create E-mail Alert Related Categories
SEC FilingsSign up for StreetInsider Free!
Receive full access to all new and archived articles, unlimited portfolio tracking, e-mail alerts, custom newswires and RSS feeds - and more!
