

Form 8-K MITEL NETWORKS CORP For: Aug 04
 Tweet
Tweet Share
Share
UNITED STATES
SECURITIES AND EXCHANGE COMMISSION
Washington, D.C. 20549
FORM 8-K
CURRENT REPORT
PURSUANT TO SECTION 13 OR 15(d)
OF THE SECURITIES EXCHANGE ACT OF 1934
Date of Report (Date of earliest event reported): August 4, 2016
MITEL NETWORKS CORPORATION
(Exact Name of Registrant as Specified in its Charter)
| Canada | 001-34699 | 98-0621254 | ||
| (State or Other Jurisdiction of Incorporation) |
(Commission File Number) |
(I.R.S. Employer Identification No.) | ||
350 Legget Drive
Ottawa, Ontario K2K 2W7
(Address of Principal Executive Offices) (Zip Code)
(613) 592-2122
(Registrant’s telephone number, including area code)
Not Applicable
(Former Name or Former Address, if Changed Since Last Report)
Check the appropriate box below if the Form 8-K filing is intended to simultaneously satisfy the filing obligation of the registrant under any of the following provisions:
| ¨ | Written communications pursuant to Rule 425 under the Securities Act (17 CFR 230.425) |
| ¨ | Soliciting material pursuant to Rule 14a-12 under the Exchange Act (17 CFR 240.14a-12) |
| ¨ | Pre-commencement communications pursuant to Rule 14d-2(b) under the Exchange Act (17 CFR 240.14d-2(b)) |
| ¨ | Pre-commencement communications pursuant to Rule 13e-4(c) under the Exchange Act (17 CFR 240.13e-4(c)) |
Item 7.01. Regulation FD
Mitel Networks Corporation (the “Company”) is furnishing under this Item 7.01, a copy of a slide deck presentation made available August 4, 2016 on the Company’s earnings call for the fiscal quarter ended June 30, 2016. The presentation is incorporated by reference herein and has also been posted to the Company’s website.
The information in this Current Report on Form 8-K under Item 7.01, including Exhibit 99.1 attached hereto and incorporated herein, is being “furnished” and not “filed” with the U.S. Securities and Exchange Commission for purposes of Section 18 of the Securities Exchange Act of 1934, as amended, or otherwise subject to the liabilities under such section. Furthermore, such information shall not be deemed incorporated by reference in any filing under the Securities Act of 1933, as amended, unless specifically identified as being incorporated therein by reference.
Item 9.01 Financial Statements and Exhibits.
(d) Exhibits.
| 99.1 | Investor Earnings Call Slide Deck Presentation dated August 4, 2016 | |
SIGNATURE
Pursuant to the requirements of the Securities Exchange Act of 1934, the registrant has duly caused this report to be signed on its behalf by the undersigned hereunto duly authorized.
Date: August 4, 2016
| MITEL NETWORKS CORPORATION | ||
| By: |
/s/ Greg Hiscock | |
| Name: | Greg Hiscock | |
| Title: | General Counsel & Corporate Secretary | |
| Exhibit 99.1
|

Mitel Q2 2016 Earnings Call
Presentation
August 4, 2016
|
|
Safe Harbor Statement
Forward Looking Statements
Some of the statements in this communication are forward-looking statements (or forward-looking information) within the meaning of applicable U.S. and Canadian securities laws. These include statements using the words believe, target, outlook, may, will, should, could, estimate, continue, expect, intend, plan, predict, potential, project and anticipate, and similar statements which do not describe the present or provide information about the past. There is no guarantee that the expected events or expected results will actually occur. Such statements reflect the current views of management of Mitel and are subject to a number of risks and uncertainties. These statements are based on many assumptions and factors, including general economic and market conditions, industry conditions, operational and other factors. Any changes in these assumptions or other factors could cause actual results to differ materially from current expectations. All forward-looking statements attributable to Mitel, or persons acting on its behalf, are expressly qualified in their entirety by the cautionary statements set forth in this paragraph. Undue reliance should not be placed on such statements. In addition, material risks that could cause actual results to differ from forward-looking statements include: the inherent uncertainty associated with financial or other projections; the anticipated size of the markets and continued demand for Mitel products and services; access to available financing on a timely basis and on reasonable terms; the integration of Mavenir and the ability to recognize the anticipated benefits from the acquisition of Mavenir;
Mitel’s ability to achieve or sustain profitability in the future; fluctuations in quarterly and annual revenues and operating results; fluctuations in foreign exchange rates; current and ongoing global economic instability, political unrest and related sanctions; intense competition; reliance on channel partners for a significant component of sales; dependence upon a small number of outside contract manufacturers to manufacture products; and, Mitel’s ability to successfully implement and achieve its business strategies, including its growth of the company through acquisitions and the integration of recently acquired businesses and realization of synergies. Additional risks are described under the heading _Risk Factors_ in Mitel’s
Annual Report on Form 10-K for the year ended December 31, 2015 filed with the U.S. Securities and Exchange Commission (the _SEC_ ) and Canadian securities regulatory authorities on February 29, 2016. Forward-looking statements speak only as of the date they are made. Except as required by law, Mitel has no intention or obligation to update or to publicly announce the results of any revisions to any of the forward-looking statements to reflect actual results, future events or developments, changes in assumptions or changes in other factors affecting the forward-looking statements.
2 |©2015 Mitel. Proprietary and Confidential.
|
|
Non-GAAP Financial Measurements
In an effort to provide investors with additional information regarding the company’s results as determined by generally accepted accounting principles (GAAP), the company also discusses, in its earnings press release and earnings presentation materials, the following non-GAAP information which management believes provides useful information to investors. Mitel provides a reconciliation between GAAP and non-GAAP financial information in our quarterly results announcements and in the supplemental slides used in conjunction with th e company’s quarterly call. This information is available on our website at www.mitel.com under the _Investor Relations_ section http://investor.mitel.com/events.cfm.
Non-GAAP Financial Measures
This presentation includes references to non-GAAP financial measures including Adjusted EBITDA, non-GAAP net income, non-GAAP EPS (earnings per share), non-GAAP revenues and non-GAAP gross margin. Non-GAAP financial measures do not have any standardized meaning and are therefore unlikely to be comparable to similar measures presented by other companies. We use these non-GAAP financial measures to assist management and investors in understanding our past financial performance and prospects for the future, including changes in our operating results, trends and marketplace performance, exclusive of unusual events or factors which do not directly affect what we consider to be our core operating performance. Non-GAAP measures are among the primary indicators management uses as a basis for our planning and forecasting of future periods. Investors are cautioned that non-GAAP financial measures should not be relied upon as a substitute for financial measures prepared in accordance with generally accepted accounting principles. Please see the reconciliation of non-GAAP financial measures to the most directly comparable U.S. GAAP measure attached to our quarterly results announcement.
Mitel completed the acquisition of Mavenir Systems Inc. on April 29, 2015. _As reported_ results in our quarterly results an nouncement and the attached tables refer to the U.S. GAAP results of Mitel, which include the results of Mavenir from the date of acquisition. Pro-forma results reflect the results of the company as if it had been fully combined with Mavenir Systems for the full presented period. Non-GAAP Revenues and non-GAAP Gross Margin have been adjusted to exclude the effect of purchase accounting. These adjustments have no i mpact on Mitel’s business or cash flows, but adversely affect the
Company`s reported revenues and gross margin in the period following an acquisition. For a reconciliation of Mitel’s as-reported results to the pro-forma results and non-GAAP results, please see the tables attached to our quarterly announcement as well as the Form 8-K presenting combined historical results of Mitel and Mavenir filed with the SEC on August 6, 2015.
Constant Currency Estimates
Management refers to growth rates at constant currency or adjusting for currency so that certain financial results can be viewed without the impact of fluctuations in foreign currency exchange rates, thereby facilitating period-to-period comparisons of the company’s business performance. Financial results adjusted for currency are calculated by translating prior period activity in local currency using the current period currency conversion rate. This approach is used for countries where the functional currency is the local currency. Generally, when the US dollar either strengthens or weakens against other currencies, the growth at constant currency rates or adjusting for currency will be higher or lower than growth reported at actual exchange rates.
Annualized Exit Monthly Cloud Recurring Revenue
Annualized Exit Monthly Cloud Recurring Revenue is a leading indicator of our anticipated cloud recurring revenues. We believe that trends in revenue are important to understanding the overall health of our cloud business. Our Annualized Exit Monthly Cloud Recurring Revenue equals our Monthly Cloud Recurring Revenue multiplied by 12. Our Monthly Cloud Recurring Revenue equals the monthly value of all customer subscriptions in effect at the end of a given month. For example, our Monthly Recurring Subscriptions at June 30, 2016 were $10.12 million. As such, our Annualized Exit Monthly Cloud Recurring
Revenues at June 30, 2016 were $121.4 million.
3 |©2015 Mitel. Proprietary and Confidential.
|
|
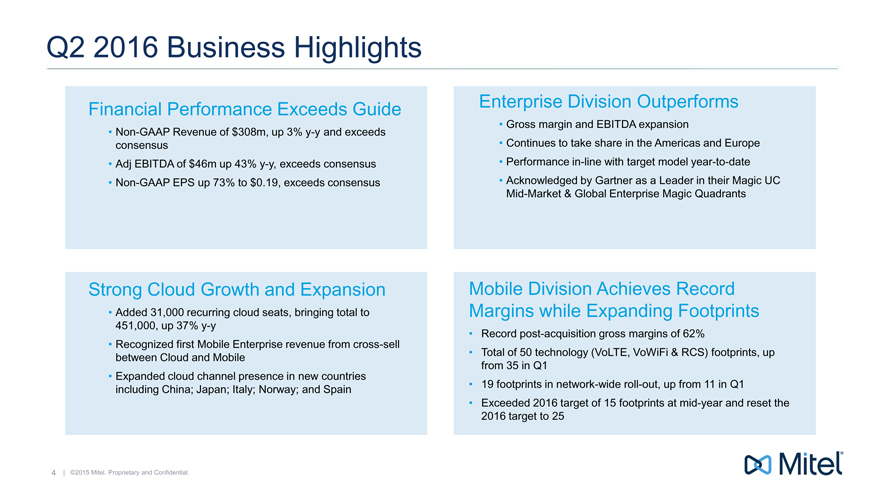
Q2 2016 Business Highlights
Financial Performance Exceeds Guide
Non -GAAP Revenue of $308m, up 3% y-y and exceeds
consensus
Adj EBITDA of $46m up 43% y-y, exceeds consensus
Non -GAAP EPS up 73% to $0.19, exceeds consensus
Strong Cloud Growth and Expansion
Added 31,000 recurring cloud seats, bringing total to
451,000, up 37% y-y
Recognized first Mobile Enterprise revenue from cross-sell
between Cloud and Mobile
Expanded cloud channel presence in new countries
including China; Japan; Italy; Norway; and Spain
Enterprise Division Outperforms
Gross margin and EBITDA expansion
Continues to take share in the Americas and Europe
Performance in -line with target model year-to-date
Acknowledged by Gartner as a Leader in their Magic UC
Mid-Market & Global Enterprise Magic Quadrants
Mobile Division Achieves Record Margins while Expanding Footprints
Record post-acquisition gross margins of 62%
Total of 50 technology (VoLTE, VoWiFi & RCS) footprints, up
from 35 in Q1
19 footprints in network-wide roll-out, up from 11 in Q1
Exceeded 2016 target of 15 footprints at mid-year and reset the
2016 target to 25
4 |©2015 Mitel. Proprietary and Confidential.
|
|
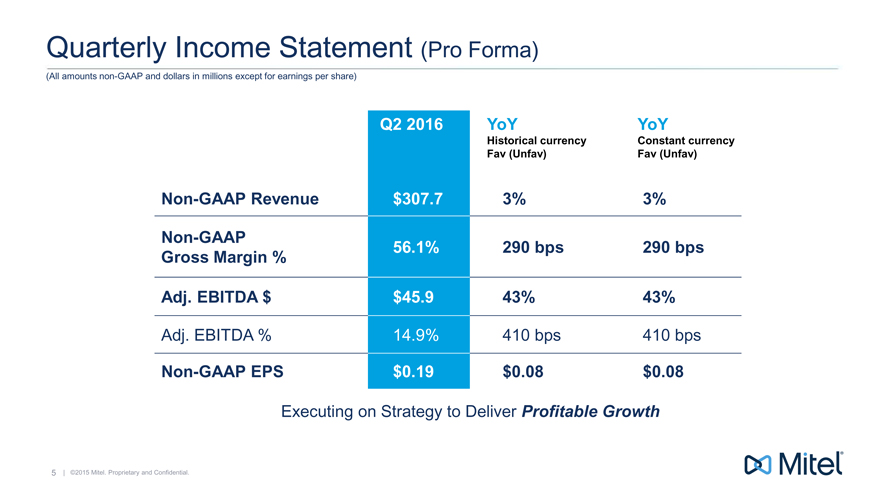
Quarterly Income Statement (Pro Forma)
(All amounts non-GAAP and dollars in millions except for earnings per share)
Q2 2016
YoY
YoY
Historical currency
Constant currency
Fav (Unfav)
Fav (Unfav)
Non-GAAP Revenue
$307.7
3%
3%
Non-GAAP
56.1%
290 bps
290 bps
Gross Margin %
Adj. EBITDA $
$45.9
43%
43%
Adj. EBITDA %
14.9%
410 bps
410 bps
Non-GAAP EPS
$0.19
$0.08
$0.08
Executing on Strategy to Deliver Profitable Growth
5 |©2015 Mitel. Proprietary and Confidential.
|
|
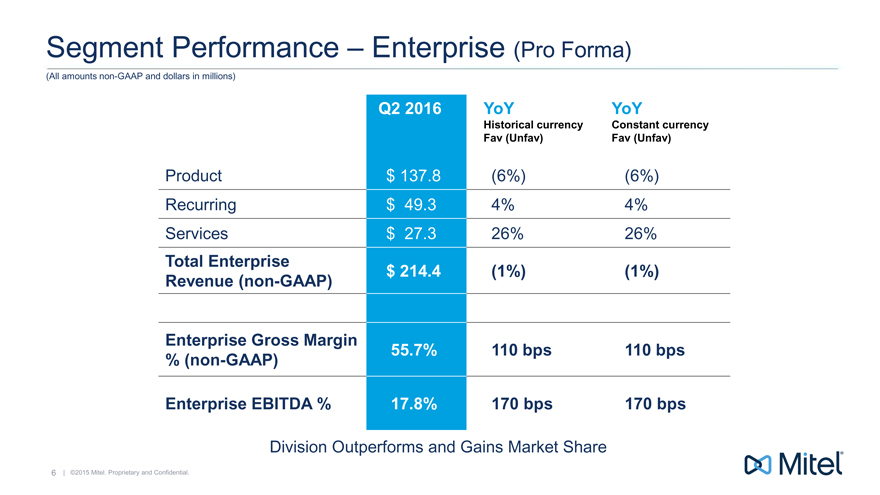
Segment Performance Enterprise (Pro Forma)
(All amounts non-GAAP and dollars in millions)
Q2 2016
YoY
YoY
Historical currency
Constant currency
Fav (Unfav)
Fav (Unfav)
Product
$
137.8
(6%)
(6%)
Recurring
$
49.3
4%
4%
Services
$
27.3
26%
26%
Total Enterprise
$
214.4
(1%)
(1%)
Revenue (non-GAAP)
Enterprise Gross Margin
55.7%
110 bps
110 bps
% (non-GAAP)
Enterprise EBITDA %
17.8%
170 bps
170 bps
Division Outperforms and Gains Market Share
6 |
©2015 Mitel. Proprietary and Confidential.
|
|
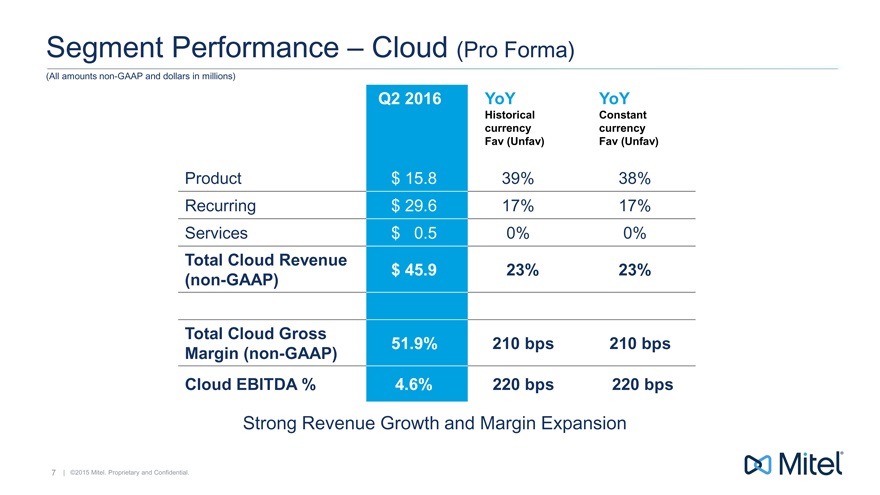
Segment Performance
Cloud
(Pro Forma)
(All amounts non-GAAP and dollars in millions)
Q2 2016
YoY
YoY
Historical
Constant
currency
currency
Fav (Unfav)
Fav (Unfav)
Product
$
15.8
39%
38%
Recurring
$
29.6
17%
17%
Services
$
0.5
0%
0%
Total Cloud Revenue
$
45.9
23%
23%
(non-GAAP)
Total Cloud Gross
51.9%
210
bps
210
bps
Margin (non-GAAP)
Cloud EBITDA %
4.6%
220
bps
220
bps
Strong Revenue Growth and Margin Expansion
7 |©2015 Mitel. Proprietary and Confidential.
|
|
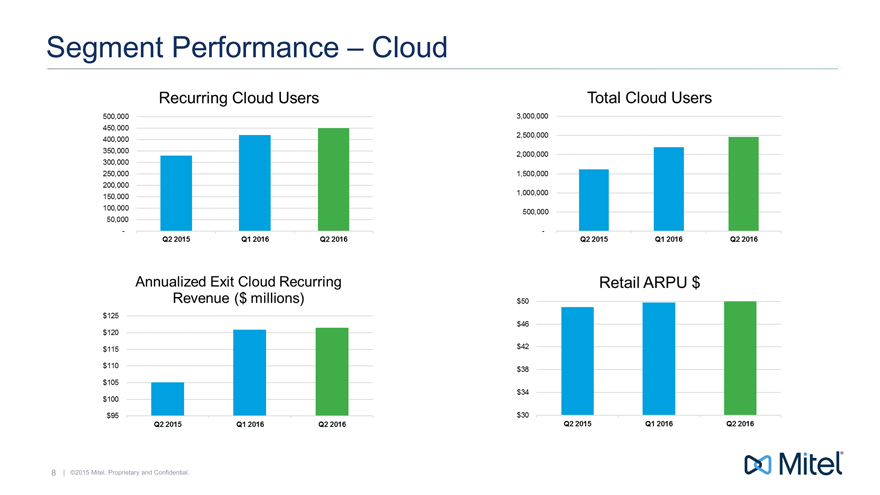
Segment Performance Cloud
8
|
©2015 Mitel. Proprietary and Confidential.
|
|
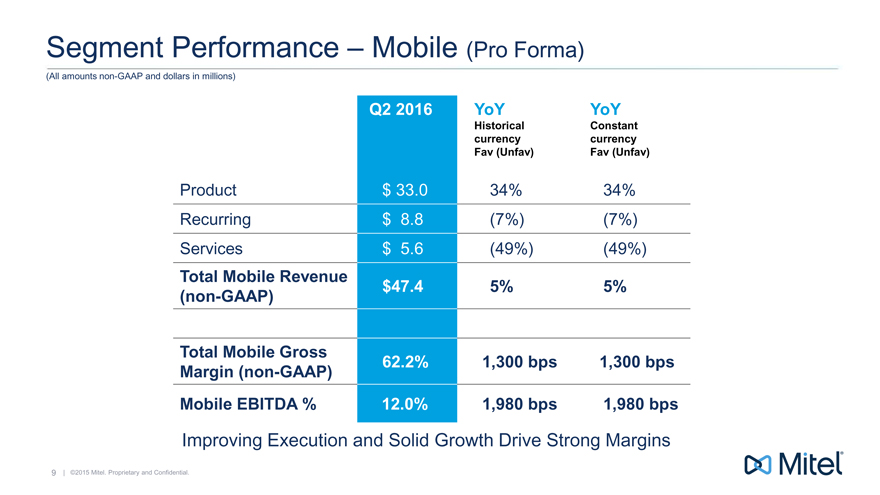
Segment Performance
Mobile (Pro Forma)
(All amounts non-GAAP and dollars in millions)
Q2
2016
YoY
YoY
Historical
Constant
currency
currency
Fav (Unfav)
Fav (Unfav)
Product
$
33.0
34%
34%
Recurring
$
8.8
(7%)
(7%)
Services
$
5.6
(49%)
(49%)
Total Mobile Revenue
$47.4
5%
5%
(non-GAAP)
Total Mobile Gross
62.2%
1,300
bps
1,300
bps
Margin (non-GAAP)
Mobile EBITDA %
12.0%
1,980
bps
1,980
bps
Improving Execution and Solid Growth Drive Strong Margins
9 |©2015 Mitel. Proprietary and Confidential.
|
|
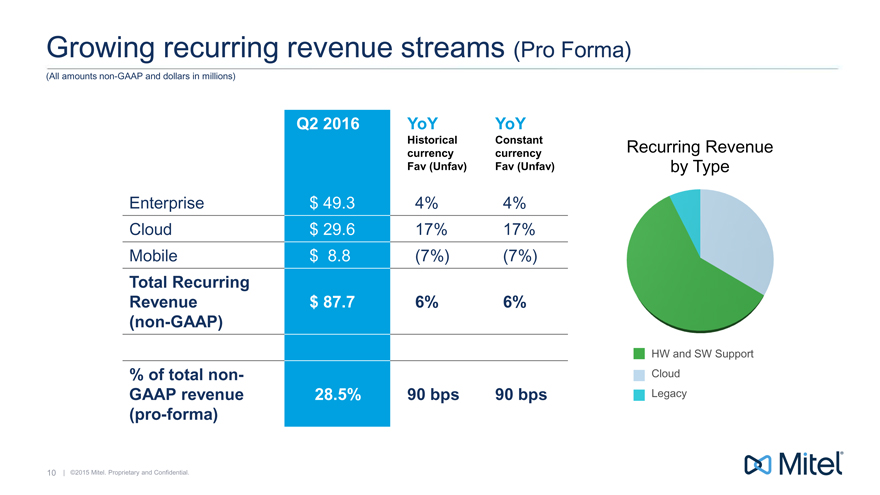
Growing
recurring
revenue
streams (Pro
Forma)
(All amounts non-GAAP and
dollars in millions)
Q2 2016
YoY
YoY
Historical
Constant
Recurring Revenue
currency
currency
Fav (Unfav)
Fav (Unfav)
by Type
Enterprise
$
49.3
4%
4%
Cloud
$
29.6
17%
17%
Mobile
$
8.8
(7%)
(7%)
Total Recurring
Revenue
$
87.7
6%
6%
(non-GAAP)
HW and SW Support
% of total non-
Cloud
GAAP revenue
28.5%
90 bps
90 bps
Legacy
(pro-forma)
10 |©2015 Mitel. Proprietary and Confidential.
|
|
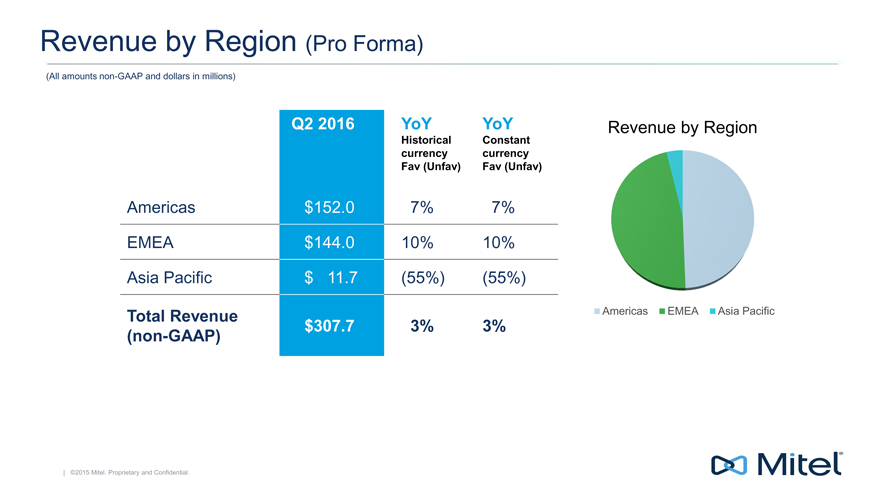
Revenue by Region (Pro Forma)
(All amounts non-GAAP and dollars in millions)
Q2 2016 YoY YoYRevenue byRegion
HistoricalConstant
currencycurrenc
Fav (Unfav)Fav (Unf
Americas $152.0 7%7%
EMEA $144.0 10%10%
Asia Pacific $11.7(55%)(55%)
Total Revenue AmericasEMEAAsia Pacific
(non-GAAP) $307.7 3%3%
|©2015 Mitel. Proprietary and Confidential.
|
|
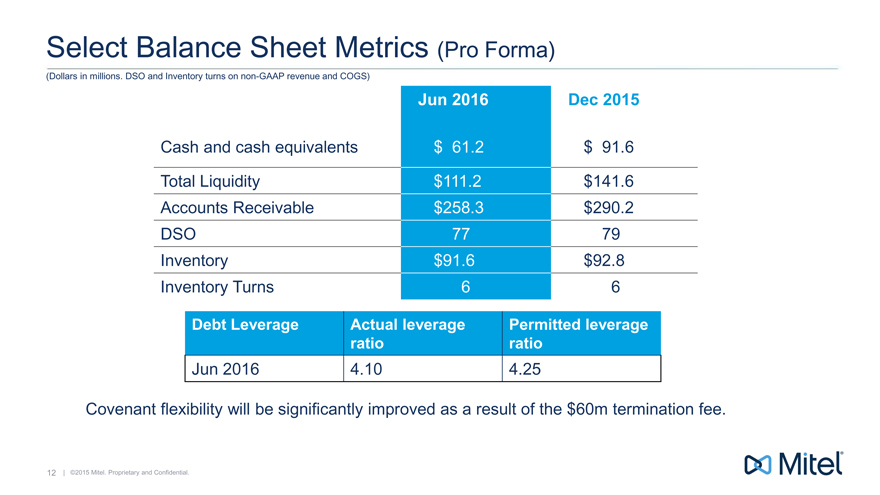
Select Balance Sheet Metrics (Pro Forma)
(Dollars in millions. DSO and Inventory turns on non-GAAP revenue and COGS)
Jun 2016 Dec 2015
Cash and cash equivalents $ 61.2 $ 91.6
Total Liquidity $111.2 $141.6 Accounts Receivable $258.3 $290.2 DSO 77 79 Inventory $91.6 $92.8 Inventory Turns 6 6
Debt Leverage Actual leverage Permitted leverage ratio ratio
Jun 2016 4.10 4.25
Covenant flexibility will be significantly improved as a result of the $60m termination fee.
12 |©2015 Mitel. Proprietary and Confidential.
|
|
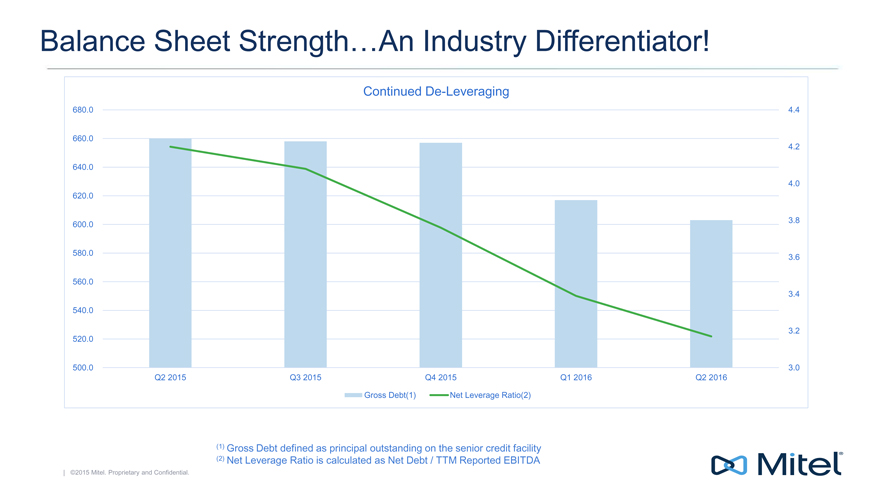
Balance Sheet Strength An Industry Differentiator!
Continued De-Leveraging
680.0 4.4
660.0
4.2
640.0
4.0 620.0
3.8 600.0
580.0
3.6
560.0
3.4
540.0
3.2 520.0
500.0 3.0 Q2 2015 Q3 2015 Q4 2015 Q1 2016 Q2 2016
Gross Debt(1) Net Leverage Ratio(2)
(1) Gross Debt defined as principal outstanding on the senior credit facility
(2) Net Leverage Ratio is calculated as Net Debt / TTM Reported EBITDA
|©2015 Mitel. Proprietary and Confidential.
|
|
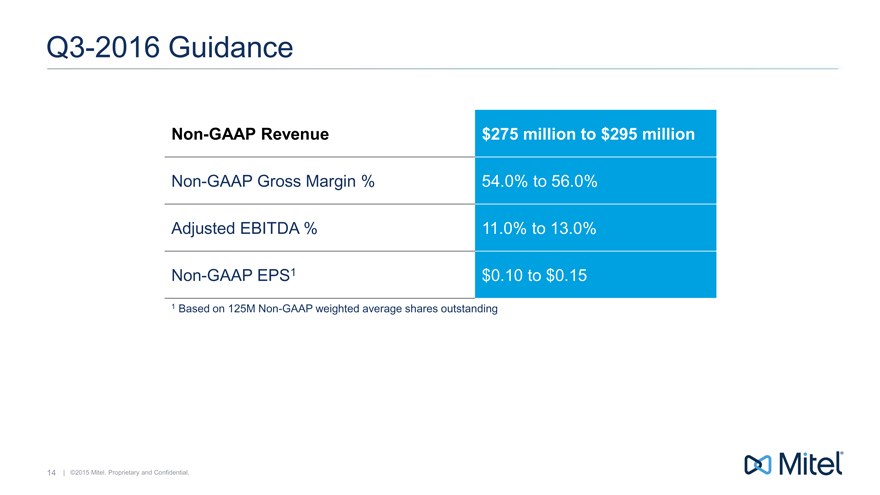
Q3-2016 Guidance
Non-GAAP Revenue $275 million to $295 million
Non-GAAP Gross Margin % 54.0% to 56.0%
Adjusted EBITDA % 11.0% to 13.0%
Non-GAAP EPS1 $0.10 to $0.15
1 Based on 125M Non -GAAP weighted average shares outstanding
14 |©2015 Mitel. Proprietary and Confidential.
|
|

Appendix
15 |©2015 Mitel. Proprietary and Confidential.
|
|
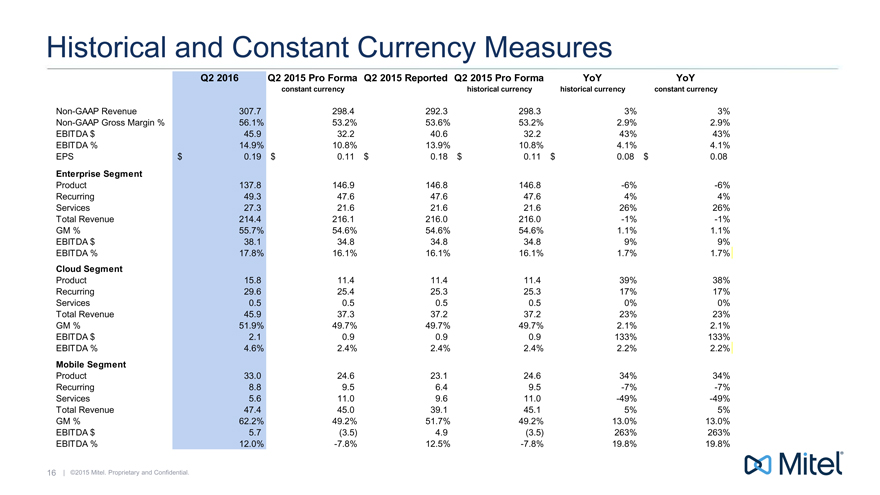
Historical and Constant Currency Measures
Q2 2016 Q2 2015 Pro FormaQ2 2015 ReportedQ2 2015 Pro FormaYoYYoY
constant currencyhistorical currencyhistorical currencyconstant currency
Non-GAAP Revenue 307.7298.4292.3298.33%3%
Non-GAAP Gross Margin % 56.1%53.2%53.6%53.2%2.9%2.9%
EBITDA $ 45.932.240.632.243%43%
EBITDA % 14.9%10.8%13.9%10.8%4.1%4.1%
EPS $0.19$0.11$0.18$0.11$0.08$0.08
Enterprise Segment
Product 137.8146.9146.8146.8-6%-6%
Recurring 49.347.647.647.64%4%
Services 27.321.621.621.626%26%
Total Revenue 214.4216.1216.0216.0-1%-1%
GM % 55.7%54.6%54.6%54.6%1.1%1.1%
EBITDA $ 38.134.834.834.89%9%
EBITDA % 17.8%16.1%16.1%16.1%1.7%1.7%
Cloud Segment
Product 15.811.411.411.439%38%
Recurring 29.625.425.325.317%17%
Services 0.50.50.50.50%0%
Total Revenue 45.937.337.237.223%23%
GM % 51.9%49.7%49.7%49.7%2.1%2.1%
EBITDA $ 2.10.90.90.9133%133%
EBITDA % 4.6%2.4%2.4%2.4%2.2%2.2%
Mobile Segment
Product 33.024.623.124.634%34%
Recurring 8.89.56.49.5-7%-7%
Services 5.611.09.611.0-49%-49%
Total Revenue 47.445.039.145.15%5%
GM % 62.2%49.2%51.7%49.2%13.0%13.0%
EBITDA $ 5.7(3.5)4.9(3.5)263%263%
EBITDA % 12.0%-7.8%12.5%-7.8%19.8%19.8%
16 |©2015 Mitel. Proprietary and Confidential.
|
|

#Mitel
Serious News for Serious Traders! Try StreetInsider.com Premium Free!
You May Also Be Interested In
- Interra Provides Rip Copper Molybdenum Project Exploration Update
- Melco reaffirms commitment to sustainability in 2023 RISE to go Above & Beyond report
- Biotricity's Path Towards Breakeven Accelerated by Latest Diagnostic Product, Biotres Pro, Garnering Rapid Interest from Existing and New Customers
Create E-mail Alert Related Categories
SEC FilingsSign up for StreetInsider Free!
Receive full access to all new and archived articles, unlimited portfolio tracking, e-mail alerts, custom newswires and RSS feeds - and more!
