

Form 8-K INTERNATIONAL BUSINESS For: Jul 18
 Tweet
Tweet Share
Share
UNITED STATES
SECURITIES AND EXCHANGE COMMISSION
WASHINGTON, D.C. 20549
FORM 8-K
CURRENT REPORT PURSUANT TO SECTION 13 OR 15 (d)
OF THE SECURITIES EXCHANGE ACT OF 1934
Date of Report: July 18, 2016
(Date of earliest event reported)
INTERNATIONAL BUSINESS MACHINES
CORPORATION
(Exact name of registrant as specified in its charter)
|
New York |
|
1-2360 |
|
13-0871985 |
|
(State of Incorporation) |
|
(Commission File Number) |
|
(IRS employer Identification No.) |
|
ARMONK, NEW YORK |
|
10504 |
|
(Address of principal executive offices) |
|
(Zip Code) |
914-499-1900
(Registrant’s telephone number)
Check the appropriate box below if the Form 8-K filing is intended to simultaneously satisfy the filing obligation of the registrant under any of the following provisions:
o Written communications pursuant to Rule 425 under the Securities Act (17 CFR 230.425)
o Soliciting material pursuant to Rule 14a-12 under the Exchange Act (17 CFR 240.14a-12)
o Pre-commencement communications pursuant to Rule 14d-2(b) under the Exchange Act (17 CFR 240.14d-2(b))
o Pre-commencement communications pursuant to Rule 13e-4(c) under the Exchange Act (17 CFR 240.13e-4(c))
Item 7.01. Regulation FD Disclosure
Exhibit 99.1 of this Form 8-K contains the prepared remarks for IBM’s Chief Financial Officer Martin Schroeter’s second quarter earnings presentation to investors on July 18, 2016.
Reconciliations of non-GAAP financial measures discussed in the earnings presentation to the most directly comparable financial measures calculated and presented in accordance with GAAP are included as Exhibit 99.2 of this Form 8-K. The slides used in Mr. Schroeter’s second quarter earnings presentation are Exhibit 99.3 to the company’s Form 8-K submitted to the SEC on July 18, 2016.
The information in this Item 7.01, including the corresponding Exhibits 99.1 and 99.2, is being furnished with the Commission and shall not be deemed “filed.”
Item 9.01 Financial Statements and Exhibits.
(d) Exhibits
The following exhibits are being furnished as part of this report:
|
Exhibit No. |
|
Description of Exhibit |
|
99.1 |
|
Prepared Remarks of Earnings Presentation on July 18, 2016 |
|
99.2 |
|
Non-GAAP Supplemental Materials |
IBM’s web site (www.ibm.com) contains a significant amount of information about IBM, including financial and other information for investors (www.ibm.com/investor/). IBM encourages investors to visit its various web sites from time to time, as information is updated and new information is posted.
SIGNATURE
Pursuant to the requirements of the Securities Exchange Act of 1934, the registrant has duly caused this report to be signed on its behalf by the undersigned, hereunto duly authorized.
|
Date: July 19, 2016 |
|
|
|
|
|
|
|
|
By: |
/s/ Stanley J. Sutula III |
|
|
|
|
|
|
|
Stanley J. Sutula III |
|
|
|
Vice President and Controller |
Exhibit 99.1
Introduction
Thank you. This is Patricia Murphy, Vice President of Investor Relations for IBM. I’m here today with Martin Schroeter, IBM’s Senior Vice President and Chief Financial Officer. I’d like to welcome you to our second quarter earnings presentation.
The prepared remarks will be available within a couple of hours, and a replay of the webcast will be posted by this time tomorrow.
I’ll remind you that certain comments made in this presentation may be characterized as forward looking under the Private Securities Litigation Reform Act of 1995. Those statements involve a number of factors that could cause actual results to differ materially. Additional information concerning these factors is contained in the company’s filings with the SEC. Copies are available from the SEC, from the IBM web site, or from us in Investor Relations.
Our presentation also includes certain non-GAAP financial measures, in an effort to provide additional information to investors. All non-GAAP measures have been reconciled to their related GAAP measures in accordance with SEC rules. You will find reconciliation charts at the end of the presentation, and in the Form 8-K submitted to the SEC.
So with that, I’ll turn the call over to Martin Schroeter.
Overview
Thanks Patricia. In the second quarter, we generated $20.2 billion in revenue, $3½ billion in pre-tax income, and $2.95 of operating earnings per share.
Ninety days ago, we told you what we expected for the second quarter. We said we’d continue to see strength in the Strategic Imperatives, and we delivered 12 percent revenue growth, led by cloud. We said we’d continue to build as-a-Service capabilities. Our cloud-as-a-Service revenue was up 50 percent, and we exited the quarter with an annual run rate of $6.7 billion in our cloud as-a-Service businesses. That’s up from $5.4 billion last quarter. Certainly we have a benefit from the acquisitions recently closed, but we had solid organic growth as well. We said we’d continue a high level of investment, as we move into new areas and build new markets, and we did that, both organically, and through acquisitions. And we said that given seasonality and actions we took in the first quarter, we’d grow our pre-tax income by about $2 billion quarter to quarter, and we grew a bit more than that.
In total, we got done what we set out to do, and we saw some improvements in trajectory relative to long term trends, though as always, the rate and pace varied by business unit and geography. Let me touch quickly on some of the drivers for the quarter.
As I said, we continued to deliver double-digit revenue growth in our Strategic Imperatives. Over the last twelve months Strategic Imperatives delivered $31 billion in revenue, and now represent 38 percent of IBM. Growth was led by cloud, where our revenue was up 30 percent to $3.4 billion in the quarter, and over $11½ billion over the last year. So good progress in cloud.
Looking at revenue from a segment perspective, the strongest growth came from Cognitive Solutions, led by our analytics and cognitive capabilities, and security. In Technology Services and Cloud Platforms, our Infrastructure Services revenue continues to grow, while Integration
Software declined as we shift those offerings to cloud. And our GTS backlog grew on the back of strong signings. Our Systems business again reflects the product cycle dynamics in terms of revenue and margin. And Global Business Services continues to reflect a shift in our business. We’re continuing to deliver double-digit growth in the strategic areas led by mobile and cloud, and our Application Management business is stable, though pressure in the more traditional areas of consulting, and some inconsistency in our execution, continue to impact the GBS results.
As we shift IBM’s business overall, it’s important to understand that we’re not only moving into new spaces, but in fact creating entirely new markets. So as I said, we’re investing at a high level, both by growing organic investment in areas like our Watson platform capabilities and our cloud datacenter capacity, and getting acquisitions into our run rate.
Our investments, together with currency, product cycle dynamics and the actions we took in the first quarter are reflected in our profit performance in the first half of this year. I’ll talk about how the second half plays out relative to the first later in the call, as we continue to expect to deliver at least $13.50 of operating earnings per share for the year.
Becoming a Cognitive Solutions & Cloud Platform Company
Let me spend a minute on what we got done as we move into new areas and become a cognitive solutions and cloud platform company.
Clients are looking to become digital businesses, and our cognitive solutions bring together digital business with digital intelligence, to improve decision making and add intelligence into all products and processes. For example, companies such as Kimberly-Clark, The ISS Group, and Sesame Workshop announced in the second quarter they are working with IBM on innovative Internet-of-Things solutions for everything from facilities management, to early childhood education. Healthcare organizations such as the UK’s National Health Service, and the US Department of Veterans Affairs and the American Diabetes Association were among many in the quarter that announced they are leveraging Watson to create new approaches to treatment and patient care. And in the second quarter we announced Watson for Cyber Security, a new cloud-based version of our cognitive technology trained on the language of security.
What these innovative client initiatives have in common is that they are industry-based cognitive solutions, enabled by the IBM Cloud, and all of this is supporting the movement of our clients to hybrid environments. This quarter we extended our Cloud innovations available on Bluemix, including the first Apache Spark development environment for data scientists to more quickly and easily analyze big data. We delivered new IoT services using Bluemix OpenWhisk, our event-driven programming model, to speed development of IoT applications on the IBM Cloud. We announced Blockchain agreements with banks such as Mizuho and Credit Mutuel Arkea, and we opened a Bluemix Garage in New York City to help financial services clients rapidly design, build and pilot their own Blockchain solutions, as well as other emerging Fintech applications and services. We leveraged recent acquisitions in Clearleap, Cleversafe and Ustream to announce new Video-on-demand services deals with major brands such as Mazda, the Canadian Broadcasting Corporation, and Comic-Con.
We also continued to partner with major IT industry players, leveraging IBM’s unique hybrid platform to grow and extend their own offerings and client migrations. For example, we announced that IBM Cloud would be a strategic partner of Box Zones in Europe and Asia. Box Zones and the IBM Cloud will uniquely enable clients to store and manage data across hybrid environments in the country of their choice. And we expanded our global partnership with VMware to deliver desktop services in a security-rich environment on the IBM Cloud.
We also announced a breakthrough in making quantum computing available in the IBM Cloud. The IBM Quantum Experience is a great example of how cloud is making emerging technologies available, that wouldn’t have been accessible in the past. This kind of open innovation will allow for the next stage of development in quantum information technology and help push a universal quantum computer to reality even faster. Now quantum isn’t a new idea, researchers have been working on it for a long time, but it’s not a niche either. On the day we announced it, it generated 138 million Twitter impressions, and to give you a sense of that level of interest, it’s fewer than Andy Murray when he won Wimbledon, but it’s more than the impressions generated by Phil Mickelson’s record-tying score in the first round of The Open last Thursday. Since the launch in May, we already have active users in nearly 150 countries that have run more than 175 thousand experiments through the IBM Quantum Experience.
As we move into new areas, we’re also continuing to deliver innovation in the core. For example in infrastructure services we’re shifting from being a systems integrator to a services integrator, connecting and streamlining multiple environments and delivering as-a-service solutions to our clients. You see this in our recent engagements with Pratt & Whitney and Emirates. To help systems innovation, this quarter we acquired EZSource, to help developers quickly and easily update mainframe applications. And in software, we entered into an agreement with a strategic partner to license the intellectual property of some of our assets within our core software portfolio to accelerate product innovation and extend the capabilities to
hybrid cloud.
I’ll expand on some of these solutions and go into more detail on our Strategic Imperatives performance in the segment discussions. But first, let me walk through our financial metrics for the quarter.
Key Financial Metrics
Our revenue for the quarter was $20.2 billion. While there was a lot of movement in individual currencies, in total, currency translation had a 20 basis point impact to revenue growth. I’ll talk to our performance at constant currency.
Our revenue was down 2½ percent, and on a geographic basis, Americas was down two. This was an improvement from last quarter’s rate, across the US, Canada, and Latin America. Europe was weaker, due primarily to Germany and Switzerland, and Asia Pacific was down about 2 percent. And with strong growth in India once again, and sequential improvement in all of the BRIC countries, the BRICs returned to growth.
Our gross margin performance reflects higher levels of investment, especially in Cognitive Solutions, and the fact that we’re building scale in our as-a-Service businesses.
Looking at expense on a year-to-year basis, there are a few items to note. First is an increase in investment levels. We also have a higher level of IP income this quarter, due primarily to the licensing partnership I just mentioned. And while not an impact to this year, we did have workforce rebalancing charges last year, as well as some gains that mitigated those charges. And finally, we have a year-to-year impact from currency, as last year’s hedging gains roll off. In fact, at a PTI level, when you consider both the hedge and the translation impact, currency impacted profit growth by about $250 million.
Our tax rate for the quarter was 19 percent all in, at the higher end of the range we provided at the beginning of the year which you’ll remember was 18 percent, plus or minus a couple of points, without discrete items.
From a cash perspective, we generated over $2 billion of free cash flow in the quarter and more than $13 billion over the last 12 months. This is over 100 percent of our GAAP net income. And over the same period, we
returned about 70 percent of our free cash flow to shareholders through dividends and gross share repurchases.
Cognitive Solutions Segment
As we get into the segments, remember our strategy and point of view is that to be successful, you need to bring together cognitive solutions to improve decision making and outcomes, to approach that with an industry context and skills, and to enable that in a hybrid environment, to get the agility of the cloud, while leveraging the breadth of an enterprises’ data and processes.
Now I’ll talk about how each of our segments plays a critical role in how we capture these opportunities, starting with our Cognitive Solutions segment, where revenue growth accelerated to 4 percent in the second quarter. We had sequential improvement in both Solutions Software and Transaction Processing Software. Our Solutions Software revenue was up 6 percent for the quarter. Our strong performance in SaaS continued, with double-digit growth in revenue. Growth was led by analytics and security, and acquisitions clearly provided lift.
Our Analytics business is the largest portion of the Solutions Software portfolio. Analytics grew in key areas, including Cognos, Information Integration, and Big Data, and of course Watson, as we add to our capabilities. The Weather Company acquisition is off to a good start as we integrate it with Watson technology. In June, we introduced Watson Ads, leveraging the weather platform, which delivers as many as 26 billion forecasts daily. Consumers will be able to interact with IBM Watson through advertising, by asking questions and receiving relevant product information. Campbell, Unilever and GSK Consumer Healthcare will be the first marketers to collaborate with The Weather Company on Watson Ads.
Security had strong revenue growth, and together with our security services, we outpaced the market by 3X. Our momentum is driven by our unique market position. We have built an extensive security portfolio, tailored to the needs of our clients for integrated security across their entire operations. As a result we are the number one enterprise security software and services provider, and hold a leadership position in 12 of the 14 segments according to Forrester, IDC and Gartner. This quarter, we
closed our Resilient acquisition, adding leading incident response technology and expertise to our portfolio. We had strong demand for our Guardium offerings as we saw clients moving to our database security offerings across a range of industries, including information services and banking. And in May, we announced Watson for Cyber Security, a new cognitive system we have been training and will make available in a beta program later this year for use by our customers. As part of this announcement, eight leading universities will also train Watson in the language of security.
We are growing and broadening the reach of Watson, with new capabilities, partnerships and engagements to accelerate adoption. Clients across industries are expanding their Watson engagements, moving from pilot use cases and consulting engagements, into long term production. As an example, in the second quarter, design software leader Autodesk signed a multi-year production SaaS agreement with Watson to leverage Watson Engagement Advisor. This engagement builds on the value and strong usage proven during the pilot to resolve customer inquiries. This is one demonstration of our focus on the core conversational service for client applications and the developer community. We also introduced new offerings such as Watson Company Analyzer, which helps companies reduce the time and effort required to collect, digest and synthesize information for building strategic business relationships and understanding competitive market spaces.
And in Watson Health we continue to capitalize on our differentiated ability to understand, reason and learn with industry-specialization. We launched Watson Care Manager, which provides structured programs and tools to support care coordinators in delivering care to patients. This offering enables patients to avoid re-hospitalization. In the second quarter, we extended partnerships with the American Cancer Society and the American Diabetes Association, which are examples of the strong support and momentum Watson Health has with leading clinical and research communities. And at the White House Cancer Moonshot summit, we made a commitment to utilize our cognitive solutions to help doctors offer personalized care to 10,000 veterans fighting cancer. We are working with
Teva, a large pharmaceuticals client to improve drug efficacy for millions of patients with complex and chronic diseases by leveraging the IBM Watson Health Cloud solution. We formed a medical imaging collaborative with 15 industry leaders to put Watson to work extracting insights from “invisible” unstructured imaging data. And in April, we closed the Truven acquisition. The data and insights from Truven will be integrated into our Watson Health Cloud.
So now looking at the profit results for the segment, gross margin was down, largely driven by mix shift to SaaS and higher investments including acquisition content. Pre-tax income performance continues to reflect our higher level of investment in strategic growth areas like Watson Platform, Health, and IoT again this quarter.
Global Business Services Segment
Global Business Services delivered $4.3 billion of revenue. Our performance was similar to recent quarters, with continued growth in our Strategic Imperatives, offset by declines in the more traditional consulting areas.
We saw double-digit growth in our digital practices around cloud, analytics, mobility, security, and cognitive, and we continue to aggressively shift resources and investments to drive these businesses. Our GBS team leads the industry mission for IBM, as we’ve amassed over a hundred thousand industry resources. Our consultants build strategies that help our clients gain new insights on data, and launch new business models for competitive advantage. We are scaling the industry’s first cognitive consulting practice which draws on the expertise of more than 2,000 consulting professionals spanning machine learning, advanced analytics, data science and development.
We continue to ramp the IBM Interactive Experience. We’ve opened over 30 digital studios around the globe, including new studios in Singapore and Seoul. We also completed the acquisition of Aperto, a digital agency in Berlin with over 300 employees and a roster of enterprise clients such as Airbus and Siemens.
We’re shifting away from traditional on-premise ERP to cloud-based application management and consulting. We closed on the acquisition of Bluewolf this quarter, a top Salesforce partner and recognized leader in cloud consulting and implementation services. We’re also growing our services on Workday applications, leveraging the skills we brought on through our Meteorix acquisition last year. Overall, we delivered 60 percent growth in our cloud practice this quarter.
Application Management remains stable as clients look to us to manage the life-cycle of their applications, and bring new applications to market faster through digital cloud platforms.
Turning to profit, GBS gross profit and PTI margins are down year to year. These margin declines reflect the investments we are making in our digital
practices, as well as some issues in our execution. And, in some of the traditional services areas that are not as differentiated, we are seeing price and profit pressure. We continue to invest and shift resources to our higher value services around digital and cognitive. We are also taking actions to improve our delivery efficiency and execution, while remaining focused on our commitment to our clients’ success.
Technology Services & Cloud Platforms Segment
Technology Services and Cloud Platforms delivered nearly $9 billion of revenue, with growth in Infrastructure Services offset by declines in Technical Support Services and Integration Software. Across the segment, our Strategic Imperatives were also up strong double digits.
We had strong signings performance in GTS, and the backlog for the segment continued to grow.
We saw continued momentum in Infrastructure Services as clients turn to us to optimize their IT environments, and move them to cloud. We again had strong growth in the IBM Cloud. Our point of view is that clients can unlock the most value for their businesses by moving to hybrid cloud infrastructures, which provide agility and enable new business models, while at the same time tie back to their core systems of record. We always said that hybrid capabilities are critical for an enterprise-grade cloud, and we continue to lead in the rapidly growing hybrid cloud market.
We’re shifting from systems integration to services integration as we connect multiple environments and build-out hybrid infrastructures, delivered as-a-service to the client. Our as-a-Service revenue for the segment was up over 50 percent for the quarter. We continue to sign transformative agreements with clients to optimize their infrastructure, and help digitize their operations. At Pratt & Whitney, we’ll move their business, manufacturing, and engineering enterprise systems to a fully-managed environment on the IBM Cloud. They are expecting to double their engine production by 2020, and we’ll provide them with the means to manage, analyze, and grow their infrastructure dramatically to accommodate the company’s growth. And this quarter we signed a 7-year, $1.3 billion agreement with CSC to expand our cloud partnership and build a secure, scalable, and flexible mainframe infrastructure that will enable CSC to economically scale up and down demand to address current and future client needs, and reduce its capital outlays. This builds on an announcement earlier this year that integrated Bluemix into their cloud management platform.
Bluemix provides our clients with speed and agility in launching new business models and applications in the cloud, and along with the rest of the Integration Software portfolio, is at the heart of our hybrid cloud strategy.
Overall, Integration Software revenue declined. From a product perspective, we had continued strength in our Connect products, as clients integrate applications, data, and processes, for both on-prem and cloud-based applications. Across Integration Software, our annuity content is growing, and we accelerate the shift to an as-a-Service consumption model through new cloud capabilities delivered on our Bluemix cloud platform. For example, this year, Kaiser Permanente began its move to the IBM Cloud and Bluemix as the strategic platform for their transformation to a more agile, data-driven organization, engaging with millions of individual members and patients. This will allow them to take advantage of new technologies, existing data, and back-end systems in a hybrid model.
Turning to profit, our gross profit was down year-to-year driven by the mix of businesses within the segment. Our PTI margin also reflects this business mix impact, as well as the investments we are making to build out our cloud platforms. Additionally, this quarter we entered into an agreement with one of our strategic business partners where we will license the intellectual property of select assets within the Integration Software portfolio while jointly going to market to ensure our clients success. This will shift our spending profile for these assets to a more variable cost structure going forward.
Systems Segment
Systems revenue was down consistent with the cycle. Our Systems hardware revenue was down 28 percent. Operating Systems software revenue was down 4 percent this quarter, which is a modest sequential improvement in year-to-year performance, but as we said we expect Operating Systems to continue to be a drag on growth.
Revenues for our zSystems declined 40 percent in the second quarter, while margins improved, consistent with where we are in the product cycle. We’re continuing to expand the z client base, adding 13 new clients in the quarter, and nearly 70 since the beginning of the cycle. We had our first major z13 win in China this quarter, with a large Chinese bank migrating its mainframe install base to our latest technology. We are continuing to drive innovation in the zSystems platform. As I mentioned earlier, we acquired EZSource which will help our clients modify applications for their digital transformation, while also supporting agility and hybrid cloud.
Power revenue was down in the second quarter, with growth in the midrange offset by declines in the high and the low end. The Unix market is a high-value space that has been declining, and we represent the majority of the market. Our performance here reflects the replacement dynamic, following strong performance in the high end of Power 8 in the second quarter of last year. While the midrange has been growing year-to-year, we will see a similar replacement dynamic in the third quarter, as we wrap on the mid-range Power 8 introduction. We’re also addressing the growing Linux market, and this quarter we grew year to year and quarter to quarter with our Linux on Power strategy. It is becoming a more meaningful part of our business, with over 10 percent of our Power revenue in the second quarter. We’ve seen particular success with HANA, a play that we started a year ago. We will expand the Linux-only portfolio. By leveraging OpenPOWER, we plan to bring two new servers supporting cloud-enabled big data and cognitive applications to our portfolio, and release our second generation HPC server with POWER8 processors connected to NVIDIA GPU acceleration.
Turning to Storage, as we said in the past, storage value is shifting to software, which is reported in our Cognitive Solutions segment. In Storage software, we’re continuing to grow Software-Defined Storage, which includes Object Storage and our newly introduced Spectrum Suite offerings. Storage hardware revenue decreased 13 percent, which continues to reflect weakness in the traditional disk storage market. We released the new all-flash DS8K storage offering during the second quarter giving us competitive differentiation, with plans to deliver all-flash offerings across the entire portfolio.
Our Systems gross profit and pre-tax income declined, reflecting the revenue performance. Our Systems gross profit margin was flat, with margin improvements in both zSystems and Power, offset by lower Storage margins and the impact of mix.
Software
So now after going through the segments I want to address the performance of software across our segments. Our total software revenue was up 1 percent, driven by an acceleration in the annuity content. Subscription and support revenue was up, reflecting increased deployment by our clients, and steady renewal rates. And the investments in new areas are paying off with growth in SaaS. Acquisitions contributed to that growth, and we also grew our annuity base on an organic basis. I’ll remind you that while these SaaS acquisitions add to the top line, they’re a drag to profit in the first year. Looking at annuity growth by business area, we had strong growth in Cognitive Solutions, as well as Integration Software, while the annuity content in Operating Systems declined.
Cash Flow & Balance Sheet Highlights
Turning to cash flow and the balance sheet, we generated $3.1 billion of cash from operations, excluding our financing receivables. After a billion dollar investment in capex, we generated $2.1 billion of free cash flow in the quarter.
For the first half, free cash flow of nearly $4½ billion is essentially flat year to year, with lower cash taxes offsetting the year-to-year operational performance.
These first half results support our expectation that we will deliver the high end of the full year free cash flow guidance range we provided earlier this year. This takes into account the cash payments related to the workforce rebalancing charge taken early in the year, as well as the timing of tax payments in the second half.
Looking at the uses of cash in the first half, we have invested $5.4 billion in acquisitions. So far this year we have acquired eleven businesses, including Truven Health Analytics and the digital assets of The Weather Company. In the last six months, we’ve returned $4.4 billion to shareholders, including $2.6 billion in dividends. In April, we again raised our dividend, and with that we’ve now doubled our dividend per share since 2010. In the first half we bought back over 12 million shares, and we ended June with 956 million shares outstanding, and $3.9 billion remaining in our buyback authorization.
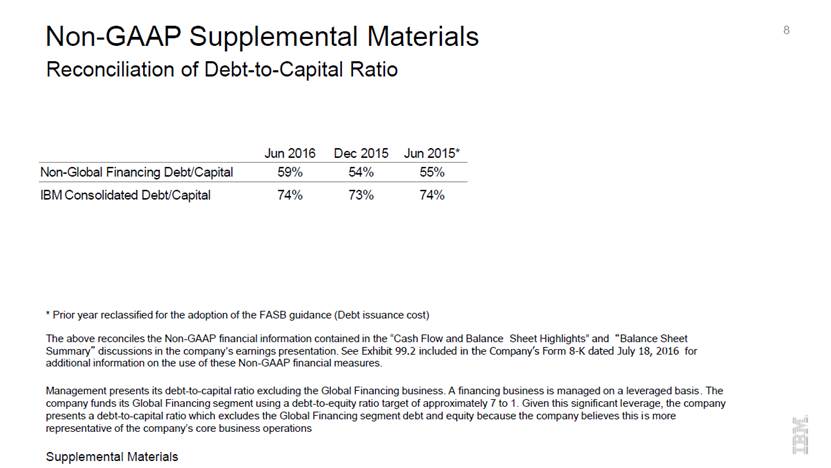
Moving to the balance sheet, we ended June with $10.6 billion in cash. Our total debt was about $44.5 billion, of which 26½ billion was in support of our financing business.
The leverage in our financing business remains at 7 to 1, and the portfolio remains strong at 52 percent investment grade. You can see more on this topic in our supplemental material in the backup.
Our non-financing debt was $18 billion, and our non-financing debt-to-cap was 59 percent. The increase in both reflect the timing of our debt issuances relative to maturities this year.
Our balance sheet continues to have the financial flexibility to support our business over the long term.
2016 EPS Drivers
So now let me wrap up and talk about our view of the second half, and put it in context of the first half performance. We thought we’d lay it out on a slide for you.
You’ll recall in the first quarter we took significant actions to transform our workforce and change the way we work, resulting in significant workforce rebalancing and real estate charges. As we’ve said, this is about rebalancing skills more than capacity reduction, and so these actions free up spend that can be reinvested to build capabilities, as well as contributing to the bottom line. We have started to see some savings already, but the majority of the gross savings we’ll see in 2016 will come in the fourth quarter. We mapped all of that out in our last call, and we’re right on track.
As expected, our mainframe product cycle also had an impact to our EPS growth in the first half. As we enter the second half, our mainframe compares will get easier, in fact, we expect mainframe to be fairly neutral to EPS growth.
Over the last twelve months, we’ve been investing at a high level, both organically, and through acquisitions, as we build cognitive and cloud capabilities. The organic investments had a mid-single-digit impact on our EPS growth. As we wrap on the higher level of spend in the back half of last year, this will have less of an impact on EPS growth over the next 2 quarters. We’ve completed 20 acquisitions over the last year. The acquired content is contributing to our top line, and will continue to do so in the second half. Because these are primarily as-a-Service capabilities, and require additional investment as we create new spaces, they have a return profile with a longer payback. The acquisitions we’ve completed to date had a low-single-digit impact to our EPS growth rate in the first half. They’ll continue to be dilutive in the second half, though at a lower level. Many of these new capabilities are delivered as-a-Service. As these ramp, it’ll benefit our second half relative to the first, not only from a software mix perspective, but adding scale will also help our margins.
And of course we’ve talked about the impact of currency on our profit growth in 2016, due primarily to the roll-off of last year’s hedging gains. We can’t predict where currency will go from here, but at current spot rates the impact from currency will moderate in the second half due to year-to-year hedging dynamics, and a slightly better translational environment.
And finally, you’ll recall we had a significant discrete tax benefit in the first quarter. Relative to the ongoing effective tax rate, we continue to expect to be in the range we provided at the beginning of the year.
Put it all together, and we expect our second half EPS dynamics to be significantly improved over the first, and continue to expect to deliver at least $13.50 of operating EPS for the year.
Summary
So with that financial context to our second half, from a business perspective we’ll continue to focus on using cognitive to help clients get value from their data to improve decision making and outcomes, moving our clients to hybrid cloud environments, and with a strong industry dimension. As we do that, we’re moving into new spaces, and in some cases, creating entirely new markets.
We’ll continue to shift our business toward our Strategic Imperatives, with strong growth in our as-a-Service offerings, and continued growth in software. And we’ll continue to invest to add capabilities, and to deliver innovation across the business, all while returning value to shareholders.
And so with that, we’ll take your questions.
Closing
Thank you, Martin. Before we begin the Q&A I’d like to mention a couple of items. First, we have supplemental charts at the end of the slide deck that provide additional information on the quarter. And second, I’d ask you to refrain from multi-part questions. So let’s please open it up for questions.
Exhibit 99.2
IBM 2Q 2016 Earnings Non GAAP Supplement Materials July 18, 2016 ibm.com/investor
Reconciliation of Operating Earnings Per Share 2 Non-GAAP Supplemental Materials * Includes acquisitions through June 30, 2016 The above reconciles the Non-GAAP financial information contained in the “Overview“ and “2016 EPS Drivers” discussions in the company’s earnings presentation. See Exhibit 99.2 included in the Company’s Form 8-K dated July 18, 2016 for additional information on the use of these Non-GAAP financial measures. Supplemental Materials 2016 EPS Guidance Expectations IBM GAAP EPS at least $12.23 IBM Operating EPS (Non-GAAP) at least $13.50 Adjustments Acquisition Related Charges* $0.84 Non-Operating Retirement-Related Items $0.43
Reconciliation of Revenue Growth-2Q 2016 3 Non-GAAP Supplemental Materials The above reconciles the Non-GAAP financial information contained in the “Geographic Revenue” discussions in the company’s earnings presentation. See Exhibit 99.2 included in the Company’s Form 8-K dated July 18, 2016 for additional information on the use of these Non-GAAP financial measures. Supplemental Materials GAAP @CC Americas (3%) (2%) Europe/ME/Africa (4%) (4%) Asia Pacific 1% (2%) U.S. (2%) (2%) Japan 13% 0% Growth Markets (8%) (3%) 2Q16 Yr/Yr
Reconciliation of Revenue Growth-2Q 2016 4 Non-GAAP Supplemental Materials The above reconciles the Non-GAAP financial information contained in the “Becoming a Cognitive Solutions & Cloud Platform Company” discussions in the company’s earnings presentation. See Exhibit 99.2 included in the Company’s Form 8-K dated July 18, 2016 for additional information on the use of these Non-GAAP financial measures. Supplemental Materials GAAP @CC Strategic Imperatives 12% 12% Analytics 5% 4% Cloud 30% 30% Mobile 43% 43% Security 18% 18% Social (15%) (15%) 2Q16 Yr/Yr
Reconciliation of Revenue Growth-2Q 2016 5 Non-GAAP Supplemental Materials The above reconciles the Non-GAAP financial information contained in the “Segment Revenue & Gross Profit”, “Additional Revenue & Backlog Information”, “Cognitive Solutions Segment”, “Global Business Services Segment”, “Technology Services & Cloud Platforms Segment” ,“Systems Segment” and “Software Revenue” discussions in the company’s earnings presentation. See Exhibit 99.2 included in the Company’s Form 8-K dated July 18, 2016 for additional information on the use of these Non-GAAP financial measures. Supplemental Materials GAAP @CC GAAP @CC Cognitive Solutions 4% 4% Tech Svcs & Cloud Platforms Flat Flat Solutions Software 6% 6% Global Technology Services 1% 1% Transaction Processing Software (1%) (1%) Infrastructure Services 2% 2% Strategic Imperatives 9% 9% Technical Support Services (3%) (2%) Cloud 54% 55% Integration Software (8%) (8%) Global Business Services (2%) (3%) Strategic Imperatives 35% 35% Consulting (4%) (5%) Cloud 43% 43% Global Processing Services (4%) (3%) Systems (23%) (23%) Application Management (0%) (1%) Systems Hardware (28%) (28%) Strategic Imperatives 14% 13% z Systems (40%) (40%) Cloud 63% 60% Power (24%) (24%) Storage (13%) (13%) Cognitive Solutions & Industry Svcs 1% 1% Operating Systems Software (5%) (4%) Strategic Imperatives (14%) (14%) Cloud (11%) (11%) Global Financing (11%) (10%) Total Software 1% 1% 2Q16 Yr/Yr 2Q16 Yr/Yr
Reconciliation of Expense Summary-2Q 2016 6 Non-GAAP Supplemental Materials The above reconciles the Non-GAAP financial information contained in the “Expense Summary” discussions in the company’s earnings presentation. See Exhibit 99.2 included in the Company’s Form 8-K dated July 18, 2016 for additional information on the use of these Non-GAAP financial measures. Supplemental Materials Non-GAAP Operating GAAP Adjustments (Non-GAAP) SG&A Currency 0 pts 0 pts 0 pts Acquisitions (5 pts) 2 pts (4 pts) Base 2 pts 0 pts 2 pts RD&E Currency 1 pts 0 pts 1 pts Acquisitions (8 pts) (0 pts) (8 pts) Base (5 pts) (0 pts) (6 pts) Operating Expense & Other Income Currency (3 pts) (0 pts) (4 pts) Acquisitions (6 pts) 1 pts (5 pts) Base 2 pts 0 pts 2 pts
Reconciliation of Software Revenue Growth – 2Q 2016 7 Non-GAAP Supplemental Materials The above reconciles the Non-GAAP financial information contained in the “Software Revenue” discussions in the company’s earnings presentation. See Exhibit 99.2 included in the Company’s Form 8-K dated July 18, 2016 for additional information on the use of these Non-GAAP financial measures. Supplemental Materials GAAP @CC Transactional (15%) (15%) Annuity (Total Software) 6% 7% Cognitive Solutions Annuity 8% 9% Integration Software Annuity 2% 2% Operating Systems Annuity (5%) (4%) 2Q16 Yr/Yr
8 Non-GAAP Supplemental Materials Reconciliation of Debt-to-Capital Ratio Supplemental Materials Jun 2016 Dec 2015 Jun 2015* Non-Global Financing Debt/Capital 59% 54% 55% IBM Consolidated Debt/Capital 74% 73% 74% The above reconciles the Non-GAAP financial information contained in the “Cash Flow and Balance Sheet Highlights” and “Balance Sheet Summary” discussions in the company’s earnings presentation. See Exhibit 99.2 included in the Company’s Form 8-K dated July 18, 2016 for additional information on the use of these Non-GAAP financial measures. Management presents its debt-to-capital ratio excluding the Global Financing business. A financing business is managed on a leveraged basis. The company funds its Global Financing segment using a debt-to-equity ratio target of approximately 7 to 1. Given this significant leverage, the company presents a debt-to-capital ratio which excludes the Global Financing segment debt and equity because the company believes this is more representative of the company’s core business operations * Prior year reclassified for the adoption of the FASB guidance (Debt issuance cost)
9 Reconciliation of Free Cash Flow-Last 12 Months Non-GAAP Supplemental Materials The above reconciles the Non-GAAP financial information contained in the “Overview”, “Key Financial Metrics” and “Cash Flow and Balance Sheet Highlights” discussions in the company’s earnings presentation. See Exhibit 99.2 included in the Company’s Form 8-K dated July 18, 2016 for additional information on the use of these Non-GAAP financial measures. Supplemental Materials $ in billions 12 Months Ended Jun 2016 Net Cash from Operating Activities per GAAP: $18.6 Less: the change in Global Financing (GF) Receivables $1.7 Net Cash from Operating Activities (Excluding GF Receivables) $17.0 Capital Expenditures, Net ($3.9) Free Cash Flow (Excluding GF Receivables) $13.1
Serious News for Serious Traders! Try StreetInsider.com Premium Free!
You May Also Be Interested In
- Midday movers: Meta, IBM, Caterpillar fall; Chipotle rises
- REBELXL - A Revolutionary Reformer Pilates Franchise Announce the Grand Opening of Its First Studio in Wyckoff, New Jersey
- IBM Transforms the Storage Ownership Experience with IBM Storage Assurance
Create E-mail Alert Related Categories
SEC FilingsSign up for StreetInsider Free!
Receive full access to all new and archived articles, unlimited portfolio tracking, e-mail alerts, custom newswires and RSS feeds - and more!
