

Form 8-K PDL BIOPHARMA, INC. For: May 04
 Tweet
Tweet Share
ShareUNITED STATES
SECURITIES AND EXCHANGE COMMISSION
Washington, D.C. 20549
FORM 8-K
CURRENT REPORT
Pursuant to Section 13 or 15(d) of the Securities Exchange Act of 1934
Date of Report (Date of Earliest Event Reported): May 2, 2016
PDL BioPharma, Inc.
(Exact name of Company as specified in its charter)
000-19756
(Commission File Number)
Delaware | 94-3023969 | |
(State or Other Jurisdiction of Incorporation) | (I.R.S. Employer Identification No.) | |
932 Southwood Boulevard
Incline Village, Nevada 89451
(Address of principal executive offices, with zip code)
(775) 832-8500
(Company’s telephone number, including area code)
Check the appropriate box below if the Form 8-K filing is intended to simultaneously satisfy the filing obligation of the Company under any of the following provisions:
¨ Written communications pursuant to Rule 425 under the Securities Act (17 CFR 230.425)
¨ Soliciting material pursuant to Rule 14a-12 under the Exchange Act (17 CFR 240.14a-12)
¨ Pre-commencement communications pursuant to Rule 14d-2(b) under the Exchange Act (17 CFR 240.14d-2(b))
¨ Pre-commencement communications pursuant to Rule 13e-4(c) under the Exchange Act (17 CFR 240.13e-4(c))
Item 2.02 Results of Operations and Financial Condition.
On May 2, 2016, PDL BioPharma, Inc. (the Company) issued a press release announcing its financial results for the first quarter ended March 31, 2016. A copy of this earnings release is furnished hereto as Exhibit 99.1. The Company will host an earnings call and webcast on May 2, 2016, during which the Company will discuss its financial results for the first quarter ended March 31, 2016.
Item 7.01 Regulation FD Disclosure.
Presentation Materials
On May 2, 2016, the Company posted to its website a set of presentation materials that it will use during its earnings call and webcast to assist participants with understanding the Company’s financial results for the quarter ended March 31, 2016. A copy of this presentation is attached hereto as Exhibit 99.2.
Information Sheet
On May 2, 2016, the Company distributed to analysts covering the Company’s securities a summary of certain information regarding the Company’s net income, dividends, recent transactions and licensed product development and sales (the Information Sheet) to assist those analysts in valuing the Company’s securities. The Information Sheet and its associated tables are attached hereto as Exhibit 99.3.
Limitation of Incorporation by Reference
In accordance with General Instruction B.2. of Form 8-K, the information in this report, including the exhibits, is furnished pursuant to Items 2.02 and 7.01 and shall not be deemed to be “filed” for the purpose of Section 18 of the Securities Exchange Act of 1934, as amended, or otherwise subject to the liabilities of that section and shall not be deemed to be incorporated by reference into any filing of the Company under the Securities Act of 1933, as amended or the Exchange Act.
Cautionary Statements
This filing and its exhibits include “forward-looking statements” within the meaning of Section 27A of the Securities Act of 1933, as amended, and Section 21E of the Securities Exchange Act of 1934, as amended. Although we believe that the expectations reflected in the forward-looking statements are reasonable, we can give no assurance that such expectations will prove to be correct. Important factors that could impair the Company’s royalty assets or business are disclosed in the “Risk Factors” contained in the Company’s Annual Report on Form 10-K, filed with the Securities and Exchange Commission. All forward-looking statements are expressly qualified in their entirety by such factors. We do not undertake any duty to update any forward-looking statement except as required by law.
Item 8.01 Other Events.
PDL BioPharma Announces 2016 Second Quarter Dividend
On May 2, 2016, PDL Biopharma, Inc.’s (the Company) board of directors declared a $0.05 per share dividend for the second quarter of 2016. The dividend will be paid on June 13, 2016 to all stockholders who own shares of the Company on June 6, 2016, the record date for the second quarter dividend payment.
On May 4, 2016, the Company issued a press release announcing the dividend for the second quarter of 2016. The press release is attached hereto as Exhibit 99.4 and is incorporated herein by reference.
Item 9.01 Financial Statements and Exhibits.
The following exhibits are furnished with this report:
Exhibit No. | Description | |
99.1 | Press Release | |
99.2 | Presentation | |
99.3 | Information Sheet | |
99.4 | Press Release | |
SIGNATURES
Pursuant to the requirements of the Securities Exchange Act of 1934, the Company has duly caused this report to be signed on its behalf by the undersigned hereunto duly authorized.
PDL BIOPHARMA, INC. | ||
(Company) | ||
By: | /s/ Peter S. Garcia | |
Peter S. Garcia | ||
Vice President and Chief Financial Officer | ||
Dated: May 4, 2016
Exhibit Index
Exhibit No. | Description | |
99.1 | Press Release | |
99.2 | Presentation | |
99.3 | Information Sheet | |
99.4 | Press Release | |
Exhibit 99.1
Contacts: | ||
Peter Garcia | Jennifer Williams | |
PDL BioPharma, Inc. | Cook Williams Communications, Inc. | |
775-832-8500 | 360-668-3701 | |
PDL BioPharma Announces First Quarter 2016 Financial Results
INCLINE VILLAGE, NV, May 2, 2016 – PDL BioPharma, Inc. (PDL) (NASDAQ: PDLI) today reported financial results for the first quarter ended March 31, 2016 including:
• | Total revenues of $103.1 million for the first quarter of 2016. |
• | Non-GAAP diluted earnings per share (EPS) of $0.52 increased approximately 11 percent versus the same period in 2015. |
• | Non-GAAP net income increased 7 percent to $84.8 million. |
• | GAAP diluted EPS of $0.34, decreased by 32 percent compared to the same period of 2015. |
• | GAAP net income decreased by 34 percent to $55.9 million. |
The largest component of the difference in non-GAAP measure compared to GAAP is the exclusion of mark-to-market adjustments related to the fair value election of our investments in royalty rights. A full reconciliation of all components of the GAAP to Non-GAAP quarterly financial results can be found in Table 4 at the end of this release.
Revenue Highlights
• | Total revenues of $103.1 million for the quarter ended March 31, 2016 included: |
◦ | Royalties from PDL's licensees to the Queen et al. patents of $121.5 million, which consisted of royalties earned on sales of products under license agreements associated with the Queen et al. patents; |
◦ | Net royalty payments from acquired royalty rights and a change in fair value of the royalty rights assets of negative $27.1 million, which consisted of revenues associated with the change in estimated fair value of our royalty right assets and primarily related to the Depomed, Inc. royalty rights acquisition; |
◦ | Interest revenue from notes receivable debt financings to late-stage healthcare companies of $9.0 million; and |
◦ | License and other revenues of negative $0.2 million, which consisted of a negative $0.3 million mark-to-market adjustments on warrants held and, a realized gain of $0.1 million from the sale of PDL's investment in AxoGen Inc. common stock. |
• | Total revenues decreased by 31 percent for the first quarter ended March 31, 2016, when compared to the same period in 2015. |
◦ | The decrease in royalties from PDL's licensees to the Queen et al. patents is due to decreased Lucentis® and Actemra® royalties as a result of the conclusion of their license agreements, partially offset by increased royalties from other Queen et al. royalty revenues. |
◦ | PDL expects its revenue from the Queen et al. patents to materially decrease beyond this first quarter of 2016. |
◦ | The decrease in royalty rights - change in fair value was driven by the $47.9 million decrease in the fair value of the Depomed royalty rights assets and is primarily a result of lower than expected cash royalties in the first quarter and an adjustment reducing future cash flows due to lower projected demand data, greater erosion of market share due to the launch of a generic, and higher gross-to-net adjustments for Glumetza. |
◦ | PDL received $17.2 million in net cash royalty payments from its acquired royalty rights in the first quarter of 2016, compared to $0.9 million for the same period of 2015. |
◦ | The decrease in interest revenues was due to reduced interest from Direct Flow Medical, Inc. as a result of ceasing to accrue interest due to the loan being impaired. |
Operating Expense Highlights
• | Operating expenses were $9.8 million for the quarter ended March 31, 2016, compared to $7.7 million for the same period of 2015. |
◦ | The increase in operating expenses for the quarter as compared to the same period in 2015, was a result of an increase in general and administrative expenses of $1.5 million for legal service expenses mostly related to business development activities, the asset management of Wellstat Diagnostics, legal expenses related to a complaint against Merck Sharp & Dohme, Corp, and $0.9 million for compensation, including stock-based compensation, offset in part by a decrease in professional services from asset management expenses. |
Other Financial Highlights
• | PDL had cash, cash equivalents, and short-term investments of $292.0 million at March 31, 2016, compared to $220.4 million at December 31, 2015. |
◦ | The increase was primarily attributable to proceeds from royalty right payments of $17.2 million and cash generated by operating activities of $92.5 million, offset in part by the repayment of a term loan for $25.0 million, payment of dividends of $8.2 million and an additional note receivable purchase of $5.0 million. |
• | Net cash provided by operating activities in the first quarter of 2016 was $92.5 million, compared with $71.8 million in the same period in 2015. |
Recent Developments
• | Q2 2016 Dividends |
◦ | On May 2, 2016, our board of directors declared a quarterly dividend of $0.05 per share of common stock to be paid on June 13, 2016 to stockholders of record on June 6, 2016, the record date of the dividend payment. |
Conference Call and Webcast Details
PDL will hold a conference call to discuss financial results at 4:30 p.m. Eastern Time today, May 4, 2016.
To access the live conference call via phone, please dial (800) 668-4132 from the United States and Canada or (224) 357-2196 internationally. The conference ID is 90724686. Please dial in approximately 10 minutes prior to the start of the call. A telephone replay will be available beginning approximately one hour after the call through May 11, 2016, and may be accessed by dialing (855) 859-2056 from the United States and Canada or (404) 537-3406 internationally. The replay passcode is 90724686.
To access the live and subsequently archived webcast of the conference call, go to the Company’s website at http://www.pdl.com and go to “Events & Presentations.” Please connect to the website at least 15 minutes prior to the call to allow for any software download that may be necessary.
About PDL BioPharma, Inc.
PDL manages a portfolio of patents and royalty assets, consisting of its Queen et al. patents, license agreements with various biotechnology and pharmaceutical companies, and royalty and other assets acquired. To acquire new income generating assets, PDL provides non-dilutive growth capital and financing solutions to late-stage public and private healthcare companies and offers immediate financial monetization of royalty streams to companies, academic institutions, and inventors. PDL has committed over $1 billion and funded approximately $937 million in these investments to date. PDL evaluates its investments based on the quality of the income generating assets and potential returns on investment. PDL is currently focused on acquiring new income generating assets, the management of its intellectual property and income generating assets, and maximizing value for its stockholders.
The Company was formerly known as Protein Design Labs, Inc. and changed its name to PDL BioPharma, Inc. in 2006. PDL was founded in 1986 and is headquartered in Incline Village, Nevada. PDL pioneered the humanization of monoclonal antibodies and, by doing so, enabled the discovery of a new generation of targeted treatments for cancer and immunologic diseases for which it receives significant royalty revenue.
PDL BioPharma and the PDL BioPharma logo are considered trademarks of PDL BioPharma, Inc.
Forward-looking Statements
This press release contains "forward-looking statements" within the meaning of Section 27A of the Securities Act of 1933, as amended, and Section 21E of the Securities Exchange Act of 1934, as amended. Each of these forward-looking statements involves risks and uncertainties. Actual results may differ materially from those, express or implied, in these forward-looking statements. Important factors that could impair the value of the Company's royalty assets, restrict or impede the ability of the Company to invest in new royalty bearing assets and limit the Company's ability to pay dividends are disclosed in the risk factors contained in the Company's Annual Report on Form 10-K, filed with the Securities and Exchange Commission. All forward-looking statements are expressly qualified in their entirety by such factors. We do not undertake any duty to update any forward-looking statement except as required by law.
TABLE 1
PDL BIOPHARMA, INC.
CONDENSED CONSOLIDATED STATEMENTS OF INCOME DATA
(Unaudited)
(In thousands, except per share amounts)
Three Months Ended | ||||||||
March 31, | ||||||||
2016 | 2015 | |||||||
Revenues | ||||||||
Royalties from Queen et al. patents | $ | 121,455 | $ | 127,810 | ||||
Royalty rights - change in fair value | (27,102 | ) | 11,362 | |||||
Interest revenue | 8,964 | 10,534 | ||||||
License and other | (193 | ) | — | |||||
Total revenues | 103,124 | 149,706 | ||||||
Operating Expenses | ||||||||
General and administrative expenses | 9,846 | 7,666 | ||||||
Operating income | 93,278 | 142,040 | ||||||
Non-operating expense, net | ||||||||
Interest and other income, net | 113 | 86 | ||||||
Interest expense | (4,550 | ) | (8,610 | ) | ||||
Total non-operating expense, net | (4,437 | ) | (8,524 | ) | ||||
Income before income taxes | 88,841 | 133,516 | ||||||
Income tax expense | 32,954 | 49,018 | ||||||
Net income | $ | 55,887 | $ | 84,498 | ||||
Net income per share | ||||||||
Basic | $ | 0.34 | $ | 0.52 | ||||
Diluted | $ | 0.34 | $ | 0.50 | ||||
Shares used to compute income per basic share | 163,701 | 162,829 | ||||||
Shares used to compute income per diluted share | 163,835 | 170,412 | ||||||
Cash dividends declared per common share | $ | 0.05 | $ | 0.60 | ||||
TABLE 2
PDL BIOPHARMA, INC.
CONDENSED CONSOLIDATED BALANCE SHEET DATA
(Unaudited)
(In thousands)
March 31, | December 31, | |||||||
2016 | 2015 | |||||||
Cash, cash equivalents and short-term investments | $ | 291,956 | $ | 220,352 | ||||
Total notes receivable | $ | 371,856 | $ | 364,905 | ||||
Total royalty rights - at fair value | $ | 354,881 | $ | 399,204 | ||||
Total assets | $ | 1,055,375 | $ | 1,012,205 | ||||
Total term loan payable | $ | — | $ | 24,966 | ||||
Total convertible notes payable | $ | 230,850 | $ | 228,862 | ||||
Total stockholders' equity | $ | 742,531 | $ | 695,952 | ||||
TABLE 3
PDL BIOPHARMA, INC.
CONDENSED CONSOLIDATED STATEMENT OF CASH FLOW DATA
(Unaudited)
(In thousands)
Three Months Ended | ||||||||
March 31, | ||||||||
2016 | 2015 | |||||||
Net income | $ | 55,887 | $ | 84,498 | ||||
Adjustments to reconcile net income to net cash provided by (used in) operating activities | 22,336 | (3,442 | ) | |||||
Changes in assets and liabilities | 14,283 | (9,210 | ) | |||||
Net cash provided by operating activities | $ | 92,506 | $ | 71,846 | ||||
TABLE 4
PDL BIOPHARMA, INC.
GAAP to NON-GAAP RECONCILIATION:
NET INCOME AND DILUTED EARNINGS PER SHARE
(Unaudited)
(In thousands, except per share amount)
A reconciliation between net income on a GAAP basis and on a non-GAAP basis is as follows: | ||||||||
Three Months Ended | ||||||||
March 31, | ||||||||
2016 | 2015 | |||||||
GAAP net income as reported | $ | 55,887 | $ | 84,498 | ||||
Adjustments to Non-GAAP net income (as detailed below) | 28,901 | (5,040 | ) | |||||
Non-GAAP net income | $ | 84,788 | $ | 79,458 | ||||
A reconciliation between diluted earnings per share on a GAAP basis and on a non-GAAP basis is as follows: | ||||||||
Three Months Ended | ||||||||
March 31, | ||||||||
2016 | 2015 | |||||||
GAAP earnings per share - Diluted | $ | 0.34 | $ | 0.50 | ||||
Adjustments to Non-GAAP net income (as detailed below) | 0.18 | (0.03 | ) | |||||
Non-GAAP earnings per share - Diluted | $ | 0.52 | $ | 0.47 | ||||
An itemized reconciliation between net income on a GAAP basis and on a non-GAAP basis is as follows: | ||||||||
Three Months Ended | ||||||||
March 31, | ||||||||
2016 | 2015 | |||||||
GAAP net income as reported | $ | 55,887 | $ | 84,498 | ||||
Adjustments: | ||||||||
Mark-to-market adjustment to fair value assets | 44,323 | (10,424 | ) | |||||
Non-cash interest revenues | (1,951 | ) | (2,105 | ) | ||||
Non-cash stock-based compensation expense | 786 | 501 | ||||||
Non-cash debt offering costs | 2,461 | 4,066 | ||||||
Mark-to-market adjustment on warrants held | 329 | — | ||||||
Income tax effect related to above items | (17,047 | ) | 2,922 | |||||
Total adjustments | 28,901 | (5,040 | ) | |||||
Non-GAAP net income | $ | 84,788 | $ | 79,458 | ||||
Use of Non-GAAP Financial Measures
We supplement our consolidated financial statements presented on a GAAP basis by providing additional measures which may be considered “non-GAAP” financial measures under applicable SEC rules. We believe that the disclosure of these non-GAAP financial measures provides our investors with information that offers greater insight into reconciling our earnings with the cash flows from our business and investments and more appropriately reflects the amounts and financial basis upon which our management assesses and operates our business. These non-GAAP financial measures are not in accordance with generally accepted accounting principles and should not be viewed in isolation or as a substitute for reported, or GAAP, net income, and
diluted earnings per share, and are not a substitute for, or superior to, measures of financial performance performed in conformity with GAAP.
“Non-GAAP net income“ and “Non-GAAP earnings per share - Diluted” are not based on any standardized methodology prescribed by GAAP and represent GAAP net income and GAAP earnings per share - diluted adjusted to exclude (1) mark-to market adjustments related to the fair value election for our investments in royalty rights presented in our earnings, which include the fair value re-measurement of future discounted cash flows for each of the royalty rights assets we have acquired, (2) non-cash interest revenue from notes receivable (3) stock-based compensation expense, (4) non-cash interest expense related to PDL debt offering costs, (5) mark-to market adjustments related to warrants held, and to adjust (6) the related tax effect of all reconciling items within our reconciliation of our GAAP to Non-GAAP net income. Non-GAAP financial measures used by PDL may be calculated differently from, and therefore may not be comparable to, non-GAAP measures used by other companies.
Exhibit 99.2


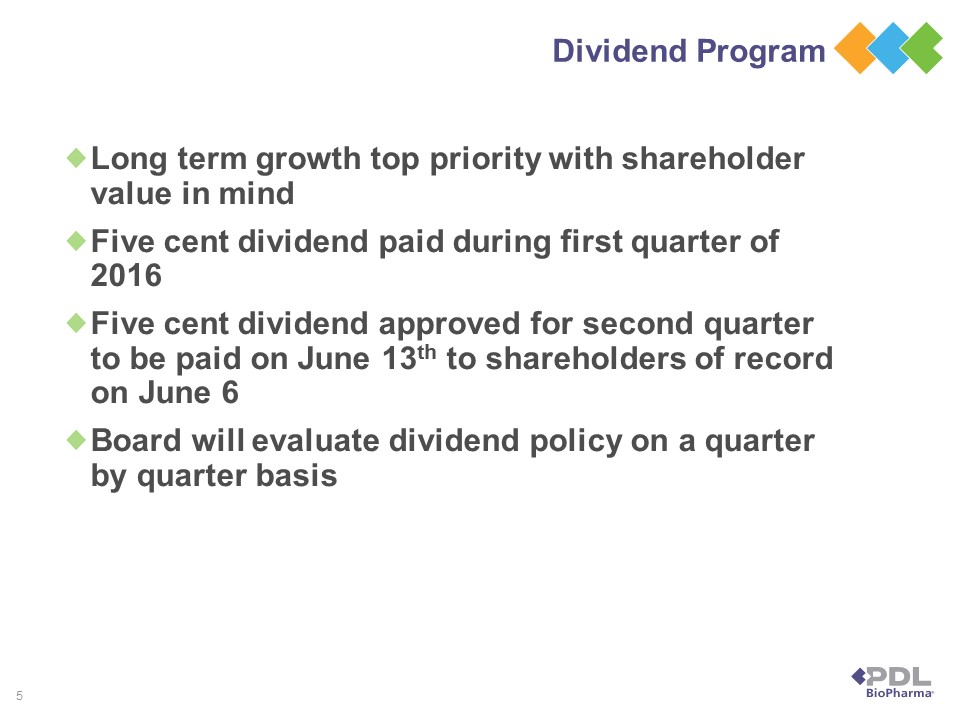
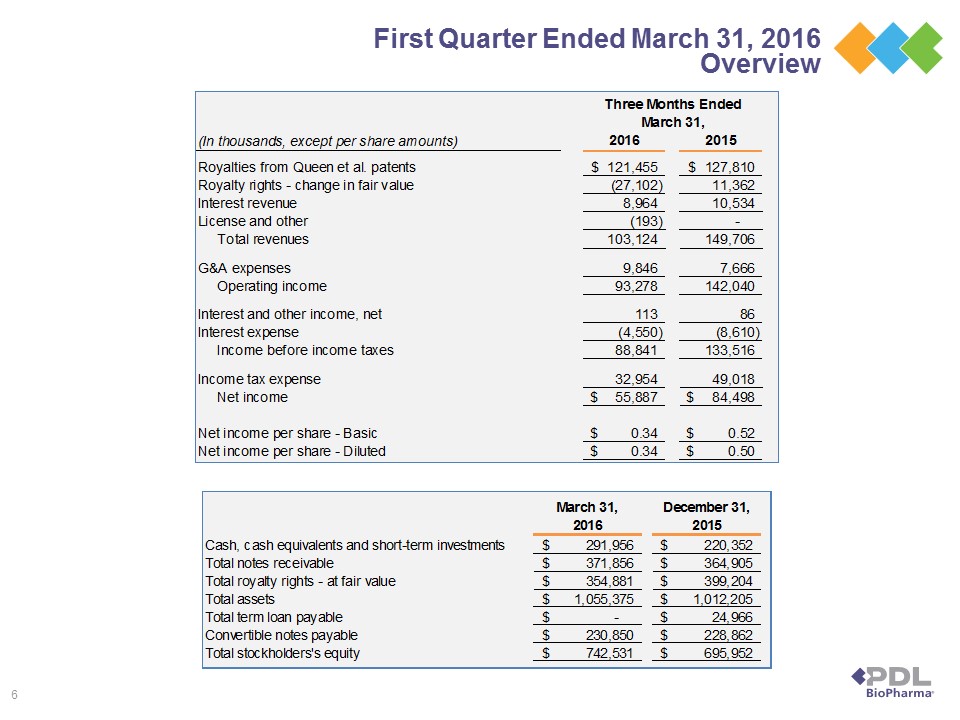


Exhibit 99.3
PDL BioPharma, Inc.
Q1 2016
May 4, 2016
Following are some of the key points regarding PDL’s first quarter 2016 financial and business results.
Highlighted Financial Results from Q1 2016
• | Total revenues of $103.1 million for the first quarter of 2016. |
• | Non-GAAP diluted earnings per share (EPS) of $0.52 increased approximately 11 percent versus the same period in 2015. |
• | Non-GAAP net income increased 7 percent to $84.8 million. |
• | GAAP diluted EPS of $0.34, decreased by 32 percent compared to the same period of 2015. |
• | GAAP net income decreased by 34 percent to $55.9 million. |
The largest component of the difference in non-GAAP measure compared to GAAP is the exclusion of mark-to-market
adjustments related to the fair value election of our investments in royalty rights. A full reconciliation of all components of the GAAP to Non-GAAP quarterly financial results can be found in Table 4 at the end of the PDL press release dated May 4, 2016.
Updates on Approved Royalty Bearing Products related to Queen et al. patents
Under the terms of the legal settlement between Genentech and PDL, the first quarter of 2016 is the last period for which Genentech will pay royalties to PDL for Avastin®, Herceptin®, Xolair®, Kadcyla® and Perjeta®. Royalty payments for Avastin®, Herceptin®, Xolair®, Kadcyla® and Perjeta® accounted for 86% of the $121.5 million Queen et al. royalty revenue recognized in the first quarter of 2016. Other products from the Queen et al. patent licenses entitle us to royalties following the expiration of our patents with respect to sales of licensed product manufactured prior to patent expiry in jurisdictions providing patent protection licenses. The amount of royalties we are due for product manufactured prior to patent expiry but sold after patent expiry is uncertain, however, the Company's revenues from payments made from these Queen et al. patent licenses and settlements will materially decrease in the second quarter of 2016.
Avastin® (bevacizumab):
• | On April 19, 2016, Genentech/Roche reported that Q116 sales were CHF 1.706 billion. |
Herceptin® (trastuzumab):
• | On April 19, 2016, Genentech/Roche reported that Q116 sales were CHF 1.725 billion. |
Xolair® (omalizumab):
• | On April 19, 2016, Genentech/Roche reported that Q116 sales were CHF 356 million. |
Tysabri® (natalizumab):
• | On April 21, 2016, Biogen reported that Q116 sales were $477 million. |
Perjeta® (pertuzumab):
• | On April 19, 2016, Genentech/Roche reported that Q116 sales were CHF 439 million. |
Kadcyla® (TDM-1 or ado-trastuzumab emtansine):
• | On April 19, 2016, Genentech/Roche reported that Q116 sales were CHF 201 million. |
Updates on Unapproved Royalty Bearing Products Related to Queen et al. patents
Solanezumab
• | On January 5, 2016, Lilly re-affirmed that topline data from its Phase 3 trial in patients with mild Alzheimer’s Disease is expected in late 2016. |
Page 1
PDL BioPharma, Inc.
Q1 2016
May 4, 2016
• | Lilly announced that it is moving from a co-primary endpoint of cognitive and functional change to a single endpoint of cognitive change with functional change as a secondary endpoint. |
Updates on Income Generating Assets
Wellstat Diagnostics, LLC
• | PDL has moved for summary judgment in New York state court to enforce guarantees related to non-Wellstat Diagnostics’ assets. |
• | A hearing was scheduled in the Maryland Circuit Court for April 13, 2016 to hear the Receiver’s motion to approve the credit bid sale to PDL. However, on April 12, 2016, Wellstat Diagnostics changed its name to Defined Diagnostics, LLC and filed for bankruptcy under Chapter 11 in the United States Bankruptcy Court in the Southern District of New York. The filing of the bankruptcy case stays the proceedings in the Maryland Circuit Court pursuant to the automatic stay provisions of the Bankruptcy Code. |
• | Because the bankruptcy filing is a transparent attempt to delay the receiver sale to PDL, we intend to file a petition with the bankruptcy court to dismiss the bankruptcy filing with prejudice and allow the case to continue in the receiver court. |
Depomed, Inc.
• | We have reduced the fair market value of the Depomed royalty rights by $47.9 million, primarily due to a reduction in Glumetza royalties received and a reduction in future cash flows due to lower projected demand data, greater erosion of market share due to the launch of a generic, and higher gross-to-net adjustments for Glumetza. As you will recall, Glumetza was marketed by Salix until its acquisition by Valeant. Because we have limited information from Valeant, we employ an independent third party consulting group to assist us in our quarterly evaluation of Glumetza and the other Depomed products on which we receive or will receive royalties. In February 2016, a generic competitor to Glumetza launched as expected. The impact of the generic has been greater than typical generic erosion models would predict resulting in less demand for Glumetza. |
• | PDL and Depomed are in the process of conducting a royalty audit on Glumetza royalties owed by Valeant. |
Direct Flow Medical, Inc.
• | Hired Daniel Lemaitre as CEO, former CEO of CoreValve, one of the early pioneers in transcatheter aortic valves, which was sold to Medtronic. |
• | Hired David Boyle as CFO, formerly CFO of AVI BioPharma, Bionovo and Salix. |
• | In January 2016, PDL funded additional $5 million secured loan convertible into equity at our option; with an additional $5 million secured convertible loan tranche to be funded at PDL’s option. |
kaleo, Inc.
• | On February 18, 2016, PDL was advised that Sanofi and kaléo will terminate their license and development agreement later this year. |
• | On March 31, 2016, PDL was informed by kaléo that the license and development agreement was terminated and that all U.S. and Canadian commercial and manufacturing rights to Auvi-Q® and Allerject® had been returned to kaléo. All manufacturing equipment had also been returned to kaléo, and they intend to evaluate the timing and options for bringing Auvi-Q and Allerject® back to the market. |
• | PDL entered into a secured note purchase agreement with Accel 300, a wholly-owned subsidiary of kaléo, which as of December 31, 2015, had a principal balance of $144.8 million due to PDL. An interest reserve account previously set up as part of the note agreement will substantially cover interest payments due to PDL through the end of the second quarter of 2016, and kaléo has indicated that it intends to make payments due to PDL under the note agreement until Auvi-Q is returned to the market. |
Forward-looking Statements
This document contains "forward-looking statements" within the meaning of Section 27A of the Securities Act of 1933, as amended, and Section 21E of the Securities Exchange Act of 1934, as amended. Each of these forward-looking statements involves risks and uncertainties. Actual results may differ materially from those, express or implied, in these forward-looking statements. Important factors that could impair the value of the Company's royalty assets, restrict or impede the ability of the
Page 2
PDL BioPharma, Inc.
Q1 2016
May 4, 2016
Company to invest in new income generating assets and limit the Company's ability to pay dividends are disclosed in the risk factors contained in the Company's Annual Report on Form 10-K, as updated by subsequent quarterly reports filed with the Securities and Exchange Commission, as updated by subsequent filings. All forward-looking statements are expressly qualified in their entirety by such factors. We do not undertake any duty to update any forward looking statement except as required by law.
Page 3
PDL BioPharma, Inc.
Q1 2016
May 4, 2016
Queen et al. Royalties | ||||||||||
Royalty Revenue by Product ($ in 000's) * | ||||||||||
Avastin | Q1 | Q2 | Q3 | Q4 | Total | |||||
2016 | 38,825 | — | — | — | 38,825 | |||||
2015 | 38,809 | 38,447 | 39,284 | 39,987 | 156,527 | |||||
2014 | 38,122 | 38,924 | 38,864 | 40,723 | 156,632 | |||||
2013 | 33,234 | 46,720 | 32,224 | 32,287 | 144,464 | |||||
2012 | 23,215 | 41,670 | 25,955 | 30,041 | 120,882 | |||||
2011 | 22,283 | 41,967 | 23,870 | 22,886 | 111,006 | |||||
2010 | 16,870 | 44,765 | 29,989 | 24,922 | 116,547 | |||||
2009 | 13,605 | 35,161 | 21,060 | 15,141 | 84,966 | |||||
2008 | 9,957 | 30,480 | 19,574 | 12,394 | 72,405 | |||||
2007 | 8,990 | 21,842 | 17,478 | 9,549 | 57,859 | |||||
2006 | 10,438 | 15,572 | 15,405 | 12,536 | 53,952 | |||||
Herceptin | Q1 | Q2 | Q3 | Q4 | Total | |||||
2016 | 38,726 | — | — | — | 38,726 | |||||
2015 | 37,875 | 39,476 | 39,457 | 38,897 | 155,704 | |||||
2014 | 36,646 | 38,292 | 39,407 | 40,049 | 154,394 | |||||
2013 | 30,287 | 47,353 | 30,961 | 33,038 | 141,640 | |||||
2012 | 25,702 | 44,628 | 30,433 | 28,307 | 129,070 | |||||
2011 | 25,089 | 42,209 | 31,933 | 21,812 | 121,042 | |||||
2010 | 23,402 | 38,555 | 27,952 | 25,441 | 115,350 | |||||
2009 | 16,003 | 32,331 | 26,830 | 18,615 | 93,779 | |||||
2008 | 14,092 | 34,383 | 28,122 | 20,282 | 96,880 | |||||
2007 | 19,035 | 28,188 | 22,582 | 14,802 | 84,608 | |||||
2006 | 15,142 | 19,716 | 21,557 | 20,354 | 76,769 | |||||
Lucentis | Q1 | Q2 | Q3 | Q4 | Total | |||||
2016 | — | — | — | — | — | |||||
2015 | 15,920 | — | — | — | 15,920 | |||||
2014 | 17,390 | 16,777 | 16,883 | 16,695 | 67,746 | |||||
2013 | 12,032 | 30,066 | 13,536 | 12,127 | 67,760 | |||||
2012 | 10,791 | 27,938 | 12,552 | 11,097 | 62,377 | |||||
2011 | 8,878 | 24,313 | 12,157 | 10,750 | 56,099 | |||||
2010 | 7,220 | 19,091 | 10,841 | 8,047 | 45,198 | |||||
2009 | 4,621 | 12,863 | 8,123 | 6,152 | 31,759 | |||||
2008 | 3,636 | 11,060 | 7,631 | 4,549 | 26,876 | |||||
2007 | 2,931 | 6,543 | 6,579 | 3,517 | 19,570 | |||||
2006 | — | — | 289 | 3,335 | 3,624 | |||||
Xolair | Q1 | Q2 | Q3 | Q4 | Total | |||||
2016 | 13,030 | — | — | — | 13,030 | |||||
2015 | 10,971 | 11,075 | 12,407 | 12,749 | 47,202 | |||||
2014 | 8,886 | 9,099 | 10,442 | 11,237 | 39,663 | |||||
2013 | 5,930 | 10,025 | 7,334 | 7,330 | 30,619 | |||||
2012 | 5,447 | 8,609 | 6,504 | 6,145 | 26,705 | |||||
2011 | 4,590 | 7,621 | 5,916 | 5,823 | 23,949 | |||||
2010 | 3,723 | 6,386 | 4,980 | 4,652 | 19,741 | |||||
2009 | 2,665 | 5,082 | 4,085 | 3,722 | 15,553 | |||||
2008 | 1,488 | 4,866 | 3,569 | 2,927 | 12,850 | |||||
2007 | 1,684 | 3,942 | 3,332 | 2,184 | 11,142 | |||||
2006 | 2,263 | 2,969 | 3,041 | 2,495 | 10,768 | |||||
Page 4
PDL BioPharma, Inc.
Q1 2016
May 4, 2016
Queen et al. Royalties | ||||||||||
Royalty Revenue by Product ($ in 000's) * | ||||||||||
Perjeta | Q1 | Q2 | Q3 | Q4 | Total | |||||
2016 | 9,320 | — | — | — | 9,320 | |||||
2015 | 6,596 | 7,419 | 7,898 | 8,753 | 30,666 | |||||
2014 | 3,375 | 4,385 | 5,157 | 5,850 | 18,767 | |||||
2013 | 340 | 1,414 | 748 | 879 | 3,381 | |||||
2012 | — | — | 58 | 250 | 308 | |||||
Kadcyla | Q1 | Q2 | Q3 | Q4 | Total | |||||
2016 | 4,782 | — | — | — | 4,782 | |||||
2015 | 3,852 | 4,177 | 4,319 | 4,535 | 16,883 | |||||
2014 | 1,934 | 2,491 | 3,048 | 3,464 | 10,937 | |||||
2013 | — | 551 | 830 | 859 | 2,240 | |||||
Tysabri | Q1 | Q2 | Q3 | Q4 | Total | |||||
2016 | 13,970 | — | — | — | 13,970 | |||||
2015 | 14,385 | 13,614 | 13,557 | 14,031 | 55,587 | |||||
2014 | 12,857 | 13,350 | 16,048 | 15,015 | 57,270 | |||||
2013 | 12,965 | 13,616 | 11,622 | 12,100 | 50,304 | |||||
2012 | 11,233 | 12,202 | 11,749 | 12,255 | 47,439 | |||||
2011 | 9,891 | 10,796 | 11,588 | 11,450 | 43,725 | |||||
2010 | 8,791 | 8,788 | 8,735 | 9,440 | 35,754 | |||||
2009 | 6,656 | 7,050 | 7,642 | 8,564 | 29,912 | |||||
2008 | 3,883 | 5,042 | 5,949 | 6,992 | 21,866 | |||||
2007 | 839 | 1,611 | 2,084 | 2,836 | 7,370 | |||||
2006 | — | — | — | 237 | 237 | |||||
Actemra | Q1 | Q2 | Q3 | Q4 | Total | |||||
2016 | — | — | — | — | — | |||||
2015 | 4,990 | — | — | — | 4,990 | |||||
2014 | 3,446 | 3,932 | 4,419 | 5,406 | 17,202 | |||||
2013 | 2,631 | 2,816 | 2,939 | 3,744 | 12,131 | |||||
2012 | 1,705 | 2,074 | 2,145 | 2,462 | 8,385 | |||||
2011 | 913 | 1,136 | 1,401 | 1,460 | 4,910 | |||||
2010 | 1,587 | 237 | 315 | 688 | 2,827 | |||||
2009 | 585 | 537 | 909 | 1,197 | 3,228 | |||||
2008 | 44 | — | 146 | 369 | 559 | |||||
2007 | 32 | — | — | 17 | 49 | |||||
Gazyva | Q1 | Q2 | Q3 | Q4 | Total | |||||
2016 | — | — | — | — | — | |||||
2015 | 313 | — | — | — | 313 | |||||
2014 | 51 | 283 | 325 | 436 | 1,094 | |||||
Entyvio | Q1 | Q2 | Q3 | Q4 | Total | |||||
2016 | — | — | — | — | — | |||||
2015 | 2,223 | — | — | — | 2,223 | |||||
2014 | — | — | 153 | 2,192 | 2,344 | |||||
* As reported to PDL by its licensees. Totals may not sum due to rounding. | ||||||||||
Q1 2014 royalty revenue by product above do not include a $5 million payment received from Genentech in Q1 2014 for a retroactive settlement payment from 2013. | ||||||||||
Page 5
PDL BioPharma, Inc.
Q1 2016
May 4, 2016
Queen et al. Sales Revenue | ||||||||||
Reported Licensee Net Sales Revenue by Product ($ in 000's) * | ||||||||||
Avastin | Q1 | Q2 | Q3 | Q4 | Total | |||||
2016 | 1,827,081 | — | — | — | 1,827,081 | |||||
2015 | 1,826,289 | 1,809,286 | 1,848,655 | 1,881,743 | 7,365,972 | |||||
2014 | 1,786,912 | 1,838,764 | 1,828,900 | 1,916,353 | 7,370,929 | |||||
2013 | 1,653,108 | 1,694,678 | 1,746,135 | 1,819,877 | 6,913,798 | |||||
2012 | 1,502,757 | 1,573,727 | 1,551,327 | 1,662,977 | 6,290,788 | |||||
2011 | 1,597,461 | 1,582,705 | 1,581,095 | 1,469,994 | 6,231,255 | |||||
2010 | 1,506,788 | 1,596,892 | 1,594,707 | 1,646,218 | 6,344,605 | |||||
2009 | 1,345,487 | 1,295,536 | 1,439,730 | 1,514,053 | 5,594,806 | |||||
2008 | 980,715 | 1,084,930 | 1,180,427 | 1,239,382 | 4,485,454 | |||||
2007 | 678,068 | 746,587 | 797,013 | 875,084 | 3,096,752 | |||||
2006 | 439,318 | 516,052 | 570,551 | 592,897 | 2,118,817 | |||||
Herceptin | Q1 | Q2 | Q3 | Q4 | Total | |||||
2016 | 1,822,407 | — | — | — | 1,822,407 | |||||
2015 | 1,789,404 | 1,857,696 | 1,856,803 | 1,830,424 | 7,334,326 | |||||
2014 | 1,731,564 | 1,801,990 | 1,854,452 | 1,877,614 | 7,265,621 | |||||
2013 | 1,681,574 | 1,744,145 | 1,681,860 | 1,726,551 | 6,834,130 | |||||
2012 | 1,515,255 | 1,625,313 | 1,663,695 | 1,650,495 | 6,454,759 | |||||
2011 | 1,391,568 | 1,559,975 | 1,642,898 | 1,432,771 | 6,027,211 | |||||
2010 | 1,270,846 | 1,349,512 | 1,300,934 | 1,409,310 | 5,330,602 | |||||
2009 | 1,210,268 | 1,133,993 | 1,226,435 | 1,278,626 | 4,849,323 | |||||
2008 | 1,105,426 | 1,195,215 | 1,211,982 | 1,186,806 | 4,699,428 | |||||
2007 | 891,761 | 949,556 | 979,602 | 1,015,033 | 3,835,952 | |||||
2006 | 529,585 | 659,719 | 761,099 | 803,576 | 2,753,979 | |||||
Lucentis | Q1 | Q2 | Q3 | Q4 | Total | |||||
2016 | — | — | — | — | — | |||||
2015 | 749,182 | — | — | — | 749,182 | |||||
2014 | 818,376 | 789,483 | 794,505 | 785,669 | 3,188,031 | |||||
2013 | 1,203,179 | 1,171,423 | 1,200,791 | 1,212,651 | 4,788,045 | |||||
2012 | 1,079,092 | 1,086,543 | 1,097,541 | 1,109,695 | 4,372,871 | |||||
2011 | 887,757 | 943,418 | 1,052,809 | 1,075,015 | 3,958,999 | |||||
2010 | 721,967 | 698,890 | 745,376 | 804,684 | 2,970,917 | |||||
2009 | 462,103 | 469,736 | 555,296 | 615,212 | 2,102,347 | |||||
2008 | 363,615 | 393,682 | 460,167 | 454,922 | 1,672,386 | |||||
2007 | 224,820 | 219,579 | 299,995 | 322,300 | 1,066,695 | |||||
2006 | — | — | 10,689 | 157,742 | 168,431 | |||||
Xolair | Q1 | Q2 | Q3 | Q4 | Total | |||||
2016 | 613,160 | — | — | — | 613,160 | |||||
2015 | 523,340 | 521,192 | 583,856 | 599,945 | 2,228,333 | |||||
2014 | 425,243 | 428,171 | 491,372 | 521,726 | 1,866,512 | |||||
2013 | 341,309 | 365,778 | 391,900 | 401,333 | 1,500,321 | |||||
2012 | 310,234 | 314,638 | 347,796 | 340,431 | 1,313,100 | |||||
2011 | 267,754 | 277,642 | 310,874 | 314,911 | 1,171,182 | |||||
2010 | 228,859 | 225,878 | 251,055 | 263,389 | 969,179 | |||||
2009 | 184,669 | 181,086 | 211,006 | 219,693 | 796,454 | |||||
2008 | 137,875 | 169,521 | 177,179 | 183,753 | 668,329 | |||||
2007 | 129,172 | 130,700 | 144,250 | 147,754 | 551,876 | |||||
2006 | 95,241 | 99,354 | 112,608 | 118,002 | 425,204 | |||||
Page 6
PDL BioPharma, Inc.
Q1 2016
May 4, 2016
Queen et al. Sales Revenue | ||||||||||
Reported Licensee Net Sales Revenue by Product ($ in 000's) * | ||||||||||
Perjeta | Q1 | Q2 | Q3 | Q4 | Total | |||||
2016 | 438,580 | — | — | — | 438,580 | |||||
2015 | 310,410 | 349,125 | 371,668 | 411,912 | 1,443,115 | |||||
2014 | 158,809 | 206,333 | 242,700 | 275,311 | 883,153 | |||||
2013 | 34,008 | 55,076 | 66,353 | 87,949 | 243,386 | |||||
2012 | — | — | 5,080 | 25,000 | 30,079 | |||||
Kadcyla | Q1 | Q2 | Q3 | Q4 | Total | |||||
2016 | 25,018 | — | — | — | 25,018 | |||||
2015 | 181,275 | 196,556 | 203,258 | 213,404 | 794,493 | |||||
2014 | 91,031 | 117,212 | 143,414 | 163,028 | 514,685 | |||||
2013 | — | 21,459 | 73,626 | 85,906 | 180,991 | |||||
Tysabri | Q1 | Q2 | Q3 | Q4 | Total | |||||
2016 | 465,647 | — | — | — | 465,647 | |||||
2015 | 479,526 | 453,786 | 451,898 | 467,735 | 1,852,945 | |||||
2014 | 428,561 | 442,492 | 534,946 | 500,511 | 1,906,510 | |||||
2013 | 434,677 | 451,358 | 387,407 | 403,334 | 1,676,776 | |||||
2012 | 374,430 | 401,743 | 391,623 | 408,711 | 1,576,508 | |||||
2011 | 329,696 | 356,876 | 388,758 | 381,618 | 1,456,948 | |||||
2010 | 293,047 | 287,925 | 293,664 | 316,657 | 1,191,292 | |||||
2009 | 221,854 | 229,993 | 257,240 | 285,481 | 994,569 | |||||
2008 | 129,430 | 163,076 | 200,783 | 233,070 | 726,359 | |||||
2007 | 30,468 | 48,715 | 71,972 | 94,521 | 245,675 | |||||
2006 | — | — | — | 7,890 | 7,890 | |||||
Actemra | Q1 | Q2 | Q3 | Q4 | Total | |||||
2016 | — | — | — | — | — | |||||
2015 | 166,338 | — | — | — | 166,338 | |||||
2014 | 114,865 | 124,736 | 147,285 | 180,197 | 567,082 | |||||
2013 | 87,703 | 91,374 | 97,961 | 124,815 | 401,852 | |||||
2012 | 56,662 | 66,624 | 71,505 | 82,053 | 276,843 | |||||
2011 | 30,433 | 35,370 | 46,709 | 48,671 | 161,183 | |||||
2010 | 52,908 | 5,405 | 10,493 | 22,919 | 91,725 | |||||
2009 | 19,504 | 17,920 | 30,313 | 39,888 | 107,625 | |||||
2008 | 1,452 | 1,377 | 5,981 | 12,305 | 21,115 | |||||
2007 | — | — | — | 1,137 | 1,137 | |||||
Gazyva | Q1 | Q2 | Q3 | Q4 | Total | |||||
2016 | — | — | — | — | — | |||||
2015 | 9,627 | — | — | — | 9,627 | |||||
2014 | 3,095 | 8,697 | 11,531 | 13,428 | 36,750 | |||||
Entyvio | Q1 | Q2 | Q3 | Q4 | Total | |||||
2016 | — | — | — | — | — | |||||
2015 | 59,287 | — | — | — | 59,287 | |||||
2014 | — | — | 5,347 | 58,500 | 63,848 | |||||
* As reported to PDL by its licensee. Dates in above charts reflect when PDL receives | ||||||||||
royalties on sales. Sales occurred in the quarter prior to the dates in the above charts. | ||||||||||
Totals may not sum due to rounding. | ||||||||||
Page 7
Exhibit 99.4
Contacts: | ||
Peter Garcia | Jennifer Williams | |
PDL BioPharma, Inc. | Cook Williams Communications, Inc. | |
775-832-8500 | 360-668-3701 | |
PDL BioPharma Announces 2016 Second Quarter Dividend
INCLINE VILLAGE, Nevada, May 4, 2016 - PDL BioPharma, Inc. (NASDAQ: PDLI) today announced that its board of directors has declared a $0.05 per share dividend for the second quarter of 2016. The cash dividend will be paid on June 13, 2016 to all stockholders who own shares of PDL on June 6, 2016, the record date for the second quarter dividend payment.
Stockholders desiring to purchase shares with rights to the dividend must ensure that their trades are executed prior to the "ex-dividend" date and settled prior to the record date. NASDAQ generally establishes an ex-dividend date that is two business days prior to the record date. Investors should consult with their brokers or financial advisors regarding their specific situations.
About PDL BioPharma
PDL manages a portfolio of patents and royalty assets, consisting of its Queen et al. patents, license agreements with various biotechnology and pharmaceutical companies, and royalty and other assets acquired. To acquire new income generating assets, PDL provides non-dilutive growth capital and financing solutions to late-stage public and private healthcare companies and offers immediate financial monetization of royalty streams to companies, academic institutions, and inventors. PDL has committed over $1 billion and funded approximately $937 million in these investments to date. PDL evaluates its investments based on the quality of the income generating assets and potential returns on investment. PDL is currently focused on acquiring new income generating assets, the management of its intellectual property and income generating assets, and maximizing value for its stockholders.
The Company was formerly known as Protein Design Labs, Inc. and changed its name to PDL BioPharma, Inc. in 2006. PDL was founded in 1986 and is headquartered in Incline Village, Nevada. PDL pioneered the humanization of monoclonal antibodies and, by doing so, enabled the discovery of a new generation of targeted treatments for cancer and immunologic diseases for which it receives significant royalty revenue.
PDL BioPharma and the PDL BioPharma logo are considered trademarks of PDL BioPharma, Inc.
Cautionary Statements Concerning Forward-Looking Statements
This Press Release contains "forward-looking" statements as defined in the Private Securities Litigation Reform Act of 1995. These statements are based on management’s current expectations or predictions of future conditions, events or results based on various assumptions and management's estimates of trends and economic factors in the markets in which we are active, as well as our business plans. Words such as "expects", "anticipates", "intends", "plans", "believes", "seeks", "estimates", "projects", "forecasts", "may", "should", variations of such words and similar expressions are intended to identify such forward-looking statements. The forward-looking statements may include, without limitation, statements regarding product development, product potential or financial performance. As all dividend payments are subject to compliance with legal requirements, dividend announcements constitute "forward-looking" statements and could be withdrawn prior to payment at the discretion of the Company's board of
directors. Our financial performance could affect or limit the ability of our board of directors to declare or pay a dividend. The forward-looking statements are subject to risks and uncertainties, which may cause results to differ materially from those set forth in the statements. Forward-looking statements in this release should be evaluated together with the many uncertainties that affect the business of PDL and its markets, particularly those discussed in the risk factors and cautionary statements contained in the Company's 2015 Annual Report on Form 10-K filed with the Securities and Exchange Commission on February 23, 2016. All forward-looking statements are expressly qualified in their entirety by such factors. The forward-looking statements are representative only as of the date they are made, and PDL assumes no responsibility to update any forward-looking statements, whether as a result of new information, future events or otherwise.
# # #
Serious News for Serious Traders! Try StreetInsider.com Premium Free!
You May Also Be Interested In
- Man Group PLC : Form 8.3 - Tyman plc
- Alphabet stock surges 11% to record high on Q1 earnings beat, first-ever dividend
- Linde Increases Production Capacity and Reduces Emissions in Florida
Create E-mail Alert Related Categories
SEC FilingsSign up for StreetInsider Free!
Receive full access to all new and archived articles, unlimited portfolio tracking, e-mail alerts, custom newswires and RSS feeds - and more!
