

Form 8-K MITEL NETWORKS CORP For: Feb 25
 Tweet
Tweet Share
Share
UNITED STATES
SECURITIES AND EXCHANGE COMMISSION
Washington, D.C. 20549
FORM 8-K
CURRENT REPORT
PURSUANT TO SECTION 13 OR 15(d)
OF THE SECURITIES EXCHANGE ACT OF 1934
Date of Report (Date of earliest event reported): February 25, 2016
MITEL NETWORKS CORPORATION
(Exact Name of Registrant as Specified in its Charter)
| Canada | 001-34699 | 98-0621254 | ||
| (State or Other Jurisdiction of Incorporation) |
(Commission File Number) |
(I.R.S. Employer Identification No.) |
350 Legget Drive
Ottawa, Ontario K2K 2W7
(Address of Principal Executive Offices) (Zip Code)
(613) 592-2122
(Registrant’s telephone number, including area code)
Not Applicable
(Former Name or Former Address, if Changed Since Last Report)
Check the appropriate box below if the Form 8-K filing is intended to simultaneously satisfy the filing obligation of the registrant under any of the following provisions:
| ¨ | Written communications pursuant to Rule 425 under the Securities Act (17 CFR 230.425) |
| ¨ | Soliciting material pursuant to Rule 14a-12 under the Exchange Act (17 CFR 240.14a-12) |
| ¨ | Pre-commencement communications pursuant to Rule 14d-2(b) under the Exchange Act (17 CFR 240.14d-2(b)) |
| ¨ | Pre-commencement communications pursuant to Rule 13e-4(c) under the Exchange Act (17 CFR 240.13e-4(c)) |
Item 7.01. Regulation FD
Mitel Networks Corporation (the “Company”) is furnishing under this Item 7.01 a copy of a slide deck presentation made available February 25, 2016 on the Company’s earnings call for the fiscal year ended December 31, 2015. The presentation is incorporated by reference herein and has also been posted to the Company’s website.
The information in this Current Report on Form 8-K under Item 7.01, including Exhibit 99.1 attached hereto and incorporated herein, is being “furnished” and not “filed” with the U.S. Securities and Exchange Commission for purposes of Section 18 of the Securities Exchange Act of 1934, as amended, or otherwise subject to the liabilities under such section. Furthermore, such information shall not be deemed incorporated by reference in any filing under the Securities Act of 1933, as amended, unless specifically identified as being incorporated therein by reference.
Item 9.01 Financial Statements and Exhibits.
(d) Exhibits.
| 99.1 | Investor Earnings Call Slide Deck Presentation dated February 25, 2016 | |
SIGNATURE
Pursuant to the requirements of the Securities Exchange Act of 1934, the registrant has duly caused this report to be signed on its behalf by the undersigned hereunto duly authorized.
Date: February 25, 2016
| MITEL NETWORKS CORPORATION | ||
| By: | /s/ Greg Hiscock | |
| Name: | Greg Hiscock | |
| Title: | General Counsel & Corporate Secretary | |
Exhibit 99.1
|
|

Mitel Q4 2015 Earnings Call Presentation
February 25, 2016
|
|
Safe Harbor Statement
Forward Looking Statements
This slide deck has been provided to help illustrate Mitel’s financial results. It has been posted on www.mitel.com and should be read in conjunction with the company’s Form 10-K. Some of the statements in this presentation are forward-looking statements (or forward-looking information) within the meaning of applicable U.S. and Canadian securities laws. These include statements using the words believe, target, outlook, may, will, should, could, estimate, continue, expect, intend, plan, predict, potential, project and anticipate, and similar statements which do not describe the present or provide information about the past. There is no guarantee that the expected events or expected results will actually occur. Such statements reflect the current views of management of Mitel and are subject to a number of risks and uncertainties. These statements are based on many assumptions and factors, including general economic and market conditions, industry conditions, operational and other factors. Any changes in these assumptions or other factors could cause actual results to differ materially from current expectations. All forward-looking statements attributable to Mitel, or persons acting on its behalf, are expressly qualified in their entirety by the cautionary statements set forth in this paragraph. Undue reliance should not be placed on such statements. In addition, material risks that could cause actual results to differ from forward-looking statements include: the inherent uncertainty associated with financial or other projections; the anticipated size of the markets and continued demand for Mitel’s products; access to available financing on a timely basis and on reasonable terms; Mitel’s ability to achieve or sustain profitability in the future; fluctuations in quarterly and annual revenues and operating results; fluctuations in foreign exchange rates; current and ongoing global economic instability, political unrest and related sanctions; intense competition; reliance on channel partners for a significant component of sales; dependence upon a small number of outside contract manufacturers to manufacture products; and, Mitel’s ability to successfully implement and achieve its business strategies including its growth of the company through acquisitions and the integration and realization of synergies resulting from recently acquired businesses. These and other risks are more fully described under the heading “Risk Factors” in Mitel’s Annual Report on Form 10-K for the year ended December 31, 2015, which is expected to be filed on February 29, 2016. Forward-looking statements speak only as of the date they are made. Except as required by law, Mitel does not have any intention or obligation to update or to publicly announce the results of any revisions to any of the forward-looking statements to reflect actual results, future events or developments, changes in assumptions or changes in other factors affecting the forward-looking statements.
| 2 |
|
| ©2015 Mitel. Proprietary and Confidential. |
|
|
Non-GAAP Financial Measurements
In an effort to provide investors with additional information regarding the company’s results as determined by generally accepted accounting principles (GAAP), the company also discusses, in its earnings press release and earnings presentation materials, the following Non-GAAP information which management believes provides useful information to investors. Mitel provides a reconciliation between GAAP and non-GAAP financial information in our quarterly results announcements and in the supplemental slides used in conjunction with the company’s quarterly call. This information is available on our website at www.mitel.com under the “Investor Relations” section http://investor.mitel.com/events.cfm.
Non-GAAP Financial Measures
This presentation includes references to non-GAAP financial measures including Adjusted EBITDA, non-GAAP net income, non-GAAP operating expenses, non-GAAP Revenues and non-GAAP Gross Margin. Non-GAAP financial measures do not have any standardized meaning and are therefore unlikely to be comparable to similar measures presented by other companies. We use these non-GAAP financial measures to assist management and investors in understanding our past financial performance and prospects for the future, including changes in our operating results, trends and marketplace performance, exclusive of unusual events or factors which do not directly affect what we consider to be our core operating performance. Non-GAAP measures are among the primary indicators management uses as a basis for our planning and forecasting of future periods. Investors are cautioned that non-GAAP financial measures should not be relied upon as a substitute for financial measures prepared in accordance with generally accepted accounting principles. Please see the reconciliation of non-GAAP financial measures to the most directly comparable U.S. GAAP measure attached to our quarterly results announcement.
Mitel completed the acquisition of Mavenir Systems Inc. on April 29, 2015. “As reported” results in our quarterly results announcement and the attached tables refer to the U.S. GAAP results of Mitel, which include the results of Mavenir from the date of acquisition. Pro-forma results reflect the results of the company as if it had been fully combined with Mavenir Systems for the full presented period. Non-GAAP Revenues and non-GAAP Gross Margin have been adjusted to exclude the effect of purchase accounting. These adjustments have no impact on Mitel’s business or cash flows, but adversely affect the Company`s reported revenues and gross margin in the period following an acquisition. For a reconciliation of Mitel’s as-reported results to the pro-forma results and non-GAAP results, please see the tables attached to our quarterly announcement as well as the Form 8-K presenting combined historical results of Mitel and Mavenir filed with the SEC on August 6, 2015.
Constant Currency Estimates
Management refers to growth rates at constant currency or adjusting for currency so that certain financial results can be viewed without the impact of fluctuations in foreign currency exchange rates, thereby facilitating period-to-period comparisons of the company’s business performance. Financial results adjusted for currency are calculated by translating prior period activity in local currency using the current period currency conversion rate. This approach is used for countries where the functional currency is the local currency. Generally, when the US dollar either strengthens or weakens against other currencies, the growth at constant currency rates or adjusting for currency will be higher or lower than growth reported at actual exchange rates.
Annualized Exit Monthly Cloud Recurring Revenue
Annualized Exit Monthly Cloud Recurring Revenue is a leading indicator of our anticipated cloud recurring revenues. We believe that trends in revenue are important to understanding the overall health of our cloud business. Our Annualized Exit Monthly Cloud Recurring Revenue equals our Monthly Cloud Recurring Revenue multiplied by 12. Our Monthly Cloud Recurring Revenue equals the monthly value of all customer subscriptions in effect at the end of a given month. For example, our Monthly Recurring Subscriptions at December 31, 2015 were $9.66 million. As such, our Annualized Exit Monthly Cloud Recurring Revenue at December 31, 2015 were $115.9 million.
| 3 |
|
| ©2015 Mitel. Proprietary and Confidential. |
|
|
Q4 2015 Business Highlights
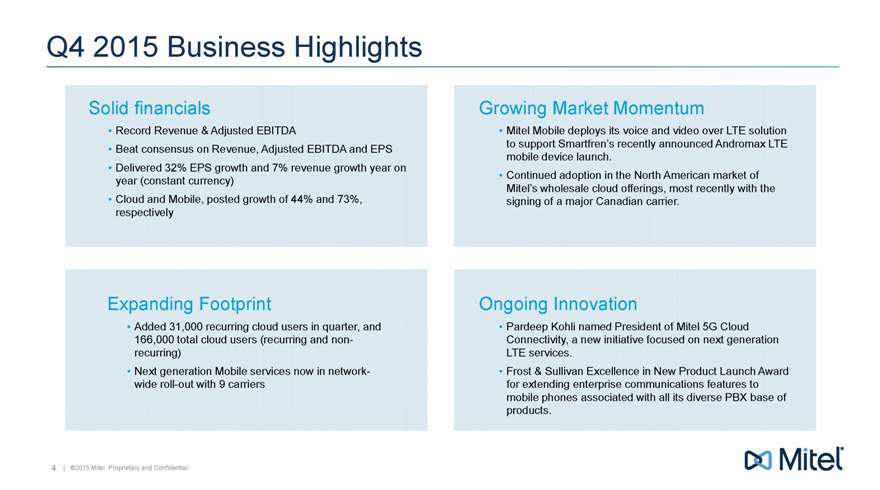
Solid financials
| • |
|
Record Revenue & Adjusted EBITDA |
| • |
|
Beat consensus on Revenue, Adjusted EBITDA and EPS |
| • |
|
Delivered 32% EPS growth and 7% revenue growth year on year (constant currency) |
| • |
|
Cloud and Mobile, posted growth of 44% and 73%, respectively |
Expanding Footprint
| • |
|
Added 31,000 recurring cloud users in quarter, and 166,000 total cloud users (recurring and non-recurring) |
| • |
|
Next generation Mobile services now in network-wide roll-out with 9 carriers |
Growing Market Momentum
| • |
|
Mitel Mobile deploys its voice and video over LTE solution to support Smartfren’s recently announced Andromax LTE mobile device launch. |
| • |
|
Continued adoption in the North American market of Mitel’s wholesale cloud offerings, most recently with the signing of a major Canadian carrier. |
Ongoing Innovation
| • |
|
Pardeep Kohli named President of Mitel 5G Cloud Connectivity, a new initiative focused on next generation LTE services. |
| • |
|
Frost & Sullivan Excellence in New Product Launch Award for extending enterprise communications features to mobile phones associated with all its diverse PBX base of products. |
| 4 |
|
| ©2015 Mitel. Proprietary and Confidential. |
|
|
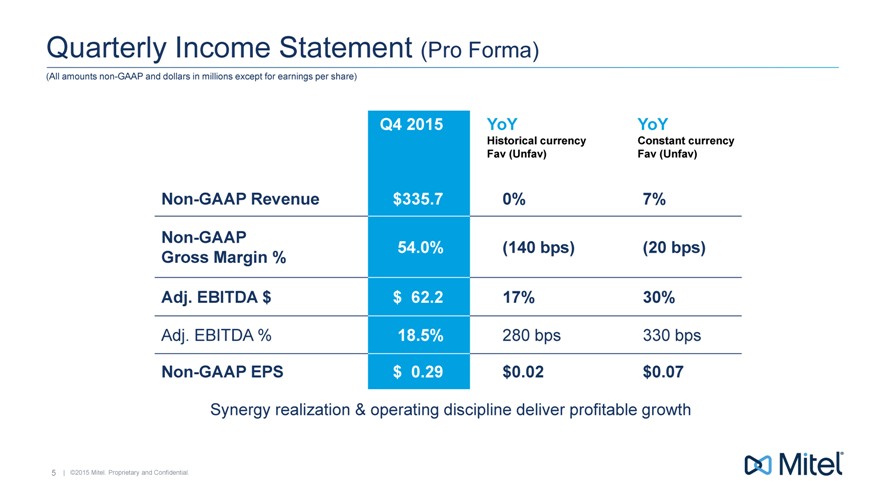
Quarterly Income Statement (Pro Forma)
(All amounts non-GAAP and dollars in millions except for earnings per share)
-Q4-2015-YoY-YoY
—-Historical currency-Constant currency
—-Fav (Unfav)-Fav (Unfav)
Non-GAAP Revenue-$335.7-0%-7%
Non-GAAP-54.0%-(140 bps)-(20 bps)
Gross Margin %——
Adj. EBITDA $-$-62.2-17%-30%
Adj. EBITDA %-18.5%-280 bps-330 bps
Non-GAAP EPS-$-0.29-$0.02-$0.07
Synergy realization & operating discipline deliver profitable growth
| 5 |
|
| ©2015 Mitel. Proprietary and Confidential. |
|
|
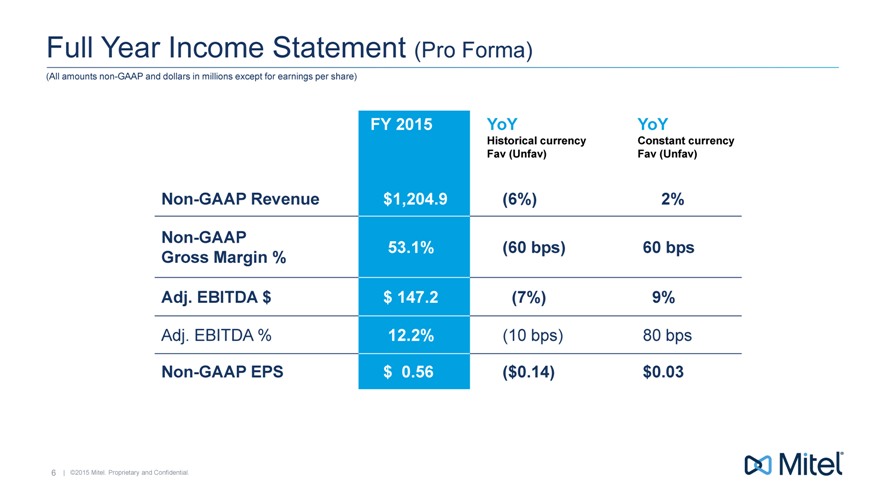
Full Year Income Statement (Pro Forma)
(All amounts non-GAAP and dollars in millions except for earnings per share)
FY 2015 YoY YoY
Historical currency Constant currency
Fav (Unfav) Fav (Unfav)
Non-GAAP Revenue $1,204.9 (6%) 2%
Non-GAAP 53.1% (60 bps) 60 bps
Gross Margin %
Adj. EBITDA $ $ 147.2 (7%) 9%
Adj. EBITDA % 12.2% (10 bps) 80 bps
Non-GAAP EPS $ 0.56 ($0.14) $0.03
| 6 |
|
| ©2015 Mitel. Proprietary and Confidential. |
|
|
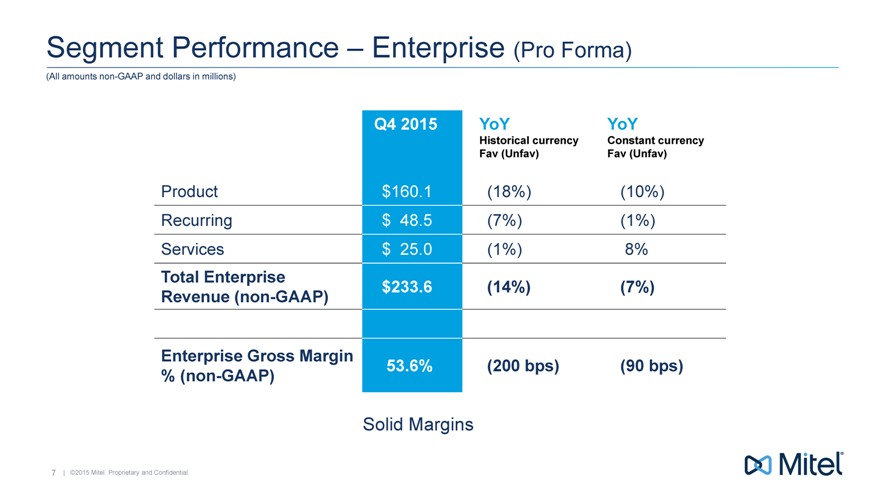
Segment Performance – Enterprise (Pro Forma)
(All amounts non-GAAP and dollars in millions)
Q4 2015 YoY YoY
Historical currency Constant currency
Fav (Unfav) Fav (Unfav)
Product $ 160.1 (18%) (10%)
Recurring $ 48.5 (7%) (1%)
Services $ 25.0 (1%) 8%
Total Enterprise $ 233.6 (14%) (7%)
Revenue (non-GAAP)
Enterprise Gross Margin 53.6% (200 bps) (90 bps)
% (non-GAAP)
Solid Margins
| 7 |
|
| ©2015 Mitel. Proprietary and Confidential. |
|
|
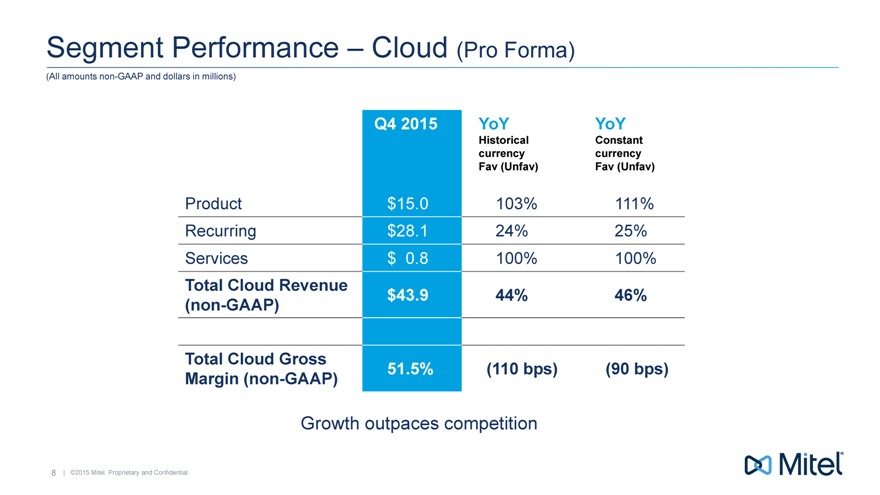
Segment Performance – Cloud (Pro Forma)
(All amounts non-GAAP and dollars in millions)
Q4 2015 YoY YoY
Historical Constant
currency currency
Fav (Unfav) Fav (Unfav)
Product $ 15.0 103% 111%
Recurring $ 28.1 24% 25%
Services $ 0.8 100% 100%
Total Cloud Revenue $ 43.9 44% 46%
(non-GAAP)
Total Cloud Gross 51.5% (110 bps) (90 bps)
Margin (non-GAAP)
Growth outpaces competition
| 8 |
|
| ©2015 Mitel. Proprietary and Confidential. |
|
|
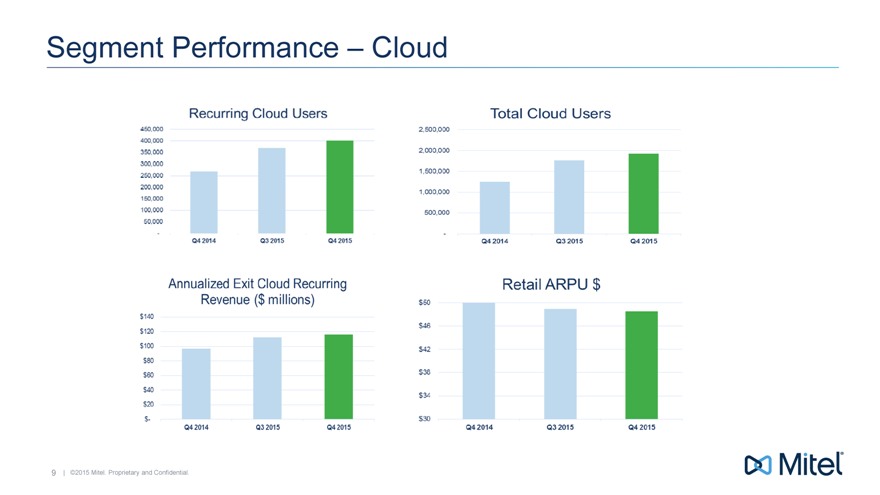
Segment Performance – Cloud
9 | ©2015 Mitel. Proprietary and Confidential.
|
|
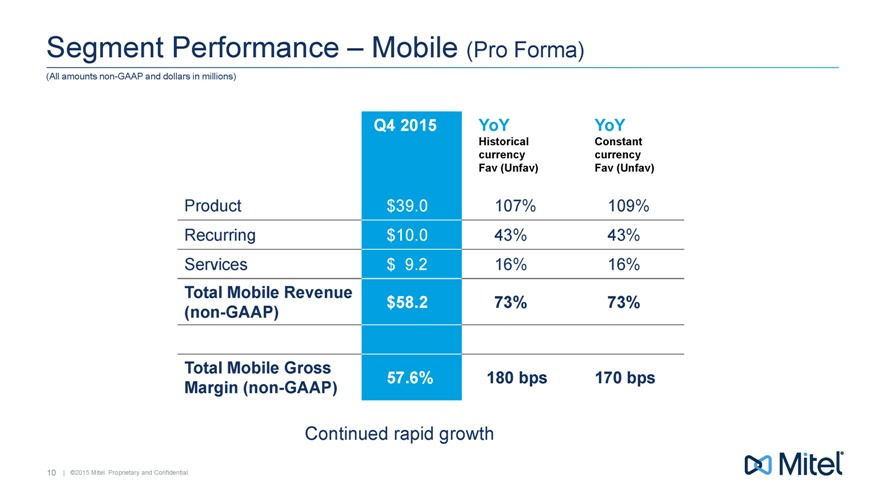
Segment Performance – Mobile (Pro Forma)
(All amounts non-GAAP and dollars in millions)
Q4 2015 YoY YoY
Historical Constant
currency currency
Fav (Unfav) Fav (Unfav)
Product $ 39.0 107% 109%
Recurring $ 10.0 43% 43%
Services $ 9.2 16% 16%
Total Mobile Revenue $ 58.2 73% 73%
(non-GAAP)
Total Mobile Gross
Margin (non-GAAP) 57.6% 180 bps 170 bps
Continued rapid growth
10 | ©2015 Mitel. Proprietary and Confidential.
|
|
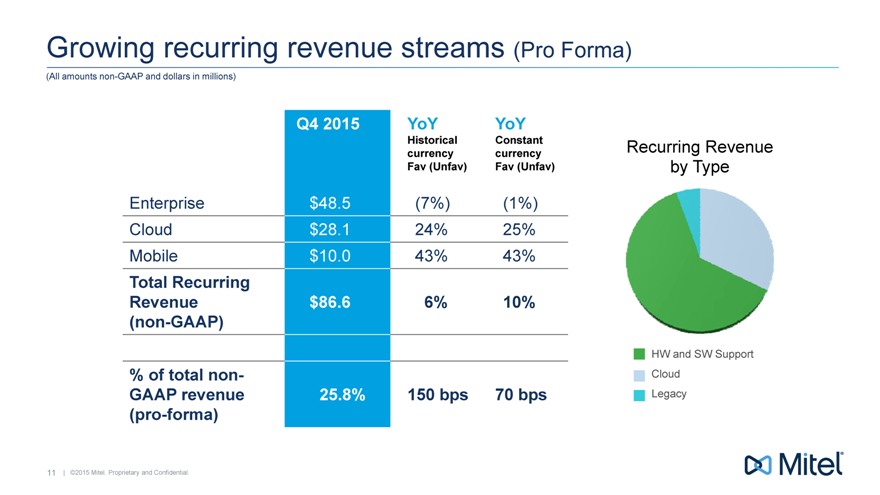
Growing recurring revenue streams (Pro Forma)
(All amounts non-GAAP and dollars in millions)
Q4 2015 YoY YoY
currency Historical currency Constant Recurring Revenue
Fav (Unfav) Fav (Unfav) by Type
Enterprise $ 48.5 (7%) (1%)
Cloud $ 28.1 24% 25%
Mobile $ 10.0 43% 43%
Total Recurring
Revenue $ 86.6 6% 10%
(non-GAAP)
HW and SW Support
% of total non- Cloud
GAAP revenue 25.8% 150 bps 70 bps Legacy
(pro-forma)
11 | ©2015 Mitel. Proprietary and Confidential.
|
|
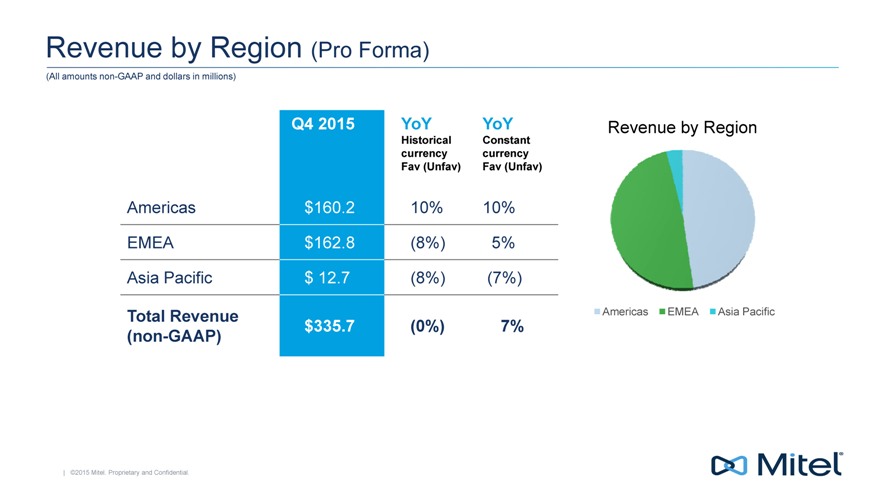
Revenue by Region (Pro Forma)
(All amounts non-GAAP and dollars in millions)
Q4 2015 YoY YoY Revenue by Region
Historical Constant
currency currency
Fav (Unfav) Fav (Unf
Americas $ 160.2 10% 10%
EMEA $ 162.8 (8%) 5%
Asia Pacific $ 12.7 (8%) (7%)
Total Revenue Americas EMEA Asia Pacific
(non-GAAP) $ 335.7 (0%) 7%
| ©2015 Mitel. Proprietary and Confidential.
|
|
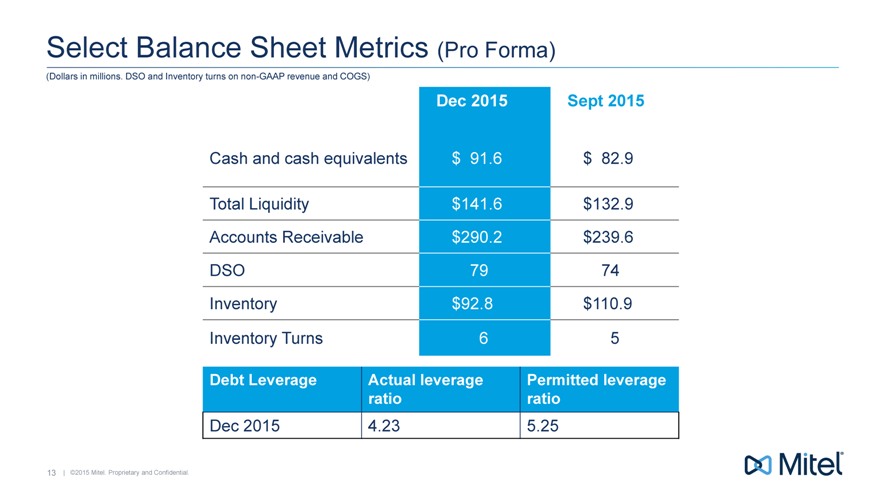
Select Balance Sheet Metrics (Pro Forma)
(Dollars in millions. DSO and Inventory turns on non-GAAP revenue and COGS)
Dec 2015 Sept 2015
Cash and cash equivalents $ 91.6 $ 82.9
Total Liquidity $ 141.6 $ 132.9
Accounts Receivable $ 290.2 $ 239.6
DSO 79 74
Inventory $ 92.8 $ 110.9
Inventory Turns 6 5
Debt Leverage Actual leverage Permitted leverage
ratio ratio
Dec 2015 4.23 5.25
13 | ©2015 Mitel. Proprietary and Confidential.
|
|
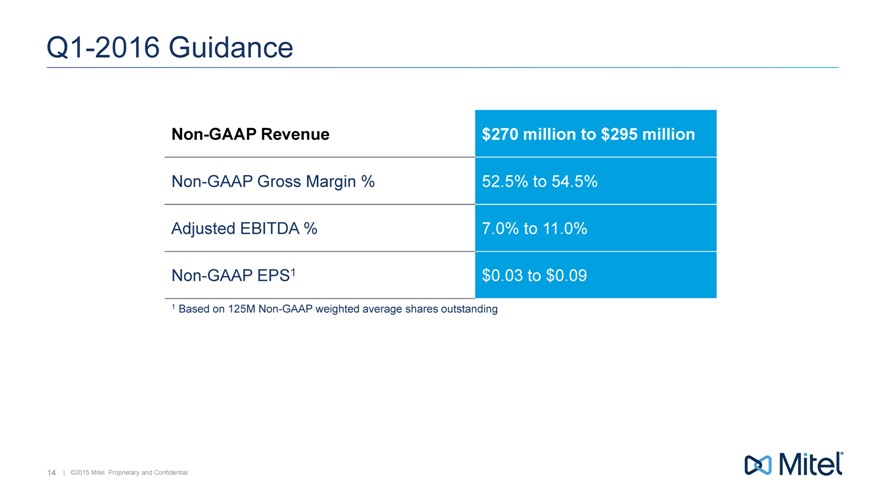
Q1-2016 Guidance
Non-GAAP Revenue $270 million to $295 million
Non-GAAP Gross Margin % 52.5% to 54.5%
Adjusted EBITDA % 7.0% to 11.0%
Non-GAAP EPS1 $0.03 to $0.09
| 1 |
|
Based on 125M Non-GAAP weighted average shares outstanding |
14 | ©2015 Mitel. Proprietary and Confidential.
|
|
Appendix
15 | ©2015 Mitel. Proprietary and Confidential.
|
|
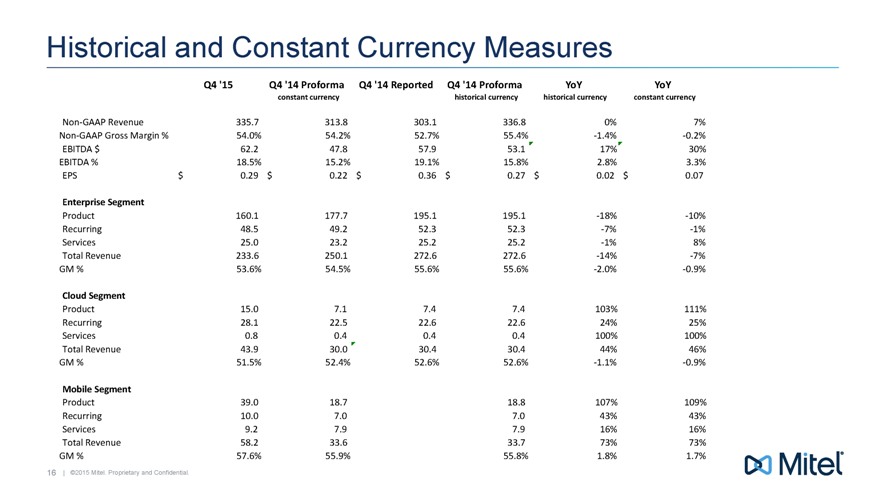
Historical and Constant Currency Measures
Q4 ‘15 Q4 ‘14 Proforma Q4 ‘14 Reported Q4 ‘14 Proforma YoY YoY
constant currency historical currency historical currency constant currency
Non-GAAP Revenue 335.7 313.8 303.1 336.8 0% 7%
Non-GAAP Gross Margin % 54.0% 54.2% 52.7% 55.4% -1.4% -0.2%
EBITDA $ 62.2 47.8 57.9 53.1 17% 30%
EBITDA % 18.5% 15.2% 19.1% 15.8% 2.8% 3.3%
EPS $ 0.29 $ 0.22 $ 0.36 $ 0.27 $ 0.02 $ 0.07
Enterprise Segment
Product 160.1 177.7 195.1 195.1 -18% -10%
Recurring 48.5 49.2 52.3 52.3 -7% -1%
Services 25.0 23.2 25.2 25.2 -1% 8%
Total Revenue 233.6 250.1 272.6 272.6 -14% -7%
GM % 53.6% 54.5% 55.6% 55.6% -2.0% -0.9%
Cloud Segment
Product 15.0 7.1 7.4 7.4 103% 111%
Recurring 28.1 22.5 22.6 22.6 24% 25%
Services 0.8 0.4 0.4 0.4 100% 100%
Total Revenue 43.9 30.0 30.4 30.4 44% 46%
GM % 51.5% 52.4% 52.6% 52.6% -1.1% -0.9%
Mobile Segment
Product 39.0 18.7 18.8 107% 109%
Recurring 10.0 7.0 7.0 43% 43%
Services 9.2 7.9 7.9 16% 16%
Total Revenue 58.2 33.6 33.7 73% 73%
GM % 57.6% 55.9% 55.8% 1.8% 1.7%
16 | ©2015 Mitel. Proprietary and Confidential.
|
|

#Mitel
Serious News for Serious Traders! Try StreetInsider.com Premium Free!
You May Also Be Interested In
- CIDARA Therapeutics ALERT: Bragar Eagel & Squire, P.C. is Investigating Cidara Therapeutics, Inc. on Behalf of Cidara Therapeutics Stockholders and Encourages Investors to Contact the Firm
- Banco Itaú Chile Files Material Event Notice announcing Extraordinary General Shareholders’ Meeting Agreements
- Perk Labs Announces Closing of Non-Brokered Private Placements
Create E-mail Alert Related Categories
SEC FilingsSign up for StreetInsider Free!
Receive full access to all new and archived articles, unlimited portfolio tracking, e-mail alerts, custom newswires and RSS feeds - and more!
