

Form 6-K CREDIT SUISSE GROUP AG For: Jan 08
 Tweet
Tweet Share
ShareUNITED STATES
SECURITIES AND EXCHANGE COMMISSION
Washington, D.C. 20549
______________
Form 6-K
______________
REPORT OF FOREIGN PRIVATE ISSUER PURSUANT TO RULE 13a-16 OR 15d-16
UNDER THE SECURITIES EXCHANGE ACT OF 1934
January 8, 2016
Commission File Number 001-15244
CREDIT SUISSE GROUP AG
(Translation of registrant’s name into English)
Paradeplatz 8, 8001 Zurich, Switzerland
(Address of principal executive office)
______________
Commission File Number 001-33434
CREDIT SUISSE AG
(Translation of registrant’s name into English)
Paradeplatz 8, 8001 Zurich, Switzerland
(Address of principal executive office)
______________
Indicate by check mark whether the registrant files or will file annual reports under cover of Form 20-F or Form 40-F.
|
Form 20-F ☒
|
Form 40-F ☐
|
Indicate by check mark if the registrant is submitting the Form 6-K in paper as permitted by Regulation S-T Rule 101(b)(1):
Note: Regulation S-T Rule 101(b)(1) only permits the submission in paper of a Form 6-K if submitted solely to provide an attached annual report to security holders.
Indicate by check mark if the registrant is submitting the Form 6-K in paper as permitted by Regulation S-T Rule 101(b)(7):
Note: Regulation S-T Rule 101(b)(7) only permits the submission in paper of a Form 6-K if submitted to furnish a report or other document that the registrant foreign private issuer must furnish and make public under the laws of the jurisdiction in which the registrant is incorporated, domiciled or legally organized (the registrant’s “home country”), or under the rules of the home country exchange on which the registrant’s securities are traded, as long as the report or other document is not a press release, is not required to be and has not been distributed to the registrant’s security holders, and, if discussing a material event, has already been the subject of a Form 6-K submission or other Commission filing on EDGAR.
This report on Form 6-K of Credit Suisse Group AG and Credit Suisse AG hereby incorporates by reference into the Registration Statement on Form F-3 (file no. 333-202913), the Registration Statements on Form S-8 (file no. 333-101259 and file no. 333-208152) and the Registration Statement on Form F-4 (file no. 333-207696-01) the slides no. 12 through no. 16 of the “Presentation on historical financials under new reporting structure”.
Presentation on historical financials under new reporting structure January 8, 2016
Disclaimer Cautionary statement regarding forward-looking statementsThis presentation contains forward-looking statements that involve inherent risks and uncertainties, and we might not be able to achieve the predictions, forecasts, projections and other outcomes we describe or imply in forward-looking statements. A number of important factors could cause results to differ materially from the plans, objectives, expectations, estimates and intentions we express in these forward-looking statements, including those we identify in "Risk Factors" in our Annual Report on Form 20-F for the fiscal year ended December 31, 2014 and in "Cautionary statement regarding forward-looking information" in our third quarter earnings release 2015 filed with the US Securities and Exchange Commission, and in other public filings and press releases. We do not intend to update these forward-looking statements except as may be required by applicable law.Statement regarding purpose and basis of presentationThe purpose of this presentation is to provide a preliminary unaudited restatement of previously published historical financial information reflecting the new management structure announced on October 21, 2015. The restated historical financial information in this presentation has not been audited or reviewed by our independent public accountants, remains preliminary and will only be finalized with the publication of the 4Q15 Earnings Release, scheduled for February 4, 2016. In addition, "Illustrative“ presentations are not intended to be viewed as targets or projections, nor are they considered to be Key Performance Indicators. All such presentations are subject to a large number of inherent risks, assumptions and uncertainties, many of which are outside of our control. Accordingly, this information should not be relied on for any purpose. In preparing this presentation, management has made estimates and assumptions which affect the reported numbers. Actual results may differ. Figures throughout presentation may also be subject to rounding adjustments. Certain figures presented herein differ from those presented on October 21, 2015, reflecting our continuing refinement of the data pending its finalization for the 4Q15 Earnings Release.Statement regarding capital, liquidity and leverageAs of January 1, 2013, Basel 3 was implemented in Switzerland along with the Swiss “Too Big to Fail” legislation and regulations thereunder. As of January 1, 2015, the Bank for International Settlements (BIS) leverage ratio framework, as issued by the Basel Committee on Banking Supervision (BCBS), was implemented in Switzerland by FINMA. Our related disclosures are in accordance with our interpretation of such requirements, including relevant assumptions. Changes in the interpretation of these requirements in Switzerland or in any of our assumptions or estimates could result in different numbers from those shown in this presentation. Capital and ratio numbers for periods prior to 2013 are based on estimates, which are calculated as if the Basel 3 framework had been in place in Switzerland during such periods. Unless otherwise noted, leverage exposure is based on the BIS leverage ratio framework and consists of period-end balance sheet assets and prescribed regulatory adjustments. Leverage amounts for 4Q14, which are presented in order to show meaningful comparative information, are based on estimates which are calculated as if the BIS leverage ratio framework had been implemented in Switzerland at such time. Beginning in 2015, the Swiss leverage ratio is calculated as Swiss total capital, divided by period-end leverage exposure. The look-through BIS tier 1 leverage ratio and CET1 leverage ratio are calculated as look-through BIS tier 1 capital and CET1 capital, respectively, divided by end-period leverage exposure. 2 January 8, 2016
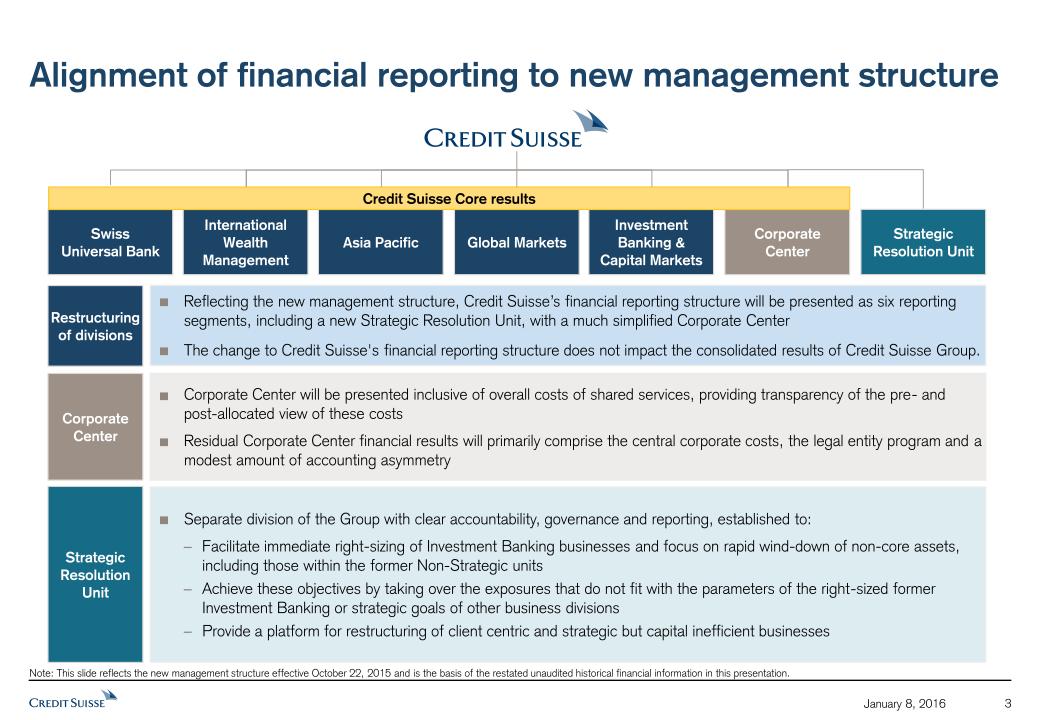
3 Corporate Center Strategic Resolution Unit Separate division of the Group with clear accountability, governance and reporting, established to:Facilitate immediate right-sizing of Investment Banking businesses and focus on rapid wind-down of non-core assets, including those within the former Non-Strategic unitsAchieve these objectives by taking over the exposures that do not fit with the parameters of the right-sized former Investment Banking or strategic goals of other business divisionsProvide a platform for restructuring of client centric and strategic but capital inefficient businesses Corporate Center will be presented inclusive of overall costs of shared services, providing transparency of the pre- and post-allocated view of these costsResidual Corporate Center financial results will primarily comprise the central corporate costs, the legal entity program and a modest amount of accounting asymmetry Restructuring of divisions Reflecting the new management structure, Credit Suisse’s financial reporting structure will be presented as six reporting segments, including a new Strategic Resolution Unit, with a much simplified Corporate CenterThe change to Credit Suisse's financial reporting structure does not impact the consolidated results of Credit Suisse Group. Alignment of financial reporting to new management structure InternationalWealth Management Global Markets Swiss Universal Bank Corporate Center Strategic Resolution Unit Asia Pacific Investment Banking & Capital Markets Credit Suisse Core results Note: This slide reflects the new management structure effective October 22, 2015 and is the basis of the restated unaudited historical financial information in this presentation. January 8, 2016
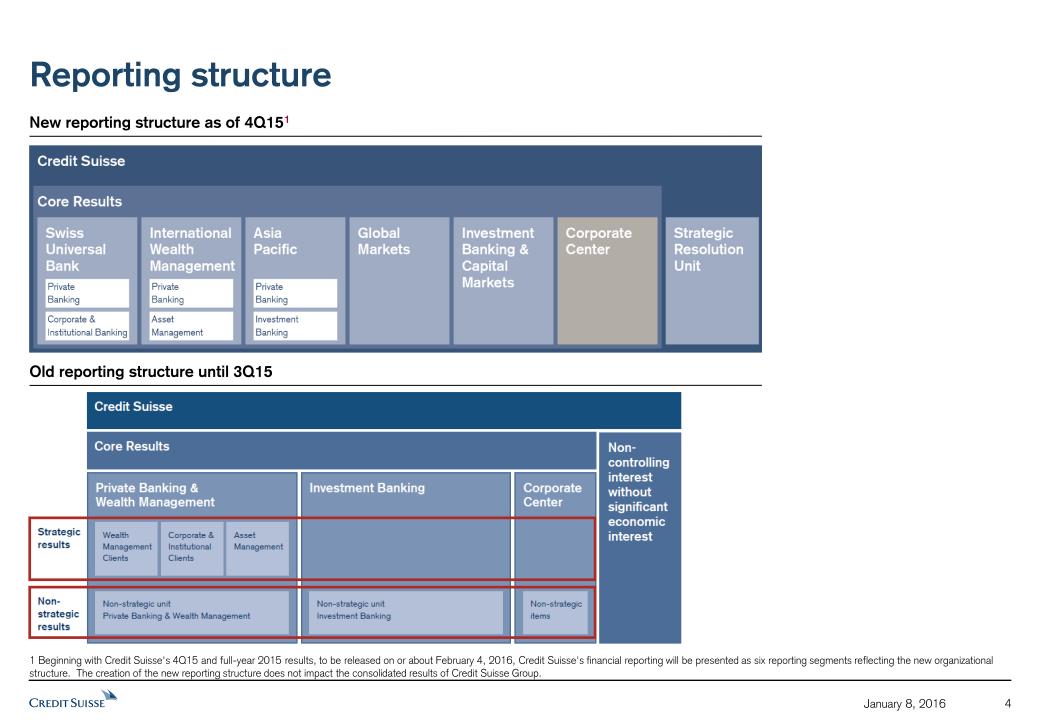
Reporting structure 4 New reporting structure as of 4Q151 Old reporting structure until 3Q15 January 8, 2016 1 Beginning with Credit Suisse's 4Q15 and full-year 2015 results, to be released on or about February 4, 2016, Credit Suisse's financial reporting will be presented as six reporting segments reflecting the new organizational structure. The creation of the new reporting structure does not impact the consolidated results of Credit Suisse Group.
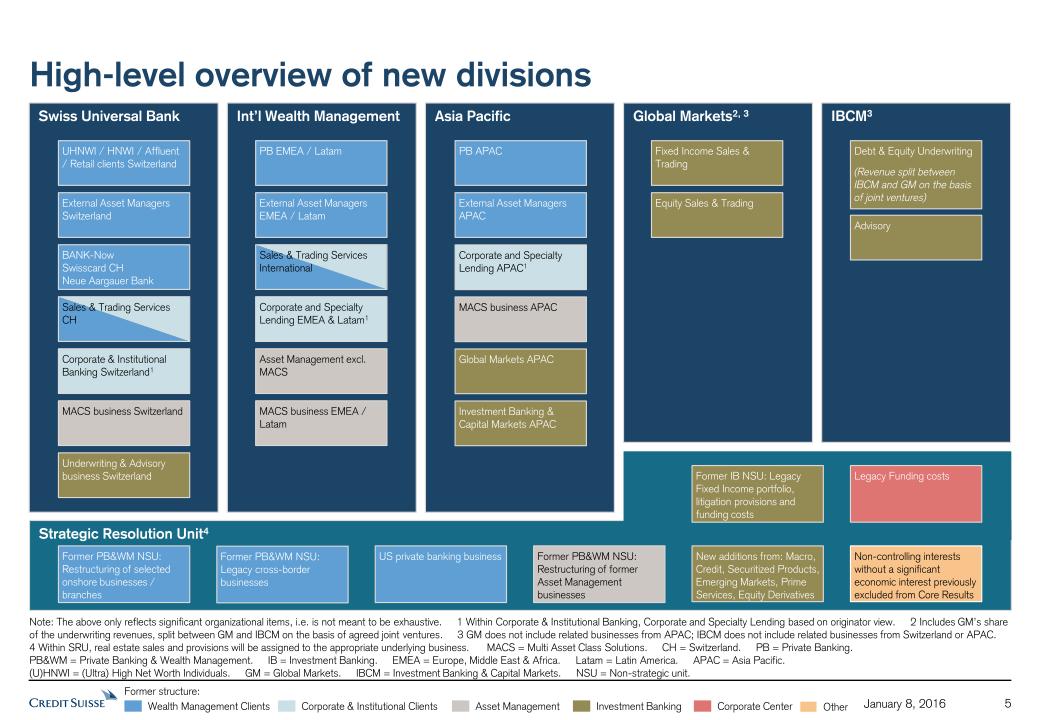
High-level overview of new divisions 5 January 8, 2016 Note: The above only reflects significant organizational items, i.e. is not meant to be exhaustive. 1 Within Corporate & Institutional Banking, Corporate and Specialty Lending based on originator view. 2 Includes GM’s share of the underwriting revenues, split between GM and IBCM on the basis of agreed joint ventures. 3 GM does not include related businesses from APAC; IBCM does not include related businesses from Switzerland or APAC. 4 Within SRU, real estate sales and provisions will be assigned to the appropriate underlying business. MACS = Multi Asset Class Solutions. CH = Switzerland. PB = Private Banking.PB&WM = Private Banking & Wealth Management. IB = Investment Banking. EMEA = Europe, Middle East & Africa. Latam = Latin America. APAC = Asia Pacific. (U)HNWI = (Ultra) High Net Worth Individuals. GM = Global Markets. IBCM = Investment Banking & Capital Markets. NSU = Non-strategic unit. Strategic Resolution Unit4 Swiss Universal Bank UHNWI / HNWI / Affluent / Retail clients Switzerland Corporate & Institutional Banking Switzerland1 External Asset Managers Switzerland MACS business Switzerland Underwriting & Advisory business Switzerland BANK-NowSwisscard CHNeue Aargauer Bank Sales & Trading Services CH Global Markets2, 3 Equity Sales & Trading Wealth Management Clients Corporate & Institutional Clients Asset Management Investment Banking Corporate Center Former structure: Asia Pacific External Asset Managers APAC PB APAC Global Markets APAC Investment Banking & Capital Markets APAC Corporate and Specialty Lending APAC1 MACS business APAC Int’l Wealth Management External Asset Managers EMEA / Latam PB EMEA / Latam Asset Management excl. MACS Sales & Trading Services International Corporate and Specialty Lending EMEA & Latam1 MACS business EMEA / Latam IBCM3 Advisory Former PB&WM NSU: Restructuring of former Asset Management businesses New additions from: Macro, Credit, Securitized Products, Emerging Markets, Prime Services, Equity Derivatives Former PB&WM NSU: Restructuring of selected onshore businesses / branches Former PB&WM NSU: Legacy cross-border businesses US private banking business Former IB NSU: Legacy Fixed Income portfolio, litigation provisions and funding costs Other Legacy Funding costs Non-controlling interests without a significant economic interest previously excluded from Core Results Fixed Income Sales & Trading Debt & Equity Underwriting(Revenue split between IBCM and GM on the basis of joint ventures)

Transfers from PB&WM to new divisions 2014 PTI: 1,333 mnRWA: 31 bnLev.: 84 bn PTI: (1,358) mnRWA: 10 bnLev.: 24 bn Full year 2014 in CHF PTI: 2,088 mnRWA: 106 bnLev.: 385 bn PTI: 341 mnRWA: 8 bnLev.: 35 bn PTI: 1,775 mnRWA: 57 bnLev.: 239 bn Investment Banking Private Banking & Wealth Management Corporate Center InternationalWealth Management Investment Banking &Capital Markets Corporate Center Asia Pacific Swiss Universal Bank Strategic Resolution Unit Global Markets PB&WM = (former) Private Banking & Wealth Management division. PTI = Pre-tax income. RWA = Risk-weighted assets. Lev. = Leverage exposure (look-through). Note: RWA and Leverage Exposure under the old structure reflect certain reclassifications between the divisions and Corporate Center. 6 January 8, 2016 PTI: (4) mnRWA: -Lev.: 2 bn
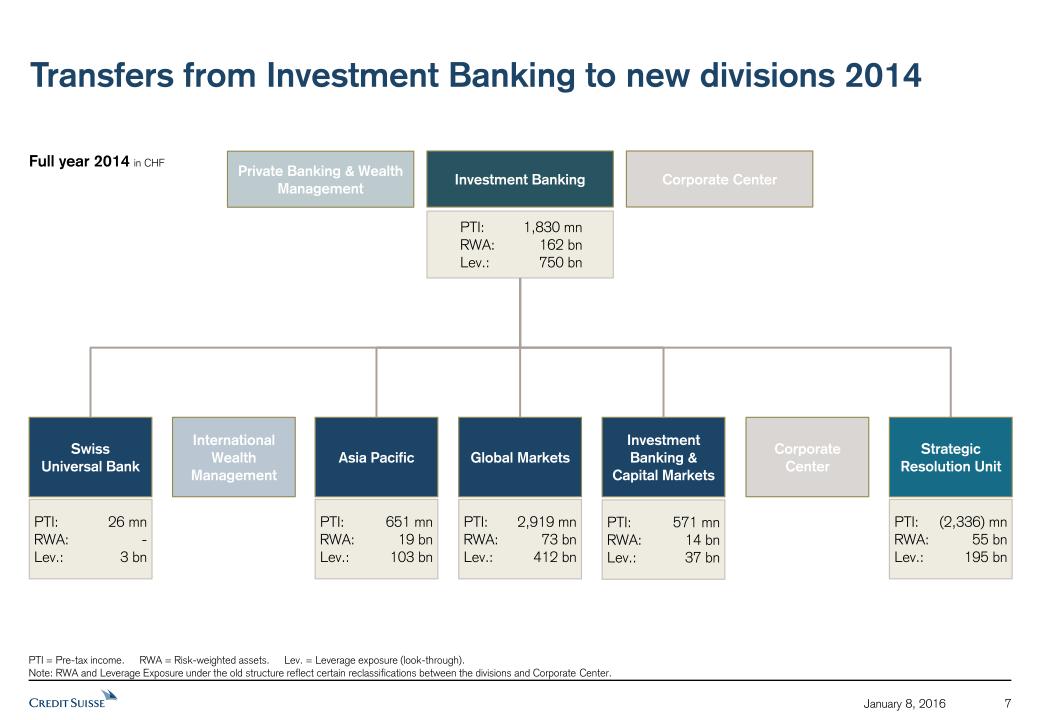
PTI: 2,919 mnRWA: 73 bnLev.: 412 bn PTI: 651 mnRWA: 19 bnLev.: 103 bn PTI: (2,336) mnRWA: 55 bnLev.: 195 bn PTI: 571 mnRWA: 14 bnLev.: 37 bn Investment Banking Private Banking & Wealth Management Corporate Center PTI: 1,830 mnRWA: 162 bnLev.: 750 bn InternationalWealth Management Investment Banking &Capital Markets Corporate Center Asia Pacific Swiss Universal Bank Global Markets Strategic Resolution Unit PTI = Pre-tax income. RWA = Risk-weighted assets. Lev. = Leverage exposure (look-through).Note: RWA and Leverage Exposure under the old structure reflect certain reclassifications between the divisions and Corporate Center. PTI: 26 mnRWA: -Lev.: 3 bn Transfers from Investment Banking to new divisions 2014 Full year 2014 in CHF 7 January 8, 2016

InternationalWealth Management Investment Banking &Capital Markets Corporate Center Asia Pacific PTI: (121) mnRWA: -Lev.: - PTI: (262) mnRWA: -Lev.: - PTI: (46) mn1RWA: 16 bnLev.: 15 bn PTI: 173 mnRWA: -Lev.: - PTI: (93) mnRWA: -Lev.: - PTI: (278) mnRWA: -Lev.: - Swiss Universal Bank Strategic Resolution Unit Global Markets PTI: (60) mnRWA: -Lev.: - Investment Banking Private Banking & Wealth Management Corporate Center PTI = Pre-tax income. RWA = Risk-weighted assets. Lev. = Leverage exposure (look-through). 1 Includes impact from FVoD of CHF 543 mn. FVoD = Fair value on own debt.Note: RWA and Leverage Exposure under the old structure reflect certain reclassifications between the divisions and Corporate Center. PTI: (686) mn1RWA: 16 bnLev.: 15 bn Transfers from Corporate Center to new divisions 2014 Full year 2014 in CHF 8 January 8, 2016

Transfers from PB&WM to new divisions 9M15 PTI: 795 mnRWA: 31 bnLev.: 91 bn PTI: (152) mnRWA: 9 bnLev.: 18 bn 9M15 in CHF PTI: 2,418 mnRWA: 107 bnLev.: 379 bn PTI: 321 mnRWA: 8 bnLev.: 35 bn PTI: 1,429 mnRWA: 58 bnLev.: 232 bn Investment Banking Private Banking & Wealth Management Corporate Center InternationalWealth Management Investment Banking &Capital Markets Corporate Center Asia Pacific Swiss Universal Bank Strategic Resolution Unit Global Markets PB&WM = (former) Private Banking & Wealth Management division. PTI = Pre-tax income. RWA = Risk-weighted assets. Lev. = Leverage exposure (look-through).Note: RWA and Leverage Exposure under the old structure reflect certain reclassifications between the divisions and Corporate Center. 9 January 8, 2016 PTI: 22 mnRWA: 1 bnLev.: 3 bn
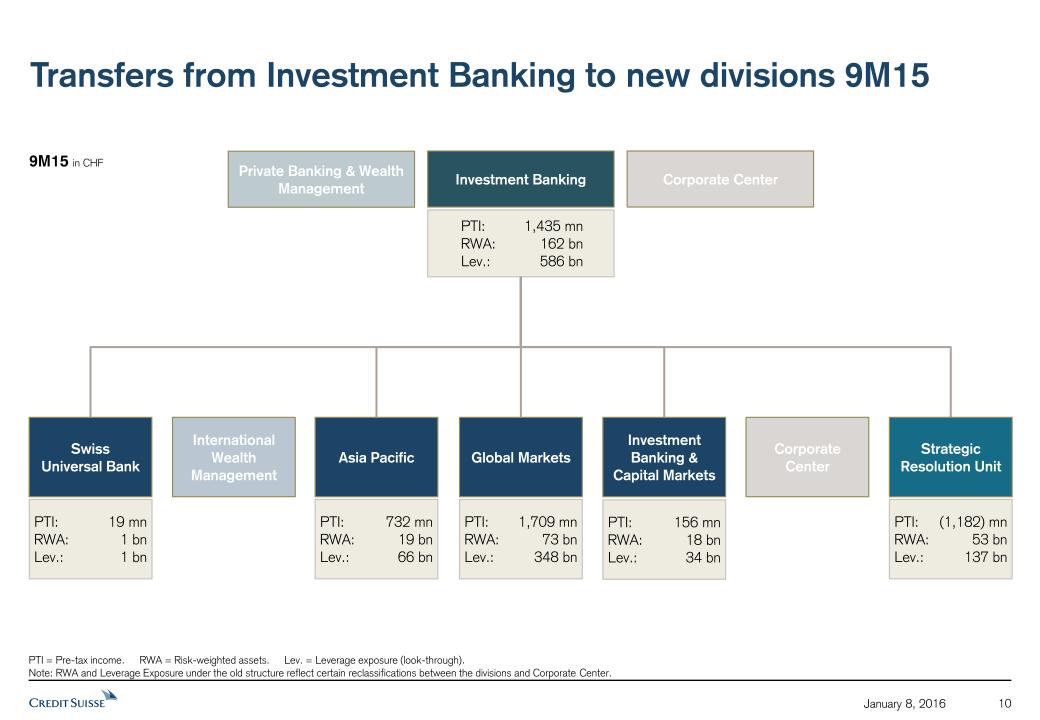
PTI: 1,709 mnRWA: 73 bnLev.: 348 bn PTI: 732 mnRWA: 19 bnLev.: 66 bn PTI: (1,182) mnRWA: 53 bnLev.: 137 bn PTI: 156 mnRWA: 18 bnLev.: 34 bn Investment Banking Private Banking & Wealth Management Corporate Center PTI: 1,435 mnRWA: 162 bnLev.: 586 bn InternationalWealth Management Investment Banking &Capital Markets Corporate Center Asia Pacific Swiss Universal Bank Global Markets Strategic Resolution Unit PTI = Pre-tax income. RWA = Risk-weighted assets. Lev. = Leverage exposure (look-through).Note: RWA and Leverage Exposure under the old structure reflect certain reclassifications between the divisions and Corporate Center. PTI: 19 mnRWA: 1 bnLev.: 1 bn Transfers from Investment Banking to new divisions 9M15 10 January 8, 2016 9M15 in CHF
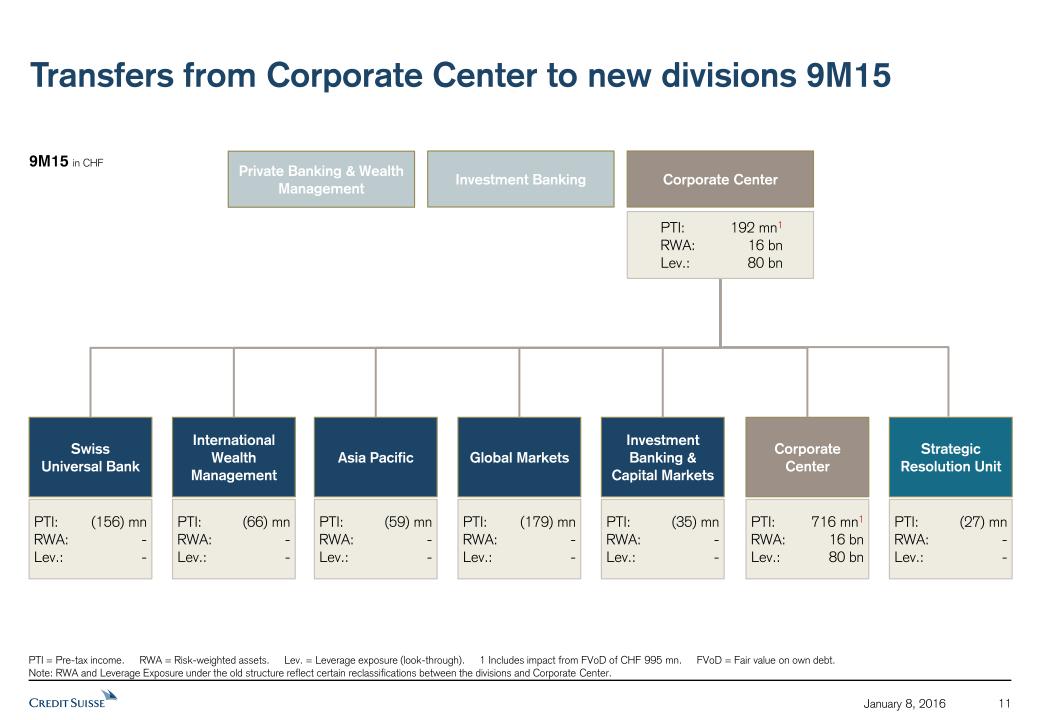
InternationalWealth Management Investment Banking &Capital Markets Corporate Center Asia Pacific PTI: (66) mnRWA: -Lev.: - PTI: (179) mnRWA: -Lev.: - PTI: 716 mn1RWA: 16 bnLev.: 80 bn PTI: (156) mnRWA: -Lev.: - PTI: (59) mnRWA: -Lev.: - PTI: (27) mnRWA: -Lev.: - Swiss Universal Bank Strategic Resolution Unit Global Markets PTI: (35) mnRWA: -Lev.: - Investment Banking Private Banking & Wealth Management Corporate Center PTI = Pre-tax income. RWA = Risk-weighted assets. Lev. = Leverage exposure (look-through). 1 Includes impact from FVoD of CHF 995 mn. FVoD = Fair value on own debt.Note: RWA and Leverage Exposure under the old structure reflect certain reclassifications between the divisions and Corporate Center. PTI: 192 mn1RWA: 16 bnLev.: 80 bn Transfers from Corporate Center to new divisions 9M15 11 January 8, 2016 9M15 in CHF

Financial Overview – Swiss Universal Bank 12 January 8, 2016 Private Banking 2014 9M15 Corp. & Inst. Banking 2014 9M15 Swiss Universal Bank 2014 9M15 Profit-ability Net revenues 3,914 2,680 1,807 1,413 5,721 4,093 Provision for credit losses 60 35 34 60 94 95 Operating expenses 2,626 1,942 1,025 764 3,651 2,706 Pre-tax income 1,228 703 748 589 1,976 1,292 Return on Capital1 16.5% 14.2% Capital Risk-weighted assets in bn Leverage exposure in bn 57 59 239 232 FTEs 13,200 13,900 Employees in CHF mn unless otherwise specified Assets under Management2 in bn 237 Assets Net New Assets in bn 3.8 6.1 FTEs = Full time equivalents. 1 Worst of return on 10% of average RWA and return on 3.5% of average leverage exposure; assumes tax rate of 30% for all periods. 2 With the update of the Group’s assets under management policy in 3Q15, certain AuM were reclassified as client assets; client assets is a broader measure than AuM as it includes transactional and custody accounts (assets held solely for transaction-related or safekeeping/custody purposes) and assets of corporate clients and public institutions used primarily for cash management or transaction-related purposes. AuM = Assets under Management. 276 263 5.5 6.4 259

Financial Overview – International Wealth Management 13 January 8, 2016 FTEs = Full time equivalents. 1 Worst of return on 10% of average RWA and return on 3.5% of average leverage exposure; assumes tax rate of 30% for all periods. 2 With the update of the Group’s assets under management policy in 3Q15, certain AuM were reclassified as client assets; client assets is a broader measure than AuM as it includes transactional and custody accounts (assets held solely for transaction-related or safekeeping/custody purposes) and assets of corporate clients and public institutions used primarily for cash management or transaction-related purposes. AuM = Assets under Management. Private Banking 2014 9M15 Asset Management 2014 9M15 Int’l Wealth Management 2014 9M15 3,127 2,284 1,624 964 4,751 3,248 12 11 0 0 12 11 2,320 1,691 1,207 817 3,527 2,508 795 582 417 147 1,212 729 27.0% 21.7% 31 31 84 91 8,700 8,900 in CHF mn unless otherwise specified Profit-ability Net revenues Provision for credit losses Operating expenses Pre-tax income Return on Capital1 Capital Risk-weighted assets in bn Leverage exposure in bn FTEs Employees Assets Net New Assets in bn 324 287 305 315 7.3 1.2 6.5 22.9 Assets under Management2 in bn

Financial Overview – Asia Pacific 14 January 8, 2016 FTEs = Full time equivalents. 1 Worst of return on 10% of average RWA and return on 3.5% of average leverage exposure; assumes tax rate of 30% for all periods. 2 With the update of the Group’s assets under management policy in 3Q15, certain AuM were reclassified as client assets; client assets is a broader measure than AuM as it includes transactional and custody accounts (assets held solely for transaction-related or safekeeping/custody purposes) and assets of corporate clients and public institutions used primarily for cash management or transaction-related purposes. AuM = Assets under Management. Private Banking 2014 9M15 Investment Banking 2014 9M15 Asia Pacific 2014 9M15 1,037 907 2,298 2,106 3,335 3,013 4 23 36 9 40 32 723 588 1,672 1,399 2,395 1,987 310 296 590 698 900 994 13.1% 23.0% 27 27 138 100 5,900 6,400 in CHF mn unless otherwise specified Profit-ability Net revenues Provision for credit losses Operating expenses Pre-tax income Return on Capital1 Capital Risk-weighted assets in bn Leverage exposure in bn FTEs Employees Assets Net New Assets in bn 151 139 17.5 14.8 Assets under Management2 in bn

Financial Overview – Global Markets and IBCM 15 January 8, 2016 GM = Global Markets. IBCM = Investment Banking & Capital Markets. FTEs = Full time equivalents. 1 Worst of return in USD on 10% of average RWA and return on 3.5% of average leverage exposure; assumes tax rate of 30% for all periods. in CHF mn unless otherwise specified Global Markets 2014 9M15 IBCM 2014 9M15 8,613 6,264 2,106 1,349 7 14 (2) 0 5,949 4,720 1,600 1,205 2,657 1,530 508 144 14.0% 10.9% 26.2% 8.8% 73 73 14 18 412 348 42 38 11,900 12,800 2,400 2,800 Profit-ability Net revenues Provision for credit losses Operating expenses Pre-tax income Return on Capital1 Capital Risk-weighted assets in bn Leverage exposure in bn FTEs Employees

Financial Overview – SRU and Corporate Center 16 January 8, 2016 SRU = Strategic Resolution Unit. n/m = not meaningful. FTEs = Full time equivalents. 1 Worst of return on 10% of average RWA and return on 3.5% of average leverage exposure; assumes tax rate of 30% for all periods.2 On January 5, 2016, the FASB issued Accounting Standards Update (ASU) No. 2016-01, Financial Instruments – Overall (Subtopic 825-10): Recognition and Measurement of Financial Assets and Financial Liabilities. This ASU requires the total change in the instrument-specific credit risk on fair value elected liabilities (also referred to as “own credit”) to be presented separately in other comprehensive income when the organization has elected to measure the liability at fair value in accordance with the fair value option for financial instruments. From the 1st of January 2016 onwards, Credit Suisse will adopt the new treatment of such valuation movements as other comprehensive income. FASB = Financial Accounting Standards Board. in CHF mn unless specified Strategic Resolution Unit 2014 9M15 Corporate Center2 2014 9M15 1,168 392 548 1,228 33 39 2 0 4,708 1,741 599 510 (3,573) (1,388) (53) 718 n/m n/m n/m n/m 65 62 16 16 219 156 15 80 3,400 3,000 300 300 Profit-ability Net revenues Provision for credit losses Operating expenses Pre-tax income Return on Capital1 Capital Risk-weighted assets in bn Leverage exposure in bn FTEs Employees
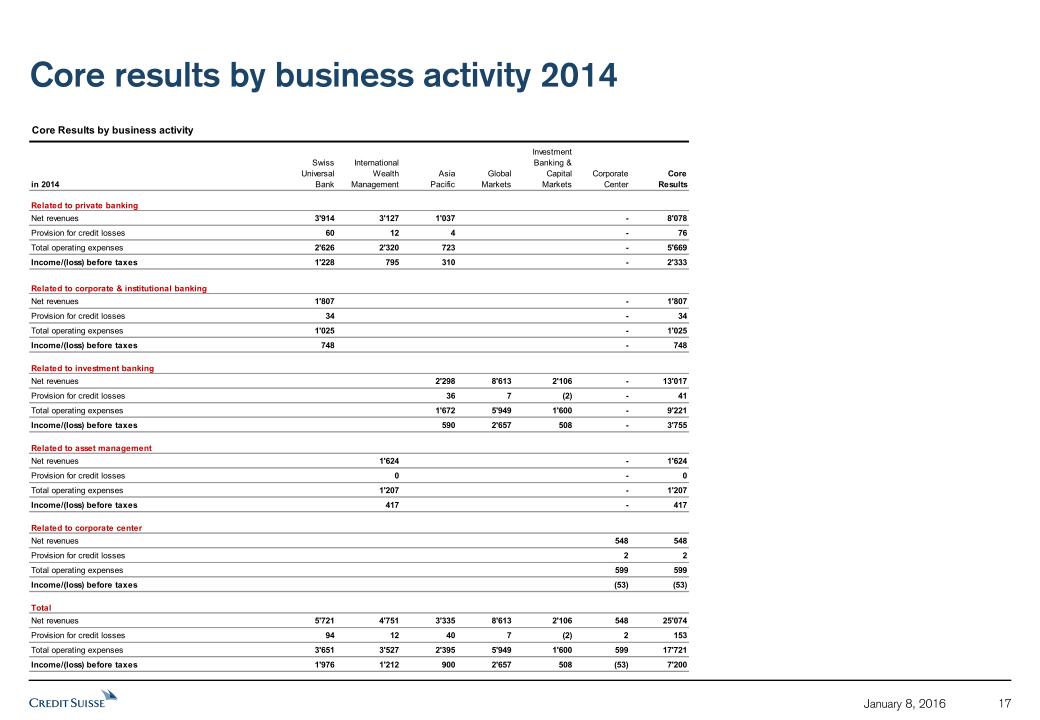
Core results by business activity 2014 17 January 8, 2016
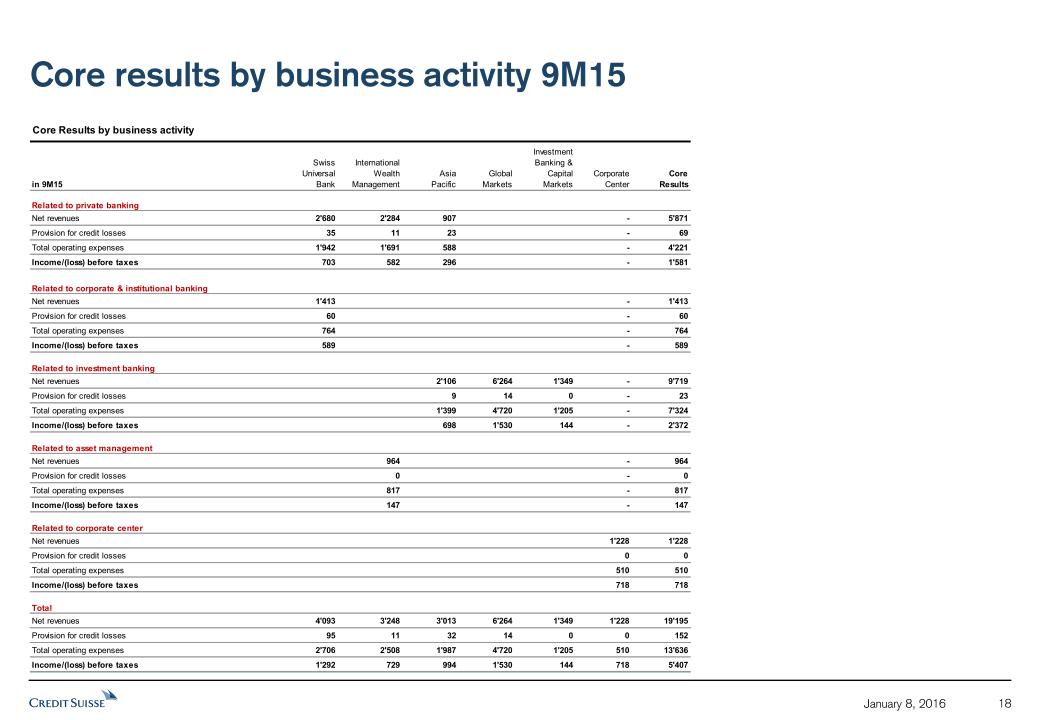
Core results by business activity 9M15 18 January 8, 2016

Corporate Center pre- & post allocations Corporate Center other operating expenses Corporate Center compensation & benefits 3,030 3,536 2,159 2,776 2,879 3,701 19 January 8, 2016 Corporate Center expenses in CHF mn Corporate Center total operating expenses 6,566 4,935 6,580 Shared Services employee allocations to divisions in FTEs Corp. Center expense allocations to divisions in CHF mn CHUB = Swiss Universal Bank. IWM = International Wealth Management. APAC = Asia Pacific. GM = Global Markets. IBCM = Investment Banking & Capital Markets. SRU = Strategic Resolution Unit.CC = Corporate Center. FTEs = Full time equivalents. 2014 9M15 9M15 annualized

Time series January 8, 2016 20
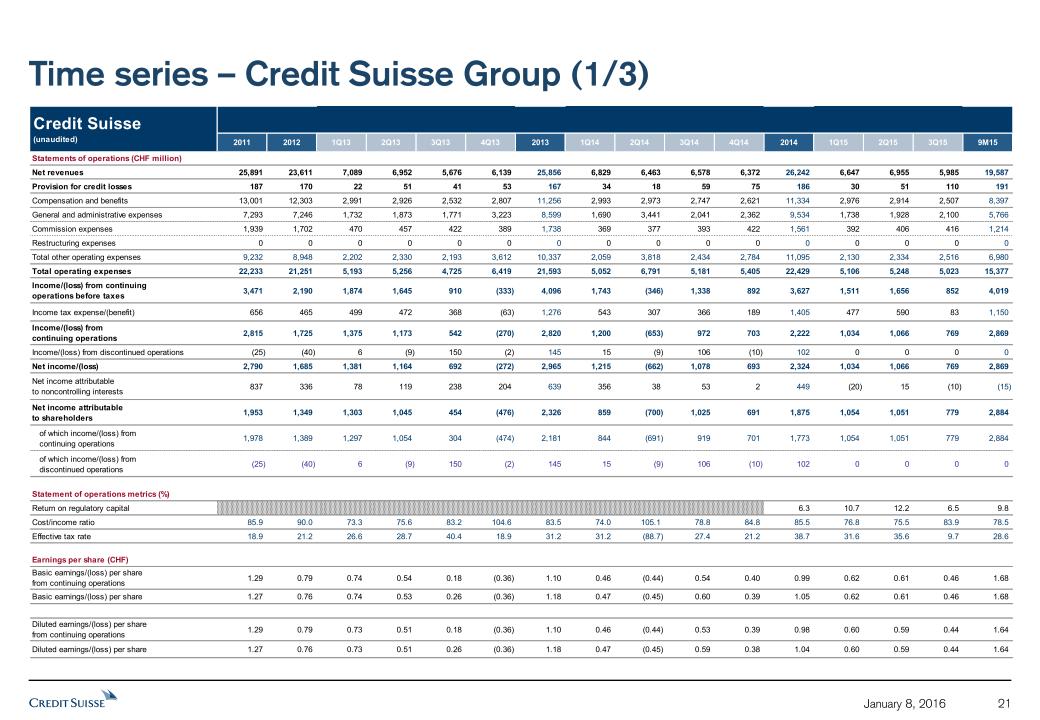
Time series – Credit Suisse Group (1/3) 21 January 8, 2016

Time series – Credit Suisse Group (2/3) 22 January 8, 2016
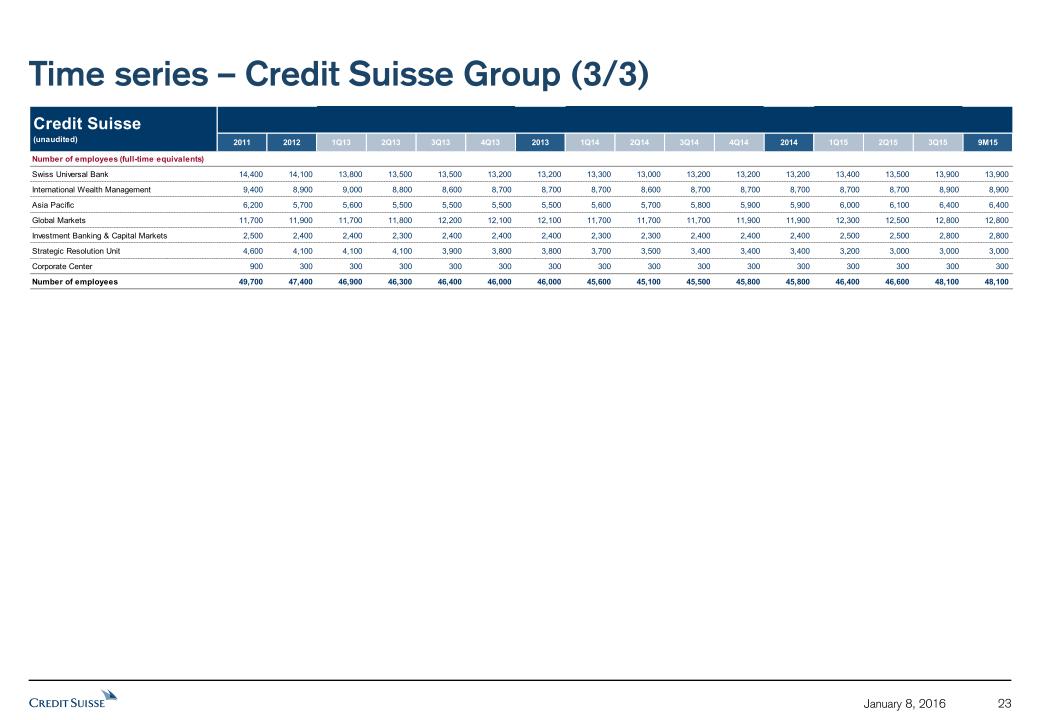
Time series – Credit Suisse Group (3/3) 23 January 8, 2016

Time series – Core Results 24 January 8, 2016

Time series – Swiss Universal Bank (1/2) 25 January 8, 2016
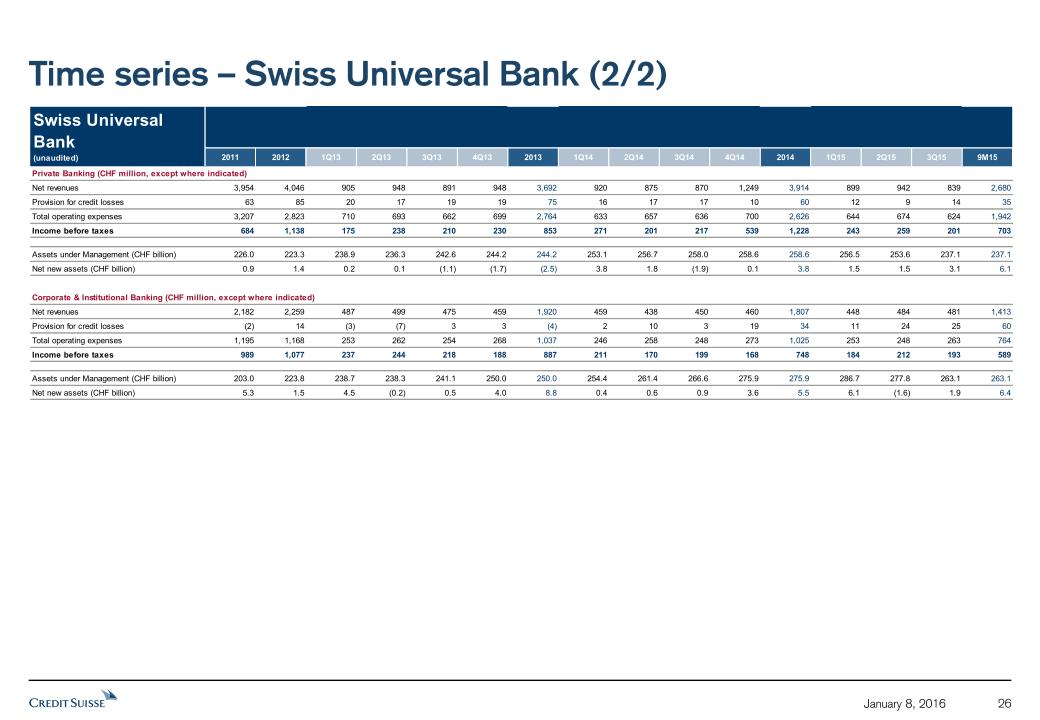
Time series – Swiss Universal Bank (2/2) 26 January 8, 2016

Time series – International Wealth Management (1/2) 27 January 8, 2016

Time series – International Wealth Management (2/2) 28 January 8, 2016
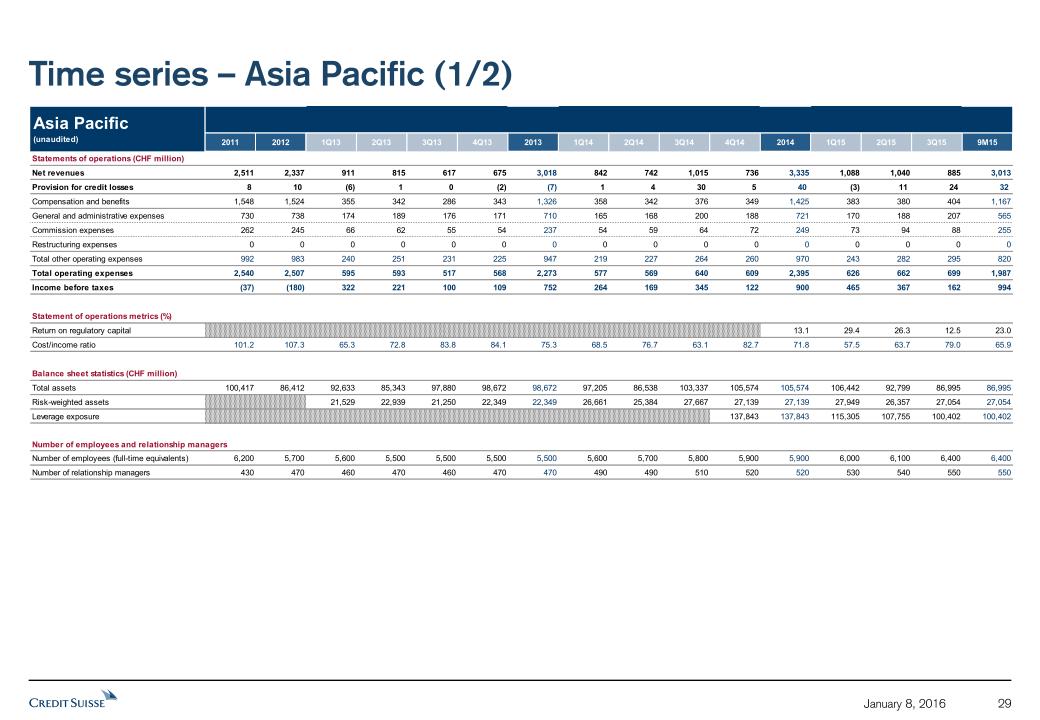
Time series – Asia Pacific (1/2) 29 January 8, 2016
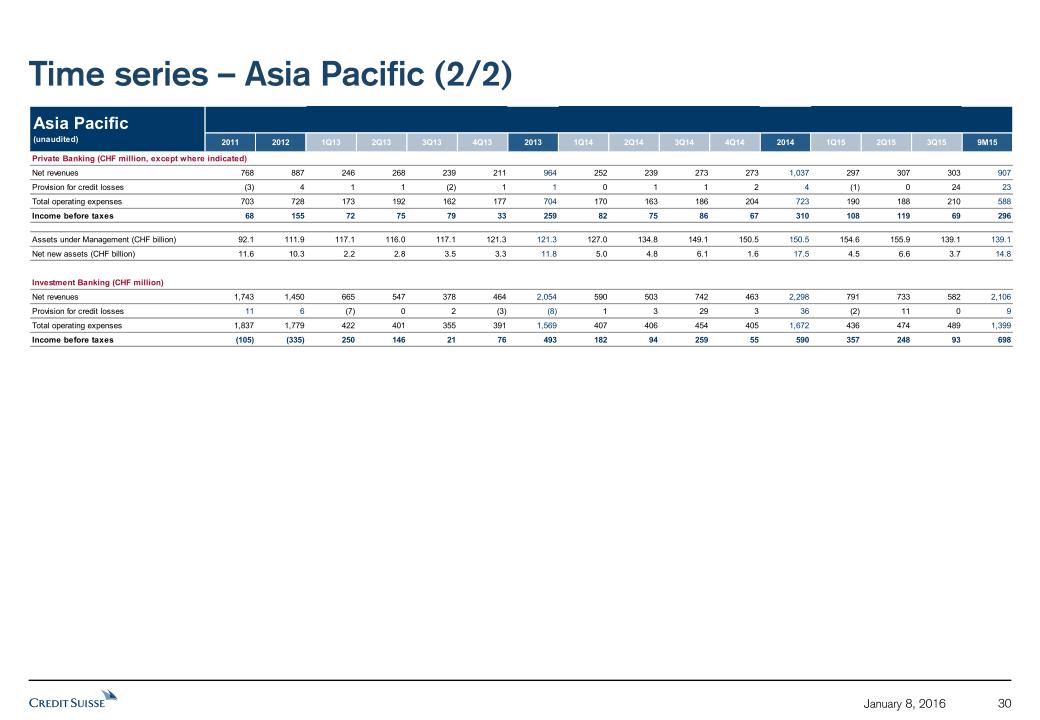
Time series – Asia Pacific (2/2) 30 January 8, 2016

Time series – Global Markets 31 January 8, 2016
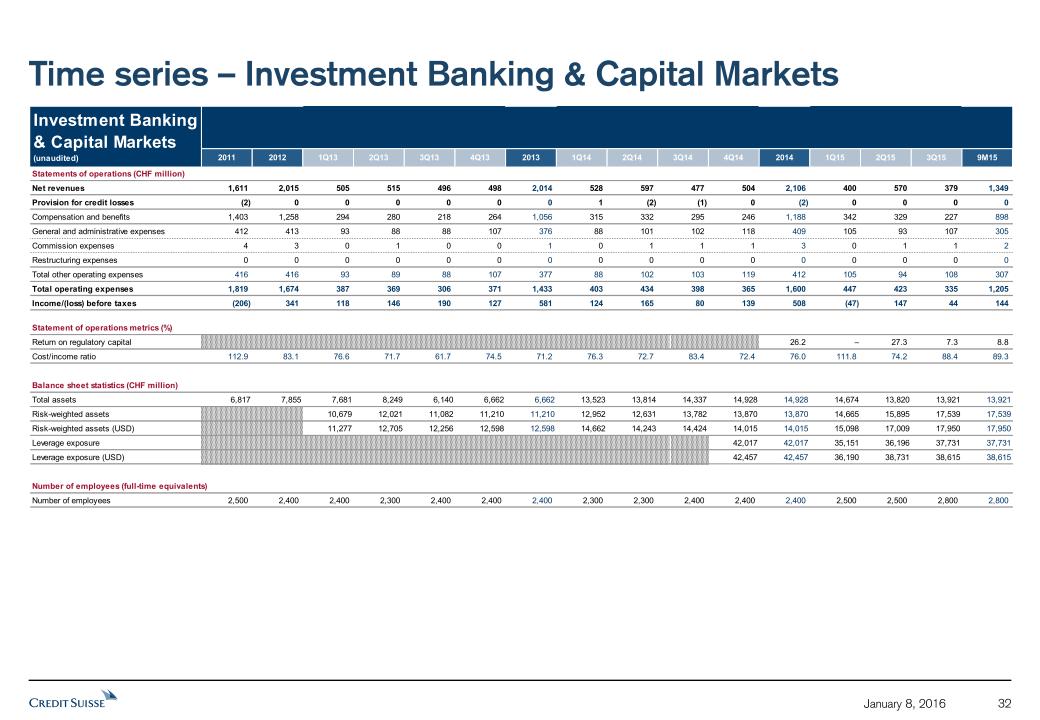
Time series – Investment Banking & Capital Markets 32 January 8, 2016
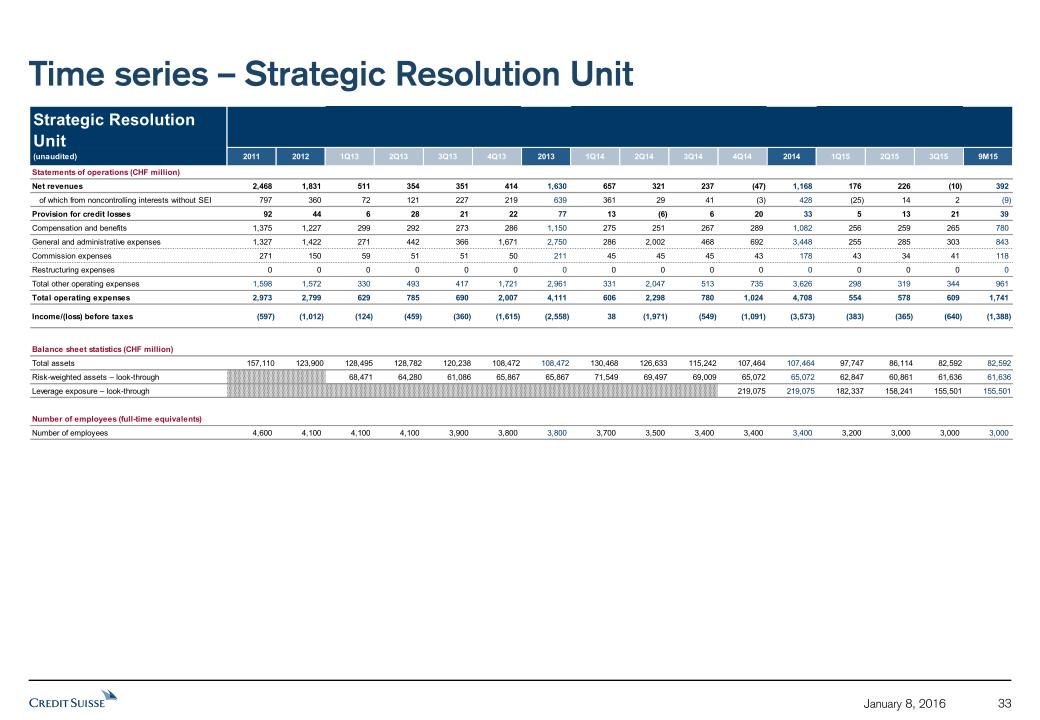
Time series – Strategic Resolution Unit 33 January 8, 2016

Time series – Corporate Center (1/2) 34 January 8, 2016

Time series – Corporate Center (2/2) 35 January 8, 2016

Time series – Assets under Management 36 January 8, 2016
January 8, 2016
SIGNATURES
Pursuant to the requirements of the Securities Exchange Act of 1934, the registrants have duly caused this report to be signed on their behalf by the undersigned, thereunto duly authorized.
|
CREDIT SUISSE GROUP AG and CREDIT SUISSE AG
|
||
|
(Registrants)
|
||
|
By:
|
/s/ Christian Schmid
|
|
|
Christian Schmid
|
||
|
Managing Director
|
||
| /s/ Zsolt Zsigray | ||
| Zsolt Zsigray | ||
| Date: January 8, 2016 | Vice President |
Serious News for Serious Traders! Try StreetInsider.com Premium Free!
You May Also Be Interested In
- Digital Realty Trust (DLR) Appoints Susan Swanezy to its Board
- Citi Downgrades UBS AG (UBSG:SW) (UBS) to Neutral
- MSCI Inc. (MSCI) PT Lowered to $425 at BofA Securities
Create E-mail Alert Related Categories
SEC FilingsRelated Entities
Credit SuisseSign up for StreetInsider Free!
Receive full access to all new and archived articles, unlimited portfolio tracking, e-mail alerts, custom newswires and RSS feeds - and more!
