Form 8-K/A Western Refining, Inc. For: Aug 04
UNITED STATES
SECURITIES AND EXCHANGE COMMISSION
Washington, D.C. 20549
FORM 8-K/A
CURRENT REPORT
Pursuant to Section 13 or 15(d) of the
Securities Exchange Act of 1934
Date of Report (Date of earliest event reported): August 4, 2015
WESTERN REFINING, INC.
(Exact name of Registrant as specified in its charter)
Delaware | 001-32721 | 20-3472415 | ||
(State or other jurisdiction of incorporation) | (Commission File Number) | (IRS Employer Identification Number) | ||
123 West Mills Ave., Suite 200
El Paso, Texas 79901
(Address of principal executive offices)
(915) 534-1400
(Registrant’s telephone number, including area code)
Check the appropriate box below if the Form 8-K filing is intended to simultaneously satisfy the filing obligation of the registrant under any of the following provisions:
¨ | Written communications pursuant to Rule 425 under the Securities Act (17 CFR 230.425) |
¨ | Soliciting material pursuant to Rule 14a-12 under the Exchange Act (17 CFR 240.14a-12) |
¨ | Pre-commencement communications pursuant to Rule 14d-2(b) under the Exchange Act (17 CFR 240.14d-2(b)) |
¨ | Pre-commencement communications pursuant to Rule 13e-4(c) under the Exchange Act (17 CFR 240.13e-4(c)) |
EXPLANATORY NOTE
Western Refining, Inc. (“Western” or the “Company”) is filing this amendment on Form 8-K/A to its Current Report on Form 8‑K filed with the United States Securities and Exchange Commission on August 4, 2015, solely to re-submit Exhibit 99.2, Earnings Presentation, dated August 4, 2015, which was included in the original filing but was not properly viewable on EDGAR due to a file incompatibility.
Item 9.01 | Financial Statements and Exhibits |
(d) | Exhibits |
Exhibit No. | Description | |
99.2 | Earnings Presentation, dated August 4, 2015. | |
SIGNATURES
Pursuant to the requirements of the Securities Exchange Act of 1934, as amended, the Registrant has duly caused this report to be signed on its behalf by the undersigned hereunto duly authorized.
WESTERN REFINING, INC. | |
By: | /s/ Gary R. Dalke |
Name: | Gary R. Dalke |
Title: | Chief Financial Officer |
Dated: August 4, 2015
EXHIBIT INDEX
Exhibit No. | Description | |
99.2 | Earnings Presentation, dated August 4, 2015. | |

Q2 2015 Earnings Review August 4, 2015

2 Cautionary Statement on Forward-Looking Statements This presentation contains forward-looking statements covered by the safe harbor provisions of the Private Securities Litigation Reform Act of 1995. The forward-looking statements contained herein include statements about third quarter 2015 guidance, including: total throughput; direct operating expenses; selling, general and administrative expenses (SG&A); depreciation and amortization; interest expense and other financing costs; and FY 2015 capital expenditures, including maintenance, regulatory expenditures and discretionary expenditures. These forward-looking statements also include information about crack spread hedge positions, market pricing and realized and unrealized gains. These statements are subject to the general risks inherent in Western Refining, Inc.’s business. These expectations may or may not be realized. Some of these expectations may be based upon assumptions or judgments that prove to be incorrect. In addition, Western’s business and operations involve numerous risks and uncertainties, many of which are beyond its control, which could result in Western’s expectations not being realized or otherwise materially affect Western’s financial condition, results of operations, and cash flows. Additional information relating to the uncertainties affecting Western’s business is contained in its filings with the Securities and Exchange Commission. The forward-looking statements are only as of the date made, and Western does not undertake any obligation to (and expressly disclaims any obligation to) update any forward-looking statements to reflect events or circumstances after the date such statements were made, or to reflect the occurrence of unanticipated events.
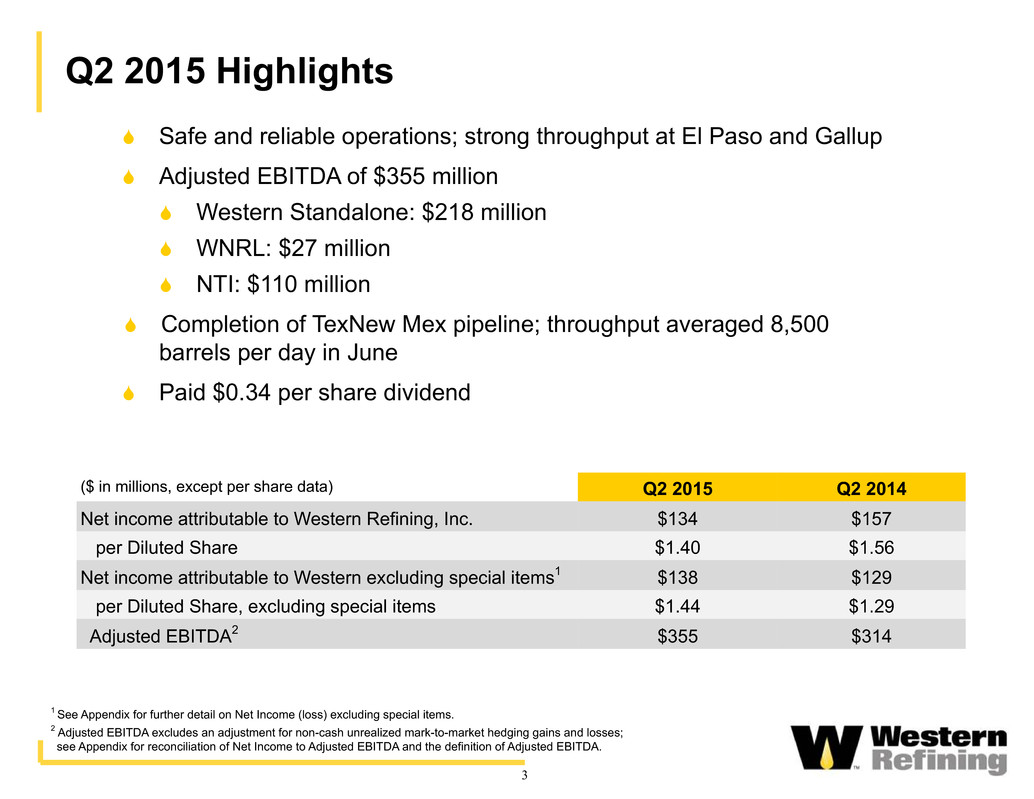
3 Q2 2015 Highlights S Safe and reliable operations; strong throughput at El Paso and Gallup S Adjusted EBITDA of $355 million S Western Standalone: $218 million S WNRL: $27 million S NTI: $110 million S Completion of TexNew Mex pipeline; throughput averaged 8,500 barrels per day in June S Paid $0.34 per share dividend ($ in millions, except per share data) Q2 2015 Q2 2014 Net income attributable to Western Refining, Inc. $134 $157 per Diluted Share $1.40 $1.56 Net income attributable to Western excluding special items1 $138 $129 per Diluted Share, excluding special items $1.44 $1.29 Adjusted EBITDA2 $355 $314 1 See Appendix for further detail on Net Income (loss) excluding special items. 2 Adjusted EBITDA excludes an adjustment for non-cash unrealized mark-to-market hedging gains and losses; see Appendix for reconciliation of Net Income to Adjusted EBITDA and the definition of Adjusted EBITDA.

4 Refining Operating Metrics Gross Margin ($ per throughput barrel) 1 Operating margin is defined as gross margin minus direct operating expenses. Direct Operating Expenses ($ per throughput barrel) Operating Margin ($ per throughput barrel) Q2 2015 Q2 2014 El Pas o Gallu p $25 $0 $20.95 $20.01 $25 $0 $3.86 $4.17 $25 $0 $17.09 $15.84 $25 $0 $15.34 $22.64 $25 $0 $9.03 $7.81 $25 $0 $6.31 $14.83 1
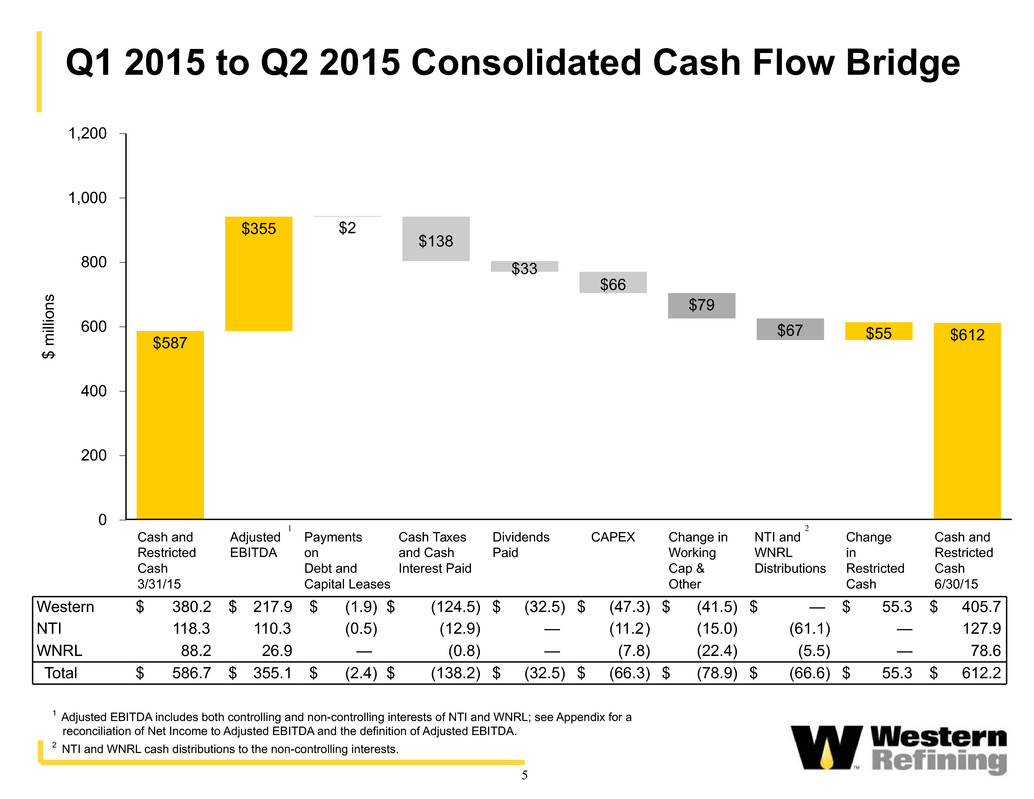
5 1,200 1,000 800 600 400 200 0 $ m illi on s Cash and Restricted Cash 3/31/15 Adjusted EBITDA Payments on Debt and Capital Leases Cash Taxes and Cash Interest Paid Dividends Paid CAPEX Change in Working Cap & Other NTI and WNRL Distributions Change in Restricted Cash Cash and Restricted Cash 6/30/15 $587 $612 $355 $55 $2 $138 $33 $66 $79 $67 Q1 2015 to Q2 2015 Consolidated Cash Flow Bridge 1 Adjusted EBITDA includes both controlling and non-controlling interests of NTI and WNRL; see Appendix for a reconciliation of Net Income to Adjusted EBITDA and the definition of Adjusted EBITDA. 2 NTI and WNRL cash distributions to the non-controlling interests. 2 Western $ 380.2 $ 217.9 $ (1.9) $ (124.5) $ (32.5) $ (47.3) $ (41.5) $ — $ 55.3 $ 405.7 NTI 118.3 110.3 (0.5) (12.9) — (11.2) (15.0) (61.1) — 127.9 WNRL 88.2 26.9 — (0.8) — (7.8) (22.4) (5.5) — 78.6 Total $ 586.7 $ 355.1 $ (2.4) $ (138.2) $ (32.5) $ (66.3) $ (78.9) $ (66.6) $ 55.3 $ 612.2 1
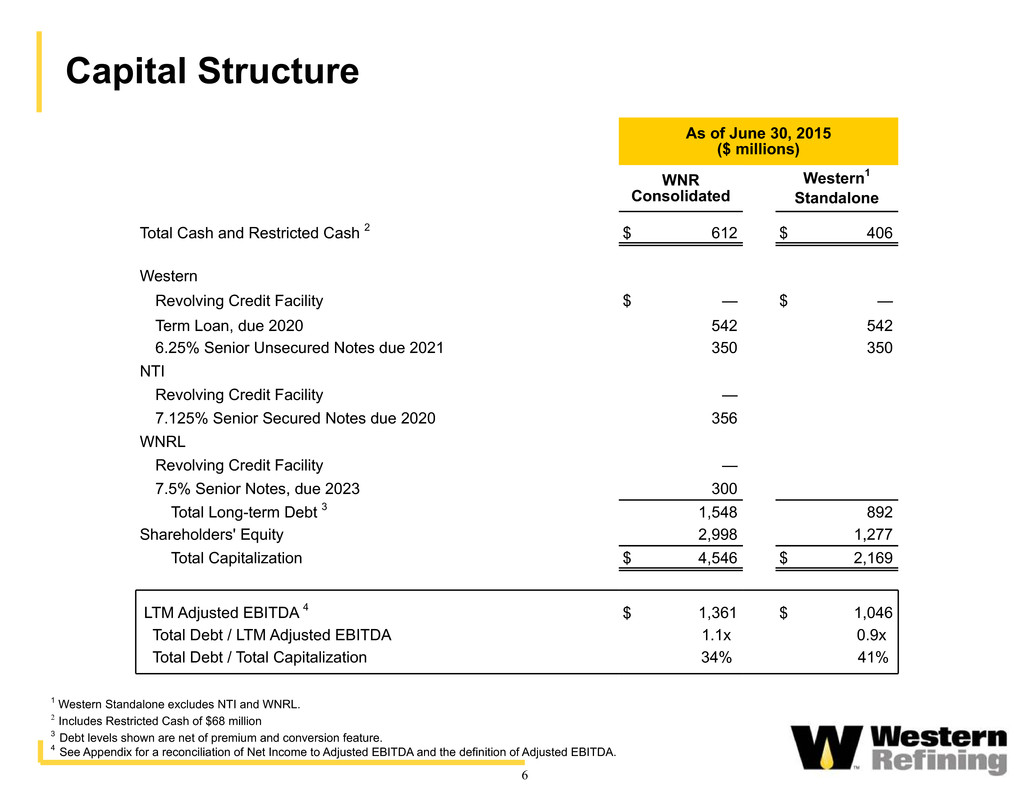
6 Capital Structure 1 Western Standalone excludes NTI and WNRL. 2 Includes Restricted Cash of $68 million 3 Debt levels shown are net of premium and conversion feature. 4 See Appendix for a reconciliation of Net Income to Adjusted EBITDA and the definition of Adjusted EBITDA. As of June 30, 2015 ($ millions) WNR Consolidated Western1 Standalone Total Cash and Restricted Cash 2 $ 612 $ 406 Western Revolving Credit Facility $ — $ — Term Loan, due 2020 542 542 6.25% Senior Unsecured Notes due 2021 350 350 NTI Revolving Credit Facility — 7.125% Senior Secured Notes due 2020 356 WNRL Revolving Credit Facility — 7.5% Senior Notes, due 2023 300 Total Long-term Debt 3 1,548 892 Shareholders' Equity 2,998 1,277 Total Capitalization $ 4,546 $ 2,169 LTM Adjusted EBITDA 4 $ 1,361 $ 1,046 Total Debt / LTM Adjusted EBITDA 1.1x 0.9x Total Debt / Total Capitalization 34% 41%

7 Operations El Paso Gallup St. Paul Park(NTI) Total Throughput (mbpd) 135 - 139 25.5 - 27.5 96 - 99.5 Direct Operating Expenses ($/Bbl) $4.00 - $4.25 $8.50 - $8.75 $4.55 - $5.05 Q3 2015 Guidance Other ($ millions) Western Standalone NTI WNRL Total SG&A $30 $23 $6 $59 Depreciation and Amortization $27 $20 $5 $52 Interest Expense and Other Financing Costs $14 $8 $6 $28 FY 2015 Capital Expenditures Maintenance/Regulatory $88 $36 $13 $137 Discretionary 162 34 32 228 FY 2015 Total Capital Expenditures $250 $70 $45 $365

Appendix
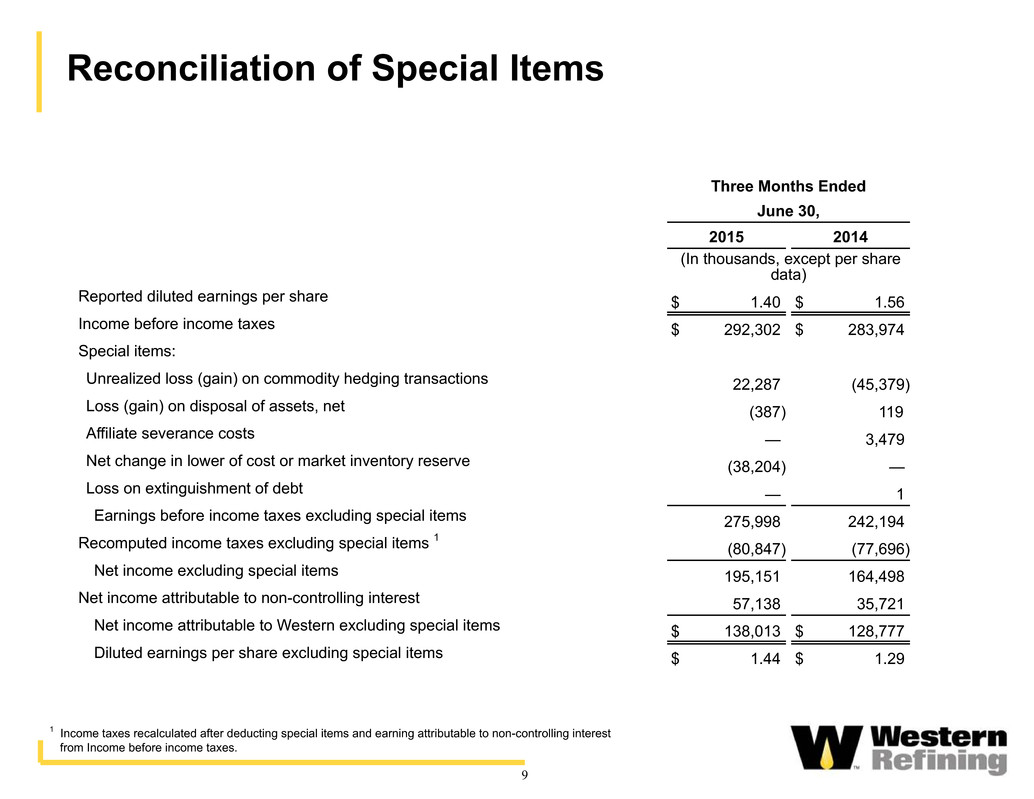
9 Reconciliation of Special Items 1 Income taxes recalculated after deducting special items and earning attributable to non-controlling interest from Income before income taxes. Three Months Ended June 30, 2015 2014 (In thousands, except per share data) Reported diluted earnings per share $ 1.40 $ 1.56 Income before income taxes $ 292,302 $ 283,974 Special items: Unrealized loss (gain) on commodity hedging transactions 22,287 (45,379) Loss (gain) on disposal of assets, net (387) 119 Affiliate severance costs — 3,479 Net change in lower of cost or market inventory reserve (38,204) — Loss on extinguishment of debt — 1 Earnings before income taxes excluding special items 275,998 242,194 Recomputed income taxes excluding special items 1 (80,847) (77,696) Net income excluding special items 195,151 164,498 Net income attributable to non-controlling interest 57,138 35,721 Net income attributable to Western excluding special items $ 138,013 $ 128,777 Diluted earnings per share excluding special items $ 1.44 $ 1.29

10 Consolidated Adjusted EBITDA Reconciliation 1 Adjusted EBITDA includes an adjustment for non-cash unrealized mark-to-market hedging gains and losses; see Appendix for reconciliation of Net Income to Adjusted EBITDA and the definition of Adjusted EBITDA. Three Months Ended June 30, 2015 2014 (In thousands) Net income attributable to Western Refining, Inc. $ 133,919 $ 156,696 Net income attributable to non-controlling interest 79,948 33,871 Interest expense and other financing costs 27,316 27,801 Provision for income taxes 78,435 93,407 Depreciation and amortization 51,143 47,848 Maintenance turnaround expense 593 — Loss (gain) on disposal of assets, net (387) 119 Loss on extinguishment of debt — 1 Net change in lower of cost or market inventory reserve (38,204) — Unrealized loss (gain) on commodity hedging transactions 22,287 (45,379) Adjusted EBITDA 1 $ 355,050 $ 314,364
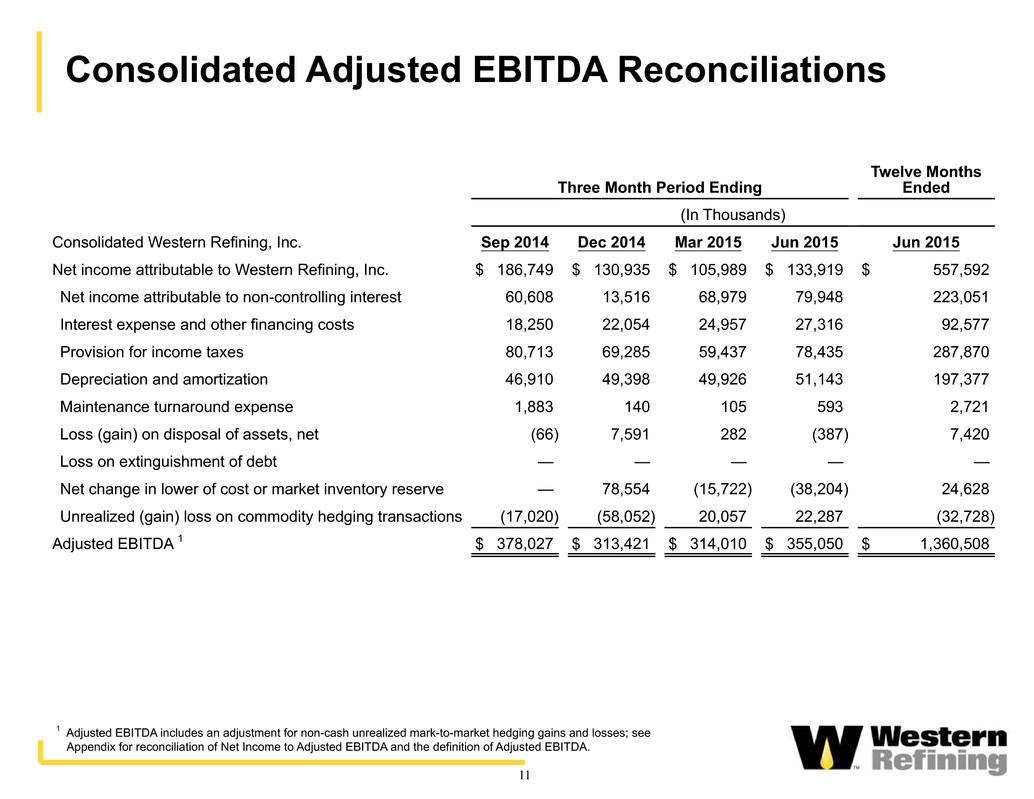
11 Consolidated Adjusted EBITDA Reconciliations Three Month Period Ending Twelve Months Ended (In Thousands) Consolidated Western Refining, Inc. Sep 2014 Dec 2014 Mar 2015 Jun 2015 Jun 2015 Net income attributable to Western Refining, Inc. $ 186,749 $ 130,935 $ 105,989 $ 133,919 $ 557,592 Net income attributable to non-controlling interest 60,608 13,516 68,979 79,948 223,051 Interest expense and other financing costs 18,250 22,054 24,957 27,316 92,577 Provision for income taxes 80,713 69,285 59,437 78,435 287,870 Depreciation and amortization 46,910 49,398 49,926 51,143 197,377 Maintenance turnaround expense 1,883 140 105 593 2,721 Loss (gain) on disposal of assets, net (66) 7,591 282 (387) 7,420 Loss on extinguishment of debt — — — — — Net change in lower of cost or market inventory reserve — 78,554 (15,722) (38,204) 24,628 Unrealized (gain) loss on commodity hedging transactions (17,020) (58,052) 20,057 22,287 (32,728) Adjusted EBITDA 1 $ 378,027 $ 313,421 $ 314,010 $ 355,050 $ 1,360,508 1 Adjusted EBITDA includes an adjustment for non-cash unrealized mark-to-market hedging gains and losses; see Appendix for reconciliation of Net Income to Adjusted EBITDA and the definition of Adjusted EBITDA.

12 Last Twelve Months June 30, 2015 Western Standalone NTI WNRL WNR Consolidated (In thousands) Net income attributable to Western Refining, Inc. $ 385,614 $ 130,841 $ 41,137 $ 557,592 Net income attributable to non-controlling interest — 201,866 21,185 223,051 Interest expense and other financing costs 56,153 24,564 11,860 92,577 Provision for income taxes 287,264 — 606 287,870 Loss (gain) on disposal of assets, net 7,743 (302) (21) 7,420 Depreciation and amortization 103,016 77,077 17,284 197,377 Maintenance turnaround expense 2,721 — — 2,721 Loss on extinguishment of debt — — — — Net change in lower of cost or market inventory reserve — 24,628 — 24,628 Unrealized loss (gain) on commodity hedging transactions (34,190) 1,462 — (32,728) Adjusted EBITDA 808,321 $ 460,136 $ 92,051 $ 1,360,508 Controlling interests in NTI 1 176,692 Controlling interests in WNRL 1 60,846 Total Adjusted EBITDA $ 1,045,859 Consolidating Adjusted EBITDA Reconciliations 1 Western's controlling interests in NTI and WNRL represent 38% and 66%, respectively.
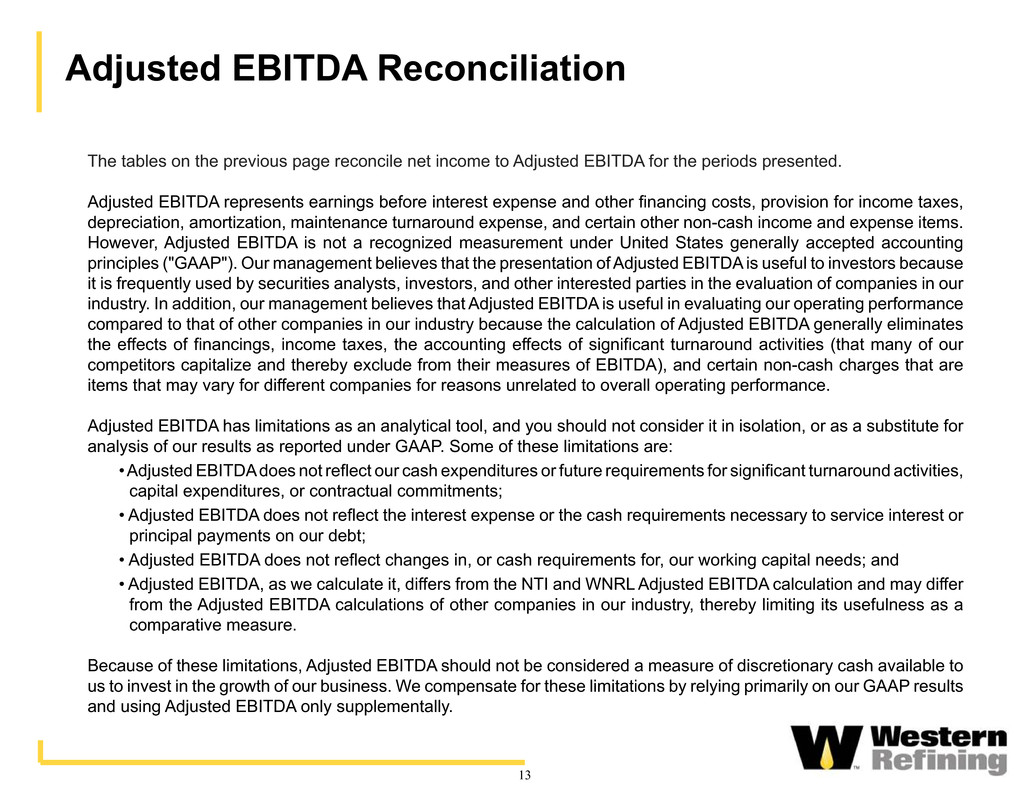
13 Adjusted EBITDA Reconciliation The tables on the previous page reconcile net income to Adjusted EBITDA for the periods presented. Adjusted EBITDA represents earnings before interest expense and other financing costs, provision for income taxes, depreciation, amortization, maintenance turnaround expense, and certain other non-cash income and expense items. However, Adjusted EBITDA is not a recognized measurement under United States generally accepted accounting principles ("GAAP"). Our management believes that the presentation of Adjusted EBITDA is useful to investors because it is frequently used by securities analysts, investors, and other interested parties in the evaluation of companies in our industry. In addition, our management believes that Adjusted EBITDA is useful in evaluating our operating performance compared to that of other companies in our industry because the calculation of Adjusted EBITDA generally eliminates the effects of financings, income taxes, the accounting effects of significant turnaround activities (that many of our competitors capitalize and thereby exclude from their measures of EBITDA), and certain non-cash charges that are items that may vary for different companies for reasons unrelated to overall operating performance. Adjusted EBITDA has limitations as an analytical tool, and you should not consider it in isolation, or as a substitute for analysis of our results as reported under GAAP. Some of these limitations are: • Adjusted EBITDA does not reflect our cash expenditures or future requirements for significant turnaround activities, capital expenditures, or contractual commitments; • Adjusted EBITDA does not reflect the interest expense or the cash requirements necessary to service interest or principal payments on our debt; • Adjusted EBITDA does not reflect changes in, or cash requirements for, our working capital needs; and • Adjusted EBITDA, as we calculate it, differs from the NTI and WNRL Adjusted EBITDA calculation and may differ from the Adjusted EBITDA calculations of other companies in our industry, thereby limiting its usefulness as a comparative measure. Because of these limitations, Adjusted EBITDA should not be considered a measure of discretionary cash available to us to invest in the growth of our business. We compensate for these limitations by relying primarily on our GAAP results and using Adjusted EBITDA only supplementally.
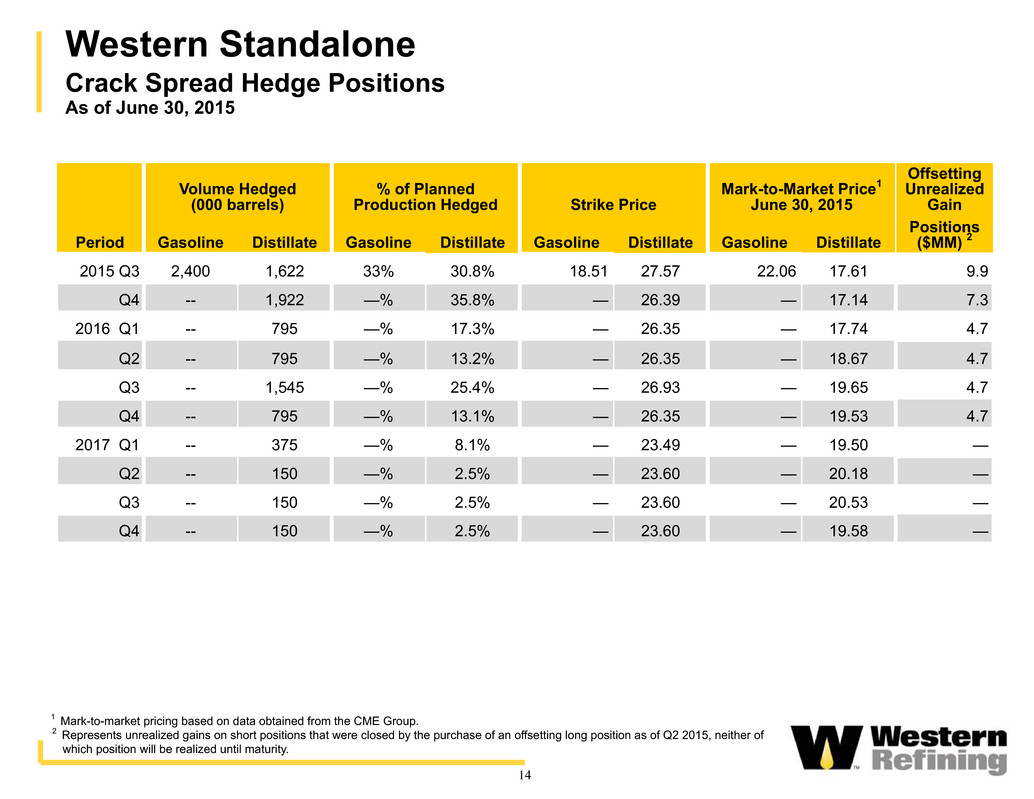
14 Volume Hedged (000 barrels) % of Planned Production Hedged Strike Price Mark-to-Market Price1 June 30, 2015 Offsetting Unrealized Gain Period Gasoline Distillate Gasoline Distillate Gasoline Distillate Gasoline Distillate Positions ($MM) 2 2015 Q3 2,400 1,622 33% 30.8% 18.51 27.57 22.06 17.61 9.9 Q4 -- 1,922 —% 35.8% — 26.39 — 17.14 7.3 2016 Q1 -- 795 —% 17.3% — 26.35 — 17.74 4.7 Q2 -- 795 —% 13.2% — 26.35 — 18.67 4.7 Q3 -- 1,545 —% 25.4% — 26.93 — 19.65 4.7 Q4 -- 795 —% 13.1% — 26.35 — 19.53 4.7 2017 Q1 -- 375 —% 8.1% — 23.49 — 19.50 — Q2 -- 150 —% 2.5% — 23.60 — 20.18 — Q3 -- 150 —% 2.5% — 23.60 — 20.53 — Q4 -- 150 —% 2.5% — 23.60 — 19.58 — 1 Mark-to-market pricing based on data obtained from the CME Group. 2 Represents unrealized gains on short positions that were closed by the purchase of an offsetting long position as of Q2 2015, neither of which position will be realized until maturity. Western Standalone Crack Spread Hedge Positions As of June 30, 2015

Western Standalone Hedging Gain/(Loss) As of June 30, 2015 ($ millions) Hedging Period Realized Gain/(Loss) Total Realized Gain / (Loss) Crack Spread Inventory/Other Q1 2015 $17.1 $0.4 $17.5 Q2 2015 18.1 (7.4) 10.7 Hedging Period Unrealized Gain/(Loss) Total Unrealized Gain / (Loss) Crack Spread Inventory/Other Q1 2015 $(20.3) $(0.9) $(21.2) Q2 2015 (23.7) 0.9 (22.8) 15

16 Consolidated Unrealized Hedging Gains and Losses 1 ($millions) Balance Sheet Fair Value Income Statement Period Beg. Of Period End of Period Unrealized Gain (Loss) 2014 Q1 $(64.5) $9.5 $74.0 Q2 $9.5 $54.9 $45.4 Q3 $54.9 $71.9 $17.0 Q4 $71.9 $130.0 $58.1 2015 Q1 $130.0 $109.9 $(20.1) Q2 $109.9 $87.6 $(22.3) 1 Includes WNR crack spreads and inventory hedging positions and NTI inventory hedging positions.

Serious News for Serious Traders! Try StreetInsider.com Premium Free!
You May Also Be Interested In
- Hollywood Star ‘The Pink Cadillac’ Hits Auction Blocks
- REBELXL - A Revolutionary Reformer Pilates Franchise Announce the Grand Opening of Its First Studio in Wyckoff, New Jersey
- InterContinental Hotels Group PLC Announces Transaction in Own Shares - April 26
Create E-mail Alert Related Categories
SEC FilingsSign up for StreetInsider Free!
Receive full access to all new and archived articles, unlimited portfolio tracking, e-mail alerts, custom newswires and RSS feeds - and more!


 Tweet
Tweet Share
Share