

Form 6-K UBS AG For: May 05
 Tweet
Tweet Share
Share
UNITED STATES
SECURITIES AND EXCHANGE COMMISSION
Washington, D.C. 20549
FORM 6-K
REPORT OF FOREIGN PRIVATE ISSUER
PURSUANT TO RULE 13a-16 OR 15d-16
UNDER THE SECURITIES EXCHANGE ACT OF 1934
Date: May 5, 2015
UBS Group AG
Commission File Number: 1-36764
UBS AG
Commission File Number: 1-15060
(Registrants’ Names)
Bahnhofstrasse 45, Zurich, Switzerland
(Address of principal executive office)
Indicate by check mark whether the registrant files or will file annual reports under cover of Form 20-F or Form 40-F.
Form 20-F x Form 40-F ¨
This Form 6-K consists of the presentation materials related to the First Quarter 2015 Results of UBS Group AG and UBS AG, including speaker notes, which appear immediately following this page.
 First quarter 2015 results May 5, 2015 |
 Cautionary statement
regarding forward-looking statements 1
This presentation contains statements that constitute “forward-looking statements,”
including but not limited to management’s outlook for UBS’s financial performance and statements relating to the anticipated effect of
transactions and strategic initiatives on UBS’s business and future development. While these
forward-looking statements represent UBS’s judgments and expectations concerning the matters described, a number of risks,
uncertainties and other important factors could cause actual developments and results to differ
materially from UBS’s expectations. These factors include, but are not limited to: (i) the degree to which UBS is successful in
executing its announced strategic plans, including its cost reduction and efficiency initiatives
and its planned further reduction in its Basel III risk-weighted assets (RWA) and leverage ratio denominator (LRD), and to
maintain its stated capital return objective; (ii) developments in the markets in which UBS
operates or to which it is exposed, including movements in securities prices or liquidity, credit spreads, currency exchange rates
and interest rates and the effect of economic conditions and market developments on the
financial position or creditworthiness of UBS’s clients and counterparties, and the degree to which UBS is successful in implementing
changes to its business to meet changing market, regulatory and other conditions; (iii) changes
in the availability of capital and funding, including any changes in UBS’s credit spreads and ratings, or arising from
requirements for bail-in debt or loss-absorbing capital; (iv) changes in or the
implementation of financial legislation and regulation in Switzerland, the US, the UK and other financial centers that may impose more stringent
capital (including leverage ratio), liquidity and funding requirements, incremental tax
requirements, additional levies, limitations on permitted activities, constraints on remuneration or other measures; (v) uncertainty as to
when and to what degree the Swiss Financial Market Supervisory Authority (FINMA) will approve
reductions to the incremental RWA resulting from the supplemental operational risk capital analysis mutually agreed to by
UBS and FINMA, or will approve a limited reduction of capital requirements due to measures to
reduce resolvability risk; (vi) the degree to which UBS is successful in executing the transfer of business to UBS Switzerland
AG, a establishing a US intermediate holding company and implementing the US enhanced prudential
standards, completing the squeeze-out of minority shareholders of UBS AG, changing the operating model of UBS
Limited and other changes which UBS may make in its legal entity structure and operating model,
including the possible consequences of such changes, and the potential need to make other changes to the legal structure
or booking model of UBS Group in response to legal and regulatory requirements, including
capital requirements, resolvability requirements and proposals in Switzerland and other countries for mandatory structural reform
of banks; (vii) changes in UBS’s competitive position, including whether differences in
regulatory capital and other requirements among the major financial centers will adversely affect UBS’s ability to compete in certain
lines of business; (viii) changes in the standards of conduct applicable to our businesses that
may result from new regulation or new enforcement of existing standards, including measures to impose new or enhanced
duties when interacting with customers or in the execution and handling of customer
transactions; (ix) the liability to which UBS may be exposed, or possible constraints or sanctions that regulatory authorities might impose
on UBS, due to litigation, contractual claims and regulatory investigations; (x) the effects on
UBS’s cross-border banking business of tax or regulatory developments and of possible changes in UBS’s policies and practices
relating to this business; (xi) UBS’s ability to retain and attract the employees necessary
to generate revenues and to manage, support and control its businesses, which may be affected by competitive factors including
differences in compensation practices; (xii) changes in accounting or tax standards or policies,
and determinations or interpretations affecting the recognition of gain or loss, the valuation of goodwill, the recognition of
deferred tax assets and other matters; (xiii) limitations on the effectiveness of UBS’s
internal processes for risk management, risk control, measurement and modeling, and of financial models generally; (xiv) whether UBS
will be successful in keeping pace with competitors in updating its technology, particularly in
trading businesses; (xv) the occurrence of operational failures, such as fraud, misconduct, unauthorized trading and systems
failures; (xvi) restrictions to the ability of subsidiaries of the Group to make loans or
distributions of any kind, directly or indirectly, to UBS Group AG; and (xvii) the effect that these or other factors or unanticipated events
may have on our reputation and the additional consequences that this may have on our business
and performance. The sequence in which the factors above are presented is not indicative of their likelihood of occurrence
or the potential magnitude of their consequences. Our business and financial performance could
be affected by other factors identified in our past and future filings and reports, including those filed with the SEC. More
detailed information about those factors is set forth in documents furnished by UBS and filings
made by UBS with the SEC, including UBS’s Annual Report on Form 20-F for the year ended 31 December 2014. UBS is not
under any obligation to (and expressly disclaims any obligation to) update or alter its
forward-looking statements, whether as a result of new information, future events, or otherwise.
This presentation and the information contained herein are provided solely for information purposes, and are not to be construed as a solicitation of an offer to buy or sell any securities or other financial
instruments in Switzerland, the United States or any other jurisdiction. No investment decision
relating to securities of or relating to UBS Group AG, UBS AG or their affiliates should be made on the basis of this document.
Refer to UBS's first quarter 2015 report and its Annual report on Form 20-F for the year
ended 31 December 2014. No representation or warranty is made or implied concerning, and UBS assumes no responsibility for, the
accuracy, completeness, reliability or comparability of the information contained herein
relating to third parties, which is based solely on publicly available information. UBS undertakes no obligation to update the
information contained herein.
Disclaimer:
©
UBS
2015.
The
key
symbol
and
UBS
are
among
the
registered
and
unregistered
trademarks
of
UBS.
All
rights
reserved. |
 Net profit
attributable to UBS Group AG shareholders of CHF 1,977 million Group
Net profit attributable to UBS Group AG shareholders CHF 1,977 million, diluted EPS CHF
0.53 Reported
profit
before
tax
(PBT)
CHF
2,708
million,
adjusted
PBT
CHF
2,268
million
Basel III fully applied CET1 ratio 13.7%, Swiss SRB fully applied leverage ratio 4.6%
Business divisions
1
Wealth Management:
PBT CHF 856 million and NNM CHF 14.4 billion
–
Highest PBT since 3Q08, net margin up 7 bps to 35 bps
Wealth Management Americas:
PBT USD 293 million and NNM USD 4.8 billion
–
Record PBT and record USD invested assets
Retail & Corporate:
PBT CHF 443 million
–
Highest first quarter PBT since 1Q10 and all KPIs within target ranges
Global Asset Management:
PBT CHF 186 million and NNM CHF 7.5 billion excluding money market flows
–
PBT up 50%, highest since 4Q09
Investment Bank:
–
Strong performances in both ICS and CCS
Corporate Center:
PBT of negative CHF 340 million
–
Significant PBT improvement across all three Corporate Center units
1Q15 highlights
1
Adjusted
numbers
unless
otherwise
indicated,
refer
to
slide
30
for
details
about
adjusted
numbers,
Basel
III
numbers
and
FX
rates
in
this
presentation
2
PBT CHF 844 million |
 UBS Group AG results
(consolidated) Refer to slide 30 for details about adjusted numbers, Basel III numbers
and FX rates in this presentation; 1 Includes non-controlling interests in UBS AG reflecting the non-exchanged
UBS AG shares as well as non-controlling interests related to the preferred notes issued by
UBS AG; 2 In addition to net profit attributable to non-controlling interests in UBS AG
reflecting the non-exchanged UBS AG shares, we expect to attribute net profit of ~CHF 80
million to non-controlling interests related to the preferred notes issued by UBS AG in both
2015, all of which in the second quarter, and 2016 and of ~CHF 70 million in 2017
3
CHF million
FY13
FY14
1Q14
4Q14
1Q15
Total operating income
27,732
28,027
7,258
6,746
8,841
Total operating expenses
24,461
25,567
5,865
6,342
6,134
Profit before tax as reported
3,272
2,461
1,393
404
2,708
of
which:
own
credit
on
financial
liabilities
designated
at
fair
value
(283)
292
88
70
226
of which: gains on sales of real estate
288
44
23
20
378
of which: gain on disposals
65
43
0
0
141
of which: net restructuring charges
(772)
(677)
(204)
(208)
(305)
of which: net losses related to the buyback of debt in public tender offers
(167)
0
0
0
0
of which: impairment of a financial investment available-for-sale
0
(48)
0
0
0
of which: credit related to changes to retiree benefit plans in the US
0
41
0
8
0
Adjusted profit before tax
4,141
2,766
1,486
514
2,268
of which: provisions for litigation, regulatory and similar matters
(1,701)
(2,594)
(193)
(310)
(58)
Tax (expense)/benefit
110
1,180
(339)
515
(670)
Net profit attributable to preferred noteholders
204
142
0
31
0
Net
profit
attributable
non-controlling
interests
1,2
5
32
0
29
61
Net profit attributable to UBS Group AG shareholders
3,172
3,466
1,054
858
1,977
Diluted EPS (CHF)
0.83
0.91
0.27
0.23
0.53
Return on tangible equity, adjusted (%)
9.8
8.6
10.7
8.6
14.4
Total book value per share (CHF)
12.74
13.94
13.07
13.94
14.33
Tangible book value per share (CHF)
11.07
12.14
11.41
12.14
12.59 |
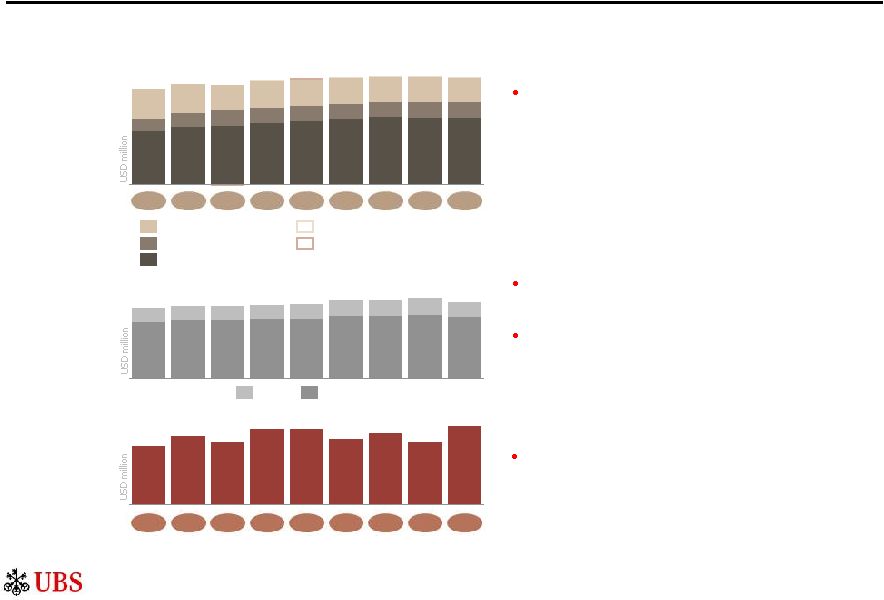
 Wealth
Management Adjusted numbers unless otherwise indicated, refer to slide 30 for details
about adjusted numbers, Basel III numbers and FX rates in this presentation 1 CHF 422
million excluding CHF 291 million charges for provisions for litigation, regulatory and similar matters; 2 Profit before tax CHF 684 million excluding
CHF 291 million charges for provisions for litigation, regulatory and similar matters
4
Operating
income
Operating
expenses
Profit
before
tax
2,106
2,004
2,031
1,921
1,943
1,859
1,837
1,953
1,913
1,250
1,311
1,264
1,528
713
1
1,285
1,348
1,220
1,346
1,224
69%
66%
73%
66%
62%
C/I ratio
Personnel
Other
Operating income CHF 2,106 million
Operating expenses CHF 1,250 million
PBT CHF 856 million
64%
80%
59%
65%
3Q13
1Q14
3Q14
4Q14
1Q15
1Q13
2Q13
4Q13
2Q14
PBT CHF 856 million, highest since 3Q08
Transaction-based
Net interest
Recurring net fee
Other
Credit loss (expense)/recovery
73%
77%
77%
72%
76%
Recurring
income
71%
75%
72%
78%
856
909
891
911
897
922
978
986
949
508
523
517
513
496
518
569
583
560
554
505
406
423
542
472
479
436
589
Transaction-based income increased across all regions, most
notably in APAC
Net interest income decreased, mainly due to lower income from
loans and deposits on a stronger Swiss Franc
Recurring net fee income decreased, mainly due to lower
invested assets on a stronger Swiss Franc
G&A expenses decreased, mainly due to lower marketing and
Corporate Center costs
Personnel expenses increased, mainly due to increased variable
compensation and untaken vacation accruals
59% cost/income ratio
836
825
778
862
822
815
828
834
859
521
442
486
463
436
477
391
388
393
2
856
694
767
659
512
617
607
690 |
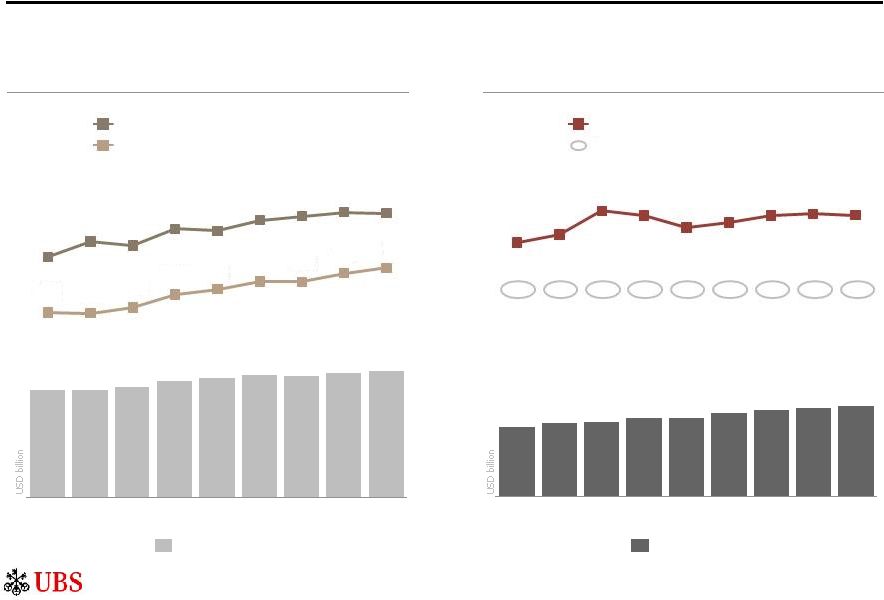
 Wealth
Management 5
Strong growth in mandate penetration, net margin up 7 bps to 35 bps
10.1
5.0
5.8
10.9
9.8
15.0
10.7
14.4
3.0
Gross margin
1
Net margin
2
3Q13
1Q14
3Q14
4Q14
1Q15
1Q13
2Q13
4Q13
2Q14
95.1
94.9
96.8
102.2
111.7
93.2
105.3
110.8
112.7
5.8%
1.2%
4.2%
4.8%
4.9%
2.7%
2.3%
4.6%
7.3%
970
987
966
928
899
886
871
862
870
Annualized
growth rate
Invested
assets
CHF billion
Margins
bps
CHF billion
Net new
money
Loans
CHF billion
NNM CHF 14.4 billion, 5.8% growth rate
on strong inflows from APAC as well as Europe
Domestic and International
Invested assets CHF 970 billion
positive market performance, more than offset by
negative FX translation effects
Mandate penetration 25.5%
with strong net mandate sales of CHF 15.0 billion
Net margin 35 bps
Gross loans CHF 110.8 billion
translation effects, underlying trend remains positive
Adjusted numbers unless otherwise indicated, refer to slide 30 for details about adjusted
numbers, Basel III numbers and FX rates in this presentation 1
Annualized operating income before credit loss (expense) or recovery in bps of average
invested assets; 2 Annualized PBT in bps of average invested assets , down on FX
, up from 24.4%,
, strong NNM and
86
82
86
84
87
85
85
90
91
28
28
23
30
32
33
17
35
28
, up 7 bps |
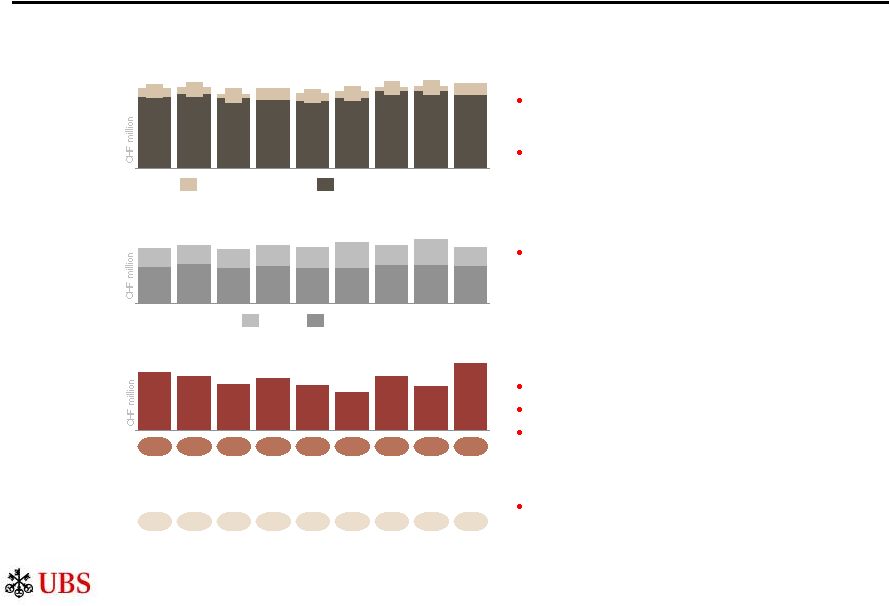
 Wealth
Management Adjusted numbers unless otherwise indicated, refer to slide 30 for details
about adjusted numbers, Basel III numbers and FX rates in this presentation Based on the
Wealth Management business area structure; refer to page 31 of the 1Q15 financial report
for more information Invested assets
CHF billion
1,496
776
761
Client advisors
FTE
31.3.15
1,201
773
503
349
276
178
165
Europe
Switzerland
Asia Pacific
Emerging markets
of which: UHNW
6
CHF billion
Net new
money
Annualized
growth rate
Gross
margin
bps
3.3%
1.1%
(1.7%)
(0.7%)
(2.5%)
1Q14
3Q14
4Q14
1Q15
2Q14
1Q14
3Q14
4Q14
1Q15
2Q14
1Q14
3Q14
4Q14
1Q15
2Q14
1Q14
3Q14
4Q14
1Q15
2Q14
1Q14
3Q14
4Q14
1Q15
2Q14
7.8%
9.2%
12.2%
13.1%
16.0%
3.6%
0.2%
0.9%
5.3%
11.0%
3.6%
1.8%
0.8%
8.7%
(0.5%)
8.1%
5.9%
5.1%
9.1%
7.1%
(2.2)
1.0
(1.5)
3.0
(0.6)
5.0
7.8
5.0
8.2
8.9
4.4
0.4
0.1
1.6
2.2
3.3
0.7
(0.2)
1.5
0.3
7.4
5.7
7.1
10.1
9.6
80
82
83
83
85
83
73
83
78
85
96
90
91
89
90
96
95
97
92
93
54
57
52
55
56
Strong NNM growth, positive in all regions, with APAC and Europe
as main
contributors |
 1,924
1,919
1,901
1,898
1,865
1,851
1,748
1,780
1,696
Wealth Management Americas
Adjusted numbers unless otherwise indicated, refer to slide 30 for details about adjusted
numbers, Basel III numbers and FX rates in this presentation 7
Operating
income
Operating
expenses
Profit
before
tax
1,652
1,582
1,567
1,517
1,523
1,608
1,691
1,651
1,476
C/I ratio
Personnel
Other
3Q13
1Q14
3Q14
4Q14
1Q15
1Q13
2Q13
4Q13
2Q14
Record PBT USD 293 million
Transaction-based
Net interest
Recurring net fee
Other
Credit loss (expense)/recovery
71%
75%
73%
74%
77%
Recurring
income
69%
75%
77%
76%
86%
86%
84%
86%
86%
87%
87%
85%
88%
Operating income USD 1,901 million
Operating expenses USD 1,608 million
PBT USD 293 million
948
1,030
1,043
1,088
1,119
1,163
1,197
1,187
1,186
217
235
286
276
250
261
276
280
277
530
507
433
476
472
464
441
448
432
1,202
1,241
1,234
1,256
1,257
1,303
1,307
1,336
1,292
274
282
283
311
325
349
344
355
316
293
233
267
246
284
283
232
256
220
G&A expenses decreased, mainly due to lower charges for
provisions for litigation, regulatory and similar matters and
lower Corporate Center costs
Personnel expenses decreased, mainly due to lower FA
compensation, primarily reflecting lower performance-based
compensation and slightly lower compensable revenues
Operating income decreased, mainly due to lower transaction-
based income
85% cost/income ratio |
 Wealth
Management Americas Adjusted numbers unless otherwise indicated, refer to slide 30 for
details about adjusted numbers, Basel III numbers and FX rates in this presentation
1
Annualized operating income before credit loss (expense) or recovery in bps of average invested
assets; 2 Annualized PBT in bps of average invested assets 8
Annualized
growth rate
78
78
73
75
76
80
76
79
76
NNM USD 4.8 billion, 1.9% growth rate
reflecting net new money inflows from financial
advisors employed more than one year
Invested assets USD 1,050 billion
positive market performance and NNM
Net margin 11 bps
Record USD invested assets and loan balances
2.8
2.1
4.9
2.1
4.9
USD billion
9.2
(2.5)
4.8
5.5
Gross margin
1
Net margin
2
Net new
money
3Q13
1Q14
3Q14
4Q14
1Q15
1Q13
2Q13
4Q13
2Q14
11
10
12
12
11
10
10
11
9
Invested
assets
USD billion
36.8
37.6
39.1
39.6
43.3
Loans
USD billion
34.5
41.7
45.5
44.6
Margins
bps
Gross loans USD 45.5 billion
credit lines and mortgages
1.9%
2.2%
1.9%
(1.0%)
0.9%
2.1%
0.9%
1.3%
4.4%
1,050
1,032
1,016
1,017
987
970
919
892
891
new
record
on
mainly on increased
up
2bps
,
, |
 Wealth
Management Americas 9
Record USD invested assets and industry-leading FA productivity
Invested assets and FA productivity
Net interest income and lending
Invested assets per FA (USD million)
Annualized revenue per FA (USD k)
Credit
loss
(expense)/recovery (USD
million)
Invested assets
3Q13
1Q14
3Q14
4Q14
1Q15
1Q13
2Q13
4Q13
2Q14
Loans, gross
3Q13
1Q14
3Q14
4Q14
1Q15
1Q13
2Q13
4Q13
2Q14
Adjusted numbers unless otherwise indicated, refer to slide 30 for details about adjusted
numbers, Basel III numbers and FX rates in this presentation 961
1,005
994
1,042
1,037
1,068
1,079
1,091
1,088
1,050
1,032
1,016
1,017
987
970
919
892
891
126
126
129
136
139
143
143
147
150
217
235
286
276
250
261
276
280
277
0
(21)
(9)
19
(1)
0
(2)
0
0
45.5
44.6
43.3
41.7
39.6
39.1
37.6
36.8
34.5
Net interest income (USD million) |
 Retail
& Corporate Adjusted numbers unless otherwise indicated, refer to slide 30 for
details about adjusted numbers, Basel III numbers and FX rates in this presentation
10
Operating
income
Operating
expenses
Profit
before
tax
958
938
932
931
958
948
919
979
913
512
571
532
587
541
558
557
536
557
59%
57%
62%
58%
52%
C/I ratio
Personnel
Other
61%
60%
54%
57%
Highest first quarter PBT since 1Q10 and all KPIs within target ranges
Transaction-based
Net interest
Recurring net fee
Other
Credit loss (expense)/recovery
3Q13
1Q14
3Q14
4Q14
1Q15
1Q13
2Q13
4Q13
2Q14
Operating income CHF 979 million
Operating expenses CHF 536 million
PBT CHF 443 million
531
542
531
540
523
541
563
557
568
243
272
262
256
234
247
267
273
284
134
133
140
138
144
127
127
126
130
376
361
350
336
343
336
331
322
343
181
197
191
251
189
235
181
235
193
443
356
446
367
401
344
417
390
362
Transaction-based income increased, mainly due to
FX-trading and hedging-related income
Net interest income increased, mainly due to pricing measures,
partly offset by lower allocated revenues from Group ALM
Credit loss expenses decreased
G&A expenses decreased, mainly as 4Q14 included significant
investments in our multichannel offering; marketing expenses
and professional fees also declined
Personnel expenses increased, mainly due to higher variable
compensation accruals
54% cost/income ratio
Net interest margin 165 bps vs. 162 bps in 4Q14,
mainly reflecting higher net interest income
Annualized net new retail business volume growth 3.1% vs.
0.6% in 4Q14, following the typical seasonal pattern |
 Global Asset
Management Adjusted numbers unless otherwise indicated, refer to slide 30 for details
about adjusted numbers, Basel III numbers and FX rates in this presentation 11
Operating
income
Operating
expenses
Profit
before
tax
429
449
418
410
404
427
462
463
443
68
72
511
497
34
489
27
465
38
451
47
482
447
29
489
41
483
53
213
230
206
215
205
208
222
223
218
110
108
111
124
120
149
116
150
107
325
373
338
357
325
339
317
338
323
186
151
107
126
143
130
152
160
124
69%
71%
70%
72%
69%
C/I ratio
Personnel
Other
67%
77%
64%
75%
3Q13
1Q14
3Q14
4Q14
1Q15
1Q13
2Q13
4Q13
2Q14
PBT CHF 186 million, up 50% and highest since 4Q09
Performance fees
Net management fees
(1.3)
(3.9)
(4.6)
13.0
3.8
Net new
money ex. MM
5.1
11.6
7.5
(5.8)
Net new money excluding money market flows of
CHF 7.5 billion, of which 2.5 billion from third parties and
CHF 5.1 billion from our wealth management businesses
Operating income CHF 511 million
Performance fees increased, primarily in O’Connor and
A&Q funds, partly offset by global real estate and
traditional investments
Net management fees decreased, mainly in traditional
investments, primarily due to FX
Operating expenses CHF 325 million
G&A expenses decreased, mainly as the prior quarter
included charges for provisions for litigation, regulatory
and similar matters, as well as due to lower Corporate
Center costs
PBT CHF 186 million
64% cost/income ratio
Net margin 11 bps vs. 8 bps in 4Q14
Gross margin 31 bps vs. 30 bps in 4Q14 |
 (1,205)
292
844
549
386
563
335
806
928
Investment Bank
12
Operating
income
Operating
expenses
Profit
before
tax
1,087
1,078
864
832
1,011
879
932
918
1,162
645
397
338
324
409
382
315
297
701
997
771
505
706
770
986
738
712
801
2,250
2,666
1,935
1,985
2,241
2,190
1,861
1,707
2,728
1,821
1,270
551
1,643
775
868
3,190
936
1,677
1,136
541
1,641
1,109
532
1,474
848
626
1,372
869
503
1,444
966
478
1,800
1,291
509
64%
80%
79%
75%
161%
C/I ratio
Personnel
Other
66%
75%
68%
85%
Strong performances in both ICS and CCS
3Q13
1Q14
3Q14
4Q14
1Q15
1Q13
2Q13
4Q13
2Q14
Operating income CHF 2,666 million
Operating expenses CHF 1,821 million
PBT CHF 844 million
1
Corporate Client Solutions
Investor Client Services –
FX, Rates and Credit
3
Investor Client Services –
Equities
2,254
CCS increased on higher revenues in DCM, ECM and
financing solutions as well as higher risk management
revenues, partly offset by lower advisory revenues
ICS increased in FRC, on significantly higher volatility and
client activity levels, and Equities, on stronger performance
across all sectors and regions, mainly reflecting seasonally
higher client activity levels
G&A expenses decreased, mainly due to lower charges
for provisions for litigation, regulatory and similar matters
and the annual UK bank levy in 4Q14
Personnel expenses increased on higher performance
driven variable compensation expenses
68% cost/income ratio
Annualized return on attributed equity 46%
Basel III RWA CHF 64 billion
Funded assets CHF 175 billion
2
Adjusted numbers unless otherwise indicated, refer to slide 30 for details about adjusted
numbers, Basel III numbers and FX rates in this presentation 1 Operating income
including credit loss (expense) or recovery; 2 CHF 567 million excluding CHF 1,687 million charges for provisions for litigation, regulatory and similar
matters; 3 Profit before tax CHF 482 million excluding CHF 1,687 million charges for
provisions for litigation, regulatory and similar matters |
 Adjusted numbers
unless otherwise indicated, refer to slide 30 for details about adjusted numbers, Basel III numbers and FX rates in this presentation
1 Operating income excluding credit loss (expense) or recovery/average management VaR, based on
unrounded figures; 2 Annualized operating income excluding credit loss (expense) or
recovery/quarter-end Basel III RWA, phase-in; 3 Phase-in Solid 1Q15 results
delivered with continued efficient resource utilization Investment Bank
Market volatility
VIX and VDAX (index value), USD/EUR and USD/CHF 90-day volatility (%)
Resource utilization and return on RWA
CHF billion, %
Revenue per unit of VaR
CHF million
Equity trading volumes
Indexed, 1.1.13 = 100
13 |
 Corporate Center
PBT negative CHF 340 million Corporate Center
Adjusted numbers unless otherwise indicated, refer to slide 30 for details about adjusted
numbers, Basel III numbers and FX rates in this presentation 14
Operating expenses before allocations decreased on lower G&A and
personnel expenses, partly due to favorable currency effects
Net allocations for shared services decreased, mainly due to lower
operating expenses before allocations
Operating income increased, mainly due higher retained income related to
hedge accounting models and cross-currency basis swaps held as
economic hedges
Improved results across all three Corporate Center units
Operating income improved, mainly as 4Q14 included losses from the
termination of certain CDS contracts and greater novation and unwind
activity
Operating expenses decreased, mainly due to lower charges for provisions
for litigation, regulatory and similar matters as well as the annual UK bank
levy in 4Q14
(340)
(1,180)
(832)
(458)
(501)
Profit
before
tax
1Q14
3Q14
4Q14
1Q15
2Q14
Corporate Center results by unit (CHF million)
Corporate Center total (CHF million)
Services
Operating income
(14)
4
9
(6)
(4)
Operating expenses
233
(9)
180
255
218
o/w before allocations
2,082
1,881
2,058
2,314
2,029
o/w net allocations
(1,849)
(1,890)
(1,878)
(2,059)
(1,811)
Profit before tax
(246)
13
(171)
(261)
(222)
Group Asset and Liability Management
Operating income
(46)
(55)
(65)
(201)
118
o/w gross income
160
189
275
129
407
o/w net allocations
(206)
(243)
(341)
(330)
(289)
Operating expenses
(8)
3
(1)
6
(4)
Profit before tax
(39)
(57)
(64)
(208)
122
Non-core and Legacy Portfolio
Operating income
29
(167)
(322)
(361)
(80)
Operating expenses
245
247
273
350
160
Profit before tax
(216)
(414)
(596)
(711)
(240)
Losses reduced due to improved results in all three Corporate Center
units, mainly due to improved operating income in Non-core and Legacy
Portfolio and Group ALM, and lower operating expenses in Non-core and
Legacy Portfolio |
 Adjusted numbers
unless otherwise indicated, refer to slide 30 for details about adjusted numbers, Basel III numbers and FX rates in this presentation
Charts illustrative only and bars not to scale; Numbers may not sum up to totals due to
rounding; 1 Refer to page 41 of the 2014 annual report for details of our cost
reduction targets; 2 Refer to slide 26 for details on net cost reduction progress as of the
end of 1Q15 ~CHF
0.8
billion
net
cost
reductions
using
March
2015
annualized
exit
rate
Corporate Center cost reductions
15
Cumulative annualized net cost reduction
CHF billion
Target CHF 1.4 billion net cost
reduction by 2015 year-end
exit rate vs. FY13
1,2
March 2015 exit rate performance
is an early positive sign of
continued cost reductions
Execution risk remains throughout
the year, we will continue to be
vigilant on costs, including
expenses driven by higher
regulatory demand
0.8
0.5
0.3
~0.05
0.8
0.5
0.3
0.6
0.3
0.2
0.1
Services and
Group ALM
Non-core and
Legacy Portfolio
FY14 vs. FY13
(as reported with
4Q14 results on 10.2.15)
1Q15 quarterly
annualized
vs. FY13
March 2015 monthly
annualized exit rate
vs. FY13
Annualized incremental
net cost reduction in 1Q15
Lower net cost reduction
due to exit-rate normalization,
e.g., to reflect seasonality |
 Swiss SRB Basel III
capital and leverage ratios Adjusted numbers unless otherwise indicated, refer to slide
30 for details about adjusted numbers, Basel III numbers and FX rates in this presentation
As of 31.3.15, our post-stress fully applied Basel III CET1 capital ratio exceeded
10% 16
Basel III CET1 capital ratio (fully applied)
CHF billion
Swiss SRB leverage ratio (fully applied)
CHF billion
Fully applied Swiss SRB leverage ratio 4.6%
1Q15
4Q14
3Q14
2Q14
1Q14
CET1
capital
CET1
capital
ratio
RWA
29.9
30.6
30.0
28.9
29.6
227
227
219
216
216
1Q15
4Q14
3Q14
2Q14
1Q14
Total
capital
Leverage
ratio
LRD
38.0
41.0
41.0
40.8
44.5
988
981
981
998
977
13.4%
13.7%
13.5%
13.2%
13.7%
4.6%
4.1%
4.2%
4.2%
3.8% |
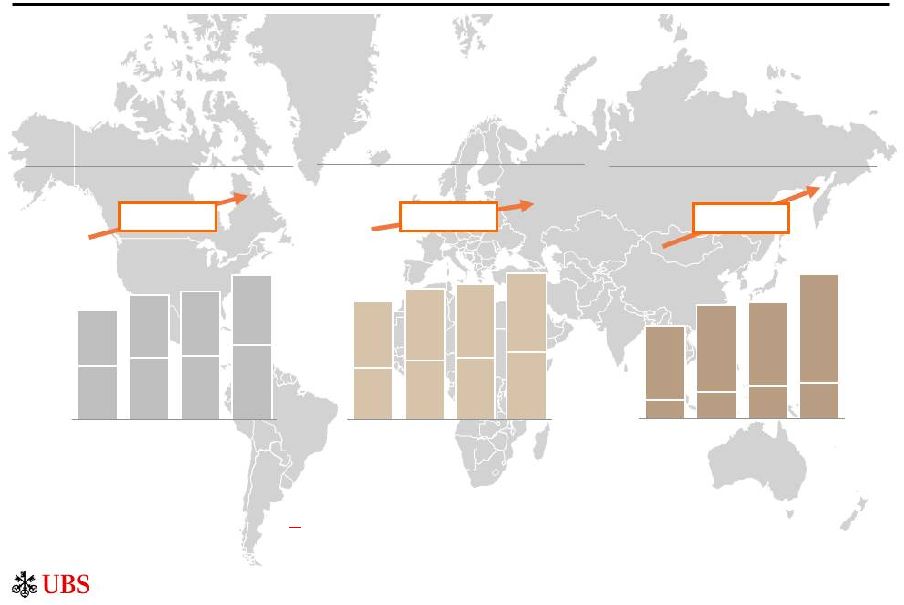 The world's leading
wealth management franchise Profit before tax
CHF billion
Invested assets
CHF trillion
WM
WMA
Adjusted numbers unless otherwise indicated, refer to slide 30 for details about adjusted
numbers, Basel III numbers and FX rates in this presentation Numbers may not sum up to
totals due to rounding 1Q12
0.7
0.1
0.6
0.3
1Q15
1Q13
0.7
0.3
0.9
0.9
1.1
1Q14
0.7
0.2
0.9
1.0
1Q15
1.0
2.0
0.9
1.8
1Q13
1Q14
1.7
0.9
0.9
0.8
0.8
0.7
1Q12
1.5
1.8
1Q14
1Q12
1.6
1.8
1Q15
1.7
1.9
3.5
1.9
1Q13
1.4
3.2
2.1
3.6
3.9
+10% CAGR
+7% CAGR
+16% CAGR
Unique global footprint
operating in the largest and fastest growing markets
Superior growth prospects and strong track record
17
Operating income
CHF billion |
 The world's
leading wealth manager
UBS is the world's largest wealth manager
1
Strong capital
position
UBS capital position is strong –
and we can adapt to change
Attractive capital
returns policy
UBS is committed to an attractive capital returns policy
UBS –
a unique and attractive investment
proposition
18
1 Scorpio Partnership Global Private Banking Benchmark 2014; 2 Adjusted pre-tax profit,
refer to slide 27 for details; 3 Payout ratio of at least 50% conditional on maintaining a
fully applied Basel III CET1 capital ratio of at least 13% and post-stress fully applied
Basel III CET1 ratio of at least 10% Unique global footprint provides exposure to both
the world's largest and fastest growing global wealth pools
Leading position across the attractive HNW and UHNW client segments
Profitable in all regions including Europe, US, APAC and emerging markets
Significant benefits from scale; high and rising barriers to entry
Retail & Corporate, Global Asset Management and the Investment Bank all add to our
wealth management franchise, providing a unique proposition for clients
Highly cash generative with a very attractive risk-return profile
10-15% pre-tax profit growth target for our combined wealth management
businesses Our fully applied Basel III CET1 capital ratio is the highest among large
global banks and we already meet our expected 2019 Swiss SRB Basel III capital ratio
requirements Our highly capital accretive business model allows us to adapt to changes
in regulatory capital requirements
Our earnings capacity, capital efficiency and low-risk profile all support our objective
to deliver sustainable and growing capital returns to our shareholders
Our capital returns capacity is strengthened by our commitment to further improve
efficiency and our potential for net upward revaluations of deferred tax assets
We target to pay out at least 50% of net profits
3
, while maintaining our strong capital
position and profitably growing our businesses
2 |
 Appendix
|
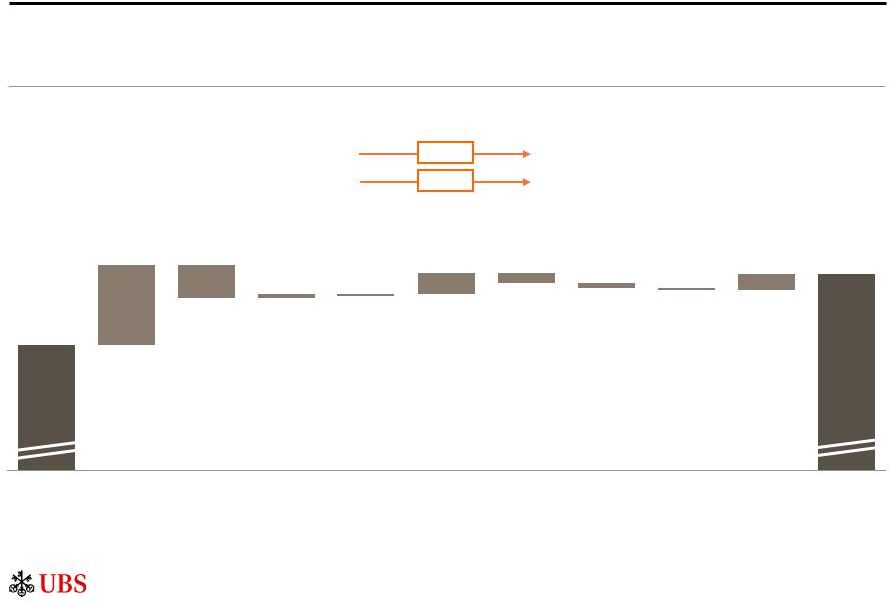 52,359
50,608
IFRS equity attributable to UBS Group AG shareholders
31.12.14
Foreign
currency
translation
(OCI)
31.3.15
Employee
share and
share options
plans (share
premium)
Cash flow
hedges
(OCI)
Net profit
Treasury
shares
Financial
investments
available-
for-sale
(OCI)
Defined
benefit
plans (OCI)
Other
QoQ movement
CHF million, except for per share figures in CHF
Increase in
UBS Group AG's
ownership
interest in UBS AG
Total book value per share:
Tangible book value per share:
12.14
13.94
31.12.14
12.59
14.33
31.3.15
77
14
539
(272)
(126)
376
(799)
1,977
(36)
Equity attributable to UBS Group AG shareholders CHF 52 billion as of 31.3.15
20
+2.8%
+3.7% |
 1Q14
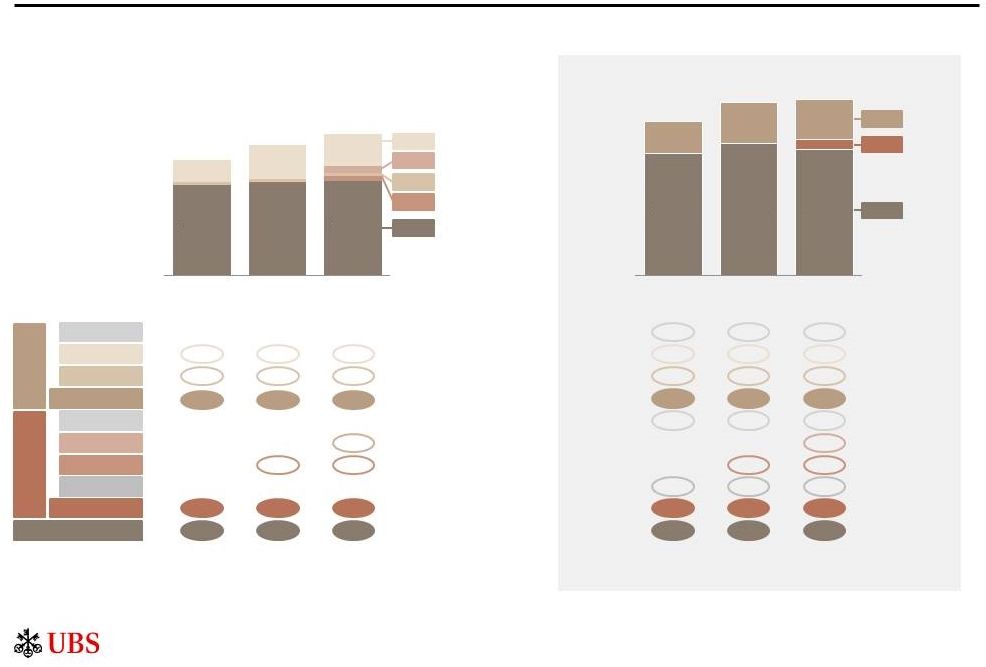
Swiss SRB Basel III capital and ratios
Refer to slide 30 for details about adjusted numbers, Basel III numbers and FX rates in this
presentation 1 Phase-out capital; 2 Hybrid capital subject to phase-out; 3
Goodwill, net of tax, offset against hybrid capital and loss-absorbing capital
21
Ratio
T2 Low-trigger
T2 High-trigger
AT1 High-trigger
CET1
13.7%
0.8%
0.4%
4.6%
CHF billion
Fully applied
Phase-in
22.7%
25.9%
25.5%
1Q15 fully applied Basel III CET1 capital ratio 13.7%
18.6%
1.4%
5.9%
T2
CET1
AT1
T2
AT1
Low-trigger
7.1
10.5
10.0
7.1
10.5
10.0
CET1
29.9
28.9
29.6
41.2
42.9
40.8
Total capital
38.0
40.8
44.5
52.2
56.3
56.8
RWA
226.8
216.5
216.4
229.9
220.9
219.4
3.0
2.1
2.0
Other¹
High-trigger
1.0
0.9
0.9
1.0
0.9
0.9
Total T2
8.1
11.4
11.0
11.0
13.4
13.0
Other²
3.1
3.2
2.9
Deductions³
(3.1)
(3.7)
(3.9)
Total AT1
-
0.5
3.9
-
-
3.0
Low-trigger
2.3
2.3
High-trigger
0.5
1.7
0.5
1.7
1.0%
AT1 Low-trigger
4Q14
1Q15
1Q14
4Q14
1Q15
18.9%
16.8%
20.6%
13.2%
13.4%
13.7%
17.9%
19.4%
18.6% |
 Refer to slide 30
for details about adjusted numbers, Basel III numbers and FX rates in this presentation 1
Hybrid capital subject to phase-out; 2 Goodwill, net of tax, offset against hybrid capital and loss-absorbing capital; 3 Refer to the "BIS Basel III leverage ratio" section of the 1Q15
financial report for further detail
Ratio
Fully applied
Phase-in
T2
CET1
AT1
T2 Low-trigger
T2 High-trigger
AT1 High-trigger
CET1
AT1 Low-trigger
1Q15 fully applied Swiss SRB leverage ratio 4.6%
Total capital
38.0
40.8
44.5
49.3
54.3
54.8
Swiss SRB LRD
987.9
997.8
976.9
994.0
1,004.9
982.2
4.1%
4.6%
3.8%
Swiss SRB leverage ratio
22
CHF billion
billion
(31.3.15)
CHF 14.0
BIS Basel III leverage ratio 3.4% on a fully applied basis and 4.4% on a
phase-in basis BIS Basel III LRD CHF 991 billion on a fully applied basis and
CHF 996 billion on a phase-in basis 3
3 |
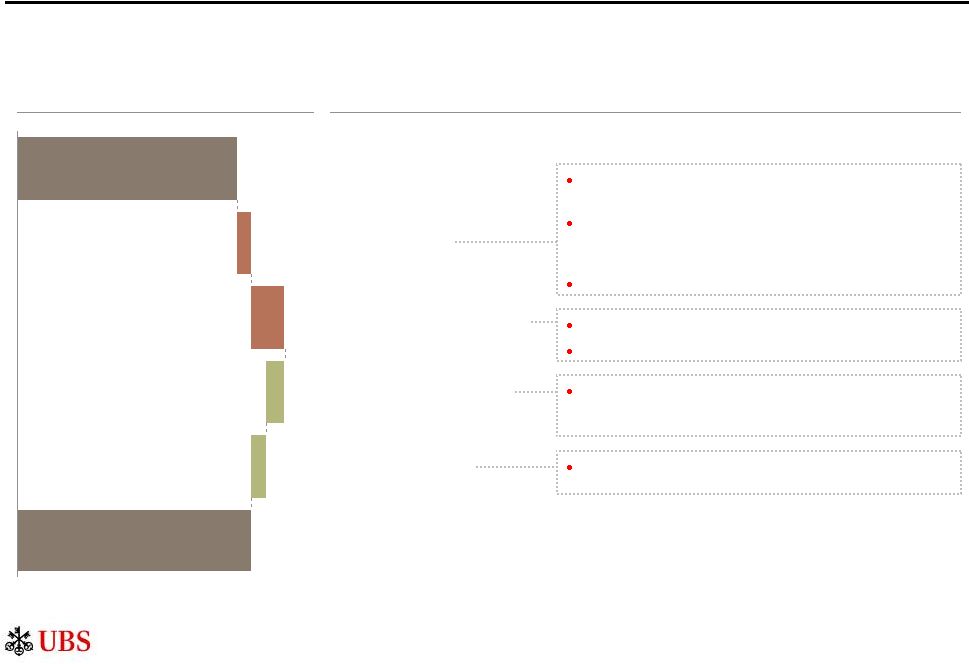 LRD: Swiss SRB vs.
BIS Basel III rules 23
We expect the net difference to decrease by year-end 2015, as we adjust our exposures to new
regulation
LRD
(CHF
billion)
Description of changes
973
991
Derivative
exposures
Securities financing
transactions
Off-balance sheet
commitments
Scope of
consolidation
BIS LRD
Fully applied
Spot, 31.3.15
Refer to slide 30 for details about adjusted and underlying numbers, Basel III numbers and FX
rates in this presentation 1 Chart based on 31.3.15 spot balances, 1Q15 average fully
applied Swiss SRB LRD was CHF 977 billion ~17
~42
(~24)
(~18)
Swiss SRB LRD
Fully applied
Spot, 31.3.15
Inclusion of net notionals for protection sold through
credit derivatives
Current exposure method (CEM) add-ons no longer
exempt for ETD and exposures to qualifying central
counterparties
Partly offset by netting with cash collateral
Addition of charge for counterparty credit risk
Stricter netting criteria
Application of credit conversion factors in line with the
Basel III framework and inclusion of forward-starting
repurchase agreements
Exclusion of assets of entities consolidated under IFRS
but not in regulatory scope of consolidation |
 Breakdown of changes
in RWA 24
31.12.14
By type
CHF billion
31.12.14
By business division
CHF billion
216
216
(5)
+1
216
216
(3)
+3
31.3.15
Methodology/model-driven
Book size and other
Currency effects
Investment Bank
31.3.15
+4
All
other
businesses
2
(0)
CHF 2.0 billion increase in operational risk RWA due to
AMA model parameter changes
CHF 2.3 billion increase in credit risk RWA due to
increased multipliers on Swiss mortgages
CHF 0.7 billion increase in credit risk RWA primarily due to
higher derivative exposures partly offset by repayment of
loans and termination of loan facilities
HF 0.8 billion increase in operational risk RWA related to
AMA model parameter changes
CHF 0.9 billion decrease in RWA due to currency effects
Non-core
and
Legacy
Portfolio
1
CHF 1.0 billion decrease in credit risk RWA primarily due currency
effects and repayment of loans, termination of loan facilities partly
offset by
to higher derivative exposures
CHF 2.3 billion increase in credit risk RWA due to increased
multipliers on Swiss mortgages
CHF 0.8 billion increase in operational risk RWA due to AMA model
parameter changes
CHF 2.0 billion decrease in market risk RWA primarily due to lower
regulatory VaR, Stressed VaR and risks not in VaR and currency
effects
CHF 0.4 billion increase in operational risk RWA due to AMA model
parameter changes
Refer to slide 30 for details about adjusted numbers, Basel III numbers and FX rates in this
presentation 1 Refer to pages 55-57 of the 1Q15 financial report for more
information on Non-core and Legacy Portfolio; 2 Corporate Centre – Group ALM, Corporate Centre – Services,
Wealth Management, Wealth Management Americas, Retail & Corporate and Global Asset
Management |
 Strong balance
sheet, funding and liquidity position Refer to slide 30 for details about adjusted
numbers, Basel III numbers and FX rates in this presentation 1 Refer
to
the
"Liquidity
and
funding
management"
section
of
the
1Q15
financial
report
for
further
detail;
2
Estimated
pro-forma
ratio
Other (including net replacement
values)
Loans
Cash collateral on securities borrowed
and reverse repo agreements
Trading portfolio assets
Financial investments available-
for-sale
Cash, balances with central
banks and due from banks
Due to banks (10)
Short-term debt issued (23)
Trading portfolio liabilities (30)
Cash collateral on securities lent
and repo agreements (24)
Long-term debt issued
Due to customers
Total equity
Other liabilities
Strong funding and liquidity
Asset funding
31.3.15, CHF billion
25
314
71
133
91
107
82
56
399
Liabilities
and equity
135
121
Assets
127%
coverage
•
Well diversified by market, tenor and currency
•
Limited use of short-term wholesale funding
•
Basel III LCR 122% and Basel III NSFR
2
106%
1 |
 0.3
Corporate Center cost reductions
26
(<0.1)
(0.1)
7.9
7.5
0.2
0.2
(0.1)
(0.2)
7.9
7.5
0.5
(0.1)
7.2
<0.1
(<0.1)
7.8
7.2
0.6
0.5
Temporary
regulatory demand²
Litigation
provisions¹
Services &
Group ALM
CHF 1.0 billion
net cost reduction
target by 2015
year-end exit rate
vs. FY13
3
~CHF 0.8 billion net cost reduction as per March 2015 exit rate
Non-core
and Legacy
Portfolio
CHF 0.4 billion
net cost reduction
target by 2015
year-end exit rate
vs. FY13
3
Residual
operating expenses
Net cost
reduction
FX
Net cost
reduction
FX
Net cost
reduction
FX
FY13
FY14
1Q15
annualized
March 2015
annualized
exit rate
Services and
Group ALM
March 2015 exit rate
net cost reduction
Average monthly
run rate (residual
operating expenses)
~CHF 630
million
~CHF 620
million
~CHF 600
million
~CHF 600
million
0.2
(0.2)
2.4
1.1
1.3
0.7
+0.1
0.6
(0.3)
1.1
0.9
~CHF 90
million
~CHF 80
million
~CHF 50
million
~CHF 50
million
FY13
FY14
1Q15
annualized
March 2015
annualized
exit rate
Non-core and
Legacy Portfolio
March 2015 exit rate
net cost reduction
Net cost
reduction
Net cost
reduction
Net cost
(reduction)/
increase
0.6
Litigation
provisions
Residual
operating expenses
Average monthly
run rate (residual
operating expenses)
~CHF 0.8
billion
annualized
net cost
reduction
Lower allocations
from Corporate
Center –
Services
Lower direct costs
in Non-core and
Legacy Portfolio
Normalization,
incl. seasonality
Adjusted operating expenses before allocations (net of allocations to the Non-core and
Legacy Portfolio), CHF billion Adjusted operating expenses, CHF billion
Adjusted numbers unless otherwise indicated, refer to slide 30 for details about adjusted
numbers, Basel III numbers and FX rates in this presentation Charts illustrative only
and bars not to scale; Numbers may not sum up to totals due to rounding; 1 Provisions for litigation, regulatory and similar matters;
2 Regulatory demand of temporary nature; 3 Refer to page 41 of the 2014 annual report for
details on our cost reduction targets |
 Services and Group
ALM Net cost reduction
CHF 1.0 billion by 2015 year-end exit rate
Non-core and
Legacy Portfolio
Net cost reduction
Basel III RWA (fully applied)
CHF 0.4 billion by 2015 year-end exit rate, additional CHF 0.7 billion after 2015
~CHF 40 billion by 31.12.15, ~CHF 25 billion by 31.12.17
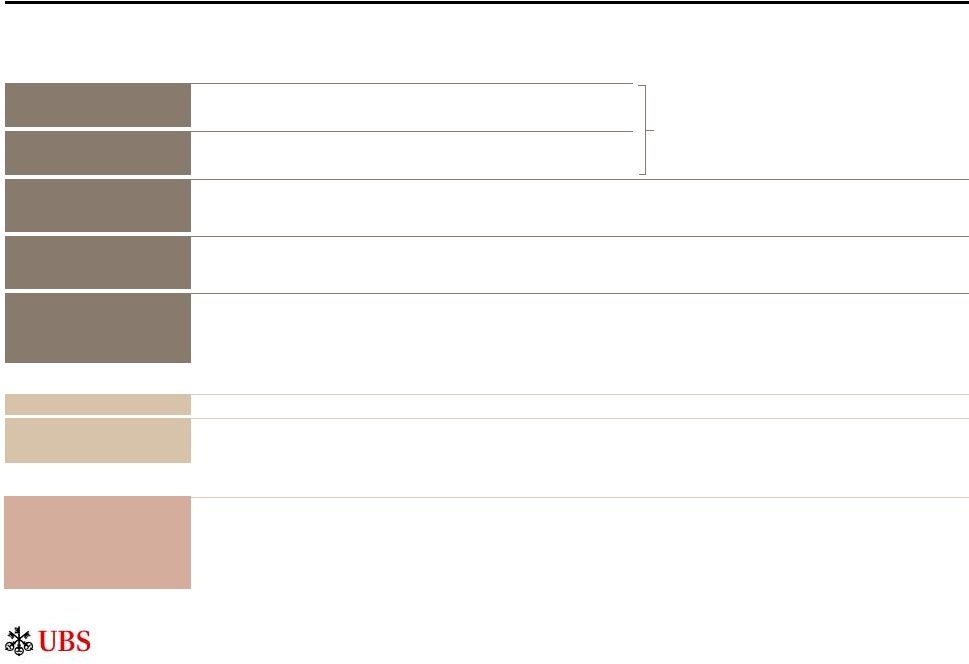
Group and business division targets
27
Ranges for sustainable performance over the cycle
1
Business divisions
Corporate Center
Retail & Corporate
Net new business volume growth rate
Net interest margin
Adjusted cost/income ratio
1-4% (retail business)
140-180 bps
50-60%
Global Asset
Management
Net new money growth rate
Adjusted cost/income ratio
Adjusted annual pre-tax profit
3-5% excluding money market
60-70%
CHF 1 billion in the medium term
Investment Bank
Adjusted annual pre-tax RoAE
Adjusted cost/income ratio
Basel III RWA limit (fully applied)
Funded assets limit
>15%
70-80%
CHF 70 billion
CHF 200 billion
Refer to slide 30 for details about adjusted numbers, Basel III numbers and FX rates in this
presentation 1 Refer to page 41 of the 2014 annual report for details; 2 Based on the
rules applicable as of the announcement of the target (6.5.14); 2 Our objective is to
maintain a post-stress fully applied CET1 capital ratio of at least 10%
Wealth Management
Americas
Net new money growth rate
Adjusted cost/income ratio
2-4%
75-85%
Wealth Management
Net new money growth rate
Adjusted cost/income ratio
3-5%
55-65%
10-15% annual adjusted pre-tax profit growth for
combined businesses through the cycle
Group
Group
Adjusted cost/income ratio
Adjusted return on tangible equity
Basel III CET1 ratio (fully applied)
Basel III RWA (fully applied)
Swiss SRB LRD
60-70%
around 10% in 2015, >15% from 2016
at least 13%
2
<CHF 215 billion by 31.12.15, <CHF 200 billion by 31.12.17
CHF 900 billion by 2016
2 |
        Regional
performance
–
1Q15
1
CHF billion
4Q14
1Q15
4Q14
1Q15
4Q14
1Q15
4Q14
1Q15
4Q14
1Q15
4Q14
1Q15
WM
0.1
0.1
0.5
0.6
1.0
1.0
0.4
0.4
(0.0)
-
2.0
2.1
WMA
1.9
1.8
-
-
-
-
-
-
-
-
1.9
1.8
R&C
-
-
-
-
-
-
0.9
1.0
-
-
0.9
1.0
Global AM
0.2
0.2
0.1
0.1
0.1
0.1
0.1
0.1
-
-
0.5
0.5
Investment Bank
0.6
0.8
0.6
0.7
0.5
0.8
0.2
0.4
0.0
(0.0)
1.9
2.7
Corporate Center
-
-
-
-
-
-
-
-
(0.6)
0.0
(0.6)
0.0
Group
2.8
2.9
1.1
1.4
1.7
1.9
1.7
1.9
(0.6)
0.0
6.7
8.1
WM
0.1
0.1
0.3
0.3
0.7
0.6
0.2
0.2
0.0
0.0
1.3
1.2
WMA
1.6
1.5
-
-
-
-
-
-
-
-
1.6
1.5
R&C
-
-
-
-
-
-
0.6
0.5
-
-
0.6
0.5
Global AM
0.1
0.1
0.1
0.0
0.1
0.1
0.1
0.1
0.0
(0.0)
0.4
0.3
Investment Bank
0.5
0.6
0.4
0.5
0.4
0.6
0.2
0.2
0.2
0.0
1.6
1.8
Corporate Center
-
-
-
-
-
-
-
-
0.6
0.4
0.6
0.4
Group
2.3
2.3
0.8
0.9
1.2
1.3
1.0
1.0
0.8
0.4
6.1
5.8
WM
0.0
0.0
0.1
0.2
0.4
0.4
0.2
0.2
(0.0)
(0.0)
0.7
0.9
WMA
0.2
0.3
-
-
-
-
-
-
-
-
0.2
0.3
R&C
-
-
-
-
-
-
0.4
0.4
-
-
0.4
0.4
Global AM
0.1
0.1
0.0
0.0
0.0
0.0
0.0
0.1
(0.0)
0.0
0.1
0.2
Investment Bank
0.1
0.2
0.2
0.3
0.1
0.2
0.1
0.2
(0.2)
(0.0)
0.3
0.8
Corporate Center
-
-
-
-
-
-
-
-
(1.2)
(0.3)
(1.2)
(0.3)
Group
0.4
0.6
0.3
0.5
0.5
0.6
0.7
0.9
(1.4)
(0.4)
0.5
2.3
EMEA²
Switzerland
Corporate Center
and global³
Total
Operating
income
Operating
expenses
Profit
before tax
Americas
Asia Pacific
28
Adjusted numbers unless otherwise indicated, refer to slide 30 for details about adjusted
numbers, Basel III numbers and FX rates in this presentation 1
Refer to the "Group performance" section of the 1Q15 financial report for further
detail about regional performance; 2 Europe, Middle East, and Africa excluding
Switzerland; 3 Refers to items managed globally |
 Adjusted
results 29
Adjusting items
Business division / Corporate Center
1Q13
2Q13
3Q13
4Q13
1Q14
2Q14
3Q14
4Q14
1Q15
CHF million
Operating income as reported (Group)
7,775
7,389
6,261
6,307
7,258
7,147
6,876
6,746
8,841
Of which:
Gain on sale of a subsidiary
Wealth Management
141
Gain on sale of Global AM’s Canadian domestic business
Global Asset Management
34
Gain from the partial sale of our investment in Markit
Investment Bank
43
Impairment of financial investments available-for-sale
Investment Bank
(48)
Investment Bank
55
Corporate Center - Group ALM
(24)
Own credit on financial liabilities designated at FV
Corporate Center - Services
(181)
138
(147)
(94)
88
72
61
70
226
Gains on sales of real estate
Corporate Center - Services
19
207
61
23
1
20
378
Corporate Center - Group ALM
(119)
(75)
Corporate Center - Non-core and Legacy Portfolio
27
Operating income adjusted (Group)
7,983
7,232
6,201
6,415
7,147
7,031
6,863
6,656
8,096
Operating expenses as reported (Group)
6,327
6,369
5,906
5,858
5,865
5,929
7,430
6,342
6,134
Of which:
Wealth Management
26
50
62
41
40
38
60
48
46
Wealth Management Americas
10
10
13
26
10
7
15
23
24
Retail & Corporate
15
13
15
12
15
13
20
16
16
Global Asset Management
4
14
12
13
4
2
5
39
18
Investment Bank
6
31
84
89
124
27
50
60
70
Corporate Center - Services
(3)
5
(1)
(7)
2
4
16
8
119
Corporate Center - Non-core and Legacy Portfolio
188
18
5
24
9
(2)
10
14
11
Wealth Management Americas
(3)
(7)
Global Asset Management
(8)
Investment Bank
(19)
(1)
Corporate Center - Non-core and Legacy Portfolio
(3)
Operating expenses adjusted (Group)
6,081
6,229
5,718
5,660
5,661
5,840
7,287
6,142
5,829
Operating profit/(loss) before tax as reported
1,447
1,020
356
449
1,393
1,218
(554)
404
2,708
Operating profit/(loss) before tax adjusted
1,901
1,003
484
755
1,486
1,191
(424)
514
2,268
Net losses related to the buyback of debt
in public tender offer
Net restructuring charges
Credit related to changes to retiree benefit plans
in the US
Net gain on sale of remaining proprietary
trading business
Adjusted numbers unless otherwise indicated, refer to slide 30 for details about adjusted
numbers, Basel III numbers and FX rates in this presentation Refer to page 15 of the
1Q15 financial report for an overview of adjusted numbers |
 30
Important information related to this
presentation
Use of adjusted numbers
If applicable for a given adjusted KPI (i.e., adjusted return on tangible equity), adjustment
items are calculated on an after-tax basis by applying indicative tax rates (i.e., 2% for own
credit, 22% for other items, and with certain large items assessed on a case-by-case
basis). Refer to page 22 of the 1Q15 financial report for more information.
Basel III RWA, Basel III capital and Basel III liquidity ratios
Basel III numbers are based on the BIS Basel III framework, as applicable for Swiss
Systemically relevant banks (SRB). Numbers in the presentation are Swiss SRB Basel III numbers
unless otherwise stated. Our fully applied and phase-in Swiss SRB Basel III and BIS Basel
III capital components have the same basis of calculation, except for differences disclosed
on page 93 of the 1Q15 financial report. Basel III
risk-weighted assets in this presentation are calculated on the basis of Basel III fully applied unless otherwise stated. Our RWA under BIS Basel III are the same as under
Swiss SRB Basel III.
Leverage ratio and leverage ratio denominator in this presentation are calculated
on the basis of fully applied Swiss SRB, unless otherwise stated.
Refer to the “Capital Management” section in the 1Q15 financial report for more
information.
Currency translation
Monthly income statement items of foreign operations with a functional currency other than
Swiss francs are translated with month-end rates into Swiss francs. Refer to “Note 19
Currency translation rates” in the 1Q15 financial report for more information. Rounding
Unless otherwise indicated, “adjusted” figures exclude the adjustment items listed on
the previous slide, to the extent applicable, on a Group and business division level. Adjusted
results are a non-GAAP financial measure as defined by SEC regulations. Refer to page 15 of
the 1Q15 financial report for an overview of adjusted numbers. Numbers presented throughout this presentation may not add up precisely to the totals
provided in the tables and text. Percentages, percent changes and absolute variances are
calculated based on rounded figures displayed in the tables and text and may not precisely reflect the percentages, percent changes and absolute variances
that would be derived based on figures that are not rounded. |

UBS First Quarter 2015 Earnings Call Remarks
May 5, 2015
Sergio P. Ermotti (Group CEO): Opening remarks
SLIDE 2 – 1Q15 highlights
While the first quarter is typically the strongest of the year, our results this quarter are exceptionally good. We reported adjusted pre-tax profit of almost 2.3 billion francs, and net profit was almost 2.0 billion francs. And the results were strong across the board, with all of our business divisions performing well. Our Basel 3 fully applied CET1 ratio also rose to 13.7%, so we remain the best capitalized bank in our peer group.
The results underline that our business model works and our approach to thinking long-term and acting early is paying off. From a macroeconomic and market point of view, the first quarter was more demanding than a typical year, but we were prepared.
So while our results for the quarter are very good and I am confident about our momentum, like we said at Q4, we wouldn’t multiply any quarterly result by four.
Turning to the business divisions -
Together our wealth management businesses delivered the highest profits since 2008 and made solid progress with their strategic initiatives to grow lending and increase mandate penetration.
Wealth Management had its best quarter since 2008 in terms of profitability. Net new money was very strong, even for a first quarter, and was achieved without compromising our profitability standards.
Page 1
Wealth Management Americas delivered another record profit before tax on its highest ever invested asset base, and attracted solid net new money.
Despite a very challenging macroeconomic environment, Retail and Corporate delivered its best first quarter in five years.
Global Asset Management also posted strong results and robust net new money.
The Investment Bank deserves applause not only for its excellent performance with pre-tax profit of 844 million francs, but also because the results were delivered without increasing our risk profile, and while remaining within allocated resource limits. This is a very important point to consider when assessing our results. Our strategy focusses on areas where we excel, and it is well-suited to the high volume and volatility environment we saw in Q1.
Our strategic cost reduction program is ambitious, and I am pleased with the progress we are making in its implementation. While improving our efficiency and effectiveness is a top priority, short-term dynamics will not change our plans, as this would impact our ability to deliver long-term sustainable growth.
Tom will now take you through the details of the quarter.
Tom Naratil (Group CFO & Group COO): Walk-through of the quarter
SLIDE 3 – UBS Group AG results (consolidated)
As usual, my commentary will reference adjusted results unless otherwise stated.
This quarter, we excluded net restructuring charges of 305 million Swiss francs, an own credit gain of 226 million, gains on sales of real estate of 378 million and a gain of 141 million on the sale of a subsidiary in Wealth Management. The net effect of these adjustment items is an accretion to capital of around 150 million in the quarter. An overview of these adjustments can be found on page 15 of our first quarter report.
Page 2
Profit before tax was 2.3 billion, up from 514 million in the prior quarter.
IFRS net profit attributable to shareholders was nearly 2 billion, and adjusted return on tangible equity was seasonally high at 14.4%, ahead of our full-year target of around 10%.
Net profit attributable to non-controlling interests was 61 million. This primarily related to net profit attributable to non-controlling interests in UBS AG reflecting the non-exchanged UBS AG shares. We also expect to attribute net profit of approximately 80 million to non-controlling interests related to the preferred notes issued by UBS AG, all of which will be booked in the second quarter of 2015.
SLIDE 4 – Wealth Management
Wealth Management delivered a strong performance, with profit before tax of 856 million, up 23% to its highest level since the third quarter of 2008.
Operating income increased 5% to 2.1 billion, as transaction-based income rose in all regions, but most notably in APAC and Switzerland. While transaction-based income was up across nearly all products, the increase was largely driven by seasonal effects, portfolio rebalancing and higher volumes in FX as a consequence of the SNB’s actions in January.
Both net interest income and recurring net fees were down due to the stronger Swiss Franc. Excluding the effect of currency movements, recurring income increased on a continued rise in recurring net fees. This underlying trend gives us even more confidence in our ability to deliver on our key initiatives, as net mandate sales were strongly positive in all regions.
Expenses decreased 5%, mainly due to lower marketing expenses and Corporate Center costs, as well as favorable currency effects. This brought the cost/income ratio to 59%, within our target range of 55 to 65%.
Page 3
SLIDE 5 – Wealth Management
Net new money was a strong 14.4 billion, the highest it’s been in eight quarters.
Mandate penetration increased 110 basis points to 25.5% of invested assets, as the business delivered 15 billion in net mandate sales.
Both gross and net margin were up on higher revenues and profit before tax, and on a lower average invested asset base. Gross margin increased 4 basis points to 86 basis points, and net margin increased 7 basis points to 35 basis points, its highest level in over five years.
Marginal transactional activity continues to cause significant swings in trading and commission revenues, resulting in large month-to-month swings in our gross margin, which was 91 basis points in January, 82 basis points in February and 92 basis points in March. What we’ve seen in two out of three months in the first quarter shows the potential upside in a more normalized environment.
SLIDE 6 – Wealth Management
Net new money was positive in all regions, with the largest net inflows in APAC, which delivered 8.2 billion of net new money. Europe delivered net new money of 3 billion, with strong inflows from our domestic business, and positive net inflows from our international business, following seasonally high offshore outflows in the fourth quarter. Net new money was 1.6 billion in Switzerland and 1.5 billion in Emerging Markets.
On a global basis, net new money continued to be strong, with 10.1 billion from our ultra-high net worth clients and a solid contribution from our high net worth clients. Of the 14.4 billion of net new money delivered in the quarter, only 1.8 billion came from increased Lombard lending.
Our net new money is one of many KPIs that we use to monitor our performance, and we don’t buy net new money. Surprisingly, we’ve seen some irrational competition for net new money as some large competitors pay premiums for deposits and these assets.
Page 4
In contrast to some of these competitors, as we highlighted in our fourth quarter earnings call, we’ll be taking action on a number of fronts to optimize our resource utilization, and to ensure that any resource constraints are appropriately priced. Some of these actions may cause affected clients to withdraw some of their cash assets, thus impacting our net new money. These exits would result in net new money outflows, which we’ll exclude from our net new money growth KPI calculation. While it’s unlikely that all assets will be withdrawn, the assets in scope approach 30 billion francs. We expect the bulk of the liquidity coverage ratio and leverage ratio denominator relief from these actions to come in the second quarter, with a slight benefit to come in the third.
Our net new money growth of 5.8% in the first quarter does not exclude any outflows associated with these assets.
Both APAC and Switzerland saw a sharp rise in revenue, as transaction-based income increased on higher client activity. In APAC, we saw strong demand for structured products, particularly related to equities. In Switzerland, the increase was largely driven by rebalancing and foreign-exchange related revenues triggered by the SNB’s actions in January. Revenues were relatively stable in Emerging Markets and down in Europe on a stronger Swiss Franc.
SLIDE 7 – Wealth Management Americas
Wealth Management Americas had a record quarter, generating a profit before tax of 293 million dollars, up 26% on lower expenses.
Operating income was 1.9 billion dollars, and decreased from the fourth quarter, mainly as there were fewer calendar and trading days. As a percentage of revenue, recurring income increased to a record 77%.
Page 5
Expenses were down 5% to 1.6 billion dollars, mainly due to lower FA compensation on lower compensable revenues, and also as charges for litigation, regulatory and similar matters declined from the prior quarter.
Our cost/income ratio was 84.6%, at the top end our target range of 75 to 85%.
SLIDE 8 – Wealth Management Americas
Wealth Management America’s trillion dollar invested asset base continued to grow to record levels, on both positive market performance and solid net new money at 4.8 billion dollars. Net inflows were driven by advisors who’ve been with the firm for more than one year. For the second quarter, we expect to see the typical trend of increased client withdrawals associated with seasonal income tax payments.
We continued to see positive trends in mandate penetration, which increased 40 basis points to 33.9%.
Net margin increased 2 basis points to 11 basis points on lower expenses, which more than offset the impact of a higher average invested asset base and lower revenues, while gross margin was down 2 basis points to 73 basis points.
SLIDE 9 – Wealth Management Americas
Invested assets per FA increased to a record 150 million dollars, while our annualized revenue per FA remained industry leading at 1.1 million dollars. The average production of recruits continued to outpace production of FAs leaving, with 77% of our recruits ranked in the first and second industry quintile, compared with 29% of FAs who left. In general, we’ve continued to see low FA attrition in the industry and at UBS.
Consistent with our strategy, we continued to grow lending balances with total loans growing 2% to 45.5 billion dollars. Average mortgage balances increased 2% to 7.8 billion dollars and securities-backed lending balances were up 3% to 32.1 billion. Although pricing on securities-based lending remains firm, mortgage spreads are under pressure as the industry targets high quality High Net Worth and Ultra High Net Worth mortgage loans.
Page 6
SLIDE 10 – Retail & Corporate
Retail and Corporate delivered its best first quarter in five years with a profit before tax of 443 million francs, up 24%. All KPIs were within their target ranges.
Operating income was up 7%, mostly reflecting lower credit loss expenses, but also higher transaction-based income and net interest income.
Transaction-based income was up 4% to 284 million, as the volatility in both interest rates and foreign-exchange after the SNB’s actions led to increased client activity in FX hedging and trading, as well as gains from macro fair-value hedge ineffectiveness. This was partly offset by a decline in credit card-related income, which was higher in the fourth quarter reflecting seasonal holiday activity.
Net interest income increased 2% to 568 million with increases in both loans and deposits, as we introduced pricing measures in response to the SNB’s policy changes, and as we saw continued benefits from pricing measures we implemented in the prior year. This more than offset the continued effect of persistently low interest rates on our replication portfolios.
On our fourth quarter earnings call, we noted that if the negative interest rate environment in Switzerland continued, our net interest margin would likely be at the lower end of our target range of 140 to 180 basis points. Considering today’s environment, in a constant rate scenario and if asset spreads hold firm despite new market entrants in the mortgage market, as we approach year-end, we would expect a net interest margin that is a bit lower than the middle of our target range.
Following a typical seasonal pattern, net new business volume growth for our retail business was solid at 3.1%, within our target range of 1 to 4%. Net new business volume for retail clients stood at 1.1 billion, and was impacted by over half a billion francs of euro-denominated cash withdrawals following the SNB’s actions.
Page 7
Net credit loss expenses were 21 million partly reflecting the strengthening of the Swiss Franc and more challenging economic conditions. At this point in time, we’ve not yet seen any significant impact on our loan portfolio from a higher Swiss franc. For the rest of this year, we expect to see more normalized and slightly increased credit loss expense levels compared with 2014. We continue to monitor both the environment and our loan portfolio closely.
Expenses decreased 4%, as lower general and administrative expenses more than offset an increase in personnel expenses. G&A expenses decreased by 48 million, as the prior quarter included higher investments in multichannel offerings, and as marketing expenses and professional fees declined.
SLIDE 11 – Global Asset Management
In Global Asset Management, the business delivered its strongest performance in over five years, with profit before tax increasing 50% to 186 million.
Operating income was up 3% to 511 million, on strong performance fees, with a notable increase in O’Connor and A&Q. This more than offset lower net management fees, which were impacted by currency moves, with the largest effect on traditional investments. Expenses declined by 13% to 325 million, on lower charges for provisions for litigation, regulatory and similar matters, and lower allocated costs from Corporate Center.
Net new money excluding money markets was 7.5 billion, as we saw strong inflows in alternatives as well as other asset classes. Net new money from our wealth management businesses was 5.1 billion, the highest it’s been since the first quarter of 2007.
Investment performance was solid overall, with strong performances in O’Connor and A&Q, where over 90% of assets eligible for performance fees were above high-water marks at quarter-end.
Page 8
SLIDE 12 – Investment Bank
The Investment Bank delivered a strong quarter, with a profit before tax of 844 million and an annualized return on attributed equity of 46%, as all regions generated double-digit revenue growth year-over-year.
Investor Client Services delivered its best quarter since the acceleration of our strategy in 2012, on higher volatility, client activity and volumes.
Equities revenues increased 27% versus the prior quarter to 1.2 billion, with stronger performance across all sectors and regions, largely on seasonally higher client activity. On a year-on-year basis, revenues were up 15% with strong performances in financing services and derivatives. Revenues increased year-over-year in all regions, but most notably in APAC, where there was a strong rise in revenues from equity finance on higher client activity levels.
In FX, Rates and Credit, revenues were 701 million, up from 297 million in the prior quarter, and up 71% year-over-year, reflecting increased client flows and volatility levels across FX and Rates, as well as solid results from credit flow on lower risk and resource utilization. In rates and credit, the business maintained high balance sheet velocity in order to meet the needs of our clients.
Corporate Client Solutions revenues were 801 million, up 13% on higher revenues in DCM, ECM, and financing solutions as well as higher risk management revenues, partly offset by lower advisory revenues.
On a year-over-year basis, revenues were up 4% mainly in ECM, on increased participation in public offerings, as well as higher revenues from private transactions. The performance in ECM along with increases in Advisory, Financing Solutions and Risk Management was partly offset by lower revenues in DCM, as the market fee pool was down 29% and as participation in leveraged finance transactions was lower.
Operating expenses were up 11% in the quarter on higher variable compensation expenses, partly offset by lower charges for litigation regulatory and similar matters, and as the prior quarter included a charge of 68 million for the annual UK bank levy. The cost/income ratio was down 17 percentage points to 68%.
Page 9
SLIDE 13 – Investment Bank
Once again, we’ve demonstrated that our business model works with the Investment Bank delivering excellent returns on attributed equity while carefully managing risk and deployment of its resources. As Sergio mentioned, this is a very important point to consider when assessing our results. We’ve provided this slide to place our results in the appropriate context.
We continue to focus on our traditional strengths in advisory, capital markets, equities and foreign exchange, complemented by a refocused rates and credit platform. The Investment Bank is an active participant in capital markets flow activities, including sales, trading and market-making. Our model is geared towards client facilitation and flow, and volumes explain almost all quarterly fluctuations in revenues.
To support our goal of earning attractive risk-adjusted returns on our allocated capital, we operate within a tightly controlled framework for balance sheet, risk-weighted assets and LRD. This is evidenced by the stability of our resource consumption, despite the demands from seasonal activity.
Revenue per unit of VaR was the highest it’s been since the acceleration of our strategy and return on risk weighted assets was the highest in eight quarters, as average VaR remained flat and risk-weighted assets declined by 3 billion to 64 billion.
SLIDE 14 – Corporate Center
We’ve increased the level of detail in reporting for Corporate Center and reflected changes in its structure. Corporate Center is now divided into three units: Corporate Center Services, Corporate Center Group Asset and Liability Management, and Non-core and Legacy Portfolio.
Page 10
Profit before tax in Corporate Center Services was negative 222 million, compared with negative 261 million in the prior quarter. This was driven by reduced operating expenses before allocations on lower G&A and personnel expenses, slightly offset by comparatively lower net allocations.
Profit before tax in Corporate Center Group Asset and Liability Management was 122 million compared with a loss of 208 million in the prior quarter. Gross revenues from balance sheet risk management activities were broadly unchanged.
Gross revenues from hedging activities increased significantly to 167 million from a loss of 63 in the prior quarter, as a result of increased gains from ineffectiveness in our cash flow hedges and gains on cross-currency basis swaps held as economic hedges. While the accounting asymmetry within Group Asset and Liability Management creates quarterly volatility within our financials, the net economic effect is largely neutral, as the positions managed within Group ALM represent economic hedges offsetting UBS’s structural positioning.
Profit before tax in Non-core and Legacy Portfolio was negative 240 million. Operating income was negative 80 million, compared with negative 361 million in the prior quarter. The decrease in negative income was the result of greater novation and unwind activity in the prior quarter. Operating expenses decreased by 190 million to 160 million, on lower charges for provisions for litigation, regulatory and similar matters and as the prior quarter included 52 million for the annual UK bank levy and a net charge of 42 million related to certain disputed receivables.
SLIDE 15 – Corporate Center cost reductions
In the first quarter of what is a critical year for our cost reduction initiatives, we made good progress, increasing our annualized cost reduction by 600 million to 800 million, based on the March exit rate versus full-year 2013.
The exit rate captures the annualized cost run-rate at the end of March, where it has been adjusted to reflect seasonality for a more accurate comparison against a full year. For our March exit rate, this was a net upward adjustment to expenses.
Page 11
Our continued improvement in efficiency is the result of successful and ongoing execution of our outsourcing, near shoring and offshoring initiatives, continued optimization of our real estate footprint, and other key levers.
While we’re pleased with our progress in our effectiveness and efficiency efforts this quarter, we’ll need to work hard to offset incremental costs associated with permanent regulatory demand to achieve our net cost reduction target of 1.4 billion in Corporate Center by the end of the year.
SLIDE 16 – Swiss SRB Basel III capital and leverage ratios
Our fully applied CET1 ratio increased 30 basis points to 13.7% and remained above 10% post-stress, as CET1 regulatory capital increased largely on higher retained earnings, partly offset by the impact of a stronger Swiss franc. Risk-weighted assets were flat at 216 billion, with small moves within the business divisions and Corporate Center.
We highlighted in our annual report that the changes to the applicable discount rate and interest rate related assumptions for our Swiss pension plan during January and February would’ve reduced our IFRS equity and fully applied CET1 capital by around 700 million. Due to the sharp change in market and macroeconomic conditions, we carried out a detailed review of the actuarial assumptions. As a result, we enhanced the methodology for estimating the discount rate, by improving the construction of the yield curve where the market for long tenor maturities of Swiss high quality bonds was not sufficiently deep. Also, we now have a more complete set of data points based on full-year information for the rate of salary increases, interest credit on retirement savings, employee turnover and the rate of employee disabilities. These improvements in estimate more than offset the impact of a decrease in the applicable discount rate previously highlighted, resulting in a 490 million net decrease in our defined benefit obligation related to our Swiss plan. This, along with an increase in the fair value of the underlying plan assets, led to a pre-tax gain of 906 million recognized in OCI. We note that we’ve maintained a prudent approach in our review of the IFRS accounting for our Swiss Pension Plan, and I’d emphasize that none of these calculations impact our pensioners or current employees.
Page 12
Our fully applied Swiss SRB leverage ratio increased 50 basis points to 4.6%, as our fully applied total regulatory capital increased, largely due to the issuance of 3.5 billion of high and low-trigger AT1 instruments out of UBS Group AG in February, and as our leverage ratio denominator decreased by 21 billion. Our fully applied BIS Basel III leverage ratio was 3.4%. Looking at a pro-forma measure of the Swiss SRB leverage ratio using a denominator based on BIS rules, our fully applied ratio would be 4.5%. We’ve added additional disclosure on our leverage ratio based on the BIS rules in the appendix of this presentation, the capital section of our quarterly report, as well as on our investor relations website.
The decrease in our Swiss SRB leverage ratio denominator was largely driven by Non-core and Legacy Portfolio, where it decreased by 9 billion to 84 billion, on continued trade unwinds, migrations and compressions.
Leverage ratio denominator also decreased by 7 billion in Wealth Management Americas, mainly due to a reassessment of securities-based lending credit lines.
We’ve also made continued progress in our measures to improve the resolvability of the bank in response to too big to fail requirements. We expect to complete the transfer of our Retail & Corporate and Wealth Management business booked in Switzerland from UBS AG to UBS Switzerland AG, as early as mid-June. The transfer arrangements will provide that UBS Switzerland AG and UBS AG will each have joint liability for most obligations of the other entity that exist on the asset transfer date. The joint liability is explained in further detail on page 10 of the report.
Thank you. I’ll now hand it back over to Sergio for some closing remarks.
Sergio P. Ermotti (Group CEO): Closing remarks
SLIDE 17 – The world’s leading wealth management franchise
Page 13
Thank you Tom.
It is clear that our businesses were at the top of their game this quarter.
In particular, our wealth management businesses combined delivered a pre-tax profit of over 1.1 billion francs, up 23% in the quarter and 24% year-over-year, the first time profits have exceeded 1 billion francs since 2008. Almost three quarters of the 3.9 billion in revenues we generated were recurring.
The businesses delivered 19 billion in net new money, which along with investment performance, partly offset currency-related headwinds to our two trillion franc invested asset base.
The positive long-term trends we see in our wealth management businesses remain strong. First quarter revenues, pre-tax profit, and invested assets have all increased year-over-year for 3 consecutive years.
UBS is the world’s largest and most geographically diverse wealth manager. As we’ve said in the past, you can’t realistically build or buy the world’s leading high and ultra-high net worth wealth management franchise. We’re also the only large bank with global wealth management at the center of its strategy. Our exposure to the world’s fastest growing wealth pools is evidenced by our strength in APAC, which is the result of over 50 years of commitment to the region, as well as the partnerships between Wealth Management, the Investment Bank and Global Asset Management.
SLIDE 18 – UBS—a unique and attractive investment proposition.
Before we open up for your questions, I would like to close with a few thoughts and observations.
Looking ahead, the macro-environment continues to evolve at an accelerated pace, especially as global monetary policies are likely to diverge. Negative interest rates in Switzerland and the Eurozone will continue to be an issue, at least in the short term, as well as high levels of volatility in foreign-exchange markets.
Page 14
The industry also continues to face increasing regulatory requirements. In Switzerland, the review of the too big to fail regulation is underway. We continue to support a strong and comprehensive regulatory framework while allowing Switzerland’s financial industry to remain competitive. While I have no reason to believe future changes will be unreasonable, it’s quite clear that the debate will include consequences not only for the banking industry but also for the overall economy, and as further requirements will most likely lead the industry to re-price in order to achieve appropriate shareholder returns. Therefore, the outcome of this process will not change the fundamental investment case for UBS.
We have a unique business model with an attractive investment proposition. We are the world’s leading wealth manager, operating in the world’s largest and fastest growing markets. Retail & Corporate, Global Asset Management and the Investment Bank all add to our wealth management franchise, providing a unique proposition for clients.
We are confident that we will achieve our full-year targeted return on tangible equity of around 10% for this year. We remain committed to our attractive capital returns policy, without compromising our capacity to reinvest in our businesses, and while maintaining capital strength as a key element of our success.
In closing, I’m pleased with the strong quarter. We stayed close to our clients, we stayed disciplined on risk and we delivered across all businesses and regions. The results again demonstrate the benefits of a strategy defined early and executed with a focus on long-term value creation. I can assure you that we will have the same focus going forward.
Thank you. Tom and I will now take your questions.
Page 15
Cautionary statement regarding forward-looking statements: This presentation contains statements that constitute “forward-looking statements,” including but not limited to management’s outlook for UBS’s financial performance and statements relating to the anticipated effect of transactions and strategic initiatives on UBS’s business and future development. While these forward-looking statements represent UBS’s judgments and expectations concerning the matters described, a number of risks, uncertainties and other important factors could cause actual developments and results to differ materially from UBS’s expectations. These factors include, but are not limited to: (i) the degree to which UBS is successful in executing its announced strategic plans, including its cost reduction and efficiency initiatives and its planned further reduction in its Basel III risk-weighted assets (RWA) and leverage ratio denominator (LRD), and to maintain its stated capital return objective; (ii) developments in the markets in which UBS operates or to which it is exposed, including movements in securities prices or liquidity, credit spreads, currency exchange rates and interest rates and the effect of economic conditions and market developments on the financial position or creditworthiness of UBS’s clients and counterparties, and the degree to which UBS is successful in implementing changes to its business to meet changing market, regulatory and other conditions; (iii) changes in the availability of capital and funding, including any changes in UBS’s credit spreads and ratings, or arising from requirements for bail-in debt or loss-absorbing capital; (iv) changes in or the implementation of financial legislation and regulation in Switzerland, the US, the UK and other financial centers that may impose more stringent capital (including leverage ratio), liquidity and funding requirements, incremental tax requirements, additional levies, limitations on permitted activities, constraints on remuneration or other measures; (v) uncertainty as to when and to what degree the Swiss Financial Market Supervisory Authority (FINMA) will approve reductions to the incremental RWA resulting from the supplemental operational risk capital analysis mutually agreed to by UBS and FINMA, or will approve a limited reduction of capital requirements due to measures to reduce resolvability risk; (vi) the degree to which UBS is successful in executing the transfer of business to UBS Switzerland AG, a establishing a US intermediate holding company and implementing the US enhanced prudential standards, completing the squeeze-out of minority shareholders of UBS AG, changing the operating model of UBS Limited and other changes which UBS may make in its legal entity structure and operating model, including the possible consequences of such changes, and the potential need to make other changes to the legal structure or booking model of UBS Group in response to legal and regulatory requirements, including capital requirements, resolvability requirements and proposals in Switzerland and other countries for mandatory structural reform of banks; (vii) changes in UBS’s competitive position, including whether differences in regulatory capital and other requirements among the major financial centers will adversely affect UBS’s ability to compete in certain lines of business; (viii) changes in the standards of conduct applicable to our businesses that may result from new regulation or new enforcement of existing standards, including measures to impose new or enhanced duties when interacting with customers or in the execution and handling of customer transactions; (ix) the liability to which UBS may be exposed, or possible constraints or sanctions that regulatory authorities might impose on UBS, due to litigation, contractual claims and regulatory investigations; (x) the effects on UBS’s cross-border banking business of tax or regulatory developments and of possible changes in UBS’s policies and practices relating to this business; (xi) UBS’s ability to retain and attract the employees necessary to generate revenues and to manage, support and control its businesses, which may be affected by competitive factors including differences in compensation practices; (xii) changes in accounting or tax standards or policies, and determinations or interpretations affecting the recognition of gain or loss, the valuation of goodwill, the recognition of deferred tax assets and other matters; (xiii) limitations on the effectiveness of UBS’s internal processes for risk management, risk control, measurement and modeling, and of financial models generally; (xiv) whether UBS will be successful in keeping pace with competitors in updating its technology, particularly in trading businesses; (xv) the occurrence of operational failures, such as fraud, misconduct, unauthorized trading and systems failures; (xvi) restrictions to the ability of subsidiaries of the Group to make loans or distributions of any kind, directly or indirectly, to UBS Group AG; and (xvii) the effect that these or other factors or unanticipated events may have on our reputation and the additional consequences that this may have on our business and performance. The sequence in which the factors above are presented is not indicative of their likelihood of occurrence or the potential magnitude of their consequences. Our business and financial performance could be affected by other factors identified in our past and future filings and reports, including those filed with the SEC. More detailed information about those factors is set forth in documents furnished by UBS and filings made by UBS with the SEC, including UBS’s Annual Report on Form 20-F for the year ended 31 December 2014. UBS is not under any obligation to (and expressly disclaims any obligation to) update or alter its forward-looking statements, whether as a result of new information, future events, or otherwise.
Disclaimer: This presentation and the information contained herein are provided solely for information purposes, and are not to be construed as a solicitation of an offer to buy or sell any securities or other financial instruments in Switzerland, the United States or any other jurisdiction. No investment decision relating to securities of or relating to UBS Group AG, UBS AG or their affiliates should be made on the basis of this document. Refer to UBS’s first quarter 2015 report and its Annual report on Form 20-F for the year ended 31 December 2014. No representation or warranty is made or implied concerning, and UBS assumes no responsibility for, the accuracy, completeness, reliability or comparability of the information contained herein relating to third parties, which is based solely on publicly available information. UBS undertakes no obligation to update the information contained herein.
Page 16
Adjusted results: Unless otherwise indicated, first-quarter 2015 “adjusted” figures exclude each of the following items, to the extent applicable, on a Group and business division level: an own credit gain of CHF 226 million, the abovementioned gains on sales of real estate of CHF 378 million and the gain on sale of a subsidiary of CHF 141 million, as well as net restructuring charges of CHF 305 million. For the fourth quarter of 2014, the items we excluded were an own credit gain of CHF 70 million, gains on sales of real estate of CHF 20 million, net restructuring charges of CHF 208 million and a credit of CHF 8 million related to changes to retiree benefit plans in the US. Adjusted results are non-GAAP financial measures as defined by SEC regulations. Please refer to the “Group performance” section of the First Quarter 2015 Report for more information on adjusted results.
© UBS 2015. The key symbol and UBS are among the registered and unregistered trademarks of UBS. All rights reserved.
Page 17
This Form 6-K is hereby incorporated by reference into (1) each of the registration statements of UBS AG on Form F-3 (Registration Number 333-200212) and of UBS Group AG on Form S-8 (Registration Numbers 333-200634; 333-200635; 333-200641; and 333-200665) and into each prospectus outstanding under any of the foregoing registration statements, (2) any outstanding offering circular or similar document issued or authorized by UBS AG that incorporates by reference any Form 6-K’s of UBS AG that are incorporated into its registration statements filed with the SEC, and (3) the base prospectus of Corporate Asset Backed Corporation (“CABCO”) dated June 23, 2004 (Registration Number 333-111572), the Form 8-K of CABCO filed and dated June 23, 2004 (SEC File Number 001-13444), and the Prospectus Supplements relating to the CABCO Series 2004-101 Trust dated May 10, 2004 and May 17, 2004 (Registration Number 033-91744 and 033-91744-05).
SIGNATURES
Pursuant to the requirements of the Securities Exchange Act of 1934, the registrant has duly caused this report to be signed on its behalf by the undersigned, thereunto duly authorized.
| UBS Group AG | ||
| By: | /s/ David Kelly | |
| Name: | David Kelly | |
| Title: | Managing Director | |
| By: | /s/ Sarah M. Starkweather | |
| Name: | Sarah M. Starkweather | |
| Title: | Executive Director | |
| UBS AG | ||
| By: | /s/ David Kelly | |
| Name: | David Kelly | |
| Title: | Managing Director | |
| By: | /s/ Sarah M. Starkweather | |
| Name: | Sarah M. Starkweather | |
| Title: | Executive Director | |
Date: May 5, 2015
Serious News for Serious Traders! Try StreetInsider.com Premium Free!
You May Also Be Interested In
- UBS AG (UBSG:SW) (UBS) PT Lowered to CHF28 at RBC Capital
- UBS AG (UBSG:SW) (UBS) PT Lowered to CHF30 at HSBC
- UBS AG (UBSG:SW) (UBS) PT Lowered to CHF31 at Morgan Stanley
Create E-mail Alert Related Categories
SEC FilingsRelated Entities
UBSSign up for StreetInsider Free!
Receive full access to all new and archived articles, unlimited portfolio tracking, e-mail alerts, custom newswires and RSS feeds - and more!
