

Form SC 13E3 Federal-Mogul Holdings Filed by: ICAHN CARL C
 Tweet
Tweet Share
Share
UNITED STATES
SECURITIES AND EXCHANGE COMMISSION
WASHINGTON, D.C. 20549
SCHEDULE 13E-3
(§240.13(e)-100)
Rule 13e-3 Transaction Statement under Section 13(e)
of the Securities Exchange Act of 1934
FEDERAL-MOGUL HOLDINGS CORPORATION
(Name of the Issuer)
IEH FM HOLDINGS LLC
AMERICAN ENTERTAINMENT PROPERTIES CORP.
ICAHN BUILDING LLC
ICAHN ENTERPRISES HOLDINGS L.P.
ICAHN ENTERPRISES G.P. INC.
BECKTON CORP.
CARL C. ICAHN
FEDERAL-MOGUL HOLDINGS CORPORATION
(Name of Person Filing Statement)
Common Stock, par value $0.01 per share
(Title of Class of Securities)
313549404
(CUSIP Number of Class of Securities)
| Michelle Epstein Taigman Senior Vice President, General Counsel and Secretary Federal-Mogul Holdings Corporation 27300 West 11 Mile Road Southfield, Michigan 48034 (248) 354-7063 |
Keith Cozza President and Chief Executive Officer Icahn Enterprises L.P. 767 Fifth Avenue, 47th Floor New York, New York 10153 (212) 702-4300 |
(Name, address and telephone number of person authorized to receive notices and communications on behalf of the persons filing statement)
With copies to:
| Bruce A. Toth Winston & Strawn LLP 35 West Wacker Drive Chicago, Illinois 60601 |
Jesse Lynn, Esq. General Counsel Icahn Enterprises L.P. 767 Fifth Avenue, 47th Floor New York, NY 10153 (212) 702-4300 |
Julie Allen, Esq. Proskauer Rose LLP 11 Times Square New York, NY 10036 (212) 969-3155 |
This statement is filed in connection with (check the appropriate box):
| a. |
¨ | The filing of solicitation materials or an information statement subject to Regulation 14A, Regulation 14C or Rule 13e-3(c) under the Securities Exchange Act of 1934. | ||
| b. |
¨ | The filing of a registration statement under the Securities Act of 1933. | ||
| c. |
x | A tender offer. | ||
| d. |
¨ | None of the above. | ||
Check the following box if the soliciting materials or information statement referred to in checking box (a) are preliminary copies: ¨
Check the following box if the filing is a final amendment reporting the results of the transaction: ¨
Calculation of Filing Fee
| Transaction valuation* | Amount of filing fee** | |
|
$281,667,218 |
$28,363.89 |
| * | The transaction valuation is estimated solely for purposes of calculating the filing fee. The calculation assumes the purchase of all outstanding shares of common stock, par value $0.01 per share (the “Shares”) of Federal-Mogul Holdings Corporation (the “Company”) not beneficially owned by IEH FM Holdings LLC, a Delaware limited liability company (the “Offeror”), at a purchase price of $9.25 per Share, net to the seller in cash. According to the Company’s Quarterly Report on Form 10-Q for the quarter ended June 30, 2016, filed with the SEC on July 27, 2016, 169,040,651 Shares were outstanding as of July 25, 2016, of which 138,590,141 are held by the Offeror. Accordingly, this calculation assumes the purchase of 30,450,510 Shares. |
| ** | The amount of the filing fee is calculated in accordance with Rule 0-11 of the Securities Exchange Act of 1934, as amended, and Fee Rate Advisory # 1 for Fiscal Year 2016 issued by the Securities and Exchange Commission, by multiplying the transaction valuation by 0.0001007. |
| x | Check the box if any part of the fee is offset as provided by Rule 0-11(a)(2) and identify the filing with which the offsetting fee was previously paid. Identify the previous filing by registration statement number, or the Form or Schedule and the date of its filing. |
| Amount Previously Paid: | $28,363.89 | |
| Form or Registration No.: | Schedule TO (File No. 005-83475) | |
| Filing Party: | IEH FM Holdings LLC, American Entertainment Properties Corp., Icahn Buildings LLC, Icahn Enterprises Holdings L.P., Icahn Enterprises G.P. Inc., Beckton Corp. and Carl C. Icahn | |
| Date Filed: | September 26, 2016 | |
Neither the Securities and Exchange Commission nor any state securities commission has: approved or disapproved of the transaction contemplated herein; passed upon the merits or fairness of such transaction; or passed upon the adequacy or accuracy of the disclosure in this document. Any representation to the contrary is a criminal offense.
INTRODUCTION
This Transaction Statement on Schedule 13E-3 (this “Schedule 13E-3”) filed by IEH FM Holdings LLC, a Delaware limited liability company (the “Offeror”) and an indirect wholly owned subsidiary of American Entertainment Properties Corp., a Delaware corporation (“Parent”), Parent, Icahn Building LLC, a Delaware limited liability company, Icahn Enterprises Holdings L.P., a Delaware limited partnership, Icahn Enterprises G.P. Inc., a Delaware corporation, Beckton Corp., a Delaware corporation, Carl Icahn, an individual, and Federal-Mogul Holdings Corporation, a Delaware corporation (the “Company”) relates to the offer by Offeror to purchase all outstanding shares of common stock, par value $0.01 per share (the “Shares”), of the Company that are not already owned by the Offeror at $9.25 per Share, net to the seller in cash, without interest and less any required withholding taxes, and on the other terms and subject to the other conditions specified in the Offer to Purchase, dated September 26, 2016 (the “Offer to Purchase”), and in the related Letter of Transmittal, each as originally filed with the Tender Offer Statement by Purchaser with the Securities and Exchange Commission (the “SEC”) on September 26, 2016 (the “Schedule TO”). Unless otherwise defined herein, capitalized terms used in this Schedule 13E-3 shall have the meaning given to them in the Offer to Purchase.
In response to the Offer, on the date hereof, the Company is filing a Solicitation/Recommendation Statement on Schedule 14D-9 (the “Schedule 14D-9”). The information contained in the Schedule 14D-9 and the Offer to Purchase, including all schedules, annexes and exhibits thereto, copies of which are attached as exhibits hereto, is expressly incorporated by reference to the extent such information is required in response to the items of this Schedule 13E-3, and is supplemented by the information specifically provided herein.
The responses to each item in this Schedule 13E-3 are qualified in their entirety by the information contained in the Schedule 14D-9 and the Offer to Purchase. All information contained in this Schedule 13E-3 concerning the Company, Offeror and Parent has been provided by such person and not by any other person.
The cross references below are being supplied pursuant to General Instruction G to Schedule 13E-3 and show the location in the Schedule TO and Schedule 14D-9 of the information required to be included in response to the items of Schedule 13E-3. The information contained in the Schedule TO and Schedule 14D-9, including all annexes thereto, is incorporated by reference herein, and the responses to each Item in this Schedule 13E-3 are qualified in their entirety by the information contained in the Schedule TO and Schedule 14D-9 and the annexes thereto.
| Item 1. | Summary Term Sheet |
Item 1001 of Regulation M-A
The information set forth in the Offer to Purchase under “Summary Term Sheet” is incorporated herein by reference.
| Item 2. | Subject Company Information |
Item 1002 of Regulation M-A
(a) Name and Address. The information set forth in the Schedule 14D-9 under “Item 1. Subject Company Information—Name and Address” and the information set forth in the Offer to Purchase under the “The Offer—Section 8—Certain Information Concerning the Company” is incorporated herein by reference.
(b) Securities. The information set forth in the Schedule 14D-9 under “Item 1. Subject Company Information—Securities” and the information set forth in the Offer to Purchase under “Introduction” is incorporated herein by reference.
(c) Trading Marking and Price. The information set forth in the Offer to Purchase under “Summary Term Sheet” and “The Offer—Section 6—Price Range of Shares; Dividends” is incorporated herein by reference.
(d) Dividends. The information set forth in the Offer to Purchase under “Summary Term Sheet”, “Special Factors— Section 7—Summary of the Merger Agreement”, “The Offer—Section 6—Price Range of Shares; Dividends” and “The Offer—Section 11—Dividends and Distributions” is incorporated herein by reference.
(e) Prior Public Offerings. Not applicable.
(f) Prior Stock Purchases. The information set forth in the Offer to Purchase under “Special Factors—Section 9—Transactions and Arrangements Concerning the Shares” and “The Offer—Section 9—Certain Information Concerning the Offeror and Parent” is incorporated herein by reference.
| Item 3. | Identity and Background of the Filing Person |
Item 1003(a)-(c) of Regulation M-A
(a) Name and Address. The information set forth in the Schedule 14D-9 under “Item 1. Subject Company Information” and the information set forth in the Offer to Purchase under “Summary Term Sheet”, “The Offer—Section 8—Certain Information Concerning the Company”, The Offer—Section 9—Certain Information Concerning the Offeror and Parent” and “Schedule A—Executive Officer(s) and Director(s) of IEH FM Holdings LLC, American Entertainment Properties Corp., Icahn Building LLC, Icahn Enterprises Holdings L.P., Icahn Enterprises L.P., Icahn Enterprises G.P. Inc. and Beckton Corp.” is incorporated herein by reference.
(b) Business and Background of Entities. The information set forth in the Schedule 14D-9 under “Item 1. Subject Company Information” and “The Offer—Section 8—Certain Information Concerning the Company” and the information set forth in the Offer to Purchase under “The Offer—Section 9—Certain Information Concerning the Offeror and Parent” is incorporated herein by reference.
(c) Business and Background of Natural Persons. The information set forth in the Offer to Purchase under “The Offer—Section 9—Certain Information Concerning the Offeror and Parent” and “Schedule A—Executive Officer(s) and Director(s) of IEH FM Holdings LLC, American Entertainment Properties Corp., Icahn Building LLC, Icahn Enterprises Holdings L.P., Icahn Enterprises L.P., Icahn Enterprises G.P. Inc. and Beckton Corp.” is incorporated herein by reference.
| Item 4. | Terms of the Transaction |
Item 1004(a), (c)-(f) of Regulation M-A
(a) Material Terms; Tender Offers
(a)(1)(i) The information set forth in the Offer to Purchase under “Summary Term Sheet”, “Introduction” and “Special Factors—Section 7—Summary of the Merger Agreement” is incorporated herein by reference.
(a)(1)(ii) The information set forth in the Offer to Purchase under “Summary Term Sheet”, “Introduction” and “The Offer—Section 10—Source and Amounts of Funds” is incorporated herein by reference.
(a)(1)(iii) The information set forth in the Offer to Purchase under “Summary Term Sheet”, “Introduction” and “The Offer—Section 1—Terms of the Offer” is incorporated herein by reference.
(a)(1)(iv) The information set forth in the Offer to Purchase under “Summary Term Sheet” is incorporated herein by reference.
(a)(1)(v) The information set forth in the Offer to Purchase under “Summary Term Sheet”, “The Offer—Section 1—Terms of the Offer” and “Special Factors—Section 7—Summary of the Merger Agreement” is incorporated herein by reference.
(a)(1)(vi) The information set forth in the Offer to Purchase under “Summary Term Sheet”, “Introduction” and “The Offer—Section 4—Withdrawal Rights” is incorporated herein by reference.
(a)(1)(vii) The information set forth in the Offer to Purchase under “Summary Term Sheet”, “Introduction”, “The Offer—Section 3—Procedure for Tendering Shares” and “The Offer—Section 4—Withdrawal Rights” are incorporated herein by reference.
(a)(1)(viii) The information set forth in the Offer to Purchase under “Summary Term Sheet”, “Introduction”, “The Offer—Section 1—Terms of the Offer”, “The Offer—Section 2—Acceptance for Payment and Payment for Shares” and “The Offer—Section 12—Conditions of the Offer” is incorporated herein by reference.
(a)(1)(ix) Not applicable.
(a)(1)(x) The information set forth in the Offer to Purchase under “Summary Term Sheet”, “Special Factors—Section 2—Purpose of and Reasons for the Offer; Plans for the Company”, “Special Factors—Section 5—Effects of the Offer and the Merger”, “Special Factors—Section 11—Interests of Certain Persons in the Offer” and “The Offer—Section 7—Possible Effects of the Offer and the Merger on the Market for the Shares; NASDAQ Listing; Registration under the Exchange Act; Margin Regulations” is incorporated herein by reference.
(a)(1)(xi) Not applicable.
(a)(1)(xii) The information set forth in the Offer to Purchase under “Summary Term Sheet” and “The Offer—Section 5—Certain U.S. Federal Income Tax Considerations” is incorporated herein by reference.
(a)(2)(i) The information set forth in the Offer to Purchase under “Summary Term Sheet”, “Introduction” and “Special Factors—Section 7—Summary of the Merger Agreement” is incorporated herein by reference.
(a)(2)(ii) The information set forth in the Offer to Purchase under “Summary Term Sheet”, “Introduction”, “Special Factors—Section 7—Summary of the Merger Agreement” and “The Offer—Section 2—Acceptance for Payment and Payment of Shares” is incorporated herein by reference.
(a)(2)(iii) The information set forth in the Offer to Purchase under “Special Factors—Section 2—Purpose of and Reasons for the Offer; Plans for the Company” and in the Schedule 14D-9 under “Item 4—The Solicitation or Recommendation—Reasons for the Special Committee’s Recommendation” and “Item 4—The Solicitation or Recommendation—Reasons for the Board’s Recommendation” is incorporated herein by reference.
(a)(2)(iv) The information set forth in the Offer to Purchase under “Summary Term Sheet”, “Introduction”, “Special Factors—Section 1—Background”, “Special Factors—Section 3—The Recommendation by the Special Committee and the Company Board of Directors”, “Special Factors—Section 5—Effects of the Offer and the Merger” and “Special Factors—Section 7—Summary of the Merger Agreement” is incorporated herein by reference.
(a)(2)(v) The information set forth in the Offer to Purchase under “Summary Term Sheet”, “Special Factors—Section 2—Purpose of and Reasons for the Offer; Plans for the Company”, “Special Factors—Section 5—Effects of the Offer and the Merger”, “Special Factors—Section 8—Dissenters’ Appraisal Rights; Rule 13e-3”, “Special Factors—Section 11—Interests of Certain Persons in the Offer” and “The Offer—Section 7—Possible Effects of the Offer and the Merger on the Market for the Shares; NASDAQ Listing; Registration under the Exchange Act; Margin Regulations” is incorporated herein by reference.
(a)(2)(vi) Not applicable.
(a)(2)(vii) The information set forth in the Offer to Purchase under “Summary Term Sheet” and “The Offer—Section 5—Certain U.S. Federal Income Tax Considerations” is incorporated herein by reference.
(c) Different Terms. The information set forth in the Offer to Purchase under “Summary Term Sheet”, “Special Factors—Section 2—Purpose of and Reasons for the Offer; Plans for the Company”, “Special Factors—Section 4—Our Position Regarding Fairness of the Transaction”, “Special Factors— Section 5—Effects of the Offer and the Merger”, “Special Factors—Section 8—Dissenters’ Appraisal Rights; Rule 13e-3”, “The Offer—Section 13—Certain Legal Matters; Regulatory Approvals” and “Schedule C—General Corporation Law of Delaware Section 262 Appraisal Rights” and the Schedule 14D-9 under “Item 3. Past Contacts, Transactions, Negotiations and Agreements—Arrangements with Current Executive Officers and Directors of the Company” is incorporated herein by reference.
(d) Appraisal Rights. The information set forth in the Schedule 14D-9 under the captions “Item 8 – Additional Information – Notice of Appraisal Rights” and “Annex B – Delaware Appraisal Statute (DGCL Section 262) and the information set forth in the Offer to Purchase under “Summary Term Sheet”, “Special Factors—Section 8—Dissenters’ Appraisal Rights; Rule 13e-3”, “The Offer—Section 13—Certain Legal Matters; Regulatory Approvals” and “Schedule C—General Corporation Law of Delaware Section 262 Appraisal Rights” is incorporated herein by reference.
(e) Provisions for Unaffiliated Security Holders. The information set forth in the Offer to Purchase under “Special Factors—Section 8—Dissenters’ Appraisal Rights; Rule 13e-3” and “The Offer—Section 9—Certain Information Concerning the Offeror and Parent” is incorporated herein by reference.
(f) Eligibility for Listing or Trading. Not applicable.
| Item 5. | Past Contacts, Transactions, Negotiations and Agreements |
Item 1005(a)-(c) and (e) of Regulation M-A
(a) Transactions. The information set forth in the Schedule 14D-9 under “Item 3. Past Contacts, Transactions, Negotiations and Agreements” and the information set forth in the Offer to Purchase under “Special Factors—Section 1—Background”, “Special Factors—Section 9—Transactions and Arrangements Concerning the Shares”, “Special Factors—Section 10—Related Party Transactions” and “Special Factors—Section 11—Interests of Certain Persons in the Offer” is incorporated herein by reference.
(b) Significant Corporate Events. The information set forth in the Schedule 14D-9 under “Item 3. Past Contacts, Transactions, Negotiations and Agreements” and the information set forth in the Offer to Purchase under “Special Factors—Section 1—Background”, “Special Factors—Section 7—Summary of the Merger Agreement”, “Special Factors—Section 9—Transactions and Arrangements Concerning the Shares” and “Special Factors—Section 10—Related Party Transactions” is incorporated herein by reference.
(c) Negotiations or Contracts. The information set forth in the Schedule 14D-9 under “Item 3. Past Contacts, Transactions, Negotiations and Agreements” and the information set forth in the Offer to Purchase under “Special Factors—Section 1—Background” and “Special Factors—Section 10—Related Party Transactions” is incorporated herein by reference.
(e) Agreements Involving the Subject Company’s Securities. The information set forth in the Schedule 14D-9 under “Item 3. Past Contacts, Transactions, Negotiations and Agreements” and the information set forth in the Offer to Purchase under “Special Factors—Section 1—Background” and “Special Factors—Section 10—Related Party Transactions” is incorporated herein by reference.
| Item 6. | Purposes of the Transaction and Plans or Proposals |
Item 1006(b) and (c)(1)-(8)
(b) Use of Securities Acquired. The information set forth in the Schedule 14D-9 under “Item 2. Identity and Background of Filing Person – Offer” and the information set forth in the Offer to Purchase under “Summary Term Sheet”, “Introduction”, “Special Factors—Section 2—Purpose of and Reasons for the Offer; Plans for the Company”, “Special Factors—Section 5—Effects of the Offer and the Merger” and “The Offer—Section 7—Possible Effects of the Offer and the Merger on the Market for the Shares; NASDAQ Listing; Registration under the Exchange Act; Margin Regulations” is incorporated herein by reference.
(c) Plans.
(c)(1) The information set forth in the Offer to Purchase under “Summary Term Sheet”, “Introduction”, “Special Factors—Section 1—Background”, “Special Factors—Section 2—Purpose of and Reasons for the Offer; Plans for the Company” and “Special Factors—Section 7—Summary of the Merger Agreement” is incorporated herein by reference.
(c)(2) The information set forth in the Offer to Purchase under “Summary Term Sheet”, “Introduction” and “Special Factors—Section 2—Purpose of and Reasons for the Offer; Plans for the Company” is incorporated herein by reference.
(c)(3) The information set forth in the Offer to Purchase under “Summary Term Sheet”, “Special Factors—Section 2—Purpose of and Reasons for the Offer; Plans for the Company”, “Special Factors—Section 4—Our Position Regarding Fairness of the Transaction”, “Special Factors—Section 7—Summary of the Merger Agreement”, “The Offer—Section 6—Price Range of Shares; Dividends” and “The Offer—Section 11—Dividends and Distributions” is incorporated herein by reference.
(c)(4) The information set forth in the Offer to Purchase under “Special Factors—Section 2—Purpose of and Reasons for the Offer; Plans for the Company” and “Special Factors—Section 7—Summary of the Merger Agreement” is incorporated herein by reference.
(c)(5) The information set forth in the Offer to Purchase under “Summary Term Sheet”, “Introduction”, “Special Factors—Section 2—Purpose of and Reasons for the Offer; Plans for the Company”, “Special Factors—Section 5—Effects of the Offer and the Merger” and “The Offer—Section 7—Possible Effects of the Offer and the Merger on the Market for the Shares; NASDAQ Listing; Registration under the Exchange Act; Margin Regulations” is incorporated herein by reference.
(c)(6) The information set forth in the Offer to Purchase under “Summary Term Sheet”, “Introduction”, “Special Factors—Section 2—Purpose of and Reasons for the Offer; Plans for the Company”, “Special Factors—Section 5—Effects of the Offer and the Merger” and “The Offer—Section 7—Possible Effects of the Offer and the Merger on the Market for the Shares; NASDAQ Listing; Registration under the Exchange Act; Margin Regulations” is incorporated herein by reference.
(c)(7) The information set forth in the Offer to Purchase under “Summary Term Sheet”, “Introduction”, “Special Factors—Section 2—Purpose of and Reasons for the Offer; Plans for the Company”, “Special Factors—Section 5—Effects of the Offer and the Merger” and “The Offer—Section 7—Possible Effects of the Offer and the Merger on the Market for the Shares; NASDAQ Listing; Registration under the Exchange Act; Margin Regulations” is incorporated herein by reference.
(c)(8) The information set forth in the Offer to Purchase under “Summary Term Sheet”, “Introduction”, “Special Factors—Section 2—Purpose of and Reasons for the Offer; Plans for the Company”, “Special Factors—Section 5—Effects of the Offer and the Merger” and “The Offer—Section 7—Possible Effects of the Offer and the Merger on the Market for the Shares; NASDAQ Listing; Registration under the Exchange Act; Margin Regulations” is incorporated herein by reference.
| Item 7. | Purposes, Alternatives, Reasons and Effects |
Item 1013 of Regulation M-A
(a) Purposes. The information set forth in the Schedule 14D-9 under “Item 4. The Solicitation or Recommendation—Reasons for the Special Committee’s Recommendation” and the information set forth in the Offer to Purchase under “Summary Term Sheet”, “Introduction”, “Special Factors—Section 1—Background” and “Special Factors—Section 2—Purpose of and Reasons for the Offer; Plans for the Company” is incorporated herein by reference.
(b) Alternatives. The information set forth in the Schedule 14D-9 under “Item 4. The Solicitation or Recommendation—Reasons for the Special Committee’s Recommendation” and the information set forth in the Offer to Purchase under “Special Factors—Section 1—Background” and “Special Factors—Section 2—Purpose of and Reasons for the Offer; Plans for the Company” is incorporated herein by reference.
(c) Reasons. The information set forth in the Schedule 14D-9 under “Item 4. The Solicitation or Recommendation—Reasons for the Special Committee’s Recommendation” and the information set forth in the Offer to Purchase under “Special Factors—Section 1—Background”, “Special Factors—Section 2—Purpose of and Reasons for the Offer; Plans for the Company” and “Special Factors—Section 5—Effects of the Offer and the Merger” is incorporated herein by reference.
(d) Effects. The information set forth in the Schedule 14D-9 under “Item 4. The Solicitation or Recommendation—Reasons for the Special Committee’s Recommendation” and the information set forth in the Offer to Purchase under “Summary Term Sheet”, “Introduction”, “Special Factors—Section 2—Purpose of and Reasons for the Offer; Plans for the Company”, “Special Factors—Section 4—Our Position Regarding Fairness of the Transaction”, “Special Factors—Section 5—Effects of the Offer and the Merger”, “Special Factors—Section 7—Summary of the Merger Agreement”, “Special Factors—Section 8—Dissenters’ Appraisal Rights; Rule 13e-3”, “The Offer—Section 5—Certain U.S. Federal Income Tax Considerations”, “The Offer—Section 7—Possible Effects of the Offer and the Merger on the Market for the Shares; NASDAQ Listing; Registration under the Exchange Act; Margin Regulations” “The Offer—Section 13—Certain Legal Matters; Regulatory Approvals” and “Schedule C—General Corporation Law of Delaware Section 262 Appraisal Rights” is incorporated herein by reference.
| Item 8. | Fairness of the Going-Private Transaction |
Item 1014 of Regulation M-A
(a) Fairness. The information set forth in the Schedule 14D-9 under “Item 4. The Solicitation or Recommendation” and the information set forth in the Offer to Purchase under “Summary Term Sheet”, “Special Factors—Section 3—The Recommendation by the Special Committee and the Company Board of Directors” and “Special Factors—Section 4—Our Position Regarding Fairness of the Transaction” is incorporated herein by reference.
(b) Factors Considered in Determining Fairness. The information set forth in the Schedule 14D-9 under “Item 4. The Solicitation or Recommendation” and the information set forth in the Offer to Purchase under “Summary Term Sheet”, “Special Factors—Section 3—The Recommendation by the Special Committee and the Company Board of Directors” and “Special Factors—Section 4—Our Position Regarding Fairness of the Transaction” is incorporated herein by reference.
(c) Approval of Security Holders. The information set forth in the Schedule 14D-9 under “Item 4. The Solicitation or Recommendation” and the information set forth in the Offer to Purchase under “Summary Term Sheet”, “Introduction”, “Special Factors—Section 1—Background”, “Special Factors—Section 2—Purpose of and Reasons for the Offer; Plans for the Company”, “Special Factors—Section 3—The Recommendation by the Special Committee and the Company Board of Directors”, “Special Factors—Section 4—Our Position Regarding Fairness of the Transaction”, “The Offer—Section 1—Terms of the Offer” and “The Offer—Section 12—Conditions of the Offer” is incorporated herein by reference.
(d) Unaffiliated Representative. The information set forth in the Schedule 14D-9 under “Item 4. The Solicitation or Recommendation” and the information set forth in the Offer to Purchase under “Special Factors—Section 1—Background”, “Special Factors—Section 3—The Recommendation by the Special Committee and the Company Board of Directors” and “Special Factors—Section 4—Our Position Regarding Fairness of the Transaction” is incorporated herein by reference.
(e) Approval of Directors. The information set forth in the Schedule 14D-9 under “Item 4. The Solicitation or Recommendation” and the information set forth in the Offer to Purchase under “Summary Term Sheet”, “Introduction”, “Special Factors—Section 1—Background”, “Special Factors—Section 3—The Recommendation by the Special Committee and the Company Board of Directors” and “Special Factors—Section 4— Our Position Regarding Fairness of the Transaction” is incorporated herein by reference.
(f) Other Offers. Not applicable.
| Item 9. | Reports, Opinions, Appraisals and Negotiations |
Item 1015 of Regulation M-A
(a) Report, Opinion or Appraisal. The information set forth in the Schedule 14D-9 under “Item 4. The Solicitation or Recommendation” and the information set forth in the Offer to Purchase under “Special Factors—Section 1—Background” and “Special Factors—Section 4—Our Position Regarding Fairness of the Transaction” is incorporated herein by reference.
(b) Preparer and Summary of the Report, Opinion or Appraisal. The information set forth in the Schedule 14D-9 under “Item 4. The Solicitation or Recommendation” and the information set forth in the Offer to Purchase under “Special Factors—Section 1—Background” and “Special Factors—Section 4—Our Position Regarding Fairness of the Transaction” is incorporated herein by reference.
(c) Availability of Documents. The reports, opinions or appraisals referenced in this Item 9 will be made available for inspection and copying at the principal executive offices of the Company during its regular business hours by any interested holder of Shares or any representative thereof who has been so designated in writing.
| Item 10. | Source and Amounts of Funds or Other Consideration |
Item 1007 of Regulation M-A
(a) Source of Funds. The information set forth in the Offer to Purchase under “Summary Term Sheet” and “The Offer—Section 10—Source and Amount of Funds” is incorporated herein by reference.
(b) Conditions. Not applicable.
(c) Expenses. The information set forth in the Offer to Purchase under “The Offer—Section 14—Fees and Expenses” is incorporated herein by reference.
(d) Borrowed Funds. Not applicable.
| Item 11. | Interest in Securities of the Subject Company |
Item 1008 of Regulation M-A
(a) Securities Ownership. The information set forth in the Offer to Purchase under “Introduction”, “Special Factors—Section 9—Transactions and Arrangements Concerning the Shares” and “Schedule B—Security Ownership of Certain Beneficial Owners” is incorporated herein by reference.
(b) Securities Transactions. The information set forth in the Schedule 14D-9 under “Item 6. Interest in Securities of the Subject Company” and the information set forth in the Offer to Purchase under “Introduction”, “Special Factors—Section 9—Transactions and Arrangements Concerning the Shares”, “Special Factors—Section 10—Related Party Transactions” and “Schedule B—Security Ownership of Certain Beneficial Owners” is incorporated herein by reference.
| Item 12. | The Solicitation or Recommendation |
Item 1012(d) and (e) of Regulation M-A
(d) Intent to Tender or Vote in a Going-Private Transaction. The information set forth in the Schedule 14D-9 under “Item 4. The Solicitation or Recommendation—Intent to Tender” and the information set forth in the Offer to Purchase under “Introduction”, “Special Factors—Section 9—Transactions and Arrangements Concerning the Shares” and “The Offer—Section 9—Certain Information Concerning the Offeror and Parent” is incorporated herein by reference.
(e) Recommendation of Others. The information set forth in the Schedule 14D-9 under “Item 4. The Solicitation or Recommendation—Solicitation or Recommendation” and the information set forth in the Offer to Purchase under “Special Factors—Section 3—The Recommendation by the Special Committee and the Company Board of Directors” and “The Offer—Section 9—Certain Information Concerning the Offeror and Parent” is incorporated herein by reference.
| Item 13. | Financial Statements Consideration |
Item 1010(a) and (b) of Regulation M-A
(a) Financial Information. The information set forth in the Offer to Purchase under “The Offer—Section 8—Certain Information Concerning the Company” is incorporated herein by reference. The financial statements of the Company are also incorporated herein by reference to its Form 10-K and Form 10-K/A for the year ended December 31, 2015, including to the section in the Form 10-K titled “Part II—Item 8—Financial Statements and Supplementary Data”. The unaudited consolidated financial statements of the Company on its Form 10-Q for the quarter ended June 30, 2016 are incorporated herein by reference to the section titled “Item 1. Financial Information”.
(b) Pro Forma Information. Not applicable.
| Item 14. | Persons/Assets Retained, Employed, Compensated or Used |
Item 1009 of Regulation M-A
(a) Solicitations or Recommendations. The information set forth in the Schedule 14D-9 under “Item 5. Persons/Assets Retained, Employed, Compensated or Used” and in the Offer to Purchase under “The Offer—Section 14—Fees and Expenses” is incorporated herein by reference.
(b) Employees and Corporate Assets. No officer, class of employee or corporate assets of the Company has been or will be employed or used by Parent or the Offeror in connection with the Offer and the Merger.
| Item 15. | Additional Information |
Item 1011(b) and (c) of Regulation M-A
(b) The information set forth in the schedule 14D-9 under “Item 3—Arrangements with Current Executive Officers and Directors of the Company—Golden Parachute Compensation” is incorporated herein by reference.
(c) Other Material Information. The information set forth in the Schedule 14D-9 under “Item 8—Additional Information” is incorporated herein by reference.
| Item 16. | Exhibits |
The following Exhibits are filed herewith or incorporated herein by reference:
| Exhibit No. |
Description | |
| (a)(1)(i) | Offer to Purchase, dated September 26, 2016 (incorporated by reference to Exhibit (a)(1)(i) to the Schedule TO of American Entertainment Properties Corp. and IEH FM Holdings, LLC, filed with the SEC on September 26, 2016). | |
| (a)(1)(ii) | Form of Letter of Transmittal (incorporated by reference to Exhibit (a)(1)(ii) to the Schedule TO of American Entertainment Properties Corp. and IEH FM Holdings, LLC, filed with the SEC on September 26, 2016). | |
| (a)(1)(iii) | Form of Notice of Guaranteed Delivery (incorporated by reference to Exhibit (a)(1)(iii) to the Schedule TO of American Entertainment Properties Corp. and IEH FM Holdings, LLC, filed with the SEC on September 26, 2016). | |
| (a)(1)(iv) | Form of Letter to Brokers, Dealers, Commercial Banks, Trust Companies and Other Nominees (incorporated by reference to Exhibit (a)(1)(iv) to the Schedule TO of American Entertainment Properties Corp. and IEH FM Holdings, LLC, filed with the SEC on September 26, 2016). | |
| (a)(1)(v) | Form of Letter to Clients for Use by Brokers, Dealers, Commercial Banks, Trust Companies and Other Nominees (incorporated by reference to Exhibit (a)(1)(v) to the Schedule TO of American Entertainment Properties Corp. and IEH FM Holdings, LLC, filed with the SEC on September 26, 2016). | |
| (a)(1)(vi) | Form of summary advertisement, published September 26, 2016 in The New York Times (incorporated by reference to Exhibit (a)(1)(vi) to the Schedule TO of American Entertainment Properties Corp. and IEH FM Holdings, LLC, filed with the SEC on September 26, 2016). | |
| (a)(5)(i) | Letter dated February 28, 2016 to the Board of Directors of Federal-Mogul Holdings Corporation (incorporated by reference to Exhibit 1 to the Schedule 13D amendment filed by Icahn Enterprises L.P. with the SEC Commission on February 29, 2016). | |
| (a)(5)(ii) | Letter dated June 17, 2016 to the Board of Directors of Federal-Mogul Holdings Corporation (incorporated by reference to Schedule 13D amendment filed by Icahn Enterprises L.P with the SEC on June 20, 2016). | |
| (a)(5)(iii) | Joint Press Release issued by Federal-Mogul Holdings Corporation and Icahn Enterprises L.P. on September 6, 2016 (incorporated by reference to the Schedule 14D9-C filed by Federal-Mogul Holdings Corporation with the SEC on September 6, 2016). | |
| (b) | None. | |
| (c)(1) | Opinion of Houlihan Lokey Capital, Inc., dated September 6, 2016 (incorporated by reference to Annex A to the Schedule 14D-9 filed by Federal-Mogul Holdings Corporation with the SEC on September 26, 2016). | |
| (c)(2) | Discussion materials for discussion with Icahn Enterprises, L.P., dated May 17, 2016.* | |
| (c)(3) | Preliminary discussion materials of Houlihan Lokey Capital, Inc. for the Special Committee of the Board of Directors of Federal-Mogul Holdings Corporation, dated June 14, 2016.* | |
| (c)(4) | Preliminary discussion materials of Houlihan Lokey Capital, Inc. for the Special Committee of the Board of Directors of Federal-Mogul Holdings Corporation, dated August 15, 2016.* | |
| (c)(5) | Preliminary discussion materials of Houlihan Lokey Capital, Inc. for the Special Committee of the Board of Directors of Federal-Mogul Holdings Corporation, dated September 5, 2016.* | |
| (c)(6) | Presentation of Houlihan Lokey Capital, Inc. to the Special Committee of the Board of Directors of Federal-Mogul Holdings Corporation, dated September 6, 2016.* | |
| (d)(1) | Agreement and Plan of Merger, dated as of September 6, 2016, by and among Federal-Mogul Holdings Corporation, American Entertainment Properties Corp. and IEH FM Holdings LLC (incorporated by reference to Exhibit 2.1 to the Current Report on Form 8-K filed by Federal-Mogul Holdings Corporation with the SEC on September 7, 2016). | |
| (d)(2) | Amendment and Joinder to Federal-Mogul Corporation Registration Rights Agreement among Federal-Mogul Corporation and IEH FM Holdings LLC (incorporated by reference to Exhibit 4.1 to the Current Report on Form 8-K filed by Federal-Mogul Holdings Corporation with the SEC on July 11, 2013). | |
| (d)(3) | Tax Allocation Agreement by and among American Entertainment Properties Corp. and Federal Mogul Corporation dated as of July 11, 2013 (incorporated by reference to Exhibit 10. to the Current Report on Form 8-K filed by Federal-Mogul Holdings Corporation with the SEC on July 11, 2013). | |
| (f) | The information set forth in the Schedule 14D-9 under “Item 8. Additional Information—Appraisal Rights” and “Annex B—Section 262 of the Delaware General Corporation Law” is incorporated herein by reference. | |
| (g) | None. | |
| * | Filed herewith |
SIGNATURE
After due inquiry and to the best of my knowledge and belief, I certify that the information set forth in this Statement is true, complete and correct.
Date: September 26, 2016
| FEDERAL-MOGUL HOLDINGS CORPORATION | ||
| By: | /s/ Michelle Epstein Taigman | |
| Name: | Michelle Epstein Taigman | |
| Title: | Senior Vice President, General Counsel and Secretary | |
| IEH FM HOLDINGS LLC | ||
| By: | Icahn Enterprises Holdings L.P., its sole member | |
| By: | Icahn Enterprises G.P. Inc., its general partner | |
| By: | /s/ SungHwan Cho | |
| Name: | SungHwan Cho | |
| Title: | Chief Financial Officer | |
| AMERICAN ENTERTAINMENT PROPERTIES CORP. | ||
| By: | /s/ SungHwan Cho | |
| Name: | SungHwan Cho | |
| Title: | Chief Financial Officer | |
| ICAHN BUILDING LLC | ||
| By: | Icahn Enterprises Holdings L.P., its sole member | |
| By: | Icahn Enterprises G.P. Inc., its general partner | |
| By: | /s/ SungHwan Cho | |
| Name: | SungHwan Cho | |
| Title: | Chief Financial Officer | |
| ICAHN ENTERPRISES HOLDINGS L.P. | ||
| By: | Icahn Enterprises G.P. Inc., its general partner | |
| By: | /s/ SungHwan Cho | |
| Name: | SungHwan Cho | |
| Title: | Chief Financial Officer | |
| ICAHN ENTERPRISES G.P. INC. | ||
| By: | /s/ SungHwan Cho | |
| Name: | SungHwan Cho | |
| Title: | Chief Financial Officer | |
| BECKTON CORP. | ||
| By: | /s/ Edward E. Mattner | |
| Name: | Edward E. Mattner | |
| Title: | Authorized Signatory | |
| CARL C. ICAHN | ||
| /s/ Carl C. Icahn | ||
| Exhibit C2
|
Project Piston
MATERIALS PREPARED FOR DISCUSSION WITH IC AHN ENTERPRISES, L . P.
MAY 17, 2016 | CONFIDENTIAL – PRELIMINARY – SUBJECT TO FURTHER REVIEW AND REVISION
1
|
|
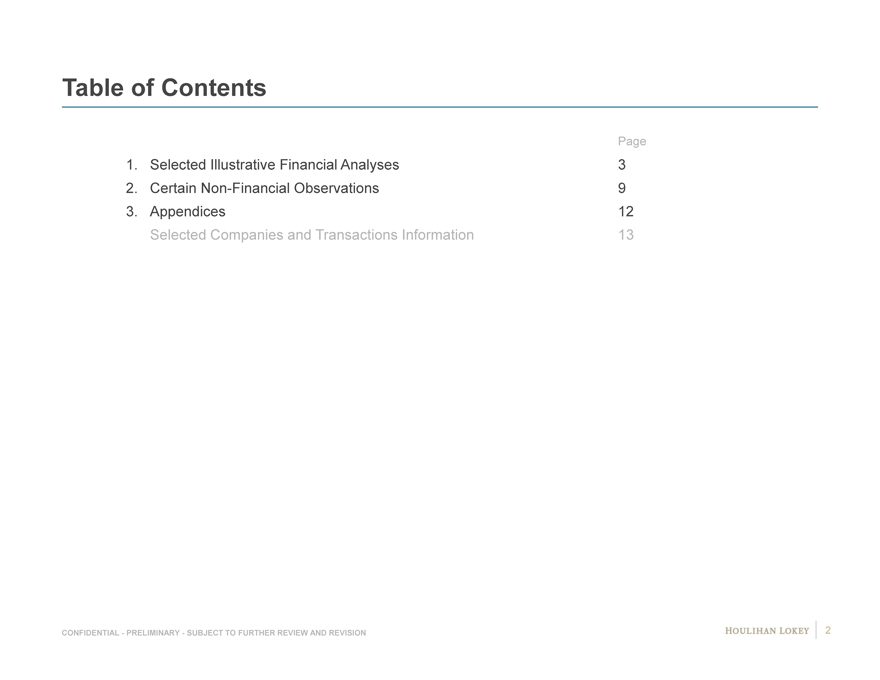
Table of Contents
Page
1. Selected Illustrative Financial Analyses 3
2. Certain Non-Financial Observations 9
3. Appendices 12
Selected Companies and Transactions Information 13
CONFIDENTIAL—PRELIMINARY—SUBJECT TO FURTHER REVIEW AND REVISION 2
2
|
|
Page
1. Selected Illustrative Financial Analyses 3
2. Certain Non-Financial Observations 9
3. Appendices 12
3
|
|

Piston Consolidated Summary Historical and Projected
Financial Data
The preliminary perspectives reflected are based on financial information provided by Company management.
(dollars in millions) LTM
3/31/2016 2016E 2017E 2018E 2019E 2020E
Revenue $7,481 $7,502 $7,914 $8,297 $8,593 $8,973
%Growth — 1.1% 5.5% 4.8% 3.6% 4.4%
Gross Profit $1,111 $1,186 $1,318 $1,431 $1,462 $1,539
%Margin 14.9% 15.8% 16.7% 17.2% 17.0% 17.2%
Less: Selling, General and Administrative Expenses 789 827 866 886 901 913
Less: Other Expenses / (Income)(28) 10 5 5 5 2
EBIT $350 $349 $446 $539 $556 $624
%Margin 4.7% 4.7% 5.6% 6.5% 6.5% 7.0%
Add: Depreciation, Amortization and Other Expenses 345 386 396 413 432 428
EBITDA¹ $695 $735 $842 $952 $988 $1,052
%Margin 9.3% 9.8% 10.6% 11.5% 11.5% 11.7%
Less: Adjustment for Pension Expense Included in D&A and Other Expenses² 2 13 12 9 6 3
Less: EBITDA of Interests in Consolidated JVs Not Attributable to Company² 20 23 26 29 32 34
Adjusted EBITDA² $673 $699 $804 $914 $950 $1,015
%Margin 9.0% 9.3% 10.2% 11.0% 11.1% 11.3%
Add: Pension (and OPEB) Expense 61 68 71 71 65 61
Adjusted EBITDAP $734 $767 $875 $985 $1,015 $1,076
Capital Expenditures $426 $434 $419 $409 $430 $430
Segment Information
Pow ertrain Adjusted EBITDA $416 $442 $497 $563 $614 $643
Pow ertrain Adjusted EBITDAP $468 $502 $560 $625 $671 $696
Motorparts Adjusted EBITDA $257 $257 $307 $351 $336 $372
Motorparts Adjusted EBITDAP $266 $265 $316 $360 $344 $380
Source: Company management
1. Per Company management, EBITDA reflects addbacks for projected restructuring expenses.
2. Reflects adjustments per direction of Company management, as discussed with the Special Committee.
Note: Illustrative discounted cash flow analyses also reflect additional cash flow items not shown above, including changes in net working capital,
restructuring expenses/payments, cash flows related to non-consolidated JVs, and pension (and OPEB) contributions.
Note: Certain figures may differ slightly due to rounding.
CONFIDENTIAL—PRELIMINARY—SUBJECT TO FURTHER REVIEW AND REVISION 4
4
|
|
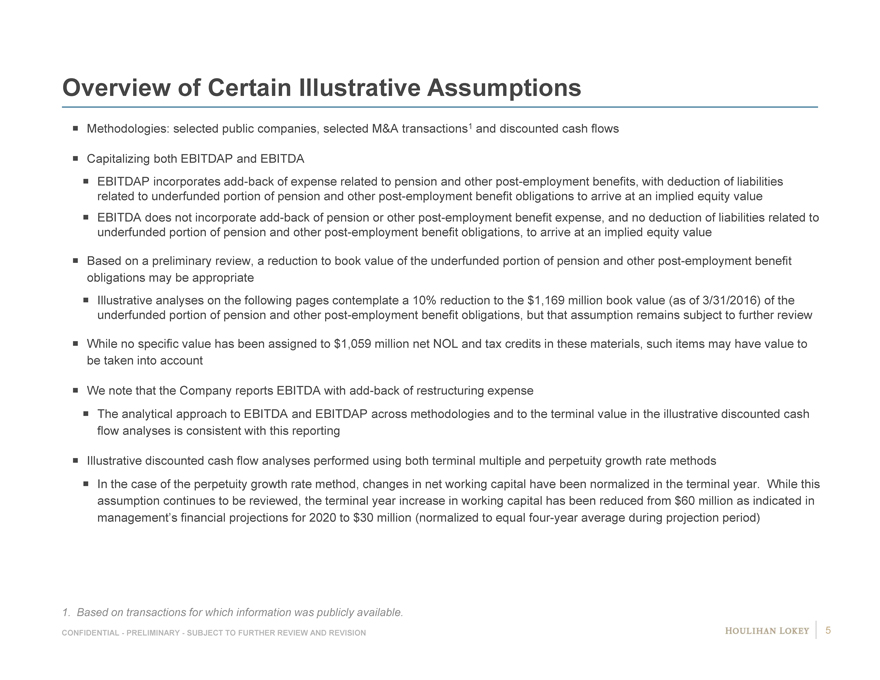
Overview of Certain Illustrative Assumptions
Methodologies: selected public companies, selected M&A transactions1 and discounted cash flows
Capitalizing both EBITDAP and EBITDA
EBITDAP incorporates add-back of expense related to pension and other post-employment benefits, with deduction of liabilities related to underfunded portion of pension and other post-employment benefit obligations to arrive at an implied equity value EBITDA does not incorporate add-back of pension or other post-employment benefit expense, and no deduction of liabilities related to underfunded portion of pension and other post-employment benefit obligations, to arrive at an implied equity value
Based on a preliminary review, a reduction to book value of the underfunded portion of pension and other post-employment benefit obligations may be appropriate Illustrative analyses on the following pages contemplate a 10% reduction to the $1,169 million book value (as of 3/31/2016) of the underfunded portion of pension and other post-employment benefit obligations, but that assumption remains subject to further review
While no specific value has been assigned to $1,059 million net NOL and tax credits in these materials, such items may have value to be taken into account
We note that the Company reports EBITDA with add-back of restructuring expense
The analytical approach to EBITDA and EBITDAP across methodologies and to the terminal value in the illustrative discounted cash flow analyses is consistent with this reporting
Illustrative discounted cash flow analyses performed using both terminal multiple and perpetuity growth rate methods
In the case of the perpetuity growth rate method, changes in net working capital have been normalized in the terminal year. While this assumption continues to be reviewed, the terminal year increase in working capital has been reduced from $60 million as indicated in management’s financial projections for 2020 to $30 million (normalized to equal four-year average during projection period)
1. Based on transactions for which information was publicly available.
CONFIDENTIAL—PRELIMINARY—SUBJECT TO FURTHER REVIEW AND REVISION 5
|
|
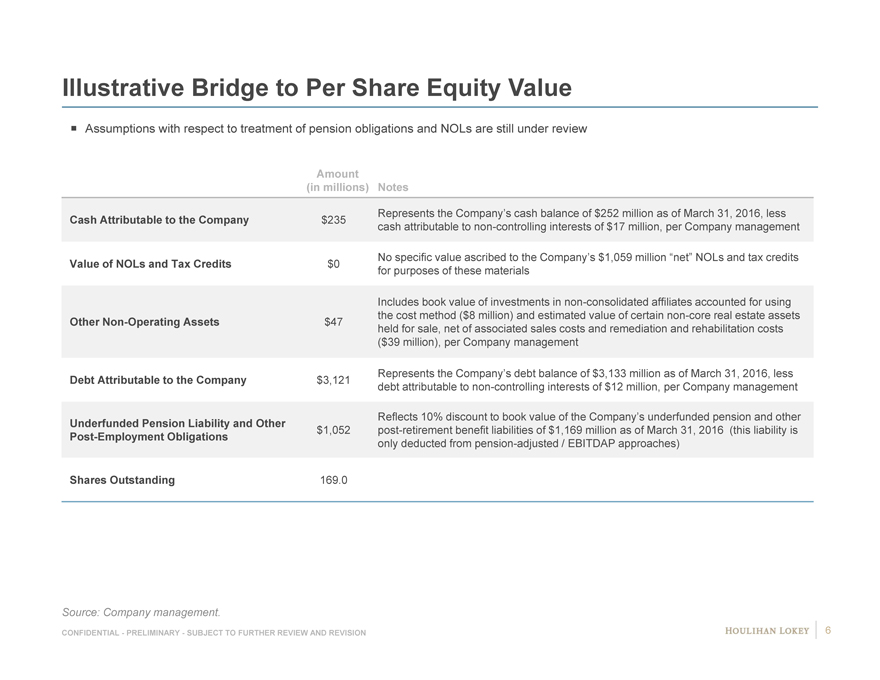
Illustrative Bridge to Per Share Equity Value
Assumptions with respect to treatment of pension obligations and NOLs are still under review
Amount
(in millions) Notes
Represents the Company’s cash balance of $252 million as of March 31, 2016, less
Cash Attributable to the Company $235 cash attributable to non-controlling interests of $17 million, per Company management
No specific value ascribed to the Company’s $1,059 million “net” NOLs and tax credits
Value of NOLs and Tax Credits $0 for purposes of these materials
Includes book value of investments in non-consolidated affiliates accounted for using the cost method ($8 million) and estimated value of certain non-core real estate assets
Other Non-Operating Assets $47 held for sale, net of associated sales costs and remediation and rehabilitation costs
($39 million), per Company management
Represents the Company’s debt balance of $3,133 million as of March 31, 2016, less
Debt Attributable to the Company $3,121 debt attributable to non-controlling interests of $12 million, per Company management
Reflects 10% discount to book value of the Company’s underfunded pension and other
Underfunded Pension Liability and Other $1,052 post-retirement benefit liabilities of $1,169 million as of March 31, 2016 (this liability is
Post-Employment Obligations only deducted from pension-adjusted / EBITDAP approaches)
Shares Outstanding 169.0
Source: Company management.
CONFIDENTIAL—PRELIMINARY—SUBJECT TO FURTHER REVIEW AND REVISION 6
|
|
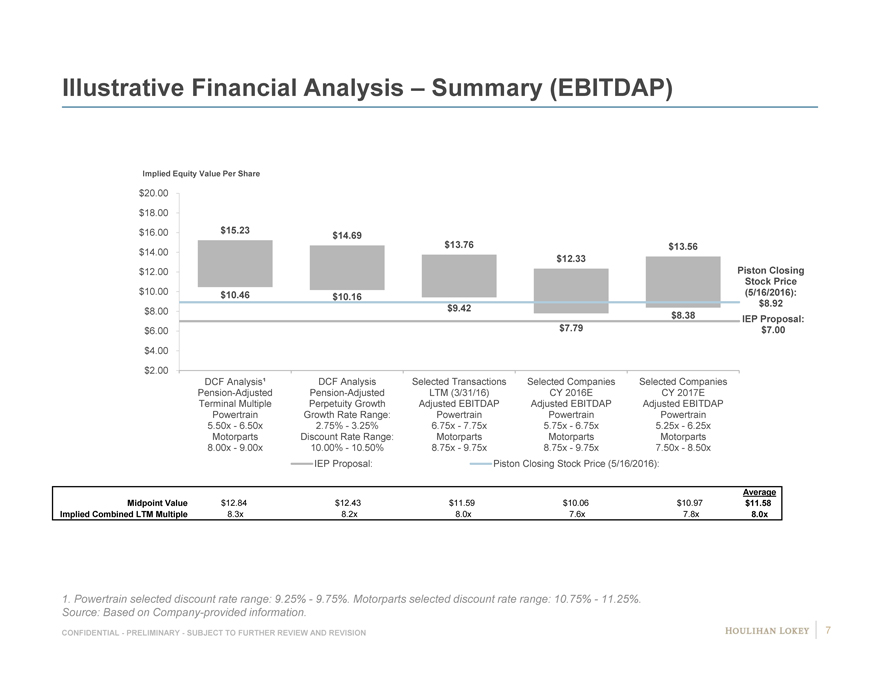
Illustrative Financial Analysis – Summary (EBITDAP)
Implied Equity Value Per Share
$20.00
$18.00
$16.00 $ 15.23 $ 14.69
$14.00 $13.76 $13.56
$12.33
$12.00 Piston Closing
Stock Price
$10.00 $ 10.46 $ 10.16(5/16/2016):
$8.92
$8.00 $9.42
$8.38 IEP Proposal:
$6.00 $7.79 $7.00
$4.00
$2.00
DCF Analysis¹ DCF Analysis Selected Transactions Selected Companies Selected Companies
Pension-Adjusted Pension-Adjusted LTM (3/31/16) CY 2016E CY 2017E
Terminal Multiple Perpetuity Growth Adjusted EBITDAP Adjusted EBITDAP Adjusted EBITDAP
Powertrain Growth Rate Range: Powertrain Powertrain Powertrain
5.50x—6.50x 2.75%—3.25% 6.75x—7.75x 5.75x—6.75x 5.25x—6.25x
Motorparts Discount Rate Range: Motorparts Motorparts Motorparts
8.00x—9.00x 10.00%—10.50% 8.75x—9.75x 8.75x—9.75x 7.50x—8.50x
IEP Proposal: Piston Closing Stock Price (5/16/2016):
Average
Midpoint Value $12.84 $12.43 $11.59 $10.06 $10.97 $11.58
Implied Combined LTM Multiple 8.3x 8.2x 8.0x 7.6x 7.8x 8.0x
1. Powertrain selected discount rate range: 9.25%—9.75%. Motorparts selected discount rate range: 10.75%—11.25%.
Source: Based on Company-provided information.
CONFIDENTIAL—PRELIMINARY—SUBJECT TO FURTHER REVIEW AND REVISION 7
|
|
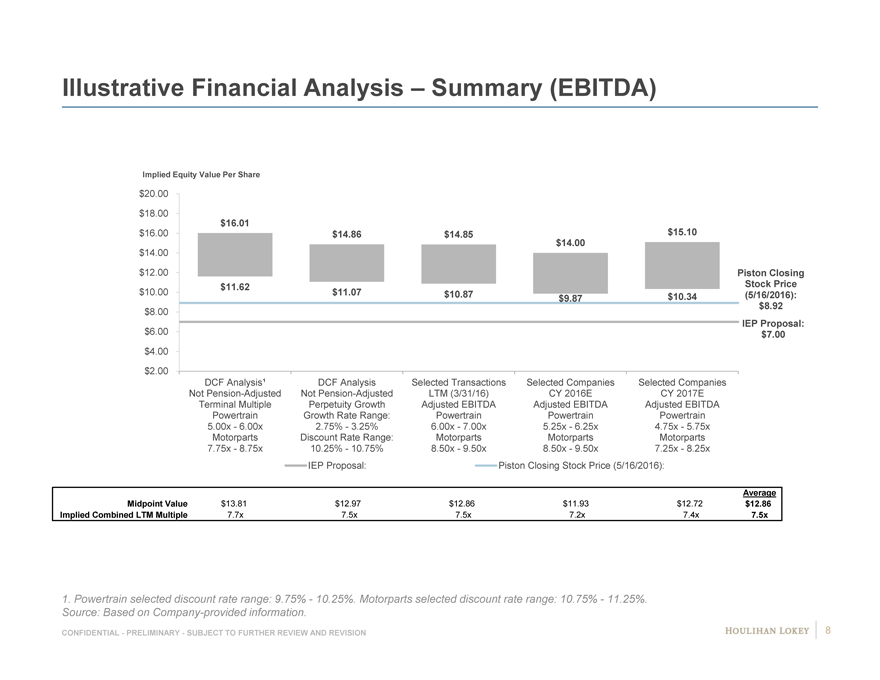
Illustrative Financial Analysis – Summary (EBITDA)
Implied Equity Value Per Share
$20.00
$18.00
$16.01
$16.00 $14.86 $14.85 $15.10
$14.00
$14.00
$12.00 Piston Closing
$11.62 Stock Price
$10.00 $11.07 $10.87 $9.87 $10.34(5/16/2016):
$8.00 $8.92
IEP Proposal:
$6.00 $7.00
$4.00
$2.00
DCF Analysis¹ DCF Analysis Selected Transactions Selected Companies Selected Companies
Not Pension-Adjusted Not Pension-Adjusted LTM (3/31/16) CY 2016E CY 2017E
Terminal Multiple Perpetuity Growth Adjusted EBITDA Adjusted EBITDA Adjusted EBITDA
Powertrain Growth Rate Range: Powertrain Powertrain Powertrain
5.00x—6.00x 2.75%—3.25% 6.00x—7.00x 5.25x—6.25x 4.75x—5.75x
Motorparts Discount Rate Range: Motorparts Motorparts Motorparts
7.75x—8.75x 10.25%—10.75% 8.50x—9.50x 8.50x—9.50x 7.25x—8.25x
IEP Proposal: Piston Closing Stock Price (5/16/2016):
Average
Midpoint Value $13.81 $12.97 $12.86 $11.93 $12.72 $12.86
Implied Combined LTM Multiple 7.7x 7.5x 7.5x 7.2x 7.4x 7.5x
1. Powertrain selected discount rate range: 9.75%—10.25%. Motorparts selected discount rate range: 10.75%—11.25%.
Source: Based on Company-provided information.
CONFIDENTIAL—PRELIMINARY—SUBJECT TO FURTHER REVIEW AND REVISION 8
|
|
Page
1. Selected Illustrative Financial Analyses 3
2. Certain Non-Financial Observations 9
3. Appendices 12
|
|
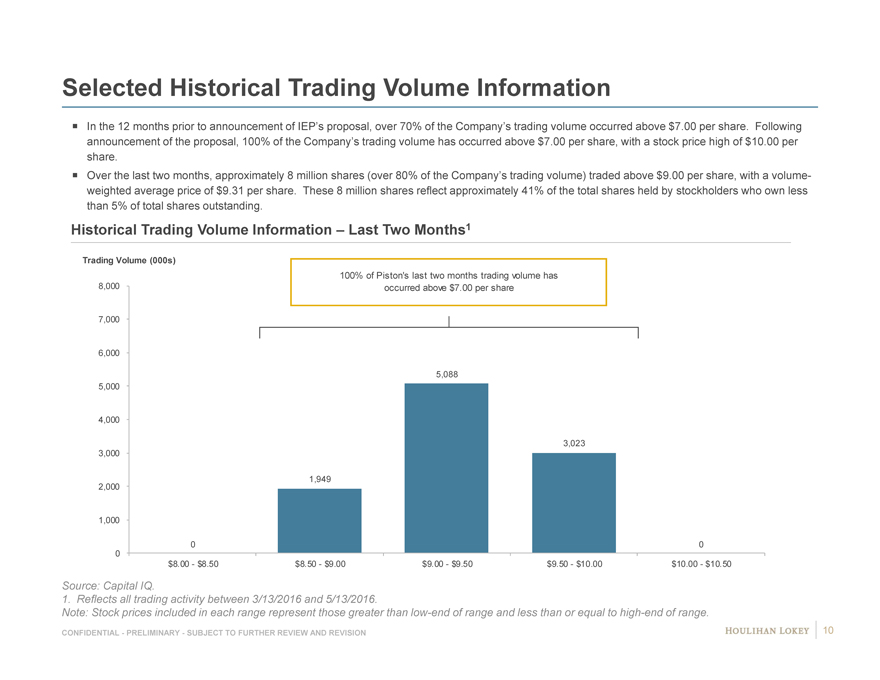
Selected Historical Trading Volume Information
In the 12 months prior to announcement of IEP’s proposal, over 70% of the Company’s trading volume occurred above $7.00 per share. Following announcement of the proposal, 100% of the Company’s trading volume has occurred above $7.00 per share, with a stock price high of $10.00 per share.
Over the last two months, approximately 8 million shares (over 80% of the Company’s trading volume) traded above $9.00 per share, with a volume-weighted average price of $9.31 per share. These 8 million shares reflect approximately 41% of the total shares held by stockholders who own less than 5% of total shares outstanding.
Historical Trading Volume Information – Last Two Months1
Trading Volume (000s)
100% of Piston’s last two months trading volume has
8,000 occurred above $7.00 per share
7,000
6,000
5,088
5,000
4,000
3,023
3,000
1,949
2,000
1,000
0 0
0
$8.00—$8.50 $8.50—$9.00 $9.00—$9.50 $9.50—$10.00 $10.00—$10.50
Source: Capital IQ.
1. Reflects all trading activity between 3/13/2016 and 5/13/2016.
Note: Stock prices included in each range represent those greater than low-end of range and less than or equal to high-end of range.
CONFIDENTIAL—PRELIMINARY—SUBJECT TO FURTHER REVIEW AND REVISION 10
|
|
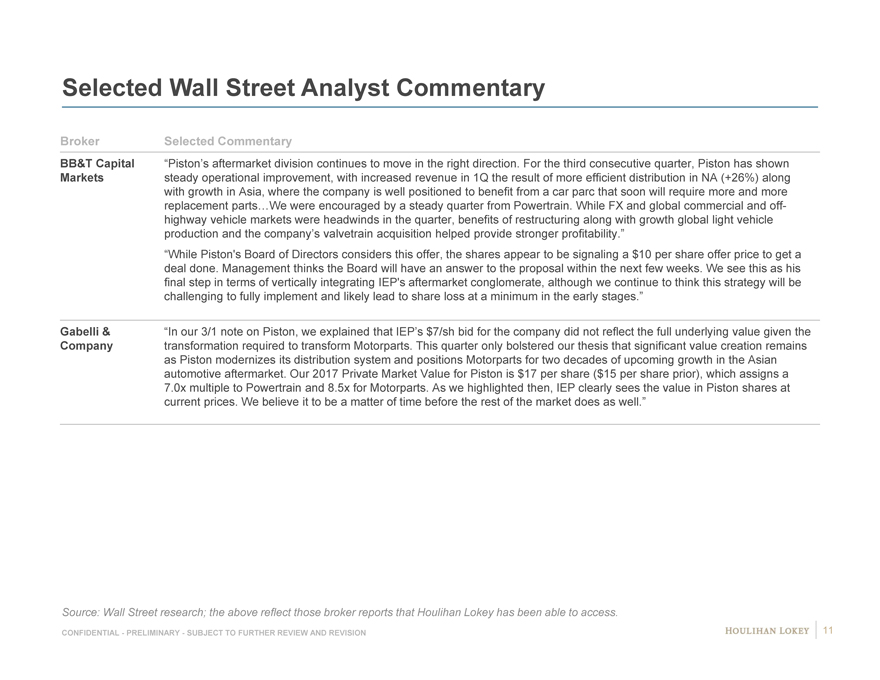
Selected Wall Street Analyst Commentary
Broker Selected Commentary
BB&T Capital “Piston’s aftermarket division continues to move in the right direction. For the third consecutive quarter, Piston has shown Markets steady operational improvement, with increased revenue in 1Q the result of more efficient distribution in NA (+26%) along with growth in Asia, where the company is well positioned to benefit from a car parc that soon will require more and more replacement parts…We were encouraged by a steady quarter from Powertrain. While FX and global commercial and off-highway vehicle markets were headwinds in the quarter, benefits of restructuring along with growth global light vehicle production and the company’s valvetrain acquisition helped provide stronger profitability.” “While Piston’s Board of Directors considers this offer, the shares appear to be signaling a $10 per share offer price to get a deal done. Management thinks the Board will have an answer to the proposal within the next few weeks. We see this as his final step in terms of vertically integrating IEP’s aftermarket conglomerate, although we continue to think this strategy will be challenging to fully implement and likely lead to share loss at a minimum in the early stages.”
Gabelli & “In our 3/1 note on Piston, we explained that IEP’s $7/sh bid for the company did not reflect the full underlying value given the Company transformation required to transform Motorparts. This quarter only bolstered our thesis that significant value creation remains as Piston modernizes its distribution system and positions Motorparts for two decades of upcoming growth in the Asian automotive aftermarket. Our 2017 Private Market Value for Piston is $17 per share ($15 per share prior), which assigns a 7.0x multiple to Powertrain and 8.5x for Motorparts. As we highlighted then, IEP clearly sees the value in Piston shares at current prices. We believe it to be a matter of time before the rest of the market does as well.”
Source: Wall Street research; the above reflect those broker reports that Houlihan Lokey has been able to access.
CONFIDENTIAL—PRELIMINARY—SUBJECT TO FURTHER REVIEW AND REVISION 11
|
|
Page
1. Selected Illustrative Financial Analyses 3
2. Certain Non-Financial Observations 9
3. Appendices 12 Selected Companies and Transactions Information 13
|
|
Page
1. Selected Illustrative Financial Analyses 3
2. Certain Non-Financial Observations 9
3. Appendices 12 Selected Companies and Transactions Information 13
|
|
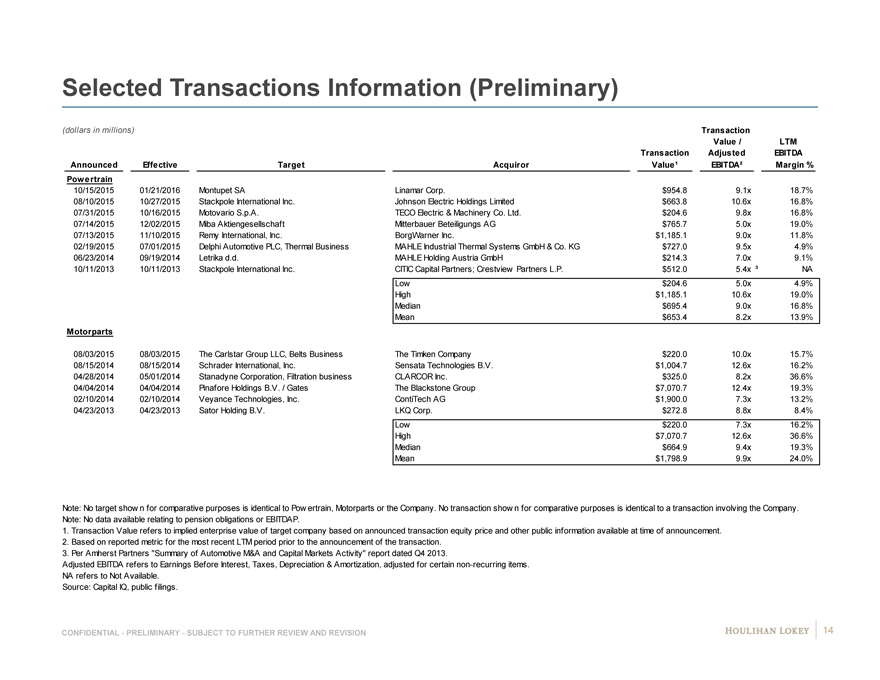
Selected Transactions Information (Preliminary)
(dollars in millions) Transaction
Value / LTM
Transaction Adjusted EBITDA
Announced Effective Target Acquiror Value¹ EBITDA² Margin %
Powertrain
10/15/2015 01/21/2016 Montupet SA Linamar Corp. $954.8 9.1x 18.7%
08/10/2015 10/27/2015 Stackpole International Inc. Johnson Electric Holdings Limited $663.8 10.6x 16.8%
07/31/2015 10/16/2015 Motovario S.p.A. TECO Electric & Machinery Co. Ltd. $204.6 9.8x 16.8%
07/14/2015 12/02/2015 Miba Aktiengesellschaft Mitterbauer Beteiligungs AG $765.7 5.0x 19.0%
07/13/2015 11/10/2015 Remy International, Inc. BorgWarner Inc. $1,185.1 9.0x 11.8%
02/19/2015 07/01/2015 Delphi Automotive PLC, Thermal Business MAHLE Industrial Thermal Systems GmbH & Co. KG $727.0 9.5x 4.9%
06/23/2014 09/19/2014 Letrika d.d. MAHLE Holding Austria GmbH $214.3 7.0x 9.1%
10/11/2013 10/11/2013 Stackpole International Inc. CITIC Capital Partners; Crestview Partners L.P. $512.0 5.4x ³ NA N
Low $204.6 5.0x 4.9%
High $1,185.1 10.6x 19.0%
Median $695.4 9.0x 16.8%
Mean $653.4 8.2x 13.9%
Motorparts
08/03/2015 08/03/2015 The Carlstar Group LLC, Belts Business The Timken Company $220.0 10.0x 15.7%
08/15/2014 08/15/2014 Schrader International, Inc. Sensata Technologies B.V. $1,004.7 12.6x 16.2%
04/28/2014 05/01/2014 Stanadyne Corporation, Filtration business CLARCOR Inc. $325.0 8.2x 36.6%
04/04/2014 04/04/2014 Pinafore Holdings B.V. / Gates The Blackstone Group $7,070.7 12.4x 19.3%
02/10/2014 02/10/2014 Veyance Technologies, Inc. ContiTech AG $1,900.0 7.3x 13.2%
04/23/2013 04/23/2013 Sator Holding B.V. LKQ Corp. $272.8 8.8x 8.4%
Low $220.0 7.3x 16.2%
High $7,070.7 12.6x 36.6%
Median $664.9 9.4x 19.3%
Mean $1,798.9 9.9x 24.0%
Note: No target show n for comparative purposes is identical to Pow ertrain, Motorparts or the Company. No transaction show n for comparative purposes is identical to a transaction involving the Company.
Note: No data available relating to pension obligations or EBITDAP.
1. Transaction Value refers to implied enterprise value of target company based on announced transaction equity price and other public information available at time of announcement.
2. Based on reported metric for the most recent LTM period prior to the announcement of the transaction.
3. Per Amherst Partners “Summary of Automotive M&A and Capital Markets Activity” report dated Q4 2013.
Adjusted EBITDA refers to Earnings Before Interest, Taxes, Depreciation & Amortization, adjusted for certain non-recurring items.
NA refers to Not Available.
Source: Capital IQ, public filings.
CONFIDENTIAL—PRELIMINARY—SUBJECT TO FURTHER REVIEW AND REVISION 14
|
|
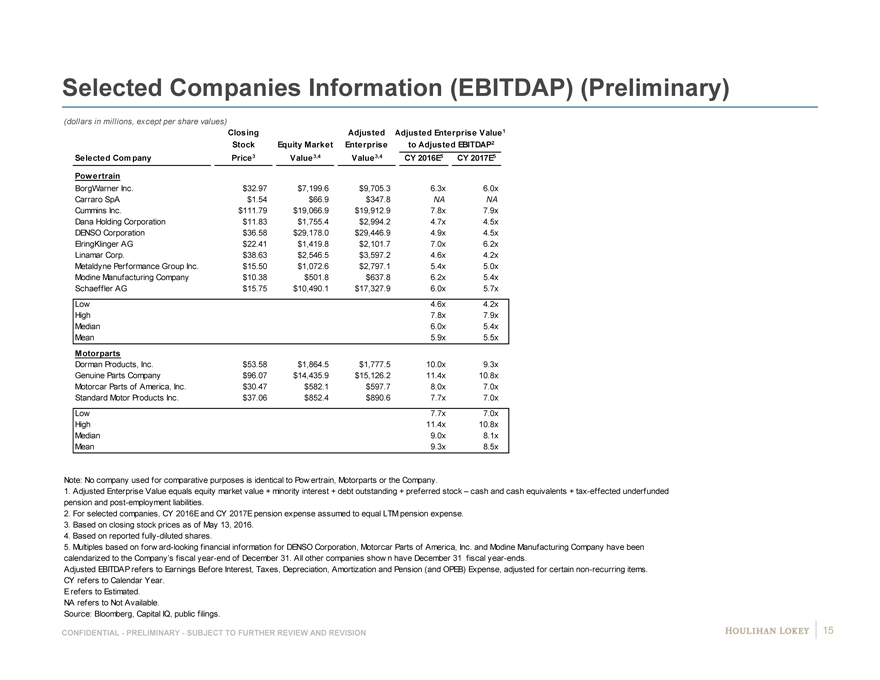
Selected Companies Information (EBITDAP) (Preliminary)
(dollars in millions, except per share values)
Closing Adjusted Adjusted Enterprise Value1
Stock Equity Market Enterprise to Adjusted EBITDAP2
Selected Company Price3 Value 3,4 Value 3,4 CY 2016E5 CY 2017E5
Powertrain
BorgWarner Inc. $32.97 $7,199.6 $9,705.3 6.3x 6.0x 6 9
Carraro SpA $1.54 $66.9 $347.8 NA NA N NA
Cummins Inc. $111.79 $19,066.9 $19,912.9 7.8x 7.9x 8 #
Dana Holding Corporation $11.83 $1,755.4 $2,994.2 4.7x 4.5x 4 8
DENSO Corporation $36.58 $29,178.0 $29,446.9 4.9x 4.5x 5 8
ElringKlinger AG $22.41 $1,419.8 $2,101.7 7.0x 6.2x 6 #
Linamar Corp. $38.63 $2,546.5 $3,597.2 4.6x 4.2x 4 9
Metaldyne Performance Group Inc. $15.50 $1,072.6 $2,797.1 5.4x 5.0x 5 8
Modine Manufacturing Company $10.38 $501.8 $637.8 6.2x 5.4x 5 #
Schaeffler AG $15.75 $10,490.1 $17,327.9 6.0x 5.7x 6 9
Low 4.6x 4.2x
High 7.8x 7.9x
Median 6.0x 5.4x
Mean 5.9x 5.5x
Motorparts
Dorman Products, Inc. $53.58 $1,864.5 $1,777.5 10.0x 9.3x 9 #
Genuine Parts Company $96.07 $14,435.9 $15,126.2 11.4x 10.8x # #
Motorcar Parts of America, Inc. $30.47 $582.1 $597.7 8.0x 7.0x 7 7
Standard Motor Products Inc. $37.06 $852.4 $890.6 7.7x 7.0x 7 NA
Low 7.7x 7.0x
High 11.4x 10.8x
Median 9.0x 8.1x
Mean 9.3x 8.5x
Note: No company used for comparative purposes is identical to Pow ertrain, Motorparts or the Company.
1. Adjusted Enterprise Value equals equity market value + minority interest + debt outstanding + preferred stock – cash and cash equivalents + tax-effected underfunded
pension and post-employment liabilities.
2. For selected companies, CY 2016E and CY 2017E pension expense assumed to equal LTM pension expense.
3. Based on closing stock prices as of May 13, 2016.
4. Based on reported fully-diluted shares.
5. Multiples based on forw ard-looking financial information for DENSO Corporation, Motorcar Parts of America, Inc. and Modine Manufacturing Company have been
calendarized to the Company’s fiscal year-end of December 31. All other companies show n have December 31 fiscal year-ends.
Adjusted EBITDAP refers to Earnings Before Interest, Taxes, Depreciation, Amortization and Pension (and OPEB) Expense, adjusted for certain non-recurring items.
CY refers to Calendar Year.
E refers to Estimated.
NA refers to Not Available.
Source: Bloomberg, Capital IQ, public filings.
CONFIDENTIAL—PRELIMINARY—SUBJECT TO FURTHER REVIEW AND REVISION 15
|
|
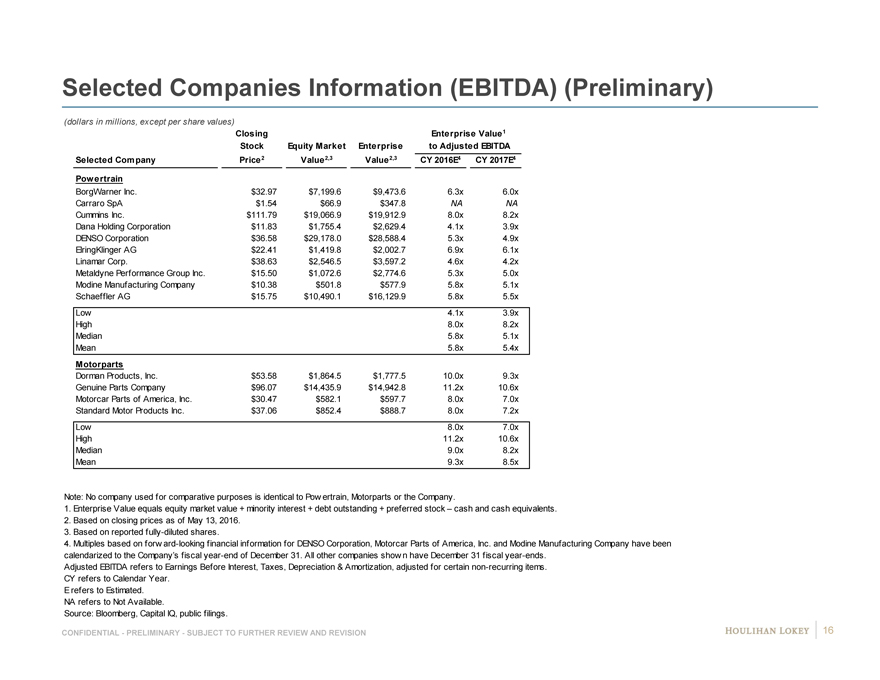
Selected Companies Information (EBITDA) (Preliminary)
(dollars in millions, except per share values)
Closing Enterprise Value 1
Stock Equity Market Enterprise to Adjusted EBITDA
Selected Company Price 2 Value 2,3 Value2,3 CY 2016E4 CY 2017E4
Powertrain
BorgWarner Inc. $32.97 $7,199.6 $9,473.6 6.3x 6.0x 6 9
Carraro SpA $1.54 $66.9 $347.8 NA NA N NA
Cummins Inc. $111.79 $19,066.9 $19,912.9 8.0x 8.2x 8 #
Dana Holding Corporation $11.83 $1,755.4 $2,629.4 4.1x 3.9x 4 7
DENSO Corporation $36.58 $29,178.0 $28,588.4 5.3x 4.9x 5 #
ElringKlinger AG $22.41 $1,419.8 $2,002.7 6.9x 6.1x 6 #
Linamar Corp. $38.63 $2,546.5 $3,597.2 4.6x 4.2x 4 9
Metaldyne Performance Group Inc. $15.50 $1,072.6 $2,774.6 5.3x 5.0x 5 8
Modine Manufacturing Company $10.38 $501.8 $577.9 5.8x 5.1x 5 #
Schaeffler AG $15.75 $10,490.1 $16,129.9 5.8x 5.5x 6 9
Low 4.1x 3.9x
High 8.0x 8.2x
Median 5.8x 5.1x
Mean 5.8x 5.4x
Motorparts
Dorman Products, Inc. $53.58 $1,864.5 $1,777.5 10.0x 9.3x 9 #
Genuine Parts Company $96.07 $14,435.9 $14,942.8 11.2x 10.6x # #
Motorcar Parts of America, Inc. $30.47 $582.1 $597.7 8.0x 7.0x 7 7
Standard Motor Products Inc. $37.06 $852.4 $888.7 8.0x 7.2x 7 NA
Low 8.0x 7.0x
High 11.2x 10.6x
Median 9.0x 8.2x
Mean 9.3x 8.5x
Note: No company used for comparative purposes is identical to Pow ertrain, Motorparts or the Company.
1. Enterprise Value equals equity market value + minority interest + debt outstanding + preferred stock – cash and cash equivalents.
2. Based on closing prices as of May 13, 2016.
3. Based on reported fully-diluted shares.
4. Multiples based on forw ard-looking financial information for DENSO Corporation, Motorcar Parts of America, Inc. and Modine Manufacturing Company have been
calendarized to the Company’s fiscal year-end of December 31. All other companies show n have December 31 fiscal year-ends.
Adjusted EBITDA refers to Earnings Before Interest, Taxes, Depreciation & Amortization, adjusted for certain non-recurring items.
CY refers to Calendar Year.
E refers to Estimated.
NA refers to Not Available.
Source: Bloomberg, Capital IQ, public filings.
CONFIDENTIAL—PRELIMINARY—SUBJECT TO FURTHER REVIEW AND REVISION 16
|
|
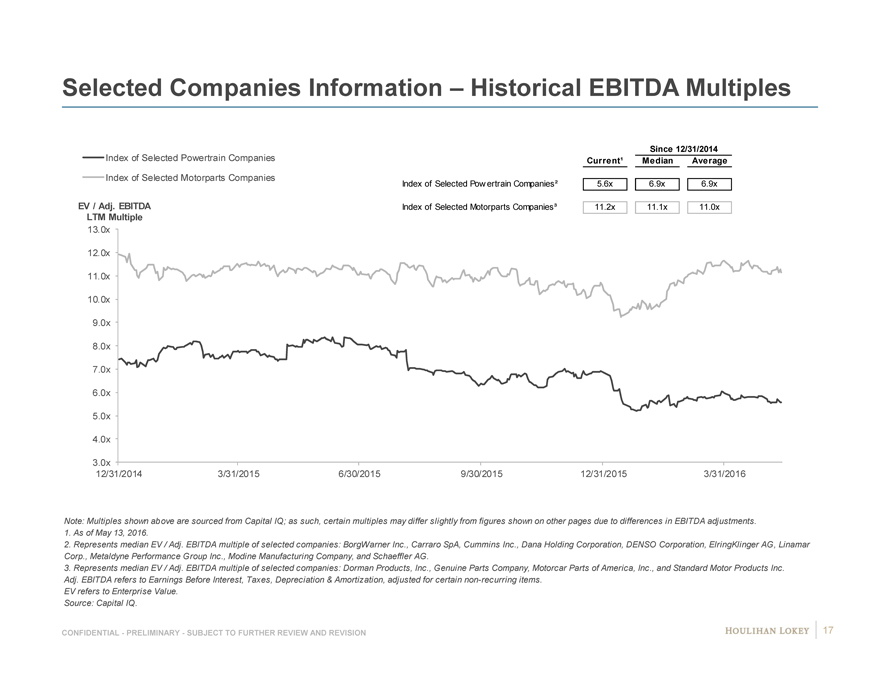
Selected Companies Information – Historical EBITDA Multiples
Since 12/31/2014
Index of Selected Powertrain Companies Current¹ Median Average
Index of Selected Motorparts Companies Index of Selected Pow ertrain Companies² 5.6x 6.9x 6.9x
EV / Adj. EBITDA Index of Selected Motorparts Companies³ 11.2x 11.1x 11.0x
LTM Multiple
13.0x
12.0x
11.0x
10.0x
9.0x
8.0x
7.0x
6.0x
5.0x
4.0x
3.0x
12/31/2014 3/31/2015 6/30/2015 9/30/2015 12/31/2015 3/31/2016
Note: Multiples shown above are sourced from Capital IQ; as such, certain multiples may differ slightly from figures shown on other pages due to differences in EBITDA adjustments.
1. As of May 13, 2016.
2. Represents median EV / Adj. EBITDA multiple of selected companies: BorgWarner Inc., Carraro SpA, Cummins Inc., Dana Holding Corporation, DENSO Corporation, ElringKlinger AG, Linamar
Corp., Metaldyne Performance Group Inc., Modine Manufacturing Company, and Schaeffler AG.
3. Represents median EV / Adj. EBITDA multiple of selected companies: Dorman Products, Inc., Genuine Parts Company, Motorcar Parts of America, Inc., and Standard Motor Products Inc.
Adj. EBITDA refers to Earnings Before Interest, Taxes, Depreciation & Amortization, adjusted for certain non-recurring items.
EV refers to Enterprise Value.
Source: Capital IQ.
CONFIDENTIAL—PRELIMINARY—SUBJECT TO FURTHER REVIEW AND REVISION 17
|
|
Disclaimer
Houlihan Lokey Capital, Inc. (“Houlihan Lokey”) has been retained by the Special Committee of the Board of Directors of Piston (“Piston” or the “Company”) to serve as its financial advisor in connection with the evaluation of a potential transaction involving the Company (a “Transaction”).
These materials have been prepared at the direction of the Special Committee for discussion purposes only and are delivered on a confidential basis in accordance with procedures established by the Special Committee. These materials do not purport to contain all of the information that may be required or relevant to an evaluation of the Company or any Transaction and you are solely responsible for conducting your own investigations and analysis and arriving at your own independent conclusions.
These materials may not be distributed, reproduced or used without the express consent of Special Committee or for any purpose other than the evaluation of a possible Transaction. In addition, if you do not wish to pursue a Transaction, you must promptly return these materials to Houlihan Lokey as soon as practicable, together with any other materials relating to the Company which you have received from or on behalf of the Special Committee or its representatives.
Houlihan Lokey has not independently verified any of the information contained herein. Neither the Special Committee nor Houlihan Lokey or any other representatives of the Special Committee makes any representation, warranty or guaranty of any kind, express or implied, as to the accuracy, completeness or reasonableness of the information contained herein or any other written or oral communication transmitted or made available to you. The Special Committee, Houlihan Lokey and other representatives of the Special Committee expressly disclaim any and all liability based on or arising from, in whole or in part, such information, errors therein or omissions therefrom. In addition, these materials include certain projections and forward-looking statements provided by the Company with respect to the anticipated future performance of the Company. Such projections and forward-looking statements, including the assumptions on which they are based, are subject to adjustment based on discussions with Company management and the Special Committee. Financial analyses performed by Houlihan Lokey for purposes of advising the Special Committee may differ from those set forth herein. In addition, the projections and forward-looking statements contained herein are subject to significant business, economic and competitive uncertainties and contingencies, many of which are beyond the control of the Special Committee and the Company. Accordingly, there can be no assurance that such projections or forward-looking statements will be realized. Actual results may vary from anticipated results and such variations may be material. No representations or warranties are made as to the accuracy or reasonableness of such projections or forward-looking statements or the assumptions based thereon. Only those representations and warranties that are made in a definitive written agreement relating to a Transaction, when and if executed, and subject to any limitations and restrictions as may be specified in such definitive agreement, shall have any legal effect. You should make an independent assessment of the merits of pursuing a Transaction and should consult your own professional advisors.
CONFIDENTIAL—PRELIMINARY—SUBJECT TO FURTHER REVIEW AND REVISION 18
| Exhibit C3
|
Project Piston
DISCUSSION MATERIALS FOR THESPECIAL COMMITTEE
JUNE 14, 2016 | PRELIMINARY DRAFT – SUBJECT TO REVIEW – CONFIDENTIAL
|
|
Table of Contents
Page
1. Selected Public Market Observations 3
2. Preliminary Financial Analyses 7
3. Appendix 17
Cost of Capital Considerations 18
Benchmarking 24
Company Financial Performance Observations 28
Premiums Paid Observations 32
Illustrative Preliminary Financial Analyses (EBITDA) 35
Selected Excerpt from June 1, 2016 Preliminary Discussion Materials:
47
Items Subject to Further Review
Selected Excerpts from May 11, 2016 / June 1, 2016 Preliminary
49
Discussion Materials: Illustrative Sensitivities
4. Disclaimer 53
CONFIDENTIAL—PRELIMINARY DRAFT—SUBJECT TO FURTHER REVIEW 2
Page
|
|
1. Selected Public Market Observations 3
2. Preliminary Financial Analyses 7
3. Appendix 17
4. Disclaimer 53
|
|
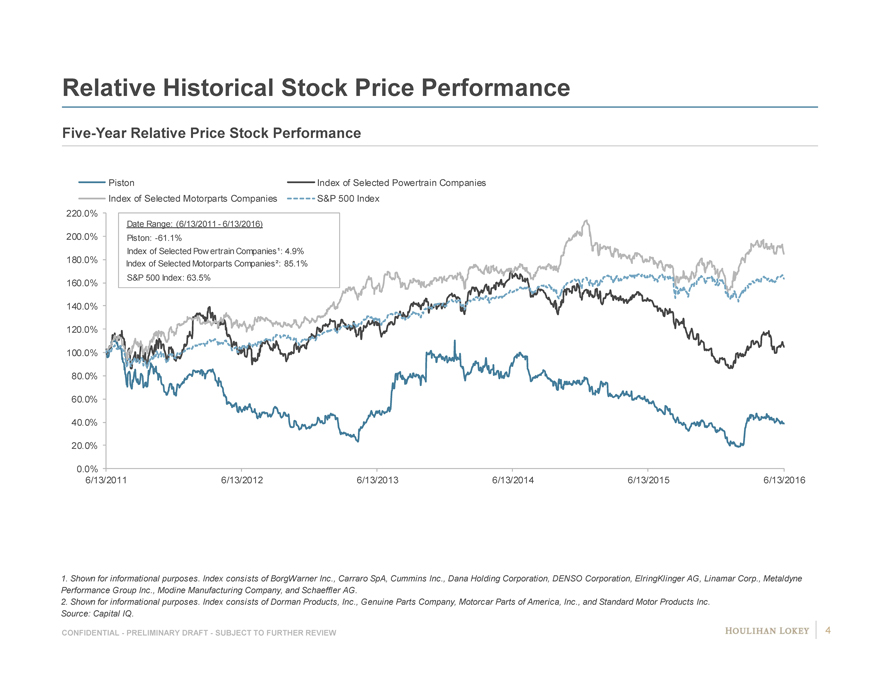
Relative Historical Stock Price Performance
Five-Year Relative Price Stock Performance
Piston Index of Selected Powertrain Companies
Index of Selected Motorparts Companies S&P 500 Index
220.0%
Date Range: (6/13/2011—6/13/2016)
200.0% Piston: -61.1%
Index of Selected Pow ertrain Companies¹: 4.9%
180.0% Index of Selected Motorparts Companies²: 85.1%
160.0% S&P 500 Index: 63.5%
140.0%
120.0%
100.0%
80.0%
60.0%
40.0%
20.0%
0.0%
6/13/2011 6/13/2012 6/13/2013 6/13/2014 6/13/2015 6/13/2016
1. Shown for informational purposes. Index consists of BorgWarner Inc., Carraro SpA, Cummins Inc., Dana Holding Corporation, DENSO Corporation, ElringKlinger AG, Linamar Corp., Metaldyne Performance Group Inc., Modine Manufacturing Company, and Schaeffler AG.
2. Shown for informational purposes. Index consists of Dorman Products, Inc., Genuine Parts Company, Motorcar Parts of America, Inc., and Standard Motor Products Inc.
Source: Capital IQ.
CONFIDENTIAL—PRELIMINARY DRAFT—SUBJECT TO FURTHER REVIEW 4
|
|
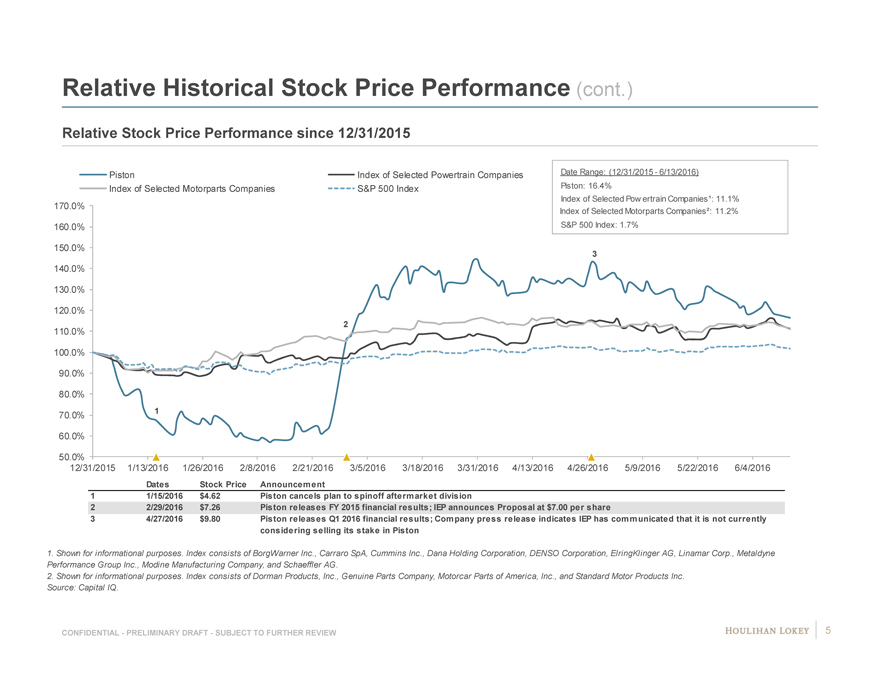
Relative Historical Stock Price Performance (cont.)
Relative Stock Price Performance since 12/31/2015
Piston Index of Selected Powertrain Companies Date Range: (12/31/2015—6/13/2016)
Index of Selected Motorparts Companies S&P 500 Index Piston: 16.4%
Index of Selected Pow ertrain Companies¹: 11.1%
170.0% Index of Selected Motorparts Companies²: 11.2%
160.0% S&P 500 Index: 1.7%
150.0%
3
140.0%
130.0%
120.0%
2
110.0%
100.0%
90.0%
80.0%
70.0% 1
60.0%
50.0%
12/31/2015 1/13/2016 1/26/2016 2/8/2016 2/21/2016 3/5/2016 3/18/2016 3/31/2016 4/13/2016 4/26/2016 5/9/2016 5/22/2016 6/4/2016
Dates Stock Price Announcement
1 1/15/2016 $4.62 Piston cancels plan to spinoff aftermarket division
2 2/29/2016 $7.26 Piston releases FY 2015 financial results; IEP announces Proposal at $7.00 per share
3 4/27/2016 $9.80 Piston releases Q1 2016 financial results; Company press release indicates IEP has communicated that it is not currently
considering selling its stake in Piston
1. Shown for informational purposes. Index consists of BorgWarner Inc., Carraro SpA, Cummins Inc., Dana Holding Corporation, DENSO Corporation, ElringKlinger AG, Linamar Corp., Metaldyne
Performance Group Inc., Modine Manufacturing Company, and Schaeffler AG.
2. Shown for informational purposes. Index consists of Dorman Products, Inc., Genuine Parts Company, Motorcar Parts of America, Inc., and Standard Motor Products Inc.
Source: Capital IQ.
CONFIDENTIAL—PRELIMINARY DRAFT—SUBJECT TO FURTHER REVIEW 5
|
|
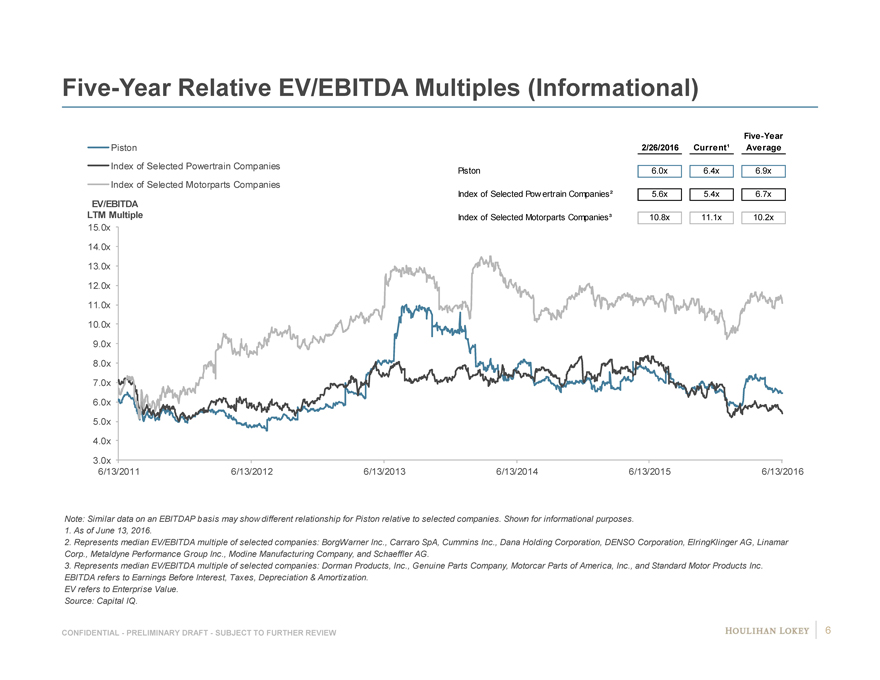
Five-Year Relative EV/EBITDA Multiples (Informational)
Five-Year
Piston 2/26/2016 Current¹ Average
Index of Selected Powertrain Companies Piston 6.0x 6.4x 6.9x
Index of Selected Motorparts Companies
Index of Selected Pow ertrain Companies² 5.6x 5.4x 6.7x
EV/EBITDA
LTM Multiple Index of Selected Motorparts Companies³ 10.8x 11.1x 10.2x
15.0x
14.0x
13.0x
12.0x
11.0x
10.0x
9.0x
8.0x
7.0x
6.0x
5.0x
4.0x
3.0x
6/13/2011 6/13/2012 6/13/2013 6/13/2014 6/13/2015 6/13/2016
Note: Similar data on an EBITDAP basis may show different relationship for Piston relative to selected companies. Shown for informational purposes.
1. As of June 13, 2016.
2. Represents median EV/EBITDA multiple of selected companies: BorgWarner Inc., Carraro SpA, Cummins Inc., Dana Holding Corporation, DENSO Corporation, ElringKlinger AG, Linamar
Corp., Metaldyne Performance Group Inc., Modine Manufacturing Company, and Schaeffler AG.
3. Represents median EV/EBITDA multiple of selected companies: Dorman Products, Inc., Genuine Parts Company, Motorcar Parts of America, Inc., and Standard Motor Products Inc.
EBITDA refers to Earnings Before Interest, Taxes, Depreciation & Amortization.
EV refers to Enterprise Value.
Source: Capital IQ.
CONFIDENTIAL—PRELIMINARY DRAFT—SUBJECT TO FURTHER REVIEW 6
|
|
Page
1. Selected Public Market Observations 3
2. Preliminary Financial Analyses 7
3. Appendix 17
4. Disclaimer 53
|
|
Selected Consolidated Historical and Projected Financial Data
(dollars in millions) Historical Projected Fiscal Year Ended December 31, LTM Ended Fiscal Year Ending December 31, 2013—2015 2015—2020 2013 2014 2015 3/31/2016 2016E 2017E 2018E 2019E 2020E CAGR CAGR
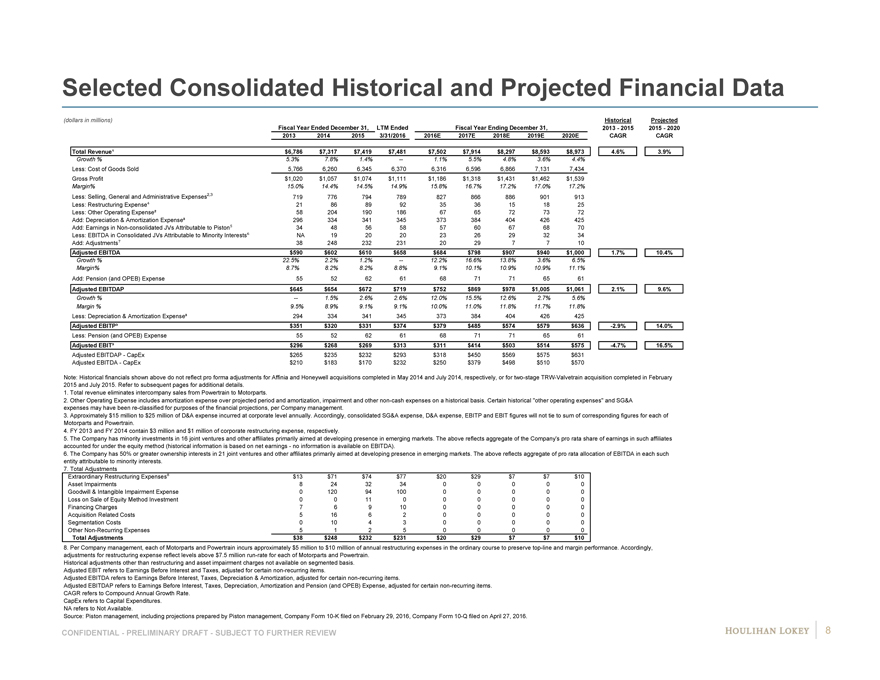
Total Revenue¹ $6,786 $7,317 $7,419 $7,481 $7,502 $7,914 $8,297 $8,593 $8,973 4.6% 3.9%
Growth % 5.3% 7.8% 1.4% — 1.1% 5.5% 4.8% 3.6% 4.4%
Less: Cost of Goods Sold 5,766 6,260 6,345 6,370 6,316 6,596 6,866 7,131 7,434 Gross Profit $1,020 $1,057 $1,074 $1,111 $1,186 $1,318 $1,431 $1,462 $1,539
Margin% 15.0% 14.4% 14.5% 14.9% 15.8% 16.7% 17.2% 17.0% 17.2%
Less: Selling, General and Administrative Expenses2,3 719 776 794 789 827 866 886 901 913 Less: Restructuring Expense 21 86 89 92 35 36 15 18 25 Less: Other Operating Expense² 58 204 190 186 67 65 72 73 72 Add: Depreciation & Amortization Expense³ 296 334 341 345 373 384 404 426 425 Add: Earnings in Non-consolidated JVs Attributable to Piston 34 48 56 58 57 60 67 68 70 Less: EBITDA in Consolidated JVs Attributable to Minority Interests NA 19 20 20 23 26 29 32 34 Add: Adjustments 38 248 232 231 20 29 7 7 10
Adjusted EBITDA $590 $602 $610 $658 $684 $798 $907 $940 $1,000 1.7% 10.4%
Growth % 22.5% 2.2% 1.2% — 12.2% 16.6% 13.8% 3.6% 6.5% Margin% 8.7% 8.2% 8.2% 8.8% 9.1% 10.1% 10.9% 10.9% 11.1%
Add: Pension (and OPEB) Expense 55 52 62 61 68 71 71 65 61
Adjusted EBITDAP $645 $654 $672 $719 $752 $869 $978 $1,005 $1,061 2.1% 9.6%
Growth % — 1.5% 2.6% 2.6% 12.0% 15.5% 12.6% 2.7% 5.6% Margin % 9.5% 8.9% 9.1% 9.1% 10.0% 11.0% 11.8% 11.7% 11.8%
Less: Depreciation & Amortization Expense³ 294 334 341 345 373 384 404 426 425
Adjusted EBITP³ $351 $320 $331 $374 $379 $485 $574 $579 $636 -2.9% 14.0%
Less: Pension (and OPEB) Expense 55 52 62 61 68 71 71 65 61
Adjusted EBIT³ $296 $268 $269 $313 $311 $414 $503 $514 $575 -4.7% 16.5%
Adjusted EBITDAP—CapEx $265 $235 $232 $293 $318 $450 $569 $575 $631 Adjusted EBITDA—CapEx $210 $183 $170 $232 $250 $379 $498 $510 $570
Note: Historical financials shown above do not reflect pro forma adjustments for Affinia and Honeywell acquisitions completed in May 2014 and July 2014, respectively, or for two-stage TRW-Valvetrain acquisition completed in February 2015 and July 2015. Refer to subsequent pages for additional details.
1. Total revenue eliminates intercompany sales from Powertrain to Motorparts.
2. Other Operating Expense includes amortization expense over projected period and amortization, impairment and other non-cash expenses on a historical basis. Certain historical “other operating expenses” and SG&A expenses may have been re-classified for purposes of the financial projections, per Company management.
3. Approximately $15 million to $25 million of D&A expense incurred at corporate level annually. Accordingly, consolidated SG&A expense, D&A expense, EBITP and EBIT figures will not tie to sum of corresponding figures for each of Motorparts and Powertrain.
4. FY 2013 and FY 2014 contain $3 million and $1 million of corporate restructuring expense, respectively.
5. The Company has minority investments in 16 joint ventures and other affiliates primarily aimed at developing presence in emerging markets. The above reflects aggregate of the Company’s pro rata share of earnings in such affiliates accounted for under the equity method (historical information is based on net earnings—no information is available on EBITDA).
6. The Company has 50% or greater ownership interests in 21 joint ventures and other affiliates primarily aimed at developing presence in emerging markets. The above reflects aggregate of pro rata allocation of EBITDA in each such entity attributable to minority interests.
7. Total Adjustments
Extraordinary Restructuring Expenses $13 $71 $74 $77 $20 $29 $7 $7 $10 Asset Impairments 8 24 32 34 0 0 0 0 0 Goodwill & Intangible Impairment Expense 0 120 94 100 0 0 0 0 0 Loss on Sale of Equity Method Investment 0 0 11 0 0 0 0 0 0 Financing Charges 7 6 9 10 0 0 0 0 0 Acquisition Related Costs 5 16 6 2 0 0 0 0 0 Segmentation Costs 0 10 4 3 0 0 0 0 0 Other Non-Recurring Expenses 5 1 2 5 0 0 0 0 0
Total Adjustments $38 $248 $232 $231 $20 $29 $7 $7 $10
8. Per Company management, each of Motorparts and Powertrain incurs approximately $5 million to $10 milllion of annual restructuring expenses in the ordinary course to preserve top-line and margin performance. Accordingly, adjustments for restructuring expense reflect levels above $7.5 million run-rate for each of Motorparts and Powertrain.
Historical adjustments other than restructuring and asset impairment charges not available on segmented basis. Adjusted EBIT refers to Earnings Before Interest and Taxes, adjusted for certain non-recurring items.
Adjusted EBITDA refers to Earnings Before Interest, Taxes, Depreciation & Amortization, adjusted for certain non-recurring items.
Adjusted EBITDAP refers to Earnings Before Interest, Taxes, Depreciation, Amortization and Pension (and OPEB) Expense, adjusted for certain non-recurring items. CAGR refers to Compound Annual Growth Rate.
CapEx refers to Capital Expenditures. NA refers to Not Available.
Source: Piston management, including projections prepared by Piston management, Company Form 10-K filed on February 29, 2016, Company Form 10-Q filed on April 27, 2016.
CONFIDENTIAL—PRELIMINARY DRAFT—SUBJECT TO FURTHER REVIEW 8
|
|

Selected Powertrain Historical and Projected Financial Data
(dollars in millions) Fiscal Year Ended December 31, LTM Ended Fiscal Year Ending December 31, Historical Projected
2013 2014 2015 3/31/2016 2016E 2017E 2018E 2019E 2020E 2013—2015 2015—2020
Shipments $4,173 $4,430 $4,450 $4,440 $4,490 $4,906 $5,206 $5,478 $5,714 CAGR CAGR
Growth % — 6.2% 0.5% — 0.9% 9.3% 6.1% 5.2% 4.3%
Net Revenue¹ $3,889 $4,163 $4,198 $4,201 $4,253 $4,666 $4,966 $5,238 $5,474 3.9% 5.5%
Growth % — 7.0% 0.8% — 1.3% 9.7% 6.4% 5.5% 4.5%
Less: Cost of Goods Sold 3,372 3,630 3,661 3,670 3,678 4,004 4,237 4,467 4,668
Gross Profit $517 $533 $537 $531 $575 $662 $729 $771 $806
Margin% 13.3% 12.8% 12.8% 12.6% 13.5% 14.2% 14.7% 14.7% 14.7%
Less: Selling, General and Administrative Expenses² 345 333 388 381 349 386 400 413 421
Less: Restructuring Expense 17 59 33 39 21 0 0 3 15
Less: Other Operating Expense² 0 0 0 0 27 22 29 29 29
Add: Depreciation & Amortization Expense 178 196 208 212 217 219 236 261 264
Add: Earnings in Non-consolidated JVs Attributable to Powertrain³ 25 35 43 43 46 47 52 52 52
Less: EBITDA in Consolidated JVs Attributable to Minority Interests NA 16 18 18 20 23 26 28 29
Add: Adjustments 15 59 55 61 14 0 0 0 8
Adjusted EBITDA $373 $414 $403 $408 $434 $497 $562 $611 $636 4.0% 9.5%
Growth % 22.5% 11.2% -2.6% — 7.7% 14.5% 13.1% 8.7% 4.0%
Margin% 9.6% 9.9% 9.6% 9.7% 10.2% 10.7% 11.3% 11.7% 11.6%
Add: Pension (and OPEB) Expense 49 44 53 52 60 62 62 57 53
Adjusted EBITDAP $421 $458 $456 $460 $494 $560 $625 $668 $689 4.1% 8.6%
Growth % — 8.8% -0.4% — 8.4% 13.2% 11.6% 6.9% 3.1%
Margin % 10.8% 11.0% 10.9% 11.0% 11.6% 12.0% 12.6% 12.8% 12.6%
Less: Depreciation & Amortization Expense 178 196 208 212 217 219 236 261 264
Adjusted EBITP $243 $262 $248 $248 $277 $341 $389 $407 $425 1.0% 11.3%
Less: Pension (and OPEB) Expense 49 44 53 52 60 62 62 57 53
Adjusted EBIT $195 $218 $195 $196 $217 $278 $326 $350 $372 0.2% 13.7%
Margin % 5.0% 5.2% 4.7% 4.7% 5.1% 6.0% 6.6% 6.7% 6.8%
Adjusted EBITDAP—CapEx $145 $190 $155 $161 $196 $267 $336 $358 $369
Adjusted EBITDA—CapEx $97 $146 $102 $109 $136 $204 $273 $301 $316
Note: Historical financials shown above do not reflect pro forma adjustments for two-stage TRW-Valvetrain acquisition completed in February 2015 and July 2015. Per Company management, 2015
revenue and EBITDA would need to be adjusted by $107 million and $13 million, respectively, to reflect pro forma full-year impact of TRW-Valvetrain acquisition. Per Company management, full year
2015 revenue and EBITDA for TRW-Valvetrain of $524 million and $67 million, respectively, approximates 2013 and 2014 performance of the entity.
1. Net revenue adjusted for intercompany transactions.
2. “Other operating expenses” have been combined with SG&A expenses in the historical periods due to insufficient segment-level detail.
3. The Company has minority investments in 16 joint ventures and other affiliates primarily aimed at developing presence in emerging markets. The above reflects aggregate of Powertrain’s pro rata share of earnings in
such affiliates accounted for under the equity method (historical information is based on net earnings—no information is available on EBITDA).
4. The Company has 50% or greater ownership interests in 21 joint ventures and other affiliates primarily aimed at developing presence in emerging markets and 100% of EBITDA associated with such JVs associated
with Powertrain is consolidated in above financials. The above reflects aggregate of Powertrain’s pro rata allocation of EBITDA in each such entity attributable to minority interests.
5. Total Adjustments
Extraordinary Restructuring Expenses $10 $52 $26 $32 $14 $0 $0 $0 $8
Asset Impairments 5 7 29 29 0 0 0 0 0
Total Adjustments $15 $59 $55 $61 $14 $0 $0 $0 $8
6. Per Company management, Powertrain incurs approximately $5 million to $10 milllion of annual restructuring expenses in the ordinary course to preserve top-line and margin performance.
Accordingly, adjustments for restructuring expense reflect levels above $7.5 million run-rate for Powertrain.
Adjusted EBIT refers to Earnings Before Interest and Taxes, adjusted for certain non-recurring items.
Adjusted EBITDA refers to Earnings Before Interest, Taxes, Depreciation & Amortization, adjusted for certain non-recurring items.
Adjusted EBITDAP refers to Earnings Before Interest, Taxes, Depreciation, Amortization and Pension (and OPEB) Expense, adjusted for certain non-recurring items.
CAGR refers to Compound Annual Growth Rate.
CapEx refers to Capital Expenditures.
NA refers to Not Available.
Source: Piston management, including projections prepared by Piston management, Company Form 10-K filed on February 29, 2016, Company Form 10-Q filed on April 27, 2016.
CONFIDENTIAL—PRELIMINARY DRAFT—SUBJECT TO FURTHER REVIEW 9
|
|
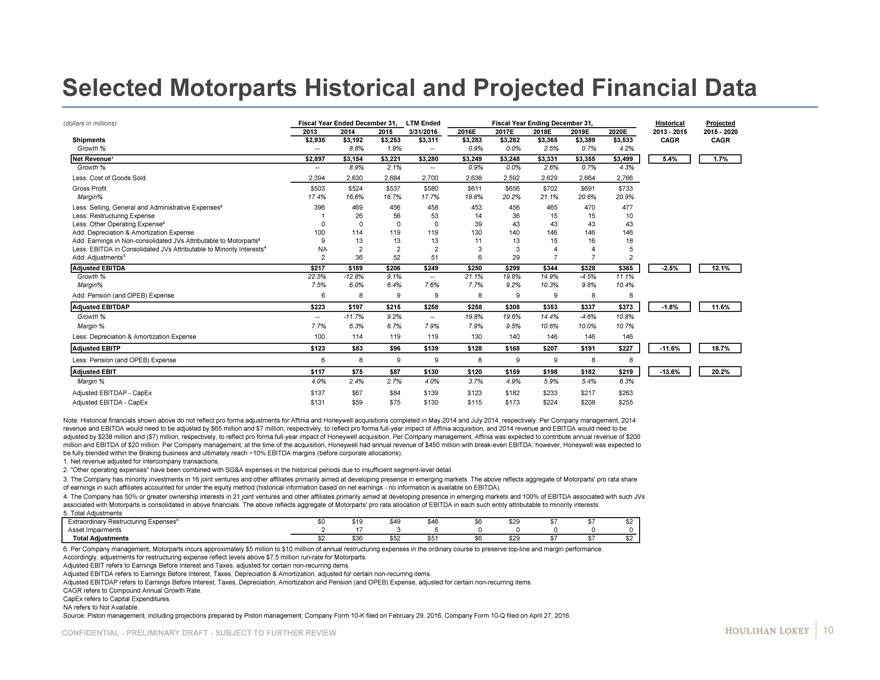
Selected Motorparts Historical and Projected Financial Data
(dollars in millions) Fiscal Year Ended December 31, LTM Ended Fiscal Year Ending December 31, Historical Projected
2013 2014 2015 3/31/2016 2016E 2017E 2018E 2019E 2020E 2013—2015 2015—2020
Shipments $2,935 $3,192 $3,253 $3,311 $3,283 $3,282 $3,365 $3,389 $3,533 CAGR CAGR
Growth % — 8.8% 1.9% — 0.9% 0.0% 2.5% 0.7% 4.2%
Net Revenue¹ $2,897 $3,154 $3,221 $3,280 $3,249 $3,248 $3,331 $3,355 $3,499 5.4% 1.7%
Growth % — 8.9% 2.1% — 0.9% 0.0% 2.6% 0.7% 4.3%
Less: Cost of Goods Sold 2,394 2,630 2,684 2,700 2,638 2,592 2,629 2,664 2,766
Gross Profit $503 $524 $537 $580 $611 $656 $702 $691 $733
Margin% 17.4% 16.6% 16.7% 17.7% 18.8% 20.2% 21.1% 20.6% 20.9%
Less: Selling, General and Administrative Expenses² 396 469 456 458 453 456 465 470 477
Less: Restructuring Expense 1 26 56 53 14 36 15 15 10
Less: Other Operating Expense² 0 0 0 0 39 43 43 43 43
Add: Depreciation & Amortization Expense 100 114 119 119 130 140 146 146 146
Add: Earnings in Non-consolidated JVs Attributable to Motorparts³ 9 13 13 13 11 13 15 16 18
Less: EBITDA in Consolidated JVs Attributable to Minority Interests NA 2 2 2 3 3 4 4 5
Add: Adjustments 2 36 52 51 6 29 7 7 2
Adjusted EBITDA $217 $189 $206 $249 $250 $299 $344 $328 $365 -2.5% 12.1%
Growth % 22.5% -12.8% 9.1% — 21.1% 19.8% 14.9% -4.5% 11.1%
Margin% 7.5% 6.0% 6.4% 7.6% 7.7% 9.2% 10.3% 9.8% 10.4%
Add: Pension (and OPEB) Expense 6 8 9 9 8 9 9 8 8
Adjusted EBITDAP $223 $197 $215 $258 $258 $308 $353 $337 $373 -1.8% 11.6%
Growth % — -11.7% 9.2% — 19.8% 19.6% 14.4% -4.6% 10.8%
Margin % 7.7% 6.3% 6.7% 7.9% 7.9% 9.5% 10.6% 10.0% 10.7%
Less: Depreciation & Amortization Expense 100 114 119 119 130 140 146 146 146
Adjusted EBITP $123 $83 $96 $139 $128 $168 $207 $191 $227 -11.6% 18.7%
Less: Pension (and OPEB) Expense 6 8 9 9 8 9 9 8 8
Adjusted EBIT $117 $75 $87 $130 $120 $159 $198 $182 $219 -13.6% 20.2%
Margin % 4.0% 2.4% 2.7% 4.0% 3.7% 4.9% 5.9% 5.4% 6.3%
Adjusted EBITDAP—CapEx $137 $67 $84 $139 $123 $182 $233 $217 $263
Adjusted EBITDA—CapEx $131 $59 $75 $130 $115 $173 $224 $208 $255
Note: Historical financials shown above do not reflect pro forma adjustments for Affinia and Honeywell acquisitions completed in May 2014 and July 2014, respectively. Per Company management, 2014
revenue and EBITDA would need to be adjusted by $65 million and $7 million, respectively, to reflect pro forma full-year impact of Affinia acquisition, and 2014 revenue and EBITDA would need to be
adjusted by $238 million and ($7) million, respectively, to reflect pro forma full-year impact of Honeywell acquisition. Per Company management, Affinia was expected to contribute annual revenue of $200
million and EBITDA of $20 million. Per Company management, at the time of the acquisition, Honeywell had annual revenue of $450 million with break-even EBITDA; however, Honeywell was expected to
be fully blended within the Braking business and ultimately reach ~10% EBITDA margins (before corporate allocations).
1. Net revenue adjusted for intercompany transactions.
2. “Other operating expenses” have been combined with SG&A expenses in the historical periods due to insufficient segment-level detail.
3. The Company has minority investments in 16 joint ventures and other affiliates primarily aimed at developing presence in emerging markets. The above reflects aggregate of Motorparts’ pro rata share
of earnings in such affiliates accounted for under the equity method (historical information based on net earnings—no information is available on EBITDA).
4. The Company has 50% or greater ownership interests in 21 joint ventures and other affiliates primarily aimed at developing presence in emerging markets and 100% of EBITDA associated with such JVs
associated with Motorparts is consolidated in above financials. The above reflects aggregate of Motorparts’ pro rata allocation of EBITDA in each such entity attributable to minority interests.
5. Total Adjustments
Extraordinary Restructuring Expenses $0 $19 $49 $46 $6 $29 $7 $7 $2
Asset Impairments 2 17 3 5 0 0 0 0 0
Total Adjustments $2 $36 $52 $51 $6 $29 $7 $7 $2
6. Per Company management, Motorparts incurs approximately $5 million to $10 milllion of annual restructuring expenses in the ordinary course to preserve top-line and margin performance.
Accordingly, adjustments for restructuring expense reflect levels above $7.5 million run-rate for Motorparts.
Adjusted EBIT refers to Earnings Before Interest and Taxes, adjusted for certain non-recurring items.
Adjusted EBITDA refers to Earnings Before Interest, Taxes, Depreciation & Amortization, adjusted for certain non-recurring items.
Adjusted EBITDAP refers to Earnings Before Interest, Taxes, Depreciation, Amortization and Pension (and OPEB) Expense, adjusted for certain non-recurring items.
CAGR refers to Compound Annual Growth Rate.
CapEx refers to Capital Expenditures.
NA refers to Not Available.
Source: Piston management, including projections prepared by Piston management, Company Form 10-K filed on February 29, 2016, Company Form 10-Q filed on April 27, 2016.
CONFIDENTIAL—PRELIMINARY DRAFT—SUBJECT TO FURTHER REVIEW 10
|
|
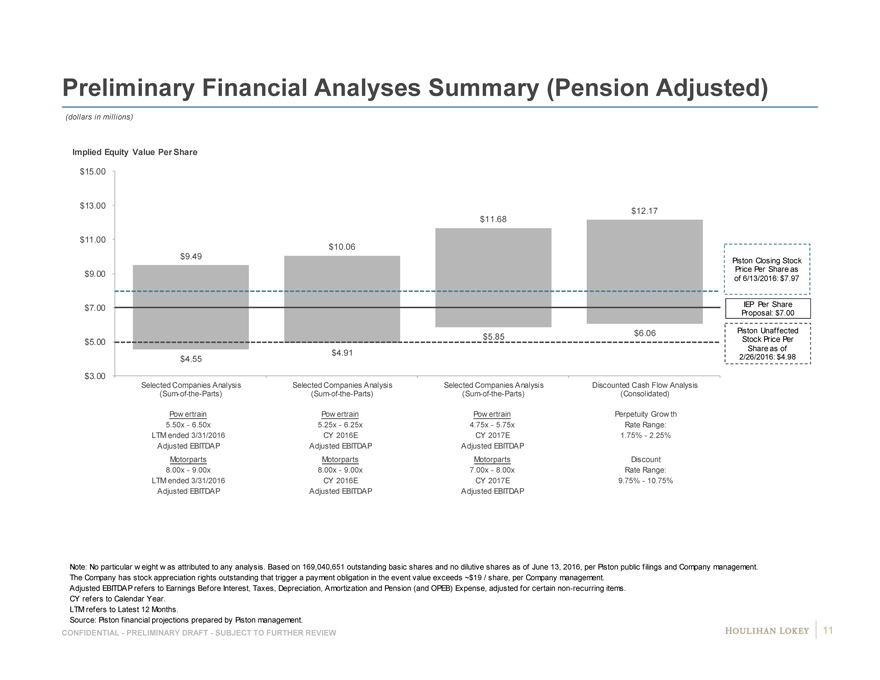
Preliminary Financial Analyses Summary (Pension Adjusted)
(dollars in millions)
Implied Equity Value Per Share
$15.00
$13.00 $12.17
$11.68
$11.00
$10.06
$9.49 Piston Closing Stock
Price Per Share as
$9.00 of 6/13/2016: $7.97
$7.00 IEP Per Share
Proposal: $7.00
$6.06 Piston Unaffected
$5.00 $5.85 Stock Price Per
$4.91 Share as of
$4.55 2/26/2016: $4.98
$3.00
Selected Companies Analysis Selected Companies Analysis Selected Companies Analysis Discounted Cash Flow Analysis
(Sum-of-the-Parts)(Sum-of-the-Parts)(Sum-of-the-Parts)(Consolidated)
Powertrain Powertrain Powertrain Perpetuity Growth
5.50x—6.50x 5.25x—6.25x 4.75x—5.75x Rate Range:
LTM ended 3/31/2016 CY 2016E CY 2017E 1.75%—2.25%
Adjusted EBITDAP Adjusted EBITDAP Adjusted EBITDAP
Motorparts Motorparts Motorparts Discount
8.00x—9.00x 8.00x—9.00x 7.00x—8.00x Rate Range:
LTM ended 3/31/2016 CY 2016E CY 2017E 9.75%—10.75%
Adjusted EBITDAP Adjusted EBITDAP Adjusted EBITDAP
Note: No particular w eight w as attributed to any analysis. Based on 169,040,651 outstanding basic shares and no dilutive shares as of June 13, 2016, per Piston public filings and Company management.
The Company has stock appreciation rights outstanding that trigger a payment obligation in the event value exceeds ~$19 / share, per Company management.
Adjusted EBITDAP refers to Earnings Before Interest, Taxes, Depreciation, Amortization and Pension (and OPEB) Expense, adjusted for certain non-recurring items.
CY refers to Calendar Year.
LTM refers to Latest 12 Months.
Source: Piston financial projections prepared by Piston management.
CONFIDENTIAL—PRELIMINARY DRAFT—SUBJECT TO FURTHER REVIEW 11
|
|
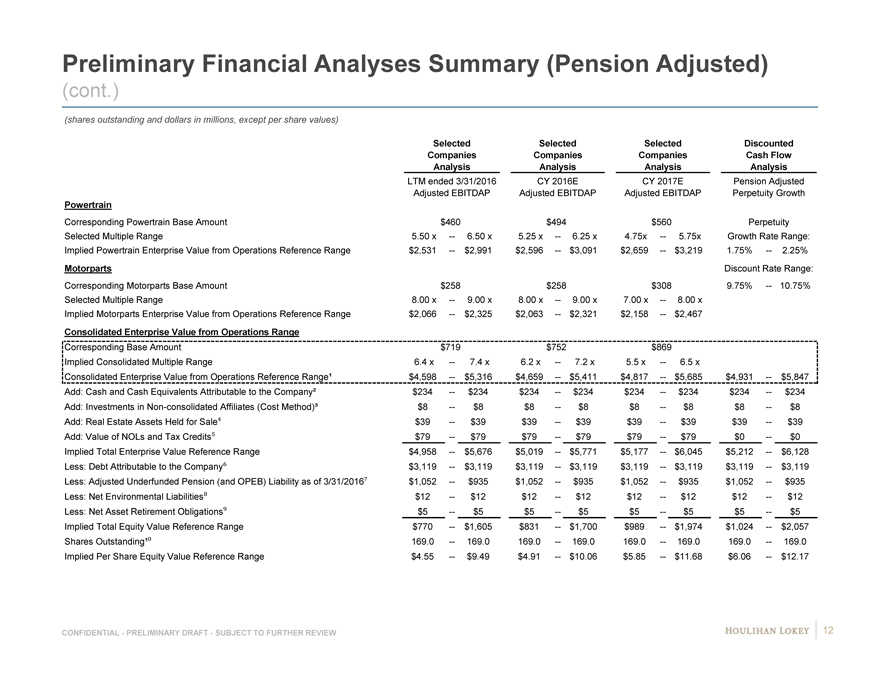
Preliminary Financial Analyses Summary (Pension Adjusted)
(cont.)
(shares outstanding and dollars in millions, except per share values)
Selected Selected Selected Discounted
Companies Companies Companies Cash Flow
Analysis Analysis Analysis Analysis
LTM ended 3/31/2016 CY 2016E CY 2017E Pension Adjusted
Adjusted EBITDAP Adjusted EBITDAP Adjusted EBITDAP Perpetuity Growth
Powertrain Discount Rate Range:
Corresponding Powertrain Base Amount $460 $494 $560 Perpetuity
Selected Multiple Range 5.50 x — 6.50 x 5.25 x — 6.25 x 4.75x — 5.75x Growth Rate Range:
Implied Powertrain Enterprise Value from Operations Reference Range $2,531 — $2,991 $2,596 — $3,091 $2,659 — $3,219 1.75% — 2.25%
Motorparts Discount Rate Range:
Corresponding Motorparts Base Amount $258 $258 $308 9.75% — 10.75%
Selected Multiple Range 8.00 x — 9.00 x 8.00 x — 9.00 x 7.00 x — 8.00 x
Implied Motorparts Enterprise Value from Operations Reference Range $2,066 — $2,325 $2,063 — $2,321 $2,158 — $2,467
Consolidated Enterprise Value from Operations Range
Corresponding Base Amount $719 $752 $869
Implied Consolidated Multiple Range 6.4 x — 7.4 x 6.2 x — 7.2 x 5.5 x — 6.5 x
Consolidated Enterprise Value from Operations Reference Range¹ $4,598 — $5,316 $4,659 — $5,411 $4,817 — $5,685 $4,931 — $5,847
Add: Cash and Cash Equivalents Attributable to the Company² $234 — $234 $234 — $234 $234 — $234 $234 — $234
Add: Investments in Non-consolidated Affiliates (Cost Method)³ $8 — $8 $8 — $8 $8 — $8 $8 — $8
Add: Real Estate Assets Held for Sale $39 — $39 $39 — $39 $39 — $39 $39 — $39
Add: Value of NOLs and Tax Credits $79 — $79 $79 — $79 $79 — $79 $0 — $0
Implied Total Enterprise Value Reference Range $4,958 — $5,676 $5,019 — $5,771 $5,177 — $6,045 $5,212 — $6,128
Less: Debt Attributable to the Company $3,119 — $3,119 $3,119 — $3,119 $3,119 — $3,119 $3,119 — $3,119
Less: Adjusted Underfunded Pension (and OPEB) Liability as of 3/31/2016 $1,052 — $935 $1,052 — $935 $1,052 — $935 $1,052 — $935
Less: Net Environmental Liabilities $12 — $12 $12 — $12 $12 — $12 $12 — $12
Less: Net Asset Retirement Obligations $5 — $5 $5 — $5 $5 — $5 $5 — $5
Implied Total Equity Value Reference Range $770 — $1,605 $831 — $1,700 $989 — $1,974 $1,024 — $2,057
Shares Outstanding¹ 169.0 — 169.0 169.0 — 169.0 169.0 — 169.0 169.0 — 169.0
Implied Per Share Equity Value Reference Range $4.55 — $9.49 $4.91 — $10.06 $5.85 — $11.68 $6.06 — $12.17
CONFIDENTIAL—PRELIMINARY DRAFT—SUBJECT TO FURTHER REVIEW 12
|
|
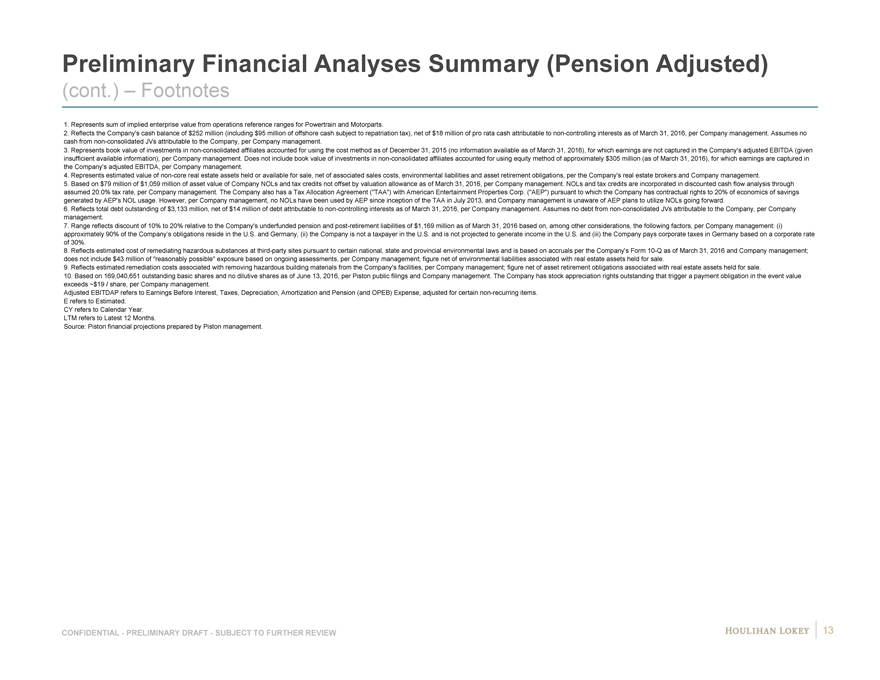
Preliminary Financial Analyses Summary (Pension Adjusted)
(cont.) – Footnotes
1. Represents sum of implied enterprise value from operations reference ranges for Powertrain and Motorparts.
2. Reflects the Company’s cash balance of $252 million (including $95 million of offshore cash subject to repatriation tax), net of $18 million of pro rata cash attributable to non-controlling interests as of March 31, 2016, per Company management. Assumes no
cash from non-consolidated JVs attributable to the Company, per Company management.
3. Represents book value of investments in non-consolidated affiliates accounted for using the cost method as of December 31, 2015 (no information available as of March 31, 2016), for which earnings are not captured in the Company’s adjusted EBITDA (given
insufficient available information), per Company management. Does not include book value of investments in non-consolidated affiliates accounted for using equity method of approximately $305 million (as of March 31, 2016), for which earnings are captured in
the Company’s adjusted EBITDA, per Company management.
4. Represents estimated value of non-core real estate assets held or available for sale, net of associated sales costs, environmental liabilities and asset retirement obligations, per the Company’s real estate brokers and Company management.
5. Based on $79 million of $1,059 million of asset value of Company NOLs and tax credits not offset by valuation allowance as of March 31, 2016, per Company management. NOLs and tax credits are incorporated in discounted cash flow analysis through
assumed 20.0% tax rate, per Company management. The Company also has a Tax Allocation Agreement (“TAA”) with American Entertainment Properties Corp. (“AEP”) pursuant to which the Company has contractual rights to 20% of economics of savings
generated by AEP’s NOL usage. However, per Company management, no NOLs have been used by AEP since inception of the TAA in July 2013, and Company management is unaware of AEP plans to utilize NOLs going forward.
6. Reflects total debt outstanding of $3,133 million, net of $14 million of debt attributable to non-controlling interests as of March 31, 2016, per Company management. Assumes no debt from non-consolidated JVs attributable to the Company, per Company
management.
7. Range reflects discount of 10% to 20% relative to the Company’s underfunded pension and post-retirement liabilities of $1,169 million as of March 31, 2016 based on, among other considerations, the following factors, per Company management: (i)
approximately 90% of the Company’s obligations reside in the U.S. and Germany, (ii) the Company is not a taxpayer in the U.S. and is not projected to generate income in the U.S. and (iii) the Company pays corporate taxes in Germany based on a corporate rate
of 30%.
8. Reflects estimated cost of remediating hazardous substances at third-party sites pursuant to certain national, state and provincial environmental laws and is based on accruals per the Company’s Form 10-Q as of March 31, 2016 and Company management;
does not include $43 million of “reasonably possible” exposure based on ongoing assessments, per Company management; figure net of environmental liabilities associated with real estate assets held for sale.
9. Reflects estimated remediation costs associated with removing hazardous building materials from the Company’s facilities, per Company management; figure net of asset retirement obligations associated with real estate assets held for sale.
10. Based on 169,040,651 outstanding basic shares and no dilutive shares as of June 13, 2016, per Piston public filings and Company management. The Company has stock appreciation rights outstanding that trigger a payment obligation in the event value
exceeds ~$19 / share, per Company management.
Adjusted EBITDAP refers to Earnings Before Interest, Taxes, Depreciation, Amortization and Pension (and OPEB) Expense, adjusted for certain non-recurring items.
E refers to Estimated.
CY refers to Calendar Year.
LTM refers to Latest 12 Months.
Source: Piston financial projections prepared by Piston management.
CONFIDENTIAL—PRELIMINARY DRAFT—SUBJECT TO FURTHER REVIEW 13
|
|
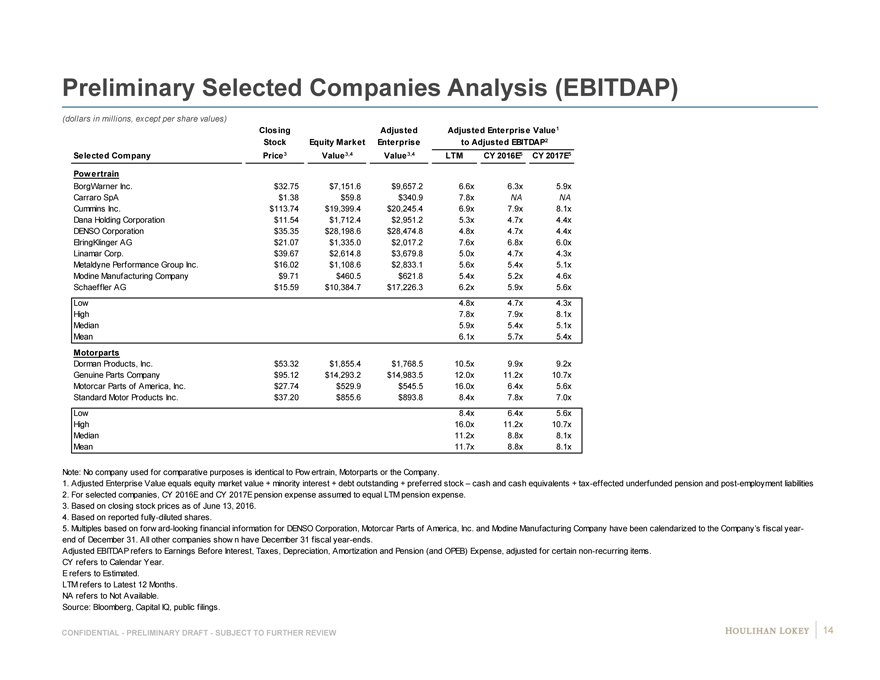
Preliminary Selected Companies Analysis (EBITDAP)
(dollars in millions, except per share values)
Closing Adjusted Adjusted Enterprise Value 1
Stock Equity Market Enterprise to Adjusted EBITDAP2
Selected Company Price 3 Value3,4 Value 3,4 LTM CY 2016E5 CY 2017E5
Powertrain
BorgWarner Inc. $32.75 $7,151.6 $9,657.2 6.6x 6.3x 5.9x 6 9
Carraro SpA $1.38 $59.8 $340.9 7.8x NA NA N NA
Cummins Inc. $113.74 $19,399.4 $20,245.4 6.9x 7.9x 8.1x 8 #
Dana Holding Corporation $11.54 $1,712.4 $2,951.2 5.3x 4.7x 4.4x 4 8
DENSO Corporation $35.35 $28,198.6 $28,474.8 4.8x 4.7x 4.4x 4 8
ElringKlinger AG $21.07 $1,335.0 $2,017.2 7.6x 6.8x 6.0x 6 #
Linamar Corp. $39.67 $2,614.8 $3,679.8 5.0x 4.7x 4.3x 4 #
Metaldyne Performance Group Inc. $16.02 $1,108.6 $2,833.1 5.6x 5.4x 5.1x 5 8
Modine Manufacturing Company $9.71 $460.5 $621.8 5.4x 5.2x 4.6x 5 NA
Schaeffler AG $15.59 $10,384.7 $17,226.3 6.2x 5.9x 5.6x 6 9
Low 4.8x 4.7x 4.3x
High 7.8x 7.9x 8.1x
Median 5.9x 5.4x 5.1x
Mean 6.1x 5.7x 5.4x
Motorparts
Dorman Products, Inc. $53.32 $1,855.4 $1,768.5 10.5x 9.9x 9.2x 9 #
Genuine Parts Company $95.12 $14,293.2 $14,983.5 12.0x 11.2x 10.7x # #
Motorcar Parts of America, Inc. $27.74 $529.9 $545.5 16.0x 6.4x 5.6x 6 6
Standard Motor Products Inc. $37.20 $855.6 $893.8 8.4x 7.8x 7.0x 7 NA
Low 8.4x 6.4x 5.6x
High 16.0x 11.2x 10.7x
Median 11.2x 8.8x 8.1x
Mean 11.7x 8.8x 8.1x
Note: No company used for comparative purposes is identical to Pow ertrain, Motorparts or the Company.
1. Adjusted Enterprise Value equals equity market value + minority interest + debt outstanding + preferred stock – cash and cash equivalents + tax-effected underfunded pension and post-employment liabilities
2. For selected companies, CY 2016E and CY 2017E pension expense assumed to equal LTM pension expense.
3. Based on closing stock prices as of June 13, 2016.
4. Based on reported fully-diluted shares.
5. Multiples based on forw ard-looking financial information for DENSO Corporation, Motorcar Parts of America, Inc. and Modine Manufacturing Company have been calendarized to the Company’s fiscal year-
end of December 31. All other companies show n have December 31 fiscal year-ends.
Adjusted EBITDAP refers to Earnings Before Interest, Taxes, Depreciation, Amortization and Pension (and OPEB) Expense, adjusted for certain non-recurring items.
CY refers to Calendar Year.
E refers to Estimated.
LTM refers to Latest 12 Months.
NA refers to Not Available.
Source: Bloomberg, Capital IQ, public filings.
CONFIDENTIAL—PRELIMINARY DRAFT—SUBJECT TO FURTHER REVIEW 14
|
|
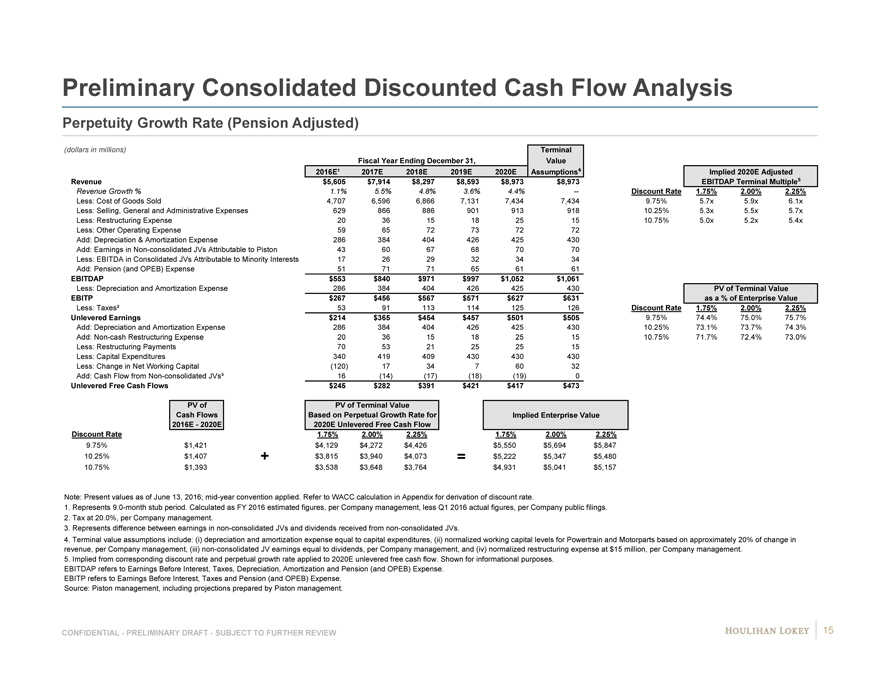
Preliminary Consolidated Discounted Cash Flow Analysis
Perpetuity Growth Rate (Pension Adjusted)
(dollars in millions) Terminal
Fiscal Year Ending December 31, Value
2016E¹ 2017E 2018E 2019E 2020E Assumptions Implied 2020E Adjusted
Revenue $5,605 $7,914 $8,297 $8,593 $8,973 $8,973 EBITDAP Terminal Multiple
Revenue Growth % 1.1% 5.5% 4.8% 3.6% 4.4% — Discount Rate 1.75% 2.00% 2.25%
Less: Cost of Goods Sold 4,707 6,596 6,866 7,131 7,434 7,434 9.75% 5.7x 5.9x 6.1x
Less: Selling, General and Administrative Expenses 629 866 886 901 913 918 10.25% 5.3x 5.5x 5.7x
Less: Restructuring Expense 20 36 15 18 25 15 10.75% 5.0x 5.2x 5.4x
Less: Other Operating Expense 59 65 72 73 72 72
Add: Depreciation & Amortization Expense 286 384 404 426 425 430
Add: Earnings in Non-consolidated JVs Attributable to Piston 43 60 67 68 70 70
Less: EBITDA in Consolidated JVs Attributable to Minority Interests 17 26 29 32 34 34
Add: Pension (and OPEB) Expense 51 71 71 65 61 61
EBITDAP $553 $840 $971 $997 $1,052 $1,061
Less: Depreciation and Amortization Expense 286 384 404 426 425 430 PV of Terminal Value
EBITP $267 $456 $567 $571 $627 $631 as a % of Enterprise Value
Less: Taxes² 53 91 113 114 125 126 Discount Rate 1.75% 2.00% 2.25%
Unlevered Earnings $214 $365 $454 $457 $501 $505 9.75% 74.4% 75.0% 75.7%
Add: Depreciation and Amortization Expense 286 384 404 426 425 430 10.25% 73.1% 73.7% 74.3%
Add: Non-cash Restructuring Expense 20 36 15 18 25 15 10.75% 71.7% 72.4% 73.0%
Less: Restructuring Payments 70 53 21 25 25 15
Less: Capital Expenditures 340 419 409 430 430 430
Less: Change in Net Working Capital (120) 17 34 7 60 32
Add: Cash Flow from Non-consolidated JVs³ 16 (14) (17) (18) (19) 0
Unlevered Free Cash Flows $245 $282 $391 $421 $417 $473
PV of PV of Terminal Value
Cash Flows Based on Perpetual Growth Rate for Implied Enterprise Value
2016E—2020E 2020E Unlevered Free Cash Flow
Discount Rate 1.75% 2.00% 2.25% 1.75% 2.00% 2.25%
9.75% 0.098 $1,421 $4,129 $4,272 $4,426 $5,550 $5,694 $5,847
10.25% 0.103 $1,407 + $3,815 $3,940 $4,073 = $5,222 $5,347 $5,480
10.75% 0.108 $1,393 $3,538 $3,648 $3,764 $4,931 $5,041 $5,157
Note: Present values as of June 13, 2016; mid-year convention applied. Refer to WACC calculation in Appendix for derivation of discount rate.
1. Represents 9.0-month stub period. Calculated as FY 2016 estimated figures, per Company management, less Q1 2016 actual figures, per Company public filings.
2. Tax at 20.0%, per Company management.
3. Represents difference between earnings in non-consolidated JVs and dividends received from non-consolidated JVs.
4. Terminal value assumptions include: (i) depreciation and amortization expense equal to capital expenditures, (ii) normalized working capital levels for Powertrain and Motorparts based on approximately 20% of change in
revenue, per Company management, (iii) non-consolidated JV earnings equal to dividends, per Company management, and (iv) normalized restructuring expense at $15 million, per Company management.
5. Implied from corresponding discount rate and perpetual growth rate applied to 2020E unlevered free cash flow. Shown for informational purposes.
EBITDAP refers to Earnings Before Interest, Taxes, Depreciation, Amortization and Pension (and OPEB) Expense.
EBITP refers to Earnings Before Interest, Taxes and Pension (and OPEB) Expense.
Source: Piston management, including projections prepared by Piston management.
CONFIDENTIAL—PRELIMINARY DRAFT—SUBJECT TO FURTHER REVIEW 15
|
|
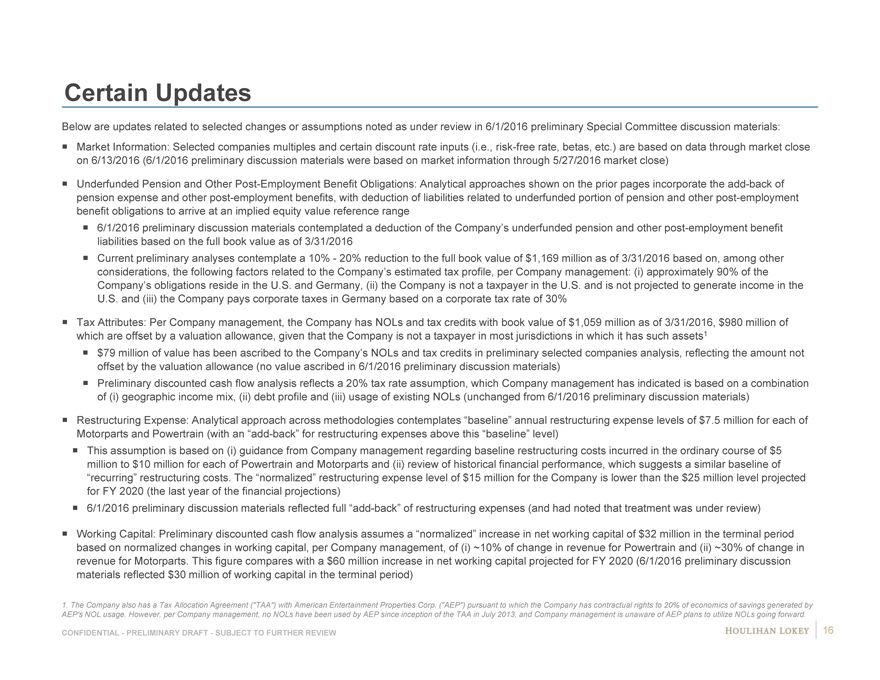
Certain Updates
Below are updates related to selected changes or assumptions noted as under review in 6/1/2016 preliminary Special Committee discussion materials: Market Information: Selected companies multiples and certain discount rate inputs (i.e., risk-free rate, betas, etc.) are based on data through market close on 6/13/2016 (6/1/2016 preliminary discussion materials were based on market information through 5/27/2016 market close)
Underfunded Pension and Other Post-Employment Benefit Obligations: Analytical approaches shown on the prior pages incorporate the add-back of pension expense and other post-employment benefits, with deduction of liabilities related to underfunded portion of pension and other post-employment benefit obligations to arrive at an implied equity value reference range 6/1/2016 preliminary discussion materials contemplated a deduction of the Company’s underfunded pension and other post-employment benefit liabilities based on the full book value as of 3/31/2016 Current preliminary analyses contemplate a 10%—20% reduction to the full book value of $1,169 million as of 3/31/2016 based on, among other considerations, the following factors related to the Company’s estimated tax profile, per Company management: (i) approximately 90% of the Company’s obligations reside in the U.S. and Germany, (ii) the Company is not a taxpayer in the U.S. and is not projected to generate income in the U.S. and (iii) the Company pays corporate taxes in Germany based on a corporate tax rate of 30%
Tax Attributes: Per Company management, the Company has NOLs and tax credits with book value of $1,059 million as of 3/31/2016, $980 million of which are offset by a valuation allowance, given that the Company is not a taxpayer in most jurisdictions in which it has such assets1 $79 million of value has been ascribed to the Company’s NOLs and tax credits in preliminary selected companies analysis, reflecting the amount not offset by the valuation allowance (no value ascribed in 6/1/2016 preliminary discussion materials) Preliminary discounted cash flow analysis reflects a 20% tax rate assumption, which Company management has indicated is based on a combination of (i) geographic income mix, (ii) debt profile and (iii) usage of existing NOLs (unchanged from 6/1/2016 preliminary discussion materials)
Restructuring Expense: Analytical approach across methodologies contemplates “baseline” annual restructuring expense levels of $7.5 million for each of Motorparts and Powertrain (with an “add-back” for restructuring expenses above this “baseline” level) This assumption is based on (i) guidance from Company management regarding baseline restructuring costs incurred in the ordinary course of $5 million to $10 million for each of Powertrain and Motorparts and (ii) review of historical financial performance, which suggests a similar baseline of “recurring” restructuring costs. The “normalized” restructuring expense level of $15 million for the Company is lower than the $25 million level projected for FY 2020 (the last year of the financial projections) 6/1/2016 preliminary discussion materials reflected full “add-back” of restructuring expenses (and had noted that treatment was under review)
Working Capital: Preliminary discounted cash flow analysis assumes a “normalized” increase in net working capital of $32 million in the terminal period based on normalized changes in working capital, per Company management, of (i) ~10% of change in revenue for Powertrain and (ii) ~30% of change in revenue for Motorparts. This figure compares with a $60 million increase in net working capital projected for FY 2020 (6/1/2016 preliminary discussion materials reflected $30 million of working capital in the terminal period)
1. The Company also has a Tax Allocation Agreement (“TAA”) with American Entertainment Properties Corp. (“AEP”) pursuant to which the Company has contractual rights to 20% of economics of savings generated by AEP’s NOL usage. However, per Company management, no NOLs have been used by AEP since inception of the TAA in July 2013, and Company management is unaware of AEP plans to utilize NOLs going forward.
CONFIDENTIAL—PRELIMINARY DRAFT—SUBJECT TO FURTHER REVIEW 16
|
|
Page
1. Selected Public Market Observations 3
2. Preliminary Financial Analyses 7
3. Appendix 17 Cost of Capital Considerations 18 Benchmarking 24 Company Financial Performance Observations 28 Premiums Paid Observations 32 Illustrative Preliminary Financial Analyses (EBITDA) 35 Selected Excerpt from June 1, 2016 Preliminary Discussion Materials: 47 Items Subject to Further Review Selected Excerpts from May 11, 2016 / June 1, 2016 Preliminary 49 Discussion Materials: Illustrative Sensitivities
4. Disclaimer 53
|
|
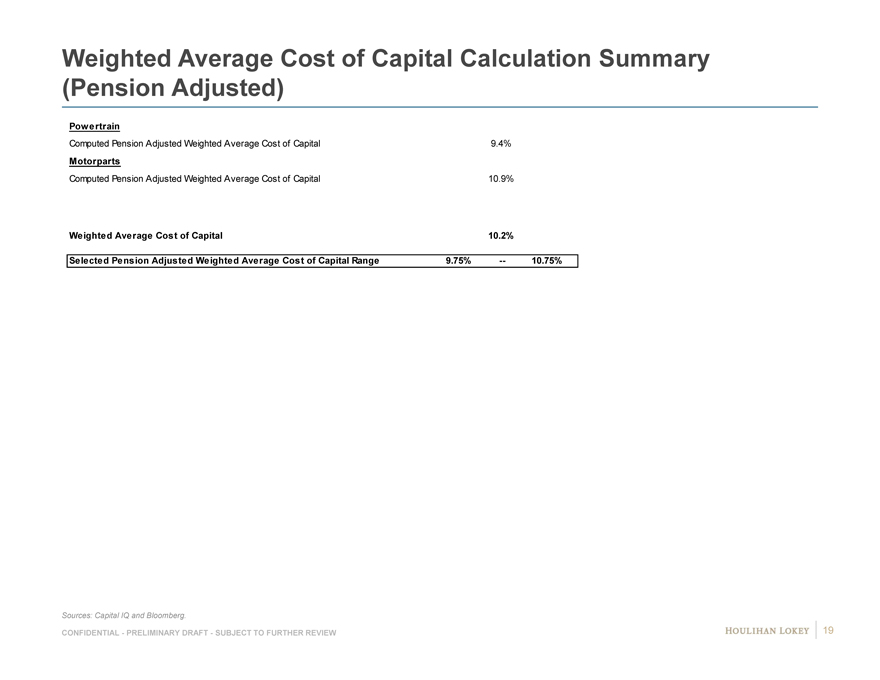
Weighted Average Cost of Capital Calculation Summary (Pension Adjusted)
Powertrain
Computed Pension Adjusted Weighted Average Cost of Capital 9.4%
Motorparts
Computed Pension Adjusted Weighted Average Cost of Capital 10.9%
Weighted Average Cost of Capital 10.2%
Selected Pension Adjusted Weighted Average Cost of Capital Range 9.75% — 10.75%
Sources: Capital IQ and Bloomberg.
CONFIDENTIAL—PRELIMINARY DRAFT—SUBJECT TO FURTHER REVIEW 19
|
|
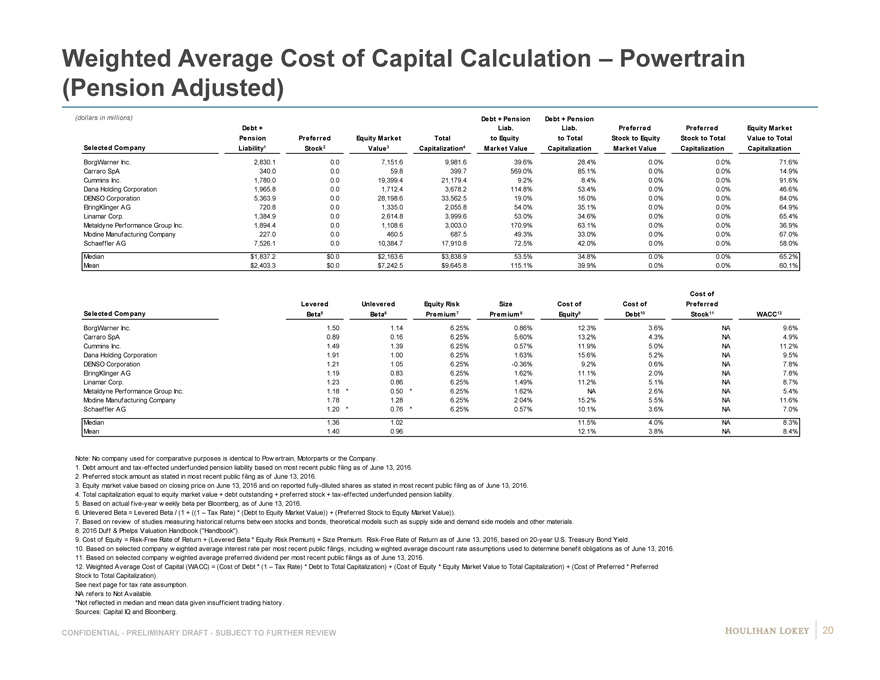
Weighted Average Cost of Capital Calculation – Powertrain
(Pension Adjusted)
(dollars in millions) Debt + Pension Debt + Pension
Debt + Liab. Liab. Preferred Preferred Equity Market
Pension Preferred Equity Market Total to Equity to Total Stock to Equity Stock to Total Value to Total
Selected Company Liability1 Stock2 Value3 Capitalization4 Market Value Capitalization Market Value Capitalization Capitalization
BorgWarner Inc. 2,830.1 # 0.0 # 7,151.6 # 9,981.6 # 39.6% # 28.4% # 0.0% # 0.0% # 71.6%
Carraro SpA 340.0 # 0.0 # 59.8 # 399.7 # 569.0% # 85.1% # 0.0% # 0.0% # 14.9%
Cummins Inc. 1,780.0 # 0.0 # 19,399.4 # 21,179.4 # 9.2% # 8.4% # 0.0% # 0.0% # 91.6%
Dana Holding Corporation 1,965.8 # 0.0 # 1,712.4 # 3,678.2 # 114.8% # 53.4% # 0.0% # 0.0% # 46.6%
DENSO Corporation 5,363.9 # 0.0 # 28,198.6 # 33,562.5 # 19.0% # 16.0% # 0.0% # 0.0% # 84.0%
ElringKlinger AG 720.8 # 0.0 # 1,335.0 # 2,055.8 # 54.0% # 35.1% # 0.0% # 0.0% # 64.9%
Linamar Corp. 1,384.9 # 0.0 # 2,614.8 # 3,999.6 # 53.0% # 34.6% # 0.0% # 0.0% # 65.4%
Metaldyne Performance Group Inc. 1,894.4 # 0.0 # 1,108.6 # 3,003.0 # 170.9% # 63.1% # 0.0% # 0.0% # 36.9%
Modine Manufacturing Company 227.0 # 0.0 # 460.5 # 687.5 # 49.3% # 33.0% # 0.0% # 0.0% # 67.0%
Schaeffler AG 7,526.1 # 0.0 # 10,384.7 # 17,910.8 # 72.5% # 42.0% # 0.0% # 0.0% # 58.0%
Median $ 1,837.2 $ 0.0 $ 2,163.6 $ 3,838.9 53.5% 34.8% 0.0% 0.0% 65.2%
Mean $ 2,403.3 $ 0.0 $ 7,242.5 $ 9,645.8 115.1% 39.9% 0.0% 0.0% 60.1%
Cost of
Levered Unlevered Equity Risk Size Cost of Cost of Preferred
Selected Company Beta5 Beta6 Premium 7 Premium 8 Equity9 Debt10 Stock11 WACC12
BorgWarner Inc. 1.50 # 1.14 # 6.25% 0.86% 12.3% # 3.6% # NA # 9.6%
Carraro SpA 0.89 # 0.16 # 6.25% 5.60% 13.2% # 4.3% # NA # 4.9%
Cummins Inc. 1.49 # 1.39 # 6.25% 0.57% 11.9% # 5.0% # NA # 11.2%
Dana Holding Corporation 1.91 # 1.00 # 6.25% 1.63% 15.6% # 5.2% # NA # 9.5%
DENSO Corporation 1.21 # 1.05 # 6.25% -0.36% 9.2% # 0.6% # NA # 7.8%
ElringKlinger AG 1.19 # 0.83 # 6.25% 1.62% 11.1% # 2.0% # NA # 7.8%
Linamar Corp. 1.23 # 0.86 # 6.25% 1.49% 11.2% # 5.1% # NA # 8.7%
Metaldyne Performance Group Inc. 1.18* 0.50* 6.25% 1.62% NA # 2.6% # NA # 5.4%
Modine Manufacturing Company 1.78 # 1.28 # 6.25% 2.04% 15.2% # 5.5% # NA # 11.6%
Schaeffler AG 1.20* 0.76* 6.25% 0.57% 10.1% # 3.6% # NA # 7.0%
Median 1.36 1.02 11.5% 4.0% NA 8.3%
Mean 1.40 0.96 12.1% 3.8% NA 8.4%
Note: No company used for comparative purposes is identical to Pow ertrain, Motorparts or the Company.
1. Debt amount and tax-effected underfunded pension liability based on most recent public filing as of June 13, 2016.
2. Preferred stock amount as stated in most recent public filing as of June 13, 2016.
3. Equity market value based on closing price on June 13, 2016 and on reported fully-diluted shares as stated in most recent public filing as of June 13, 2016.
4. Total capitalization equal to equity market value + debt outstanding + preferred stock + tax-effected underfunded pension liability.
5. Based on actual five-year w eekly beta per Bloomberg, as of June 13, 2016.
6. Unlevered Beta = Levered Beta / (1 + ((1 – Tax Rate) * (Debt to Equity Market Value)) + (Preferred Stock to Equity Market Value)).
7. Based on review of studies measuring historical returns betw een stocks and bonds, theoretical models such as supply side and demand side models and other materials.
8. 2016 Duff & Phelps Valuation Handbook (“Handbook”).
9. Cost of Equity = Risk-Free Rate of Return + (Levered Beta * Equity Risk Premium) + Size Premium. Risk-Free Rate of Return as of June 13, 2016, based on 20-year U.S. Treasury Bond Yield.
10. Based on selected company w eighted average interest rate per most recent public filings, including w eighted average discount rate assumptions used to determine benefit obligations as of June 13, 2016.
11. Based on selected company w eighted average preferred dividend per most recent public filings as of June 13, 2016.
12. Weighted Average Cost of Capital (WACC) = (Cost of Debt * (1 – Tax Rate) * Debt to Total Capitalization) + (Cost of Equity * Equity Market Value to Total Capitalization) + (Cost of Preferred * Preferred
Stock to Total Capitalization).
See next page for tax rate assumption.
NA refers to Not Available.
*Not reflected in median and mean data given insufficient trading history.
Sources: Capital IQ and Bloomberg.
CONFIDENTIAL—PRELIMINARY DRAFT—SUBJECT TO FURTHER REVIEW
20
|
|
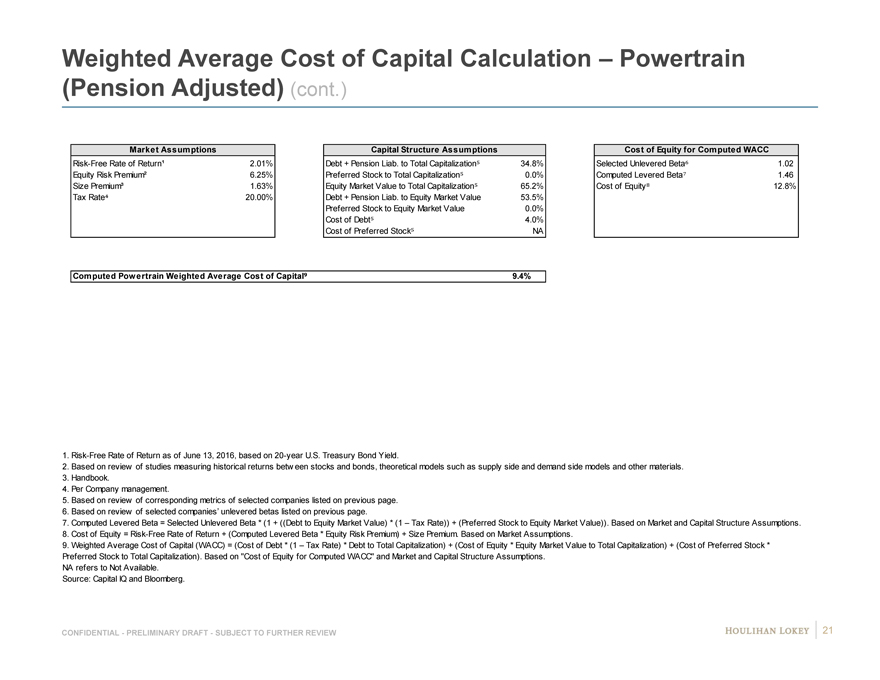
Weighted Average Cost of Capital Calculation – Powertrain
(Pension Adjusted) (cont.)
Market Assumptions Capital Structure Assumptions Cost of Equity for Computed WACC
Risk-Free Rate of Return¹ 2.01% Debt + Pension Liab. to Total Capitalization 34.8% Selected Unlevered Beta 1.02
Equity Risk Premium² 6.25% Preferred Stock to Total Capitalization 0.0% Computed Levered Beta 1.46
Size Premium³ 1.63% Equity Market Value to Total Capitalization 65.2% Cost of Equity 12.8%
Tax Rate 20.00% Debt + Pension Liab. to Equity Market Value 53.5%
Preferred Stock to Equity Market Value 0.0%
Cost of Debt 4.0%
Cost of Preferred Stock NA
Computed Powertrain Weighted Average Cost of Capital 9.4%
1. Risk-Free Rate of Return as of June 13, 2016, based on 20-year U.S. Treasury Bond Yield.
2. Based on review of studies measuring historical returns betw een stocks and bonds, theoretical models such as supply side and demand side models and other materials.
3. Handbook.
4. Per Company management.
5. Based on review of corresponding metrics of selected companies listed on previous page.
6. Based on review of selected companies’ unlevered betas listed on previous page.
7. Computed Levered Beta = Selected Unlevered Beta * (1 + ((Debt to Equity Market Value) * (1 – Tax Rate)) + (Preferred Stock to Equity Market Value)). Based on Market and Capital Structure Assumptions.
8. Cost of Equity = Risk-Free Rate of Return + (Computed Levered Beta * Equity Risk Premium) + Size Premium. Based on Market Assumptions.
9. Weighted Average Cost of Capital (WACC) = (Cost of Debt * (1 – Tax Rate) * Debt to Total Capitalization) + (Cost of Equity * Equity Market Value to Total Capitalization) + (Cost of Preferred Stock *
Preferred Stock to Total Capitalization). Based on “Cost of Equity for Computed WACC” and Market and Capital Structure Assumptions.
NA refers to Not Available.
Source: Capital IQ and Bloomberg.
CONFIDENTIAL—PRELIMINARY DRAFT—SUBJECT TO FURTHER REVIEW 21
|
|
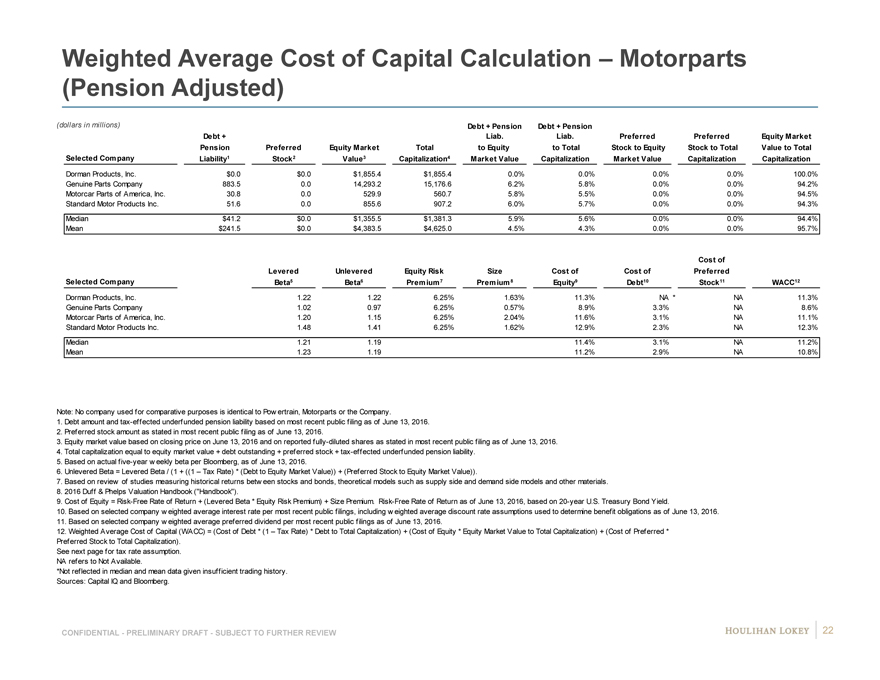
Weighted Average Cost of Capital Calculation – Motorparts
(Pension Adjusted)
(dollars in millions) Debt + Pension Debt + Pension
Debt + Liab. Liab. Preferred Preferred Equity Market
Pension Preferred Equity Market Total to Equity to Total Stock to Equity Stock to Total Value to Total
Selected Company Liability1 Stock2 Value3 Capitalization4 Market Value Capitalization Market Value Capitalization Capitalization
Dorman Products, Inc. $0.0 # $0.0 # $1,855.4 # $1,855.4 # 0.0% # 0.0% # 0.0% # 0.0% # 100.0%
Genuine Parts Company 883.5 # 0.0 # 14,293.2 # 15,176.6 # 6.2% # 5.8% # 0.0% # 0.0% # 94.2%
Motorcar Parts of America, Inc. 30.8 # 0.0 # 529.9 # 560.7 # 5.8% # 5.5% # 0.0% # 0.0% # 94.5%
Standard Motor Products Inc. 51.6 # 0.0 # 855.6 # 907.2 # 6.0% # 5.7% # 0.0% # 0.0% # 94.3%
Median $41.2 $0.0 $1,355.5 $1,381.3 5.9% 5.6% 0.0% 0.0% 94.4%
Mean $241.5 $0.0 $4,383.5 $4,625.0 4.5% 4.3% 0.0% 0.0% 95.7%
Cost of
Levered Unlevered Equity Risk Size Cost of Cost of Preferred
Selected Company Beta5 Beta6 Premium 7 Premium 8 Equity9 Debt10 Stock11 WACC12
Dorman Products, Inc. 1.22 # 1.22 # 6.25% 1.63% 11.3% # NA * NA # 11.3%
Genuine Parts Company 1.02 # 0.97 # 6.25% 0.57% 8.9% # 3.3% # NA # 8.6%
Motorcar Parts of America, Inc. 1.20 # 1.15 # 6.25% 2.04% 11.6% # 3.1% # NA # 11.1%
Standard Motor Products Inc. 1.48 # 1.41 # 6.25% 1.62% 12.9% # 2.3% # NA # 12.3%
Median 1.21 1.19 11.4% 3.1% NA 11.2%
Mean 1.23 1.19 11.2% 2.9% NA 10.8%
Note: No company used for comparative purposes is identical to Pow ertrain, Motorparts or the Company.
1. Debt amount and tax-effected underfunded pension liability based on most recent public filing as of June 13, 2016.
2. Preferred stock amount as stated in most recent public filing as of June 13, 2016.
3. Equity market value based on closing price on June 13, 2016 and on reported fully-diluted shares as stated in most recent public filing as of June 13, 2016.
4. Total capitalization equal to equity market value + debt outstanding + preferred stock + tax-effected underfunded pension liability.
5. Based on actual five-year w eekly beta per Bloomberg, as of June 13, 2016.
6. Unlevered Beta = Levered Beta / (1 + ((1 – Tax Rate) * (Debt to Equity Market Value)) + (Preferred Stock to Equity Market Value)).
7. Based on review of studies measuring historical returns betw een stocks and bonds, theoretical models such as supply side and demand side models and other materials.
8. 2016 Duff & Phelps Valuation Handbook (“Handbook”).
9. Cost of Equity = Risk-Free Rate of Return + (Levered Beta * Equity Risk Premium) + Size Premium. Risk-Free Rate of Return as of June 13, 2016, based on 20-year U.S. Treasury Bond Yield.
10. Based on selected company w eighted average interest rate per most recent public filings, including w eighted average discount rate assumptions used to determine benefit obligations as of June 13, 2016.
11. Based on selected company w eighted average preferred dividend per most recent public filings as of June 13, 2016.
12. Weighted Average Cost of Capital (WACC) = (Cost of Debt * (1 – Tax Rate) * Debt to Total Capitalization) + (Cost of Equity * Equity Market Value to Total Capitalization) + (Cost of Preferred *
Preferred Stock to Total Capitalization).
See next page for tax rate assumption.
NA refers to Not Available.
*Not reflected in median and mean data given insufficient trading history.
Sources: Capital IQ and Bloomberg.
CONFIDENTIAL—PRELIMINARY DRAFT—SUBJECT TO FURTHER REVIEW 22
|
|

Weighted Average Cost of Capital Calculation – Motorparts
(Pension Adjusted) (cont.)
Market Assumptions Capital Structure Assumptions Cost of Equity for Computed WACC
Risk-Free Rate of Return¹ 2.01% Debt + Pension Liab. to Total Capitalization 5.6% Selected Unlevered Beta 1.19
Equity Risk Premium² 6.25% Preferred Stock to Total Capitalization 0.0% Computed Levered Beta 1.24
Size Premium³ 1.63% Equity Market Value to Total Capitalization 94.4% Cost of Equity 11.4%
Tax Rate 20.00% Debt + Pension Liab. to Equity Market Value 5.9%
Preferred Stock to Equity Market Value 0.0%
Cost of Debt 3.1%
Cost of Preferred Stock NA
Computed Motorparts Weighted Average Cost of Capital 10.9%
1. Risk-Free Rate of Return as of June 13, 2016, based on 20-year U.S. Treasury Bond Yield.
2. Based on review of studies measuring historical returns betw een stocks and bonds, theoretical models such as supply side and demand side models and other materials.
3. Handbook.
4. Per Company management.
5. Based on review of corresponding metrics of selected companies listed on previous page.
6. Based on review of selected companies’ unlevered betas listed on previous page.
7. Computed Levered Beta = Selected Unlevered Beta * (1 + ((Debt to Equity Market Value) * (1 – Tax Rate)) + (Preferred Stock to Equity Market Value)). Based on Market and Capital Structure Assumptions.
8. Cost of Equity = Risk-Free Rate of Return + (Computed Levered Beta * Equity Risk Premium) + Size Premium. Based on Market Assumptions.
9. Weighted Average Cost of Capital (WACC) = (Cost of Debt * (1 – Tax Rate) * Debt to Total Capitalization) + (Cost of Equity * Equity Market Value to Total Capitalization) + (Cost of Preferred Stock *
Preferred Stock to Total Capitalization). Based on “Cost of Equity for Computed WACC” and Market and Capital Structure Assumptions.
NA refers to Not Available.
Source: Capital IQ and Bloomberg.
CONFIDENTIAL—PRELIMINARY DRAFT—SUBJECT TO FURTHER REVIEW 23
|
|
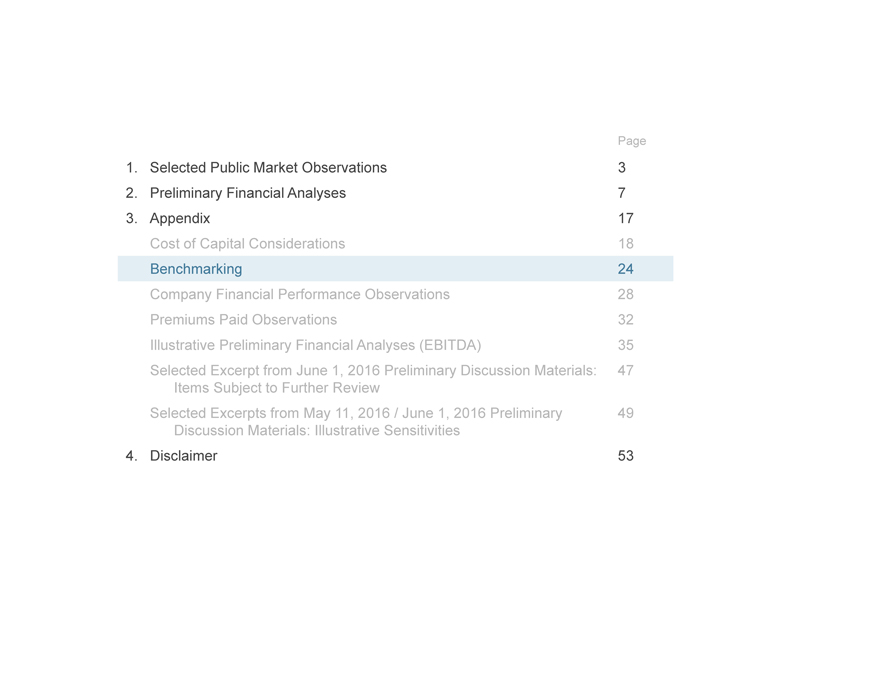
Page
1. Selected Public Market Observations 3
2. Preliminary Financial Analyses 7
3. Appendix 17 Cost of Capital Considerations 18 Benchmarking 24 Company Financial Performance Observations 28 Premiums Paid Observations 32 Illustrative Preliminary Financial Analyses (EBITDA) 35 Selected Excerpt from June 1, 2016 Preliminary Discussion Materials: 47 Items Subject to Further Review Selected Excerpts from May 11, 2016 / June 1, 2016 Preliminary 49 Discussion Materials: Illustrative Sensitivities
4. Disclaimer 53
|
|
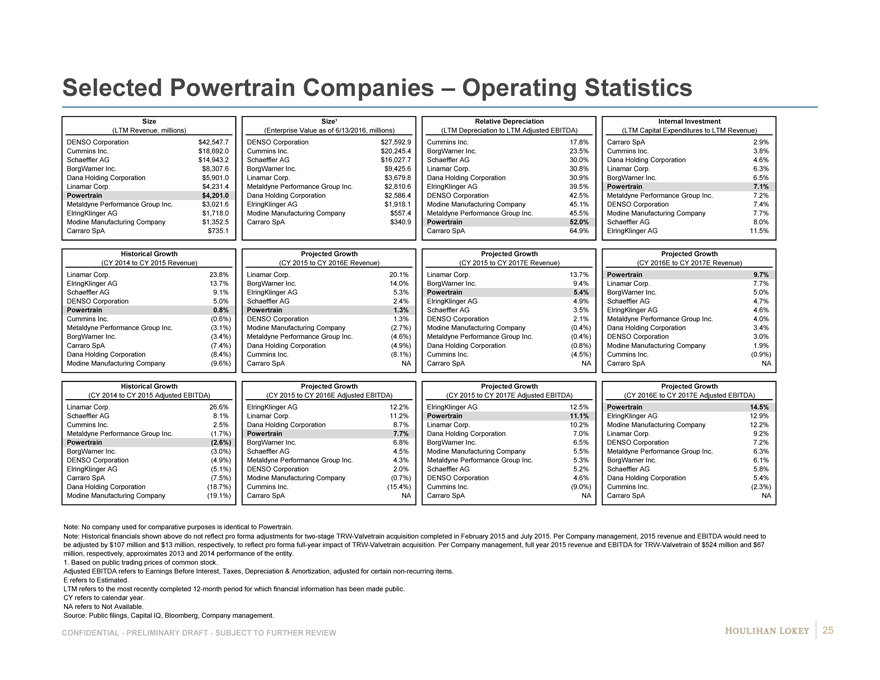
Selected Powertrain Companies – Operating Statistics
Size Size¹ Relative Depreciation Internal Investment
(LTM Revenue, millions)(Enterprise Value as of 6/13/2016, millions)(LTM Depreciation to LTM Adjusted EBITDA)(LTM Capital Expenditures to LTM Revenue)
DENSO Corporation $42,547.7 DENSO Corporation $27,592.9 Cummins Inc. 17.8% Carraro SpA 2.9%
Cummins Inc. $18,692.0 Cummins Inc. $20,245.4 BorgWarner Inc. 23.5% Cummins Inc. 3.8%
Schaeffler AG $14,943.2 Schaeffler AG $16,027.7 Schaeffler AG 30.0% Dana Holding Corporation 4.6%
BorgWarner Inc. $8,307.6 BorgWarner Inc. $9,425.6 Linamar Corp. 30.8% Linamar Corp. 6.3%
Dana Holding Corporation $5,901.0 Linamar Corp. $3,679.8 Dana Holding Corporation 30.9% BorgWarner Inc. 6.5%
Linamar Corp. $4,231.4 Metaldyne Performance Group Inc. $2,810.6 ElringKlinger AG 39.5% Powertrain 7.1%
Powertrain $4,201.0 Dana Holding Corporation $2,586.4 DENSO Corporation 42.5% Metaldyne Performance Group Inc. 7.2%
Metaldyne Performance Group Inc. $3,021.6 ElringKlinger AG $1,918.1 Modine Manufacturing Company 45.1% DENSO Corporation 7.4%
ElringKlinger AG $1,718.0 Modine Manufacturing Company $557.4 Metaldyne Performance Group Inc. 45.5% Modine Manufacturing Company 7.7%
Modine Manufacturing Company $1,352.5 Carraro SpA $340.9 Powertrain 52.0% Schaeffler AG 8.0%
Carraro SpA $735.1 Carraro SpA 64.9% ElringKlinger AG 11.5%
Historical Growth Projected Growth Projected Growth Projected Growth
(CY 2014 to CY 2015 Revenue)(CY 2015 to CY 2016E Revenue)(CY 2015 to CY 2017E Revenue)(CY 2016E to CY 2017E Revenue)
Linamar Corp. 23.8% Linamar Corp. 20.1% Linamar Corp. 13.7% Powertrain 9.7%
ElringKlinger AG 13.7% BorgWarner Inc. 14.0% BorgWarner Inc. 9.4% Linamar Corp. 7.7%
Schaeffler AG 9.1% ElringKlinger AG 5.3% Powertrain 5.4% BorgWarner Inc. 5.0%
DENSO Corporation 5.0% Schaeffler AG 2.4% ElringKlinger AG 4.9% Schaeffler AG 4.7%
Powertrain 0.8% Powertrain 1.3% Schaeffler AG 3.5% ElringKlinger AG 4.6%
Cummins Inc.(0.6%) DENSO Corporation 1.3% DENSO Corporation 2.1% Metaldyne Performance Group Inc. 4.0%
Metaldyne Performance Group Inc.(3.1%) Modine Manufacturing Company(2.7%) Modine Manufacturing Company(0.4%) Dana Holding Corporation 3.4%
BorgWarner Inc.(3.4%) Metaldyne Performance Group Inc.(4.6%) Metaldyne Performance Group Inc.(0.4%) DENSO Corporation 3.0%
Carraro SpA(7.4%) Dana Holding Corporation(4.9%) Dana Holding Corporation(0.8%) Modine Manufacturing Company 1.9%
Dana Holding Corporation(8.4%) Cummins Inc.(8.1%) Cummins Inc.(4.5%) Cummins Inc.(0.9%)
Modine Manufacturing Company(9.6%) Carraro SpA NA Carraro SpA NA Carraro SpA NA
Historical Growth Projected Growth Projected Growth Projected Growth
(CY 2014 to CY 2015 Adjusted EBITDA)(CY 2015 to CY 2016E Adjusted EBITDA)(CY 2015 to CY 2017E Adjusted EBITDA)(CY 2016E to CY 2017E Adjusted EBITDA)
Linamar Corp. 26.6% ElringKlinger AG 12.2% ElringKlinger AG 12.5% Powertrain 14.5%
Schaeffler AG 8.1% Linamar Corp. 11.2% Powertrain 11.1% ElringKlinger AG 12.9%
Cummins Inc. 2.5% Dana Holding Corporation 8.7% Linamar Corp. 10.2% Modine Manufacturing Company 12.2%
Metaldyne Performance Group Inc.(1.7%) Powertrain 7.7% Dana Holding Corporation 7.0% Linamar Corp. 9.2%
Powertrain(2.6%) BorgWarner Inc. 6.8% BorgWarner Inc. 6.5% DENSO Corporation 7.2%
BorgWarner Inc.(3.0%) Schaeffler AG 4.5% Modine Manufacturing Company 5.5% Metaldyne Performance Group Inc. 6.3%
DENSO Corporation(4.9%) Metaldyne Performance Group Inc. 4.3% Metaldyne Performance Group Inc. 5.3% BorgWarner Inc. 6.1%
ElringKlinger AG(5.1%) DENSO Corporation 2.0% Schaeffler AG 5.2% Schaeffler AG 5.8%
Carraro SpA(7.5%) Modine Manufacturing Company(0.7%) DENSO Corporation 4.6% Dana Holding Corporation 5.4%
Dana Holding Corporation(18.7%) Cummins Inc.(15.4%) Cummins Inc.(9.0%) Cummins Inc.(2.3%)
Modine Manufacturing Company(19.1%) Carraro SpA NA Carraro SpA NA Carraro SpA NA
Note: No company used for comparative purposes is identical to Powertrain.
Note: Historical financials shown above do not reflect pro forma adjustments for two-stage TRW-Valvetrain acquisition completed in February 2015 and July 2015. Per Company management, 2015 revenue and EBITDA would need to
be adjusted by $107 million and $13 million, respectively, to reflect pro forma full-year impact of TRW-Valvetrain acquisition. Per Company management, full year 2015 revenue and EBITDA for TRW-Valvetrain of $524 million and $67
million, respectively, approximates 2013 and 2014 performance of the entity.
1. Based on public trading prices of common stock.
Adjusted EBITDA refers to Earnings Before Interest, Taxes, Depreciation & Amortization, adjusted for certain non-recurring items.
E refers to Estimated.
LTM refers to the most recently completed 12-month period for which financial information has been made public.
CY refers to calendar year.
NA refers to Not Available.
Source: Public filings, Capital IQ, Bloomberg, Company management.
CONFIDENTIAL—PRELIMINARY DRAFT—SUBJECT TO FURTHER REVIEW 25
|
|
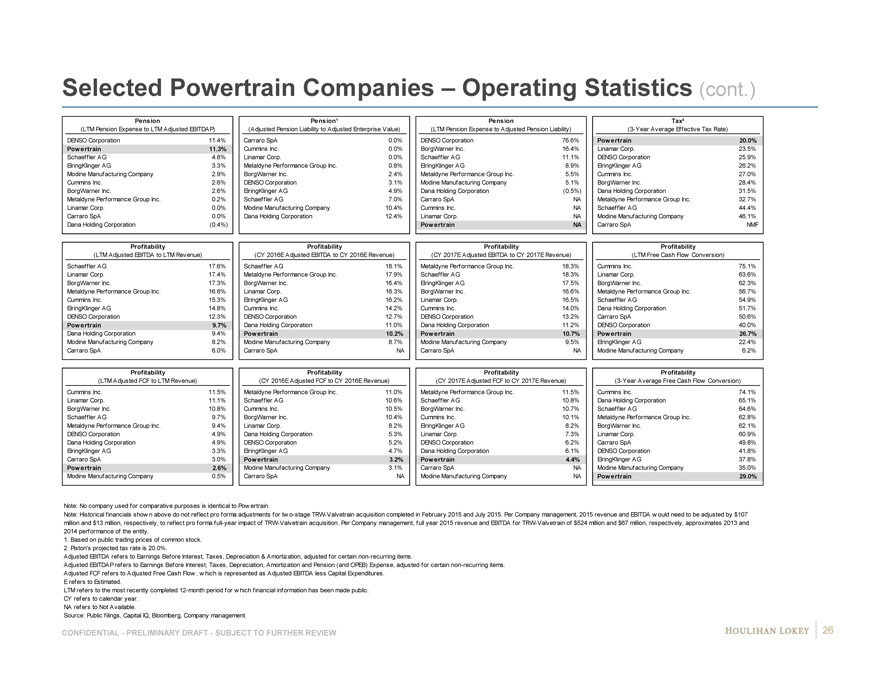
Selected Powertrain Companies – Operating Statistics (cont.)
Pension Pension¹ Pension Tax²
(LTM Pension Expense to LTM Adjusted EBITDAP)(Adjusted Pension Liability to Adjusted Enterprise Value)(LTM Pension Expense to Adjusted Pension Liability)(3-Year Average Effective Tax Rate)
DENSO Corporation 11.4% Carraro SpA 0.0% DENSO Corporation 76.6% Powertrain 20.0%
Powertrain 11.3% Cummins Inc. 0.0% BorgWarner Inc. 16.4% Linamar Corp. 23.5%
Schaeffler AG 4.8% Linamar Corp. 0.0% Schaeffler AG 11.1% DENSO Corporation 25.9%
ElringKlinger AG 3.3% Metaldyne Performance Group Inc. 0.8% ElringKlinger AG 8.9% ElringKlinger AG 26.2%
Modine Manufacturing Company 2.9% BorgWarner Inc. 2.4% Metaldyne Performance Group Inc. 5.5% Cummins Inc. 27.0%
Cummins Inc. 2.6% DENSO Corporation 3.1% Modine Manufacturing Company 5.1% BorgWarner Inc. 28.4%
BorgWarner Inc. 2.6% ElringKlinger AG 4.9% Dana Holding Corporation(0.5%) Dana Holding Corporation 31.5%
Metaldyne Performance Group Inc. 0.2% Schaeffler AG 7.0% Carraro SpA NA Metaldyne Performance Group Inc. 32.7%
Linamar Corp. 0.0% Modine Manufacturing Company 10.4% Cummins Inc. NA Schaeffler AG 44.4%
Carraro SpA 0.0% Dana Holding Corporation 12.4% Linamar Corp. NA Modine Manufacturing Company 46.1%
Dana Holding Corporation(0.4%) Powertrain NA Carraro SpA NMF
Profitability Profitability Profitability Profitability
(LTM Adjusted EBITDA to LTM Revenue)(CY 2016E Adjusted EBITDA to CY 2016E Revenue)(CY 2017E Adjusted EBITDA to CY 2017E Revenue)(LTM Free Cash Flow Conversion)
Schaeffler AG 17.6% Schaeffler AG 18.1% Metaldyne Performance Group Inc. 18.3% Cummins Inc. 75.1%
Linamar Corp. 17.4% Metaldyne Performance Group Inc. 17.9% Schaeffler AG 18.3% Linamar Corp. 63.6%
BorgWarner Inc. 17.3% BorgWarner Inc. 16.4% ElringKlinger AG 17.5% BorgWarner Inc. 62.3%
Metaldyne Performance Group Inc. 16.6% Linamar Corp. 16.3% BorgWarner Inc. 16.6% Metaldyne Performance Group Inc. 56.7%
Cummins Inc. 15.3% ElringKlinger AG 16.2% Linamar Corp. 16.5% Schaeffler AG 54.9%
ElringKlinger AG 14.8% Cummins Inc. 14.2% Cummins Inc. 14.0% Dana Holding Corporation 51.7%
DENSO Corporation 12.3% DENSO Corporation 12.7% DENSO Corporation 13.2% Carraro SpA 50.6%
Powertrain 9.7% Dana Holding Corporation 11.0% Dana Holding Corporation 11.2% DENSO Corporation 40.0%
Dana Holding Corporation 9.4% Powertrain 10.2% Powertrain 10.7% Powertrain 26.7%
Modine Manufacturing Company 8.2% Modine Manufacturing Company 8.7% Modine Manufacturing Company 9.5% ElringKlinger AG 22.4%
Carraro SpA 6.0% Carraro SpA NA Carraro SpA NA Modine Manufacturing Company 6.2%
Profitability Profitability Profitability Profitability
(LTM Adjusted FCF to LTM Revenue)(CY 2016E Adjusted FCF to CY 2016E Revenue)(CY 2017E Adjusted FCF to CY 2017E Revenue)(3-Year Average Free Cash Flow Conversion)
Cummins Inc. 11.5% Metaldyne Performance Group Inc. 11.0% Metaldyne Performance Group Inc. 11.5% Cummins Inc. 74.1%
Linamar Corp. 11.1% Schaeffler AG 10.6% Schaeffler AG 10.8% Dana Holding Corporation 65.1%
BorgWarner Inc. 10.8% Cummins Inc. 10.5% BorgWarner Inc. 10.7% Schaeffler AG 64.6%
Schaeffler AG 9.7% BorgWarner Inc. 10.4% Cummins Inc. 10.1% Metaldyne Performance Group Inc. 62.8%
Metaldyne Performance Group Inc. 9.4% Linamar Corp. 8.2% ElringKlinger AG 8.2% BorgWarner Inc. 62.1%
DENSO Corporation 4.9% Dana Holding Corporation 5.3% Linamar Corp. 7.3% Linamar Corp. 60.9%
Dana Holding Corporation 4.9% DENSO Corporation 5.2% DENSO Corporation 6.2% Carraro SpA 49.8%
ElringKlinger AG 3.3% ElringKlinger AG 4.7% Dana Holding Corporation 6.1% DENSO Corporation 41.8%
Carraro SpA 3.0% Powertrain 3.2% Powertrain 4.4% ElringKlinger AG 37.8%
Powertrain 2.6% Modine Manufacturing Company 3.1% Carraro SpA NA Modine Manufacturing Company 35.0%
Modine Manufacturing Company 0.5% Carraro SpA NA Modine Manufacturing Company NA Powertrain 29.0%
Note: No company used for comparative purposes is identical to Pow ertrain.
Note: Historical financials show n above do not reflect pro forma adjustments for tw o-stage TRW-Valvetrain acquisition completed in February 2015 and July 2015. Per Company management, 2015 revenue and EBITDA w ould need to be adjusted by $107
million and $13 million, respectively, to reflect pro forma full-year impact of TRW-Valvetrain acquisition. Per Company management, full year 2015 revenue and EBITDA for TRW-Valvetrain of $524 million and $67 million, respectively, approximates 2013 and
2014 performance of the entity.
1. Based on public trading prices of common stock.
2. Piston’s projected tax rate is 20.0%.
Adjusted EBITDA refers to Earnings Before Interest, Taxes, Depreciation & Amortization, adjusted for certain non-recurring items.
Adjusted EBITDAP refers to Earnings Before Interest, Taxes, Depreciation, Amortization and Pension (and OPEB) Expense, adjusted for certain non-recurring items.
Adjusted FCF refers to Adjusted Free Cash Flow , w hich is represented as Adjusted EBITDA less Capital Expenditures.
E refers to Estimated.
LTM refers to the most recently completed 12-month period for w hich financial information has been made public.
CY refers to calendar year.
NA refers to Not Available.
Source: Public filings, Capital IQ, Bloomberg, Company management.
CONFIDENTIAL—PRELIMINARY DRAFT—SUBJECT TO FURTHER REVIEW 26
|
|
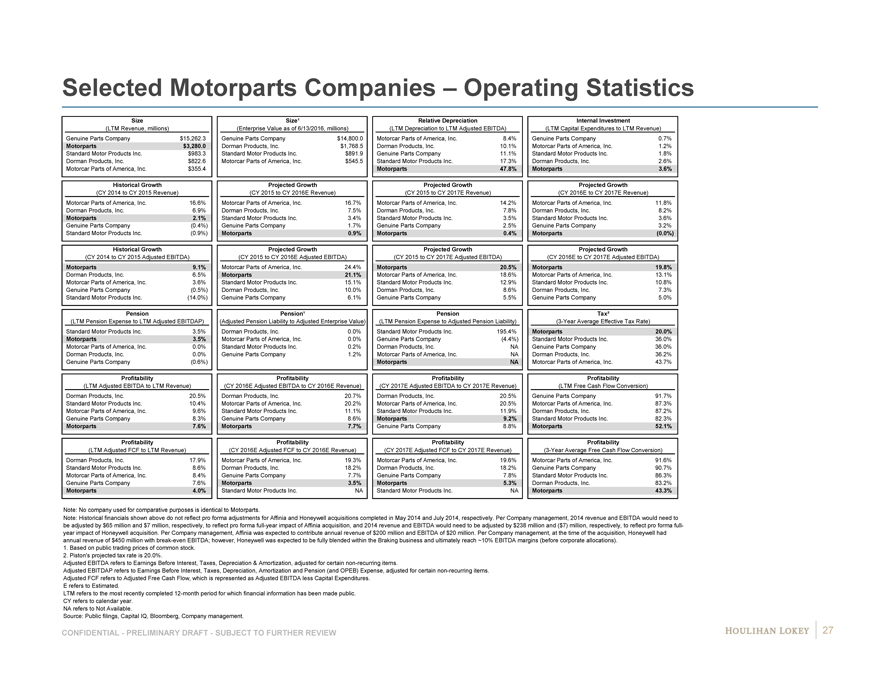
Selected Motorparts Companies – Operating Statistics
Size Size¹ Relative Depreciation Internal Investment
(LTM Revenue, millions)(Enterprise Value as of 6/13/2016, millions)(LTM Depreciation to LTM Adjusted EBITDA)(LTM Capital Expenditures to LTM Revenue)
Genuine Parts Company $15,262.3 Genuine Parts Company $14,800.0 Motorcar Parts of America, Inc. 8.4% Genuine Parts Company 0.7%
Motorparts $3,280.0 Dorman Products, Inc. $1,768.5 Dorman Products, Inc. 10.1% Motorcar Parts of America, Inc. 1.2%
Standard Motor Products Inc. $983.3 Standard Motor Products Inc. $891.9 Genuine Parts Company 11.1% Standard Motor Products Inc. 1.8%
Dorman Products, Inc. $822.6 Motorcar Parts of America, Inc. $545.5 Standard Motor Products Inc. 17.3% Dorman Products, Inc. 2.6%
Motorcar Parts of America, Inc. $355.4 ######### Motorparts 47.8% Motorparts 3.6%
Historical Growth Projected Growth Projected Growth Projected Growth
(CY 2014 to CY 2015 Revenue)(CY 2015 to CY 2016E Revenue)(CY 2015 to CY 2017E Revenue)(CY 2016E to CY 2017E Revenue)
Motorcar Parts of America, Inc. 16.6% Motorcar Parts of America, Inc. 16.7% Motorcar Parts of America, Inc. 14.2% Motorcar Parts of America, Inc. 11.8%
Dorman Products, Inc. 6.9% Dorman Products, Inc. 7.5% Dorman Products, Inc. 7.8% Dorman Products, Inc. 8.2%
Motorparts 2.1% Standard Motor Products Inc. 3.4% Standard Motor Products Inc. 3.5% Standard Motor Products Inc. 3.6%
Genuine Parts Company(0.4%) Genuine Parts Company 1.7% Genuine Parts Company 2.5% Genuine Parts Company 3.2%
Standard Motor Products Inc.(0.9%) Motorparts 0.9% Motorparts 0.4% Motorparts(0.0%)
Historical Growth Projected Growth Projected Growth Projected Growth
(CY 2014 to CY 2015 Adjusted EBITDA)(CY 2015 to CY 2016E Adjusted EBITDA)(CY 2015 to CY 2017E Adjusted EBITDA)(CY 2016E to CY 2017E Adjusted EBITDA)
Motorparts 9.1% Motorcar Parts of America, Inc. 24.4% Motorparts 20.5% Motorparts 19.8%
Dorman Products, Inc. 6.5% Motorparts 21.1% Motorcar Parts of America, Inc. 18.6% Motorcar Parts of America, Inc. 13.1%
Motorcar Parts of America, Inc. 3.6% Standard Motor Products Inc. 15.1% Standard Motor Products Inc. 12.9% Standard Motor Products Inc. 10.8%
Genuine Parts Company(0.5%) Dorman Products, Inc. 10.0% Dorman Products, Inc. 8.6% Dorman Products, Inc. 7.3%
Standard Motor Products Inc.(14.0%) Genuine Parts Company 6.1% Genuine Parts Company 5.5% Genuine Parts Company 5.0%
Pension Pension¹ Pension Tax²
(LTM Pension Expense to LTM Adjusted EBITDAP)(Adjusted Pension Liability to Adjusted Enterprise Value)(LTM Pension Expense to Adjusted Pension Liability)(3-Year Average Effective Tax Rate)
Standard Motor Products Inc. 3.5% Dorman Products, Inc. 0.0% Standard Motor Products Inc. 195.4% Motorparts 20.0%
Motorparts 3.5% Motorcar Parts of America, Inc. 0.0% Genuine Parts Company(4.4%) Standard Motor Products Inc. 36.0%
Motorcar Parts of America, Inc. 0.0% Standard Motor Products Inc. 0.2% Dorman Products, Inc. NA Genuine Parts Company 36.0%
Dorman Products, Inc. 0.0% Genuine Parts Company 1.2% Motorcar Parts of America, Inc. NA Dorman Products, Inc. 36.2%
Genuine Parts Company(0.6%) Motorparts NA Motorcar Parts of America, Inc. 43.7%
Profitability Profitability Profitability Profitability
(LTM Adjusted EBITDA to LTM Revenue)(CY 2016E Adjusted EBITDA to CY 2016E Revenue)(CY 2017E Adjusted EBITDA to CY 2017E Revenue)(LTM Free Cash Flow Conversion)
Dorman Products, Inc. 20.5% Dorman Products, Inc. 20.7% Dorman Products, Inc. 20.5% Genuine Parts Company 91.7%
Standard Motor Products Inc. 10.4% Motorcar Parts of America, Inc. 20.2% Motorcar Parts of America, Inc. 20.5% Motorcar Parts of America, Inc. 87.3%
Motorcar Parts of America, Inc. 9.6% Standard Motor Products Inc. 11.1% Standard Motor Products Inc. 11.9% Dorman Products, Inc. 87.2%
Genuine Parts Company 8.3% Genuine Parts Company 8.6% Motorparts 9.2% Standard Motor Products Inc. 82.3%
Motorparts 7.6% Motorparts 7.7% Genuine Parts Company 8.8% Motorparts 52.1%
Profitability Profitability Profitability Profitability
(LTM Adjusted FCF to LTM Revenue)(CY 2016E Adjusted FCF to CY 2016E Revenue)(CY 2017E Adjusted FCF to CY 2017E Revenue)(3-Year Average Free Cash Flow Conversion)
Dorman Products, Inc. 17.9% Motorcar Parts of America, Inc. 19.3% Motorcar Parts of America, Inc. 19.6% Motorcar Parts of America, Inc. 91.6%
Standard Motor Products Inc. 8.6% Dorman Products, Inc. 18.2% Dorman Products, Inc. 18.2% Genuine Parts Company 90.7%
Motorcar Parts of America, Inc. 8.4% Genuine Parts Company 7.7% Genuine Parts Company 7.8% Standard Motor Products Inc. 86.3%
Genuine Parts Company 7.6% Motorparts 3.5% Motorparts 5.3% Dorman Products, Inc. 83.2%
Motorparts 4.0% Standard Motor Products Inc. NA Standard Motor Products Inc. NA Motorparts 43.3%
Note: No company used for comparative purposes is identical to Motorparts.
Note: Historical financials shown above do not reflect pro forma adjustments for Affinia and Honeywell acquisitions completed in May 2014 and July 2014, respectively. Per Company management, 2014 revenue and EBITDA would need to
be adjusted by $65 million and $7 million, respectively, to reflect pro forma full-year impact of Affinia acquisition, and 2014 revenue and EBITDA would need to be adjusted by $238 million and ($7) million, respectively, to reflect pro forma full-
year impact of Honeywell acquisition. Per Company management, Affinia was expected to contribute annual revenue of $200 million and EBITDA of $20 million. Per Company management, at the time of the acquisition, Honeywell had
annual revenue of $450 million with break-even EBITDA; however, Honeywell was expected to be fully blended within the Braking business and ultimately reach ~10% EBITDA margins (before corporate allocations).
1. Based on public trading prices of common stock.
2. Piston’s projected tax rate is 20.0%.
Adjusted EBITDA refers to Earnings Before Interest, Taxes, Depreciation & Amortization, adjusted for certain non-recurring items.
Adjusted EBITDAP refers to Earnings Before Interest, Taxes, Depreciation, Amortization and Pension (and OPEB) Expense, adjusted for certain non-recurring items.
Adjusted FCF refers to Adjusted Free Cash Flow, which is represented as Adjusted EBITDA less Capital Expenditures.
E refers to Estimated.
LTM refers to the most recently completed 12-month period for which financial information has been made public.
CY refers to calendar year.
NA refers to Not Available.
Source: Public filings, Capital IQ, Bloomberg, Company management.
CONFIDENTIAL—PRELIMINARY DRAFT—SUBJECT TO FURTHER REVIEW 27
|
|
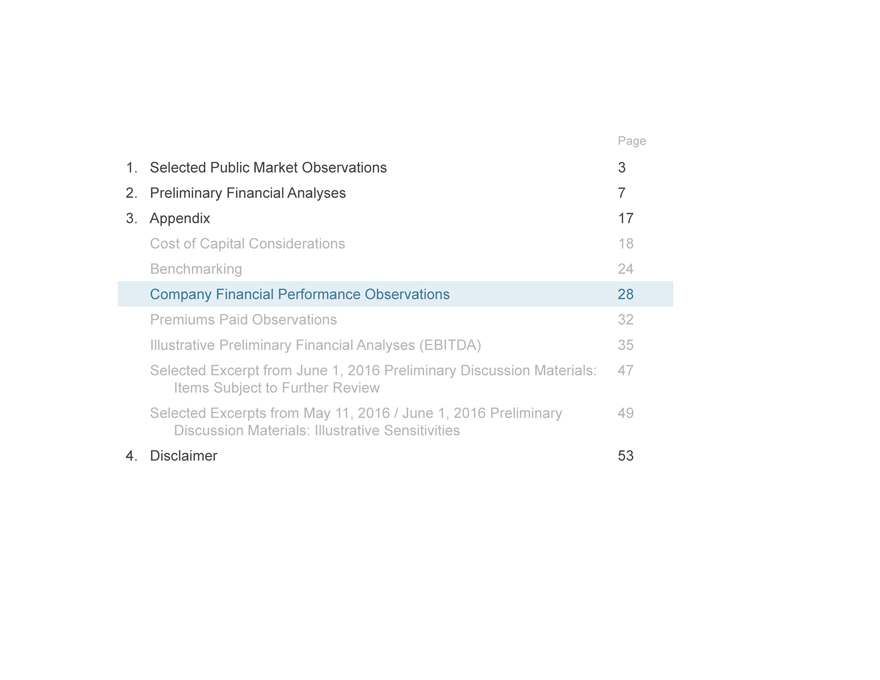
Page
1. Selected Public Market Observations 3
2. Preliminary Financial Analyses 7
3. Appendix 17 Cost of Capital Considerations 18 Benchmarking 24 Company Financial Performance Observations 28 Premiums Paid Observations 32 Illustrative Preliminary Financial Analyses (EBITDA) 35 Selected Excerpt from June 1, 2016 Preliminary Discussion Materials: 47 Items Subject to Further Review Selected Excerpts from May 11, 2016 / June 1, 2016 Preliminary 49 Discussion Materials: Illustrative Sensitivities
4. Disclaimer 53
|
|
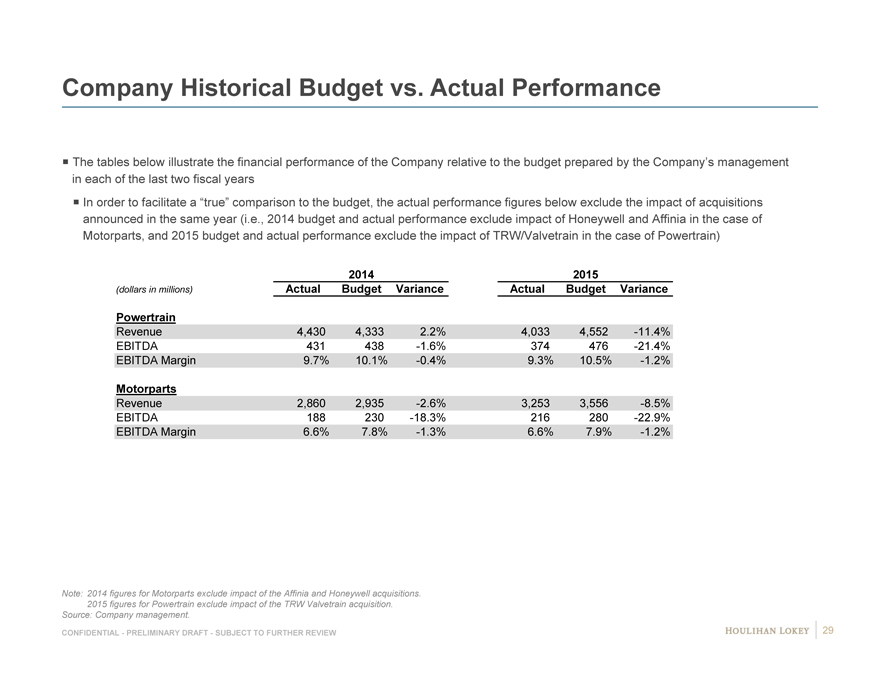
Company Historical Budget vs. Actual Performance
The tables below illustrate the financial performance of the Company relative to the budget prepared by the Company’s management
in each of the last two fiscal years
In order to facilitate a “true” comparison to the budget, the actual performance figures below exclude the impact of acquisitions
announced in the same year (i.e., 2014 budget and actual performance exclude impact of Honeywell and Affinia in the case of
Motorparts, and 2015 budget and actual performance exclude the impact of TRW/Valvetrain in the case of Powertrain)
2014 2015
(dollars in millions) Actual Budget Variance Actual Budget Variance
Powertrain
Revenue 4,430 4,333 2.2% 4,033 4,552 -11.4%
EBITDA 431 438 -1.6% 374 476 -21.4%
EBITDA Margin 9.7% 10.1% -0.4% 9.3% 10.5% -1.2%
Motorparts
Revenue 2,860 2,935 -2.6% 3,253 3,556 -8.5%
EBITDA 188 230 -18.3% 216 280 -22.9%
EBITDA Margin 6.6% 7.8% -1.3% 6.6% 7.9% -1.2%
Note: 2014 figures for Motorparts exclude impact of the Affinia and Honeywell acquisitions.
2015 figures for Powertrain exclude impact of the TRW Valvetrain acquisition.
Source: Company management.
CONFIDENTIAL—PRELIMINARY DRAFT—SUBJECT TO FURTHER REVIEW 29
|
|
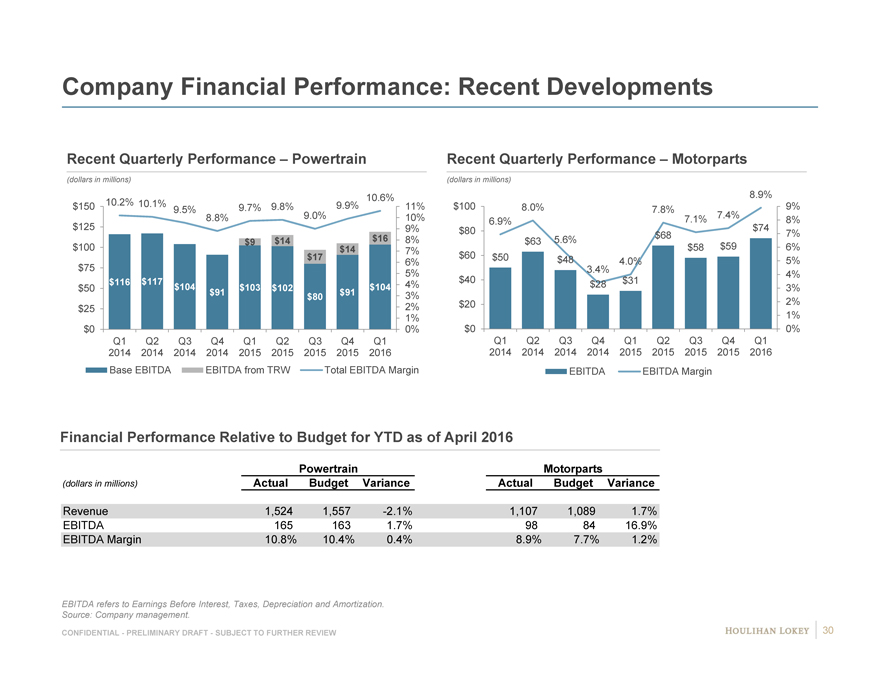
Company Financial Performance: Recent Developments
Recent Quarterly Performance – Powertrain
(dollars in millions)
$150 10.2% 10.1% 9.8% 9.9% 10.6% 11%
9.5% 9.7%
8.8% 9.0% 10%
$125 9%
$9 $14 $16 8%
$100 $ 14 7%
$ 17 6%
$75 5%
$50 $116 $117 $104 $103 $102 $104 4%
$91 $ 80 $ 91 3%
$25 2%
1%
$0 0%
Q1 Q2 Q3 Q4 Q1 Q2 Q3 Q4 Q1
2014 2014 2014 2014 2015 2015 2015 2015 2016
Base EBITDA EBITDA from TRW Total EBITDA Margin
Recent Quarterly Performance – Motorparts
(dollars in millions)
8.9%
$100 8.0% 7.8% 9%
6.9% 7.1% 7.4% 8%
$80 $68 $74 7%
$63 5.6% $58 $59 6%
$60 $50 $48 4.0% 5%
3.4% 4%
$40 $28 $31
3%
$20 2%
1%
$0 0%
Q1 Q2 Q3 Q4 Q1 Q2 Q3 Q4 Q1
2014 2014 2014 2014 2015 2015 2015 2015 2016
EBITDA EBITDA Margin
Financial Performance Relative to Budget for YTD as of April 2016
Powertrain Motorparts
(dollars in millions) Actual Budget Variance Actual Budget Variance
Revenue 1,524 1,557 -2.1% 1,107 1,089 1.7%
EBITDA 165 163 1.7% 98 84 16.9%
EBITDA Margin 10.8% 10.4% 0.4% 8.9% 7.7% 1.2%
EBITDA refers to Earnings Before Interest, Taxes, Depreciation and Amortization.
Source: Company management.
CONFIDENTIAL—PRELIMINARY DRAFT—SUBJECT TO FURTHER REVIEW 30
|
|
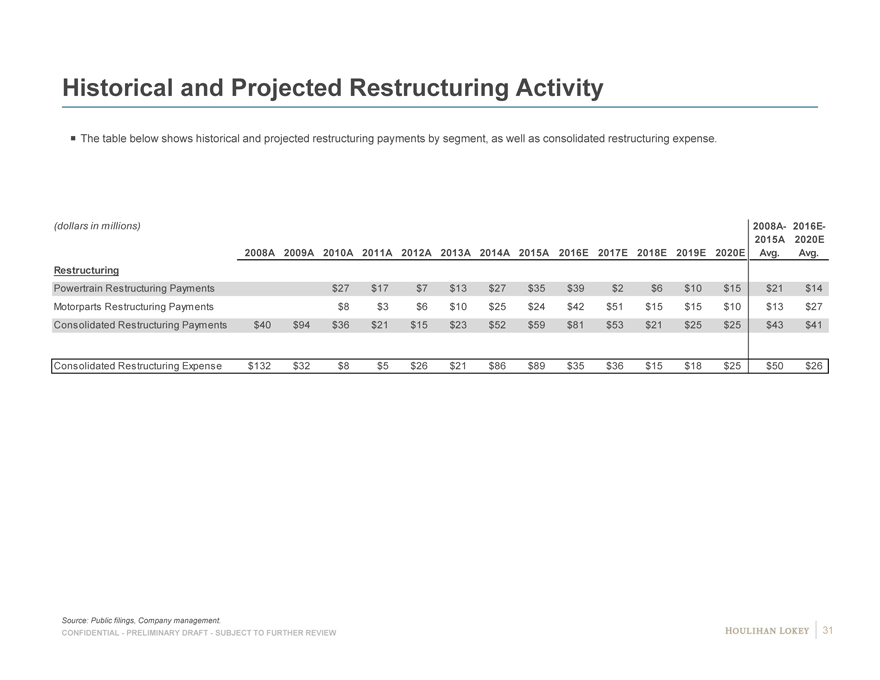
Historical and Projected Restructuring Activity
The table below shows historical and projected restructuring payments by segment, as well as consolidated restructuring expense.
(dollars in millions) 2008A- 2016E-
2015A 2020E
2008A 2009A 2010A 2011A 2012A 2013A 2014A 2015A 2016E 2017E 2018E 2019E 2020E Avg. Avg.
Restructuring
Powertrain Restructuring Payments $27 $17 $7 $ 13 $ 27 $ 35 $ 39 $2 $6 $10 $15 $21 $ 14
Motorparts Restructuring Payments $8 $3 $6 $10 $ 25 $24 $ 42 $51 $15 $ 15 $10 $ 13 $ 27
Consolidated Restructuring Payments $40 $ 94 $36 $21 $15 $ 23 $ 52 $ 59 $ 81 $53 $21 $ 25 $25 $ 43 $ 41
Consolidated Restructuring Expense $132 $ 32 $8 $5 $26 $ 21 $ 86 $ 89 $ 35 $36 $15 $ 18 $25 $ 50 $ 26
Source: Public filings, Company management.
CONFIDENTIAL—PRELIMINARY DRAFT—SUBJECT TO FURTHER REVIEW 31
|
|
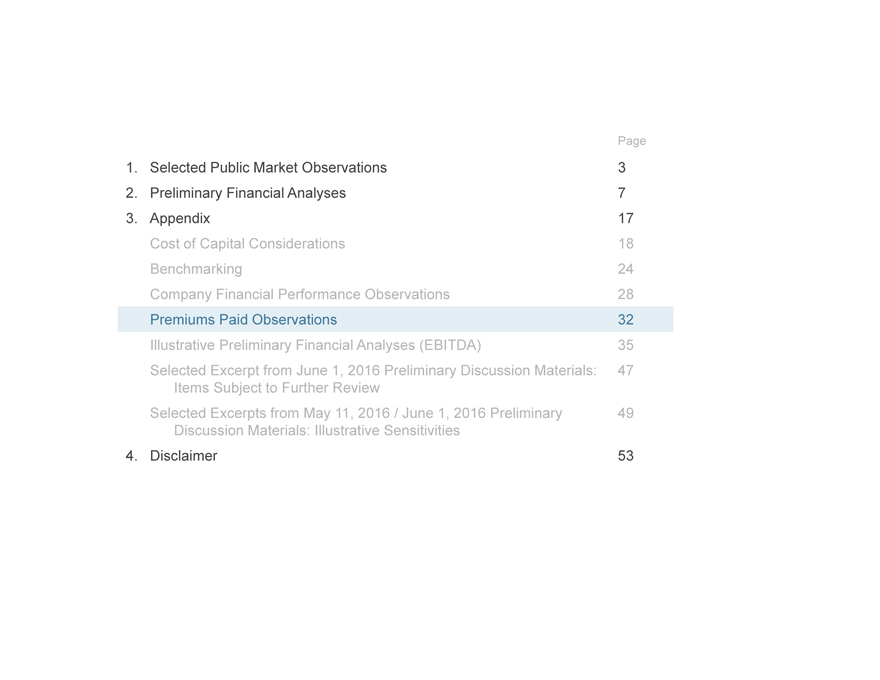
Page
1. Selected Public Market Observations 3
2. Preliminary Financial Analyses 7
3. Appendix 17 Cost of Capital Considerations 18 Benchmarking 24 Company Financial Performance Observations 28 Premiums Paid Observations 32 Illustrative Preliminary Financial Analyses (EBITDA) 35 Selected Excerpt from June 1, 2016 Preliminary Discussion Materials: 47 Items Subject to Further Review Selected Excerpts from May 11, 2016 / June 1, 2016 Preliminary 49 Discussion Materials: Illustrative Sensitivities
4. Disclaimer 53
|
|
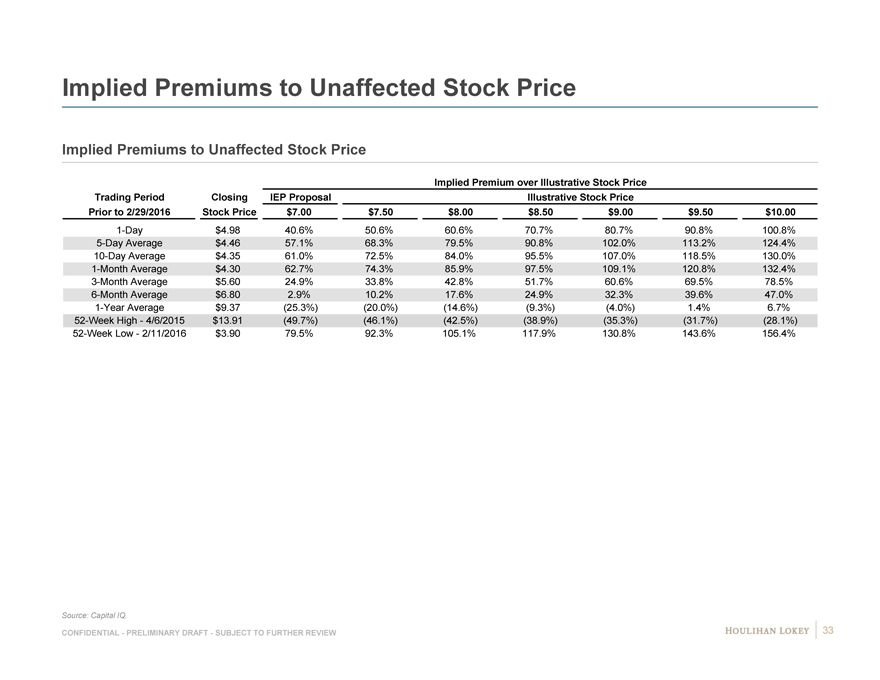
Implied Premiums to Unaffected Stock Price
Implied Premiums to Unaffected Stock Price
Implied Premium over Illustrative Stock Price
Trading Period Closing IEP Proposal Illustrative Stock Price
Prior to 2/29/2016 Stock Price $7.00 $7.50 $8.00 $8.50 $9.00 $9.50 $10.00
1-Day $4.98 40.6% 50.6% 60.6% 70.7% 80.7% 90.8% 100.8%
5-Day Average $4.46 57.1% 68.3% 79.5% 90.8% 102.0% 113.2% 124.4%
10-Day Average $4.35 61.0% 72.5% 84.0% 95.5% 107.0% 118.5% 130.0%
1-Month Average $4.30 62.7% 74.3% 85.9% 97.5% 109.1% 120.8% 132.4%
3-Month Average $5.60 24.9% 33.8% 42.8% 51.7% 60.6% 69.5% 78.5%
6-Month Average $6.80 2.9% 10.2% 17.6% 24.9% 32.3% 39.6% 47.0%
1-Year Average $9.37(25.3%)(20.0%)(14.6%)(9.3%)(4.0%) 1.4% 6.7%
52-Week High—4/6/2015 $13.91(49.7%)(46.1%)(42.5%)(38.9%)(35.3%)(31.7%)(28.1%)
52-Week Low—2/11/2016 $3.90 79.5% 92.3% 105.1% 117.9% 130.8% 143.6% 156.4%
Source: Capital IQ.
CONFIDENTIAL—PRELIMINARY DRAFT—SUBJECT TO FURTHER REVIEW 33
|
|
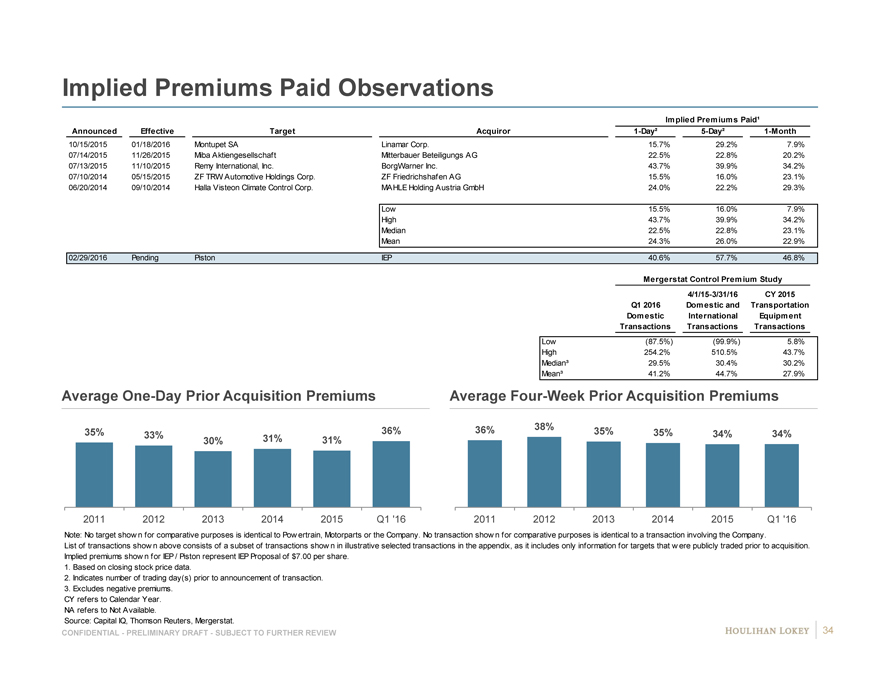
Implied Premiums Paid Observations
Implied Premiums Paid¹
Announced Effective Target Acquiror 1-Day² 5-Day² 1-Month
10/15/2015 01/18/2016 Montupet SA Linamar Corp. 15.7% # 29.2% # 7.9% #
07/14/2015 11/26/2015 Miba Aktiengesellschaft Mitterbauer Beteiligungs AG 22.5% # 22.8% # 20.2% #
07/13/2015 11/10/2015 Remy International, Inc. BorgWarner Inc. 43.7% # 39.9% # 34.2% #
07/10/2014 05/15/2015 ZF TRW Automotive Holdings Corp. ZF Friedrichshafen AG 15.5% # 16.0% # 23.1% #
06/20/2014 09/10/2014 Halla Visteon Climate Control Corp. MAHLE Holding Austria GmbH 24.0% # 22.2% # 29.3% #
Low 15.5% 16.0% 7.9%
High 43.7% 39.9% 34.2%
Median 22.5% 22.8% 23.1%
Mean 24.3% 26.0% 22.9%
02/29/2016 Pending Piston IEP 40.6% 57.7% 46.8%
Mergerstat Control Premium Study
4/1/15-3/31/16 CY 2015
Q1 2016 Domestic and Transportation
Domestic ic International al Equipment
Transactions Transactions Transactions
Low(87.5%) #(99.9%) # 5.8%
High 254.2% # 510.5% # 43.7%
Median³ 29.5% # 30.4% # 30.2%
Mean³ 41.2% # 44.7% # 27.9%
Average One-Day Prior Acquisition Premiums
35% 33% 36%
30% 31% 31%
2011 2012 2013 2014 2015 Q1 ‘16
Average Four-Week Prior Acquisition Premiums
36% 38% 35% 35% 34% 34%
2011 2012 2013 2014 2015 Q1 ‘16
Note: No target show n for comparative purposes is identical to Pow ertrain, Motorparts or the Company. No transaction show n for comparative purposes is identical to a transaction involving the Company.
List of transactions show n above consists of a subset of transactions show n in illustrative selected transactions in the appendix, as it includes only information for targets that w ere publicly traded prior to acquisition.
Implied premiums show n for IEP / Piston represent IEP Proposal of $7.00 per share.
1. Based on closing stock price data.
2. Indicates number of trading day(s) prior to announcement of transaction.
3. Excludes negative premiums.
CY refers to Calendar Year.
NA refers to Not Available.
Source: Capital IQ, Thomson Reuters, Mergerstat.
CONFIDENTIAL—PRELIMINARY DRAFT—SUBJECT TO FURTHER REVIEW 34
|
|
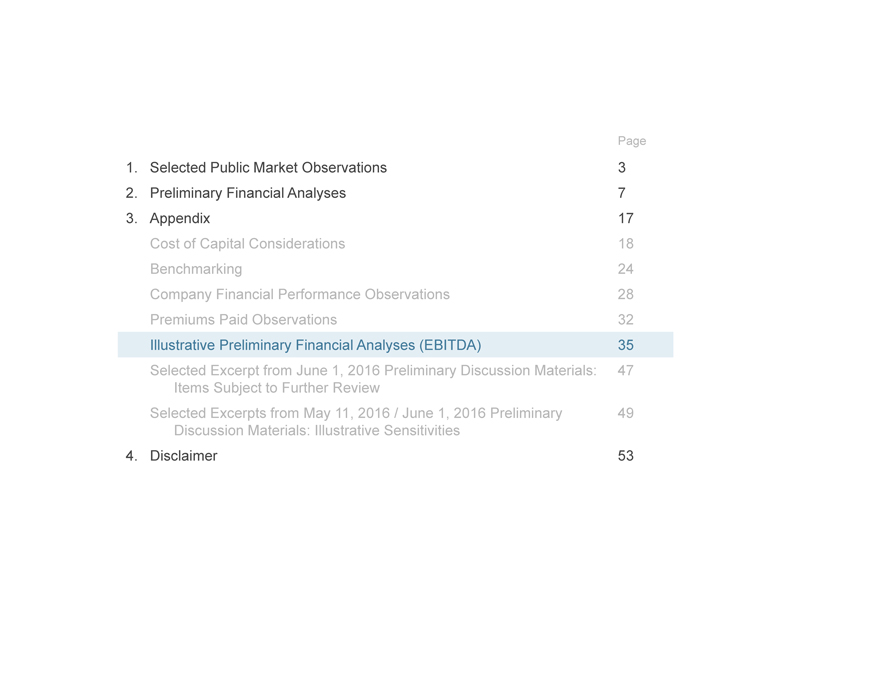
Page
1. Selected Public Market Observations 3
2. Preliminary Financial Analyses 7
3. Appendix 17 Cost of Capital Considerations 18 Benchmarking 24 Company Financial Performance Observations 28 Premiums Paid Observations 32 Illustrative Preliminary Financial Analyses (EBITDA) 35 Selected Excerpt from June 1, 2016 Preliminary Discussion Materials: 47 Items Subject to Further Review Selected Excerpts from May 11, 2016 / June 1, 2016 Preliminary 49 Discussion Materials: Illustrative Sensitivities
4. Disclaimer 53
|
|
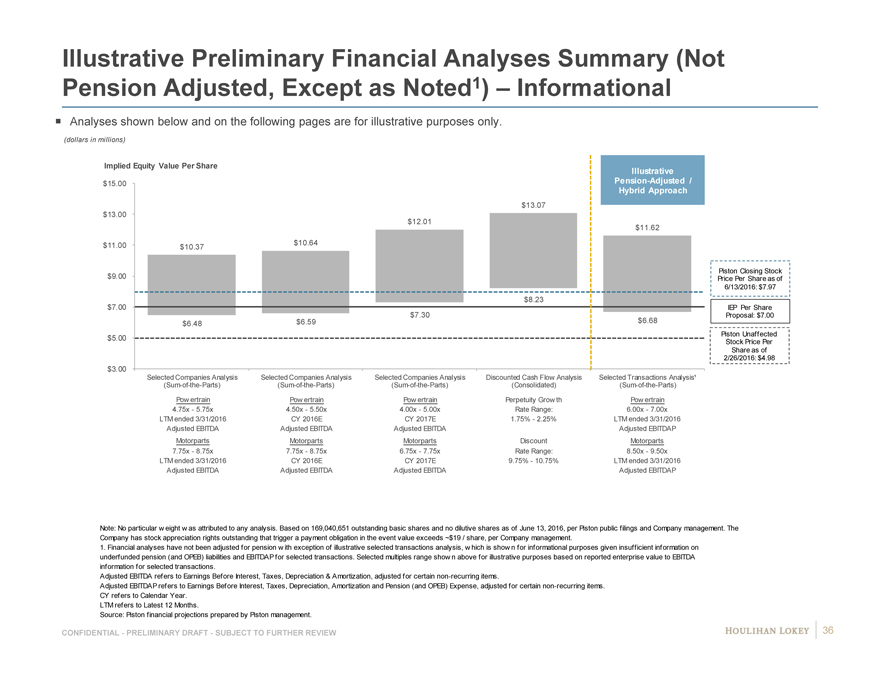
Illustrative Preliminary Financial Analyses Summary (Not
Pension Adjusted, Except as Noted1) – Informational
Analyses shown below and on the following pages are for illustrative purposes only.
(dollars in millions)
Implied Equity Value Per Share Illustrative
$15.00 Pension-Adjusted /
Hybrid Approach
$13.07
$13.00
$12.01
$11.62
$11.00 $10.37 $10.64
Piston Closing Stock
$9.00 Price Per Share as of
6/13/2016: $7.97
$8.23
$7.00 IEP Per Share
$7.30 Proposal: $7.00
$6.48 $6.59 $6.68
Piston Unaffected
$5.00 Stock Price Per
Share as of
2/26/2016: $4.98
$3.00
Selected Companies Analysis Selected Companies Analysis Selected Companies Analysis Discounted Cash Flow Analysis Selected Transactions Analysis¹
(Sum-of-the-Parts)(Sum-of-the-Parts)(Sum-of-the-Parts)(Consolidated)(Sum-of-the-Parts)
Pow ertrain Pow ertrain Pow ertrain Perpetuity Grow th Pow ertrain
4.75x—5.75x 4.50x—5.50x 4.00x—5.00x Rate Range: 6.00x—7.00x
LTM ended 3/31/2016 CY 2016E CY 2017E 1.75%—2.25% LTM ended 3/31/2016
Adjusted EBITDA Adjusted EBITDA Adjusted EBITDA Adjusted EBITDAP
Motorparts Motorparts Motorparts Discount Motorparts
7.75x—8.75x 7.75x—8.75x 6.75x—7.75x Rate Range: 8.50x—9.50x
LTM ended 3/31/2016 CY 2016E CY 2017E 9.75%—10.75% LTM ended 3/31/2016
Adjusted EBITDA Adjusted EBITDA Adjusted EBITDA Adjusted EBITDAP
Note: No particular w eight w as attributed to any analysis. Based on 169,040,651 outstanding basic shares and no dilutive shares as of June 13, 2016, per Piston public filings and Company management. The Company has stock appreciation rights outstanding that trigger a payment obligation in the event value exceeds ~$19 / share, per Company management.
1. Financial analyses have not been adjusted for pension w ith exception of illustrative selected transactions analysis, w hich is show n for informational purposes given insufficient information on underfunded pension (and OPEB) liabilities and EBITDAP for selected transactions. Selected multiples range show n above for illustrative purposes based on reported enterprise value to EBITDA information for selected transactions.
Adjusted EBITDA refers to Earnings Before Interest, Taxes, Depreciation & Amortization, adjusted for certain non-recurring items.
Adjusted EBITDAP refers to Earnings Before Interest, Taxes, Depreciation, Amortization and Pension (and OPEB) Expense, adjusted for certain non-recurring items. CY refers to Calendar Year.
LTM refers to Latest 12 Months.
Source: Piston financial projections prepared by Piston management.
CONFIDENTIAL—PRELIMINARY DRAFT—SUBJECT TO FURTHER REVIEW 36
|
|
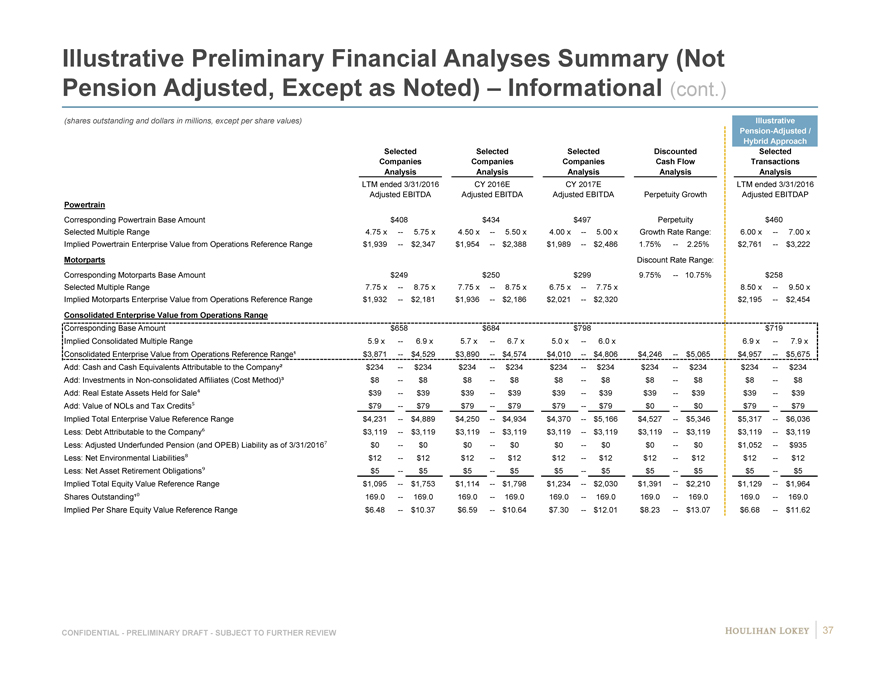
Illustrative Preliminary Financial Analyses Summary (Not
Pension Adjusted, Except as Noted) – Informational (cont.)
(shares outstanding and dollars in millions, except per share values) Illustrative
Pension-Adjusted /
Hybrid Approach
Selected Selected Selected Discounted Selected
Companies Companies Companies Cash Flow Transactions
Analysis Analysis Analysis Analysis Analysis
LTM ended 3/31/2016 CY 2016E CY 2017E LTM ended 3/31/2016
Adjusted EBITDA Adjusted EBITDA Adjusted EBITDA Perpetuity Growth Adjusted EBITDAP
Powertrain Discount Rate Range:
Corresponding Powertrain Base Amount $408 $434 $497 Perpetuity $460
Selected Multiple Range 4.75 x — 5.75 x 4.50 x — 5.50 x 4.00 x — 5.00 x Growth Rate Range: 6.00 x — 7.00 x
Implied Powertrain Enterprise Value from Operations Reference Range $1,939 — $2,347 $1,954 — $2,388 $1,989 — $2,486 1.75% — 2.25% $2,761 — $3,222
Motorparts Discount Rate Range:
Corresponding Motorparts Base Amount $249 $250 $299 9.75% — 10.75% $258
Selected Multiple Range 7.75 x — 8.75 x 7.75 x — 8.75 x 6.75 x — 7.75 x 8.50 x — 9.50 x
Implied Motorparts Enterprise Value from Operations Reference Range $1,932 — $2,181 $1,936 — $2,186 $2,021 — $2,320 $2,195 — $2,454
Consolidated Enterprise Value from Operations Range
Corresponding Base Amount $658 $684 $798 $719
Implied Consolidated Multiple Range 5.9 x — 6.9 x 5.7 x — 6.7 x 5.0 x — 6.0 x 6.9 x — 7.9 x
Consolidated Enterprise Value from Operations Reference Range¹ $3,871 — $4,529 $3,890 — $4,574 $4,010 — $4,806 $4,246 — $5,065 $4,957 — $5,675
Add: Cash and Cash Equivalents Attributable to the Company² $234 — $234 $234 — $234 $234 — $234 $234 — $234 $234 — $234
Add: Investments in Non-consolidated Affiliates (Cost Method)³ $8 — $8 $8 — $8 $8 — $8 $8 — $8 $8 — $8
Add: Real Estate Assets Held for Sale $39 — $39 $39 — $39 $39 — $39 $39 — $39 $39 — $39
Add: Value of NOLs and Tax Credits $79 — $79 $79 — $79 $79 — $79 $0 — $0 $79 — $79
Implied Total Enterprise Value Reference Range $4,231 — $4,889 $4,250 — $4,934 $4,370 — $5,166 $4,527 — $5,346 $5,317 — $6,036
Less: Debt Attributable to the Company $3,119 — $3,119 $3,119 — $3,119 $3,119 — $3,119 $3,119 — $3,119 $3,119 — $3,119
Less: Adjusted Underfunded Pension (and OPEB) Liability as of 3/31/2016 $0 — $0 $0 — $0 $0 — $0 $0 — $0 $1,052 — $935
Less: Net Environmental Liabilities $12 — $12 $12 — $12 $12 — $12 $12 — $12 $12 — $12
Less: Net Asset Retirement Obligations $5 — $5 $5 — $5 $5 — $5 $5 — $5 $5 — $5
Implied Total Equity Value Reference Range $1,095 — $1,753 $1,114 — $1,798 $1,234 — $2,030 $1,391 — $2,210 $1,129 — $1,964
Shares Outstanding¹ 169.0 — 169.0 169.0 — 169.0 169.0 — 169.0 169.0 — 169.0 169.0 — 169.0
Implied Per Share Equity Value Reference Range $6.48 — $10.37 $6.59 — $10.64 $7.30 — $12.01 $8.23 — $13.07 $6.68 — $11.62
CONFIDENTIAL—PRELIMINARY DRAFT—SUBJECT TO FURTHER REVIEW 37
|
|
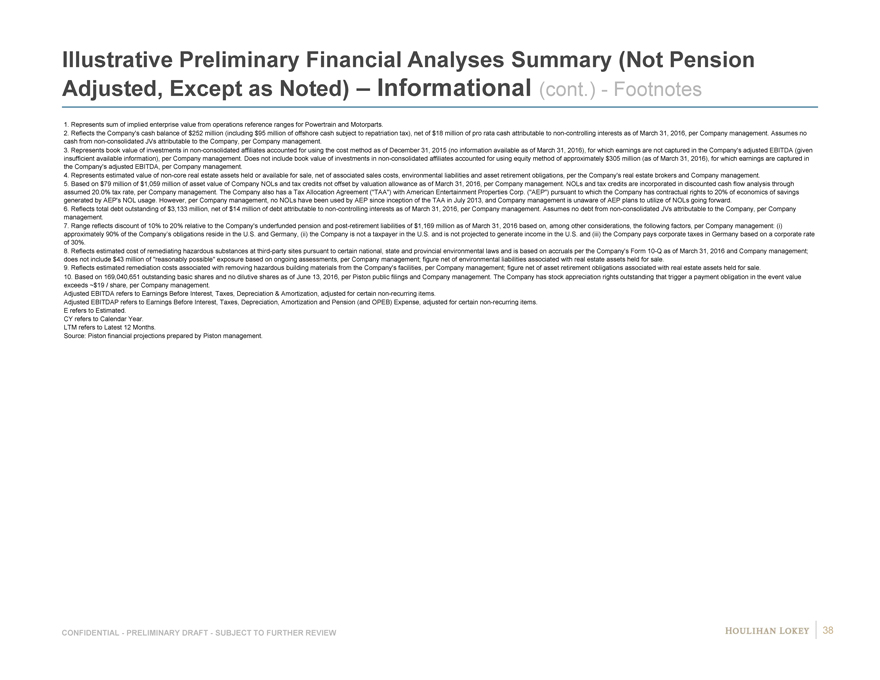
Illustrative Preliminary Financial Analyses Summary (Not Pension Adjusted, Except as Noted) – Informational (cont.)—Footnotes
1. Represents sum of implied enterprise value from operations reference ranges for Powertrain and Motorparts.
2. Reflects the Company’s cash balance of $252 million (including $95 million of offshore cash subject to repatriation tax), net of $18 million of pro rata cash attributable to non-controlling interests as of March 31, 2016, per Company management. Assumes no cash from non-consolidated JVs attributable to the Company, per Company management.
3. Represents book value of investments in non-consolidated affiliates accounted for using the cost method as of December 31, 2015 (no information available as of March 31, 2016), for which earnings are not captured in the Company’s adjusted EBITDA (given insufficient available information), per Company management. Does not include book value of investments in non-consolidated affiliates accounted for using equity method of approximately $305 million (as of March 31, 2016), for which earnings are captured in the Company’s adjusted EBITDA, per Company management.
4. Represents estimated value of non-core real estate assets held or available for sale, net of associated sales costs, environmental liabilities and asset retirement obligations, per the Company’s real estate brokers and Company management.
5. Based on $79 million of $1,059 million of asset value of Company NOLs and tax credits not offset by valuation allowance as of March 31, 2016, per Company management. NOLs and tax credits are incorporated in discounted cash flow analysis through assumed 20.0% tax rate, per Company management. The Company also has a Tax Allocation Agreement (“TAA”) with American Entertainment Properties Corp. (“AEP”) pursuant to which the Company has contractual rights to 20% of economics of savings generated by AEP’s NOL usage. However, per Company management, no NOLs have been used by AEP since inception of the TAA in July 2013, and Company management is unaware of AEP plans to utilize of NOLs going forward.
6. Reflects total debt outstanding of $3,133 million, net of $14 million of debt attributable to non-controlling interests as of March 31, 2016, per Company management. Assumes no debt from non-consolidated JVs attributable to the Company, per Company management.
7. Range reflects discount of 10% to 20% relative to the Company’s underfunded pension and post-retirement liabilities of $1,169 million as of March 31, 2016 based on, among other considerations, the following factors, per Company management: (i) approximately 90% of the Company’s obligations reside in the U.S. and Germany, (ii) the Company is not a taxpayer in the U.S. and is not projected to generate income in the U.S. and (iii) the Company pays corporate taxes in Germany based on a corporate rate of 30%.
8. Reflects estimated cost of remediating hazardous substances at third-party sites pursuant to certain national, state and provincial environmental laws and is based on accruals per the Company’s Form 10-Q as of March 31, 2016 and Company management; does not include $43 million of “reasonably possible” exposure based on ongoing assessments, per Company management; figure net of environmental liabilities associated with real estate assets held for sale.
9. Reflects estimated remediation costs associated with removing hazardous building materials from the Company’s facilities, per Company management; figure net of asset retirement obligations associated with real estate assets held for sale.
10. Based on 169,040,651 outstanding basic shares and no dilutive shares as of June 13, 2016, per Piston public filings and Company management. The Company has stock appreciation rights outstanding that trigger a payment obligation in the event value exceeds ~$19 / share, per Company management.
Adjusted EBITDA refers to Earnings Before Interest, Taxes, Depreciation & Amortization, adjusted for certain non-recurring items.
Adjusted EBITDAP refers to Earnings Before Interest, Taxes, Depreciation, Amortization and Pension (and OPEB) Expense, adjusted for certain non-recurring items. E refers to Estimated.
CY refers to Calendar Year. LTM refers to Latest 12 Months.
Source: Piston financial projections prepared by Piston management.
CONFIDENTIAL—PRELIMINARY DRAFT—SUBJECT TO FURTHER REVIEW 38
|
|
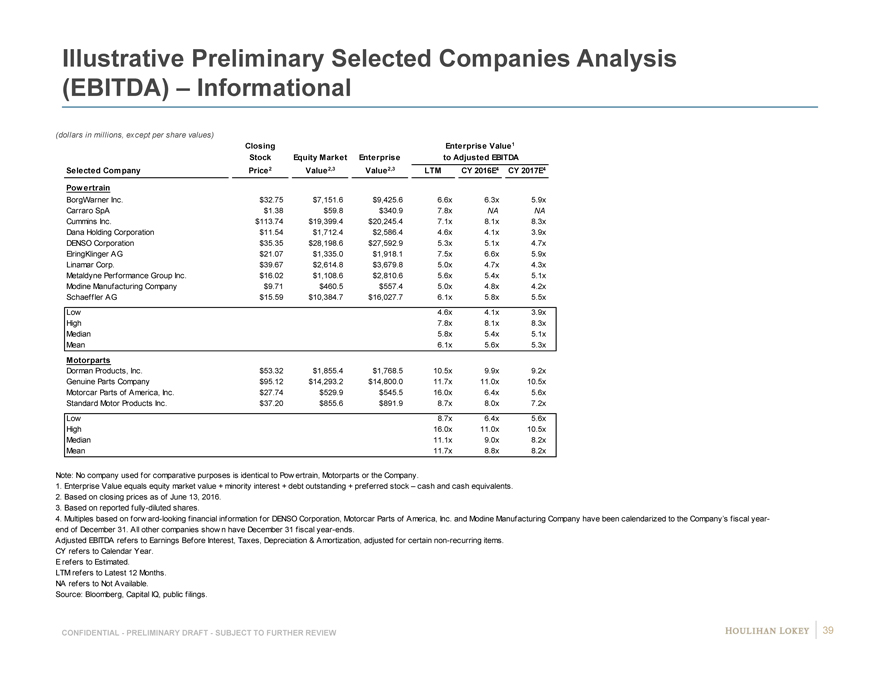
Illustrative Preliminary Selected Companies Analysis
(EBITDA) – Informational
(dollars in millions, except per share values)
Closing Enterprise Value1
Stock Equity Market Enterprise to Adjusted EBITDA
Selected Company Price 2 Value2,3 Value2,3 LTM CY 2016E4 CY 2017E4
Powertrain
BorgWarner Inc. $32.75 $7,151.6 $9,425.6 6.6x 6.3x 5.9x 6 9
Carraro SpA $1.38 $59.8 $340.9 7.8x NA NA N NA
Cummins Inc. $113.74 $19,399.4 $20,245.4 7.1x 8.1x 8.3x 8 #
Dana Holding Corporation $11.54 $1,712.4 $2,586.4 4.6x 4.1x 3.9x 4 7
DENSO Corporation $35.35 $28,198.6 $27,592.9 5.3x 5.1x 4.7x 5 #
ElringKlinger AG $21.07 $1,335.0 $1,918.1 7.5x 6.6x 5.9x 6 #
Linamar Corp. $39.67 $2,614.8 $3,679.8 5.0x 4.7x 4.3x 4 #
Metaldyne Performance Group Inc. $16.02 $1,108.6 $2,810.6 5.6x 5.4x 5.1x 5 8
Modine Manufacturing Company $9.71 $460.5 $557.4 5.0x 4.8x 4.2x 4 NA
Schaeffler AG $15.59 $10,384.7 $16,027.7 6.1x 5.8x 5.5x 5 9
Low 4.6x 4.1x 3.9x
High 7.8x 8.1x 8.3x
Median 5.8x 5.4x 5.1x
Mean 6.1x 5.6x 5.3x
Motorparts
Dorman Products, Inc. $53.32 $1,855.4 $1,768.5 10.5x 9.9x 9.2x 9 #
Genuine Parts Company $95.12 $14,293.2 $14,800.0 11.7x 11.0x 10.5x # #
Motorcar Parts of America, Inc. $27.74 $529.9 $545.5 16.0x 6.4x 5.6x 6 6
Standard Motor Products Inc. $37.20 $855.6 $891.9 8.7x 8.0x 7.2x 7 NA
Low 8.7x 6.4x 5.6x
High 16.0x 11.0x 10.5x
Median 11.1x 9.0x 8.2x
Mean 11.7x 8.8x 8.2x
Note: No company used for comparative purposes is identical to Pow ertrain, Motorparts or the Company.
1. Enterprise Value equals equity market value + minority interest + debt outstanding + preferred stock – cash and cash equivalents.
2. Based on closing prices as of June 13, 2016.
3. Based on reported fully-diluted shares.
4. Multiples based on forw ard-looking financial information for DENSO Corporation, Motorcar Parts of America, Inc. and Modine Manufacturing Company have been calendarized to the Company’s fiscal year-
end of December 31. All other companies show n have December 31 fiscal year-ends.
Adjusted EBITDA refers to Earnings Before Interest, Taxes, Depreciation & Amortization, adjusted for certain non-recurring items.
CY refers to Calendar Year.
E refers to Estimated.
LTM refers to Latest 12 Months.
NA refers to Not Available.
Source: Bloomberg, Capital IQ, public filings.
CONFIDENTIAL—PRELIMINARY DRAFT—SUBJECT TO FURTHER REVIEW 39
|
|
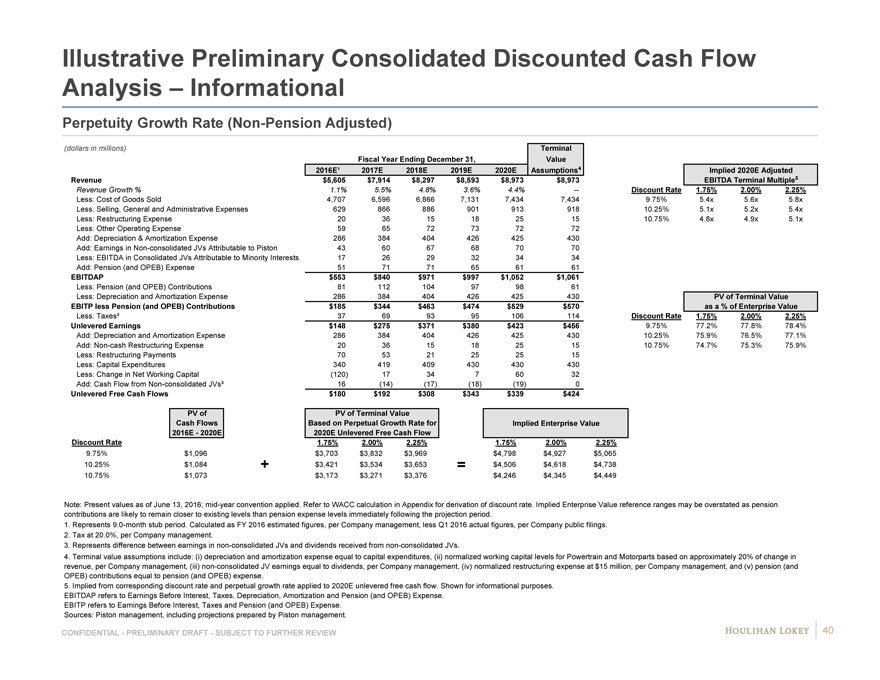
Illustrative Preliminary Consolidated Discounted Cash Flow Analysis – Informational
Perpetuity Growth Rate (Non-Pension Adjusted)
(dollars in millions) Terminal
Fiscal Year Ending December 31, Value
2016E¹ 2017E 2018E 2019E 2020E Assumptions
Revenue $5,605 $7,914 $8,297 $8,593 $8,973 $8,973
Revenue Growth % 1.1% 5.5% 4.8% 3.6% 4.4% —
Less: Cost of Goods Sold 4,707 6,596 6,866 7,131 7,434 7,434
Less: Selling, General and Administrative Expenses 629 866 886 901 913 918
Less: Restructuring Expense 20 36 15 18 25 15
Less: Other Operating Expense 59 65 72 73 72 72
Add: Depreciation & Amortization Expense 286 384 404 426 425 430
Add: Earnings in Non-consolidated JVs Attributable to Piston 43 60 67 68 70 70
Less: EBITDA in Consolidated JVs Attributable to Minority Interests 17 26 29 32 34 34
Add: Pension (and OPEB) Expense 51 71 71 65 61 61
EBITDAP $553 $840 $971 $997 $1,052 $1,061
Less: Pension (and OPEB) Contributions 81 112 104 97 98 61
Less: Depreciation and Amortization Expense 286 384 404 426 425 430
EBITP less Pension (and OPEB) Contributions $185 $344 $463 $474 $529 $570
Less: Taxes² 37 69 93 95 106 114
Unlevered Earnings $148 $275 $371 $380 $423 $456
Add: Depreciation and Amortization Expense 286 384 404 426 425 430
Add: Non-cash Restructuring Expense 20 36 15 18 25 15
Less: Restructuring Payments 70 53 21 25 25 15
Less: Capital Expenditures 340 419 409 430 430 430
Less: Change in Net Working Capital(120) 17 34 7 60 32
Add: Cash Flow from Non-consolidated JVs³ 16(14)(17)(18)(19) 0
Unlevered Free Cash Flows $180 $192 $308 $343 $339 $424
Implied 2020E Adjusted
EBITDA Terminal Multiple
Discount Rate 1.75% 2.00% 2.25%
9.75% 5.4x 5.6x 5.8x
10.25% 5.1x 5.2x 5.4x
10.75% 4.8x 4.9x 5.1x
PV of Terminal Value
as a % of Enterprise Value
Discount Rate 1.75% 2.00% 2.25%
9.75% 77.2% 77.8% 78.4%
10.25% 75.9% 76.5% 77.1%
10.75% 74.7% 75.3% 75.9%
PV of
Cash Flows
2016E—2020E
Discount Rate
9.75% 0.098 $ 1,096
10.25% 0.103 $ 1,084
10.75% 0.108 $ 1,073
PV of Terminal Value
Based on Perpetual Growth Rate for
2020E Unlevered Free Cash Flow
1.75% 2.00% 2.25%
$ 3,703 $ 3,832 $ 3,969
$ 3,421 $ 3,534 $3,653
$ 3,173 $ 3,271 $3,376
Implied Enterprise Value
1.75% 2.00% 2.25%
$ 4,798 $ 4,927 $ 5,065
$ 4,506 $ 4,618 $ 4,738
$ 4,246 $ 4,345 $ 4,449
Note: Present values as of June 13, 2016; mid-year convention applied. Refer to WACC calculation in Appendix for derivation of discount rate. Implied Enterprise Value reference ranges may be overstated as pension contributions are likely to remain closer to existing levels than pension expense levels immediately following the projection period.
1. Represents 9.0-month stub period. Calculated as FY 2016 estimated figures, per Company management, less Q1 2016 actual figures, per Company public filings.
2. Tax at 20.0%, per Company management.
3. Represents difference between earnings in non-consolidated JVs and dividends received from non-consolidated JVs.
4. Terminal value assumptions include: (i) depreciation and amortization expense equal to capital expenditures, (ii) normalized working capital levels for Powertrain and Motorparts based on approximately 20% of change in revenue, per Company management, (iii) non-consolidated JV earnings equal to dividends, per Company management, (iv) normalized restructuring expense at $15 million, per Company management, and (v) pension (and OPEB) contributions equal to pension (and OPEB) expense.
5. Implied from corresponding discount rate and perpetual growth rate applied to 2020E unlevered free cash flow. Shown for informational purposes.
EBITDAP refers to Earnings Before Interest, Taxes, Depreciation, Amortization and Pension (and OPEB) Expense. EBITP refers to Earnings Before Interest, Taxes and Pension (and OPEB) Expense.
Sources: Piston management, including projections prepared by Piston management.
CONFIDENTIAL—PRELIMINARY DRAFT—SUBJECT TO FURTHER REVIEW 40
|
|
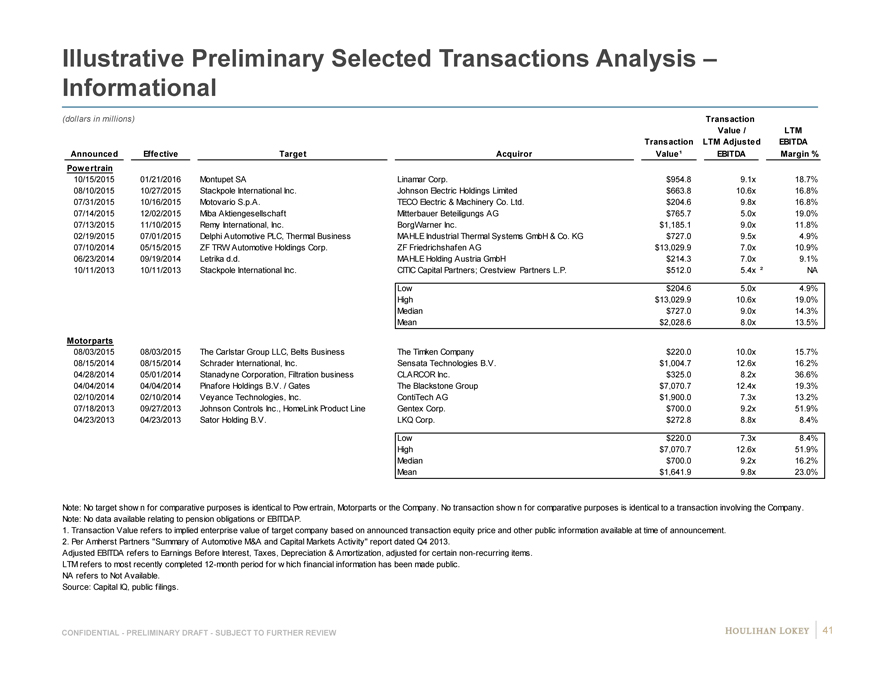
Illustrative Preliminary Selected Transactions Analysis –
Informational
(dollars in millions) Transaction
Value / LTM
Transaction LTM Adjusted EBITDA
Announced Effective Target Acquiror Value¹ EBITDA Margin %
Powertrain
10/15/2015 01/21/2016 Montupet SA Linamar Corp. $954.8 9.1x 18.7%
08/10/2015 10/27/2015 Stackpole International Inc. Johnson Electric Holdings Limited $663.8 10.6x 16.8%
07/31/2015 10/16/2015 Motovario S.p.A. TECO Electric & Machinery Co. Ltd. $204.6 9.8x 16.8%
07/14/2015 12/02/2015 Miba Aktiengesellschaft Mitterbauer Beteiligungs AG $765.7 5.0x 19.0%
07/13/2015 11/10/2015 Remy International, Inc. BorgWarner Inc. $1,185.1 9.0x 11.8%
02/19/2015 07/01/2015 Delphi Automotive PLC, Thermal Business MAHLE Industrial Thermal Systems GmbH & Co. KG $727.0 9.5x 4.9%
07/10/2014 05/15/2015 ZF TRW Automotive Holdings Corp. ZF Friedrichshafen AG $13,029.9 7.0x 10.9%
06/23/2014 09/19/2014 Letrika d.d. MAHLE Holding Austria GmbH $214.3 7.0x 9.1%
10/11/2013 10/11/2013 Stackpole International Inc. CITIC Capital Partners; Crestview Partners L.P. $512.0 5.4x ² NA N
Low $204.6 5.0x 4.9%
High $13,029.9 10.6x 19.0%
Median $727.0 9.0x 14.3%
Mean $2,028.6 8.0x 13.5%
Motorparts
08/03/2015 08/03/2015 The Carlstar Group LLC, Belts Business The Timken Company $220.0 10.0x 15.7%
08/15/2014 08/15/2014 Schrader International, Inc. Sensata Technologies B.V. $1,004.7 12.6x 16.2%
04/28/2014 05/01/2014 Stanadyne Corporation, Filtration business CLARCOR Inc. $325.0 8.2x 36.6%
04/04/2014 04/04/2014 Pinafore Holdings B.V. / Gates The Blackstone Group $7,070.7 12.4x 19.3%
02/10/2014 02/10/2014 Veyance Technologies, Inc. ContiTech AG $1,900.0 7.3x 13.2%
07/18/2013 09/27/2013 Johnson Controls Inc., HomeLink Product Line Gentex Corp. $700.0 9.2x 51.9%
04/23/2013 04/23/2013 Sator Holding B.V. LKQ Corp. $272.8 8.8x 8.4%
Low $220.0 7.3x 8.4%
High $7,070.7 12.6x 51.9%
Median $700.0 9.2x 16.2%
Mean $1,641.9 9.8x 23.0%
Note: No target show n for comparative purposes is identical to Pow ertrain, Motorparts or the Company. No transaction show n for comparative purposes is identical to a transaction involving the Company.
Note: No data available relating to pension obligations or EBITDAP.
1. Transaction Value refers to implied enterprise value of target company based on announced transaction equity price and other public information available at time of announcement.
2. Per Amherst Partners “Summary of Automotive M&A and Capital Markets Activity” report dated Q4 2013.
Adjusted EBITDA refers to Earnings Before Interest, Taxes, Depreciation & Amortization, adjusted for certain non-recurring items.
LTM refers to most recently completed 12-month period for w hich financial information has been made public.
NA refers to Not Available.
Source: Capital IQ, public filings.
CONFIDENTIAL—PRELIMINARY DRAFT—SUBJECT TO FURTHER REVIEW 41
|
|
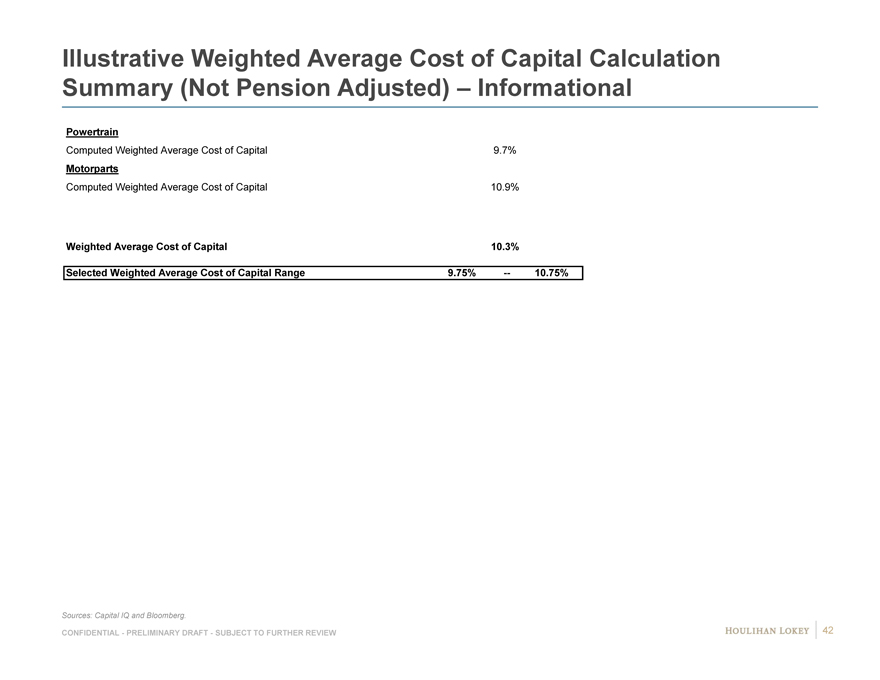
Illustrative Weighted Average Cost of Capital Calculation
Summary (Not Pension Adjusted) – Informational
Powertrain
Computed Weighted Average Cost of Capital 9.7%
Motorparts
Computed Weighted Average Cost of Capital 10.9%
Weighted Average Cost of Capital 10.3%
Selected Weighted Average Cost of Capital Range 9.75% — 10.75%
Sources: Capital IQ and Bloomberg.
CONFIDENTIAL—PRELIMINARY DRAFT—SUBJECT TO FURTHER REVIEW 42
|
|
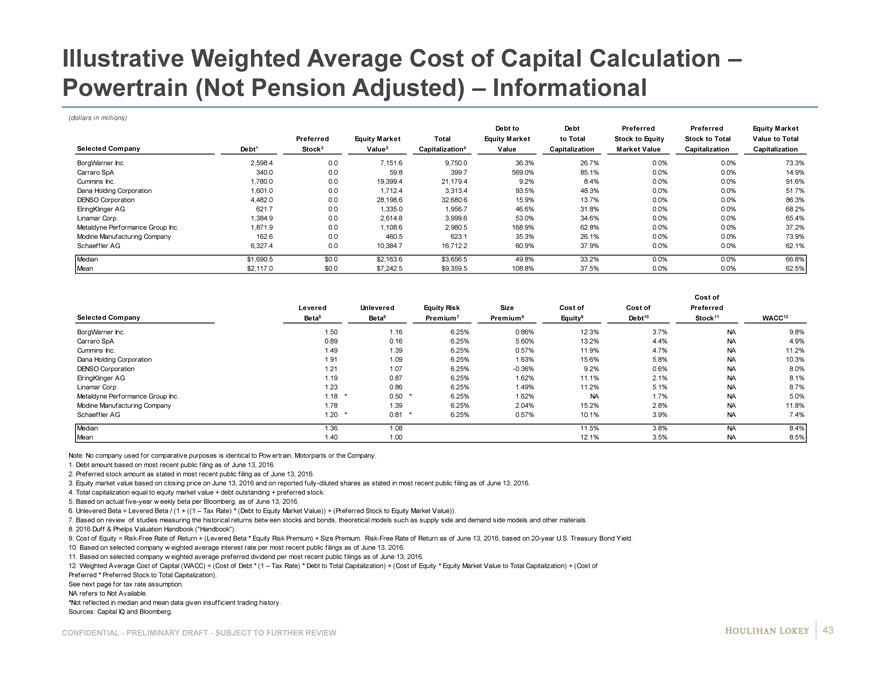
Illustrative Weighted Average Cost of Capital Calculation –
Powertrain (Not Pension Adjusted) – Informational
(dollars in millions)
Debt to Debt Preferred Preferred Equity Market
Preferred Equity Market Total Equity Market to Total Stock to Equity Stock to Total Value to Total
Selected Company Debt1 Stock2 Value3 Capitalization4 Value Capitalization Market Value Capitalization Capitalization
BorgWarner Inc. 2,598.4 # 0.0 # 7,151.6 # 9,750.0 # 36.3% # 26.7% # 0.0% # 0.0% # 73.3%
Carraro SpA 340.0 # 0.0 # 59.8 # 399.7 # 569.0% # 85.1% # 0.0% # 0.0% # 14.9%
Cummins Inc. 1,780.0 # 0.0 # 19,399.4 # 21,179.4 # 9.2% # 8.4% # 0.0% # 0.0% # 91.6%
Dana Holding Corporation 1,601.0 # 0.0 # 1,712.4 # 3,313.4 # 93.5% # 48.3% # 0.0% # 0.0% # 51.7%
DENSO Corporation 4,482.0 # 0.0 # 28,198.6 # 32,680.6 # 15.9% # 13.7% # 0.0% # 0.0% # 86.3%
ElringKlinger AG 621.7 # 0.0 # 1,335.0 # 1,956.7 # 46.6% # 31.8% # 0.0% # 0.0% # 68.2%
Linamar Corp. 1,384.9 # 0.0 # 2,614.8 # 3,999.6 # 53.0% # 34.6% # 0.0% # 0.0% # 65.4%
Metaldyne Performance Group Inc. 1,871.9 # 0.0 # 1,108.6 # 2,980.5 # 168.9% # 62.8% # 0.0% # 0.0% # 37.2%
Modine Manufacturing Company 162.6 # 0.0 # 460.5 # 623.1 # 35.3% # 26.1% # 0.0% # 0.0% # 73.9%
Schaeffler AG 6,327.4 # 0.0 # 10,384.7 # 16,712.2 # 60.9% # 37.9% # 0.0% # 0.0% # 62.1%
Median $ 1,690.5 $ 0.0 $ 2,163.6 $ 3,656.5 49.8% 33.2% 0.0% 0.0% 66.8%
Mean $ 2,117.0 $ 0.0 $ 7,242.5 $ 9,359.5 108.8% 37.5% 0.0% 0.0% 62.5%
Cost of
Levered Unlevered Equity Risk Size Cost of Cost of Preferred
Selected Company Beta5 Beta6 Premium 7 Premium 8 Equity9 Debt10 Stock11 WACC12
BorgWarner Inc. 1.50 # 1.16 # 6.25% 0.86% 12.3% # 3.7% # NA # 9.8%
Carraro SpA 0.89 # 0.16 # 6.25% 5.60% 13.2% # 4.4% # NA # 4.9%
Cummins Inc. 1.49 # 1.39 # 6.25% 0.57% 11.9% # 4.7% # NA # 11.2%
Dana Holding Corporation 1.91 # 1.09 # 6.25% 1.63% 15.6% # 5.8% # NA # 10.3%
DENSO Corporation 1.21 # 1.07 # 6.25% -0.36% 9.2% # 0.6% # NA # 8.0%
ElringKlinger AG 1.19 # 0.87 # 6.25% 1.62% 11.1% # 2.1% # NA # 8.1%
Linamar Corp. 1.23 # 0.86 # 6.25% 1.49% 11.2% # 5.1% # NA # 8.7%
Metaldyne Performance Group Inc. 1.18* 0.50* 6.25% 1.62% NA # 1.7% # NA # 5.0%
Modine Manufacturing Company 1.78 # 1.39 # 6.25% 2.04% 15.2% # 2.8% # NA # 11.8%
Schaeffler AG 1.20* 0.81* 6.25% 0.57% 10.1% # 3.9% # NA # 7.4%
Median 1.36 1.08 11.5% 3.8% NA 8.4%
Mean 1.40 1.00 12.1% 3.5% NA 8.5%
Note: No company used for comparative purposes is identical to Pow ertrain, Motorparts or the Company.
1. Debt amount based on most recent public filing as of June 13, 2016.
2. Preferred stock amount as stated in most recent public filing as of June 13, 2016.
3. Equity market value based on closing price on June 13, 2016 and on reported fully-diluted shares as stated in most recent public filing as of June 13, 2016.
4. Total capitalization equal to equity market value + debt outstanding + preferred stock.
5. Based on actual five-year w eekly beta per Bloomberg, as of June 13, 2016.
6. Unlevered Beta = Levered Beta / (1 + ((1 – Tax Rate) * (Debt to Equity Market Value)) + (Preferred Stock to Equity Market Value)).
7. Based on review of studies measuring the historical returns betw een stocks and bonds, theoretical models such as supply side and demand side models and other materials.
8. 2016 Duff & Phelps Valuation Handbook (“Handbook”).
9. Cost of Equity = Risk-Free Rate of Return + (Levered Beta * Equity Risk Premium) + Size Premium. Risk-Free Rate of Return as of June 13, 2016, based on 20-year U.S. Treasury Bond Yield.
10. Based on selected company w eighted average interest rate per most recent public filings as of June 13, 2016.
11. Based on selected company w eighted average preferred dividend per most recent public filings as of June 13, 2016.
12. Weighted Average Cost of Capital (WACC) = (Cost of Debt * (1 – Tax Rate) * Debt to Total Capitalization) + (Cost of Equity * Equity Market Value to Total Capitalization) + (Cost of
Preferred * Preferred Stock to Total Capitalization).
See next page for tax rate assumption.
NA refers to Not Available.
*Not reflected in median and mean data given insufficient trading history.
Sources: Capital IQ and Bloomberg.
CONFIDENTIAL—PRELIMINARY DRAFT—SUBJECT TO FURTHER REVIEW 43
|
|
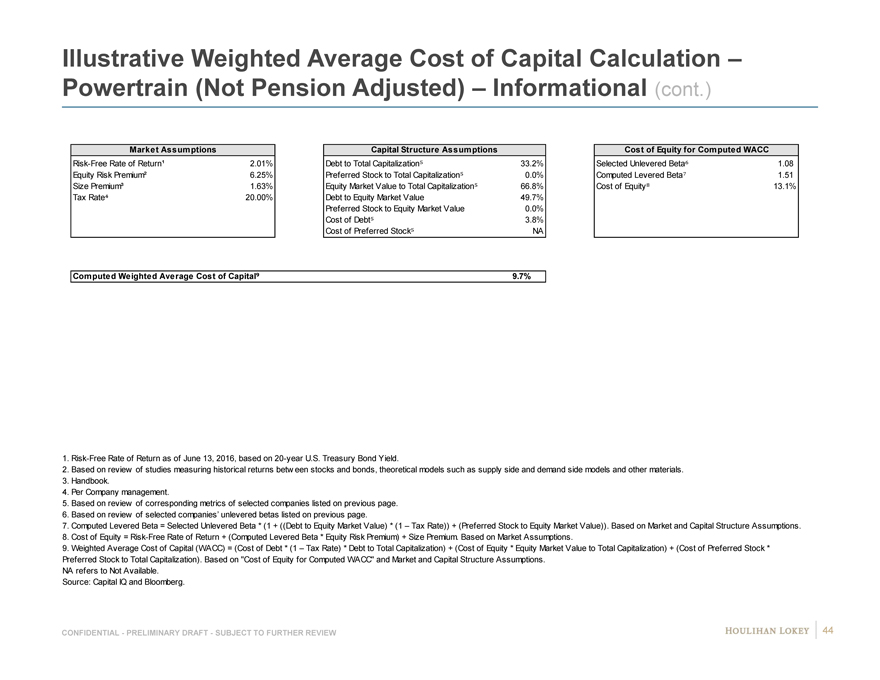
Illustrative Weighted Average Cost of Capital Calculation –Powertrain (Not Pension Adjusted) – Informational (cont.)
Market Assumptions
Risk-Free Rate of Return¹ 2.01%
Equity Risk Premium² 6.25%
Size Premium³ 1.63%
Tax Rate 20.00%
Capital Structure Assumptions
Debt to Total Capitalization 33.2%
Preferred Stock to Total Capitalization 0.0%
Equity Market Value to Total Capitalization 66.8%
Debt to Equity Market Value 49.7%
Preferred Stock to Equity Market Value 0.0%
Cost of Debt 3.8%
Cost of Preferred Stock NA
Cost of Equity for Computed WACC
Selected Unlevered Beta 1.08
Computed Levered Beta 1.51
Cost of Equity 13.1%
Computed Weighted Average Cost of Capital 9.7%
1. Risk-Free Rate of Return as of June 13, 2016, based on 20-year U.S. Treasury Bond Yield.
2. Based on review of studies measuring historical returns betw een stocks and bonds, theoretical models such as supply side and demand side models and other materials.
3. Handbook.
4. Per Company management.
5. Based on review of corresponding metrics of selected companies listed on previous page.
6. Based on review of selected companies’ unlevered betas listed on previous page.
7. Computed Levered Beta = Selected Unlevered Beta * (1 + ((Debt to Equity Market Value) * (1 – Tax Rate)) + (Preferred Stock to Equity Market Value)). Based on Market and Capital Structure Assumptions.
8. Cost of Equity = Risk-Free Rate of Return + (Computed Levered Beta * Equity Risk Premium) + Size Premium. Based on Market Assumptions.
9. Weighted Average Cost of Capital (WACC) = (Cost of Debt * (1 – Tax Rate) * Debt to Total Capitalization) + (Cost of Equity * Equity Market Value to Total Capitalization) + (Cost of Preferred Stock * Preferred Stock to Total Capitalization). Based on “Cost of Equity for Computed WACC” and Market and Capital Structure Assumptions.
NA refers to Not Available. Source: Capital IQ and Bloomberg.
CONFIDENTIAL—PRELIMINARY DRAFT—SUBJECT TO FURTHER REVIEW 44
|
|
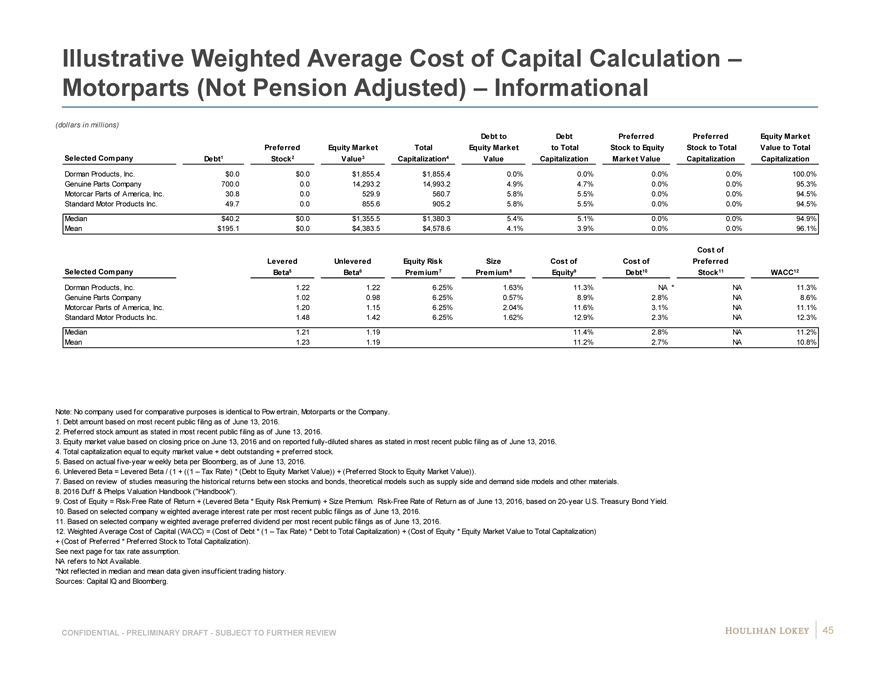
Illustrative Weighted Average Cost of Capital Calculation –
Motorparts (Not Pension Adjusted) – Informational
(dollars in millions)
Debt to Debt Preferred Preferred Equity Market
Preferred Equity Market Total Equity Market to Total Stock to Equity Stock to Total Value to Total
Selected Company Debt1 Stock2 Value3 Capitalization4 Value Capitalization Market Value Capitalization Capitalization
Dorman Products, Inc. $0.0 # $0.0 # $1,855.4 # $1,855.4 # 0.0% # 0.0% # 0.0% # 0.0% # 100.0%
Genuine Parts Company 700.0 # 0.0 # 14,293.2 # 14,993.2 # 4.9% # 4.7% # 0.0% # 0.0% # 95.3%
Motorcar Parts of America, Inc. 30.8 # 0.0 # 529.9 # 560.7 # 5.8% # 5.5% # 0.0% # 0.0% # 94.5%
Standard Motor Products Inc. 49.7 # 0.0 # 855.6 # 905.2 # 5.8% # 5.5% # 0.0% # 0.0% # 94.5%
Median $40.2 $0.0 $1,355.5 $1,380.3 5.4% 5.1% 0.0% 0.0% 94.9%
Mean $195.1 $0.0 $4,383.5 $4,578.6 4.1% 3.9% 0.0% 0.0% 96.1%
Cost of
Levered Unlevered Equity Risk Size Cost of Cost of Preferred
Selected Company Beta5 Beta6 Premium 7 Premium 8 Equity9 Debt10 Stock11 WACC12
Dorman Products, Inc. 1.22 # 1.22 # 6.25% 1.63% 11.3% # NA * NA # 11.3%
Genuine Parts Company 1.02 # 0.98 # 6.25% 0.57% 8.9% # 2.8% # NA # 8.6%
Motorcar Parts of America, Inc. 1.20 # 1.15 # 6.25% 2.04% 11.6% # 3.1% # NA # 11.1%
Standard Motor Products Inc. 1.48 # 1.42 # 6.25% 1.62% 12.9% # 2.3% # NA # 12.3%
Median 1.21 1.19 11.4% 2.8% NA 11.2%
Mean 1.23 1.19 11.2% 2.7% NA 10.8%
Note: No company used for comparative purposes is identical to Pow ertrain, Motorparts or the Company.
1. Debt amount based on most recent public filing as of June 13, 2016.
2. Preferred stock amount as stated in most recent public filing as of June 13, 2016.
3. Equity market value based on closing price on June 13, 2016 and on reported fully-diluted shares as stated in most recent public filing as of June 13, 2016.
4. Total capitalization equal to equity market value + debt outstanding + preferred stock.
5. Based on actual five-year w eekly beta per Bloomberg, as of June 13, 2016.
6. Unlevered Beta = Levered Beta / (1 + ((1 – Tax Rate) * (Debt to Equity Market Value)) + (Preferred Stock to Equity Market Value)).
7. Based on review of studies measuring the historical returns betw een stocks and bonds, theoretical models such as supply side and demand side models and other materials.
8. 2016 Duff & Phelps Valuation Handbook (“Handbook”).
9. Cost of Equity = Risk-Free Rate of Return + (Levered Beta * Equity Risk Premium) + Size Premium. Risk-Free Rate of Return as of June 13, 2016, based on 20-year U.S. Treasury Bond Yield.
10. Based on selected company w eighted average interest rate per most recent public filings as of June 13, 2016.
11. Based on selected company w eighted average preferred dividend per most recent public filings as of June 13, 2016.
12. Weighted Average Cost of Capital (WACC) = (Cost of Debt * (1 – Tax Rate) * Debt to Total Capitalization) + (Cost of Equity * Equity Market Value to Total Capitalization)
+ (Cost of Preferred * Preferred Stock to Total Capitalization).
See next page for tax rate assumption.
NA refers to Not Available.
*Not reflected in median and mean data given insufficient trading history.
Sources: Capital IQ and Bloomberg.
CONFIDENTIAL—PRELIMINARY DRAFT—SUBJECT TO FURTHER REVIEW 45
|
|

Illustrative Weighted Average Cost of Capital Calculation –
Motorparts (Not Pension Adjusted) – Informational (cont.)
Market Assumptions
Risk-Free Rate of Return¹ 2.01%
Equity Risk Premium² 6.25%
Size Premium³ 1.63%
Tax Rate 20.00%
Capital Structure Assumptions
Debt to Total Capitalization 5.1%
Preferred Stock to Total Capitalization 0.0%
Equity Market Value to Total Capitalization 94.9%
Debt to Equity Market Value 5.3%
Preferred Stock to Equity Market Value 0.0%
Cost of Debt 2.8%
Cost of Preferred Stock NA
Cost of Equity for Computed WACC
Selected Unlevered Beta 1.19
Computed Levered Beta 1.24
Cost of Equity 11.4%
Computed Weighted Average Cost of Capital 10.9%
1. Risk-Free Rate of Return as of June 13, 2016, based on 20-year U.S. Treasury Bond Yield.
2. Based on review of studies measuring historical returns betw een stocks and bonds, theoretical models such as supply side and demand side models and other materials.
3. Handbook.
4. Per Company management.
5. Based on review of corresponding metrics of selected companies listed on previous page.
6. Based on review of selected companies’ unlevered betas listed on previous page.
7. Computed Levered Beta = Selected Unlevered Beta * (1 + ((Debt to Equity Market Value) * (1 – Tax Rate)) + (Preferred Stock to Equity Market Value)). Based on Market and Capital Structure Assumptions.
8. Cost of Equity = Risk-Free Rate of Return + (Computed Levered Beta * Equity Risk Premium) + Size Premium. Based on Market Assumptions.
9. Weighted Average Cost of Capital (WACC) = (Cost of Debt * (1 – Tax Rate) * Debt to Total Capitalization) + (Cost of Equity * Equity Market Value to Total Capitalization) + (Cost of Preferred Stock *
Preferred Stock to Total Capitalization). Based on “Cost of Equity for Computed WACC” and Market and Capital Structure Assumptions.
NA refers to Not Available.
Source: Capital IQ and Bloomberg.
CONFIDENTIAL—PRELIMINARY DRAFT—SUBJECT TO FURTHER REVIEW 46
|
|
Page
1. Selected Public Market Observations 3
2. Preliminary Financial Analyses 7
3. Appendix 17
Cost of Capital Considerations 18 Benchmarking 24 Company Financial Performance Observations 28 Premiums Paid Observations 32 Illustrative Preliminary Financial Analyses (EBITDA) 35 Selected Excerpt from June 1, 2016 Preliminary Discussion Materials: 47 Items Subject to Further Review Selected Excerpts from May 11, 2016 / June 1, 2016 Preliminary 49 Discussion Materials: Illustrative Sensitivities
4. Disclaimer 53
|
|
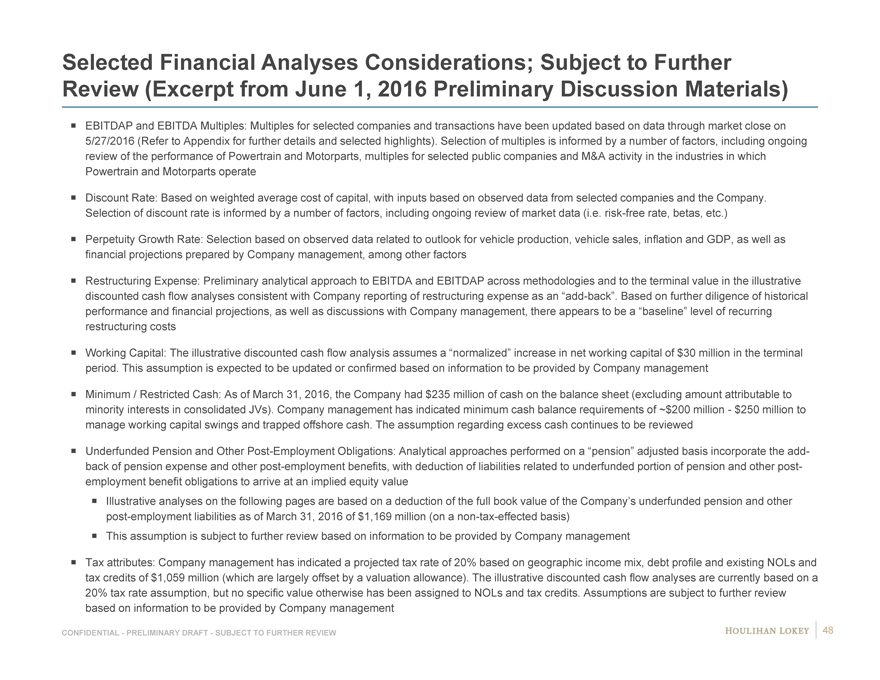
Selected Financial Analyses Considerations; Subject to Further Review (Excerpt from June 1, 2016 Preliminary Discussion Materials)
EBITDAP and EBITDA Multiples: Multiples for selected companies and transactions have been updated based on data through market close on 5/27/2016 (Refer to Appendix for further details and selected highlights). Selection of multiples is informed by a number of factors, including ongoing review of the performance of Powertrain and Motorparts, multiples for selected public companies and M&A activity in the industries in which Powertrain and Motorparts operate
Discount Rate: Based on weighted average cost of capital, with inputs based on observed data from selected companies and the Company. Selection of discount rate is informed by a number of factors, including ongoing review of market data (i.e. risk-free rate, betas, etc.)
Perpetuity Growth Rate: Selection based on observed data related to outlook for vehicle production, vehicle sales, inflation and GDP, as well as financial projections prepared by Company management, among other factors
Restructuring Expense: Preliminary analytical approach to EBITDA and EBITDAP across methodologies and to the terminal value in the illustrative discounted cash flow analyses consistent with Company reporting of restructuring expense as an “add-back”. Based on further diligence of historical performance and financial projections, as well as discussions with Company management, there appears to be a “baseline” level of recurring restructuring costs
Working Capital: The illustrative discounted cash flow analysis assumes a “normalized” increase in net working capital of $30 million in the terminal period. This assumption is expected to be updated or confirmed based on information to be provided by Company management
Minimum / Restricted Cash: As of March 31, 2016, the Company had $235 million of cash on the balance sheet (excluding amount attributable to minority interests in consolidated JVs). Company management has indicated minimum cash balance requirements of ~$200 million—$250 million to manage working capital swings and trapped offshore cash. The assumption regarding excess cash continues to be reviewed
Underfunded Pension and Other Post-Employment Obligations: Analytical approaches performed on a “pension” adjusted basis incorporate the add-back of pension expense and other post-employment benefits, with deduction of liabilities related to underfunded portion of pension and other post-employment benefit obligations to arrive at an implied equity value Illustrative analyses on the following pages are based on a deduction of the full book value of the Company’s underfunded pension and other post-employment liabilities as of March 31, 2016 of $1,169 million (on a non-tax-effected basis) This assumption is subject to further review based on information to be provided by Company management
Tax attributes: Company management has indicated a projected tax rate of 20% based on geographic income mix, debt profile and existing NOLs and tax credits of $1,059 million (which are largely offset by a valuation allowance). The illustrative discounted cash flow analyses are currently based on a 20% tax rate assumption, but no specific value otherwise has been assigned to NOLs and tax credits. Assumptions are subject to further review based on information to be provided by Company management
CONFIDENTIAL—PRELIMINARY DRAFT—SUBJECT TO FURTHER REVIEW 48
|
|
Page
1. Selected Public Market Observations 3
2. Preliminary Financial Analyses 7
3. Appendix 17 Cost of Capital Considerations 18 Benchmarking 24 Company Financial Performance Observations 28 Premiums Paid Observations 32 Illustrative Preliminary Financial Analyses (EBITDA) 35 Selected Excerpt from June 1, 2016 Preliminary Discussion Materials: 47 Items Subject to Further Review Selected Excerpts from May 11, 2016 / June 1, 2016 Preliminary 49 Discussion Materials: Illustrative Sensitivities
4. Disclaimer 53
|
|
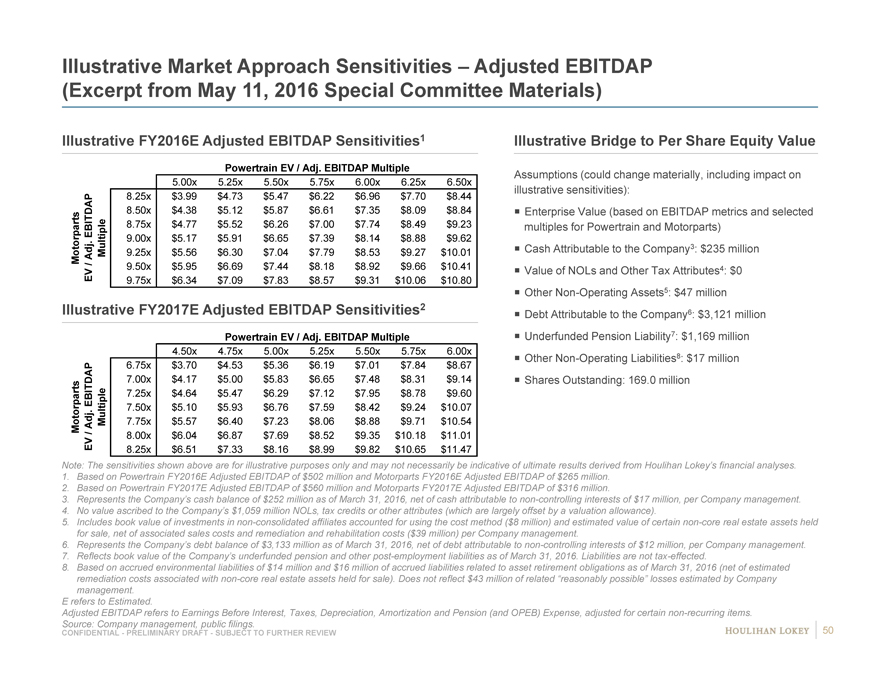
Illustrative Market Approach Sensitivities – Adjusted EBITDAP (Excerpt from May 11, 2016 Special Committee Materials)
Illustrative FY2016E Adjusted EBITDAP Sensitivities1
Powertrain EV / Adj. EBITDAP Multiple
| $8.85 |
|
5.00x 5.25x 5.50x 5.75x 6.00x 6.25x 6.50x |
| 8.25x |
|
$3.99 $4.73 $5.47 $6.22 $6.96 $7.70 $8.44 |
| 8.50x |
|
$4.38 $5.12 $5.87 $6.61 $7.35 $8.09 $8.84 |
EBITDAP 8.75x $4.77 $5.52 $6.26 $7.00 $7.74 $8.49 $9.23
. 9.00x $5.17 $5.91 $6.65 $7.39 $8.14 $8.88 $9.62
Motorparts Adj Multiple 9.25x $5.56 $6.30 $7.04 $7.79 $8.53 $9.27 $10.01
/ 9.50x $5.95 $6.69 $7.44 $8.18 $8.92 $9.66 $10.41
EV 9.75x $6.34 $7.09 $7.83 $8.57 $9.31 $10.06 $10.80
Illustrative FY2017E Adjusted EBITDAP Sensitivities2
Powertrain EV / Adj. EBITDAP Multiple
| $11.94 |
|
4.50x 4.75x 5.00x 5.25x 5.50x 5.75x 6.00x |
| 6.75x |
|
$3.70 $4.53 $5.36 $6.19 $7.01 $7.84 $8.67 |
| 7.00x |
|
$4.17 $5.00 $5.83 $6.65 $7.48 $8.31 $9.14 |
EBITDAP 7.25x $4.64 $5.47 $6.29 $7.12 $7.95 $8.78 $9.60
. 7.50x $5.10 $5.93 $6.76 $7.59 $8.42 $9.24 $10.07
Motorparts Adj Multiple 7.75x $5.57 $6.40 $7.23 $8.06 $8.88 $9.71 $10.54
/ 8.00x $6.04 $6.87 $7.69 $8.52 $9.35 $10.18 $11.01
EV 8.25x $6.51 $7.33 $8.16 $8.99 $9.82 $10.65 $11.47
Illustrative Bridge to Per Share Equity Value
Assumptions (could change materially, including impact on illustrative sensitivities): Enterprise Value (based on EBITDAP metrics and selected multiples for Powertrain and Motorparts) Cash Attributable to the Company3: $235 million Value of NOLs and Other Tax Attributes4: $0 Other Non-Operating Assets5: $47 million Debt Attributable to the Company6: $3,121 million Underfunded Pension Liability7: $1,169 million Other Non-Operating Liabilities8: $17 million Shares Outstanding: 169.0 million
Note: The sensitivities shown above are for illustrative purposes only and may not necessarily be indicative of ultimate results derived from Houlihan Lokey’s financial analyses.
1. Based on Powertrain FY2016E Adjusted EBITDAP of $502 million and Motorparts FY2016E Adjusted EBITDAP of $265 million.
2. Based on Powertrain FY2017E Adjusted EBITDAP of $560 million and Motorparts FY2017E Adjusted EBITDAP of $316 million.
3. Represents the Company’s cash balance of $252 million as of March 31, 2016, net of cash attributable to non-controlling interests of $17 million, per Company management.
4. No value ascribed to the Company’s $1,059 million NOLs, tax credits or other attributes (which are largely offset by a valuation allowance).
5. Includes book value of investments in non-consolidated affiliates accounted for using the cost method ($8 million) and estimated value of certain non-core real estate assets held for sale, net of associated sales costs and remediation and rehabilitation costs ($39 million) per Company management.
6. Represents the Company’s debt balance of $3,133 million as of March 31, 2016, net of debt attributable to non-controlling interests of $12 million, per Company management.
7. Reflects book value of the Company’s underfunded pension and other post-employment liabilities as of March 31, 2016. Liabilities are not tax-effected.
8. Based on accrued environmental liabilities of $14 million and $16 million of accrued liabilities related to asset retirement obligations as of March 31, 2016 (net of estimated remediation costs associated with non-core real estate assets held for sale). Does not reflect $43 million of related “reasonably possible” losses estimated by Company management.
E refers to Estimated.
Adjusted EBITDAP refers to Earnings Before Interest, Taxes, Depreciation, Amortization and Pension (and OPEB) Expense, adjusted for certain non-recurring items. Source: Company management, public filings.
CONFIDENTIAL—PRELIMINARY DRAFT—SUBJECT TO FURTHER REVIEW 50
|
|
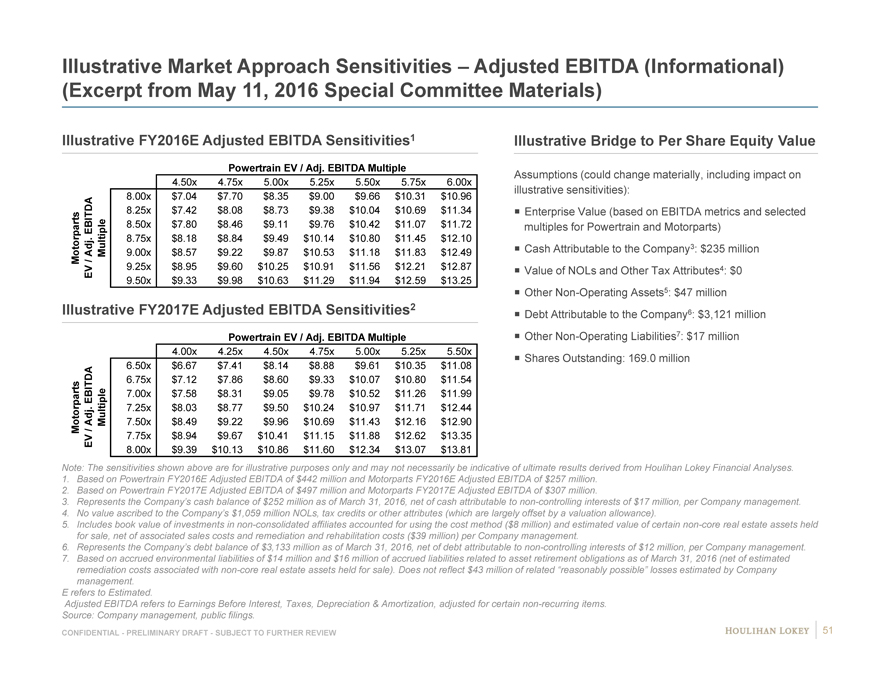
Illustrative Market Approach Sensitivities Adjusted EBITDA (Informational) (Excerpt from May 11, 2016 Special Committee Materials)
Illustrative FY2016E Adjusted EBITDA Sensitivities1
Powertrain EV / Adj. EBITDA Multiple
$8.85 4.50x 4.75x 5.00x 5.25x 5.50x 5.75x 6.00x
8.00x $7.04 $7.70 $8.35 $9.00 $9.66 $ 10.31 $ 10.96
8.25x $7.42 $8.08 $8.73 $9.38 $10.04 $ 10.69 $ 11.34
EBITDA 8.50x $7.80 $8.46 $9.11 $9.76 $10.42 $ 11.07 $ 11.72
Adj. 8.75x $8.18 $8.84 $9.49 $10.14 $10.80 $ 11.45 $ 12.10
9.00x $8.57 $9.22 $9.87 $10.53 $11.18 $ 11.83 $ 12.49
Motorparts / Multiple
EV 9.25x $8.95 $9.60 $10.25 $10.91 $11.56 $ 12.21 $ 12.87
9.50x $9.33 $9.98 $10.63 $11.29 $11.94 $ 12.59 $ 13.25
Illustrative FY2017E Adjusted EBITDA Sensitivities2
Powertrain EV / Adj. EBITDA Multiple
$16.18 4.00x 4.25x 4.50x 4.75x 5.00x 5.25x 5.50x
6.50x $6.67 $7.41 $8.14 $8.88 $9.61 $ 10.35 $ 11.08
6.75x $7.12 $7.86 $8.60 $9.33 $10.07 $ 10.80 $ 11.54
EBITDA 7.00x $7.58 $8.31 $9.05 $9.78 $10.52 $ 11.26 $ 11.99
. 7.25x $8.03 $8.77 $9.50 $10.24 $10.97 $ 11.71 $ 12.44
Adj 7.50x $8.49 $9.22 $9.96 $10.69 $11.43 $ 12.16 $ 12.90
Motorparts / Multiple
EV 7.75x $8.94 $9.67 $10.41 $11.15 $11.88 $ 12.62 $ 13.35
8.00x $9.39 $10.13 $10.86 $11.60 $12.34 $ 13.07 $ 13.81
Illustrative Bridge to Per Share Equity Value
Assumptions (could change materially, including impact on illustrative sensitivities): Enterprise Value (based on EBITDA metrics and selected multiples for Powertrain and Motorparts) Cash Attributable to the Company3: $235 million Value of NOLs and Other Tax Attributes4: $0 Other Non-Operating Assets5: $47 million Debt Attributable to the Company6: $3,121 million Other Non-Operating Liabilities7: $17 million Shares Outstanding: 169.0 million
Note: The sensitivities shown above are for illustrative purposes only and may not necessarily be indicative of ultimate results derived from Houlihan Lokey Financial Analyses.
1. Based on Powertrain FY2016E Adjusted EBITDA of $442 million and Motorparts FY2016E Adjusted EBITDA of $257 million.
2. Based on Powertrain FY2017E Adjusted EBITDA of $497 million and Motorparts FY2017E Adjusted EBITDA of $307 million.
3. Represents the Company’s cash balance of $252 million as of March 31, 2016, net of cash attributable to non-controlling interests of $17 million, per Company management.
4. No value ascribed to the Company’s $1,059 million NOLs, tax credits or other attributes (which are largely offset by a valuation allowance).
5. Includes book value of investments in non-consolidated affiliates accounted for using the cost method ($8 million) and estimated value of certain non-core real estate assets held for sale, net of associated sales costs and remediation and rehabilitation costs ($39 million) per Company management.
6. Represents the Company’s debt balance of $3,133 million as of March 31, 2016, net of debt attributable to non-controlling interests of $12 million, per Company management.
7. Based on accrued environmental liabilities of $14 million and $16 million of accrued liabilities related to asset retirement obligations as of March 31, 2016 (net of estimated remediation costs associated with non-core real estate assets held for sale). Does not reflect $43 million of related “reasonably possible” losses estimated by Company management.
E refers to Estimated.
Adjusted EBITDA refers to Earnings Before Interest, Taxes, Depreciation & Amortization, adjusted for certain non-recurring items. Source: Company management, public filings.
CONFIDENTIAL—PRELIMINARY DRAFT—SUBJECT TO FURTHER REVIEW 51
|
|
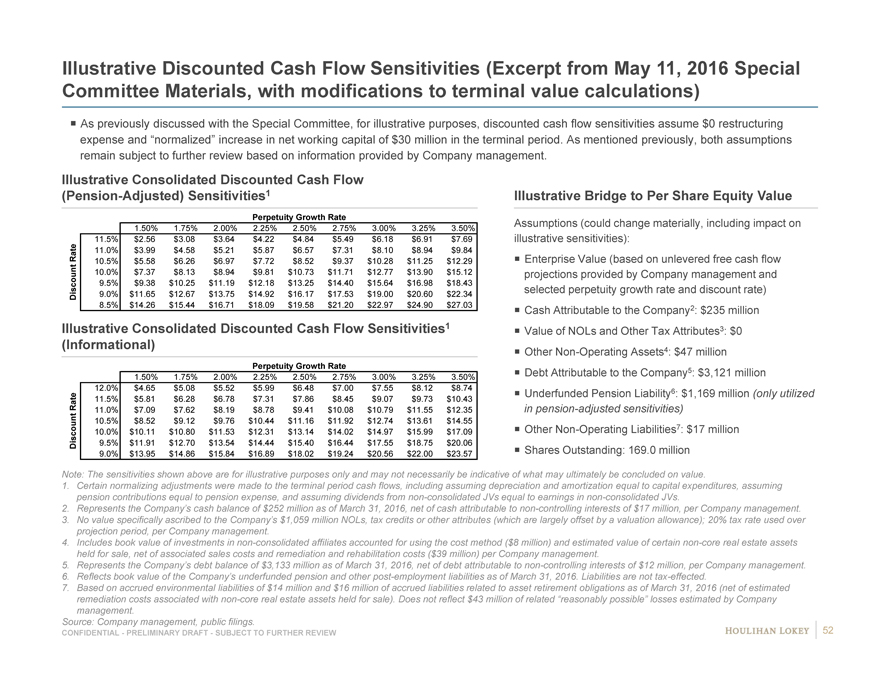
Illustrative Discounted Cash Flow Sensitivities (Excerpt from May 11, 2016 Special Committee Materials, with modifications to terminal value calculations)
As previously discussed with the Special Committee, for illustrative purposes, discounted cash flow sensitivities assume $0 restructuring expense and “normalized” increase in net working capital of $30 million in the terminal period. As mentioned previously, both assumptions remain subject to further review based on information provided by Company management.
Illustrative Consolidated Discounted Cash Flow
(Pension-Adjusted) Sensitivities1
Perpetuity Growth Rate
1.50% 1.75% 2.00% 2.25% 2.50% 2.75% 3.00% 3.25% 3.50%
11.5% $2.56 $3.08 $3.64 $4.22 $4.84 $5.49 $6.18 $6.91 $7.69
Rate 11.0% $3.99 $4.58 $5.21 $5.87 $6.57 $7.31 $8.10 $8.94 $9.84
10.5% $5.58 $6.26 $6.97 $7.72 $8.52 $9.37 $10.28 $11.25 $12.29
10.0% $7.37 $8.13 $8.94 $9.81 $10.73 $11.71 $12.77 $13.90 $15.12
9.5% $9.38 $10.25 $11.19 $12.18 $13.25 $14.40 $15.64 $16.98 $18.43
Discount 9.0% $11.65 $12.67 $13.75 $14.92 $16.17 $17.53 $19.00 $20.60 $22.34
8.5% $14.26 $15.44 $16.71 $18.09 $19.58 $21.20 $22.97 $24.90 $27.03
Illustrative Consolidated Discounted Cash Flow Sensitivities1
(Informational)
Perpetuity Growth Rate
1.50% 1.75% 2.00% 2.25% 2.50% 2.75% 3.00% 3.25% 3.50%
12.0% $4.65 $5.08 $5.52 $5.99 $6.48 $7.00 $7.55 $8.12 $8.74
Rate 11.5% $5.81 $6.28 $6.78 $7.31 $7.86 $8.45 $9.07 $9.73 $10.43
11.0% $7.09 $7.62 $8.19 $8.78 $9.41 $10.08 $10.79 $11.55 $12.35
10.5% $8.52 $9.12 $9.76 $10.44 $11.16 $11.92 $12.74 $13.61 $14.55
10.0% $10.11 $10.80 $11.53 $12.31 $13.14 $14.02 $14.97 $15.99 $17.09
Discount 9.5% $11.91 $12.70 $13.54 $14.44 $15.40 $16.44 $17.55 $18.75 $20.06
9.0% $13.95 $14.86 $15.84 $16.89 $18.02 $19.24 $20.56 $22.00 $23.57
Illustrative Bridge to Per Share Equity Value
Assumptions (could change materially, including impact on illustrative sensitivities): Enterprise Value (based on unlevered free cash flow projections provided by Company management and selected perpetuity growth rate and discount rate) Cash Attributable to the Company2: $235 million Value of NOLs and Other Tax Attributes3: $0 Other Non-Operating Assets4: $47 million Debt Attributable to the Company5: $3,121 million Underfunded Pension Liability6: $1,169 million (only utilized in pension-adjusted sensitivities)
Other Non-Operating Liabilities7: $17 million Shares Outstanding: 169.0 million
Note: The sensitivities shown above are for illustrative purposes only and may not necessarily be indicative of what may ultimately be concluded on value.
1. Certain normalizing adjustments were made to the terminal period cash flows, including assuming depreciation and amortization equal to capital expenditures, assuming pension contributions equal to pension expense, and assuming dividends from non-consolidated JVs equal to earnings in non-consolidated JVs.
2. Represents the Company’s cash balance of $252 million as of March 31, 2016, net of cash attributable to non-controlling interests of $17 million, per Company management.
3. No value specifically ascribed to the Company’s $1,059 million NOLs, tax credits or other attributes (which are largely offset by a valuation allowance); 20% tax rate used over projection period, per Company management.
4. Includes book value of investments in non-consolidated affiliates accounted for using the cost method ($8 million) and estimated value of certain non-core real estate assets held for sale, net of associated sales costs and remediation and rehabilitation costs ($39 million) per Company management.
5. Represents the Company’s debt balance of $3,133 million as of March 31, 2016, net of debt attributable to non-controlling interests of $12 million, per Company management.
6. Reflects book value of the Company’s underfunded pension and other post-employment liabilities as of March 31, 2016. Liabilities are not tax-effected.
7. Based on accrued environmental liabilities of $14 million and $16 million of accrued liabilities related to asset retirement obligations as of March 31, 2016 (net of estimated remediation costs associated with non-core real estate assets held for sale). Does not reflect $43 million of related “reasonably possible” losses estimated by Company management.
Source: Company management, public filings. 52
CONFIDENTIAL—PRELIMINARY DRAFT—SUBJECT TO FURTHER REVIEW
|
|
Page
1. Selected Public Market Observations 3
2. Preliminary Financial Analyses 7
3. Appendix 17
4. Disclaimer 53
|
|

Disclaimer
This presentation, and any supplemental information (written or oral) or other documents provided in connection therewith (collectively, the “materials”), are provided solely for the information of the Special Committee (the “Committee”) of the Board of Directors (the “Board”) of Federal-Mogul Holdings Corporation (“Piston” or the “Company”) by Houlihan Lokey in connection with the Committee’s consideration of a potential transaction (the “Transaction”) involving the Company. This presentation is incomplete without reference to, and should be considered in conjunction with, any supplemental information provided by and discussions with Houlihan Lokey in connection therewith. Any defined terms used herein shall have the meanings set forth herein, even if such defined terms have been given different meanings elsewhere in the materials.
The materials are for discussion purposes only. Houlihan Lokey expressly disclaims any and all liability which may be based on the materials and any errors therein or omissions therefrom. The materials were prepared for specific persons familiar with the business and affairs of the Company for use in a specific context and were not prepared with a view to public disclosure or to conform with any disclosure standards under any state, federal or international securities laws or other laws, rules or regulations, and none of the Committee, the Company or Houlihan Lokey takes any responsibility for the use of the materials by persons other than the Committee. The materials are provided on a confidential basis solely for the information of the Committee and may not be disclosed, summarized, reproduced, disseminated or quoted or otherwise referred to, in whole or in part, without Houlihan Lokey’s express prior written consent.
Notwithstanding any other provision herein, the Company (and each employee, representative or other agent of the Company) may disclose to any and all persons without limitation of any kind, the tax treatment and tax structure of any transaction and all materials of any kind (including opinions or other tax analyses, if any) that are provided to the Company relating to such tax treatment and structure. However, any information relating to the tax treatment and tax structure shall remain confidential (and the foregoing sentence shall not apply) to the extent necessary to enable any person to comply with securities laws. For this purpose, the tax treatment of a transaction is the purported or claimed U.S. income or franchise tax treatment of the transaction and the tax structure of a transaction is any fact that may be relevant to understanding the purported or claimed U.S. income or franchise tax treatment of the transaction. If the Company plans to disclose information pursuant to the first sentence of this paragraph, the Company shall inform those to whom it discloses any such information that they may not rely upon such information for any purpose without Houlihan Lokey’s prior written consent. Houlihan Lokey is not an expert on, and nothing contained in the materials should be construed as advice with regard to, legal, accounting, regulatory, insurance, tax or other specialist matters. Houlihan Lokey’s role in reviewing any information is limited solely to performing such a review as it shall deem necessary to support its own advice and analysis and shall not be on behalf of the Committee.
The materials necessarily are based on financial, economic, market and other conditions as in effect on, and the information available to Houlihan Lokey as of, the date of the materials. Although subsequent developments may affect the contents of the materials, Houlihan Lokey has not undertaken, and is under no obligation, to update, revise or reaffirm the materials, except as may be expressly contemplated by Houlihan Lokey’s engagement letter. The materials are not intended to provide the sole basis for evaluation of the Transaction and do not purport to contain all information that may be required. The materials do not address the underlying business decision of the Company or any other party to proceed with or effect the Transaction. The materials do not constitute any opinion, nor do the materials constitute a recommendation to the Board, the Committee, the Company, any security holder of the Company or any other party as to how to vote or act with respect to any matter relating to the Transaction or otherwise or whether to buy or sell any assets or securities of any company. Houlihan Lokey’s only opinion is the opinion, if any, that is actually delivered to the Committee. The materials may not reflect information known to other professionals in other business areas of Houlihan Lokey and its affiliates.
The preparation of the materials was a complex process involving quantitative and qualitative judgments and determinations with respect to the financial, comparative and other analytic methods employed and the adaption and application of these methods to the unique facts and circumstances presented and, therefore, is not readily susceptible to partial analysis or summary description. Furthermore, Houlihan Lokey did not attribute any particular weight to any analysis or factor considered by it, but rather made qualitative judgments as to the significance and relevance of each analysis and factor. Each analytical technique has inherent strengths and weaknesses, and the nature of the available information may further affect the value of particular techniques. Accordingly, the analyses contained in the materials must be considered as a whole. Selecting portions of the analyses, analytic methods and factors without considering all analyses and factors could create a misleading or incomplete view. The materials reflect judgments and assumptions with regard to industry performance, general business, economic, regulatory, market and financial conditions and other matters, many of which are beyond the control of the participants in the Transaction. Any estimates of value contained in the materials are not necessarily indicative of actual value or predictive of future results or values, which may be significantly more or less favorable. Any analyses relating to the value of assets, businesses or securities do not purport to be appraisals or to reflect the prices at which any assets, businesses or securities may actually be sold. The materials do not constitute a valuation opinion or credit rating. In preparing the materials, Houlihan Lokey has not conducted any physical inspection or independent appraisal or evaluation of any of the assets, properties or liabilities (contingent or otherwise) of the Company or any other party and has no obligation to evaluate the solvency of the Company or any other party under any law.
All budgets, projections, estimates, financial analyses, reports and other information with respect to operations (including estimates of potential cost savings and expenses) reflected in the materials have been prepared by management of the relevant party or are derived from such budgets, projections, estimates, financial analyses, reports and other information or from other sources, which involve numerous and significant subjective determinations made by management of the relevant party and/or which such management has reviewed and found reasonable. The budgets, projections and estimates contained in the materials may or may not be achieved and differences between projected results and those actually achieved may be material. Houlihan Lokey has relied upon representations made by management of the Company that such budgets, projections and estimates have been reasonably prepared in good faith on bases reflecting the best currently available estimates and judgments of such management (or, with respect to information obtained from public sources, represent reasonable estimates), and Houlihan Lokey expresses no opinion with respect to such budgets, projections or estimates or the assumptions on which they are based. The scope of the financial analysis contained herein is based on discussions with the Company (including, without limitation, regarding the methodologies to be utilized), and Houlihan Lokey does not make any representation, express or implied, as to the sufficiency or adequacy of such financial analysis or the scope thereof for any particular purpose.
Houlihan Lokey has assumed and relied upon the accuracy and completeness of the financial and other information provided to, discussed with or reviewed by it without (and without assuming responsibility for) independent verification of such information, makes no representation or warranty (express or implied) in respect of the accuracy or completeness of such information and has further relied upon the assurances of the Company that it is not aware of any facts or circumstances that would make such information inaccurate or misleading. In addition, Houlihan Lokey has relied upon and assumed, without independent verification, that there has been no change in the business, assets, liabilities, financial condition, results of operations, cash flows or prospects of the Company or any other participant in the Transaction since the respective dates of the most recent financial statements and other information, financial or otherwise, provided to Houlihan Lokey that would be material to its analyses , and that the final forms of any draft documents reviewed by Houlihan Lokey will not differ in any material respect from such draft documents.
The materials are not an offer to sell or a solicitation of an indication of interest to purchase any security, option, commodity, future, loan or currency. The materials do not constitute a commitment by Houlihan Lokey or any of its affiliates to underwrite, subscribe for or place any securities, to extend or arrange credit, or to provide any other services. In the ordinary course of business, certain of Houlihan Lokey’s affiliates and employees, as well as investment funds in which they may have financial interests or with which they may co-invest, may acquire, hold or sell, long or short positions, or trade or otherwise effect transactions, in debt, equity, and other securities and financial instruments (including loans and other obligations) of, or investments in, one or more parties that may be involved in the Transaction and their respective affiliates or any currency or commodity that may be involved in the Transaction. Houlihan Lokey provides mergers and acquisitions, restructuring and other advisory and consulting services to clients. Houlihan Lokey’s personnel may make statements or provide advice that is contrary to information contained in the materials. Houlihan Lokey’s or its affiliates’ proprietary interests may conflict with the Company’s interests. Houlihan Lokey may have advised, may seek to advise and may in the future advise one or more participants in the Transaction and/or other companies mentioned in the materials.
CONFIDENTIAL—PRELIMINARY DRAFT—SUBJECT TO FURTHER REVIEW 54
|
|

CORPORATE FINANCE
FINANCIAL ADVISORY SERVICES FINANCIAL RESTRUCTURING STRATEGIC CONSULTING
HL.com
55
| Exhibit C4
|
Exhibit c4
Project Piston
DISCUSSION MATERIALS FOR THE SPECIAL COMMITTEE
AUGUST 15, 2016 | PRELIMINARY DRAFT – SUBJECT TO REVIEW – CONFIDENTIAL
|
|
Table of Contents
Page
1. Executive Summary 3
2. Preliminary Financial Analyses 11
3. Selected Public Market Observations 21
4. Appendix 26 Cost of Capital Considerations 27 Selected Companies—Operating Statistics 33 Company Financial Performance Observations 37 Implied Premiums Paid Observations 40 Illustrative Preliminary Financial Analyses (EBITDA) 43
5. Disclaimer 56
CONFIDENTIAL—PRELIMINARY DRAFT—SUBJECT TO FURTHER REVIEW 2
|
|
Page
1. Executive Summary 3
2. Preliminary Financial Analyses 11
3. Selected Public Market Observations 21
4. Appendix 26
5. Disclaimer 56
|
|
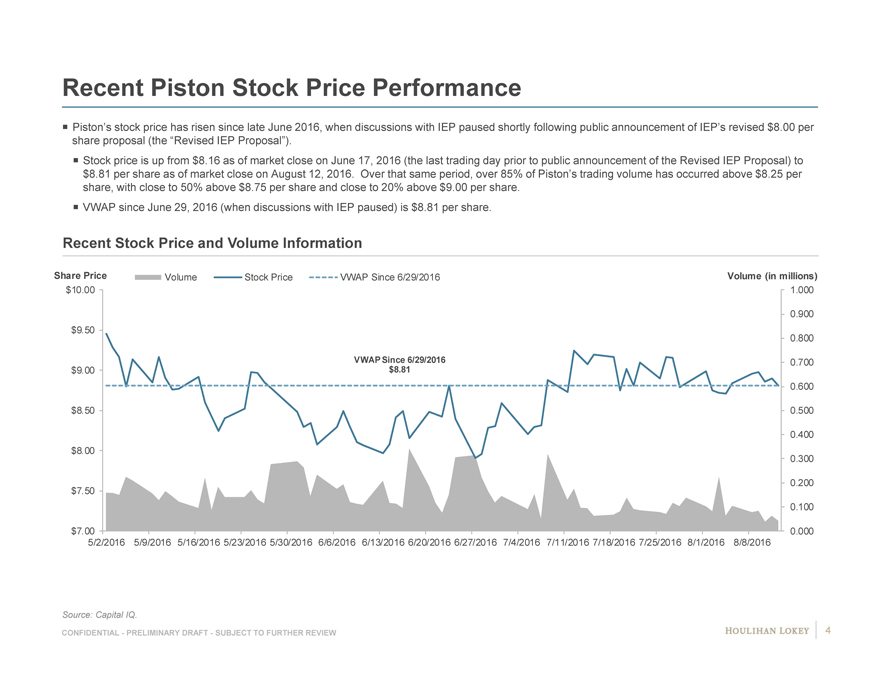
Recent Piston Stock Price Performance
Piston’s stock price has risen since late June 2016, when discussions with IEP paused shortly following public announcement of IEP’s revised $8.00 per share proposal (the “Revised IEP Proposal”).
Stock price is up from $8.16 as of market close on June 17, 2016 (the last trading day prior to public announcement of the Revised IEP Proposal) to $8.81 per share as of market close on August 12, 2016. Over that same period, over 85% of Piston’s trading volume has occurred above $8.25 per share, with close to 50% above $8.75 per share and close to 20% above $9.00 per share.
VWAP since June 29, 2016 (when discussions with IEP paused) is $8.81 per share.
Recent Stock Price and Volume Information
Share Price Volume Stock Price VWAP Since 6/29/2016 Volume (in millions) $10.00 1.000
0.900 $9.50 0.800
VWAP Since 6/29/2016 0.700 $9.00 $8.81 0.600
$8.50 0.500
0.400 $8.00 0.300
0.200 $7.50 0.100
$7.00 0.000 5/2/2016 5/9/2016 5/16/2016 5/23/2016 5/30/2016 6/6/2016 6/13/2016 6/20/2016 6/27/2016 7/4/2016 7/11/2016 7/18/2016 7/25/2016 8/1/2016 8/8/2016
Source: Capital IQ.
CONFIDENTIAL—PRELIMINARY DRAFT—SUBJECT TO FURTHER REVIEW 4
|
|
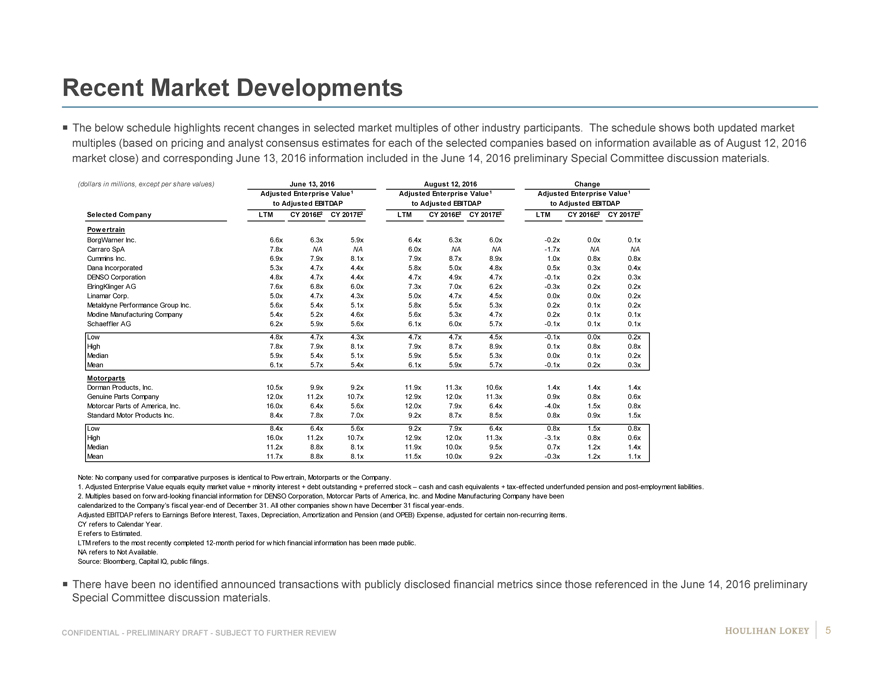
Recent Market Developments
The below schedule highlights recent changes in selected market multiples of other industry participants. The schedule shows both updated market multiples (based on pricing and analyst consensus estimates for each of the selected companies based on information available as of August 12, 2016 market close) and corresponding June 13, 2016 information included in the June 14, 2016 preliminary Special Committee discussion materials.
(dollars in millions, except per share values) June 13, 2016 August 12, 2016 Change
Adjusted Enterprise Value1 Adjusted Enterprise Value1 Adjusted Enterprise Value1 to Adjusted EBITDAP to Adjusted EBITDAP to Adjusted EBITDAP
Selected Company LTM CY 2016E2 CY 2017E2 LTM CY 2016E2 CY 2017E2 LTM CY 2016E2 CY 2017E2
Pow ertrain
BorgWarner Inc. 6.6x 6.3x 5.9x ## 6.4x 6.3x 6.0x 6 9 -0.2x 0.0x 0.1x Carraro SpA 7.8x NA NA NA 6.0x NA NA NA NA -1.7x NA NA Cummins Inc. 6.9x 7.9x 8.1x ## 7.9x 8.7x 8.9x 9 12 1.0x 0.8x 0.8x Dana Incorporated 5.3x 4.7x 4.4x ## 5.8x 5.0x 4.8x 5 9 0.5x 0.3x 0.4x DENSO Corporation 4.8x 4.7x 4.4x ## 4.7x 4.9x 4.7x 5 9 -0.1x 0.2x 0.3x ElringKlinger AG 7.6x 6.8x 6.0x ## 7.3x 7.0x 6.2x 6 14 -0.3x 0.2x 0.2x Linamar Corp. 5.0x 4.7x 4.3x ## 5.0x 4.7x 4.5x 4 9 0.0x 0.0x 0.2x Metaldyne Performance Group Inc. 5.6x 5.4x 5.1x ## 5.8x 5.5x 5.3x 5 9 0.2x 0.1x 0.2x Modine Manufacturing Company 5.4x 5.2x 4.6x ## 5.6x 5.3x 4.7x 5 9 0.2x 0.1x 0.1x Schaeffler AG 6.2x 5.9x 5.6x ## 6.1x 6.0x 5.7x 6 10 -0.1x 0.1x 0.1x Low 4.8x 4.7x 4.3x 4.7x 4.7x 4.5x -0.1x 0.0x 0.2x High 7.8x 7.9x 8.1x 7.9x 8.7x 8.9x 0.1x 0.8x 0.8x Median 5.9x 5.4x 5.1x 5.9x 5.5x 5.3x 0.0x 0.1x 0.2x Mean 6.1x 5.7x 5.4x 6.1x 5.9x 5.7x -0.1x 0.2x 0.3x
Motorparts
Dorman Products, Inc. 10.5x 9.9x 9.2x ## 11.9x 11.3x 10.6x 11 12 1.4x 1.4x 1.4x Genuine Parts Company 12.0x 11.2x 10.7x ## 12.9x 12.0x 11.3x 11 13 0.9x 0.8x 0.6x Motorcar Parts of America, Inc. 16.0x 6.4x 5.6x ## 12.0x 7.9x 6.4x 6 7 -4.0x 1.5x 0.8x Standard Motor Products Inc. 8.4x 7.8x 7.0x ## 9.2x 8.7x 8.5x 8 NA 0.8x 0.9x 1.5x Low 8.4x 6.4x 5.6x 9.2x 7.9x 6.4x 0.8x 1.5x 0.8x High 16.0x 11.2x 10.7x 12.9x 12.0x 11.3x -3.1x 0.8x 0.6x Median 11.2x 8.8x 8.1x 11.9x 10.0x 9.5x 0.7x 1.2x 1.4x Mean 11.7x 8.8x 8.1x 11.5x 10.0x 9.2x -0.3x 1.2x 1.1x
Note: No company used for comparative purposes is identical to Pow ertrain, Motorparts or the Company.
1. Adjusted Enterprise Value equals equity market value + minority interest + debt outstanding + preferred stock – cash and cash equivalents + tax-effected underfunded pension and post-employment liabilities.
2. Multiples based on forw ard-looking financial information for DENSO Corporation, Motorcar Parts of America, Inc. and Modine Manufacturing Company have been calendarized to the Company’s fiscal year-end of December 31. All other companies show n have December 31 fiscal year-ends.
Adjusted EBITDAP refers to Earnings Before Interest, Taxes, Depreciation, Amortization and Pension (and OPEB) Expense, adjusted for certain non-recurring items. CY refers to Calendar Year.
E refers to Estimated.
LTM refers to the most recently completed 12-month period for w hich financial information has been made public. NA refers to Not Available.
Source: Bloomberg, Capital IQ, public filings.
There have been no identified announced transactions with publicly disclosed financial metrics since those referenced in the June 14, 2016 preliminary Special Committee discussion materials.
CONFIDENTIAL—PRELIMINARY DRAFT—SUBJECT TO FURTHER REVIEW 5
|
|
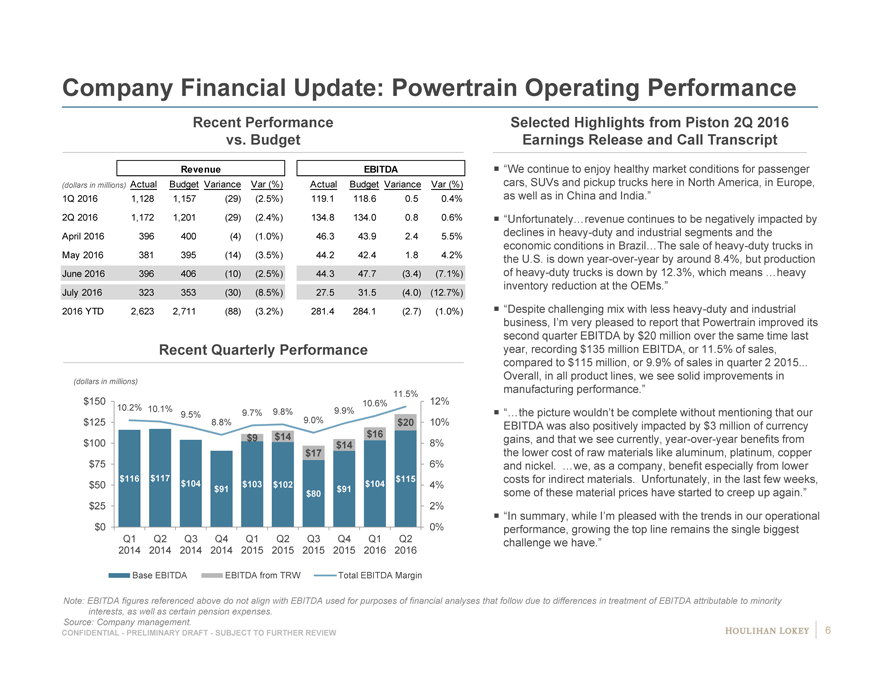
Company Financial Update: Powertrain Operating Performance
Recent Performance Selected Highlights from Piston 2Q 2016 vs. Budget Earnings Release and Call Transcript
Revenue EBITDA “We continue to enjoy healthy market conditions for passenger (dollars in millions) Actual Budget Variance Var (%) Actual Budget Variance Var (%) cars, SUVs and pickup trucks here in North America, in Europe,
1Q 2016 1,128 1,157 (29) (2.5%) 119.1 118.6 0.5 0.4% as well as in China and India.”
2Q 2016 1,172 1,201 (29) (2.4%) 134.8 134.0 0.8 0.6% “Unfortunately…revenue continues to be negatively impacted by April 2016 396 400 (4) (1.0%) 46.3 43.9 2.4 5.5% declines in heavy-duty and industrial segments and the May 2016 381 395 (14) (3.5%) 44.2 42.4 1.8 4.2% economic conditions in Brazil…The sale of heavy-duty trucks in the U.S. is down year-over-year by around 8.4%, but production June 2016 396 406 (10) (2.5%) 44.3 47.7 (3.4) (7.1%) of heavy-duty trucks is down by 12.3%, which means …heavy inventory reduction at the OEMs.”
July 2016 323 353 (30) (8.5%) 27.5 31.5 (4.0) (12.7%)
2016 YTD 2,623 2,711 (88) (3.2%) 281.4 284.1 (2.7) (1.0%) “Despite challenging mix with less heavy-duty and industrial business, I’m very pleased to report that Powertrain improved its second quarter EBITDA by $20 million over the same time last Recent Quarterly Performance year, recording $135 million EBITDA, or 11.5% of sales, compared to $115 million, or 9.9% of sales in quarter 2 2015...
Overall, in all product lines, we see solid improvements in
(dollars in millions)
manufacturing performance.”
11.5% $150 10.6% 12%
10.2% 10.1% 9.9%
9.5% 9.7% 9.8% 9.0% “…the picture wouldn’t be complete without mentioning that our $125 8.8% $20 10% EBITDA was also positively impacted by $3 million of currency $100 $9 $14 $16 8% gains, and that we see currently, year-over-year benefits from $14 $17 the lower cost of raw materials like aluminum, platinum, copper
$75 6% and nickel. …we, as a company, benefit especially from lower $116 $117 $115 costs for indirect materials. Unfortunately, in the last few weeks,
$50 $104 $103 $102 $104 4%
$91 $91 some of these material prices have started to creep up again.”
$80
$25 2% while in our operational “In summary, I’m pleased with the trends
$0 0% performance, growing the top line remains the single biggest
Q1 Q2 Q3 Q4 Q1 Q2 Q3 Q4 Q1 Q2 challenge we have.” 2014 2014 2014 2014 2015 2015 2015 2015 2016 2016
Base EBITDA EBITDA from TRW Total EBITDA Margin
Note: EBITDA figures referenced above do not align with EBITDA used for purposes of financial analyses that follow due to differences in treatment of EBITDA attributable to minority interests, as well as certain pension expenses.
Source: Company management. 6
CONFIDENTIAL—PRELIMINARY DRAFT—SUBJECT TO FURTHER REVIEW
|
|
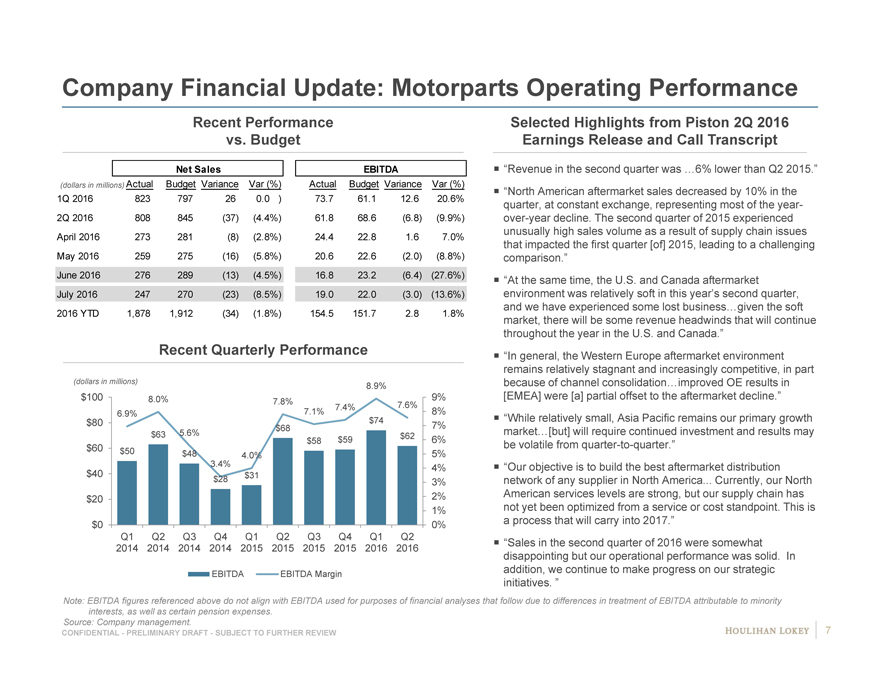
Company Financial Update: Motorparts Operating Performance
Recent Performance Selected Highlights from Piston 2Q 2016 vs. Budget Earnings Release and Call Transcript
Net Sales EBITDA “Revenue in the second quarter was …6% lower than Q2 2015.”
(dollars in millions) Actual Budget Variance Var (%) Actual Budget Variance Var (%)
“North American aftermarket sales decreased by 10% in the
1Q 2016 823 797 26 0.0 ) 73.7 61.1 12.6 20.6% quarter, at constant exchange, representing most of the year-
2Q 2016 808 845 (37) (4.4%) 61.8 68.6 (6.8) (9.9%) over-year decline. The second quarter of 2015 experienced unusually high sales volume as a result of supply chain issues
April 2016 273 281 (8) (2.8%) 24.4 22.8 1.6 7.0% that impacted the first quarter [of] 2015, leading to a challenging
May 2016 259 275 (16) (5.8%) 20.6 22.6 (2.0) (8.8%) comparison.” June 2016 276 289 (13) (4.5%) 16.8 23.2 (6.4) (27.6%)
“At the same time, the U.S. and Canada aftermarket July 2016 247 270 (23) (8.5%) 19.0 22.0 (3.0) (13.6%) environment was relatively soft in this year’s second quarter, and we have experienced some lost business…given the soft
2016 YTD 1,878 1,912 (34) (1.8%) 154.5 151.7 2.8 1.8% market, there will be some revenue headwinds that will continue throughout the year in the U.S. and Canada.” Recent Quarterly Performance “In general, the aftermarket environment Western Europe remains relatively stagnant and increasingly competitive, in part (dollars in millions) because of channel consolidation…improved OE results in 8.9% [EMEA] were [a] partial offset to the aftermarket decline.” $100 8.0% 9%
7.8% 7.6% 7.4% 6.9% 7.1% 8%
$80 $74 “While relatively small, Asia Pacific remains our primary growth
$68 7%
$63 5.6% $59 $62 market…[but] will require continued investment and results may
$58 6% be volatile from quarter-to-quarter.”
$60 $50
$48 4.0% 5%
3.4% 4% “Our objective is to build the best aftermarket distribution
$40 $31
$28 3% network of any supplier in North America... Currently, our North
2% American services levels are strong, but our supply chain has $20 1% not yet been optimized from a service or cost standpoint. This is
$0 0% a process that will carry into 2017.”
Q1 Q2 Q3 Q4 Q1 Q2 Q3 Q4 Q1 Q2
“Sales in the second quarter of 2016 were somewhat
2014 2014 2014 2014 2015 2015 2015 2015 2016 2016 disappointing but our operational performance was solid. In EBITDA EBITDA Margin addition, we continue to make progress on our strategic initiatives. ”
Note: EBITDA figures referenced above do not align with EBITDA used for purposes of financial analyses that follow due to differences in treatment of EBITDA attributable to minority interests, as well as certain pension expenses.
Source: Company management. 7
CONFIDENTIAL—PRELIMINARY DRAFT—SUBJECT TO FURTHER REVIEW
|
|
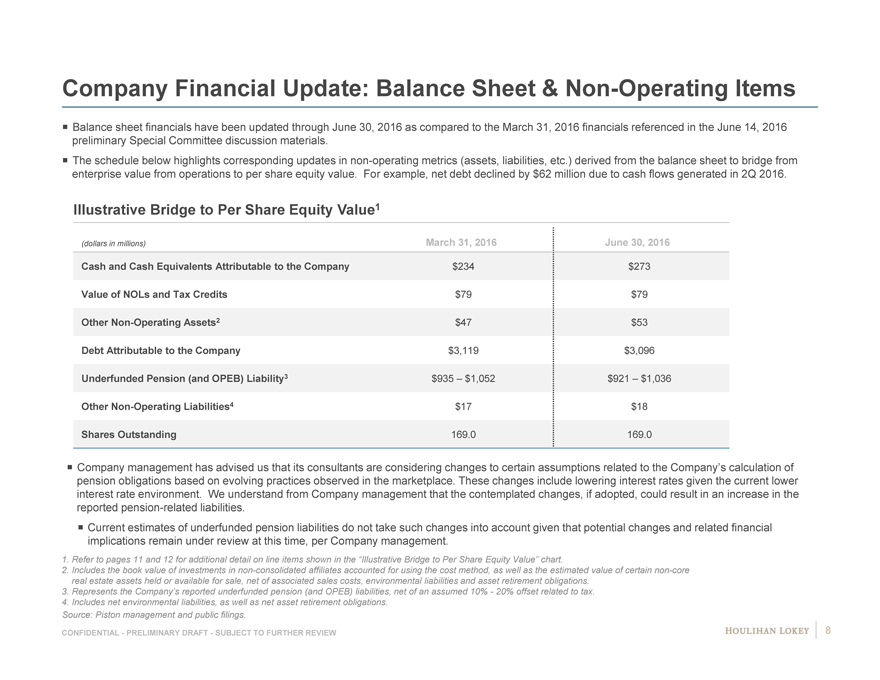
Company Financial Update: Balance Sheet & Non-Operating Items
Balance sheet financials have been updated through June 30, 2016 as compared to the March 31, 2016 financials referenced in the June 14, 2016 preliminary Special Committee discussion materials.
The schedule below highlights corresponding updates in non-operating metrics (assets, liabilities, etc.) derived from the balance sheet to bridge from enterprise value from operations to per share equity value. For example, net debt declined by $62 million due to cash flows generated in 2Q 2016.
Illustrative Bridge to Per Share Equity Value1
(dollars in millions) March 31, 2016 June 30, 2016
Cash and Cash Equivalents Attributable to the Company $234 $273
Value of NOLs and Tax Credits $79 $79 Other Non-Operating Assets2 $47 $53 Debt Attributable to the Company $3,119 $3,096 Underfunded Pension (and OPEB) Liability3 $935 – $1,052 $921 – $1,036 Other Non-Operating Liabilities4 $17 $18 Shares Outstanding 169.0 169.0
Company management has advised us that its consultants are considering changes to certain assumptions related to the Company’s calculation of pension obligations based on evolving practices observed in the marketplace. These changes include lowering interest rates given the current lower interest rate environment. We understand from Company management that the contemplated changes, if adopted, could result in an increase in the reported pension-related liabilities.
Current estimates of underfunded pension liabilities do not take such changes into account given that potential changes and related financial implications remain under review at this time, per Company management.
1. Refer to pages 11 and 12 for additional detail on line items shown in the “Illustrative Bridge to Per Share Equity Value” chart.
2. Includes the book value of investments in non-consolidated affiliates accounted for using the cost method, as well as the estimated value of certain non-core real estate assets held or available for sale, net of associated sales costs, environmental liabilities and asset retirement obligations.
3. Represents the Company’s reported underfunded pension (and OPEB) liabilities, net of an assumed 10%—20% offset related to tax.
4. Includes net environmental liabilities, as well as net asset retirement obligations.
Source: Piston management and public filings.
CONFIDENTIAL—PRELIMINARY DRAFT—SUBJECT TO FURTHER REVIEW 8
|
|
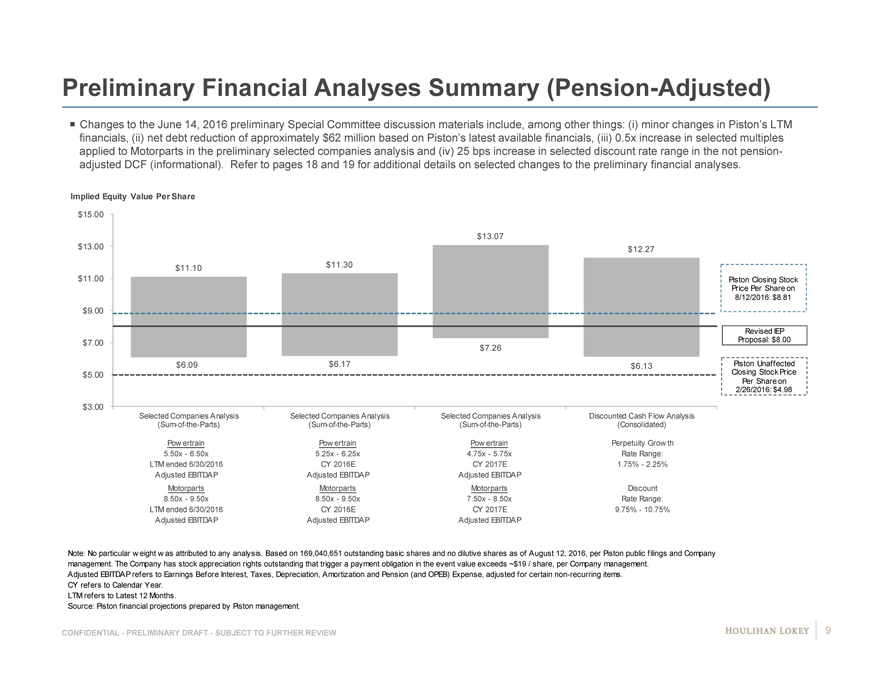
Preliminary Financial Analyses Summary (Pension-Adjusted)
Changes to the June 14, 2016 preliminary Special Committee discussion materials include, among other things: (i) minor changes in Piston’s LTM financials, (ii) net debt reduction of approximately $62 million based on Piston’s latest available financials, (iii) 0.5x increase in selected multiples applied to Motorparts in the preliminary selected companies analysis and (iv) 25 bps increase in selected discount rate range in the not pension-adjusted DCF (informational). Refer to pages 18 and 19 for additional details on selected changes to the preliminary financial analyses.
Implied Equity Value Per Share
$15.00
$13.07 $13.00 $12.27 $11.10 $11.30 $11.00 Piston Closing Stock Price Per Share on 8/12/2016: $8.81 $9.00
Revised IEP $7.00 Proposal: $8.00 $7.26 $6.09 $6.17 $6.13 Piston Unaffected $5.00 Closing Stock Price Per Share on 2/26/2016: $4.98
$3.00
Selected Companies Analysis Selected Companies Analysis Selected Companies Analysis Discounted Cash Flow Analysis (Sum-of-the-Parts) (Sum-of-the-Parts) (Sum-of-the-Parts) (Consolidated)
Pow ertrain Pow ertrain Pow ertrain Perpetuity Grow th 5.50x—6.50x 5.25x—6.25x 4.75x—5.75x Rate Range: LTM ended 6/30/2016 CY 2016E CY 2017E 1.75%—2.25% Adjusted EBITDAP Adjusted EBITDAP Adjusted EBITDAP
Motorparts Motorparts Motorparts Discount 8.50x—9.50x 8.50x—9.50x 7.50x—8.50x Rate Range: LTM ended 6/30/2016 CY 2016E CY 2017E 9.75%—10.75% Adjusted EBITDAP Adjusted EBITDAP Adjusted EBITDAP
Note: No particular w eight w as attributed to any analysis. Based on 169,040,651 outstanding basic shares and no dilutive shares as of August 12, 2016, per Piston public filings and Company management. The Company has stock appreciation rights outstanding that trigger a payment obligation in the event value exceeds ~$19 / share, per Company management.
Adjusted EBITDAP refers to Earnings Before Interest, Taxes, Depreciation, Amortization and Pension (and OPEB) Expense, adjusted for certain non-recurring items. CY refers to Calendar Year.
LTM refers to Latest 12 Months.
Source: Piston financial projections prepared by Piston management.
CONFIDENTIAL—PRELIMINARY DRAFT—SUBJECT TO FURTHER REVIEW 9
|
|
Page
1. Executive Summary 3
2. Preliminary Financial Analyses 11
3. Selected Public Market Observations 21
4. Appendix 26
5. Disclaimer 56
|
|
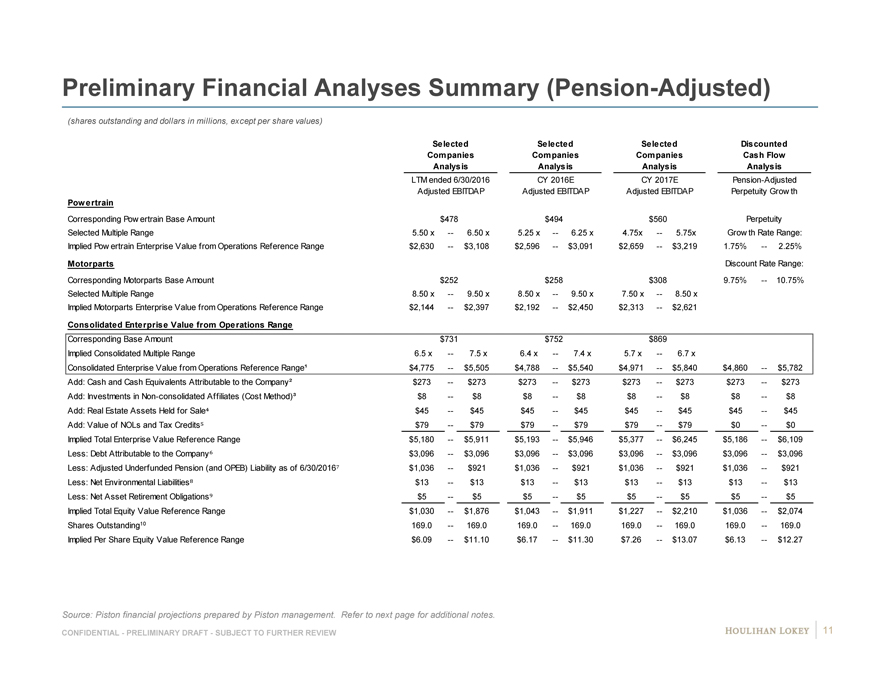
Preliminary Financial Analyses Summary (Pension-Adjusted)
(shares outstanding and dollars in millions, except per share values)
Selected Selected Selected Discounted Companies Companies Companies Cash Flow Analysis Analysis Analysis Analysis
LTM ended 6/30/2016 CY 2016E CY 2017E Pension-Adjusted Adjusted EBITDAP Adjusted EBITDAP Adjusted EBITDAP Perpetuity Grow th Powertrain Discount Rate Range: Corresponding Pow ertrain Base Amount $478 $494 $560 Perpetuity Selected Multiple Range 5.50 x — 6.50 x 5.25 x — 6.25 x 4.75x — 5.75x Grow th Rate Range: Implied Pow ertrain Enterprise Value from Operations Reference Range $2,630 — $3,108 $2,596 — $3,091 $2,659 — $3,219 1.75% — 2.25%
Motorparts Discount Rate Range: Corresponding Motorparts Base Amount $252 $258 $308 9.75% — 10.75% Selected Multiple Range 8.50 x — 9.50 x 8.50 x — 9.50 x 7.50 x — 8.50 x Implied Motorparts Enterprise Value from Operations Reference Range $2,144 — $2,397 $2,192 — $2,450 $2,313 — $2,621
Consolidated Enterprise Value from Operations Range
Corresponding Base Amount $731 $752 $869 Implied Consolidated Multiple Range 6.5 x — 7.5 x 6.4 x — 7.4 x 5.7 x — 6.7 x
Consolidated Enterprise Value from Operations Reference Range¹ $4,775 — $5,505 $4,788 — $5,540 $4,971 — $5,840 $4,860 — $5,782 Add: Cash and Cash Equivalents Attributable to the Company² $273 — $273 $273 — $273 $273 — $273 $273 — $273 Add: Investments in Non-consolidated Affiliates (Cost Method)³ $8 — $8 $8 — $8 $8 — $8 $8 — $8 Add: Real Estate Assets Held for Sale $45 — $45 $45 — $45 $45 — $45 $45 — $45 Add: Value of NOLs and Tax Credits $79 — $79 $79 — $79 $79 — $79 $0 — $0 Implied Total Enterprise Value Reference Range $5,180 — $5,911 $5,193 — $5,946 $5,377 — $6,245 $5,186 — $6,109 Less: Debt Attributable to the Company $3,096 — $3,096 $3,096 — $3,096 $3,096 — $3,096 $3,096 — $3,096 Less: Adjusted Underfunded Pension (and OPEB) Liability as of 6/30/2016 $1,036 — $921 $1,036 — $921 $1,036 — $921 $1,036 — $921 Less: Net Environmental Liabilities $13 — $13 $13 — $13 $13 — $13 $13 — $13 Less: Net Asset Retirement Obligations $5 — $5 $5 — $5 $5 — $5 $5 — $5 Implied Total Equity Value Reference Range $1,030 — $1,876 $1,043 — $1,911 $1,227 — $2,210 $1,036 — $2,074 Shares Outstanding10 169.0 — 169.0 169.0 — 169.0 169.0 — 169.0 169.0 — 169.0 Implied Per Share Equity Value Reference Range $6.09 — $11.10 $6.17 — $11.30 $7.26 — $13.07 $6.13 — $12.27
Source: Piston financial projections prepared by Piston management. Refer to next page for additional notes.
CONFIDENTIAL—PRELIMINARY DRAFT—SUBJECT TO FURTHER REVIEW 11
|
|
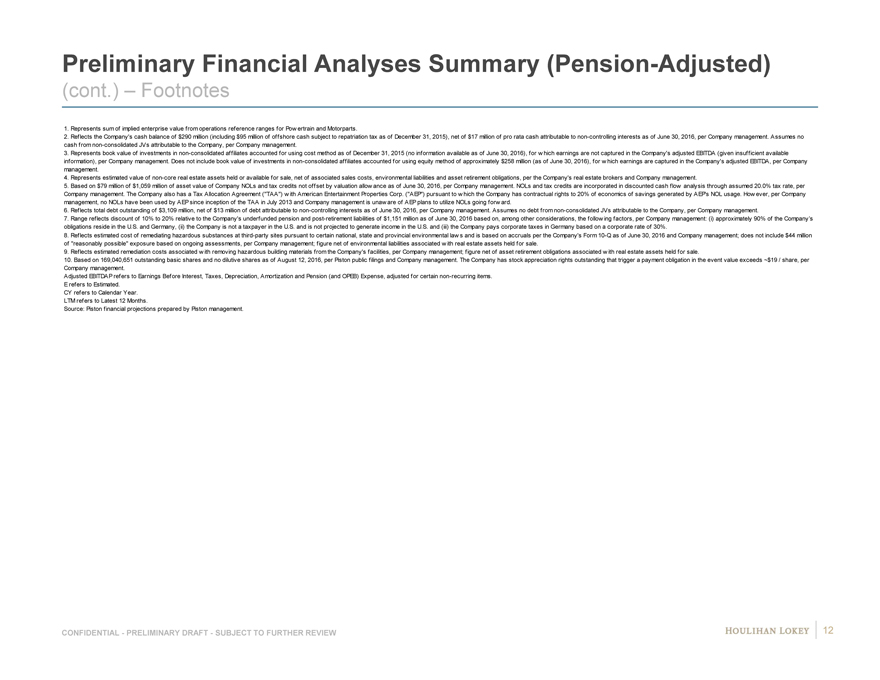
Preliminary Financial Analyses Summary (Pension-Adjusted)
(cont.) – Footnotes
1. Represents sum of implied enterprise value from operations reference ranges for Pow ertrain and Motorparts.
2. Reflects the Company’s cash balance of $290 million (including $95 million of offshore cash subject to repatriation tax as of December 31, 2015), net of $17 million of pro rata cash attributable to non-controlling interests as of June 30, 2016, per Company management. Assumes no cash from non-consolidated JVs attributable to the Company, per Company management.
3. Represents book value of investments in non-consolidated affiliates accounted for using cost method as of December 31, 2015 (no information available as of June 30, 2016), for w hich earnings are not captured in the Company’s adjusted EBITDA (given insufficient available information), per Company management. Does not include book value of investments in non-consolidated affiliates accounted for using equity method of approximately $258 million (as of June 30, 2016), for w hich earnings are captured in the Company’s adjusted EBITDA, per Company management.
4. Represents estimated value of non-core real estate assets held or available for sale, net of associated sales costs, environmental liabilities and asset retirement obligations, per the Company’s real estate brokers and Company management.
5. Based on $79 million of $1,059 million of asset value of Company NOLs and tax credits not offset by valuation allow ance as of June 30, 2016, per Company management. NOLs and tax credits are incorporated in discounted cash flow analysis through assumed 20.0% tax rate, per Company management. The Company also has a Tax Allocation Agreement (“TAA”) w ith American Entertainment Properties Corp. (“AEP”) pursuant to w hich the Company has contractual rights to 20% of economics of savings generated by AEP’s NOL usage. How ever, per Company management, no NOLs have been used by AEP since inception of the TAA in July 2013 and Company management is unaw are of AEP plans to utilize NOLs going forw ard.
6. Reflects total debt outstanding of $3,109 million, net of $13 million of debt attributable to non-controlling interests as of June 30, 2016, per Company management. Assumes no debt from non-consolidated JVs attributable to the Company, per Company management.
7. Range reflects discount of 10% to 20% relative to the Company’s underfunded pension and post-retirement liabilities of $1,151 million as of June 30, 2016 based on, among other considerations, the follow ing factors, per Company management: (i) approximately 90% of the Company’s obligations reside in the U.S. and Germany, (ii) the Company is not a taxpayer in the U.S. and is not projected to generate income in the U.S. and (iii) the Company pays corporate taxes in Germany based on a corporate rate of 30%.
8. Reflects estimated cost of remediating hazardous substances at third-party sites pursuant to certain national, state and provincial environmental law s and is based on accruals per the Company’s Form 10-Q as of June 30, 2016 and Company management; does not include $44 million of “reasonably possible” exposure based on ongoing assessments, per Company management; figure net of environmental liabilities associated w ith real estate assets held for sale.
9. Reflects estimated remediation costs associated w ith removing hazardous building materials from the Company’s facilities, per Company management; figure net of asset retirement obligations associated w ith real estate assets held for sale.
10. Based on 169,040,651 outstanding basic shares and no dilutive shares as of August 12, 2016, per Piston public filings and Company management. The Company has stock appreciation rights outstanding that trigger a payment obligation in the event value exceeds ~$19 / share, per Company management.
Adjusted EBITDAP refers to Earnings Before Interest, Taxes, Depreciation, Amortization and Pension (and OPEB) Expense, adjusted for certain non-recurring items. E refers to Estimated.
CY refers to Calendar Year. LTM refers to Latest 12 Months.
Source: Piston financial projections prepared by Piston management.
CONFIDENTIAL—PRELIMINARY DRAFT—SUBJECT TO FURTHER REVIEW 12
|
|
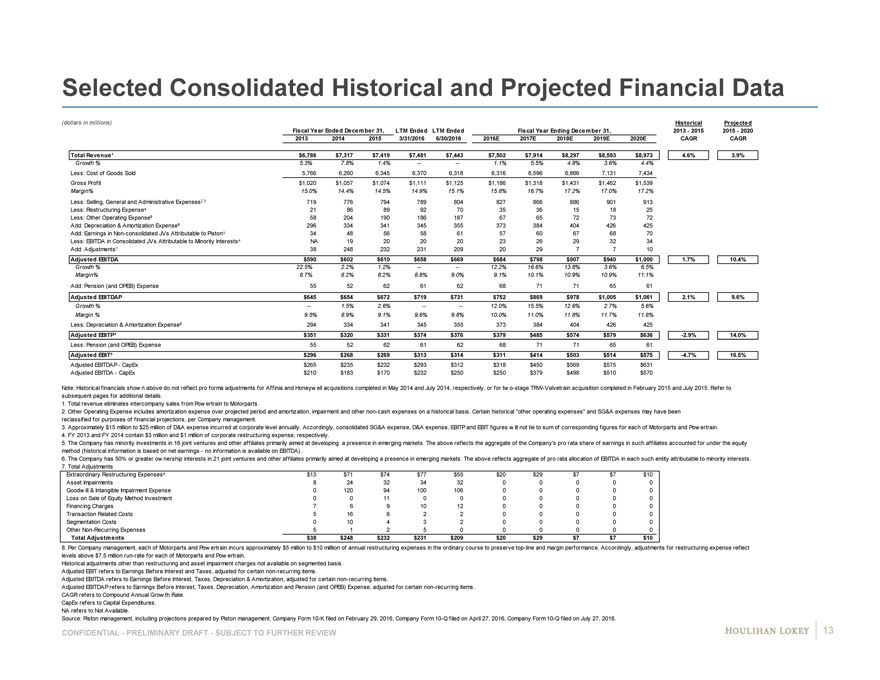
Selected Consolidated Historical and Projected Financial Data
(dollars in millions) Historical Projected Fiscal Year Ended December 31, LTM Ended LTM Ended Fiscal Year Ending December 31, 2013—2015 2015—2020 2013 2014 2015 3/31/2016 6/30/2016 2016E 2017E 2018E 2019E 2020E CAGR CAGR
Total Revenue¹ $6,786 $7,317 $7,419 $7,481 $7,443 $7,502 $7,914 $8,297 $8,593 $8,973 4.6% 3.9%
Growth % 5.3% 7.8% 1.4% -—- 1.1% 5.5% 4.8% 3.6% 4.4%
Less: Cost of Goods Sold 5,766 6,260 6,345 6,370 6,318 6,316 6,596 6,866 7,131 7,434 Gross Profit $1,020 $1,057 $1,074 $1,111 $1,125 $1,186 $1,318 $1,431 $1,462 $1,539
Margin% 15.0% 14.4% 14.5% 14.9% 15.1% 15.8% 16.7% 17.2% 17.0% 17.2%
Less: Selling, General and Administrative Expenses2,3 719 776 794 789 804 827 866 886 901 913 Less: Restructuring Expense 21 86 89 92 70 35 36 15 18 25 Less: Other Operating Expense² 58 204 190 186 187 67 65 72 73 72 Add: Depreciation & Amortization Expense³ 296 334 341 345 355 373 384 404 426 425 Add: Earnings in Non-consolidated JVs Attributable to Piston 34 48 56 58 61 57 60 67 68 70 Less: EBITDA in Consolidated JVs Attributable to Minority Interests NA 19 20 20 20 23 26 29 32 34 Add: Adjustments 38 248 232 231 209 20 29 7 7 10
Adjusted EBITDA $590 $602 $610 $658 $669 $684 $798 $907 $940 $1,000 1.7% 10.4%
Growth % 22.5% 2.2% 1.2% -—- 12.2% 16.6% 13.8% 3.6% 6.5% Margin% 8.7% 8.2% 8.2% 8.8% 9.0% 9.1% 10.1% 10.9% 10.9% 11.1%
Add: Pension (and OPEB) Expense 55 52 62 61 62 68 71 71 65 61
Adjusted EBITDAP $645 $654 $672 $719 $731 $752 $869 $978 $1,005 $1,061 2.1% 9.6%
Growth % — 1.5% 2.6% -—- 12.0% 15.5% 12.6% 2.7% 5.6% Margin % 9.5% 8.9% 9.1% 9.6% 9.8% 10.0% 11.0% 11.8% 11.7% 11.8%
Less: Depreciation & Amortization Expense³ 294 334 341 345 355 373 384 404 426 425
Adjusted EBITP³ $351 $320 $331 $374 $376 $379 $485 $574 $579 $636 -2.9% 14.0%
Less: Pension (and OPEB) Expense 55 52 62 61 62 68 71 71 65 61
Adjusted EBIT³ $296 $268 $269 $313 $314 $311 $414 $503 $514 $575 -4.7% 16.5%
Adjusted EBITDAP—CapEx $265 $235 $232 $293 $312 $318 $450 $569 $575 $631 Adjusted EBITDA—CapEx $210 $183 $170 $232 $250 $250 $379 $498 $510 $570
Note: Historical financials show n above do not reflect pro forma adjustments for Affinia and Honeyw ell acquisitions completed in May 2014 and July 2014, respectively, or for tw o-stage TRW-Valvetrain acquisition completed in February 2015 and July 2015. Refer to subsequent pages for additional details.
1. Total revenue eliminates intercompany sales from Pow ertrain to Motorparts.
2. Other Operating Expense includes amortization expense over projected period and amortization, impairment and other non-cash expenses on a historical basis. Certain historical “other operating expenses” and SG&A expenses may have been reclassified for purposes of financial projections, per Company management.
3. Approximately $15 million to $25 million of D&A expense incurred at corporate level annually. Accordingly, consolidated SG&A expense, D&A expense, EBITP and EBIT figures w ill not tie to sum of corresponding figures for each of Motorparts and Pow ertrain.
4. FY 2013 and FY 2014 contain $3 million and $1 million of corporate restructuring expense, respectively.
5. The Company has minority investments in 16 joint ventures and other affiliates primarily aimed at developing a presence in emerging markets. The above reflects the aggregate of the Company’s pro rata share of earnings in such affiliates accounted for under the equity method (historical information is based on net earnings—no information is available on EBITDA).
6. The Company has 50% or greater ow nership interests in 21 joint ventures and other affiliates primarily aimed at developing a presence in emerging markets. The above reflects aggregate of pro rata allocation of EBITDA in each such entity attributable to minority interests.
7. Total Adjustments
Extraordinary Restructuring Expenses $13 $71 $74 $77 $55 $20 $29 $7 $7 $10 Asset Impairments 8 24 32 34 32 0 0 0 0 0 Goodw ill & Intangible Impairment Expense 0 120 94 100 106 0 0 0 0 0 Loss on Sale of Equity Method Investment 0 0 11 0 0 0 0 0 0 0 Financing Charges 7 6 9 10 12 0 0 0 0 0 Transaction Related Costs 5 16 6 2 2 0 0 0 0 0 Segmentation Costs 0 10 4 3 2 0 0 0 0 0 Other Non-Recurring Expenses 5 1 2 5 0 0 0 0 0 0
Total Adjustments $38 $248 $232 $231 $209 $20 $29 $7 $7 $10
8. Per Company management, each of Motorparts and Pow ertrain incurs approximately $5 million to $10 milllion of annual restructuring expenses in the ordinary course to preserve top-line and margin performance. Accordingly, adjustments for restructuring expense reflect levels above $7.5 million run-rate for each of Motorparts and Pow ertrain.
Historical adjustments other than restructuring and asset impairment charges not available on segmented basis. Adjusted EBIT refers to Earnings Before Interest and Taxes, adjusted for certain non-recurring items.
Adjusted EBITDA refers to Earnings Before Interest, Taxes, Depreciation & Amortization, adjusted for certain non-recurring items.
Adjusted EBITDAP refers to Earnings Before Interest, Taxes, Depreciation, Amortization and Pension (and OPEB) Expense, adjusted for certain non-recurring items. CAGR refers to Compound Annual Grow th Rate.
CapEx refers to Capital Expenditures. NA refers to Not Available.
Source: Piston management, including projections prepared by Piston management, Company Form 10-K filed on February 29, 2016, Company Form 10-Q filed on April 27, 2016, Company Form 10-Q filed on July 27, 2016.
CONFIDENTIAL—PRELIMINARY DRAFT—SUBJECT TO FURTHER REVIEW 13
|
|

Selected Powertrain Historical and Projected Financial Data
(dollars in millions) Fiscal Year Ended December 31, LTM Ended LTM Ended Fiscal Year Ending December 31, Historical Projected 2013 2014 2015 3/31/2016 6/30/2016 2016E 2017E 2018E 2019E 2020E 2013—2015 2015—2020 Shipments $4,173 $4,430 $4,450 $4,440 $4,445 $4,490 $4,906 $5,206 $5,478 $5,714 CAGR CAGR
Growth % — 6.2% 0.5% -—- 0.9% 9.3% 6.1% 5.2% 4.3%
Net Revenue¹ $3,889 $4,163 $4,198 $4,201 $4,217 $4,253 $4,666 $4,966 $5,238 $5,474 3.9% 5.5%
Growth % — 7.0% 0.8% -—- 1.3% 9.7% 6.4% 5.5% 4.5%
Less: Cost of Goods Sold 3,372 3,630 3,661 3,670 3,675 3,678 4,004 4,237 4,467 4,668 Gross Profit $517 $533 $537 $531 $542 $575 $662 $729 $771 $806
Margin% 13.3% 12.8% 12.8% 12.6% 12.9% 13.5% 14.2% 14.7% 14.7% 14.7%
Less: Selling, General and Administrative Expenses² 345 333 388 381 380 349 386 400 413 421 Less: Restructuring Expense 17 59 33 39 39 21 0 0 3 15 Less: Other Operating Expense² 0 0 0 0 0 27 22 29 29 29 Add: Depreciation & Amortization Expense 178 196 208 212 219 217 219 236 261 264 Add: Earnings in Non-consolidated JVs Attributable to Pow ertrain³ 25 35 43 43 43 46 47 52 52 52 Less: EBITDA in Consolidated JVs Attributable to Minority Interests NA 16 18 18 18 20 23 26 28 29 Add: Adjustments 15 59 55 61 59 14 0 0 0 8
Adjusted EBITDA $373 $414 $403 $408 $425 $434 $497 $562 $611 $636 4.0% 9.5%
Growth % 22.5% 11.2% -2.6% -—- 7.7% 14.5% 13.1% 8.7% 4.0% Margin% 9.6% 9.9% 9.6% 9.7% 10.1% 10.2% 10.7% 11.3% 11.7% 11.6%
Add: Pension (and OPEB) Expense 49 44 53 52 53 60 62 62 57 53
Adjusted EBITDAP $421 $458 $456 $460 $478 $494 $560 $625 $668 $689 4.1% 8.6%
Growth % — 8.8% -0.4% -—- 8.4% 13.2% 11.6% 6.9% 3.1% Margin % 10.8% 11.0% 10.9% 10.9% 11.3% 11.6% 12.0% 12.6% 12.8% 12.6%
Less: Depreciation & Amortization Expense 178 196 208 212 219 217 219 236 261 264
Adjusted EBITP $243 $262 $248 $248 $259 $277 $341 $389 $407 $425 1.0% 11.3%
Less: Pension (and OPEB) Expense 49 44 53 52 53 60 62 62 57 53
Adjusted EBIT $195 $218 $195 $196 $206 $217 $278 $326 $350 $372 0.2% 13.7%
Margin % 5.0% 5.2% 4.7% 4.7% 4.9% 5.1% 6.0% 6.6% 6.7% 6.8%
Adjusted EBITDAP—CapEx $145 $190 $155 $161 $169 $196 $267 $336 $358 $369 Adjusted EBITDA—CapEx $97 $146 $102 $109 $116 $136 $204 $273 $301 $316
Note: Historical financials show n above do not reflect pro forma adjustments for tw o-stage TRW-Valvetrain acquisition completed in February 2015 and July 2015. Per Company management, 2015 revenue and EBITDA w ould need to be adjusted by $107 million and $13 million, respectively, to reflect pro forma full-year impact of TRW-Valvetrain acquisition. Per Company management, full year 2015 revenue and EBITDA for TRW-Valvetrain of $524 million and $67 million, respectively, approximates 2013 and 2014 performance of the entity.
1. Net revenue adjusted for intercompany transactions.
2. “Other operating expenses” have been combined w ith SG&A expenses in historical periods given insufficient segment-level detail.
3. The Company has minority investments in 16 joint ventures and other affiliates primarily aimed at developing a presence in emerging markets. The above reflects the aggregate of Pow ertrain’s pro rata share of earnings in such affiliates accounted for under the equity method (historical information is based on net earnings—no information is available on EBITDA).
4. The Company has 50% or greater ow nership interests in 21 joint ventures and other affiliates primarily aimed at developing presence in emerging markets and 100% of EBITDA associated w ith such JVs associated w ith Pow ertrain is consolidated in above financials. The above reflects aggregate of Pow ertrain’s pro rata allocation of EBITDA in each such entity attributable to minority interests.
5. Total Adjustments
Extraordinary Restructuring Expenses $10 $52 $26 $32 $32 $14 $0 $0 $0 $8 Asset Impairments 5 7 29 29 27 0 0 0 0 0 Total Adjustments $15 $59 $55 $61 $59 $14 $0 $0 $0 $8
6. Per Company management, Pow ertrain incurs approximately $5 million to $10 milllion of annual restructuring expenses in the ordinary course to preserve top-line and margin performance. Accordingly, adjustments for restructuring expense reflect levels above $7.5 million run-rate for Pow ertrain.
Adjusted EBIT refers to Earnings Before Interest and Taxes, adjusted for certain non-recurring items.
Adjusted EBITDA refers to Earnings Before Interest, Taxes, Depreciation & Amortization, adjusted for certain non-recurring items.
Adjusted EBITDAP refers to Earnings Before Interest, Taxes, Depreciation, Amortization and Pension (and OPEB) Expense, adjusted for certain non-recurring items. CAGR refers to Compound Annual Grow th Rate.
CapEx refers to Capital Expenditures. NA refers to Not Available.
Source: Piston management, including projections prepared by Piston management, Company Form 10-K filed on February 29, 2016, Company Form 10-Q filed on April 27, 2016, Company Form 10-Q filed on July 27, 2016.
CONFIDENTIAL—PRELIMINARY DRAFT—SUBJECT TO FURTHER REVIEW 14
|
|
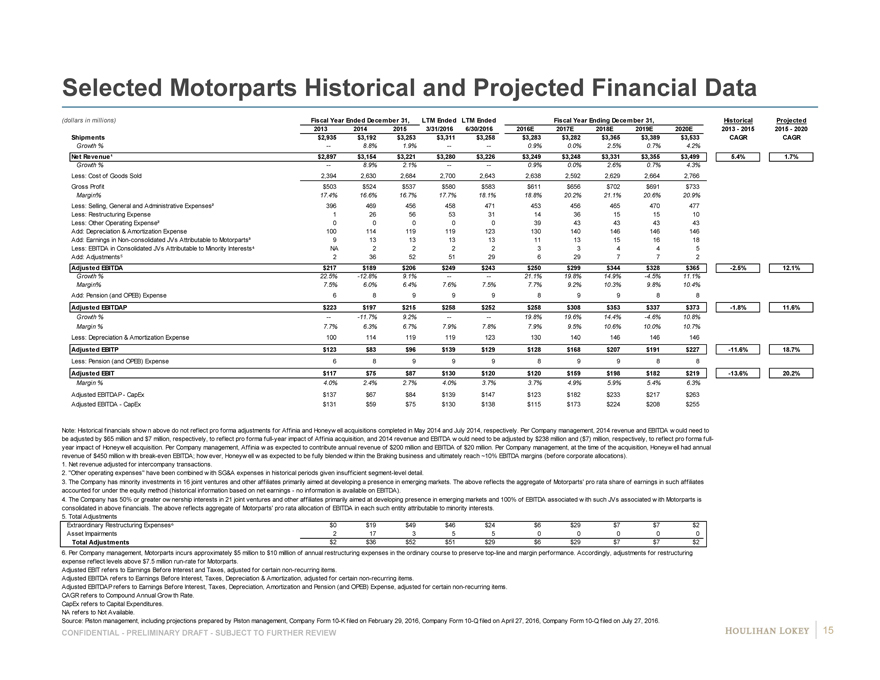
Selected Motorparts Historical and Projected Financial Data
(dollars in millions) Fiscal Year Ended December 31, LTM Ended LTM Ended Fiscal Year Ending December 31, Historical Projected 2013 2014 2015 3/31/2016 6/30/2016 2016E 2017E 2018E 2019E 2020E 2013—2015 2015—2020 Shipments $2,935 $3,192 $3,253 $3,311 $3,258 $3,283 $3,282 $3,365 $3,389 $3,533 CAGR CAGR
Growth % — 8.8% 1.9% -—- 0.9% 0.0% 2.5% 0.7% 4.2%
Net Revenue¹ $2,897 $3,154 $3,221 $3,280 $3,226 $3,249 $3,248 $3,331 $3,355 $3,499 5.4% 1.7%
Growth % — 8.9% 2.1% -—- 0.9% 0.0% 2.6% 0.7% 4.3%
Less: Cost of Goods Sold 2,394 2,630 2,684 2,700 2,643 2,638 2,592 2,629 2,664 2,766 Gross Profit $503 $524 $537 $580 $583 $611 $656 $702 $691 $733
Margin% 17.4% 16.6% 16.7% 17.7% 18.1% 18.8% 20.2% 21.1% 20.6% 20.9%
Less: Selling, General and Administrative Expenses² 396 469 456 458 471 453 456 465 470 477 Less: Restructuring Expense 1 26 56 53 31 14 36 15 15 10 Less: Other Operating Expense² 0 0 0 0 0 39 43 43 43 43 Add: Depreciation & Amortization Expense 100 114 119 119 123 130 140 146 146 146 Add: Earnings in Non-consolidated JVs Attributable to Motorparts³ 9 13 13 13 13 11 13 15 16 18 Less: EBITDA in Consolidated JVs Attributable to Minority Interests NA 2 2 2 2 3 3 4 4 5 Add: Adjustments 2 36 52 51 29 6 29 7 7 2
Adjusted EBITDA $217 $189 $206 $249 $243 $250 $299 $344 $328 $365 -2.5% 12.1%
Growth % 22.5% -12.8% 9.1% -—- 21.1% 19.8% 14.9% -4.5% 11.1% Margin% 7.5% 6.0% 6.4% 7.6% 7.5% 7.7% 9.2% 10.3% 9.8% 10.4%
Add: Pension (and OPEB) Expense 6 8 9 9 9 8 9 9 8 8
Adjusted EBITDAP $223 $197 $215 $258 $252 $258 $308 $353 $337 $373 -1.8% 11.6%
Growth % -—11.7% 9.2% -—- 19.8% 19.6% 14.4% -4.6% 10.8% Margin % 7.7% 6.3% 6.7% 7.9% 7.8% 7.9% 9.5% 10.6% 10.0% 10.7%
Less: Depreciation & Amortization Expense 100 114 119 119 123 130 140 146 146 146
Adjusted EBITP $123 $83 $96 $139 $129 $128 $168 $207 $191 $227 -11.6% 18.7%
Less: Pension (and OPEB) Expense 6 8 9 9 9 8 9 9 8 8
Adjusted EBIT $117 $75 $87 $130 $120 $120 $159 $198 $182 $219 -13.6% 20.2%
Margin % 4.0% 2.4% 2.7% 4.0% 3.7% 3.7% 4.9% 5.9% 5.4% 6.3%
Adjusted EBITDAP—CapEx $137 $67 $84 $139 $147 $123 $182 $233 $217 $263 Adjusted EBITDA—CapEx $131 $59 $75 $130 $138 $115 $173 $224 $208 $255
Note: Historical financials show n above do not reflect pro forma adjustments for Affinia and Honeyw ell acquisitions completed in May 2014 and July 2014, respectively. Per Company management, 2014 revenue and EBITDA w ould need to be adjusted by $65 million and $7 million, respectively, to reflect pro forma full-year impact of Affinia acquisition, and 2014 revenue and EBITDA w ould need to be adjusted by $238 million and ($7) million, respectively, to reflect pro forma full-year impact of Honeyw ell acquisition. Per Company management, Affinia w as expected to contribute annual revenue of $200 million and EBITDA of $20 million. Per Company management, at the time of the acquisition, Honeyw ell had annual revenue of $450 million w ith break-even EBITDA; how ever, Honeyw ell w as expected to be fully blended w ithin the Braking business and ultimately reach ~10% EBITDA margins (before corporate allocations).
1. Net revenue adjusted for intercompany transactions.
2. “Other operating expenses” have been combined w ith SG&A expenses in historical periods given insufficient segment-level detail.
3. The Company has minority investments in 16 joint ventures and other affiliates primarily aimed at developing a presence in emerging markets. The above reflects the aggregate of Motorparts’ pro rata share of earnings in such affiliates accounted for under the equity method (historical information based on net earnings—no information is available on EBITDA).
4. The Company has 50% or greater ow nership interests in 21 joint ventures and other affiliates primarily aimed at developing presence in emerging markets and 100% of EBITDA associated w ith such JVs associated w ith Motorparts is consolidated in above financials. The above reflects aggregate of Motorparts’ pro rata allocation of EBITDA in each such entity attributable to minority interests.
5. Total Adjustments
Extraordinary Restructuring Expenses $0 $19 $49 $46 $24 $6 $29 $7 $7 $2 Asset Impairments 2 17 3 5 5 0 0 0 0 0 Total Adjustments $2 $36 $52 $51 $29 $6 $29 $7 $7 $2
6. Per Company management, Motorparts incurs approximately $5 million to $10 milllion of annual restructuring expenses in the ordinary course to preserve top-line and margin performance. Accordingly, adjustments for restructuring expense reflect levels above $7.5 million run-rate for Motorparts.
Adjusted EBIT refers to Earnings Before Interest and Taxes, adjusted for certain non-recurring items.
Adjusted EBITDA refers to Earnings Before Interest, Taxes, Depreciation & Amortization, adjusted for certain non-recurring items.
Adjusted EBITDAP refers to Earnings Before Interest, Taxes, Depreciation, Amortization and Pension (and OPEB) Expense, adjusted for certain non-recurring items. CAGR refers to Compound Annual Grow th Rate.
CapEx refers to Capital Expenditures. NA refers to Not Available.
Source: Piston management, including projections prepared by Piston management, Company Form 10-K filed on February 29, 2016, Company Form 10-Q filed on April 27, 2016, Company Form 10-Q filed on July 27, 2016.
CONFIDENTIAL—PRELIMINARY DRAFT—SUBJECT TO FURTHER REVIEW 15
|
|
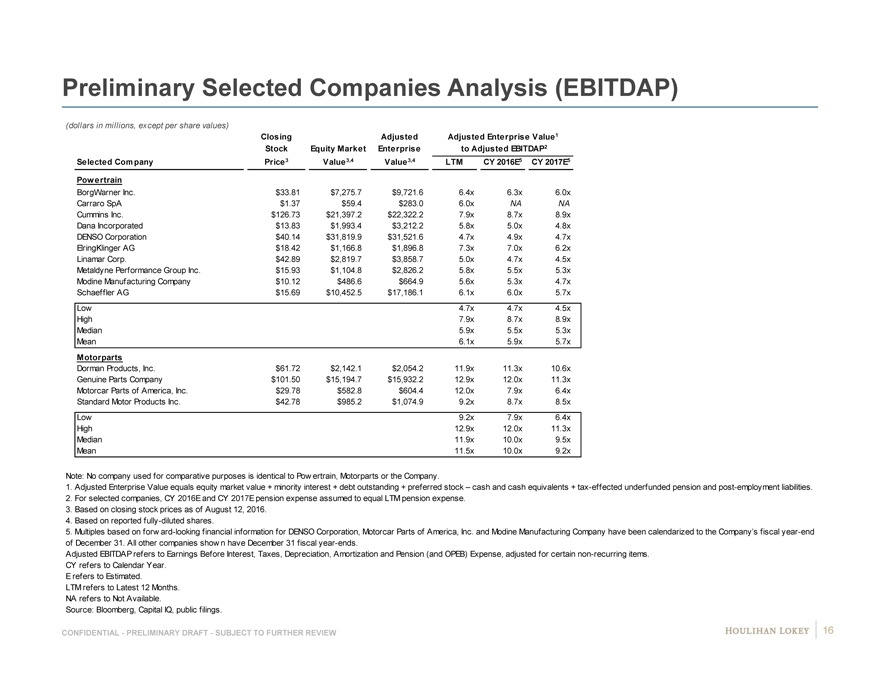
Preliminary Selected Companies Analysis (EBITDAP)
(dollars in millions, except per share values)
Closing Adjusted Adjusted Enterprise Value1 Stock Equity Market Enterprise to Adjusted EBITDAP2 Selected Company Price3 Value3,4 Value3,4 LTM CY 2016E5 CY 2017E5
Powertrain
BorgWarner Inc. $33.81 $7,275.7 $9,721.6 6.4x 6.3x 6.0x 6 9 Carraro SpA $1.37 $59.4 $283.0 6.0x NA NA N NA Cummins Inc. $126.73 $21,397.2 $22,322.2 7.9x 8.7x 8.9x 9 # Dana Incorporated $13.83 $1,993.4 $3,212.2 5.8x 5.0x 4.8x 5 9 DENSO Corporation $40.14 $31,819.9 $31,521.6 4.7x 4.9x 4.7x 5 9 ElringKlinger AG $18.42 $1,166.8 $1,896.8 7.3x 7.0x 6.2x 6 # Linamar Corp. $42.89 $2,819.7 $3,858.7 5.0x 4.7x 4.5x 4 9 Metaldyne Performance Group Inc. $15.93 $1,104.8 $2,826.2 5.8x 5.5x 5.3x 5 9 Modine Manufacturing Company $10.12 $486.6 $664.9 5.6x 5.3x 4.7x 5 9 Schaeffler AG $15.69 $10,452.5 $17,186.1 6.1x 6.0x 5.7x 6 # Low 4.7x 4.7x 4.5x High 7.9x 8.7x 8.9x Median 5.9x 5.5x 5.3x Mean 6.1x 5.9x 5.7x
Motorparts
Dorman Products, Inc. $61.72 $2,142.1 $2,054.2 11.9x 11.3x 10.6x # # Genuine Parts Company $101.50 $15,194.7 $15,932.2 12.9x 12.0x 11.3x # # Motorcar Parts of America, Inc. $29.78 $582.8 $604.4 12.0x 7.9x 6.4x 6 7 Standard Motor Products Inc. $42.78 $985.2 $1,074.9 9.2x 8.7x 8.5x 8 NA Low 9.2x 7.9x 6.4x High 12.9x 12.0x 11.3x Median 11.9x 10.0x 9.5x Mean 11.5x 10.0x 9.2x
Note: No company used for comparative purposes is identical to Pow ertrain, Motorparts or the Company.
1. Adjusted Enterprise Value equals equity market value + minority interest + debt outstanding + preferred stock – cash and cash equivalents + tax-effected underfunded pension and post-employment liabilities.
2. For selected companies, CY 2016E and CY 2017E pension expense assumed to equal LTM pension expense.
3. Based on closing stock prices as of August 12, 2016.
4. Based on reported fully-diluted shares.
5. Multiples based on forw ard-looking financial information for DENSO Corporation, Motorcar Parts of America, Inc. and Modine Manufacturing Company have been calendarized to the Company’s fiscal year-end of December 31. All other companies show n have December 31 fiscal year-ends.
Adjusted EBITDAP refers to Earnings Before Interest, Taxes, Depreciation, Amortization and Pension (and OPEB) Expense, adjusted for certain non-recurring items. CY refers to Calendar Year.
E refers to Estimated.
LTM refers to Latest 12 Months. NA refers to Not Available.
Source: Bloomberg, Capital IQ, public filings.
CONFIDENTIAL—PRELIMINARY DRAFT—SUBJECT TO FURTHER REVIEW 16
|
|
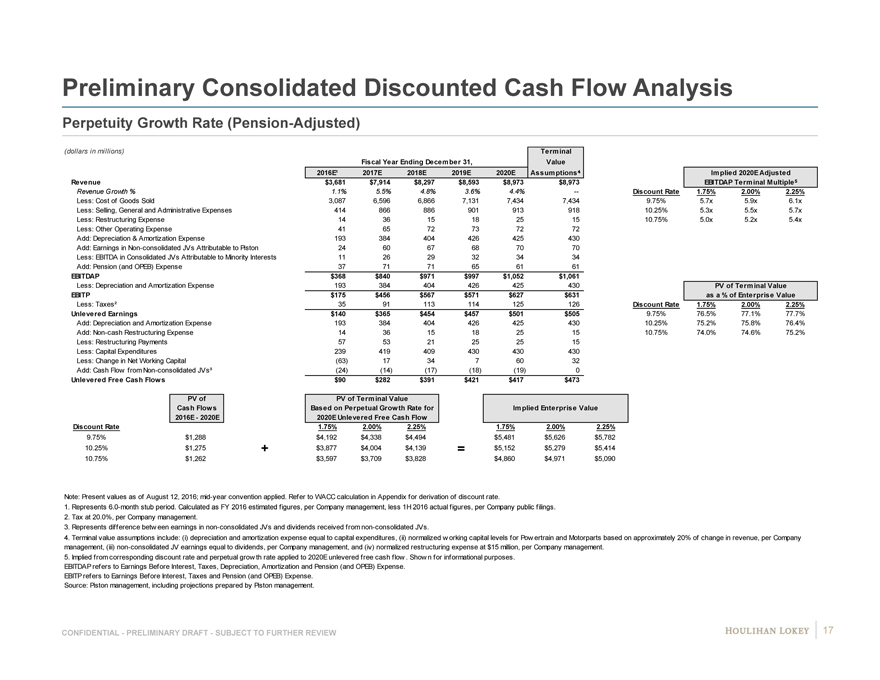
Preliminary Consolidated Discounted Cash Flow Analysis
Perpetuity Growth Rate (Pension-Adjusted)
(dollars in millions) Terminal Fiscal Year Ending December 31, Value
2016E¹ 2017E 2018E 2019E 2020E Assumptions Implied 2020E Adjusted Revenue $3,681 $7,914 $8,297 $8,593 $8,973 $8,973 EBITDAP Terminal Multiple
Revenue Growth % 1.1% 5.5% 4.8% 3.6% 4.4% — Discount Rate 1.75% 2.00% 2.25%
Less: Cost of Goods Sold 3,087 6,596 6,866 7,131 7,434 7,434 9.75% 5.7x 5.9x 6.1x Less: Selling, General and Administrative Expenses 414 866 886 901 913 918 10.25% 5.3x 5.5x 5.7x Less: Restructuring Expense 14 36 15 18 25 15 10.75% 5.0x 5.2x 5.4x Less: Other Operating Expense 41 65 72 73 72 72 Add: Depreciation & Amortization Expense 193 384 404 426 425 430 Add: Earnings in Non-consolidated JVs Attributable to Piston 24 60 67 68 70 70 Less: EBITDA in Consolidated JVs Attributable to Minority Interests 11 26 29 32 34 34 Add: Pension (and OPEB) Expense 37 71 71 65 61 61
EBITDAP $368 $840 $971 $997 $1,052 $1,061
Less: Depreciation and Amortization Expense 193 384 404 426 425 430 PV of Terminal Value EBITP $175 $456 $567 $571 $627 $631 as a % of Enterprise Value
Less: Taxes² 35 91 113 114 125 126 Discount Rate 1.75% 2.00% 2.25% Unlevered Earnings $140 $365 $454 $457 $501 $505 9.75% 76.5% 77.1% 77.7% Add: Depreciation and Amortization Expense 193 384 404 426 425 430 10.25% 75.2% 75.8% 76.4% Add: Non-cash Restructuring Expense 14 36 15 18 25 15 10.75% 74.0% 74.6% 75.2% Less: Restructuring Payments 57 53 21 25 25 15 Less: Capital Expenditures 239 419 409 430 430 430 Less: Change in Net Working Capital (63) 17 34 7 60 32 Add: Cash Flow from Non-consolidated JVs³ (24) (14) (17) (18) (19) 0
Unlevered Free Cash Flows $90 $282 $391 $421 $417 $473
PV of PV of Terminal Value
Cash Flows Based on Perpetual Growth Rate for Implied Enterprise Value 2016E—2020E 2020E Unlevered Free Cash Flow Discount Rate 1.75% 2.00% 2.25% 1.75% 2.00% 2.25%
9.75% 0.098 $1,288 $4,192 $4,338 $4,494 $5,481 $5,626 $5,782 10.25% 0.103 $1,275 + $3,877 $4,004 $4,139 = $5,152 $5,279 $5,414 10.75% 0.108 $1,262 $3,597 $3,709 $3,828 $4,860 $4,971 $5,090
Note: Present values as of August 12, 2016; mid-year convention applied. Refer to WACC calculation in Appendix for derivation of discount rate.
1. Represents 6.0-month stub period. Calculated as FY 2016 estimated figures, per Company management, less 1H 2016 actual figures, per Company public filings.
2. Tax at 20.0%, per Company management.
3. Represents difference betw een earnings in non-consolidated JVs and dividends received from non-consolidated JVs.
4. Terminal value assumptions include: (i) depreciation and amortization expense equal to capital expenditures, (ii) normalized w orking capital levels for Pow ertrain and Motorparts based on approximately 20% of change in revenue, per Company management, (iii) non-consolidated JV earnings equal to dividends, per Company management, and (iv) normalized restructuring expense at $15 million, per Company management.
5. Implied from corresponding discount rate and perpetual grow th rate applied to 2020E unlevered free cash flow . Show n for informational purposes.
EBITDAP refers to Earnings Before Interest, Taxes, Depreciation, Amortization and Pension (and OPEB) Expense. EBITP refers to Earnings Before Interest, Taxes and Pension (and OPEB) Expense.
Source: Piston management, including projections prepared by Piston management.
CONFIDENTIAL—PRELIMINARY DRAFT—SUBJECT TO FURTHER REVIEW 17
|
|
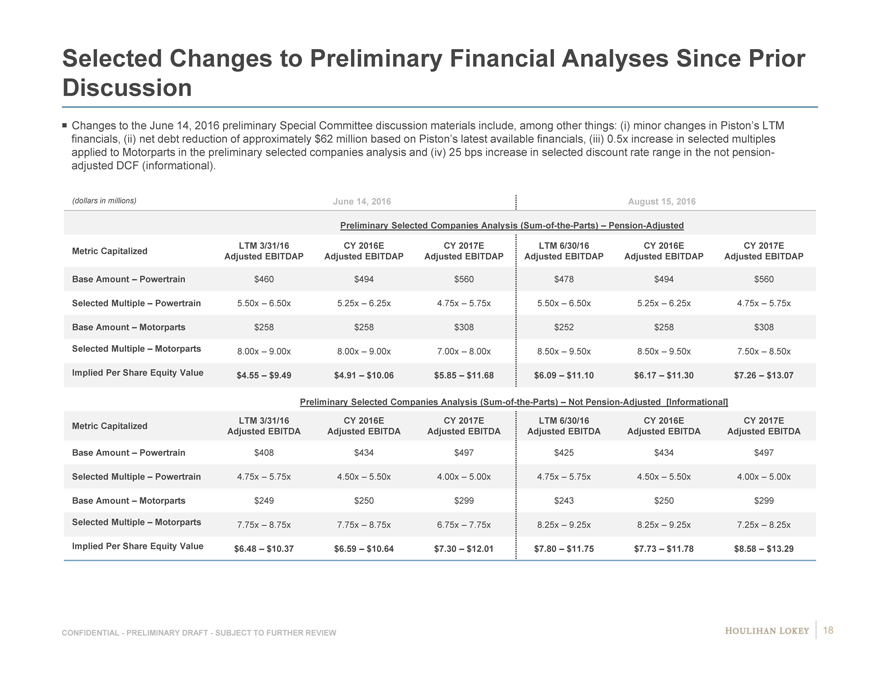
Selected Changes to Preliminary Financial Analyses Since Prior Discussion
Changes to the June 14, 2016 preliminary Special Committee discussion materials include, among other things: (i) minor changes in Piston’s LTM financials, (ii) net debt reduction of approximately $62 million based on Piston’s latest available financials, (iii) 0.5x increase in selected multiples applied to Motorparts in the preliminary selected companies analysis and (iv) 25 bps increase in selected discount rate range in the not pension-adjusted DCF (informational).
(dollars in millions) June 14, 2016 August 15, 2016
Preliminary Selected Companies Analysis (Sum-of-the-Parts) – Pension-Adjusted
LTM 3/31/16 CY 2016E CY 2017E LTM 6/30/16 CY 2016E CY 2017E Metric Capitalized Adjusted EBITDAP Adjusted EBITDAP Adjusted EBITDAP Adjusted EBITDAP Adjusted EBITDAP Adjusted EBITDAP
Base Amount – Powertrain $460 $494 $560 $478 $494 $560 Selected Multiple – Powertrain 5.50x – 6.50x 5.25x – 6.25x 4.75x – 5.75x 5.50x – 6.50x 5.25x – 6.25x 4.75x – 5.75x Base Amount – Motorparts $258 $258 $308 $252 $258 $308
Selected Multiple – Motorparts 8.00x – 9.00x 8.00x – 9.00x 7.00x – 8.00x 8.50x – 9.50x 8.50x – 9.50x 7.50x – 8.50x
Implied Per Share Equity Value $4.55 – $9.49 $4.91 – $10.06 $5.85 – $11.68 $6.09 – $11.10 $6.17 – $11.30 $7.26 – $13.07
Preliminary Selected Companies Analysis (Sum-of-the-Parts) – Not Pension-Adjusted [Informational]
LTM 3/31/16 CY 2016E CY 2017E LTM 6/30/16 CY 2016E CY 2017E Metric Capitalized Adjusted EBITDA Adjusted EBITDA Adjusted EBITDA Adjusted EBITDA Adjusted EBITDA Adjusted EBITDA
Base Amount – Powertrain $408 $434 $497 $425 $434 $497 Selected Multiple – Powertrain 4.75x – 5.75x 4.50x – 5.50x 4.00x – 5.00x 4.75x – 5.75x 4.50x – 5.50x 4.00x – 5.00x Base Amount – Motorparts $249 $250 $299 $243 $250 $299
Selected Multiple – Motorparts 7.75x – 8.75x 7.75x – 8.75x 6.75x – 7.75x 8.25x – 9.25x 8.25x – 9.25x 7.25x – 8.25x
Implied Per Share Equity Value $6.48 – $10.37 $6.59 – $10.64 $7.30 – $12.01 $7.80 – $11.75 $7.73 – $11.78 $8.58 – $13.29
CONFIDENTIAL—PRELIMINARY DRAFT—SUBJECT TO FURTHER REVIEW 18
|
|
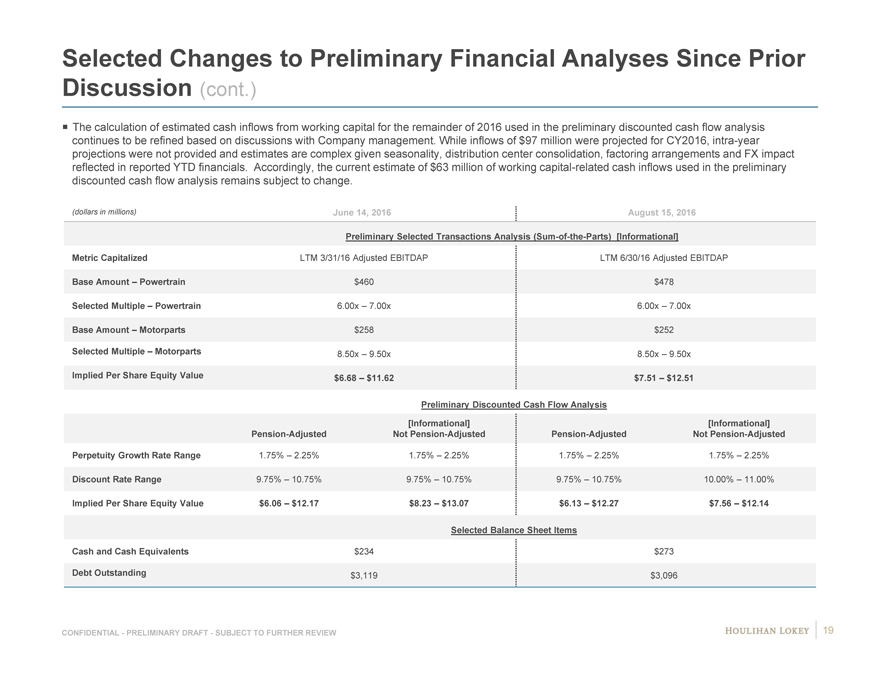
Selected Changes to Preliminary Financial Analyses Since Prior Discussion (cont.)
The calculation of estimated cash inflows from working capital for the remainder of 2016 used in the preliminary discounted cash flow analysis continues to be refined based on discussions with Company management. While inflows of $97 million were projected for CY2016, intra-year projections were not provided and estimates are complex given seasonality, distribution center consolidation, factoring arrangements and FX impact reflected in reported YTD financials. Accordingly, the current estimate of $63 million of working capital-related cash inflows used in the preliminary discounted cash flow analysis remains subject to change.
(dollars in millions) June 14, 2016 August 15, 2016 Preliminary Selected Transactions Analysis (Sum-of-the-Parts) [Informational] Metric Capitalized LTM 3/31/16 Adjusted EBITDAP LTM 6/30/16 Adjusted EBITDAP
Base Amount – Powertrain $460 $478 Selected Multiple – Powertrain 6.00x – 7.00x 6.00x – 7.00x Base Amount – Motorparts $258 $252
Selected Multiple – Motorparts 8.50x – 9.50x 8.50x – 9.50x Implied Per Share Equity Value $6.68 – $11.62 $7.51 – $12.51
Preliminary Discounted Cash Flow Analysis
[Informational] [Informational] Pension-Adjusted Not Pension-Adjusted Pension-Adjusted Not Pension-Adjusted
Perpetuity Growth Rate Range 1.75% – 2.25% 1.75% – 2.25% 1.75% – 2.25% 1.75% – 2.25%
Discount Rate Range 9.75% – 10.75% 9.75% – 10.75% 9.75% – 10.75% 10.00% – 11.00%
Implied Per Share Equity Value $6.06 – $12.17 $8.23 – $13.07 $6.13 – $12.27 $7.56 – $12.14
Selected Balance Sheet Items
Cash and Cash Equivalents $234 $273
Debt Outstanding $3,119 $3,096
CONFIDENTIAL—PRELIMINARY DRAFT—SUBJECT TO FURTHER REVIEW 19
|
|
Page
1. Executive Summary 3
2. Preliminary Financial Analyses 11
3. Selected Public Market Observations 21
4. Appendix 26
5. Disclaimer 56
|
|
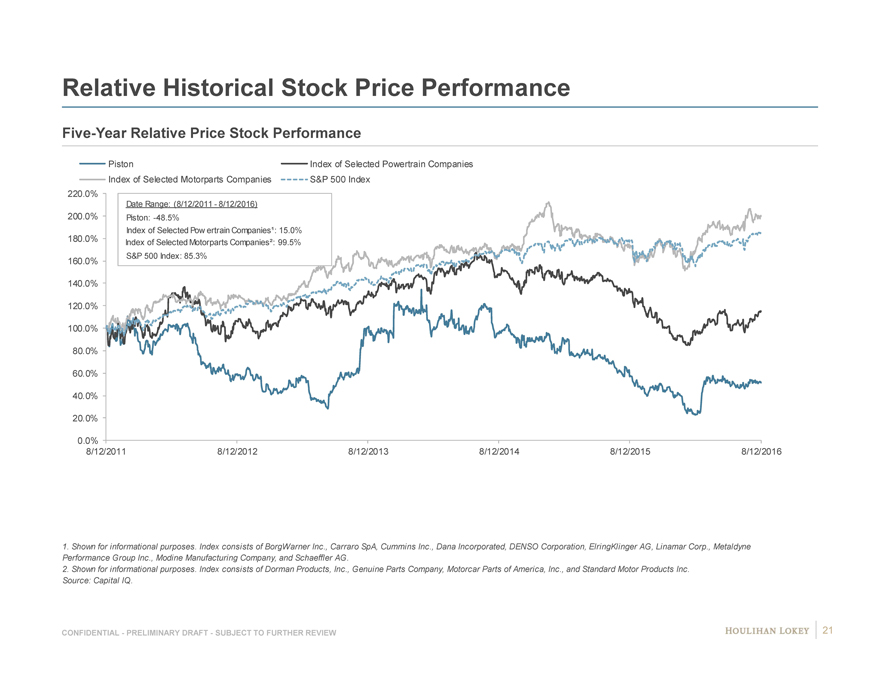
Relative Historical Stock Price Performance
Five-Year Relative Price Stock Performance
Piston Index of Selected Powertrain Companies Index of Selected Motorparts Companies S&P 500 Index 220.0%
Date Range: (8/12/2011—8/12/2016) 200.0% Piston: -48.5%
180.0% Index of Selected Pow ertrain Companies¹: 15.0% Index of Selected Motorparts Companies²: 99.5% S&P 500 Index: 85.3%
160.0% 140.0% 120.0% 100.0%
80.0%
60.0%
40.0%
20.0%
0.0%
8/12/2011 8/12/2012 8/12/2013 8/12/2014 8/12/2015 8/12/2016
1. Shown for informational purposes. Index consists of BorgWarner Inc., Carraro SpA, Cummins Inc., Dana Incorporated, DENSO Corporation, ElringKlinger AG, Linamar Corp., Metaldyne Performance Group Inc., Modine Manufacturing Company, and Schaeffler AG.
2. Shown for informational purposes. Index consists of Dorman Products, Inc., Genuine Parts Company, Motorcar Parts of America, Inc., and Standard Motor Products Inc.
Source: Capital IQ.
CONFIDENTIAL—PRELIMINARY DRAFT—SUBJECT TO FURTHER REVIEW 21
|
|
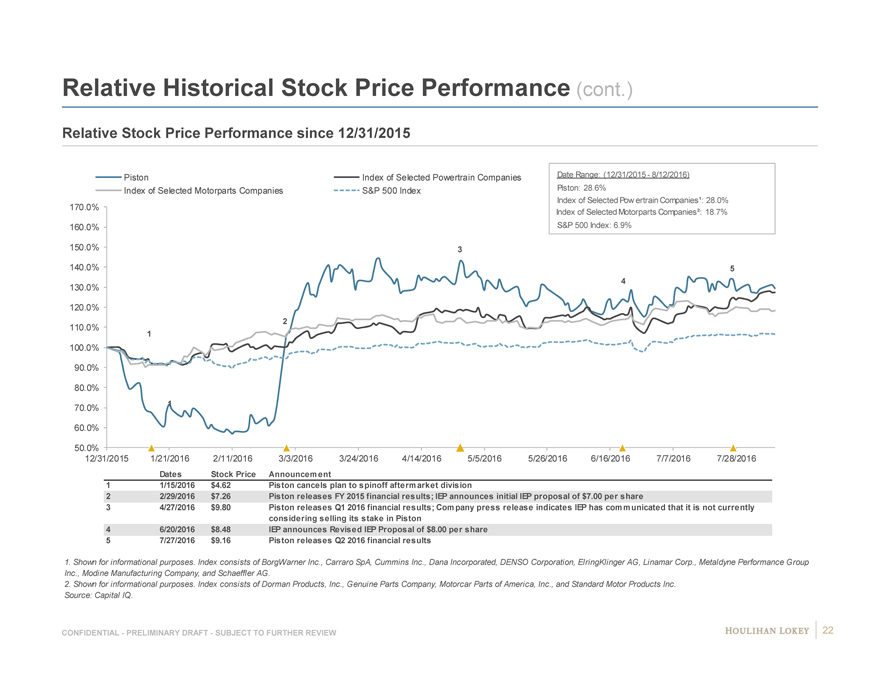
Relative Historical Stock Price Performance (cont.)
Relative Stock Price Performance since 12/31/2015
Piston Index of Selected Powertrain Companies Date Range: (12/31/2015—8/12/2016) Index of Selected Motorparts Companies S&P 500 Index Piston: 28.6%
Index of Selected Pow ertrain Companies¹: 28.0%
170.0%
Index of Selected Motorparts Companies²: 18.7% 160.0% S&P 500 Index: 6.9%
150.0% 3
140.0% 5 4
130.0%
120.0%
2
110.0%
1
100.0%
90.0%
80.0%
1
70.0%
60.0%
50.0%
12/31/2015 1/21/2016 2/11/2016 3/3/2016 3/24/2016 4/14/2016 5/5/2016 5/26/2016 6/16/2016 7/7/2016 7/28/2016
Dates Stock Price Announcement
1 1/15/2016 $4.62 Piston cancels plan to spinoff aftermarket division
2 2/29/2016 $7.26 Piston releases FY 2015 financial results; IEP announces initial IEP proposal of $7.00 per share
3 4/27/2016 $9.80 Piston releases Q1 2016 financial results; Company press release indicates IEP has communicated that it is not currently considering selling its stake in Piston
4 6/20/2016 $8.48 IEP announces Revised IEP Proposal of $8.00 per share
5 7/27/2016 $9.16 Piston releases Q2 2016 financial results
1. Shown for informational purposes. Index consists of BorgWarner Inc., Carraro SpA, Cummins Inc., Dana Incorporated, DENSO Corporation, ElringKlinger AG, Linamar Corp., Metaldyne Performance Group Inc., Modine Manufacturing Company, and Schaeffler AG.
2. Shown for informational purposes. Index consists of Dorman Products, Inc., Genuine Parts Company, Motorcar Parts of America, Inc., and Standard Motor Products Inc.
Source: Capital IQ.
CONFIDENTIAL—PRELIMINARY DRAFT—SUBJECT TO FURTHER REVIEW 22
|
|
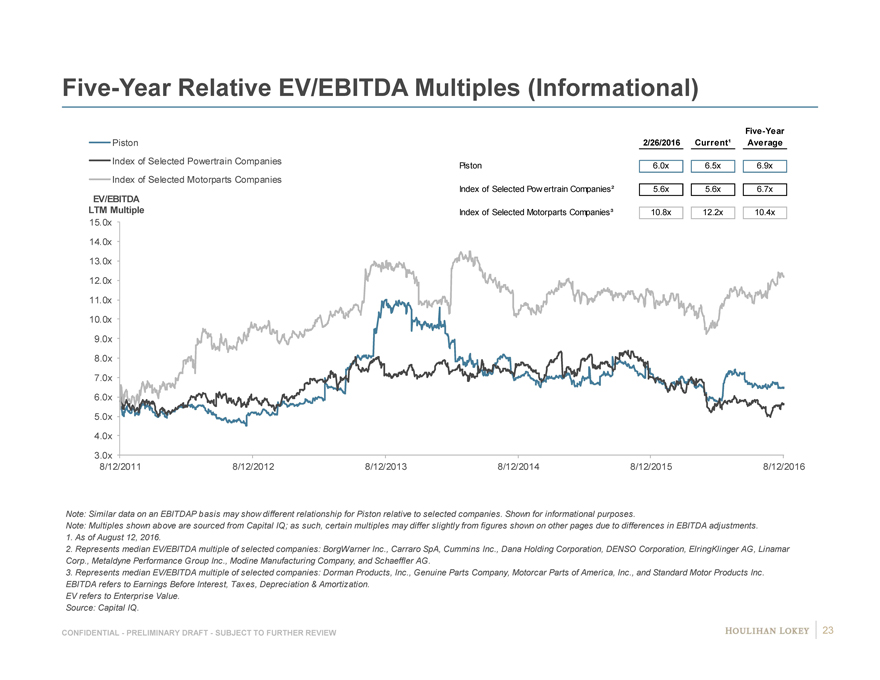
Five-Year Relative EV/EBITDA Multiples (Informational)
Five-Year Piston 2/26/2016 Current¹ Average
Index of Selected Powertrain Companies
Piston 6.0x 6.5x 6.9x
Index of Selected Motorparts Companies
Index of Selected Pow ertrain Companies² 5.6x 5.6x 6.7x
EV/EBITDA
LTM Multiple Index of Selected Motorparts Companies³ 10.8x 12.2x 10.4x
15.0x 14.0x 13.0x 12.0x 11.0x 10.0x 9.0x 8.0x 7.0x 6.0x 5.0x 4.0x
3.0x
8/12/2011 8/12/2012 8/12/2013 8/12/2014 8/12/2015 8/12/2016
Note: Similar data on an EBITDAP basis may show different relationship for Piston relative to selected companies. Shown for informational purposes.
Note: Multiples shown above are sourced from Capital IQ; as such, certain multiples may differ slightly from figures shown on other pages due to differences in EBITDA adjustments.
1. As of August 12, 2016.
2. Represents median EV/EBITDA multiple of selected companies: BorgWarner Inc., Carraro SpA, Cummins Inc., Dana Holding Corporation, DENSO Corporation, ElringKlinger AG, Linamar Corp., Metaldyne Performance Group Inc., Modine Manufacturing Company, and Schaeffler AG.
3. Represents median EV/EBITDA multiple of selected companies: Dorman Products, Inc., Genuine Parts Company, Motorcar Parts of America, Inc., and Standard Motor Products Inc.
EBITDA refers to Earnings Before Interest, Taxes, Depreciation & Amortization. EV refers to Enterprise Value.
Source: Capital IQ.
CONFIDENTIAL—PRELIMINARY DRAFT—SUBJECT TO FURTHER REVIEW 23
|
|
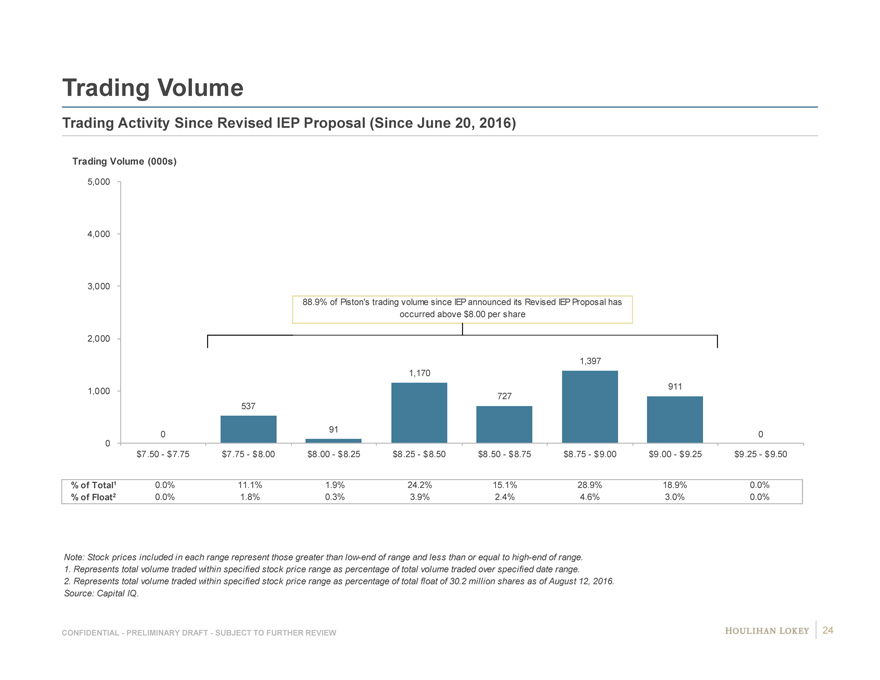
Trading Volume
Trading Activity Since Revised IEP Proposal (Since June 20, 2016)
Trading Volume (000s)
5,000
4,000
3,000
88.9% of Piston’s trading volume since IEP announced its Revised IEP Proposal has occurred above $8.00 per share
2,000
1,397 1,170
911 1,000 727 537
91
0 0 0
$7.50—$7.75 $7.75—$8.00 $8.00—$8.25 $8.25—$8.50 $8.50—$8.75 $8.75—$9.00 $9.00—$9.25 $9.25—$9.50
% of Total1 0.0% 11.1% 1.9% 24.2% 15.1% 28.9% 18.9% 0.0% % of Float2 0.0% 1.8% 0.3% 3.9% 2.4% 4.6% 3.0% 0.0%
Note: Stock prices included in each range represent those greater than low-end of range and less than or equal to high-end of range.
1. Represents total volume traded within specified stock price range as percentage of total volume traded over specified date range.
2. Represents total volume traded within specified stock price range as percentage of total float of 30.2 million shares as of August 12, 2016.
Source: Capital IQ.
CONFIDENTIAL—PRELIMINARY DRAFT—SUBJECT TO FURTHER REVIEW 24
|
|
Page
1. Executive Summary 3
2. Preliminary Financial Analyses 11
3. Selected Public Market Observations 21
4. Appendix 26 Cost of Capital Considerations 27 Selected Companies—Operating Statistics 33 Company Financial Performance Observations 37 Implied Premiums Paid Observations 40 Illustrative Preliminary Financial Analyses (EBITDA) 43
5. Disclaimer 56
|
|

Weighted Average Cost of Capital Calculation Summary (Pension-Adjusted)
Powertrain
Computed Pension-Adjusted Weighted Average Cost of Capital 9.7%
Motorparts
Computed Pension-Adjusted Weighted Average Cost of Capital 10.8%
Weighted Average Cost of Capital 10.3%
Selected Pension-Adjusted Weighted Average Cost of Capital Range 9.75% — 10.75%
Source: Refer to the four following pages for details.
CONFIDENTIAL—PRELIMINARY DRAFT—SUBJECT TO FURTHER REVIEW 27
|
|
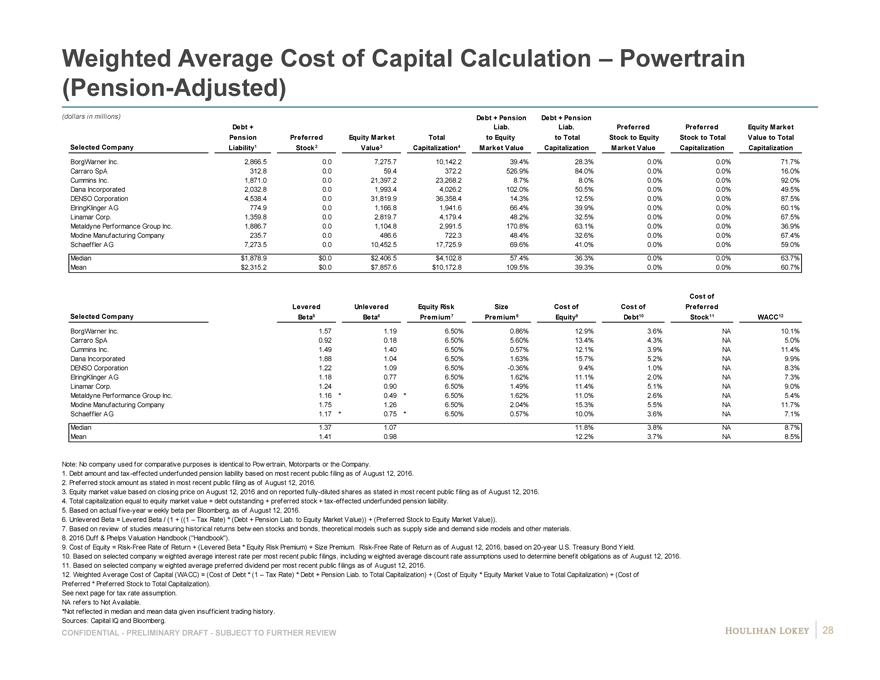
Weighted Average Cost of Capital Calculation – Powertrain (Pension-Adjusted)
(dollars in millions) Debt + Pension Debt + Pension
Debt + Liab. Liab. Preferred Preferred Equity Market Pension Preferred Equity Market Total to Equity to Total Stock to Equity Stock to Total Value to Total Selected Company Liability1 Stock2 Value3 Capitalization4 Market Value Capitalization Market Value Capitalization Capitalization
BorgWarner Inc. 2,866.5 # 0.0 # 7,275.7 # 10,142.2 # 39.4% # 28.3% # 0.0% # 0.0% # 71.7% # Carraro SpA 312.8 # 0.0 # 59.4 # 372.2 # 526.9% # 84.0% # 0.0% # 0.0% # 16.0% # Cummins Inc. 1,871.0 # 0.0 # 21,397.2 # 23,268.2 # 8.7% # 8.0% # 0.0% # 0.0% # 92.0% # Dana Incorporated 2,032.8 # 0.0 # 1,993.4 # 4,026.2 # 102.0% # 50.5% # 0.0% # 0.0% # 49.5% # DENSO Corporation 4,538.4 # 0.0 # 31,819.9 # 36,358.4 # 14.3% # 12.5% # 0.0% # 0.0% # 87.5% # ElringKlinger AG 774.9 # 0.0 # 1,166.8 # 1,941.6 # 66.4% # 39.9% # 0.0% # 0.0% # 60.1% # Linamar Corp. 1,359.8 # 0.0 # 2,819.7 # 4,179.4 # 48.2% # 32.5% # 0.0% # 0.0% # 67.5% # Metaldyne Performance Group Inc. 1,886.7 # 0.0 # 1,104.8 # 2,991.5 # 170.8% # 63.1% # 0.0% # 0.0% # 36.9% # Modine Manufacturing Company 235.7 # 0.0 # 486.6 # 722.3 # 48.4% # 32.6% # 0.0% # 0.0% # 67.4% # Schaeffler AG 7,273.5 # 0.0 # 10,452.5 # 17,725.9 # 69.6% # 41.0% # 0.0% # 0.0% # 59.0% # Median $1,878.9 $0.0 $2,406.5 $4,102.8 57.4% 36.3% 0.0% 0.0% 63.7% Mean $2,315.2 $0.0 $7,857.6 $10,172.8 109.5% 39.3% 0.0% 0.0% 60.7%
Cost of Levered Unlevered Equity Risk Size Cost of Cost of Preferred
Selected Company Beta5 Beta6 Premium7 Premium8 Equity9 Debt10 Stock11 WACC12
BorgWarner Inc. 1.57 # 1.19 # 6.50% 0.86% 12.9% # 3.6% # NA # 10.1% 0 Carraro SpA 0.92 # 0.18 # 6.50% 5.60% 13.4% # 4.3% # NA # 5.0% 0 Cummins Inc. 1.49 # 1.40 # 6.50% 0.57% 12.1% # 3.9% # NA # 11.4% 0 Dana Incorporated 1.88 # 1.04 # 6.50% 1.63% 15.7% # 5.2% # NA # 9.9% 0 DENSO Corporation 1.22 # 1.09 # 6.50% -0.36% 9.4% # 1.0% # NA # 8.3% 0 ElringKlinger AG 1.18 # 0.77 # 6.50% 1.62% 11.1% # 2.0% # NA # 7.3% 0 Linamar Corp. 1.24 # 0.90 # 6.50% 1.49% 11.4% # 5.1% # NA # 9.0% 0 Metaldyne Performance Group Inc. 1.16 * 0.49 * 6.50% 1.62% 11.0% # 2.6% # NA # 5.4% 0 Modine Manufacturing Company 1.75 # 1.26 # 6.50% 2.04% 15.3% # 5.5% # NA # 11.7% 0 Schaeffler AG 1.17 * 0.75 * 6.50% 0.57% 10.0% # 3.6% # NA # 7.1% 0 Median 1.37 1.07 11.8% 3.8% NA 8.7% Mean 1.41 0.98 12.2% 3.7% NA 8.5%
Note: No company used for comparative purposes is identical to Pow ertrain, Motorparts or the Company.
1. Debt amount and tax-effected underfunded pension liability based on most recent public filing as of August 12, 2016.
2. Preferred stock amount as stated in most recent public filing as of August 12, 2016.
3. Equity market value based on closing price on August 12, 2016 and on reported fully-diluted shares as stated in most recent public filing as of August 12, 2016.
4. Total capitalization equal to equity market value + debt outstanding + preferred stock + tax-effected underfunded pension liability.
5. Based on actual five-year w eekly beta per Bloomberg, as of August 12, 2016.
6. Unlevered Beta = Levered Beta / (1 + ((1 – Tax Rate) * (Debt + Pension Liab. to Equity Market Value)) + (Preferred Stock to Equity Market Value)).
7. Based on review of studies measuring historical returns betw een stocks and bonds, theoretical models such as supply side and demand side models and other materials.
8. 2016 Duff & Phelps Valuation Handbook (“Handbook”).
9. Cost of Equity = Risk-Free Rate of Return + (Levered Beta * Equity Risk Premium) + Size Premium. Risk-Free Rate of Return as of August 12, 2016, based on 20-year U.S. Treasury Bond Yield.
10. Based on selected company w eighted average interest rate per most recent public filings, including w eighted average discount rate assumptions used to determine benefit obligations as of August 12, 2016. 11. Based on selected company w eighted average preferred dividend per most recent public filings as of August 12, 2016.
12. Weighted Average Cost of Capital (WACC) = (Cost of Debt * (1 – Tax Rate) * Debt + Pension Liab. to Total Capitalization) + (Cost of Equity * Equity Market Value to Total Capitalization) + (Cost of Preferred * Preferred Stock to Total Capitalization).
See next page for tax rate assumption. NA refers to Not Available.
*Not reflected in median and mean data given insufficient trading history. Sources: Capital IQ and Bloomberg.
CONFIDENTIAL—PRELIMINARY DRAFT—SUBJECT TO FURTHER REVIEW 28
|
|

Weighted Average Cost of Capital Calculation – Powertrain (Pension-Adjusted) (cont.)
Market Assumptions Capital Structure Assumptions Cost of Equity for Computed WACC
Risk-Free Rate of Return¹ 1.85% Debt + Pension Liab. to Total Capitalization 36.3% Selected Unlevered Beta 1.07 Equity Risk Premium² 6.50% Preferred Stock to Total Capitalization 0.0% Computed Levered Beta 1.55 Size Premium³ 1.63% Equity Market Value to Total Capitalization 63.7% Cost of Equity 13.6% Tax Rate 20.00% Debt + Pension Liab. to Equity Market Value 56.9% Preferred Stock to Equity Market Value 0.0% Cost of Debt 3.8% Cost of Preferred Stock NA
Computed Powertrain Weighted Average Cost of Capital 9.7%
1. Risk-Free Rate of Return as of August 12, 2016, based on 20-year U.S. Treasury Bond Yield.
2. Based on review of studies measuring historical returns betw een stocks and bonds, theoretical models such as supply side and demand side models and other materials.
3. Handbook.
4. Per Company management.
5. Based on review of corresponding metrics of selected companies listed on previous page.
6. Based on review of selected companies’ unlevered betas listed on previous page.
7. Computed Levered Beta = Selected Unlevered Beta * (1 + ((Debt + Pension Liab. to Equity Market Value) * (1 – Tax Rate)) + (Preferred Stock to Equity Market Value)). Based on Market and Capital Structure Assumptions.
8. Cost of Equity = Risk-Free Rate of Return + (Computed Levered Beta * Equity Risk Premium) + Size Premium. Based on Market Assumptions.
9. Weighted Average Cost of Capital (WACC) = (Cost of Debt * (1 – Tax Rate) * Debt + Pension Liab. to Total Capitalization) + (Cost of Equity * Equity Market Value to Total Capitalization) + (Cost of Preferred Stock * Preferred Stock to Total Capitalization). Based on “Cost of Equity for Computed WACC” and Market and Capital Structure Assumptions.
NA refers to Not Available. Source: Capital IQ and Bloomberg.
CONFIDENTIAL—PRELIMINARY DRAFT—SUBJECT TO FURTHER REVIEW 29
|
|
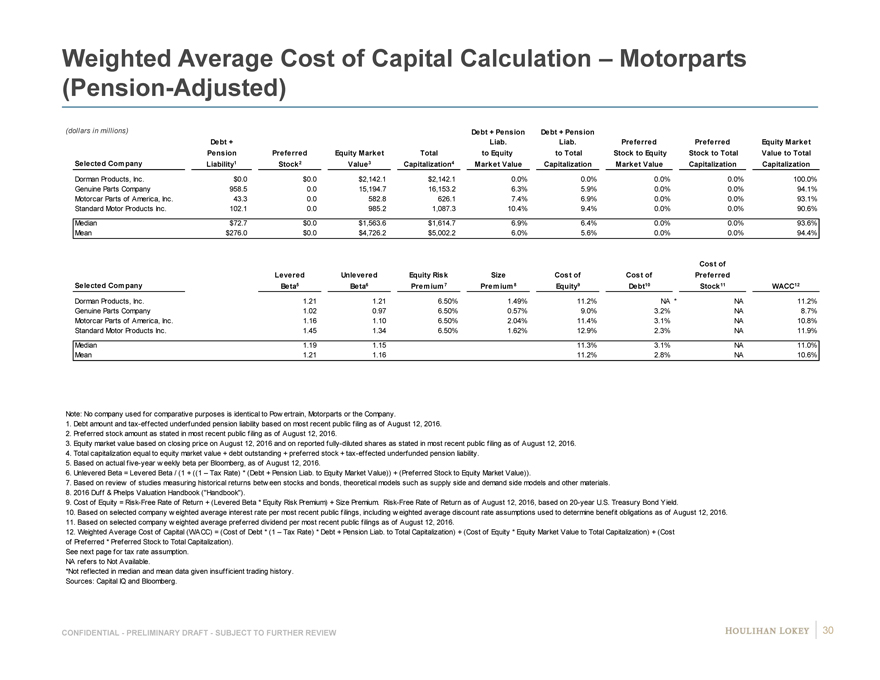
Weighted Average Cost of Capital Calculation – Motorparts (Pension-Adjusted)
(dollars in millions) Debt + Pension Debt + Pension
Debt + Liab. Liab. Preferred Preferred Equity Market Pension Preferred Equity Market Total to Equity to Total Stock to Equity Stock to Total Value to Total Selected Company Liability1 Stock2 Value3 Capitalization4 Market Value Capitalization Market Value Capitalization Capitalization
Dorman Products, Inc. $0.0 # $0.0 # $2,142.1 # $2,142.1 # 0.0% # 0.0% # 0.0% # 0.0% # 100.0% # Genuine Parts Company 958.5 # 0.0 # 15,194.7 # 16,153.2 # 6.3% # 5.9% # 0.0% # 0.0% # 94.1% # Motorcar Parts of America, Inc. 43.3 # 0.0 # 582.8 # 626.1 # 7.4% # 6.9% # 0.0% # 0.0% # 93.1% # Standard Motor Products Inc. 102.1 # 0.0 # 985.2 # 1,087.3 # 10.4% # 9.4% # 0.0% # 0.0% # 90.6% # Median $72.7 $0.0 $1,563.6 $1,614.7 6.9% 6.4% 0.0% 0.0% 93.6% Mean $276.0 $0.0 $4,726.2 $5,002.2 6.0% 5.6% 0.0% 0.0% 94.4%
Cost of Levered Unlevered Equity Risk Size Cost of Cost of Preferred
Selected Company Beta5 Beta6 Premium7 Premium8 Equity9 Debt10 Stock11 WACC12
Dorman Products, Inc. 1.21 # 1.21 # 6.50% 1.49% 11.2% # NA * NA # 11.2% 0 Genuine Parts Company 1.02 # 0.97 # 6.50% 0.57% 9.0% # 3.2% # NA # 8.7% 0 Motorcar Parts of America, Inc. 1.16 # 1.10 # 6.50% 2.04% 11.4% # 3.1% # NA # 10.8% 0 Standard Motor Products Inc. 1.45 # 1.34 # 6.50% 1.62% 12.9% # 2.3% # NA # 11.9% 0 Median 1.19 1.15 11.3% 3.1% NA 11.0% Mean 1.21 1.16 11.2% 2.8% NA 10.6%
Note: No company used for comparative purposes is identical to Pow ertrain, Motorparts or the Company.
1. Debt amount and tax-effected underfunded pension liability based on most recent public filing as of August 12, 2016.
2. Preferred stock amount as stated in most recent public filing as of August 12, 2016.
3. Equity market value based on closing price on August 12, 2016 and on reported fully-diluted shares as stated in most recent public filing as of August 12, 2016.
4. Total capitalization equal to equity market value + debt outstanding + preferred stock + tax-effected underfunded pension liability.
5. Based on actual five-year w eekly beta per Bloomberg, as of August 12, 2016.
6. Unlevered Beta = Levered Beta / (1 + ((1 – Tax Rate) * (Debt + Pension Liab. to Equity Market Value)) + (Preferred Stock to Equity Market Value)).
7. Based on review of studies measuring historical returns betw een stocks and bonds, theoretical models such as supply side and demand side models and other materials.
8. 2016 Duff & Phelps Valuation Handbook (“Handbook”).
9. Cost of Equity = Risk-Free Rate of Return + (Levered Beta * Equity Risk Premium) + Size Premium. Risk-Free Rate of Return as of August 12, 2016, based on 20-year U.S. Treasury Bond Yield.
10. Based on selected company w eighted average interest rate per most recent public filings, including w eighted average discount rate assumptions used to determine benefit obligations as of August 12, 2016. 11. Based on selected company w eighted average preferred dividend per most recent public filings as of August 12, 2016.
12. Weighted Average Cost of Capital (WACC) = (Cost of Debt * (1 – Tax Rate) * Debt + Pension Liab. to Total Capitalization) + (Cost of Equity * Equity Market Value to Total Capitalization) + (Cost of Preferred * Preferred Stock to Total Capitalization).
See next page for tax rate assumption. NA refers to Not Available.
*Not reflected in median and mean data given insufficient trading history. Sources: Capital IQ and Bloomberg.
CONFIDENTIAL—PRELIMINARY DRAFT—SUBJECT TO FURTHER REVIEW 30
|
|
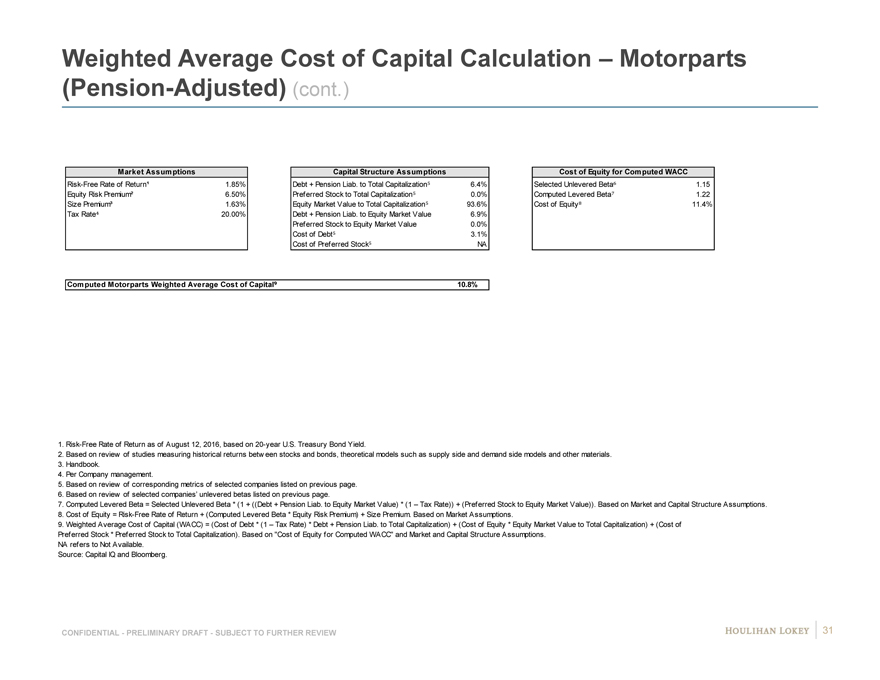
Weighted Average Cost of Capital Calculation – Motorparts (Pension-Adjusted) (cont.)
Market Assumptions Capital Structure Assumptions Cost of Equity for Computed WACC
Risk-Free Rate of Return¹ 1.85% Debt + Pension Liab. to Total Capitalization 6.4% Selected Unlevered Beta 1.15 Equity Risk Premium² 6.50% Preferred Stock to Total Capitalization 0.0% Computed Levered Beta 1.22 Size Premium³ 1.63% Equity Market Value to Total Capitalization 93.6% Cost of Equity 11.4% Tax Rate 20.00% Debt + Pension Liab. to Equity Market Value 6.9% Preferred Stock to Equity Market Value 0.0% Cost of Debt 3.1% Cost of Preferred Stock NA
Computed Motorparts Weighted Average Cost of Capital 10.8%
1. Risk-Free Rate of Return as of August 12, 2016, based on 20-year U.S. Treasury Bond Yield.
2. Based on review of studies measuring historical returns betw een stocks and bonds, theoretical models such as supply side and demand side models and other materials.
3. Handbook.
4. Per Company management.
5. Based on review of corresponding metrics of selected companies listed on previous page.
6. Based on review of selected companies’ unlevered betas listed on previous page.
7. Computed Levered Beta = Selected Unlevered Beta * (1 + ((Debt + Pension Liab. to Equity Market Value) * (1 – Tax Rate)) + (Preferred Stock to Equity Market Value)). Based on Market and Capital Structure Assumptions.
8. Cost of Equity = Risk-Free Rate of Return + (Computed Levered Beta * Equity Risk Premium) + Size Premium. Based on Market Assumptions.
9. Weighted Average Cost of Capital (WACC) = (Cost of Debt * (1 – Tax Rate) * Debt + Pension Liab. to Total Capitalization) + (Cost of Equity * Equity Market Value to Total Capitalization) + (Cost of Preferred Stock * Preferred Stock to Total Capitalization). Based on “Cost of Equity for Computed WACC” and Market and Capital Structure Assumptions.
NA refers to Not Available. Source: Capital IQ and Bloomberg.
CONFIDENTIAL—PRELIMINARY DRAFT—SUBJECT TO FURTHER REVIEW 31
|
|
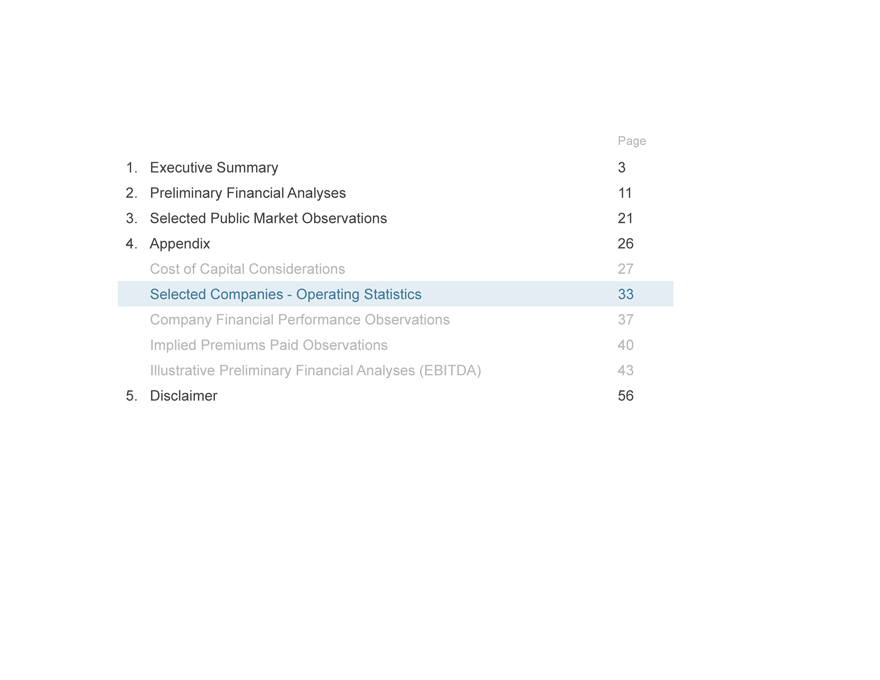
Page
1. Executive Summary 3
2. Preliminary Financial Analyses 11
3. Selected Public Market Observations 21
4. Appendix 26 Cost of Capital Considerations 27 Selected Companies—Operating Statistics 33 Company Financial Performance Observations 37 Implied Premiums Paid Observations 40 Illustrative Preliminary Financial Analyses (EBITDA) 43
5. Disclaimer 56
|
|

Selected Powertrain Companies – Operating Statistics
Size Size¹ Relative Depreciation Internal Investment
(LTM Revenue, millions) (Enterprise Value as of 8/12/2016, millions) (LTM Depreciation to LTM Adjusted EBITDA) (LTM Capital Expenditures to LTM Revenue) DENSO Corporation $44,642.0 DENSO Corporation $30,015.1 Cummins Inc. 18.7% Carraro SpA 3.0% Cummins Inc. $18,205.0 Cummins Inc. $22,322.2 BorgWarner Inc. 23.9% Cummins Inc. 3.8% Schaeffler AG $14,773.4 Schaeffler AG $15,999.9 Schaeffler AG 29.6% Dana Incorporated 4.9% BorgWarner Inc. $8,604.9 BorgWarner Inc. $9,489.9 Linamar Corp. 30.7% Linamar Corp. 6.1% Dana Incorporated $5,838.0 Linamar Corp. $3,858.7 Dana Incorporated 31.4% BorgWarner Inc. 6.1% Linamar Corp. $4,401.7 Dana Incorporated $2,847.4 DENSO Corporation 40.1% Modine Manufacturing Company 6.9% Powertrain $4,217.0 Metaldyne Performance Group Inc. $2,803.7 ElringKlinger AG 40.5% Metaldyne Performance Group Inc. 7.0% Metaldyne Performance Group Inc. $2,949.8 ElringKlinger AG $1,798.7 Modine Manufacturing Company 43.9% Powertrain 7.3% ElringKlinger AG $1,712.6 Modine Manufacturing Company $600.5 Metaldyne Performance Group Inc. 46.2% DENSO Corporation 7.4% Modine Manufacturing Company $1,353.6 Carraro SpA $283.0 Powertrain 51.5% Schaeffler AG 7.8% Carraro SpA $702.7 Carraro SpA 59.9% ElringKlinger AG 11.1%
Historical Growth Projected Growth Projected Growth Projected Growth
(CY 2014 to CY 2015 Revenue) (CY 2015 to CY 2016E Revenue) (CY 2015 to CY 2017E Revenue) (CY 2016E to CY 2017E Revenue)
Linamar Corp. 23.8% Linamar Corp. 19.0% Linamar Corp. 12.8% Powertrain 9.7% ElringKlinger AG 13.7% BorgWarner Inc. 14.0% BorgWarner Inc. 9.1% Linamar Corp. 7.0% Schaeffler AG 9.1% ElringKlinger AG 4.6% Powertrain 5.4% Schaeffler AG 4.7% DENSO Corporation 5.0% Schaeffler AG 2.1% ElringKlinger AG 4.5% ElringKlinger AG 4.5% Powertrain 0.8% Powertrain 1.3% Schaeffler AG 3.4% BorgWarner Inc. 4.5% Cummins Inc. (0.6%) DENSO Corporation 0.0% DENSO Corporation 1.2% Metaldyne Performance Group Inc. 2.9% Metaldyne Performance Group Inc. (3.1%) Modine Manufacturing Company (2.6%) Modine Manufacturing Company (0.6%) Dana Incorporated 2.5% BorgWarner Inc. (3.4%) Dana Incorporated (4.1%) Dana Incorporated (0.8%) DENSO Corporation 2.4% Carraro SpA (7.4%) Metaldyne Performance Group Inc. (6.0%) Metaldyne Performance Group Inc. (1.7%) Modine Manufacturing Company 1.5% Dana Incorporated (8.4%) Cummins Inc. (8.6%) Cummins Inc. (5.1%) Cummins Inc. (1.4%) Modine Manufacturing Company (9.6%) Carraro SpA NA Carraro SpA NA Carraro SpA NA
Historical Growth Projected Growth Projected Growth Projected Growth
(CY 2014 to CY 2015 Adjusted EBITDA) (CY 2015 to CY 2016E Adjusted EBITDA) (CY 2015 to CY 2017E Adjusted EBITDA) (CY 2016E to CY 2017E Adjusted EBITDA) Linamar Corp. 26.6% Linamar Corp. 16.2% Powertrain 11.1% Powertrain 14.5% Schaeffler AG 8.1% Dana Incorporated 10.1% Modine Manufacturing Company 11.0% ElringKlinger AG 14.0% DENSO Corporation 3.9% Modine Manufacturing Company 8.9% Linamar Corp. 11.0% Modine Manufacturing Company 13.2% Cummins Inc. 2.5% BorgWarner Inc. 7.9% ElringKlinger AG 7.8% Linamar Corp. 6.1% Modine Manufacturing Company 1.6% Powertrain 7.7% Dana Incorporated 7.0% Schaeffler AG 5.5% Metaldyne Performance Group Inc. (1.7%) Schaeffler AG 4.0% BorgWarner Inc. 6.1% Metaldyne Performance Group Inc. 4.6% Powertrain (2.6%) Metaldyne Performance Group Inc. 2.6% Schaeffler AG 4.7% BorgWarner Inc. 4.4% BorgWarner Inc. (3.0%) ElringKlinger AG 1.9% Metaldyne Performance Group Inc. 3.6% Dana Incorporated 4.0% ElringKlinger AG (5.1%) DENSO Corporation (6.3%) DENSO Corporation (1.5%) DENSO Corporation 3.6% Carraro SpA (7.5%) Cummins Inc. (15.6%) Cummins Inc. (9.3%) Cummins Inc. (2.4%) Dana Incorporated (18.7%) Carraro SpA NA Carraro SpA NA Carraro SpA NA
Note: No company used for comparative purposes is identical to Pow ertrain. Show n for informational purposes.
Note: Historical financials show n above do not reflect pro forma adjustments for tw o-stage TRW-Valvetrain acquisition completed in February 2015 and July 2015. Per Company management, 2015 revenue and EBITDA w ould need to be adjusted by $107 million and $13 million, respectively, to reflect pro forma full-year impact of TRW-Valvetrain acquisition. Per Company management, full year 2015 revenue and EBITDA for TRW-Valvetrain of $524 million and $67 million, respectively, approximates 2013 and 2014 performance of the entity.
1. Based on public trading prices of common stock.
Adjusted EBITDA refers to Earnings Before Interest, Taxes, Depreciation & Amortization, adjusted for certain non-recurring items. E refers to Estimated.
LTM refers to the most recently completed 12-month period for w hich financial information has been made public. CY refers to calendar year.
NA refers to Not Available.
Source: Public filings, Capital IQ, Bloomberg, Company management.
CONFIDENTIAL—PRELIMINARY DRAFT—SUBJECT TO FURTHER REVIEW 33
|
|
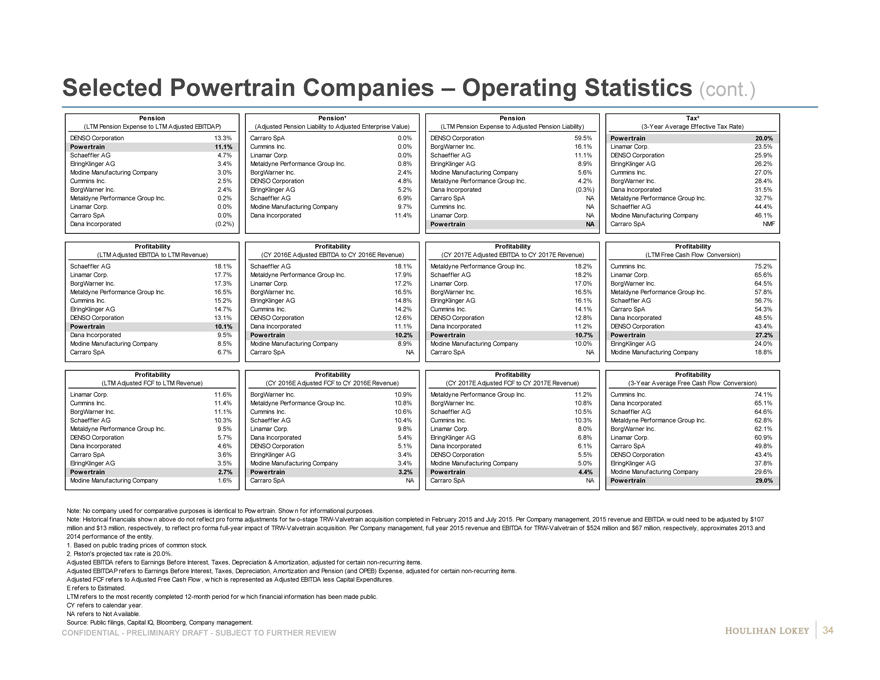
Selected Powertrain Companies – Operating Statistics (cont.)
Pension Pension¹ Pension Tax²
(LTM Pension Expense to LTM Adjusted EBITDAP) (Adjusted Pension Liability to Adjusted Enterprise Value) (LTM Pension Expense to Adjusted Pension Liability) (3-Year Average Effective Tax Rate)
DENSO Corporation 13.3% Carraro SpA 0.0% DENSO Corporation 59.5% Powertrain 20.0% Powertrain 11.1% Cummins Inc. 0.0% BorgWarner Inc. 16.1% Linamar Corp. 23.5% Schaeffler AG 4.7% Linamar Corp. 0.0% Schaeffler AG 11.1% DENSO Corporation 25.9% ElringKlinger AG 3.4% Metaldyne Performance Group Inc. 0.8% ElringKlinger AG 8.9% ElringKlinger AG 26.2% Modine Manufacturing Company 3.0% BorgWarner Inc. 2.4% Modine Manufacturing Company 5.6% Cummins Inc. 27.0% Cummins Inc. 2.5% DENSO Corporation 4.8% Metaldyne Performance Group Inc. 4.2% BorgWarner Inc. 28.4% BorgWarner Inc. 2.4% ElringKlinger AG 5.2% Dana Incorporated (0.3%) Dana Incorporated 31.5% Metaldyne Performance Group Inc. 0.2% Schaeffler AG 6.9% Carraro SpA NA Metaldyne Performance Group Inc. 32.7% Linamar Corp. 0.0% Modine Manufacturing Company 9.7% Cummins Inc. NA Schaeffler AG 44.4% Carraro SpA 0.0% Dana Incorporated 11.4% Linamar Corp. NA Modine Manufacturing Company 46.1% Dana Incorporated (0.2%) Powertrain NA Carraro SpA NMF
Profitability Profitability Profitability Profitability
(LTM Adjusted EBITDA to LTM Revenue) (CY 2016E Adjusted EBITDA to CY 2016E Revenue) (CY 2017E Adjusted EBITDA to CY 2017E Revenue) (LTM Free Cash Flow Conversion)
Schaeffler AG 18.1% Schaeffler AG 18.1% Metaldyne Performance Group Inc. 18.2% Cummins Inc. 75.2% Linamar Corp. 17.7% Metaldyne Performance Group Inc. 17.9% Schaeffler AG 18.2% Linamar Corp. 65.6% BorgWarner Inc. 17.3% Linamar Corp. 17.2% Linamar Corp. 17.0% BorgWarner Inc. 64.5% Metaldyne Performance Group Inc. 16.5% BorgWarner Inc. 16.5% BorgWarner Inc. 16.5% Metaldyne Performance Group Inc. 57.8% Cummins Inc. 15.2% ElringKlinger AG 14.8% ElringKlinger AG 16.1% Schaeffler AG 56.7% ElringKlinger AG 14.7% Cummins Inc. 14.2% Cummins Inc. 14.1% Carraro SpA 54.3% DENSO Corporation 13.1% DENSO Corporation 12.6% DENSO Corporation 12.8% Dana Incorporated 48.5% Powertrain 10.1% Dana Incorporated 11.1% Dana Incorporated 11.2% DENSO Corporation 43.4% Dana Incorporated 9.5% Powertrain 10.2% Powertrain 10.7% Powertrain 27.2%
Modine Manufacturing Company 8.5% Modine Manufacturing Company 8.9% Modine Manufacturing Company 10.0% ElringKlinger AG 24.0% Carraro SpA 6.7% Carraro SpA NA Carraro SpA NA Modine Manufacturing Company 18.8%
Profitability Profitability Profitability Profitability
(LTM Adjusted FCF to LTM Revenue) (CY 2016E Adjusted FCF to CY 2016E Revenue) (CY 2017E Adjusted FCF to CY 2017E Revenue) (3-Year Average Free Cash Flow Conversion) Linamar Corp. 11.6% BorgWarner Inc. 10.9% Metaldyne Performance Group Inc. 11.2% Cummins Inc. 74.1% Cummins Inc. 11.4% Metaldyne Performance Group Inc. 10.8% BorgWarner Inc. 10.8% Dana Incorporated 65.1% BorgWarner Inc. 11.1% Cummins Inc. 10.6% Schaeffler AG 10.5% Schaeffler AG 64.6% Schaeffler AG 10.3% Schaeffler AG 10.4% Cummins Inc. 10.3% Metaldyne Performance Group Inc. 62.8% Metaldyne Performance Group Inc. 9.5% Linamar Corp. 9.8% Linamar Corp. 8.0% BorgWarner Inc. 62.1% DENSO Corporation 5.7% Dana Incorporated 5.4% ElringKlinger AG 6.8% Linamar Corp. 60.9% Dana Incorporated 4.6% DENSO Corporation 5.1% Dana Incorporated 6.1% Carraro SpA 49.8% Carraro SpA 3.6% ElringKlinger AG 3.4% DENSO Corporation 5.5% DENSO Corporation 43.4% ElringKlinger AG 3.5% Modine Manufacturing Company 3.4% Modine Manufacturing Company 5.0% ElringKlinger AG 37.8%
Powertrain 2.7% Powertrain 3.2% Powertrain 4.4% Modine Manufacturing Company 29.6% Modine Manufacturing Company 1.6% Carraro SpA NA Carraro SpA NA Powertrain 29.0%
Note: No company used for comparative purposes is identical to Pow ertrain. Show n for informational purposes.
Note: Historical financials show n above do not reflect pro forma adjustments for tw o-stage TRW-Valvetrain acquisition completed in February 2015 and July 2015. Per Company management, 2015 revenue and EBITDA w ould need to be adjusted by $107 million and $13 million, respectively, to reflect pro forma full-year impact of TRW-Valvetrain acquisition. Per Company management, full year 2015 revenue and EBITDA for TRW-Valvetrain of $524 million and $67 million, respectively, approximates 2013 and 2014 performance of the entity.
1. Based on public trading prices of common stock.
2. Piston’s projected tax rate is 20.0%.
Adjusted EBITDA refers to Earnings Before Interest, Taxes, Depreciation & Amortization, adjusted for certain non-recurring items.
Adjusted EBITDAP refers to Earnings Before Interest, Taxes, Depreciation, Amortization and Pension (and OPEB) Expense, adjusted for certain non-recurring items. Adjusted FCF refers to Adjusted Free Cash Flow , w hich is represented as Adjusted EBITDA less Capital Expenditures.
E refers to Estimated.
LTM refers to the most recently completed 12-month period for w hich financial information has been made public. CY refers to calendar year.
NA refers to Not Available.
Source: Public filings, Capital IQ, Bloomberg, Company management. 34
CONFIDENTIAL—PRELIMINARY DRAFT—SUBJECT TO FURTHER REVIEW
|
|
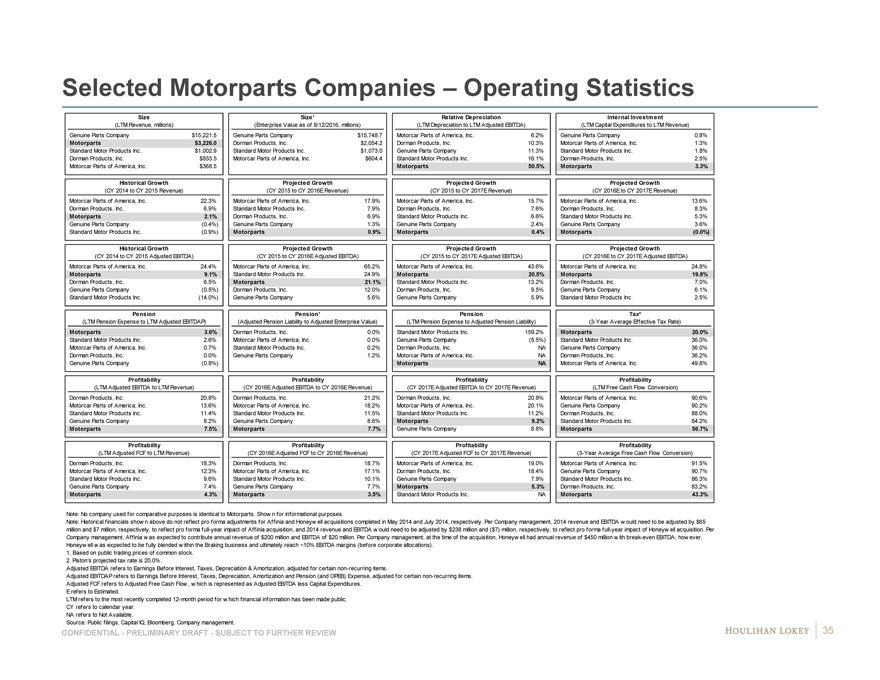
Selected Motorparts Companies – Operating Statistics
Size Size¹ Relative Depreciation Internal Investment
(LTM Revenue, millions) (Enterprise Value as of 8/12/2016, millions) (LTM Depreciation to LTM Adjusted EBITDA) (LTM Capital Expenditures to LTM Revenue) Genuine Parts Company $15,221.5 Genuine Parts Company $15,748.7 Motorcar Parts of America, Inc. 6.2% Genuine Parts Company 0.8% Motorparts $3,226.0 Dorman Products, Inc. $2,054.2 Dorman Products, Inc. 10.3% Motorcar Parts of America, Inc. 1.3% Standard Motor Products Inc. $1,002.9 Standard Motor Products Inc. $1,073.0 Genuine Parts Company 11.3% Standard Motor Products Inc. 1.8% Dorman Products, Inc. $833.5 Motorcar Parts of America, Inc. $604.4 Standard Motor Products Inc. 16.1% Dorman Products, Inc. 2.5% Motorcar Parts of America, Inc. $368.5 ########## Motorparts 50.5% Motorparts 3.3%
Historical Grow th Projected Growth Projected Growth Projected Growth
(CY 2014 to CY 2015 Revenue) (CY 2015 to CY 2016E Revenue) (CY 2015 to CY 2017E Revenue) (CY 2016E to CY 2017E Revenue)
Motorcar Parts of America, Inc. 22.3% Motorcar Parts of America, Inc. 17.9% Motorcar Parts of America, Inc. 15.7% Motorcar Parts of America, Inc. 13.6% Dorman Products, Inc. 6.9% Standard Motor Products Inc. 7.9% Dorman Products, Inc. 7.6% Dorman Products, Inc. 8.3% Motorparts 2.1% Dorman Products, Inc. 6.9% Standard Motor Products Inc. 6.6% Standard Motor Products Inc. 5.3% Genuine Parts Company (0.4%) Genuine Parts Company 1.3% Genuine Parts Company 2.4% Genuine Parts Company 3.6% Standard Motor Products Inc. (0.9%) Motorparts 0.9% Motorparts 0.4% Motorparts (0.0%)
Historical Grow th Projected Growth Projected Growth Projected Growth
(CY 2014 to CY 2015 Adjusted EBITDA) (CY 2015 to CY 2016E Adjusted EBITDA) (CY 2015 to CY 2017E Adjusted EBITDA) (CY 2016E to CY 2017E Adjusted EBITDA) Motorcar Parts of America, Inc. 24.4% Motorcar Parts of America, Inc. 65.2% Motorcar Parts of America, Inc. 43.6% Motorcar Parts of America, Inc. 24.8%
Motorparts 9.1% Standard Motor Products Inc. 24.9% Motorparts 20.5% Motorparts 19.8%
Dorman Products, Inc. 6.5% Motorparts 21.1% Standard Motor Products Inc. 13.2% Dorman Products, Inc. 7.0% Genuine Parts Company (0.5%) Dorman Products, Inc. 12.0% Dorman Products, Inc. 9.5% Genuine Parts Company 6.1% Standard Motor Products Inc. (14.0%) Genuine Parts Company 5.6% Genuine Parts Company 5.9% Standard Motor Products Inc. 2.5%
Pension Pension¹ Pension Tax²
(LTM Pension Expense to LTM Adjusted EBITDAP) (Adjusted Pension Liability to Adjusted Enterprise Value) (LTM Pension Expense to Adjusted Pension Liability) (3-Year Average Effective Tax Rate)
Motorparts 3.6% Dorman Products, Inc. 0.0% Standard Motor Products Inc. 159.2% Motorparts 20.0% Standard Motor Products Inc. 2.6% Motorcar Parts of America, Inc. 0.0% Genuine Parts Company (5.5%) Standard Motor Products Inc. 36.0% Motorcar Parts of America, Inc. 0.7% Standard Motor Products Inc. 0.2% Dorman Products, Inc. NA Genuine Parts Company 36.0% Dorman Products, Inc. 0.0% Genuine Parts Company 1.2% Motorcar Parts of America, Inc. NA Dorman Products, Inc. 36.2% Genuine Parts Company (0.8%) Motorparts NA Motorcar Parts of America, Inc. 49.8%
Profitability Profitability Profitability Profitability
(LTM Adjusted EBITDA to LTM Revenue) (CY 2016E Adjusted EBITDA to CY 2016E Revenue) (CY 2017E Adjusted EBITDA to CY 2017E Revenue) (LTM Free Cash Flow Conversion)
Dorman Products, Inc. 20.8% Dorman Products, Inc. 21.2% Dorman Products, Inc. 20.9% Motorcar Parts of America, Inc. 90.6% Motorcar Parts of America, Inc. 13.6% Motorcar Parts of America, Inc. 18.2% Motorcar Parts of America, Inc. 20.1% Genuine Parts Company 90.2% Standard Motor Products Inc. 11.4% Standard Motor Products Inc. 11.5% Standard Motor Products Inc. 11.2% Dorman Products, Inc. 88.0% Genuine Parts Company 8.2% Genuine Parts Company 8.6% Motorparts 9.2% Standard Motor Products Inc. 84.2%
Motorparts 7.5% Motorparts 7.7% Genuine Parts Company 8.8% Motorparts 56.7%
Profitability Profitability Profitability Profitability
(LTM Adjusted FCF to LTM Revenue) (CY 2016E Adjusted FCF to CY 2016E Revenue) (CY 2017E Adjusted FCF to CY 2017E Revenue) (3-Year Average Free Cash Flow Conversion) Dorman Products, Inc. 18.3% Dorman Products, Inc. 18.7% Motorcar Parts of America, Inc. 19.0% Motorcar Parts of America, Inc. 91.5% Motorcar Parts of America, Inc. 12.3% Motorcar Parts of America, Inc. 17.1% Dorman Products, Inc. 18.4% Genuine Parts Company 90.7% Standard Motor Products Inc. 9.6% Standard Motor Products Inc. 10.1% Genuine Parts Company 7.9% Standard Motor Products Inc. 86.3% Genuine Parts Company 7.4% Genuine Parts Company 7.7% Motorparts 5.3% Dorman Products, Inc. 83.2%
Motorparts 4.3% Motorparts 3.5% Standard Motor Products Inc. NA Motorparts 43.3%
Note: No company used for comparative purposes is identical to Motorparts. Show n for informational purposes.
Note: Historical financials show n above do not reflect pro forma adjustments for Affinia and Honeyw ell acquisitions completed in May 2014 and July 2014, respectively. Per Company management, 2014 revenue and EBITDA w ould need to be adjusted by $65 million and $7 million, respectively, to reflect pro forma full-year impact of Affinia acquisition, and 2014 revenue and EBITDA w ould need to be adjusted by $238 million and ($7) million, respectively, to reflect pro forma full-year impact of Honeyw ell acquisition. Per Company management, Affinia w as expected to contribute annual revenue of $200 million and EBITDA of $20 million. Per Company management, at the time of the acquisition, Honeyw ell had annual revenue of $450 million w ith break-even EBITDA; how ever, Honeyw ell w as expected to be fully blended w ithin the Braking business and ultimately reach ~10% EBITDA margins (before corporate allocations).
1. Based on public trading prices of common stock.
2. Piston’s projected tax rate is 20.0%.
Adjusted EBITDA refers to Earnings Before Interest, Taxes, Depreciation & Amortization, adjusted for certain non-recurring items.
Adjusted EBITDAP refers to Earnings Before Interest, Taxes, Depreciation, Amortization and Pension (and OPEB) Expense, adjusted for certain non-recurring items. Adjusted FCF refers to Adjusted Free Cash Flow , w hich is represented as Adjusted EBITDA less Capital Expenditures.
E refers to Estimated.
LTM refers to the most recently completed 12-month period for w hich financial information has been made public. CY refers to calendar year.
NA refers to Not Available.
Source: Public filings, Capital IQ, Bloomberg, Company management. 35
CONFIDENTIAL—PRELIMINARY DRAFT—SUBJECT TO FURTHER REVIEW
|
|
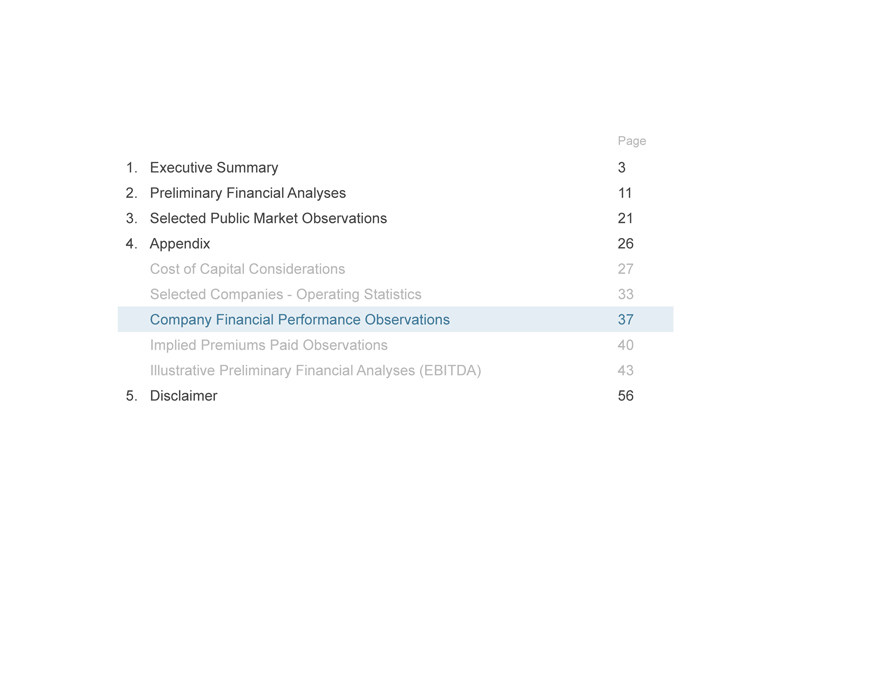
Page
1. Executive Summary 3
2. Preliminary Financial Analyses 11
3. Selected Public Market Observations 21
4. Appendix 26 Cost of Capital Considerations 27 Selected Companies—Operating Statistics 33 Company Financial Performance Observations 37 Implied Premiums Paid Observations 40 Illustrative Preliminary Financial Analyses (EBITDA) 43
5. Disclaimer 56
|
|
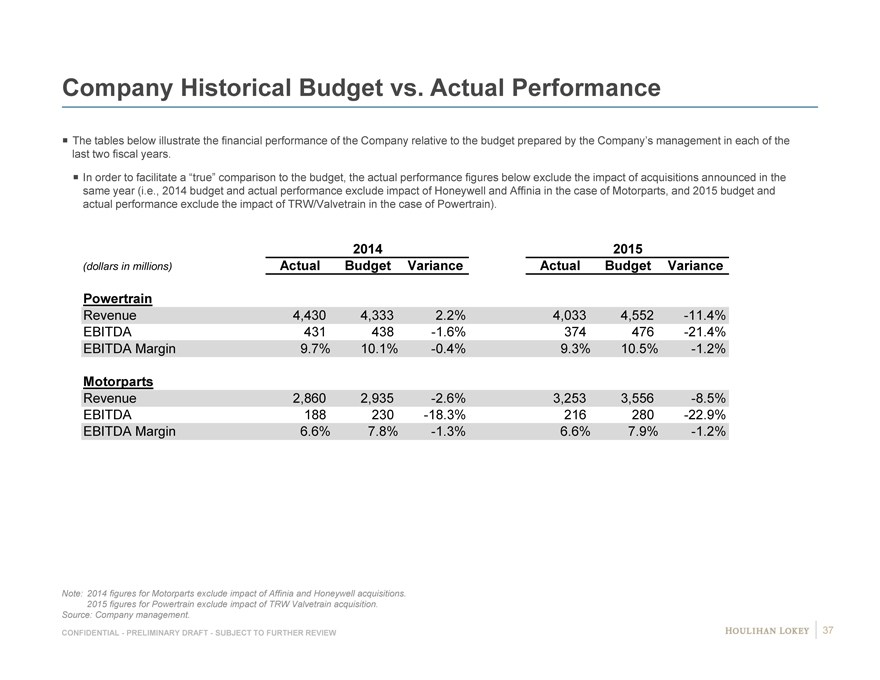
Company Historical Budget vs. Actual Performance
The tables below illustrate the financial performance of the Company relative to the budget prepared by the Company’s management in each of the last two fiscal years.
In order to facilitate a “true” comparison to the budget, the actual performance figures below exclude the impact of acquisitions announced in the same year (i.e., 2014 budget and actual performance exclude impact of Honeywell and Affinia in the case of Motorparts, and 2015 budget and actual performance exclude the impact of TRW/Valvetrain in the case of Powertrain).
2014 2015
(dollars in millions) Actual Budget Variance Actual Budget Variance
Powertrain
Revenue 4,430 4,333 2.2% 4,033 4,552 -11.4% EBITDA 431 438 -1.6% 374 476 -21.4% EBITDA Margin 9.7% 10.1% -0.4% 9.3% 10.5% -1.2%
Motorparts
Revenue 2,860 2,935 -2.6% 3,253 3,556 -8.5% EBITDA 188 230 -18.3% 216 280 -22.9% EBITDA Margin 6.6% 7.8% -1.3% 6.6% 7.9% -1.2%
Note: 2014 figures for Motorparts exclude impact of Affinia and Honeywell acquisitions. 2015 figures for Powertrain exclude impact of TRW Valvetrain acquisition. Source: Company management.
CONFIDENTIAL—PRELIMINARY DRAFT—SUBJECT TO FURTHER REVIEW 37
|
|
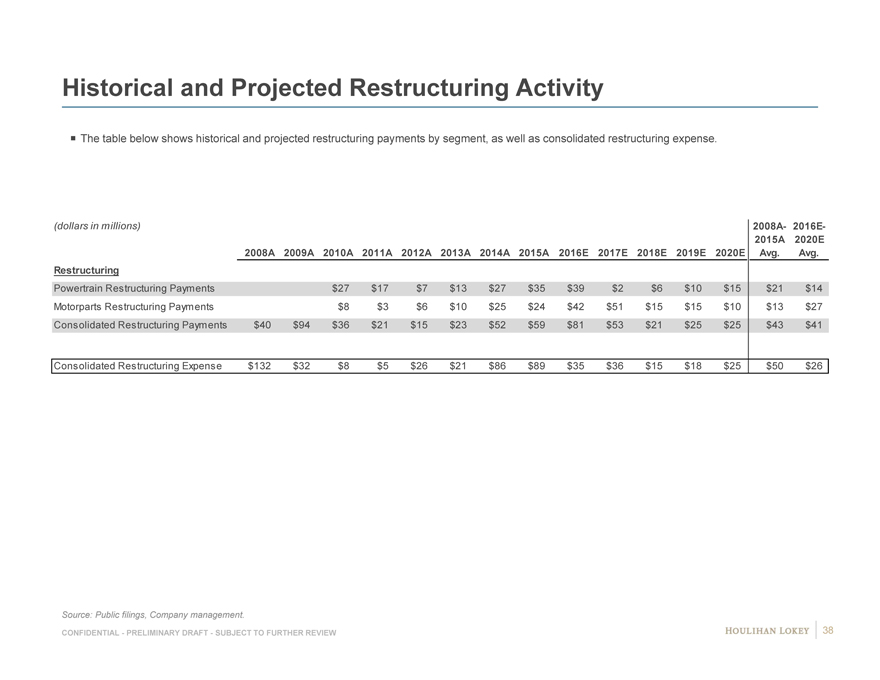
Historical and Projected Restructuring Activity
The table below shows historical and projected restructuring payments by segment, as well as consolidated restructuring expense.
(dollars in millions) 2008A- 2016E-2015A 2020E
2008A 2009A 2010A 2011A 2012A 2013A 2014A 2015A 2016E 2017E 2018E 2019E 2020E Avg. Avg. Restructuring
Powertrain Restructuring Payments $27 $17 $7 $13 $27 $35 $39 $2 $6 $10 $15 $21 $14 Motorparts Restructuring Payments $8 $3 $6 $10 $25 $24 $42 $51 $15 $15 $10 $13 $27 Consolidated Restructuring Payments $40 $94 $36 $21 $15 $23 $52 $59 $81 $53 $21 $25 $25 $43 $41
Consolidated Restructuring Expense $132 $32 $8 $5 $26 $21 $86 $89 $35 $36 $15 $18 $25 $50 $26
Source: Public filings, Company management.
CONFIDENTIAL—PRELIMINARY DRAFT—SUBJECT TO FURTHER REVIEW 38
|
|
Page
1. Executive Summary 3
2. Preliminary Financial Analyses 11
3. Selected Public Market Observations 21
4. Appendix 26 Cost of Capital Considerations 27 Selected Companies—Operating Statistics 33 Company Financial Performance Observations 37 Implied Premiums Paid Observations 40 Illustrative Preliminary Financial Analyses (EBITDA) 43
5. Disclaimer 56
|
|

Implied Premiums to Unaffected Stock Price
Implied Premiums to Unaffected Stock Price
Implied Premium over Illustrative Stock Price Revised IEP
Trading Period Closing Proposal Illustrative Stock Price
Prior to 2/29/2016 Stock Price $8.00 $7.00 $7.50 $8.50 $9.00 $9.50 $10.00
1-Day $4.98 60.6% 40.6% 50.6% 70.7% 80.7% 90.8% 100.8%
5-Day Average $4.46 79.5% 57.1% 68.3% 90.8% 102.0% 113.2% 124.4%
10-Day Average $4.35 84.0% 61.0% 72.5% 95.5% 107.0% 118.5% 130.0%
1-Month Average $4.30 85.9% 62.7% 74.3% 97.5% 109.1% 120.8% 132.4%
3-Month Average $5.60 42.8% 24.9% 33.8% 51.7% 60.6% 69.5% 78.5%
6-Month Average $6.80 17.6% 2.9% 10.2% 24.9% 32.3% 39.6% 47.0%
1-Year Average $9.37 (14.6%) (25.3%) (20.0%) (9.3%) (4.0%) 1.4% 6.7%
52-Week High—4/6/2015 $13.91 (42.5%) (49.7%) (46.1%) (38.9%) (35.3%) (31.7%) (28.1%)
52-Week Low—2/11/2016 $3.90 105.1% 79.5% 92.3% 117.9% 130.8% 143.6% 156.4%
Source: Capital IQ.
CONFIDENTIAL—PRELIMINARY DRAFT—SUBJECT TO FURTHER REVIEW 40
|
|
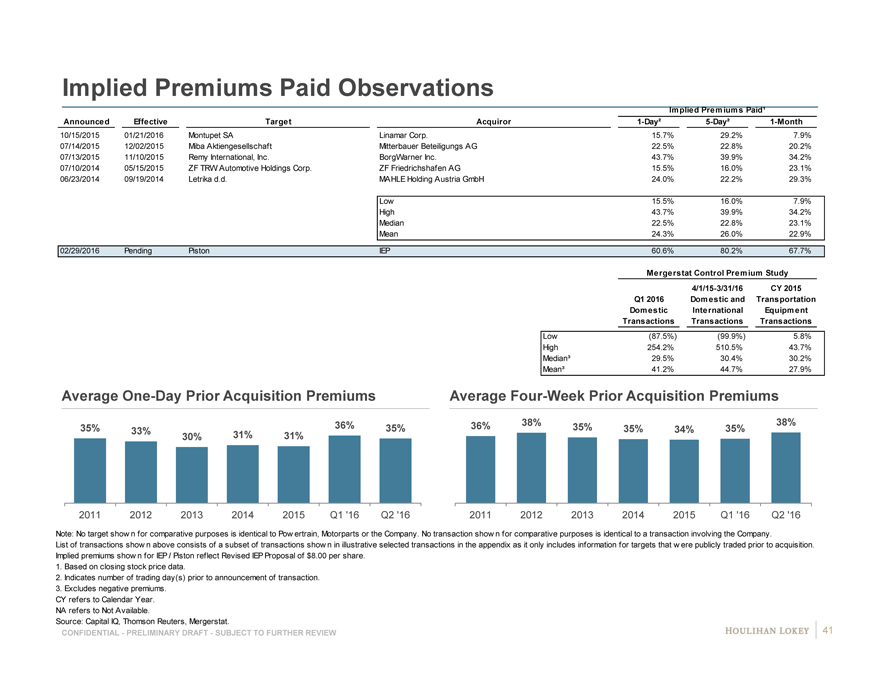
Implied Premiums Paid Observations
Implied Premiums Paid¹
Announced Effective Target Acquiror 1-Day² 5-Day² 1-Month
10/15/2015 01/21/2016 Montupet SA Linamar Corp. 15.7% # 29.2% # 7.9% # 07/14/2015 12/02/2015 Miba Aktiengesellschaft Mitterbauer Beteiligungs AG 22.5% # 22.8% # 20.2% # 07/13/2015 11/10/2015 Remy International, Inc. BorgWarner Inc. 43.7% # 39.9% # 34.2% # 07/10/2014 05/15/2015 ZF TRW Automotive Holdings Corp. ZF Friedrichshafen AG 15.5% # 16.0% # 23.1% # 06/23/2014 09/19/2014 Letrika d.d. MAHLE Holding Austria GmbH 24.0% # 22.2% # 29.3% #
Low 15.5% 16.0% 7.9% High 43.7% 39.9% 34.2% Median 22.5% 22.8% 23.1% Mean 24.3% 26.0% 22.9%
02/29/2016 Pending Piston IEP 60.6% 80.2% 67.7%
Mergerstat Control Premium Study 4/1/15-3/31/16 CY 2015 Q1 2016 Domestic and Transportation Domestic ic International al Equipment Transactions Transactions Transactions
Low (87.5%) # (99.9%) # 5.8% High 254.2% # 510.5% # 43.7% Median³ 29.5% # 30.4% # 30.2% Mean³ 41.2% # 44.7% # 27.9%
Average One-Day Prior Acquisition Premiums Average Four-Week Prior Acquisition Premiums
36% 36% 38% 38% 35% 33% 35% 35% 35% 34% 35% 30% 31% 31%
2011 2012 2013 2014 2015 Q1 ‘16 Q2 ‘16 2011 2012 2013 2014 2015 Q1 ‘16 Q2 ‘16
Note: No target show n for comparative purposes is identical to Pow ertrain, Motorparts or the Company. No transaction show n for comparative purposes is identical to a transaction involving the Company.
List of transactions show n above consists of a subset of transactions show n in illustrative selected transactions in the appendix as it only includes information for targets that w ere publicly traded prior to acquisition. Implied premiums show n for IEP / Piston reflect Revised IEP Proposal of $8.00 per share.
1. Based on closing stock price data.
2. Indicates number of trading day(s) prior to announcement of transaction.
3. Excludes negative premiums.
CY refers to Calendar Year. NA refers to Not Available.
Source: Capital IQ, Thomson Reuters, Mergerstat. 41
CONFIDENTIAL—PRELIMINARY DRAFT—SUBJECT TO FURTHER REVIEW
|
|
Page
1. Executive Summary 3
2. Preliminary Financial Analyses 11
3. Selected Public Market Observations 21
4. Appendix 26 Cost of Capital Considerations 27 Selected Companies—Operating Statistics 33 Company Financial Performance Observations 37 Implied Premiums Paid Observations 40 Illustrative Preliminary Financial Analyses (EBITDA) 43
5. Disclaimer 56
|
|
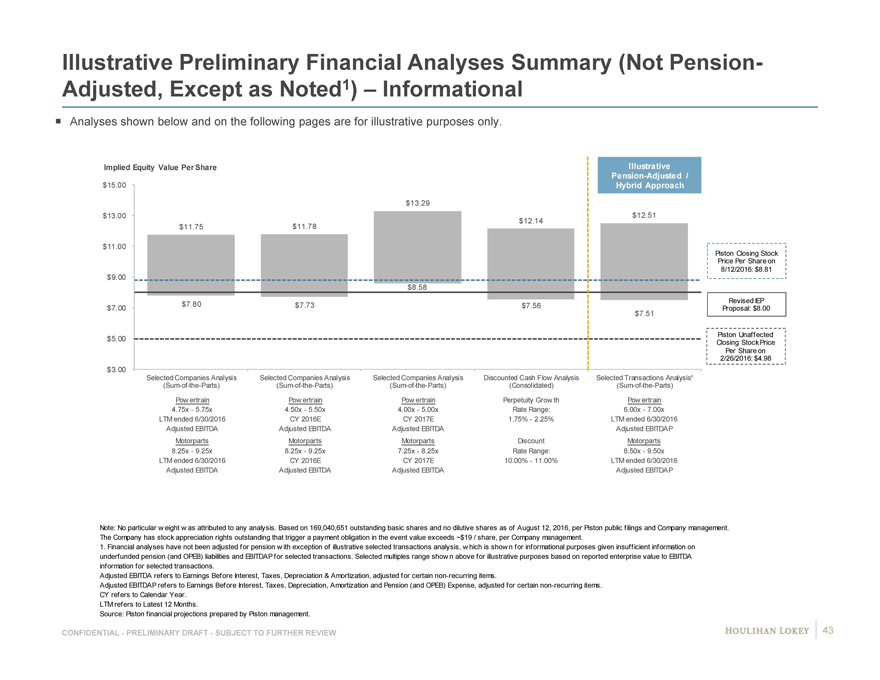
Illustrative Preliminary Financial Analyses Summary (Not Pension-Adjusted, Except as Noted1) – Informational
Analyses shown below and on the following pages are for illustrative purposes only.
Implied Equity Value Per Share Illustrative Pension-Adjusted / $15.00 Hybrid Approach
$13.29 $13.00 $12.51 $12.14 $11.75 $11.78
$11.00 Piston Closing Stock Price Per Share on 8/12/2016: $8.81 $9.00 $8.58 $7.80 Revised IEP $7.00 $7.73 $7.56 Proposal: $8.00 $7.51
Piston Unaffected $5.00
Closing Stock Price Per Share on 2/26/2016: $4.98 $3.00
Selected Companies Analysis Selected Companies Analysis Selected Companies Analysis Discounted Cash Flow Analysis Selected Transactions Analysis¹ (Sum-of-the-Parts) (Sum-of-the-Parts) (Sum-of-the-Parts) (Consolidated) (Sum-of-the-Parts)
Pow ertrain Pow ertrain Pow ertrain Perpetuity Grow th Pow ertrain 4.75x—5.75x 4.50x—5.50x 4.00x—5.00x Rate Range: 6.00x—7.00x LTM ended 6/30/2016 CY 2016E CY 2017E 1.75%—2.25% LTM ended 6/30/2016 Adjusted EBITDA Adjusted EBITDA Adjusted EBITDA Adjusted EBITDAP
Motorparts Motorparts Motorparts Discount Motorparts 8.25x—9.25x 8.25x—9.25x 7.25x—8.25x Rate Range: 8.50x—9.50x LTM ended 6/30/2016 CY 2016E CY 2017E 10.00%—11.00% LTM ended 6/30/2016 Adjusted EBITDA Adjusted EBITDA Adjusted EBITDA Adjusted EBITDAP
Note: No particular w eight w as attributed to any analysis. Based on 169,040,651 outstanding basic shares and no dilutive shares as of August 12, 2016, per Piston public filings and Company management. The Company has stock appreciation rights outstanding that trigger a payment obligation in the event value exceeds ~$19 / share, per Company management.
1. Financial analyses have not been adjusted for pension w ith exception of illustrative selected transactions analysis, w hich is show n for informational purposes given insufficient information on underfunded pension (and OPEB) liabilities and EBITDAP for selected transactions. Selected multiples range show n above for illustrative purposes based on reported enterprise value to EBITDA information for selected transactions.
Adjusted EBITDA refers to Earnings Before Interest, Taxes, Depreciation & Amortization, adjusted for certain non-recurring items.
Adjusted EBITDAP refers to Earnings Before Interest, Taxes, Depreciation, Amortization and Pension (and OPEB) Expense, adjusted for certain non-recurring items. CY refers to Calendar Year.
LTM refers to Latest 12 Months.
Source: Piston financial projections prepared by Piston management.
CONFIDENTIAL—PRELIMINARY DRAFT—SUBJECT TO FURTHER REVIEW 43
|
|

Illustrative Preliminary Financial Analyses Summary (Not Pension-Adjusted, Except as Noted) – Informational (cont.)
(shares outstanding and dollars in millions, except per share values) Illustrative Pension-Adjusted / Hybrid Approach Selected Selected Selected Discounted Selected Companies Companies Companies Cash Flow Transactions Analysis Analysis Analysis Analysis Analysis
LTM ended 6/30/2016 CY 2016E CY 2017E LTM ended 6/30/2016 Adjusted EBITDA Adjusted EBITDA Adjusted EBITDA Perpetuity Grow th Adjusted EBITDAP
Powertrain Discount Rate Range:
Corresponding Pow ertrain Base Amount $425 $434 $497 Perpetuity $478
Selected Multiple Range 4.75 x — 5.75 x 4.50 x — 5.50 x 4.00 x — 5.00 x Grow th Rate Range: 6.00 x — 7.00 x Implied Pow ertrain Enterprise Value from Operations Reference Range $2,020 — $2,445 $1,954 — $2,388 $1,989 — $2,486 1.75% — 2.25% $2,869 — $3,348
Motorparts Discount Rate Range:
Corresponding Motorparts Base Amount $243 $250 $299 10.00% — 11.00% $252
Selected Multiple Range 8.25 x — 9.25 x 8.25 x — 9.25 x 7.25 x — 8.25 x 8.50 x — 9.50 x Implied Motorparts Enterprise Value from Operations Reference Range $2,007 — $2,250 $2,061 — $2,311 $2,170 — $2,470 $2,144 — $2,397
Consolidated Enterprise Value from Operations Range
Corresponding Base Amount $669 $684 $798 $731 Implied Consolidated Multiple Range 6.0 x — 7.0 x 5.9 x — 6.9 x 5.2 x — 6.2 x 6.9 x — 7.9 x Consolidated Enterprise Value from Operations Reference Range¹ $4,027 — $4,695 $4,015 — $4,699 $4,159 — $4,956 $4,065 — $4,840 $5,014 — $5,744 Add: Cash and Cash Equivalents Attributable to the Company² $273 — $273 $273 — $273 $273 — $273 $273 — $273 $273 — $273 Add: Investments in Non-consolidated Affiliates (Cost Method)³ $8 — $8 $8 — $8 $8 — $8 $8 — $8 $8 — $8 Add: Real Estate Assets Held for Sale $45 — $45 $45 — $45 $45 — $45 $45 — $45 $45 — $45 Add: Value of NOLs and Tax Credits $79 — $79 $79 — $79 $79 — $79 $0 — $0 $79 — $79 Implied Total Enterprise Value Reference Range $4,432 — $5,101 $4,421 — $5,105 $4,565 — $5,361 $4,392 — $5,167 $5,419 — $6,150 Less: Debt Attributable to the Company $3,096 — $3,096 $3,096 — $3,096 $3,096 — $3,096 $3,096 — $3,096 $3,096 — $3,096 Less: Adjusted Underfunded Pension (and OPEB) Liability as of 6/30/2016 $0 — $0 $0 — $0 $0 — $0 $0 — $0 $1,036 — $921 Less: Net Environmental Liabilities $13 — $13 $13 — $13 $13 — $13 $13 — $13 $13 — $13 Less: Net Asset Retirement Obligations $5 — $5 $5 — $5 $5 — $5 $5 — $5 $5 — $5 Implied Total Equity Value Reference Range $1,318 — $1,987 $1,307 — $1,991 $1,451 — $2,247 $1,278 — $2,053 $1,269 — $2,115 Shares Outstanding10 169.0 — 169.0 169.0 — 169.0 169.0 — 169.0 169.0 — 169.0 169.0 — 169.0 Implied Per Share Equity Value Reference Range $7.80 — $11.75 $7.73 — $11.78 $8.58 — $13.29 $7.56 — $12.14 $7.51 — $12.51
Source: Piston financial projections prepared by Piston management. Refer to next page for additional notes.
CONFIDENTIAL—PRELIMINARY DRAFT—SUBJECT TO FURTHER REVIEW 44
|
|

Illustrative Preliminary Financial Analyses Summary (Not Pension-Adjusted, Except as Noted) – Informational (cont.)—Footnotes
1. Represents sum of implied enterprise value from operations reference ranges for Pow ertrain and Motorparts.
2. Reflects the Company’s cash balance of $290 million (including $95 million of offshore cash subject to repatriation tax as of December 31, 2015), net of $17 million of pro rata cash attributable to non-controlling interests as of June 30, 2016, per Company management. Assumes no cash from non-consolidated JVs attributable to the Company, per Company management.
3. Represents book value of investments in non-consolidated affiliates accounted for using cost method as of December 31, 2015 (no information available as of June 30, 2016), for w hich earnings are not captured in the Company’s adjusted EBITDA (given insufficient available information), per Company management. Does not include book value of investments in non-consolidated affiliates accounted for using equity method of approximately $258 million (as of June 30, 2016), for w hich earnings are captured in the Company’s adjusted EBITDA, per Company management.
4. Represents estimated value of non-core real estate assets held or available for sale, net of associated sales costs, environmental liabilities and asset retirement obligations, per the Company’s real estate brokers and Company management.
5. Based on $79 million of $1,059 million of asset value of Company NOLs and tax credits not offset by valuation allow ance as of June 30, 2016, per Company management. NOLs and tax credits are incorporated in discounted cash flow analysis through assumed 20.0% tax rate, per Company management. The Company also has a Tax Allocation Agreement (“TAA”) w ith American Entertainment Properties Corp. (“AEP”) pursuant to w hich the Company has contractual rights to 20% of economics of savings generated by AEP’s NOL usage. How ever, per Company management, no NOLs have been used by AEP since inception of the TAA in July 2013 and Company management is unaw are of AEP plans to utilize of NOLs going forw ard.
6. Reflects total debt outstanding of $3,109 million, net of $13 million of debt attributable to non-controlling interests as of June 30, 2016, per Company management. Assumes no debt from non-consolidated JVs attributable to the Company, per Company management.
7. Range reflects discount of 10% to 20% relative to the Company’s underfunded pension and post-retirement liabilities of $1,151 million as of June 30, 2016 based on, among other considerations, the follow ing factors, per Company management: (i) approximately 90% of the Company’s obligations reside in the U.S. and Germany, (ii) the Company is not a taxpayer in the U.S. and is not projected to generate income in the U.S. and (iii) the Company pays corporate taxes in Germany based on a corporate rate of 30%.
8. Reflects estimated cost of remediating hazardous substances at third-party sites pursuant to certain national, state and provincial environmental law s and is based on accruals per the Company’s Form 10-Q as of June 30, 2016 and Company management; does not include $44 million of “reasonably possible” exposure based on ongoing assessments, per Company management; figure net of environmental liabilities associated w ith real estate assets held for sale.
9. Reflects estimated remediation costs associated w ith removing hazardous building materials from the Company’s facilities, per Company management; figure net of asset retirement obligations associated w ith real estate assets held for sale.
10. Based on 169,040,651 outstanding basic shares and no dilutive shares as of August 12, 2016, per Piston public filings and Company management. The Company has stock appreciation rights outstanding that trigger a payment obligation in the event value exceeds ~$19 / share, per Company management.
Adjusted EBITDA refers to Earnings Before Interest, Taxes, Depreciation & Amortization, adjusted for certain non-recurring items.
Adjusted EBITDAP refers to Earnings Before Interest, Taxes, Depreciation, Amortization and Pension (and OPEB) Expense, adjusted for certain non-recurring items. E refers to Estimated.
CY refers to Calendar Year. LTM refers to Latest 12 Months.
Source: Piston financial projections prepared by Piston management.
CONFIDENTIAL—PRELIMINARY DRAFT—SUBJECT TO FURTHER REVIEW 45
|
|
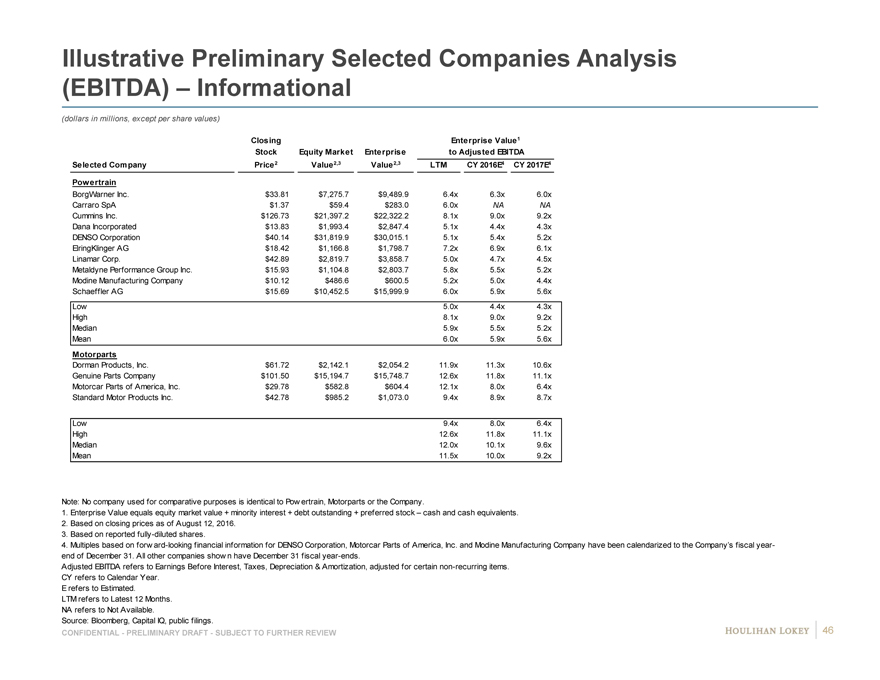
Illustrative Preliminary Selected Companies Analysis (EBITDA) – Informational
(dollars in millions, except per share values)
Closing Enterprise Value1 Stock Equity Market Enterprise to Adjusted EBITDA
Selected Company Price2 Value2,3 Value2,3 LTM CY 2016E4 CY 2017E4
Powertrain
BorgWarner Inc. $33.81 $7,275.7 $9,489.9 6.4x 6.3x 6.0x 6 9 Carraro SpA $1.37 $59.4 $283.0 6.0x NA NA N NA Cummins Inc. $126.73 $21,397.2 $22,322.2 8.1x 9.0x 9.2x 9 # Dana Incorporated $13.83 $1,993.4 $2,847.4 5.1x 4.4x 4.3x 4 8 DENSO Corporation $40.14 $31,819.9 $30,015.1 5.1x 5.4x 5.2x 5 # ElringKlinger AG $18.42 $1,166.8 $1,798.7 7.2x 6.9x 6.1x 6 # Linamar Corp. $42.89 $2,819.7 $3,858.7 5.0x 4.7x 4.5x 4 9 Metaldyne Performance Group Inc. $15.93 $1,104.8 $2,803.7 5.8x 5.5x 5.2x 5 9 Modine Manufacturing Company $10.12 $486.6 $600.5 5.2x 5.0x 4.4x 4 9 Schaeffler AG $15.69 $10,452.5 $15,999.9 6.0x 5.9x 5.6x 6 # Low 5.0x 4.4x 4.3x High 8.1x 9.0x 9.2x Median 5.9x 5.5x 5.2x Mean 6.0x 5.9x 5.6x
Motorparts
Dorman Products, Inc. $61.72 $2,142.1 $2,054.2 11.9x 11.3x 10.6x # # Genuine Parts Company $101.50 $15,194.7 $15,748.7 12.6x 11.8x 11.1x # # Motorcar Parts of America, Inc. $29.78 $582.8 $604.4 12.1x 8.0x 6.4x 6 7 Standard Motor Products Inc. $42.78 $985.2 $1,073.0 9.4x 8.9x 8.7x 9 NA
Low 9.4x 8.0x 6.4x High 12.6x 11.8x 11.1x Median 12.0x 10.1x 9.6x Mean 11.5x 10.0x 9.2x
Note: No company used for comparative purposes is identical to Pow ertrain, Motorparts or the Company.
1. Enterprise Value equals equity market value + minority interest + debt outstanding + preferred stock – cash and cash equivalents.
2. Based on closing prices as of August 12, 2016.
3. Based on reported fully-diluted shares.
4. Multiples based on forw ard-looking financial information for DENSO Corporation, Motorcar Parts of America, Inc. and Modine Manufacturing Company have been calendarized to the Company’s fiscal year-end of December 31. All other companies show n have December 31 fiscal year-ends.
Adjusted EBITDA refers to Earnings Before Interest, Taxes, Depreciation & Amortization, adjusted for certain non-recurring items. CY refers to Calendar Year.
E refers to Estimated.
LTM refers to Latest 12 Months. NA refers to Not Available.
Source: Bloomberg, Capital IQ, public filings.
CONFIDENTIAL—PRELIMINARY DRAFT—SUBJECT TO FURTHER REVIEW 46
|
|
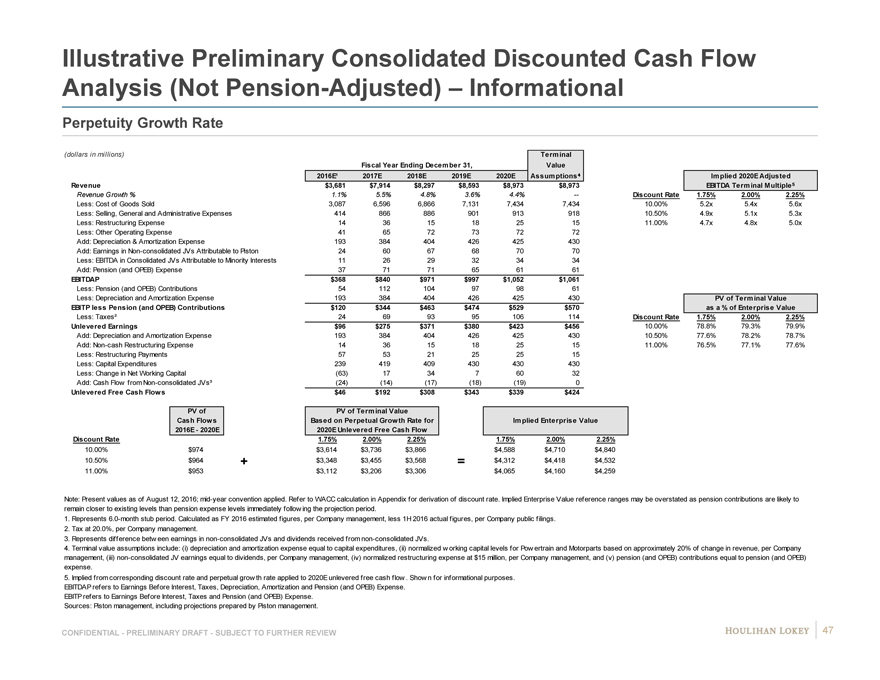
Illustrative Preliminary Consolidated Discounted Cash Flow Analysis (Not Pension-Adjusted) – Informational
Perpetuity Growth Rate
(dollars in millions) Terminal Fiscal Year Ending December 31, Value
2016E¹ 2017E 2018E 2019E 2020E Assumptions Implied 2020E Adjusted Revenue $3,681 $7,914 $8,297 $8,593 $8,973 $8,973 EBITDA Terminal Multiple
Revenue Growth % 1.1% 5.5% 4.8% 3.6% 4.4% — Discount Rate 1.75% 2.00% 2.25%
Less: Cost of Goods Sold 3,087 6,596 6,866 7,131 7,434 7,434 10.00% 5.2x 5.4x 5.6x Less: Selling, General and Administrative Expenses 414 866 886 901 913 918 10.50% 4.9x 5.1x 5.3x Less: Restructuring Expense 14 36 15 18 25 15 11.00% 4.7x 4.8x 5.0x Less: Other Operating Expense 41 65 72 73 72 72 Add: Depreciation & Amortization Expense 193 384 404 426 425 430 Add: Earnings in Non-consolidated JVs Attributable to Piston 24 60 67 68 70 70 Less: EBITDA in Consolidated JVs Attributable to Minority Interests 11 26 29 32 34 34 Add: Pension (and OPEB) Expense 37 71 71 65 61 61
EBITDAP $368 $840 $971 $997 $1,052 $1,061
Less: Pension (and OPEB) Contributions 54 112 104 97 98 61
Less: Depreciation and Amortization Expense 193 384 404 426 425 430 PV of Terminal Value EBITP less Pension (and OPEB) Contributions $120 $344 $463 $474 $529 $570 as a % of Enterprise Value Less: Taxes² 24 69 93 95 106 114 Discount Rate 1.75% 2.00% 2.25% Unlevered Earnings $96 $275 $371 $380 $423 $456 10.00% 78.8% 79.3% 79.9% Add: Depreciation and Amortization Expense 193 384 404 426 425 430 10.50% 77.6% 78.2% 78.7% Add: Non-cash Restructuring Expense 14 36 15 18 25 15 11.00% 76.5% 77.1% 77.6% Less: Restructuring Payments 57 53 21 25 25 15 Less: Capital Expenditures 239 419 409 430 430 430 Less: Change in Net Working Capital (63) 17 34 7 60 32 Add: Cash Flow from Non-consolidated JVs³ (24) (14) (17) (18) (19) 0
Unlevered Free Cash Flows $46 $192 $308 $343 $339 $424
PV of PV of Terminal Value
Cash Flows Based on Perpetual Growth Rate for Implied Enterprise Value 2016E—2020E 2020E Unlevered Free Cash Flow Discount Rate 1.75% 2.00% 2.25% 1.75% 2.00% 2.25%
10.00% 0.100 $974 $3,614 $3,736 $3,866 $4,588 $4,710 $4,840 10.50% 0.105 $964 + $3,348 $3,455 $3,568 = $4,312 $4,418 $4,532 11.00% 0.110 $953 $3,112 $3,206 $3,306 $4,065 $4,160 $4,259
Note: Present values as of August 12, 2016; mid-year convention applied. Refer to WACC calculation in Appendix for derivation of discount rate. Implied Enterprise Value reference ranges may be overstated as pension contributions are likely to remain closer to existing levels than pension expense levels immediately follow ing the projection period.
1. Represents 6.0-month stub period. Calculated as FY 2016 estimated figures, per Company management, less 1H 2016 actual figures, per Company public filings.
2. Tax at 20.0%, per Company management.
3. Represents difference betw een earnings in non-consolidated JVs and dividends received from non-consolidated JVs.
4. Terminal value assumptions include: (i) depreciation and amortization expense equal to capital expenditures, (ii) normalized w orking capital levels for Pow ertrain and Motorparts based on approximately 20% of change in revenue, per Company management, (iii) non-consolidated JV earnings equal to dividends, per Company management, (iv) normalized restructuring expense at $15 million, per Company management, and (v) pension (and OPEB) contributions equal to pension (and OPEB) expense.
5. Implied from corresponding discount rate and perpetual grow th rate applied to 2020E unlevered free cash flow . Show n for informational purposes.
EBITDAP refers to Earnings Before Interest, Taxes, Depreciation, Amortization and Pension (and OPEB) Expense. EBITP refers to Earnings Before Interest, Taxes and Pension (and OPEB) Expense.
Sources: Piston management, including projections prepared by Piston management.
CONFIDENTIAL—PRELIMINARY DRAFT—SUBJECT TO FURTHER REVIEW 47
|
|
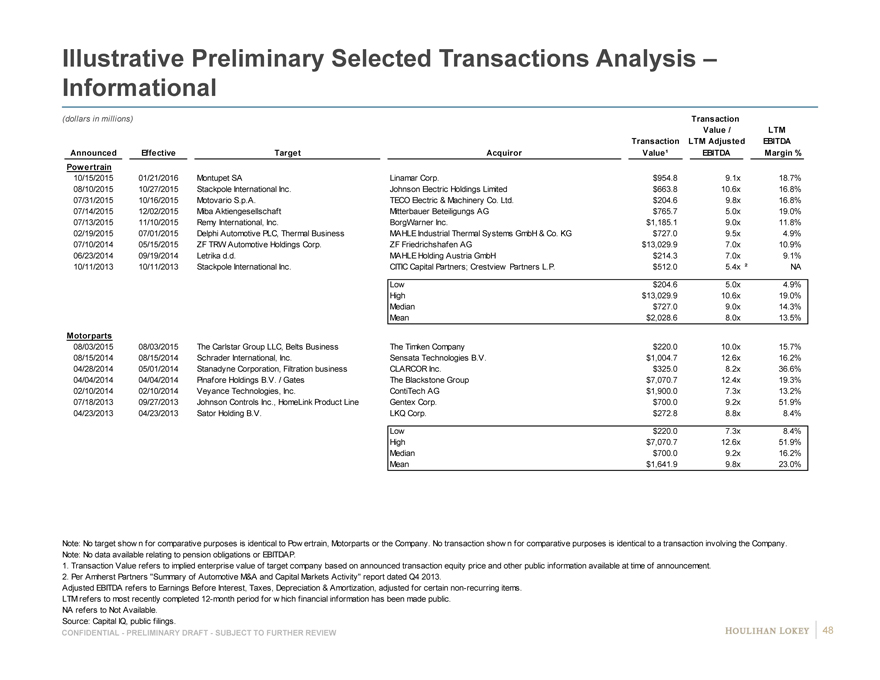
Illustrative Preliminary Selected Transactions Analysis –Informational
(dollars in millions) Transaction
Value / LTM Transaction LTM Adjusted EBITDA
Announced Effective Target Acquiror Value¹ EBITDA Margin % Powertrain
10/15/2015 01/21/2016 Montupet SA Linamar Corp. $954.8 9.1x 18.7% 08/10/2015 10/27/2015 Stackpole International Inc. Johnson Electric Holdings Limited $663.8 10.6x 16.8% 07/31/2015 10/16/2015 Motovario S.p.A. TECO Electric & Machinery Co. Ltd. $204.6 9.8x 16.8% 07/14/2015 12/02/2015 Miba Aktiengesellschaft Mitterbauer Beteiligungs AG $765.7 5.0x 19.0% 07/13/2015 11/10/2015 Remy International, Inc. BorgWarner Inc. $1,185.1 9.0x 11.8% 02/19/2015 07/01/2015 Delphi Automotive PLC, Thermal Business MAHLE Industrial Thermal Systems GmbH & Co. KG $727.0 9.5x 4.9% 07/10/2014 05/15/2015 ZF TRW Automotive Holdings Corp. ZF Friedrichshafen AG $13,029.9 7.0x 10.9% 06/23/2014 09/19/2014 Letrika d.d. MAHLE Holding Austria GmbH $214.3 7.0x 9.1% 10/11/2013 10/11/2013 Stackpole International Inc. CITIC Capital Partners; Crestview Partners L.P. $512.0 5.4x ² NA N
Low $204.6 5.0x 4.9% High $13,029.9 10.6x 19.0% Median $727.0 9.0x 14.3% Mean $2,028.6 8.0x 13.5%
Motorparts
08/03/2015 08/03/2015 The Carlstar Group LLC, Belts Business The Timken Company $220.0 10.0x 15.7% 08/15/2014 08/15/2014 Schrader International, Inc. Sensata Technologies B.V. $1,004.7 12.6x 16.2% 04/28/2014 05/01/2014 Stanadyne Corporation, Filtration business CLARCOR Inc. $325.0 8.2x 36.6% 04/04/2014 04/04/2014 Pinafore Holdings B.V. / Gates The Blackstone Group $7,070.7 12.4x 19.3% 02/10/2014 02/10/2014 Veyance Technologies, Inc. ContiTech AG $1,900.0 7.3x 13.2% 07/18/2013 09/27/2013 Johnson Controls Inc., HomeLink Product Line Gentex Corp. $700.0 9.2x 51.9% 04/23/2013 04/23/2013 Sator Holding B.V. LKQ Corp. $272.8 8.8x 8.4%
Low $220.0 7.3x 8.4% High $7,070.7 12.6x 51.9% Median $700.0 9.2x 16.2% Mean $1,641.9 9.8x 23.0%
Note: No target show n for comparative purposes is identical to Pow ertrain, Motorparts or the Company. No transaction show n for comparative purposes is identical to a transaction involving the Company. Note: No data available relating to pension obligations or EBITDAP.
1. Transaction Value refers to implied enterprise value of target company based on announced transaction equity price and other public information available at time of announcement.
2. Per Amherst Partners “Summary of Automotive M&A and Capital Markets Activity” report dated Q4 2013.
Adjusted EBITDA refers to Earnings Before Interest, Taxes, Depreciation & Amortization, adjusted for certain non-recurring items. LTM refers to most recently completed 12-month period for w hich financial information has been made public.
NA refers to Not Available. Source: Capital IQ, public filings.
CONFIDENTIAL—PRELIMINARY DRAFT—SUBJECT TO FURTHER REVIEW 48
|
|
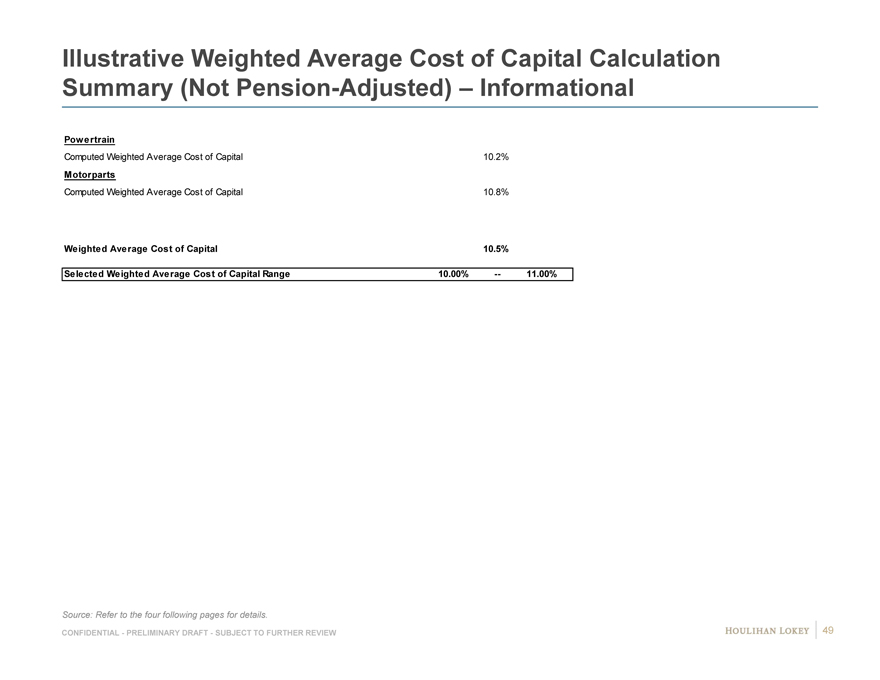
Illustrative Weighted Average Cost of Capital Calculation Summary (Not Pension-Adjusted) – Informational
Powertrain
Computed Weighted Average Cost of Capital 10.2%
Motorparts
Computed Weighted Average Cost of Capital 10.8%
Weighted Average Cost of Capital 10.5%
Selected Weighted Average Cost of Capital Range 10.00% — 11.00%
Source: Refer to the four following pages for details.
CONFIDENTIAL—PRELIMINARY DRAFT—SUBJECT TO FURTHER REVIEW 49
|
|
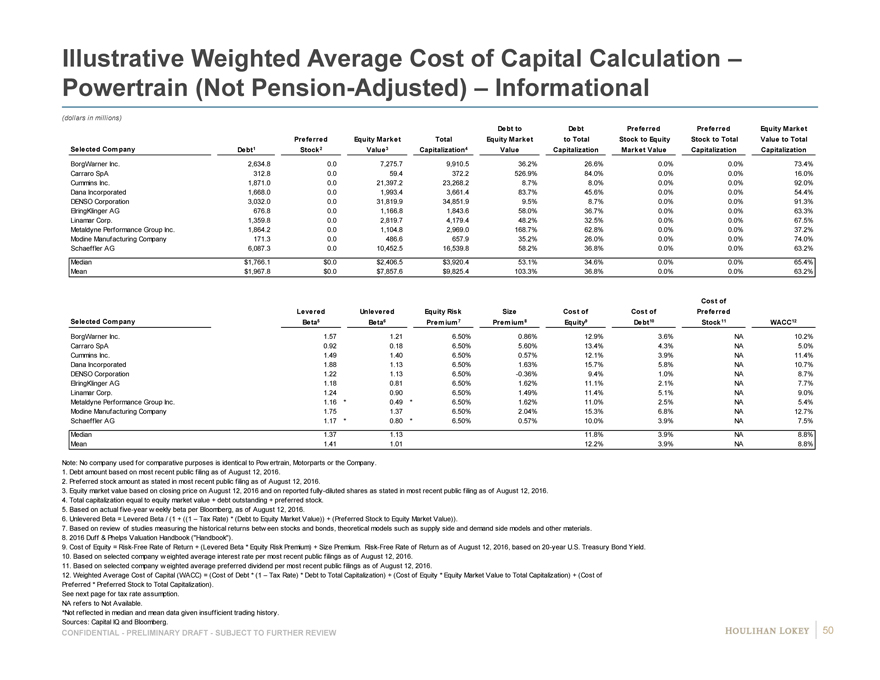
Illustrative Weighted Average Cost of Capital Calculation –Powertrain (Not Pension-Adjusted) – Informational
(dollars in millions)
Debt to Debt Preferred Preferred Equity Market Preferred Equity Market Total Equity Market to Total Stock to Equity Stock to Total Value to Total Selected Company Debt1 Stock2 Value3 Capitalization4 Value Capitalization Market Value Capitalization Capitalization
BorgWarner Inc. 2,634.8 # 0.0 # 7,275.7 # 9,910.5 # 36.2% # 26.6% # 0.0% # 0.0% # 73.4% # Carraro SpA 312.8 # 0.0 # 59.4 # 372.2 # 526.9% # 84.0% # 0.0% # 0.0% # 16.0% # Cummins Inc. 1,871.0 # 0.0 # 21,397.2 # 23,268.2 # 8.7% # 8.0% # 0.0% # 0.0% # 92.0% # Dana Incorporated 1,668.0 # 0.0 # 1,993.4 # 3,661.4 # 83.7% # 45.6% # 0.0% # 0.0% # 54.4% # DENSO Corporation 3,032.0 # 0.0 # 31,819.9 # 34,851.9 # 9.5% # 8.7% # 0.0% # 0.0% # 91.3% # ElringKlinger AG 676.8 # 0.0 # 1,166.8 # 1,843.6 # 58.0% # 36.7% # 0.0% # 0.0% # 63.3% # Linamar Corp. 1,359.8 # 0.0 # 2,819.7 # 4,179.4 # 48.2% # 32.5% # 0.0% # 0.0% # 67.5% # Metaldyne Performance Group Inc. 1,864.2 # 0.0 # 1,104.8 # 2,969.0 # 168.7% # 62.8% # 0.0% # 0.0% # 37.2% # Modine Manufacturing Company 171.3 # 0.0 # 486.6 # 657.9 # 35.2% # 26.0% # 0.0% # 0.0% # 74.0% # Schaeffler AG 6,087.3 # 0.0 # 10,452.5 # 16,539.8 # 58.2% # 36.8% # 0.0% # 0.0% # 63.2% # Median $1,766.1 $0.0 $2,406.5 $3,920.4 53.1% 34.6% 0.0% 0.0% 65.4% Mean $1,967.8 $0.0 $7,857.6 $9,825.4 103.3% 36.8% 0.0% 0.0% 63.2%
Cost of Levered Unlevered Equity Risk Size Cost of Cost of Preferred
Selected Company Beta5 Beta6 Premium7 Premium8 Equity9 Debt10 Stock11 WACC12
BorgWarner Inc. 1.57 # 1.21 # 6.50% 0.86% 12.9% # 3.6% # NA # 10.2% 0 Carraro SpA 0.92 # 0.18 # 6.50% 5.60% 13.4% # 4.3% # NA # 5.0% 0 Cummins Inc. 1.49 # 1.40 # 6.50% 0.57% 12.1% # 3.9% # NA # 11.4% 0 Dana Incorporated 1.88 # 1.13 # 6.50% 1.63% 15.7% # 5.8% # NA # 10.7% 0 DENSO Corporation 1.22 # 1.13 # 6.50% -0.36% 9.4% # 1.0% # NA # 8.7% 0 ElringKlinger AG 1.18 # 0.81 # 6.50% 1.62% 11.1% # 2.1% # NA # 7.7% 0 Linamar Corp. 1.24 # 0.90 # 6.50% 1.49% 11.4% # 5.1% # NA # 9.0% 0 Metaldyne Performance Group Inc. 1.16 * 0.49 * 6.50% 1.62% 11.0% # 2.5% # NA # 5.4% 0 Modine Manufacturing Company 1.75 # 1.37 # 6.50% 2.04% 15.3% # 6.8% # NA # 12.7% 0 Schaeffler AG 1.17 * 0.80 * 6.50% 0.57% 10.0% # 3.9% # NA # 7.5% 0 Median 1.37 1.13 11.8% 3.9% NA 8.8% Mean 1.41 1.01 12.2% 3.9% NA 8.8%
Note: No company used for comparative purposes is identical to Pow ertrain, Motorparts or the Company.
1. Debt amount based on most recent public filing as of August 12, 2016.
2. Preferred stock amount as stated in most recent public filing as of August 12, 2016.
3. Equity market value based on closing price on August 12, 2016 and on reported fully-diluted shares as stated in most recent public filing as of August 12, 2016.
4. Total capitalization equal to equity market value + debt outstanding + preferred stock.
5. Based on actual five-year w eekly beta per Bloomberg, as of August 12, 2016.
6. Unlevered Beta = Levered Beta / (1 + ((1 – Tax Rate) * (Debt to Equity Market Value)) + (Preferred Stock to Equity Market Value)).
7. Based on review of studies measuring the historical returns betw een stocks and bonds, theoretical models such as supply side and demand side models and other materials.
8. 2016 Duff & Phelps Valuation Handbook (“Handbook”).
9. Cost of Equity = Risk-Free Rate of Return + (Levered Beta * Equity Risk Premium) + Size Premium. Risk-Free Rate of Return as of August 12, 2016, based on 20-year U.S. Treasury Bond Yield.
10. Based on selected company w eighted average interest rate per most recent public filings as of August 12, 2016. 11. Based on selected company w eighted average preferred dividend per most recent public filings as of August 12, 2016.
12. Weighted Average Cost of Capital (WACC) = (Cost of Debt * (1 – Tax Rate) * Debt to Total Capitalization) + (Cost of Equity * Equity Market Value to Total Capitalization) + (Cost of Preferred * Preferred Stock to Total Capitalization).
See next page for tax rate assumption. NA refers to Not Available.
*Not reflected in median and mean data given insufficient trading history.
Sources: Capital IQ and Bloomberg. 50
CONFIDENTIAL—PRELIMINARY DRAFT—SUBJECT TO FURTHER REVIEW
|
|

Illustrative Weighted Average Cost of Capital Calculation –Powertrain (Not Pension-Adjusted) – Informational (cont.)
Market Assumptions Capital Structure Assumptions Cost of Equity for Computed WACC
Risk-Free Rate of Return¹ 1.85% Debt to Total Capitalization 34.6% Selected Unlevered Beta 1.13 Equity Risk Premium² 6.50% Preferred Stock to Total Capitalization 0.0% Computed Levered Beta 1.61 Size Premium³ 1.63% Equity Market Value to Total Capitalization 65.4% Cost of Equity 13.9% Tax Rate 20.00% Debt to Equity Market Value 53.0% Preferred Stock to Equity Market Value 0.0% Cost of Debt 3.9% Cost of Preferred Stock NA
Computed Weighted Average Cost of Capital 10.2%
1. Risk-Free Rate of Return as of August 12, 2016, based on 20-year U.S. Treasury Bond Yield.
2. Based on review of studies measuring historical returns betw een stocks and bonds, theoretical models such as supply side and demand side models and other materials.
3. Handbook.
4. Per Company management.
5. Based on review of corresponding metrics of selected companies listed on previous page.
6. Based on review of selected companies’ unlevered betas listed on previous page.
7. Computed Levered Beta = Selected Unlevered Beta * (1 + ((Debt to Equity Market Value) * (1 – Tax Rate)) + (Preferred Stock to Equity Market Value)). Based on Market and Capital Structure Assumptions.
8. Cost of Equity = Risk-Free Rate of Return + (Computed Levered Beta * Equity Risk Premium) + Size Premium. Based on Market Assumptions.
9. Weighted Average Cost of Capital (WACC) = (Cost of Debt * (1 – Tax Rate) * Debt to Total Capitalization) + (Cost of Equity * Equity Market Value to Total Capitalization) + (Cost of Preferred Stock * Preferred Stock to Total Capitalization). Based on “Cost of Equity for Computed WACC” and Market and Capital Structure Assumptions.
NA refers to Not Available. Source: Capital IQ and Bloomberg.
CONFIDENTIAL—PRELIMINARY DRAFT—SUBJECT TO FURTHER REVIEW 51
|
|

Illustrative Weighted Average Cost of Capital Calculation –Motorparts (Not Pension-Adjusted) – Informational
(dollars in millions)
Debt to Debt Preferred Preferred Equity Market Preferred Equity Market Total Equity Market to Total Stock to Equity Stock to Total Value to Total Selected Company Debt1 Stock2 Value3 Capitalization4 Value Capitalization Market Value Capitalization Capitalization
Dorman Products, Inc. $0.0 # $0.0 # $2,142.1 # $2,142.1 # 0.0% # 0.0% # 0.0% # 0.0% # 100.0% # Genuine Parts Company 775.0 # 0.0 # 15,194.7 # 15,969.7 # 5.1% # 4.9% # 0.0% # 0.0% # 95.1% # Motorcar Parts of America, Inc. 43.3 # 0.0 # 582.8 # 626.1 # 7.4% # 6.9% # 0.0% # 0.0% # 93.1% # Standard Motor Products Inc. 100.2 # 0.0 # 985.2 # 1,085.4 # 10.2% # 9.2% # 0.0% # 0.0% # 90.8% # Median $71.7 $0.0 $1,563.6 $1,613.7 6.3% 5.9% 0.0% 0.0% 94.1% Mean $229.6 $0.0 $4,726.2 $4,955.8 5.7% 5.2% 0.0% 0.0% 94.8%
Cost of Levered Unlevered Equity Risk Size Cost of Cost of Preferred
Selected Company Beta5 Beta6 Premium7 Premium8 Equity9 Debt10 Stock11 WACC12
Dorman Products, Inc. 1.21 # 1.21 # 6.50% 1.49% 11.2% # NA * NA # 11.2% 0 Genuine Parts Company 1.02 # 0.98 # 6.50% 0.57% 9.0% # 2.8% # NA # 8.7% 0 Motorcar Parts of America, Inc. 1.16 # 1.10 # 6.50% 2.04% 11.4% # 3.1% # NA # 10.8% 0 Standard Motor Products Inc. 1.45 # 1.34 # 6.50% 1.62% 12.9% # 2.3% # NA # 11.9% 0 Median 1.19 1.15 11.3% 2.8% NA 11.0% Mean 1.21 1.16 11.2% 2.7% NA 10.7%
Note: No company used for comparative purposes is identical to Pow ertrain, Motorparts or the Company.
1. Debt amount based on most recent public filing as of August 12, 2016.
2. Preferred stock amount as stated in most recent public filing as of August 12, 2016.
3. Equity market value based on closing price on August 12, 2016 and on reported fully-diluted shares as stated in most recent public filing as of August 12, 2016.
4. Total capitalization equal to equity market value + debt outstanding + preferred stock.
5. Based on actual five-year w eekly beta per Bloomberg, as of August 12, 2016.
6. Unlevered Beta = Levered Beta / (1 + ((1 – Tax Rate) * (Debt to Equity Market Value)) + (Preferred Stock to Equity Market Value)).
7. Based on review of studies measuring the historical returns betw een stocks and bonds, theoretical models such as supply side and demand side models and other materials.
8. 2016 Duff & Phelps Valuation Handbook (“Handbook”).
9. Cost of Equity = Risk-Free Rate of Return + (Levered Beta * Equity Risk Premium) + Size Premium. Risk-Free Rate of Return as of August 12, 2016, based on 20-year U.S. Treasury Bond Yield.
10. Based on selected company w eighted average interest rate per most recent public filings as of August 12, 2016. 11. Based on selected company w eighted average preferred dividend per most recent public filings as of August 12, 2016.
12. Weighted Average Cost of Capital (WACC) = (Cost of Debt * (1 – Tax Rate) * Debt to Total Capitalization) + (Cost of Equity * Equity Market Value to Total Capitalization)
+ (Cost of Preferred * Preferred Stock to Total Capitalization).
See next page for tax rate assumption. NA refers to Not Available.
*Not reflected in median and mean data given insufficient trading history. Sources: Capital IQ and Bloomberg.
CONFIDENTIAL—PRELIMINARY DRAFT—SUBJECT TO FURTHER REVIEW 52
|
|
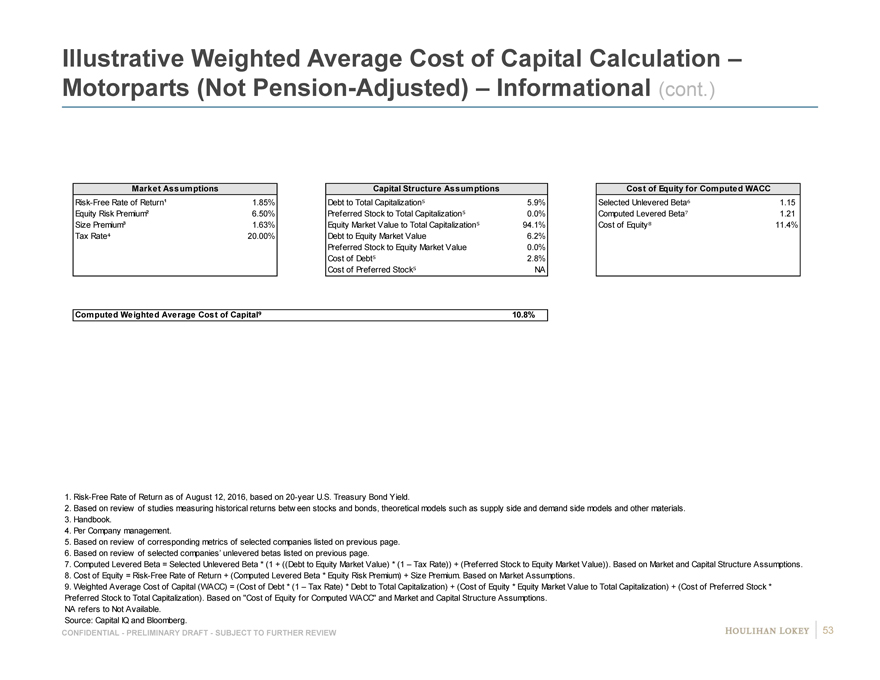
Illustrative Weighted Average Cost of Capital Calculation –Motorparts (Not Pension-Adjusted) – Informational (cont.)
Market Assumptions Capital Structure Assumptions Cost of Equity for Computed WACC
Risk-Free Rate of Return¹ 1.85% Debt to Total Capitalization 5.9% Selected Unlevered Beta 1.15 Equity Risk Premium² 6.50% Preferred Stock to Total Capitalization 0.0% Computed Levered Beta 1.21 Size Premium³ 1.63% Equity Market Value to Total Capitalization 94.1% Cost of Equity 11.4% Tax Rate 20.00% Debt to Equity Market Value 6.2% Preferred Stock to Equity Market Value 0.0% Cost of Debt 2.8% Cost of Preferred Stock NA
Computed Weighted Average Cost of Capital 10.8%
1. Risk-Free Rate of Return as of August 12, 2016, based on 20-year U.S. Treasury Bond Yield.
2. Based on review of studies measuring historical returns betw een stocks and bonds, theoretical models such as supply side and demand side models and other materials.
3. Handbook.
4. Per Company management.
5. Based on review of corresponding metrics of selected companies listed on previous page.
6. Based on review of selected companies’ unlevered betas listed on previous page.
7. Computed Levered Beta = Selected Unlevered Beta * (1 + ((Debt to Equity Market Value) * (1 – Tax Rate)) + (Preferred Stock to Equity Market Value)). Based on Market and Capital Structure Assumptions.
8. Cost of Equity = Risk-Free Rate of Return + (Computed Levered Beta * Equity Risk Premium) + Size Premium. Based on Market Assumptions.
9. Weighted Average Cost of Capital (WACC) = (Cost of Debt * (1 – Tax Rate) * Debt to Total Capitalization) + (Cost of Equity * Equity Market Value to Total Capitalization) + (Cost of Preferred Stock * Preferred Stock to Total Capitalization). Based on “Cost of Equity for Computed WACC” and Market and Capital Structure Assumptions.
NA refers to Not Available. Source: Capital IQ and Bloomberg.
CONFIDENTIAL—PRELIMINARY DRAFT—SUBJECT TO FURTHER REVIEW 53
|
|
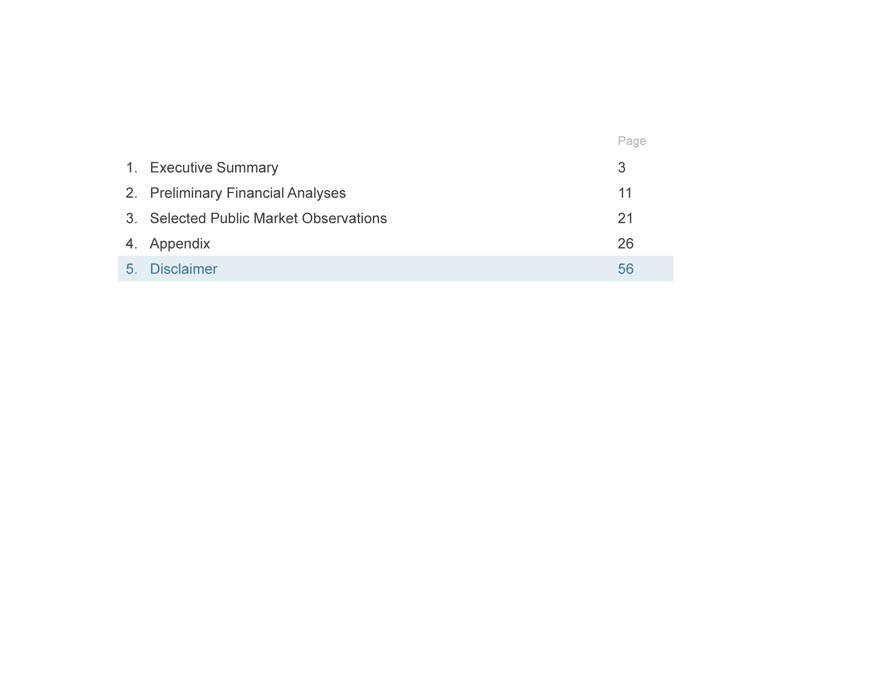
Page
1. Executive Summary 3
2. Preliminary Financial Analyses 11
3. Selected Public Market Observations 21
4. Appendix 26
5. Disclaimer 56
|
|

Disclaimer
This presentation, and any supplemental information (written or oral) or other documents provided in connection therewith (collectively, the “materials”), are provided solely for the information of the Special Committee (the “Committee”) of the Board of Directors (the “Board”) of Federal-Mogul Holdings Corporation (“Piston” or the “Company”) by Houlihan Lokey in connection with the Committee’s consideration of a potential transaction (the “Transaction”) involving the Company. This presentation is incomplete without reference to, and should be considered in conjunction with, any supplemental information provided by and discussions with Houlihan Lokey in connection therewith. Any defined terms used herein shall have the meanings set forth herein, even if such defined terms have been given different meanings elsewhere in the materials.
The materials are for discussion purposes only. Houlihan Lokey expressly disclaims any and all liability which may be based on the materials and any errors therein or omissions therefrom. The materials were prepared for specific persons familiar with the business and affairs of the Company for use in a specific context and were not prepared with a view to public disclosure or to conform with any disclosure standards under any state, federal or international securities laws or other laws, rules or regulations, and none of the Committee, the Company or Houlihan Lokey takes any responsibility for the use of the materials by persons other than the Committee. The materials are provided on a confidential basis solely for the information of the Committee and may not be disclosed, summarized, reproduced, disseminated or quoted or otherwise referred to, in whole or in part, without Houlihan Lokey’s express prior written consent.
Notwithstanding any other provision herein, the Company (and each employee, representative or other agent of the Company) may disclose to any and all persons without limitation of any kind, the tax treatment and tax structure of any transaction and all materials of any kind (including opinions or other tax analyses, if any) that are provided to the Company relating to such tax treatment and structure. However, any information relating to the tax treatment and tax structure shall remain confidential (and the foregoing sentence shall not apply) to the extent necessary to enable any person to comply with securities laws. For this purpose, the tax treatment of a transaction is the purported or claimed U.S. income or franchise tax treatment of the transaction and the tax structure of a transaction is any fact that may be relevant to understanding the purported or claimed U.S. income or franchise tax treatment of the transaction. If the Company plans to disclose information pursuant to the first sentence of this paragraph, the Company shall inform those to whom it discloses any such information that they may not rely upon such information for any purpose without Houlihan Lokey’s prior written consent. Houlihan Lokey is not an expert on, and nothing contained in the materials should be construed as advice with regard to, legal, accounting, regulatory, insurance, tax or other specialist matters. Houlihan Lokey’s role in reviewing any information is limited solely to performing such a review as it shall deem necessary to support its own advice and analysis and shall not be on behalf of the Committee.
The materials necessarily are based on financial, economic, market and other conditions as in effect on, and the information available to Houlihan Lokey as of, the date of the materials. Although subsequent developments may affect the contents of the materials, Houlihan Lokey has not undertaken, and is under no obligation, to update, revise or reaffirm the materials, except as may be expressly contemplated by Houlihan Lokey’s engagement letter. The materials are not intended to provide the sole basis for evaluation of the Transaction and do not purport to contain all information that may be required. The materials do not address the underlying business decision of the Company or any other party to proceed with or effect the Transaction. The materials do not constitute any opinion, nor do the materials constitute a recommendation to the Board, the Committee, the Company, any security holder of the Company or any other party as to how to vote or act with respect to any matter relating to the Transaction or otherwise or whether to buy or sell any assets or securities of any company. Houlihan Lokey’s only opinion is the opinion, if any, that is actually delivered to the Committee. The materials may not reflect information known to other professionals in other business areas of Houlihan Lokey and its affiliates.
The preparation of the materials was a complex process involving quantitative and qualitative judgments and determinations with respect to the financial, comparative and other analytic methods employed and the adaption and application of these methods to the unique facts and circumstances presented and, therefore, is not readily susceptible to partial analysis or summary description. Furthermore, Houlihan Lokey did not attribute any particular weight to any analysis or factor considered by it, but rather made qualitative judgments as to the significance and relevance of each analysis and factor. Each analytical technique has inherent strengths and weaknesses, and the nature of the available information may further affect the value of particular techniques. Accordingly, the analyses contained in the materials must be considered as a whole. Selecting portions of the analyses, analytic methods and factors without considering all analyses and factors could create a misleading or incomplete view. The materials reflect judgments and assumptions with regard to industry performance, general business, economic, regulatory, market and financial conditions and other matters, many of which are beyond the control of the participants in the Transaction. Any estimates of value contained in the materials are not necessarily indicative of actual value or predictive of future results or values, which may be significantly more or less favorable. Any analyses relating to the value of assets, businesses or securities do not purport to be appraisals or to reflect the prices at which any assets, businesses or securities may actually be sold. The materials do not constitute a valuation opinion or credit rating. In preparing the materials, Houlihan Lokey has not conducted any physical inspection or independent appraisal or evaluation of any of the assets, properties or liabilities (contingent or otherwise) of the Company or any other party and has no obligation to evaluate the solvency of the Company or any other party under any law.
All budgets, projections, estimates, financial analyses, reports and other information with respect to operations (including estimates of potential cost savings and expenses) reflected in the materials have been prepared by management of the relevant party or are derived from such budgets, projections, estimates, financial analyses, reports and other information or from other sources, which involve numerous and significant subjective determinations made by management of the relevant party and/or which such management has reviewed and found reasonable. The budgets, projections and estimates contained in the materials may or may not be achieved and differences between projected results and those actually achieved may be material. Houlihan Lokey has relied upon representations made by management of the Company that such budgets, projections and estimates have been reasonably prepared in good faith on bases reflecting the best currently available estimates and judgments of such management (or, with respect to information obtained from public sources, represent reasonable estimates), and Houlihan Lokey expresses no opinion with respect to such budgets, projections or estimates or the assumptions on which they are based. The scope of the financial analysis contained herein is based on discussions with the Company (including, without limitation, regarding the methodologies to be utilized), and Houlihan Lokey does not make any representation, express or implied, as to the sufficiency or adequacy of such financial analysis or the scope thereof for any particular purpose.
Houlihan Lokey has assumed and relied upon the accuracy and completeness of the financial and other information provided to, discussed with or reviewed by it without (and without assuming responsibility for) independent verification of such information, makes no representation or warranty (express or implied) in respect of the accuracy or completeness of such information and has further relied upon the assurances of the Company that it is not aware of any facts or circumstances that would make such information inaccurate or misleading. In addition, Houlihan Lokey has relied upon and assumed, without independent verification, that there has been no change in the business, assets, liabilities, financial condition, results of operations, cash flows or prospects of the Company or any other participant in the Transaction since the respective dates of the most recent financial statements and other information, financial or otherwise, provided to Houlihan Lokey that would be material to its analyses , and that the final forms of any draft documents reviewed by Houlihan Lokey will not differ in any material respect from such draft documents.
The materials are not an offer to sell or a solicitation of an indication of interest to purchase any security, option, commodity, future, loan or currency. The materials do not constitute a commitment by Houlihan Lokey or any of its affiliates to underwrite, subscribe for or place any securities, to extend or arrange credit, or to provide any other services. In the ordinary course of business, certain of Houlihan Lokey’s affiliates and employees, as well as investment funds in which they may have financial interests or with which they may co-invest, may acquire, hold or sell, long or short positions, or trade or otherwise effect transactions, in debt, equity, and other securities and financial instruments (including loans and other obligations) of, or investments in, one or more parties that may be involved in the Transaction and their respective affiliates or any currency or commodity that may be involved in the Transaction. Houlihan Lokey provides mergers and acquisitions, restructuring and other advisory and consulting services to clients. Houlihan Lokey’s personnel may make statements or provide advice that is contrary to information contained in the materials. Houlihan Lokey’s or its affiliates’ proprietary interests may conflict with the Company’s interests. Houlihan Lokey may have advised, may seek to advise and may in the future advise one or more participants in the Transaction and/or other companies mentioned in the materials.
CONFIDENTIAL—PRELIMINARY DRAFT—SUBJECT TO FURTHER REVIEW 55
|
|
CORPORATEFINANCE
FINANCIALADVISORYSERVICES FINANCIALRESTRUCTURING STRATEGICCONSULTING
HL.com
56
| Exhibit C5
|

Project Piston
D I S C U S S I O N M AT E R I A L S F O R T H E S P E C I A L C O M M I T T E E
S E P T E M B E R 5 , 2 0 1 6 | P R E L I M I N A R Y D R A F T – S U B J E C T T O R E V I E W – C O N F I D E N T I A L
|
|
Table of Contents
Page
1. Executive Summary 3
2. Preliminary Financial Analyses 9
3. Selected Public Market Observations 17
4. Appendix 22 Company Financial Update 23 Cost of Capital Considerations 26 Selected Companies—Operating Statistics 32 Company Financial Performance Observations 36 Implied Premiums Paid Observations 39 Illustrative Preliminary Financial Analyses (EBITDA) 42
5. Disclaimer 54
CONFIDENTIAL—PRELIMINARY DRAFT—SUBJECT TO FURTHER REVIEW 2
|
|
Page
1. Executive Summary 3
2. Preliminary Financial Analyses 9
3. Selected Public Market Observations 17
4. Appendix 22
5. Disclaimer 54
|
|
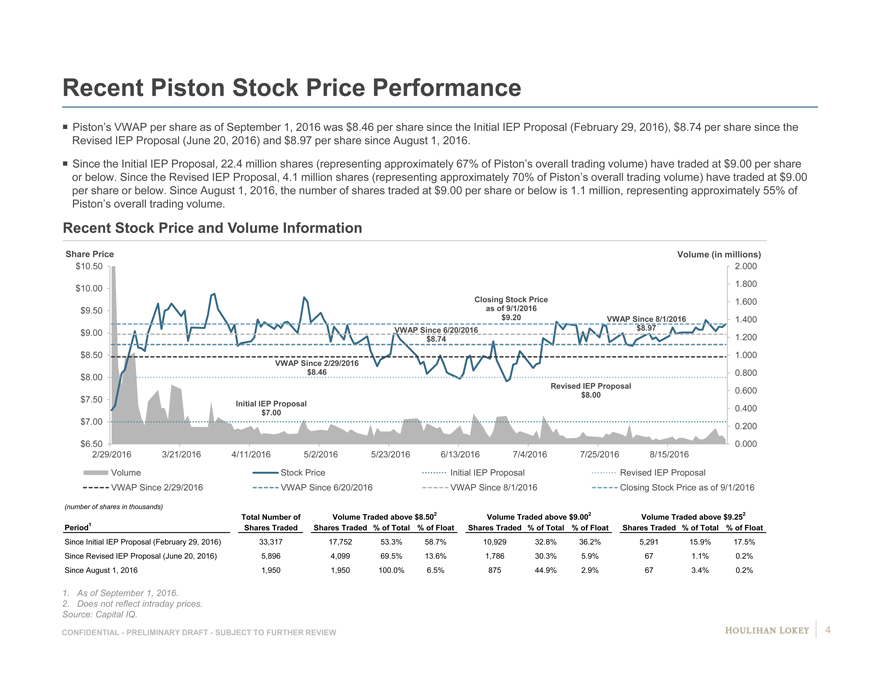
Recent Piston Stock Price Performance
Piston’s VWAP per share as of September 1, 2016 was $8.46 per share since the Initial IEP Proposal (February 29, 2016), $8.74 per share since the
Revised IEP Proposal (June 20, 2016) and $8.97 per share since August 1, 2016.
Since the Initial IEP Proposal, 22.4 million shares (representing approximately 67% of Piston’s overall trading volume) have traded at $9.00 per share
or below. Since the Revised IEP Proposal, 4.1 million shares (representing approximately 70% of Piston’s overall trading volume) have traded at $9.00
per share or below. Since August 1, 2016, the number of shares traded at $9.00 per share or below is 1.1 million, representing approximately 55% of
Piston’s overall trading volume.
Recent Stock Price and Volume Information
Share Price Volume (in millions)
$10.50 2.000
$10.00 1.800
Closing Stock Price1.600
$9.50 as of 9/1/2016
$9.20VWAP Since 8/1/20161.400
$9.00 VWAP Since 6/20/2016$8.97
$8.741.200
$8.50 1.000
VWAP Since 2/29/2016
$8.00 $8.460.800
Revised IEP Proposal0.600
$8.00
$7.50 Initial IEP Proposal
$7.000.400
$7.00 0.200
$6.50 0.000
2/29/2016 3/21/20164/11/20165/2/20165/23/20166/13/20167/4/20167/25/20168/15/2016
Volume Stock PriceInitial IEP ProposalRevised IEP Proposal
VWAP Since 2/29/2016 VWAP Since 6/20/2016VWAP Since 8/1/2016Closing Stock Price as of 9/1/2016
(number of shares in thousands)
Total Number ofVolume Traded above $8.502Volume Traded above $9.002Volume Traded above $9.252
Period1 Shares TradedShares Traded% of Total% of Float Shares Traded% of Total% of FloatShares Traded% of Total% of Float
Since Initial IEP Proposal (February 29, 2016)33,317 17,75253.3%58.7%10,92932.8%36.2%5,29115.9%17.5%
Since Revised IEP Proposal (June 20, 2016) 5,896 4,09969.5%13.6%1,78630.3%5.9%671.1%0.2%
Since August 1, 2016 1,9501,950100.0%6.5%87544.9%2.9%673.4%0.2%
1. As of September 1, 2016.
2. Does not reflect intraday prices.
Source: Capital IQ.
CONFIDENTIAL—PRELIMINARY DRAFT—SUBJECT TO FURTHER REVIEW 4
|
|
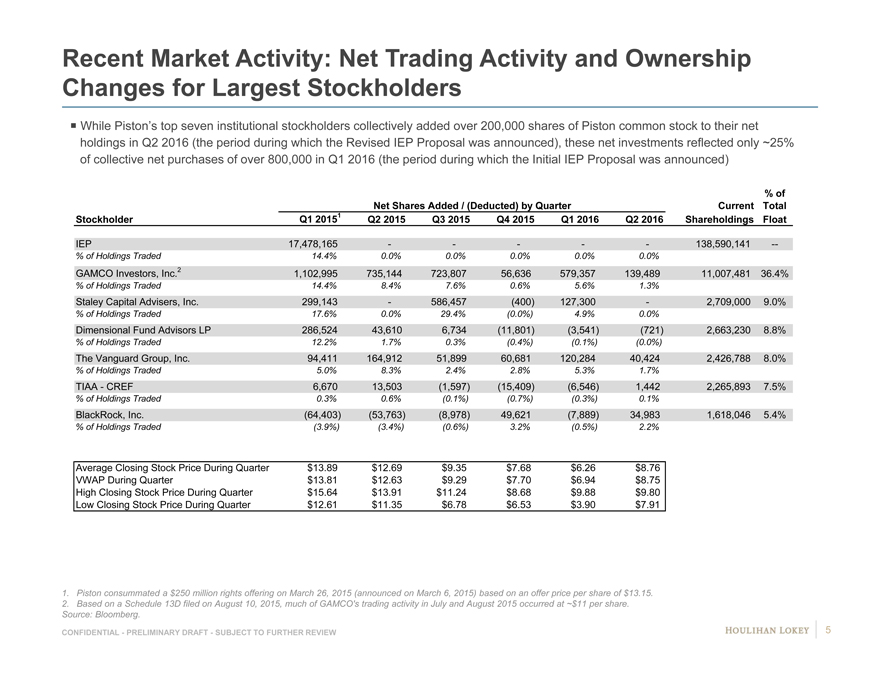
Recent Market Activity: Net Trading Activity and Ownership
Changes for Largest Stockholders
While Piston’s top seven institutional stockholders collectively added over 200,000 shares of Piston common stock to their net
holdings in Q2 2016 (the period during which the Revised IEP Proposal was announced), these net investments reflected only ~25%
of collective net purchases of over 800,000 in Q1 2016 (the period during which the Initial IEP Proposal was announced)
% of
Net Shares Added / (Deducted) by QuarterCurrentTotal
Stockholder Q1 20151 Q2 2015Q3 2015Q4 2015Q1 2016Q2 2016Shareholdings Float
IEP 17,478,165 -----138,590,141—
% of Holdings Traded 14.4% 0.0%0.0%0.0%0.0%0.0%
GAMCO Investors, Inc.2 1,102,995 735,144723,80756,636579,357139,48911,007,48136.4%
% of Holdings Traded 14.4% 8.4%7.6%0.6%5.6%1.3%
Staley Capital Advisers, Inc. 299,143 -586,457(400)127,300-2,709,0009.0%
% of Holdings Traded 17.6% 0.0%29.4%(0.0%)4.9%0.0%
Dimensional Fund Advisors LP 286,524 43,6106,734(11,801)(3,541)(721)2,663,2308.8%
% of Holdings Traded 12.2% 1.7%0.3%(0.4%)(0.1%)(0.0%)
The Vanguard Group, Inc. 94,411 164,91251,89960,681120,28440,4242,426,7888.0%
% of Holdings Traded 5.0%8.3%2.4%2.8%5.3%1.7%
TIAA—CREF 6,67013,503(1,597)(15,409)(6,546)1,4422,265,8937.5%
% of Holdings Traded 0.3%0.6%(0.1%)(0.7%)(0.3%)0.1%
BlackRock, Inc. (64,403) (53,763)(8,978)49,621(7,889)34,9831,618,0465.4%
% of Holdings Traded (3.9%)(3.4%)(0.6%)3.2%(0.5%)2.2%
Average Closing Stock Price During Quarter $13.89$12.69$9.35$7.68$6.26$8.76
VWAP During Quarter $13.81$12.63$9.29$7.70$6.94$8.75
High Closing Stock Price During Quarter $15.64$13.91$11.24$8.68$9.88$9.80
Low Closing Stock Price During Quarter $12.61$11.35$6.78$6.53$3.90$7.91
1. Piston consummated a $250 million rights offering on March 26, 2015 (announced on March 6, 2015) based on an offer price per share of $13.15.
2. Based on a Schedule 13D filed on August 10, 2015, much of GAMCO’s trading activity in July and August 2015 occurred at ~$11 per share.
Source: Bloomberg.
CONFIDENTIAL—PRELIMINARY DRAFT—SUBJECT TO FURTHER REVIEW 5
|
|
Updates to Financial Analyses Since August 15, 2016 Preliminary Discussion Materials
Since the preliminary Special Committee discussion materials on August 15, 2016, the following updates have been made:
Stock prices and other publicly available financial information for the selected companies have been updated to market close as of September 1, 2016 (refer to following page for further details).
LTM: Selected Adjusted Enterprise Value/Adjusted EBITDAP multiple range of 5.50x to 6.50x for Powertrain was unchanged, selected Adjusted Enterprise Value/Adjusted EBITDAP multiple range of 8.50x to 9.50x for Motorparts was unchanged CY 2016E: Selected Adjusted Enterprise Value/Adjusted EBITDAP multiple range of 5.25x to 6.25x for Powertrain was unchanged, selected Adjusted Enterprise Value/Adjusted EBITDAP multiple range of 8.50x to 9.50x for Motorparts was unchanged CY 2017E: Selected Adjusted Enterprise Value/Adjusted EBITDAP multiple range of 4.75x to 5.75x for Powertrain was unchanged, selected Adjusted Enterprise Value/Adjusted EBITDAP multiple range of 7.50x to 8.50x for Motorparts was unchanged
Discounted cash flow analysis reflects updated market data and present value date (see page 16)
Stock prices, betas, risk-free rate and other public information in the weighted average cost of capital calculation have been updated to market close as of September 1, 2016 Pension-adjusted WACC decreased from 10.3% in the August 15, 2016 preliminary Special Committee discussion materials to 10.2% currently; selected range of discount rates of 9.75% to 10.75% was unchanged
Based on discussions with Company management, there were no changes in the Company’s financials or projections
CONFIDENTIAL—PRELIMINARY DRAFT—SUBJECT TO FURTHER REVIEW 6
|
|
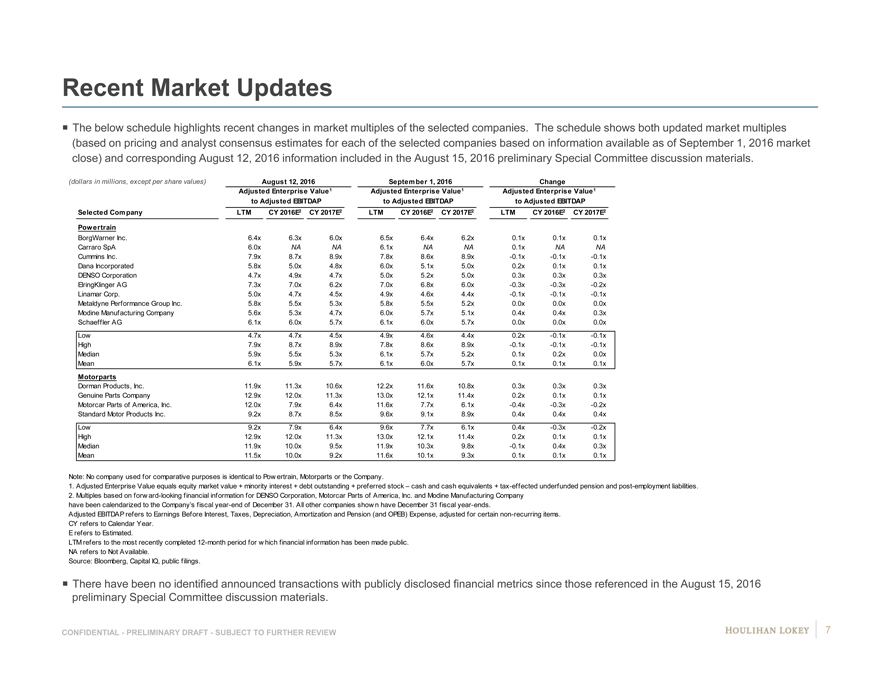
Recent Market Updates
The below schedule highlights recent changes in market multiples of the selected companies. The schedule shows both updated market multiples
(based on pricing and analyst consensus estimates for each of the selected companies based on information available as of September 1, 2016 market
close) and corresponding August 12, 2016 information included in the August 15, 2016 preliminary Special Committee discussion materials.
(dollars in millions, except per share values) August 12, 2016September 1, 2016Change
Adjusted Enterprise Value1 Adjusted Enterprise Value1Adjusted Enterprise Value1
to Adjusted EBITDAP to Adjusted EBITDAPto Adjusted EBITDAP
Selected Company LTM CY 2016E2 CY 2017E2LTMCY 2016E2 CY 2017E2LTMCY 2016E2 CY 2017E2
Powertrain
BorgWarner Inc. 6.4x 6.3x6.0x #6.5x6.4x6.2x6 90.1x0.1x0.1x
Carraro SpA 6.0x NANA A6.1xNANA N N0.1xNANA
Cummins Inc. 7.9x 8.7x8.9x #7.8x8.6x8.9x9 #-0.1x-0.1x-0.1x
Dana Incorporated 5.8x 5.0x4.8x #6.0x5.1x5.0x5 90.2x0.1x0.1x
DENSO Corporation 4.7x 4.9x4.7x #5.0x5.2x5.0x5 #0.3x0.3x0.3x
ElringKlinger AG 7.3x 7.0x6.2x #7.0x6.8x6.0x6 #-0.3x-0.3x-0.2x
Linamar Corp. 5.0x 4.7x4.5x #4.9x4.6x4.4x4 9-0.1x-0.1x-0.1x
Metaldyne Performance Group Inc. 5.8x 5.5x5.3x #5.8x5.5x5.2x5 90.0x0.0x0.0x
Modine Manufacturing Company 5.6x 5.3x4.7x #6.0x5.7x5.1x5 #0.4x0.4x0.3x
Schaeffler AG 6.1x 6.0x5.7x #6.1x6.0x5.7x6 #0.0x0.0x0.0x
Low 4.7x 4.7x4.5x4.9x4.6x4.4x0.2x-0.1x-0.1x
High 7.9x 8.7x8.9x7.8x8.6x8.9x-0.1x-0.1x-0.1x
Median 5.9x 5.5x5.3x6.1x5.7x5.2x0.1x0.2x0.0x
Mean 6.1x 5.9x5.7x6.1x6.0x5.7x0.1x0.1x0.1x
Motorparts
Dorman Products, Inc. 11.9x 11.3x10.6x #12.2x11.6x10.8x# #0.3x0.3x0.3x
Genuine Parts Company 12.9x 12.0x11.3x #13.0x12.1x11.4x# #0.2x0.1x0.1x
Motorcar Parts of America, Inc. 12.0x 7.9x6.4x #11.6x7.7x6.1x6 6-0.4x-0.3x-0.2x
Standard Motor Products Inc. 9.2x 8.7x8.5x #9.6x9.1x8.9x9 N0.4x0.4x0.4x
Low 9.2x 7.9x6.4x9.6x7.7x6.1x0.4x-0.3x-0.2x
High 12.9x 12.0x11.3x13.0x12.1x11.4x0.2x0.1x0.1x
Median 11.9x 10.0x9.5x11.9x10.3x9.8x-0.1x0.4x0.3x
Mean 11.5x 10.0x9.2x11.6x10.1x9.3x0.1x0.1x0.1x
Note: No company used for comparative purposes is identical to Pow ertrain, Motorparts or the Company.
1. Adjusted Enterprise Value equals equity market value + minority interest + debt outstanding + preferred stock – cash and cash equivalents + tax-effected underfunded pension and post-employment liabilities.
2. Multiples based on forw ard-looking financial information for DENSO Corporation, Motorcar Parts of America, Inc. and Modine Manufacturing Company
have been calendarized to the Company’s fiscal year-end of December 31. All other companies show n have December 31 fiscal year-ends.
Adjusted EBITDAP refers to Earnings Before Interest, Taxes, Depreciation, Amortization and Pension (and OPEB) Expense, adjusted for certain non-recurring items.
CY refers to Calendar Year.
E refers to Estimated.
LTM refers to the most recently completed 12-month period for w hich financial information has been made public.
NA refers to Not Available.
Source: Bloomberg, Capital IQ, public filings.
There have been no identified announced transactions with publicly disclosed financial metrics since those referenced in the August 15, 2016
preliminary Special Committee discussion materials.
CONFIDENTIAL—PRELIMINARY DRAFT—SUBJECT TO FURTHER REVIEW 7
|
|
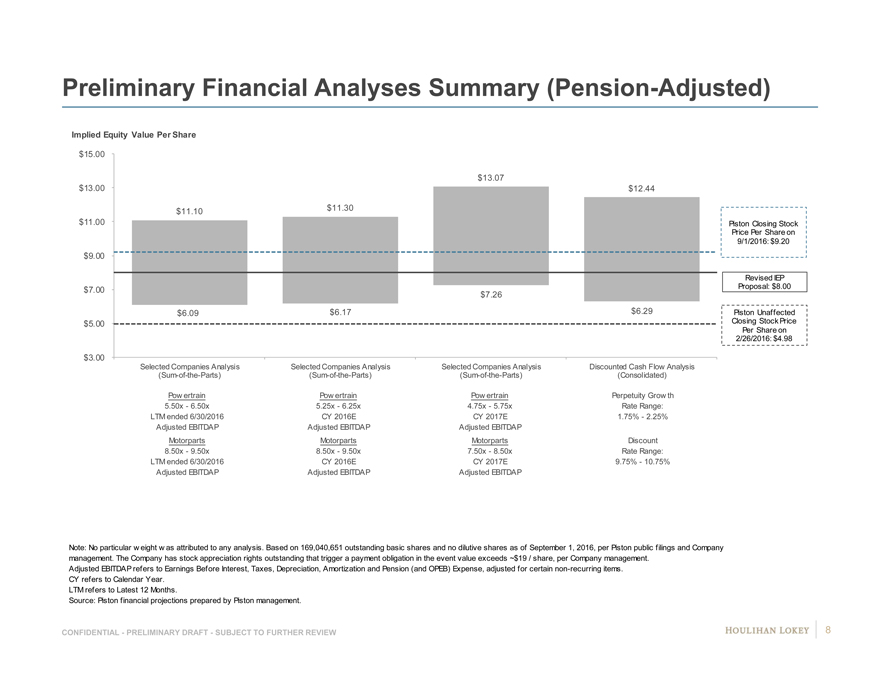
Preliminary Financial Analyses Summary (Pension-Adjusted)
Implied Equity Value Per Share
$15.00
$13.07
$13.00 $12.44
$11.10 $11.30
$11.00 Piston Closing Stock Price Per Share on 9/1/2016: $9.20 $9.00
Revised IEP $7.00 Proposal: $8.00
$7.26
$6.09 $6.17 $6.29 Piston Unaffected $5.00 Closing Stock Price Per Share on 2/26/2016: $4.98
$3.00
Selected Companies Analysis Selected Companies Analysis Selected Companies Analysis Discounted Cash Flow Analysis (Sum-of-the-Parts) (Sum-of-the-Parts) (Sum-of-the-Parts) (Consolidated)
Pow ertrain Pow ertrain Pow ertrain Perpetuity Grow th
5.50x—6.50x 5.25x—6.25x 4.75x—5.75x Rate Range: LTM ended 6/30/2016 CY 2016E CY 2017E 1.75%—2.25% Adjusted EBITDAP Adjusted EBITDAP Adjusted EBITDAP
Motorparts Motorparts Motorparts Discount
8.50x—9.50x 8.50x—9.50x 7.50x—8.50x Rate Range: LTM ended 6/30/2016 CY 2016E CY 2017E 9.75%—10.75% Adjusted EBITDAP Adjusted EBITDAP Adjusted EBITDAP
Note: No particular w eight w as attributed to any analysis. Based on 169,040,651 outstanding basic shares and no dilutive shares as of September 1, 2016, per Piston public filings and Company management. The Company has stock appreciation rights outstanding that trigger a payment obligation in the event value exceeds ~$19 / share, per Company management.
Adjusted EBITDAP refers to Earnings Before Interest, Taxes, Depreciation, Amortization and Pension (and OPEB) Expense, adjusted for certain non-recurring items. CY refers to Calendar Year.
LTM refers to Latest 12 Months.
Source: Piston financial projections prepared by Piston management.
CONFIDENTIAL—PRELIMINARY DRAFT—SUBJECT TO FURTHER REVIEW 8
|
|
Page
1. Executive Summary 3
2. Preliminary Financial Analyses 9
3. Selected Public Market Observations 17
4. Appendix 22
5. Disclaimer 54
|
|

Preliminary Financial Analyses Summary (Pension-Adjusted)
(shares outstanding and dollars in millions, except per share values)
Selected SelectedSelectedDiscounted
Companies CompaniesCompaniesCash Flow
Analysis AnalysisAnalysisAnalysis
LTM ended 6/30/2016 CY 2016ECY 2017EPension-Adjusted
Adjusted EBITDAP Adjusted EBITDAPAdjusted EBITDAPPerpetuity Grow th
Powertrain Discount Rate Range:
Corresponding Pow ertrain Base Amount $478$494$560Perpetuity
Selected Multiple Range 5.50 x —6.50 x5.25 x—6.25 x4.75x—5.75xGrow th Rate Range:
Implied Pow ertrain Enterprise Value from Operations Reference Range $2,630 —$3,108$2,596—$3,091$2,659—$3,2191.75%—2.25%
Motorparts Discount Rate Range:
Corresponding Motorparts Base Amount $252$258$3089.75%—10.75%
Selected Multiple Range 8.50 x —9.50 x8.50 x—9.50 x7.50 x—8.50 x
Implied Motorparts Enterprise Value from Operations Reference Range $2,144 —$2,397$2,192—$2,450$2,313—$2,621
Consolidated Enterprise Value from Operations Range
Corresponding Base Amount $731$752$869
Implied Consolidated Multiple Range 6.5 x —7.5 x6.4 x—7.4 x5.7 x—6.7 x
Consolidated Enterprise Value from Operations Reference Range¹ $4,775 —$5,505$4,788—$5,540$4,971—$5,840$4,887—$5,811
Add: Cash and Cash Equivalents Attributable to the Company² $273 —$273$273—$273$273—$273$273—$273
Add: Investments in Non-consolidated Affiliates (Cost Method)³ $8 —$8$8—$8$8—$8$8—$8
Add: Real Estate Assets Held for Sale $45 —$45$45—$45$45—$45$45—$45
Add: Value of NOLs and Tax Credits $79 —$79$79—$79$79—$79$0—$0
Implied Total Enterprise Value Reference Range $5,180 —$5,911$5,193—$5,946$5,377—$6,245$5,213—$6,138
Less: Debt Attributable to the Company $3,096 —$3,096$3,096—$3,096$3,096—$3,096$3,096—$3,096
Less: Adjusted Underfunded Pension (and OPEB) Liability as of 6/30/2016 $1,036 —$921$1,036—$921$1,036—$921$1,036—$921
Less: Net Environmental Liabilities $13 —$13$13—$13$13—$13$13—$13
Less: Net Asset Retirement Obligations $5 —$5$5—$5$5—$5$5—$5
Implied Total Equity Value Reference Range $1,030 —$1,876$1,043—$1,911$1,227—$2,210$1,063—$2,103
Shares Outstanding10 169.0 —169.0169.0—169.0169.0—169.0169.0—169.0
Implied Per Share Equity Value Reference Range $6.09 —$11.10$6.17—$11.30$7.26—$13.07$6.29—$12.44
Source: Piston financial projections prepared by Piston management. Refer to next page for additional notes.
CONFIDENTIAL—PRELIMINARY DRAFT—SUBJECT TO FURTHER REVIEW 10
|
|
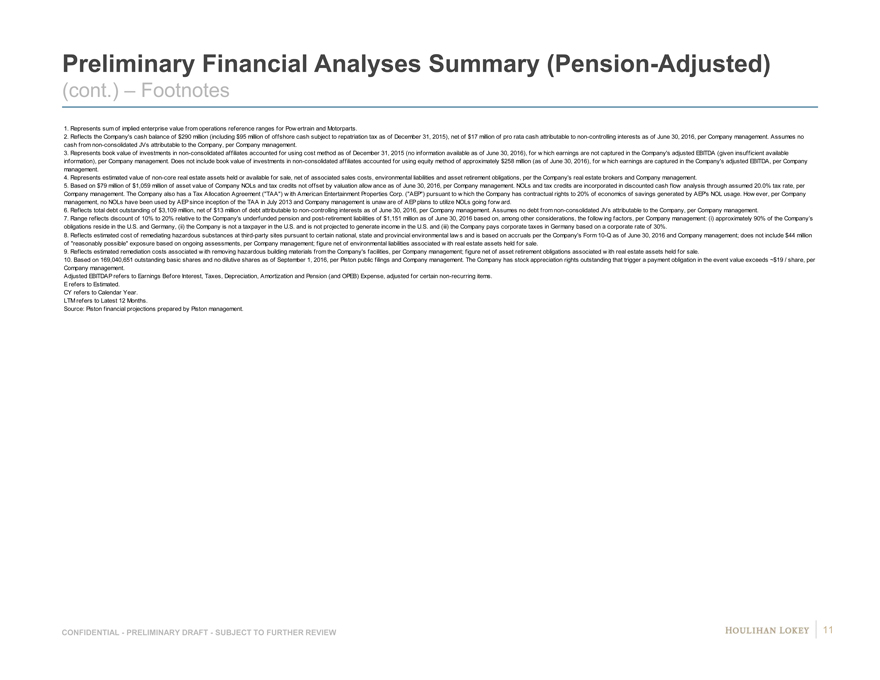
Preliminary Financial Analyses Summary (Pension-Adjusted)
(cont.) – Footnotes
1. Represents sum of implied enterprise value from operations reference ranges for Pow ertrain and Motorparts.
2. Reflects the Company’s cash balance of $290 million (including $95 million of offshore cash subject to repatriation tax as of December 31, 2015), net of $17 million of pro rata cash attributable to non-controlling interests as of June 30, 2016, per Company management. Assumes no cash from non-consolidated JVs attributable to the Company, per Company management.
3. Represents book value of investments in non-consolidated affiliates accounted for using cost method as of December 31, 2015 (no information available as of June 30, 2016), for w hich earnings are not captured in the Company’s adjusted EBITDA (given insufficient available information), per Company management. Does not include book value of investments in non-consolidated affiliates accounted for using equity method of approximately $258 million (as of June 30, 2016), for w hich earnings are captured in the Company’s adjusted EBITDA, per Company management.
4. Represents estimated value of non-core real estate assets held or available for sale, net of associated sales costs, environmental liabilities and asset retirement obligations, per the Company’s real estate brokers and Company management.
5. Based on $79 million of $1,059 million of asset value of Company NOLs and tax credits not offset by valuation allow ance as of June 30, 2016, per Company management. NOLs and tax credits are incorporated in discounted cash flow analysis through assumed 20.0% tax rate, per Company management. The Company also has a Tax Allocation Agreement (“TAA”) w ith American Entertainment Properties Corp. (“AEP”) pursuant to w hich the Company has contractual rights to 20% of economics of savings generated by AEP’s NOL usage. How ever, per Company management, no NOLs have been used by AEP since inception of the TAA in July 2013 and Company management is unaw are of AEP plans to utilize NOLs going forw ard.
6. Reflects total debt outstanding of $3,109 million, net of $13 million of debt attributable to non-controlling interests as of June 30, 2016, per Company management. Assumes no debt from non-consolidated JVs attributable to the Company, per Company management.
7. Range reflects discount of 10% to 20% relative to the Company’s underfunded pension and post-retirement liabilities of $1,151 million as of June 30, 2016 based on, among other considerations, the follow ing factors, per Company management: (i) approximately 90% of the Company’s obligations reside in the U.S. and Germany, (ii) the Company is not a taxpayer in the U.S. and is not projected to generate income in the U.S. and (iii) the Company pays corporate taxes in Germany based on a corporate rate of 30%.
8. Reflects estimated cost of remediating hazardous substances at third-party sites pursuant to certain national, state and provincial environmental law s and is based on accruals per the Company’s Form 10-Q as of June 30, 2016 and Company management; does not include $44 million of “reasonably possible” exposure based on ongoing assessments, per Company management; figure net of environmental liabilities associated w ith real estate assets held for sale.
9. Reflects estimated remediation costs associated w ith removing hazardous building materials from the Company’s facilities, per Company management; figure net of asset retirement obligations associated w ith real estate assets held for sale.
10. Based on 169,040,651 outstanding basic shares and no dilutive shares as of September 1, 2016, per Piston public filings and Company management. The Company has stock appreciation rights outstanding that trigger a payment obligation in the event value exceeds ~$19 / share, per Company management.
Adjusted EBITDAP refers to Earnings Before Interest, Taxes, Depreciation, Amortization and Pension (and OPEB) Expense, adjusted for certain non-recurring items. E refers to Estimated.
CY refers to Calendar Year. LTM refers to Latest 12 Months.
Source: Piston financial projections prepared by Piston management.
CONFIDENTIAL—PRELIMINARY DRAFT—SUBJECT TO FURTHER REVIEW 11
|
|

Selected Consolidated Historical and Projected Financial Data
(dollars in millions) HistoricalProjected
Fiscal Year Ended December 31, LTM EndedLTM EndedFiscal Year Ending December 31,2013—20152015—2020
2013 201420153/31/20166/30/20162016E2017E2018E2019E2020ECAGRCAGR
Total Revenue¹ $6,786 $7,317$7,419$7,481$7,443$7,502$7,914$8,297$8,593$8,9734.6%3.9%
Growth % 5.3% 7.8%1.4%——1.1%5.5%4.8%3.6%4.4%
Less: Cost of Goods Sold 5,766 6,2606,3456,3706,3186,3166,5966,8667,1317,434
Gross Profit $1,020 $1,057$1,074$1,111$1,125$1,186$1,318$1,431$1,462$1,539
Margin% 15.0% 14.4%14.5%14.9%15.1%15.8%16.7%17.2%17.0%17.2%
Less: Selling, General and Administrative Expenses2,3 719 776794789804827866886901913
Less: Restructuring Expense? 21 868992703536151825
Less: Other Operating Expense² 58 2041901861876765727372
Add: Depreciation & Amortization Expense³ 296 334341345355373384404426425
Add: Earnings in Non-consolidated JVs Attributable to Piston? 34 485658615760676870
Less: EBITDA in Consolidated JVs Attributable to Minority Interests? NA 192020202326293234
Add: Adjustments? 38 24823223120920297710
Adjusted EBITDA $590 $602$610$658$669$684$798$907$940$1,0001.7%10.4%
Growth % 22.5% 2.2%1.2%——12.2%16.6%13.8%3.6%6.5%
Margin% 8.7% 8.2%8.2%8.8%9.0%9.1%10.1%10.9%10.9%11.1%
Add: Pension (and OPEB) Expense 55 526261626871716561
Adjusted EBITDAP $645 $654$672$719$731$752$869$978$1,005$1,0612.1%9.6%
Growth % — 1.5%2.6%——12.0%15.5%12.6%2.7%5.6%
Margin % 9.5% 8.9%9.1%9.6%9.8%10.0%11.0%11.8%11.7%11.8%
Less: Depreciation & Amortization Expense³ 294 334341345355373384404426425
Adjusted EBITP³ $351 $320$331$374$376$379$485$574$579$636-2.9%14.0%
Less: Pension (and OPEB) Expense 55 526261626871716561
Adjusted EBIT³ $296 $268$269$313$314$311$414$503$514$575-4.7%16.5%
Adjusted EBITDAP—CapEx $265 $235$232$293$312$318$450$569$575$631
Adjusted EBITDA—CapEx $210 $183$170$232$250$250$379$498$510$570
Note: Historical financials show n above do not reflect pro forma adjustments for Affinia and Honeyw ell acquisitions completed in May 2014 and July 2014, respectively, or for tw o-stage TRW-Valvetrain acquisition completed in February 2015 and July 2015. Refer to
subsequent pages for additional details.
1. Total revenue eliminates intercompany sales from Pow ertrain to Motorparts.
2. Other Operating Expense includes amortization expense over projected period and amortization, impairment and other non-cash expenses on a historical basis. Certain historical “other operating expenses” and SG&A expenses may have been
reclassified for purposes of financial projections, per Company management.
3. Approximately $15 million to $25 million of D&A expense incurred at corporate level annually. Accordingly, consolidated SG&A expense, D&A expense, EBITP and EBIT figures w ill not tie to sum of corresponding figures for each of Motorparts and Pow ertrain.
4. FY 2013 and FY 2014 contain $3 million and $1 million of corporate restructuring expense, respectively.
5. The Company has minority investments in 16 joint ventures and other affiliates primarily aimed at developing a presence in emerging markets. The above reflects the aggregate of the Company’s pro rata share of earnings in such affiliates accounted for under the equity
method (historical information is based on net earnings—no information is available on EBITDA).
6. The Company has 50% or greater ow nership interests in 21 joint ventures and other affiliates primarily aimed at developing a presence in emerging markets. The above reflects aggregate of pro rata allocation of EBITDA in each such entity attributable to minority interests.
7. Total Adjustments
Extraordinary Restructuring Expenses? $13 $71$74$77$55$20$29$7$7$10
Asset Impairments 8 2432343200000
Goodw ill & Intangible Impairment Expense 0 1209410010600000
Loss on Sale of Equity Method Investment 0 0110000000
Financing Charges 7 69101200000
Transaction Related Costs 5 1662200000
Segmentation Costs 0 1043200000
Other Non-Recurring Expenses 5 125000000
Total Adjustments $38 $248$232$231$209$20$29$7$7$10
8. Per Company management, each of Motorparts and Pow ertrain incurs approximately $5 million to $10 milllion of annual restructuring expenses in the ordinary course to preserve top-line and margin performance. Accordingly, adjustments for restructuring expense reflect
levels above $7.5 million run-rate for each of Motorparts and Pow ertrain.
Historical adjustments other than restructuring and asset impairment charges not available on segmented basis.
Adjusted EBIT refers to Earnings Before Interest and Taxes, adjusted for certain non-recurring items.
Adjusted EBITDA refers to Earnings Before Interest, Taxes, Depreciation & Amortization, adjusted for certain non-recurring items.
Adjusted EBITDAP refers to Earnings Before Interest, Taxes, Depreciation, Amortization and Pension (and OPEB) Expense, adjusted for certain non-recurring items.
CAGR refers to Compound Annual Grow th Rate.
CapEx refers to Capital Expenditures.
NA refers to Not Available.
Source: Piston management, including projections prepared by Piston management, Company Form 10-K filed on February 29, 2016, Company Form 10-Q filed on April 27, 2016, Company Form 10-Q filed on July 27, 2016.
CONFIDENTIAL—PRELIMINARY DRAFT—SUBJECT TO FURTHER REVIEW 12
|
|
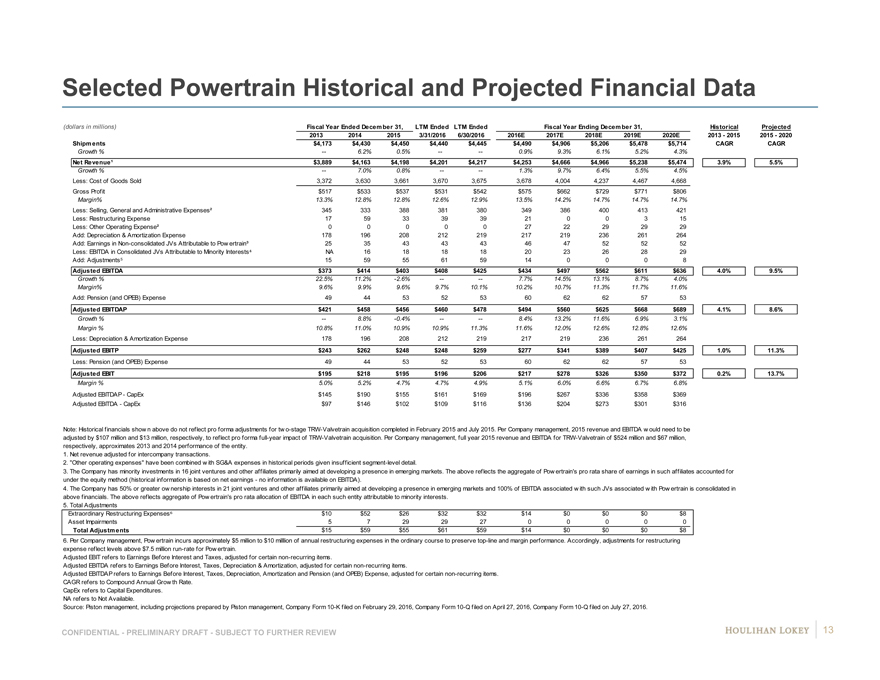
Selected Powertrain Historical and Projected Financial Data
(dollars in millions) Fiscal Year Ended December 31, LTM EndedLTM EndedFiscal Year Ending December 31,HistoricalProjected
2013 201420153/31/20166/30/20162016E2017E2018E2019E2020E2013—20152015—2020
Shipments $4,173 $4,430$4,450$4,440$4,445$4,490$4,906$5,206$5,478$5,714CAGRCAGR
Growth % — 6.2%0.5%——0.9%9.3%6.1%5.2%4.3%
Net Revenue¹ $3,889 $4,163$4,198$4,201$4,217$4,253$4,666$4,966$5,238$5,4743.9%5.5%
Growth % — 7.0%0.8%——1.3%9.7%6.4%5.5%4.5%
Less: Cost of Goods Sold 3,372 3,6303,6613,6703,6753,6784,0044,2374,4674,668
Gross Profit $517 $533$537$531$542$575$662$729$771$806
Margin% 13.3% 12.8%12.8%12.6%12.9%13.5%14.2%14.7%14.7%14.7%
Less: Selling, General and Administrative Expenses² 345 333388381380349386400413421
Less: Restructuring Expense 17 593339392100315
Less: Other Operating Expense² 0 00002722292929
Add: Depreciation & Amortization Expense 178 196208212219217219236261264
Add: Earnings in Non-consolidated JVs Attributable to Pow ertrain³ 25 354343434647525252
Less: EBITDA in Consolidated JVs Attributable to Minority Interests? NA 161818182023262829
Add: Adjustments? 15 59556159140008
Adjusted EBITDA $373 $414$403$408$425$434$497$562$611$6364.0%9.5%
Growth % 22.5% 11.2%-2.6%——7.7%14.5%13.1%8.7%4.0%
Margin% 9.6% 9.9%9.6%9.7%10.1%10.2%10.7%11.3%11.7%11.6%
Add: Pension (and OPEB) Expense 49 445352536062625753
Adjusted EBITDAP $421 $458$456$460$478$494$560$625$668$6894.1%8.6%
Growth % — 8.8%-0.4%——8.4%13.2%11.6%6.9%3.1%
Margin % 10.8% 11.0%10.9%10.9%11.3%11.6%12.0%12.6%12.8%12.6%
Less: Depreciation & Amortization Expense 178 196208212219217219236261264
Adjusted EBITP $243 $262$248$248$259$277$341$389$407$4251.0%11.3%
Less: Pension (and OPEB) Expense 49 445352536062625753
Adjusted EBIT $195 $218$195$196$206$217$278$326$350$3720.2%13.7%
Margin % 5.0% 5.2%4.7%4.7%4.9%5.1%6.0%6.6%6.7%6.8%
Adjusted EBITDAP—CapEx $145 $190$155$161$169$196$267$336$358$369
Adjusted EBITDA—CapEx $97 $146$102$109$116$136$204$273$301$316
Note: Historical financials show n above do not reflect pro forma adjustments for tw o-stage TRW-Valvetrain acquisition completed in February 2015 and July 2015. Per Company management, 2015 revenue and EBITDA w ould need to be
adjusted by $107 million and $13 million, respectively, to reflect pro forma full-year impact of TRW-Valvetrain acquisition. Per Company management, full year 2015 revenue and EBITDA for TRW-Valvetrain of $524 million and $67 million,
respectively, approximates 2013 and 2014 performance of the entity.
1. Net revenue adjusted for intercompany transactions.
2. “Other operating expenses” have been combined w ith SG&A expenses in historical periods given insufficient segment-level detail.
3. The Company has minority investments in 16 joint ventures and other affiliates primarily aimed at developing a presence in emerging markets. The above reflects the aggregate of Pow ertrain’s pro rata share of earnings in such affiliates accounted for
under the equity method (historical information is based on net earnings—no information is available on EBITDA).
4. The Company has 50% or greater ow nership interests in 21 joint ventures and other affiliates primarily aimed at developing a presence in emerging markets and 100% of EBITDA associated w ith such JVs associated w ith Pow ertrain is consolidated in
above financials. The above reflects aggregate of Pow ertrain’s pro rata allocation of EBITDA in each such entity attributable to minority interests.
5. Total Adjustments
Extraordinary Restructuring Expenses? $10 $52$26$32$32$14$0$0$0$8
Asset Impairments 5 729292700000
Total Adjustments $15 $59$55$61$59$14$0$0$0$8
6. Per Company management, Pow ertrain incurs approximately $5 million to $10 milllion of annual restructuring expenses in the ordinary course to preserve top-line and margin performance. Accordingly, adjustments for restructuring
expense reflect levels above $7.5 million run-rate for Pow ertrain.
Adjusted EBIT refers to Earnings Before Interest and Taxes, adjusted for certain non-recurring items.
Adjusted EBITDA refers to Earnings Before Interest, Taxes, Depreciation & Amortization, adjusted for certain non-recurring items.
Adjusted EBITDAP refers to Earnings Before Interest, Taxes, Depreciation, Amortization and Pension (and OPEB) Expense, adjusted for certain non-recurring items.
CAGR refers to Compound Annual Grow th Rate.
CapEx refers to Capital Expenditures.
NA refers to Not Available.
Source: Piston management, including projections prepared by Piston management, Company Form 10-K filed on February 29, 2016, Company Form 10-Q filed on April 27, 2016, Company Form 10-Q filed on July 27, 2016.
CONFIDENTIAL—PRELIMINARY DRAFT—SUBJECT TO FURTHER REVIEW 13
|
|

Selected Motorparts Historical and Projected Financial Data
(dollars in millions) Fiscal Year Ended December 31, LTM EndedLTM EndedFiscal Year Ending December 31,HistoricalProjected
2013 201420153/31/20166/30/20162016E2017E2018E2019E2020E2013—20152015—2020
Shipments $2,935 $3,192$3,253$3,311$3,258$3,283$3,282$3,365$3,389$3,533CAGRCAGR
Growth % — 8.8%1.9%——0.9%0.0%2.5%0.7%4.2%
Net Revenue¹ $2,897 $3,154$3,221$3,280$3,226$3,249$3,248$3,331$3,355$3,4995.4%1.7%
Growth % — 8.9%2.1%——0.9%0.0%2.6%0.7%4.3%
Less: Cost of Goods Sold 2,394 2,6302,6842,7002,6432,6382,5922,6292,6642,766
Gross Profit $503 $524$537$580$583$611$656$702$691$733
Margin% 17.4% 16.6%16.7%17.7%18.1%18.8%20.2%21.1%20.6%20.9%
Less: Selling, General and Administrative Expenses² 396 469456458471453456465470477
Less: Restructuring Expense 1 265653311436151510
Less: Other Operating Expense² 0 00003943434343
Add: Depreciation & Amortization Expense 100 114119119123130140146146146
Add: Earnings in Non-consolidated JVs Attributable to Motorparts³ 9 131313131113151618
Less: EBITDA in Consolidated JVs Attributable to Minority Interests? NA 222233445
Add: Adjustments? 2 36525129629772
Adjusted EBITDA $217 $189$206$249$243$250$299$344$328$365-2.5%12.1%
Growth % 22.5% -12.8%9.1%——21.1%19.8%14.9%-4.5%11.1%
Margin% 7.5% 6.0%6.4%7.6%7.5%7.7%9.2%10.3%9.8%10.4%
Add: Pension (and OPEB) Expense 6 899989988
Adjusted EBITDAP $223 $197$215$258$252$258$308$353$337$373-1.8%11.6%
Growth % — -11.7%9.2%——19.8%19.6%14.4%-4.6%10.8%
Margin % 7.7% 6.3%6.7%7.9%7.8%7.9%9.5%10.6%10.0%10.7%
Less: Depreciation & Amortization Expense 100 114119119123130140146146146
Adjusted EBITP $123 $83$96$139$129$128$168$207$191$227-11.6%18.7%
Less: Pension (and OPEB) Expense 6 899989988
Adjusted EBIT $117 $75$87$130$120$120$159$198$182$219-13.6%20.2%
Margin % 4.0% 2.4%2.7%4.0%3.7%3.7%4.9%5.9%5.4%6.3%
Adjusted EBITDAP—CapEx $137 $67$84$139$147$123$182$233$217$263
Adjusted EBITDA—CapEx $131 $59$75$130$138$115$173$224$208$255
Note: Historical financials show n above do not reflect pro forma adjustments for Affinia and Honeyw ell acquisitions completed in May 2014 and July 2014, respectively. Per Company management, 2014 revenue and EBITDA w ould need to
be adjusted by $65 million and $7 million, respectively, to reflect pro forma full-year impact of Affinia acquisition, and 2014 revenue and EBITDA w ould need to be adjusted by $238 million and ($7) million, respectively, to reflect pro forma full-
year impact of Honeyw ell acquisition. Per Company management, Affinia w as expected to contribute annual revenue of $200 million and EBITDA of $20 million. Per Company management, at the time of the acquisition, Honeyw ell had annual
revenue of $450 million w ith break-even EBITDA; how ever, Honeyw ell w as expected to be fully blended w ithin the Braking business and ultimately reach ~10% EBITDA margins (before corporate allocations).
1. Net revenue adjusted for intercompany transactions.
2. “Other operating expenses” have been combined w ith SG&A expenses in historical periods given insufficient segment-level detail.
3. The Company has minority investments in 16 joint ventures and other affiliates primarily aimed at developing a presence in emerging markets. The above reflects the aggregate of Motorparts’ pro rata share of earnings in such affiliates
accounted for under the equity method (historical information based on net earnings—no information is available on EBITDA).
4. The Company has 50% or greater ow nership interests in 21 joint ventures and other affiliates primarily aimed at developing a presence in emerging markets and 100% of EBITDA associated w ith such JVs associated w ith Motorparts is
consolidated in above financials. The above reflects aggregate of Motorparts’ pro rata allocation of EBITDA in each such entity attributable to minority interests.
5. Total Adjustments
Extraordinary Restructuring Expenses? $0 $19$49$46$24$6$29$7$7$2
Asset Impairments 2 1735500000
Total Adjustments $2 $36$52$51$29$6$29$7$7$2
6. Per Company management, Motorparts incurs approximately $5 million to $10 milllion of annual restructuring expenses in the ordinary course to preserve top-line and margin performance. Accordingly, adjustments for restructuring
expense reflect levels above $7.5 million run-rate for Motorparts.
Adjusted EBIT refers to Earnings Before Interest and Taxes, adjusted for certain non-recurring items.
Adjusted EBITDA refers to Earnings Before Interest, Taxes, Depreciation & Amortization, adjusted for certain non-recurring items.
Adjusted EBITDAP refers to Earnings Before Interest, Taxes, Depreciation, Amortization and Pension (and OPEB) Expense, adjusted for certain non-recurring items.
CAGR refers to Compound Annual Grow th Rate.
CapEx refers to Capital Expenditures.
NA refers to Not Available.
Source: Piston management, including projections prepared by Piston management, Company Form 10-K filed on February 29, 2016, Company Form 10-Q filed on April 27, 2016, Company Form 10-Q filed on July 27, 2016.
CONFIDENTIAL—PRELIMINARY DRAFT—SUBJECT TO FURTHER REVIEW 14
|
|
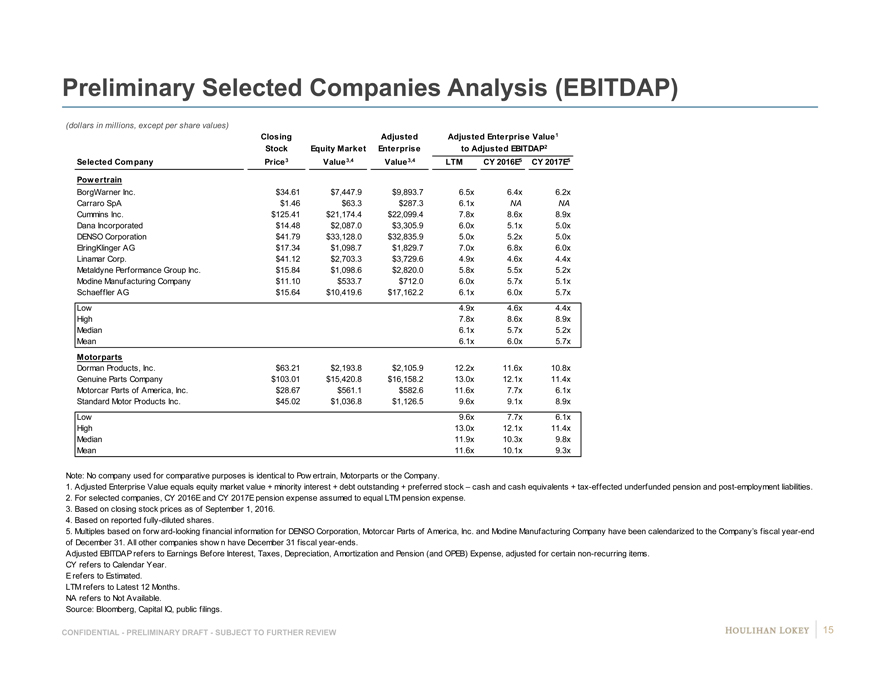
Preliminary Selected Companies Analysis (EBITDAP)
(dollars in millions, except per share values)
Closing AdjustedAdjusted Enterprise Value1
Stock Equity MarketEnterpriseto Adjusted EBITDAP2
Selected Company Price 3 Value 3,4Value 3,4LTMCY 2016E5CY 2017E5
Powertrain
BorgWarner Inc. $34.61 $7,447.9$9,893.76.5x6.4x6.2x6 9
Carraro SpA $1.46 $63.3$287.36.1xNANA N NA
Cummins Inc. $125.41 $21,174.4$22,099.47.8x8.6x8.9x9 #
Dana Incorporated $14.48 $2,087.0$3,305.96.0x5.1x5.0x5 9
DENSO Corporation $41.79 $33,128.0$32,835.95.0x5.2x5.0x5 #
ElringKlinger AG $17.34 $1,098.7$1,829.77.0x6.8x6.0x6 #
Linamar Corp. $41.12 $2,703.3$3,729.64.9x4.6x4.4x4 9
Metaldyne Performance Group Inc. $15.84 $1,098.6$2,820.05.8x5.5x5.2x5 9
Modine Manufacturing Company $11.10 $533.7$712.06.0x5.7x5.1x5 #
Schaeffler AG $15.64 $10,419.6$17,162.26.1x6.0x5.7x6 #
Low 4.9x4.6x4.4x
High 7.8x8.6x8.9x
Median 6.1x5.7x5.2x
Mean 6.1x6.0x5.7x
Motorparts
Dorman Products, Inc. $63.21 $2,193.8$2,105.912.2x11.6x10.8x# #
Genuine Parts Company $103.01 $15,420.8$16,158.213.0x12.1x11.4x# #
Motorcar Parts of America, Inc. $28.67 $561.1$582.611.6x7.7x6.1x6 6
Standard Motor Products Inc. $45.02 $1,036.8$1,126.59.6x9.1x8.9x9 NA
Low 9.6x7.7x6.1x
High 13.0x12.1x11.4x
Median 11.9x10.3x9.8x
Mean 11.6x10.1x9.3x
Note: No company used for comparative purposes is identical to Pow ertrain, Motorparts or the Company.
1. Adjusted Enterprise Value equals equity market value + minority interest + debt outstanding + preferred stock – cash and cash equivalents + tax-effected underfunded pension and post-employment liabilities.
2. For selected companies, CY 2016E and CY 2017E pension expense assumed to equal LTM pension expense.
3. Based on closing stock prices as of September 1, 2016.
4. Based on reported fully-diluted shares.
5. Multiples based on forw ard-looking financial information for DENSO Corporation, Motorcar Parts of America, Inc. and Modine Manufacturing Company have been calendarized to the Company’s fiscal year-end
of December 31. All other companies show n have December 31 fiscal year-ends.
Adjusted EBITDAP refers to Earnings Before Interest, Taxes, Depreciation, Amortization and Pension (and OPEB) Expense, adjusted for certain non-recurring items.
CY refers to Calendar Year.
E refers to Estimated.
LTM refers to Latest 12 Months.
NA refers to Not Available.
Source: Bloomberg, Capital IQ, public filings.
CONFIDENTIAL—PRELIMINARY DRAFT—SUBJECT TO FURTHER REVIEW 15
|
|

Preliminary Consolidated Discounted Cash Flow Analysis
Perpetuity Growth Rate (Pension-Adjusted)
(dollars in millions) Terminal
Fiscal Year Ending December 31,Value
2016E¹2017E2018E2019E2020E Assumptions?Implied 2020E Adjusted
Revenue $3,681$7,914$8,297$8,593$8,973$8,973EBITDAP Terminal Multiple?
Revenue Growth % 1.1%5.5%4.8%3.6%4.4%—Discount Rate1.75%2.00%2.25%
Less: Cost of Goods Sold 3,0876,5966,8667,1317,4347,4349.75%5.7x5.9x6.1x
Less: Selling, General and Administrative Expenses 41486688690191391810.25%5.3x5.5x5.7x
Less: Restructuring Expense 14361518251510.75%5.0x5.2x5.4x
Less: Other Operating Expense 416572737272
Add: Depreciation & Amortization Expense 193384404426425430
Add: Earnings in Non-consolidated JVs Attributable to Piston 24 6067687070
Less: EBITDA in Consolidated JVs Attributable to Minority Interests 11 2629323434
Add: Pension (and OPEB) Expense 377171656161
EBITDAP $368$840$971$997$1,052$1,061
Less: Depreciation and Amortization Expense 193384404426425430PV of Terminal Value
EBITP $175$456$567$571$627$631as a % of Enterprise Value
Less: Taxes² 3591113114125126Discount Rate1.75%2.00%2.25%
Unlevered Earnings $140$365$454$457$501$5059.75%76.5%77.1%77.7%
Add: Depreciation and Amortization Expense 19338440442642543010.25%75.3%75.8%76.5%
Add: Non-cash Restructuring Expense 14361518251510.75%74.0%74.6%75.2%
Less: Restructuring Payments 575321252515
Less: Capital Expenditures 239419409430430430
Less: Change in Net Working Capital (63)173476032
Add: Cash Flow from Non-consolidated JVs³ (24)(14)(17)(18)(19)0
Unlevered Free Cash Flows $90$282$391$421$417$473
PV ofPV of Terminal Value
Cash FlowsBased on Perpetual Growth Rate forImplied Enterprise Value
2016E—2020E2020E Unlevered Free Cash Flow
Discount Rate 1.75%2.00%2.25%1.75%2.00%2.25%
9.75% 0.098 $1,295$4,214$4,360$4,517$5,508$5,655$5,811
10.25% 0.103 $1,282+$3,897$4,025$4,161=$5,179$5,307$5,443
10.75% 0.108 $1,269$3,618$3,730$3,849$4,887$4,999$5,118
Note: Present values as of September 1, 2016; mid-year convention applied. Refer to WACC calculation in Appendix for derivation of discount rate.
1. Represents 6.0-month stub period. Calculated as FY 2016 estimated figures, per Company management, less 1H 2016 actual figures, per Company public filings.
2. Tax at 20.0%, per Company management.
3. Represents difference betw een earnings in non-consolidated JVs and dividends received from non-consolidated JVs.
4. Terminal value assumptions include: (i) depreciation and amortization expense equal to capital expenditures, (ii) normalized w orking capital levels for Pow ertrain and Motorparts based on approximately 20% of change in revenue, per Company
management, (iii) non-consolidated JV earnings equal to dividends, per Company management, and (iv) normalized restructuring expense at $15 million, per Company management.
5. Implied from corresponding discount rate and perpetual grow th rate applied to 2020E unlevered free cash flow . Show n for informational purposes.
EBITDAP refers to Earnings Before Interest, Taxes, Depreciation, Amortization and Pension (and OPEB) Expense.
EBITP refers to Earnings Before Interest, Taxes and Pension (and OPEB) Expense.
Source: Piston management, including projections prepared by Piston management.
CONFIDENTIAL—PRELIMINARY DRAFT—SUBJECT TO FURTHER REVIEW 16
|
|
Page
1. Executive Summary 3
2. Preliminary Financial Analyses 9
3. Selected Public Market Observations 17
4. Appendix 22
5. Disclaimer 54
|
|
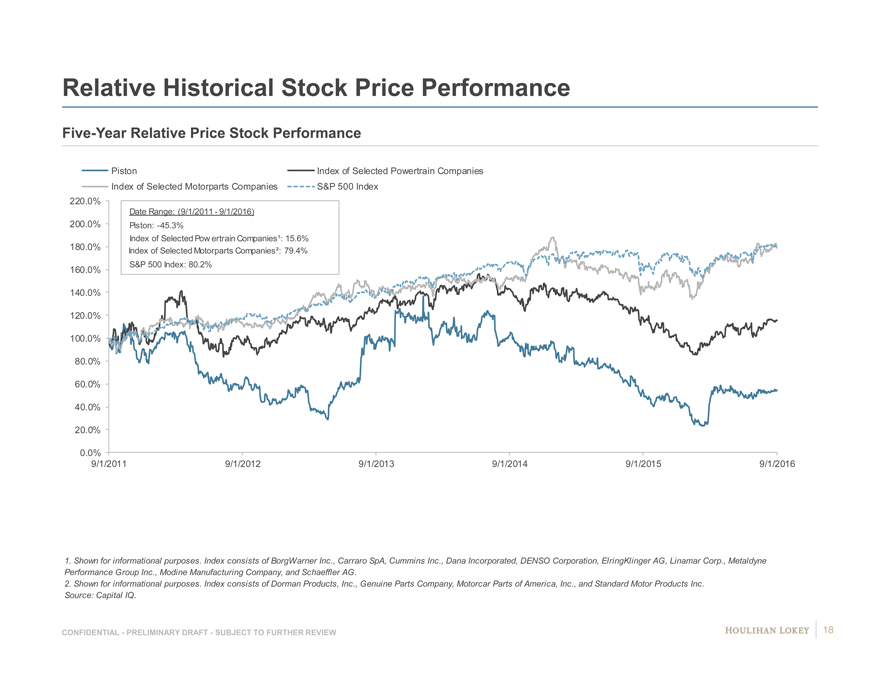
Relative Historical Stock Price Performance
Five-Year Relative Price Stock Performance
Piston Index of Selected Powertrain Companies Index of Selected Motorparts Companies S&P 500 Index 220.0%
Date Range: (9/1/2011—9/1/2016) 200.0% Piston: -45.3%
180.0% Index of Selected Pow ertrain Companies¹: 15.6% Index of Selected Motorparts Companies²: 79.4% S&P 500 Index: 80.2%
160.0% 140.0% 120.0% 100.0%
80.0%
60.0%
40.0%
20.0%
0.0%
9/1/2011 9/1/2012 9/1/2013 9/1/2014 9/1/2015 9/1/2016
1. Shown for informational purposes. Index consists of BorgWarner Inc., Carraro SpA, Cummins Inc., Dana Incorporated, DENSO Corporation, ElringKlinger AG, Linamar Corp., Metaldyne Performance Group Inc., Modine Manufacturing Company, and Schaeffler AG.
2. Shown for informational purposes. Index consists of Dorman Products, Inc., Genuine Parts Company, Motorcar Parts of America, Inc., and Standard Motor Products Inc.
Source: Capital IQ.
CONFIDENTIAL—PRELIMINARY DRAFT—SUBJECT TO FURTHER REVIEW 18
|
|
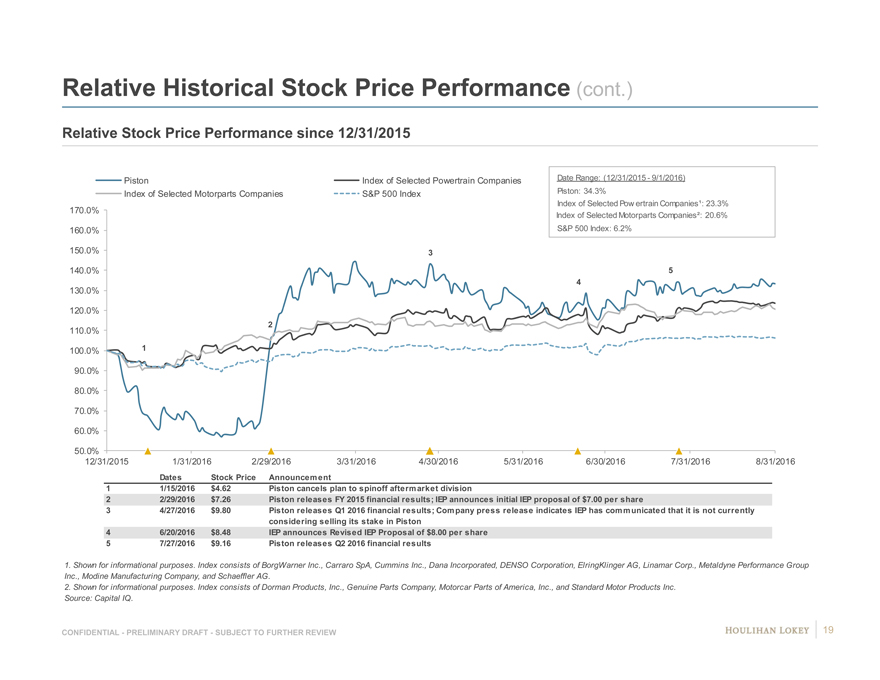
Relative Historical Stock Price Performance (cont.)
Relative Stock Price Performance since 12/31/2015
Piston Index of Selected Powertrain Companies Date Range: (12/31/2015—9/1/2016) Index of Selected Motorparts Companies S&P 500 Index Piston: 34.3%
Index of Selected Pow ertrain Companies¹: 23.3%
170.0%
Index of Selected Motorparts Companies²: 20.6% 160.0% S&P 500 Index: 6.2%
150.0% 3
140.0% 5 4
130.0%
120.0%
2
110.0%
100.0% 1 90.0%
80.0% 70.0% 60.0%
50.0%
12/31/2015 1/31/2016 2/29/2016 3/31/2016 4/30/2016 5/31/2016 6/30/2016 7/31/2016 8/31/2016
Dates Stock Price Announcement
1 1/15/2016 $4.62 Piston cancels plan to spinoff aftermarket division
2 2/29/2016 $7.26 Piston releases FY 2015 financial results; IEP announces initial IEP proposal of $7.00 per share
3 4/27/2016 $9.80 Piston releases Q1 2016 financial results; Company press release indicates IEP has communicated that it is not currently considering selling its stake in Piston
4 6/20/2016 $8.48 IEP announces Revised IEP Proposal of $8.00 per share
5 7/27/2016 $9.16 Piston releases Q2 2016 financial results
1. Shown for informational purposes. Index consists of BorgWarner Inc., Carraro SpA, Cummins Inc., Dana Incorporated, DENSO Corporation, ElringKlinger AG, Linamar Corp., Metaldyne Performance Group Inc., Modine Manufacturing Company, and Schaeffler AG.
2. Shown for informational purposes. Index consists of Dorman Products, Inc., Genuine Parts Company, Motorcar Parts of America, Inc., and Standard Motor Products Inc.
Source: Capital IQ.
CONFIDENTIAL—PRELIMINARY DRAFT—SUBJECT TO FURTHER REVIEW 19
|
|

Five-Year Relative EV/EBITDA Multiples (Informational)
Five-Year
Piston 2/26/2016Current¹Average
Index of Selected Powertrain Companies Piston6.0x6.6x6.9x
Index of Selected Motorparts Companies
Index of Selected Pow ertrain Companies²5.6x5.8x6.7x
EV/EBITDA
LTM Multiple Index of Selected Motorparts Companies³10.8x12.4x10.5x
15.0x
14.0x
13.0x
12.0x
11.0x
10.0x
9.0x
8.0x
7.0x
6.0x
5.0x
4.0x
3.0x
9/1/2011 9/1/2012 9/1/20139/1/20149/1/20159/1/2016
Note: Similar data on an EBITDAP basis may show a different relationship for Piston relative to selected companies. Shown for informational purposes.
Note: Multiples shown above are sourced from Capital IQ; as such, certain multiples may differ slightly from figures shown on other pages due to differences in EBITDA adjustments.
1. As of September 1, 2016.
2. Represents median EV/EBITDA multiple of selected companies: BorgWarner Inc., Carraro SpA, Cummins Inc., Dana Holding Corporation, DENSO Corporation, ElringKlinger AG, Linamar
Corp., Metaldyne Performance Group Inc., Modine Manufacturing Company, and Schaeffler AG.
3. Represents median EV/EBITDA multiple of selected companies: Dorman Products, Inc., Genuine Parts Company, Motorcar Parts of America, Inc., and Standard Motor Products Inc.
EBITDA refers to Earnings Before Interest, Taxes, Depreciation & Amortization.
EV refers to Enterprise Value.
Source: Capital IQ.
CONFIDENTIAL—PRELIMINARY DRAFT—SUBJECT TO FURTHER REVIEW 20
|
|
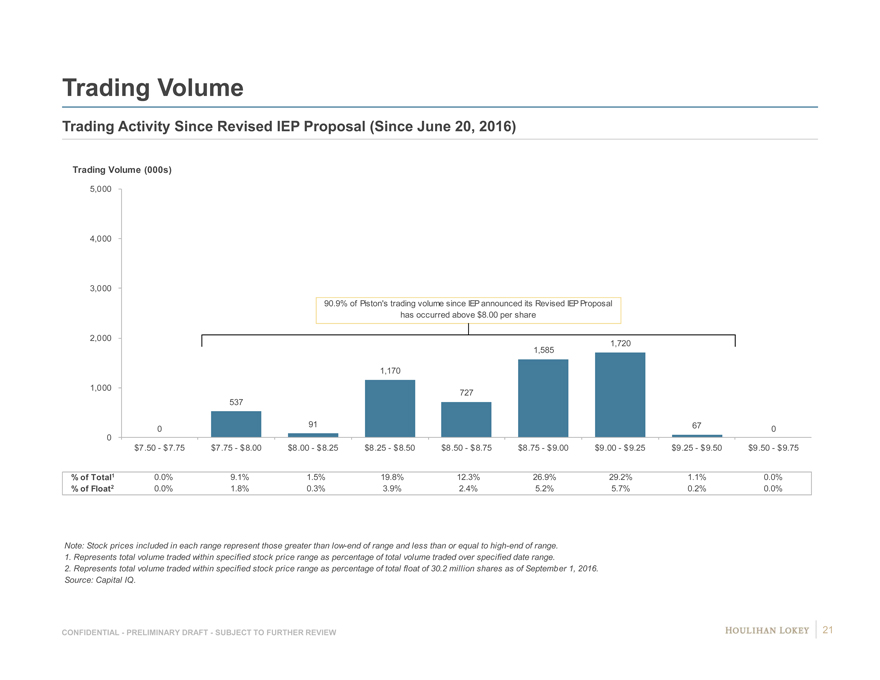
Trading Volume
Trading Activity Since Revised IEP Proposal (Since June 20, 2016)
Trading Volume (000s)
5,000
4,000
3,000
90.9% of Piston’s trading volume since IEP announced its Revised IEP Proposal
has occurred above $8.00 per share
2,000 1,720
1,585
1,170
1,000 727
537
0 91670
0
$7 .50—$7.75 $7.75—$8.00$8.00—$8.25$8.25—$8.50$8.50—$8.75$8.75—$9.00$9.00—$9.25$9.25—$9.50$9.50—$9.75
% of Total1 0.0% 9.1%1.5%19.8%12.3%26.9%29.2%1.1%0.0%
% of Float2 0.0% 1.8%0.3%3.9%2.4%5.2%5.7%0.2%0.0%
Note: Stock prices included in each range represent those greater than low-end of range and less than or equal to high-end of range.
1. Represents total volume traded within specified stock price range as percentage of total volume traded over specified date range.
2. Represents total volume traded within specified stock price range as percentage of total float of 30.2 million shares as of September 1, 2016.
Source: Capital IQ.
CONFIDENTIAL—PRELIMINARY DRAFT—SUBJECT TO FURTHER REVIEW 21
|
|
Page
1. Executive Summary 3
2. Preliminary Financial Analyses 9
3. Selected Public Market Observations 17
4. Appendix 22 Company Financial Update 23 Cost of Capital Considerations 26 Selected Companies—Operating Statistics 32 Company Financial Performance Observations 36 Implied Premiums Paid Observations 39 Illustrative Preliminary Financial Analyses (EBITDA) 42
5. Disclaimer 54
|
|
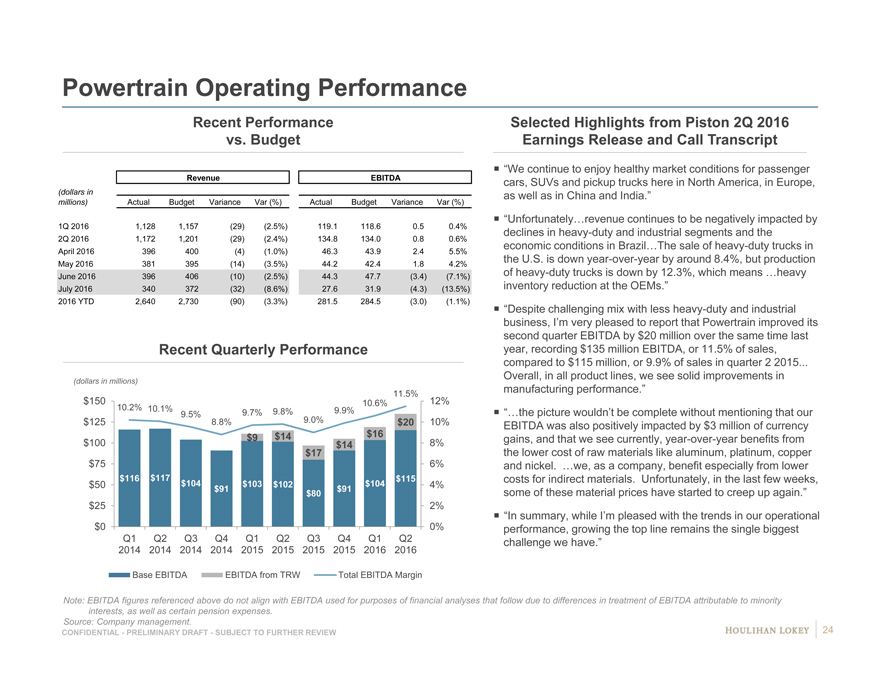
Powertrain Operating Performance
Recent Performance vs. Budget
Revenue EBITDA
(dollars in millions) Actual Budget Variance Var (%) Actual Budget Variance Var (%)
1Q 2016 1,128 1,157 (29) (2.5%) 119.1 118.6 0.5 0.4%
2Q 2016 1,172 1,201 (29) (2.4%) 134.8 134.0 0.8 0.6% April 2016 396 400 (4) (1.0%) 46.3 43.9 2.4 5.5% May 2016 381 395 (14) (3.5%) 44.2 42.4 1.8 4.2% June 2016 396 406 (10) (2.5%) 44.3 47.7 (3.4) (7.1%) July 2016 340 372 (32) (8.6%) 27.6 31.9 (4.3) (13.5%) 2016 YTD 2,640 2,730 (90) (3.3%) 281.5 284.5 (3.0) (1.1%)
Recent Quarterly Performance
(dollars in millions)
11.5% $150 10.6% 12%
10.2% 10.1% 9.9% 9.5% 9.7% 9.8% 9.0% $125 8.8% $20 10% $100 $9 $14 $16 8% $14 $17
$75 6% $116 $117 $115
$50 $104 $103 $102 $104 4%
$91 $91 $80
$25 2%
$0 0% Q1 Q2 Q3 Q4 Q1 Q2 Q3 Q4 Q1 Q2 2014 2014 2014 2014 2015 2015 2015 2015 2016 2016
Base EBITDA EBITDA from TRW Total EBITDA Margin
Selected Highlights from Piston 2Q 2016 Earnings Release and Call Transcript
? “We continue to enjoy healthy market conditions for passenger cars, SUVs and pickup trucks here in North America, in Europe, as well as in China and India.”
? “Unfortunately…revenue continues to be negatively impacted by declines in heavy-duty and industrial segments and the economic conditions in Brazil…The sale of heavy-duty trucks in the U.S. is down year-over-year by around 8.4%, but production of heavy-duty trucks is down by 12.3%, which means …heavy inventory reduction at the OEMs.”
? “Despite challenging mix with less heavy-duty and industrial business, I’m very pleased to report that Powertrain improved its second quarter EBITDA by $20 million over the same time last year, recording $135 million EBITDA, or 11.5% of sales, compared to $115 million, or 9.9% of sales in quarter 2 2015...
Overall, in all product lines, we see solid improvements in manufacturing performance.”
? “…the picture wouldn’t be complete without mentioning that our EBITDA was also positively impacted by $3 million of currency gains, and that we see currently, year-over-year benefits from the lower cost of raw materials like aluminum, platinum, copper and nickel. …we, as a company, benefit especially from lower costs for indirect materials. Unfortunately, in the last few weeks, some of these material prices have started to creep up again.”
? “In summary, while I’m pleased with the trends in our operational performance, growing the top line remains the single biggest challenge we have.”
Note: EBITDA figures referenced above do not align with EBITDA used for purposes of financial analyses that follow due to differences in treatment of EBITDA attributable to minority interests, as well as certain pension expenses.
Source: Company management. 24
CONFIDENTIAL—PRELIMINARY DRAFT—SUBJECT TO FURTHER REVIEW
|
|
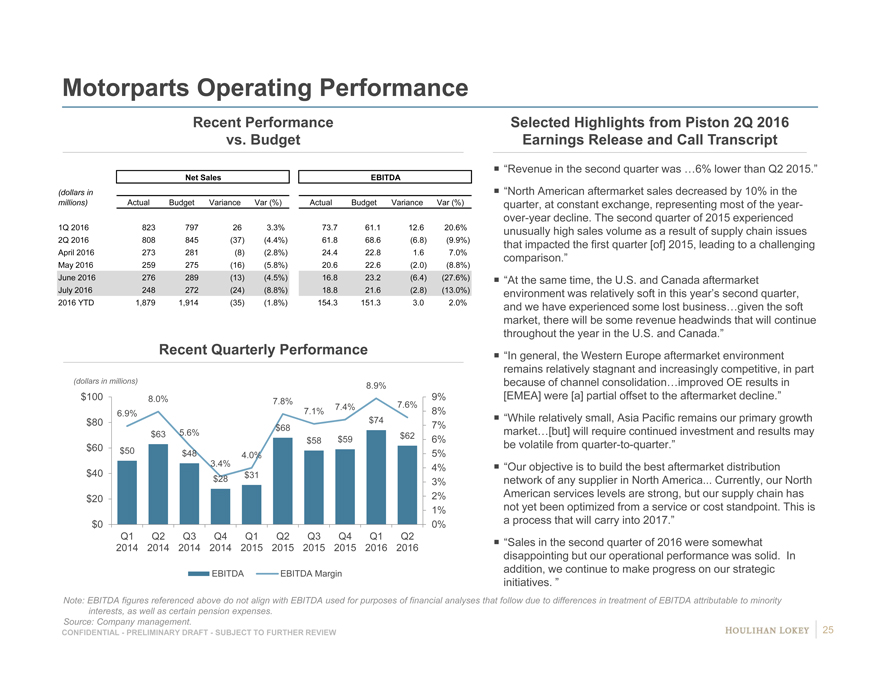
Motorparts Operating Performance
Recent Performance
vs. Budget
Net SalesEBITDA
(dollars in
millions) Actual Budget Variance Var (%)ActualBudgetVariance Var (%)
1Q 2016 823797263.3%73.761.112.620.6%
2Q 2016 808845(37)(4.4%)61.868.6(6.8)(9.9%)
April 2016 273281(8)(2.8%)24.422.81.67.0%
May 2016 259275(16)(5.8%)20.622.6(2.0)(8.8%)
June 2016 276289(13)(4.5%)16.823.2(6.4)(27.6%)
July 2016 248272(24)(8.8%)18.821.6(2.8)(13.0%)
2016 YTD 1,8791,914(35)(1.8%)154.3151.33.02.0%
Recent Quarterly Performance
(dollars in millions) 8.9%
$100 8.0%7.8%9%
7.4%7.6%
6.9% 7.1%8%
$80 $747%
$68
$635.6%$58$59$626%
$60 $50 $484.0%5%
3.4%4%
$40 $28 $31
3%
$20 2%
1%
$0 0%
Q1 Q2Q3Q4Q1Q2Q3Q4Q1Q2
2014 2014 20142014 201520152015201520162016
EBITDAEBITDA Margin
Selected Highlights from Piston 2Q 2016 Earnings Release and Call Transcript
? “Revenue in the second quarter was …6% lower than Q2 2015.”? “North American aftermarket sales decreased by 10% in the quarter, at constant exchange, representing most of the year-over-year decline. The second quarter of 2015 experienced unusually high sales volume as a result of supply chain issues that impacted the first quarter [of] 2015, leading to a challenging comparison.”? “At the same time, the U.S. and Canada aftermarket environment was relatively soft in this year’s second quarter, and we have experienced some lost business…given the soft market, there will be some revenue headwinds that will continue throughout the year in the U.S. and Canada.” ? “In general, the Western Europe aftermarket environment remains relatively stagnant and increasingly competitive, in part because of channel consolidation…improved OE results in [EMEA] were [a] partial offset to the aftermarket decline.” ? “While relatively small, Asia Pacific remains our primary growth market…[but] will require continued investment and results may be volatile from quarter-to-quarter.” ? “Our objective is to build the best aftermarket distribution network of any supplier in North America... Currently, our North American services levels are strong, but our supply chain has not yet been optimized from a service or cost standpoint. This is a process that will carry into 2017.”? “Sales in the second quarter of 2016 were somewhat disappointing but our operational performance was solid. In addition, we continue to make progress on our strategic initiatives. ”
Note: EBITDA figures referenced above do not align with EBITDA used for purposes of financial analyses that follow due to differences in treatment of EBITDA attributable to minority interests, as well as certain pension expenses.
Source: Company management. 25
CONFIDENTIAL—PRELIMINARY DRAFT—SUBJECT TO FURTHER REVIEW
|
|
Page
1. Executive Summary 3
2. Preliminary Financial Analyses 9
3. Selected Public Market Observations 17
4. Appendix 22 Company Financial Update 23 Cost of Capital Considerations 26 Selected Companies—Operating Statistics 32 Company Financial Performance Observations 36 Implied Premiums Paid Observations 39 Illustrative Preliminary Financial Analyses (EBITDA) 42
5. Disclaimer 54
|
|
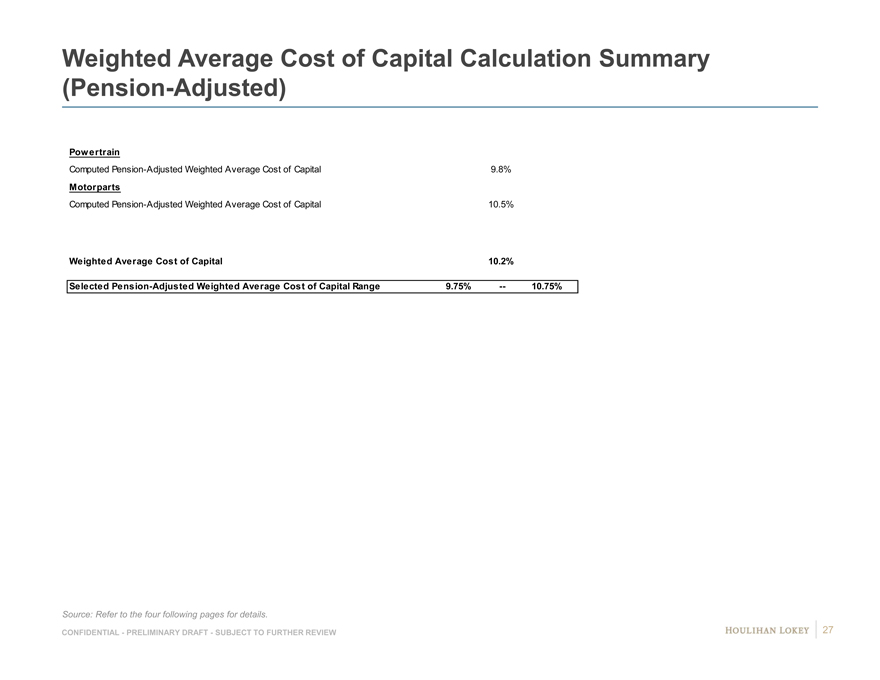
Weighted Average Cost of Capital Calculation Summary (Pension-Adjusted)
Powertrain
Computed Pension-Adjusted Weighted Average Cost of Capital 9.8%
Motorparts
Computed Pension-Adjusted Weighted Average Cost of Capital 10.5%
Weighted Average Cost of Capital 10.2%
Selected Pension-Adjusted Weighted Average Cost of Capital Range 9.75% — 10.75%
Source: Refer to the four following pages for details.
CONFIDENTIAL—PRELIMINARY DRAFT—SUBJECT TO FURTHER REVIEW 27
|
|
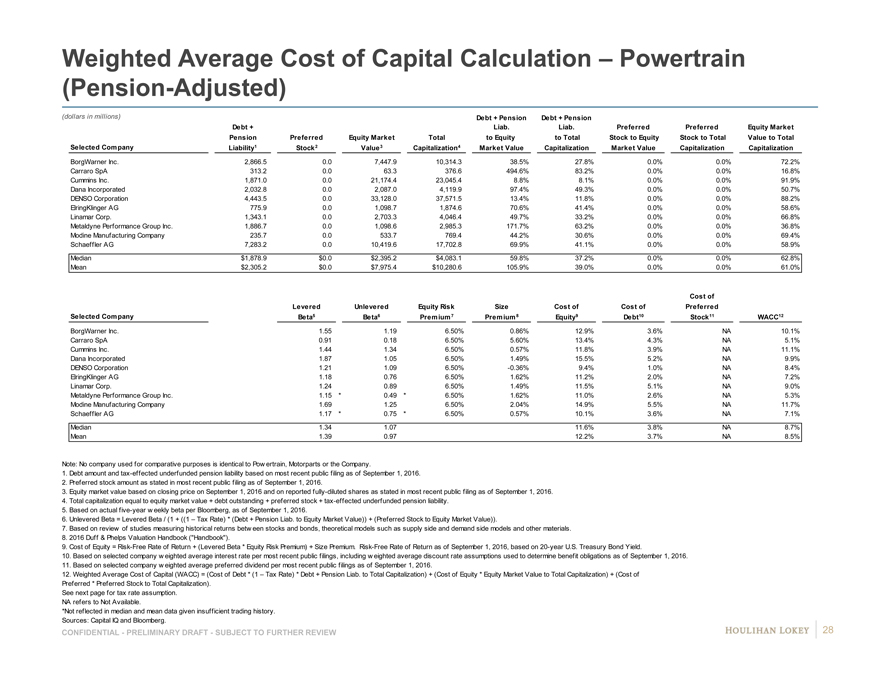
Weighted Average Cost of Capital Calculation – Powertrain
(Pension-Adjusted)
(dollars in millions) Debt + PensionDebt + Pension
Debt + Liab.Liab.PreferredPreferredEquity Market
Pension PreferredEquity MarketTotalto Equityto TotalStock to EquityStock to TotalValue to Total
Selected Company Liability1 Stock2Value3Capitalization4Market ValueCapitalizationMarket ValueCapitalizationCapitalization
BorgWarner Inc. 2,866.5#0.0#7,447.9#10,314.3#38.5% #27.8% #0.0% #0.0%#72.2%#
Carraro SpA 313.2#0.0#63.3#376.6#494.6% #83.2% #0.0% #0.0%#16.8%#
Cummins Inc. 1,871.0#0.0#21,174.4#23,045.4#8.8% #8.1% #0.0% #0.0%#91.9%#
Dana Incorporated 2,032.8#0.0#2,087.0#4,119.9#97.4% #49.3% #0.0% #0.0%#50.7%#
DENSO Corporation 4,443.5#0.0#33,128.0#37,571.5#13.4% #11.8% #0.0% #0.0%#88.2%#
ElringKlinger AG 775.9#0.0#1,098.7#1,874.6#70.6% #41.4% #0.0% #0.0%#58.6%#
Linamar Corp. 1,343.1#0.0#2,703.3#4,046.4#49.7% #33.2% #0.0% #0.0%#66.8%#
Metaldyne Performance Group Inc. 1,886.7#0.0#1,098.6#2,985.3#171.7% #63.2% #0.0% #0.0%#36.8%#
Modine Manufacturing Company 235.7#0.0#533.7#769.4#44.2% #30.6% #0.0% #0.0%#69.4%#
Schaeffler AG 7,283.2#0.0#10,419.6#17,702.8#69.9% #41.1% #0.0% #0.0%#58.9%#
Median $1,878.9$0.0$2,395.2$4,083.159.8%37.2%0.0%0.0%62.8%
Mean $2,305.2$0.0$7,975.4$10,280.6105.9%39.0%0.0%0.0%61.0%
Cost of
LeveredUnleveredEquity RiskSizeCost ofCost ofPreferred
Selected Company Beta5Beta6Premium 7Premium 8Equity9Debt10Stock11WACC12
BorgWarner Inc. 1.55#1.19#6.50%0.86%12.9% #3.6% #NA#10.1%0
Carraro SpA 0.91#0.18#6.50%5.60%13.4% #4.3% #NA#5.1%0
Cummins Inc. 1.44#1.34#6.50%0.57%11.8% #3.9% #NA#11.1%0
Dana Incorporated 1.87#1.05#6.50%1.49%15.5% #5.2% #NA#9.9%0
DENSO Corporation 1.21#1.09#6.50%-0.36%9.4% #1.0% #NA#8.4%0
ElringKlinger AG 1.18#0.76#6.50%1.62%11.2% #2.0% #NA#7.2%0
Linamar Corp. 1.24#0.89#6.50%1.49%11.5% #5.1% #NA#9.0%0
Metaldyne Performance Group Inc. 1.15*0.49*6.50%1.62%11.0% #2.6% #NA#5.3%0
Modine Manufacturing Company 1.69#1.25#6.50%2.04%14.9% #5.5% #NA#11.7%0
Schaeffler AG 1.17*0.75*6.50%0.57%10.1% #3.6% #NA#7.1%0
Median 1.341.0711.6%3.8%NA8.7%
Mean 1.390.9712.2%3.7%NA8.5%
Note: No company used for comparative purposes is identical to Pow ertrain, Motorparts or the Company.
1. Debt amount and tax-effected underfunded pension liability based on most recent public filing as of September 1, 2016.
2. Preferred stock amount as stated in most recent public filing as of September 1, 2016.
3. Equity market value based on closing price on September 1, 2016 and on reported fully-diluted shares as stated in most recent public filing as of September 1, 2016.
4. Total capitalization equal to equity market value + debt outstanding + preferred stock + tax-effected underfunded pension liability.
5. Based on actual five-year w eekly beta per Bloomberg, as of September 1, 2016.
6. Unlevered Beta = Levered Beta / (1 + ((1 – Tax Rate) * (Debt + Pension Liab. to Equity Market Value)) + (Preferred Stock to Equity Market Value)).
7. Based on review of studies measuring historical returns betw een stocks and bonds, theoretical models such as supply side and demand side models and other materials.
8. 2016 Duff & Phelps Valuation Handbook (“Handbook”).
9. Cost of Equity = Risk-Free Rate of Return + (Levered Beta * Equity Risk Premium) + Size Premium. Risk-Free Rate of Return as of September 1, 2016, based on 20-year U.S. Treasury Bond Yield.
10. Based on selected company w eighted average interest rate per most recent public filings, including w eighted average discount rate assumptions used to determine benefit obligations as of September 1, 2016.
11. Based on selected company w eighted average preferred dividend per most recent public filings as of September 1, 2016.
12. Weighted Average Cost of Capital (WACC) = (Cost of Debt * (1 – Tax Rate) * Debt + Pension Liab. to Total Capitalization) + (Cost of Equity * Equity Market Value to Total Capitalization) + (Cost of
Preferred * Preferred Stock to Total Capitalization).
See next page for tax rate assumption.
NA refers to Not Available.
*Not reflected in median and mean data given insufficient trading history.
Sources: Capital IQ and Bloomberg.
CONFIDENTIAL—PRELIMINARY DRAFT—SUBJECT TO FURTHER REVIEW 28
|
|
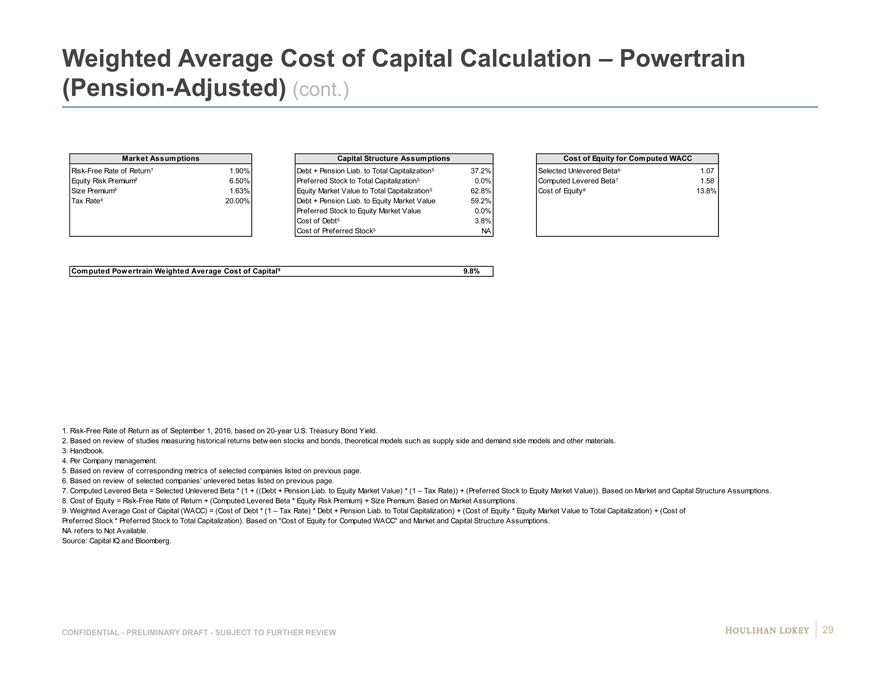
Weighted Average Cost of Capital Calculation – Powertrain
(Pension-Adjusted) (cont.)
Market Assumptions Capital Structure AssumptionsCost of Equity for Computed WACC
Risk-Free Rate of Return¹ 1.90% Debt + Pension Liab. to Total Capitalization 37.2%Selected Unlevered Beta 1.07
Equity Risk Premium² 6.50% Preferred Stock to Total Capitalization 0.0%Computed Levered Beta 1.58
Size Premium³ 1.63%Equity Market Value to Total Capitalization 62.8%Cost of Equity 13.8%
Tax Rate 20.00%Debt + Pension Liab. to Equity Market Value59.2%
Preferred Stock to Equity Market Value0.0%
Cost of Debt 3.8%
Cost of Preferred Stock NA
Computed Powertrain Weighted Average Cost of Capital 9.8%
1. Risk-Free Rate of Return as of September 1, 2016, based on 20-year U.S. Treasury Bond Yield.
2. Based on review of studies measuring historical returns betw een stocks and bonds, theoretical models such as supply side and demand side models and other materials.
3. Handbook.
4. Per Company management.
5. Based on review of corresponding metrics of selected companies listed on previous page.
6. Based on review of selected companies’ unlevered betas listed on previous page.
7. Computed Levered Beta = Selected Unlevered Beta * (1 + ((Debt + Pension Liab. to Equity Market Value) * (1 – Tax Rate)) + (Preferred Stock to Equity Market Value)). Based on Market and Capital Structure Assumptions.
8. Cost of Equity = Risk-Free Rate of Return + (Computed Levered Beta * Equity Risk Premium) + Size Premium. Based on Market Assumptions.
9. Weighted Average Cost of Capital (WACC) = (Cost of Debt * (1 – Tax Rate) * Debt + Pension Liab. to Total Capitalization) + (Cost of Equity * Equity Market Value to Total Capitalization) + (Cost of
Preferred Stock * Preferred Stock to Total Capitalization). Based on “Cost of Equity for Computed WACC” and Market and Capital Structure Assumptions.
NA refers to Not Available.
Source: Capital IQ and Bloomberg.
CONFIDENTIAL—PRELIMINARY DRAFT—SUBJECT TO FURTHER REVIEW 29
|
|
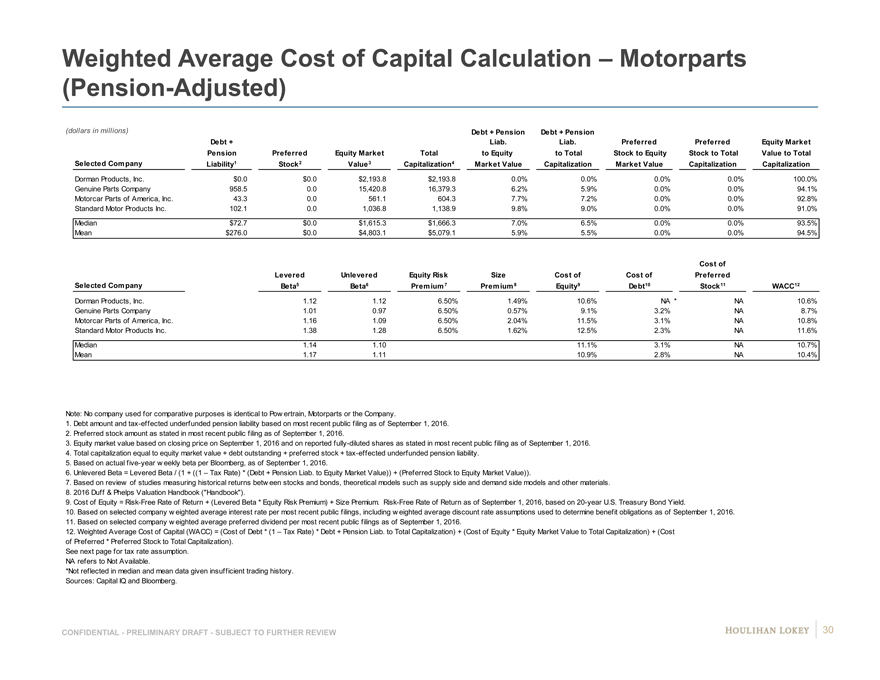
Weighted Average Cost of Capital Calculation – Motorparts
(Pension-Adjusted)
(dollars in millions) Debt + PensionDebt + Pension
Debt + Liab.Liab.PreferredPreferredEquity Market
Pension PreferredEquity MarketTotalto Equityto TotalStock to EquityStock to TotalValue to Total
Selected Company Liability1 Stock2Value3Capitalization4Market ValueCapitalizationMarket ValueCapitalizationCapitalization
Dorman Products, Inc. $0.0 #$0.0#$2,193.8#$2,193.8#0.0% #0.0%#0.0%#0.0% #100.0%#
Genuine Parts Company 958.5 #0.0#15,420.8#16,379.3#6.2% #5.9%#0.0%#0.0% #94.1%#
Motorcar Parts of America, Inc. 43.3 #0.0#561.1#604.3#7.7% #7.2%#0.0%#0.0% #92.8%#
Standard Motor Products Inc. 102.1 #0.0#1,036.8#1,138.9#9.8% #9.0%#0.0%#0.0% #91.0%#
Median $72.7 $0.0$1,615.3$1,666.37.0%6.5%0.0%0.0%93.5%
Mean $276.0 $0.0$4,803.1$5,079.15.9%5.5%0.0%0.0%94.5%
Cost of
LeveredUnleveredEquity RiskSizeCost ofCost ofPreferred
Selected Company Beta5Beta6Premium 7Premium 8Equity9Debt10Stock11WACC12
Dorman Products, Inc. 1.12#1.12#6.50%1.49%10.6%#NA *NA#10.6%0
Genuine Parts Company 1.01#0.97#6.50%0.57%9.1%#3.2%#NA#8.7%0
Motorcar Parts of America, Inc. 1.16#1.09#6.50%2.04%11.5%#3.1%#NA#10.8%0
Standard Motor Products Inc. 1.38#1.28#6.50%1.62%12.5%#2.3%#NA#11.6%0
Median 1.141.1011.1%3.1%NA10.7%
Mean 1.171.1110.9%2.8%NA10.4%
Note: No company used for comparative purposes is identical to Pow ertrain, Motorparts or the Company.
1. Debt amount and tax-effected underfunded pension liability based on most recent public filing as of September 1, 2016.
2. Preferred stock amount as stated in most recent public filing as of September 1, 2016.
3. Equity market value based on closing price on September 1, 2016 and on reported fully-diluted shares as stated in most recent public filing as of September 1, 2016.
4. Total capitalization equal to equity market value + debt outstanding + preferred stock + tax-effected underfunded pension liability.
5. Based on actual five-year w eekly beta per Bloomberg, as of September 1, 2016.
6. Unlevered Beta = Levered Beta / (1 + ((1 – Tax Rate) * (Debt + Pension Liab. to Equity Market Value)) + (Preferred Stock to Equity Market Value)).
7. Based on review of studies measuring historical returns betw een stocks and bonds, theoretical models such as supply side and demand side models and other materials.
8. 2016 Duff & Phelps Valuation Handbook (“Handbook”).
9. Cost of Equity = Risk-Free Rate of Return + (Levered Beta * Equity Risk Premium) + Size Premium. Risk-Free Rate of Return as of September 1, 2016, based on 20-year U.S. Treasury Bond Yield.
10. Based on selected company w eighted average interest rate per most recent public filings, including w eighted average discount rate assumptions used to determine benefit obligations as of September 1, 2016.
11. Based on selected company w eighted average preferred dividend per most recent public filings as of September 1, 2016.
12. Weighted Average Cost of Capital (WACC) = (Cost of Debt * (1 – Tax Rate) * Debt + Pension Liab. to Total Capitalization) + (Cost of Equity * Equity Market Value to Total Capitalization) + (Cost
of Preferred * Preferred Stock to Total Capitalization).
See next page for tax rate assumption.
NA refers to Not Available.
*Not reflected in median and mean data given insufficient trading history.
Sources: Capital IQ and Bloomberg.
CONFIDENTIAL—PRELIMINARY DRAFT—SUBJECT TO FURTHER REVIEW 30
|
|

Weighted Average Cost of Capital Calculation – Motorparts
(Pension-Adjusted) (cont.)
Market Assumptions Capital Structure AssumptionsCost of Equity for Computed WACC
Risk-Free Rate of Return¹ 1.90% Debt + Pension Liab. to Total Capitalization 6.5%Selected Unlevered Beta 1.10
Equity Risk Premium² 6.50% Preferred Stock to Total Capitalization 0.0%Computed Levered Beta 1.17
Size Premium³ 1.63%Equity Market Value to Total Capitalization 93.5%Cost of Equity 11.1%
Tax Rate 20.00%Debt + Pension Liab. to Equity Market Value7.0%
Preferred Stock to Equity Market Value0.0%
Cost of Debt 3.1%
Cost of Preferred Stock NA
Computed Motorparts Weighted Average Cost of Capital 10.5%
1. Risk-Free Rate of Return as of September 1, 2016, based on 20-year U.S. Treasury Bond Yield.
2. Based on review of studies measuring historical returns betw een stocks and bonds, theoretical models such as supply side and demand side models and other materials.
3. Handbook.
4. Per Company management.
5. Based on review of corresponding metrics of selected companies listed on previous page.
6. Based on review of selected companies’ unlevered betas listed on previous page.
7. Computed Levered Beta = Selected Unlevered Beta * (1 + ((Debt + Pension Liab. to Equity Market Value) * (1 – Tax Rate)) + (Preferred Stock to Equity Market Value)). Based on Market and Capital Structure Assumptions.
8. Cost of Equity = Risk-Free Rate of Return + (Computed Levered Beta * Equity Risk Premium) + Size Premium. Based on Market Assumptions.
9. Weighted Average Cost of Capital (WACC) = (Cost of Debt * (1 – Tax Rate) * Debt + Pension Liab. to Total Capitalization) + (Cost of Equity * Equity Market Value to Total Capitalization) + (Cost of
Preferred Stock * Preferred Stock to Total Capitalization). Based on “Cost of Equity for Computed WACC” and Market and Capital Structure Assumptions.
NA refers to Not Available.
Source: Capital IQ and Bloomberg.
CONFIDENTIAL—PRELIMINARY DRAFT—SUBJECT TO FURTHER REVIEW 31
|
|
Page
1. Executive Summary 3
2. Preliminary Financial Analyses 9
3. Selected Public Market Observations 17
4. Appendix 22
Company Financial Update 23
Cost of Capital Considerations 26
Selected Companies—Operating Statistics 32
Company Financial Performance Observations 36
Implied Premiums Paid Observations 39
Illustrative Preliminary Financial Analyses (EBITDA) 42
5. Disclaimer 54
|
|
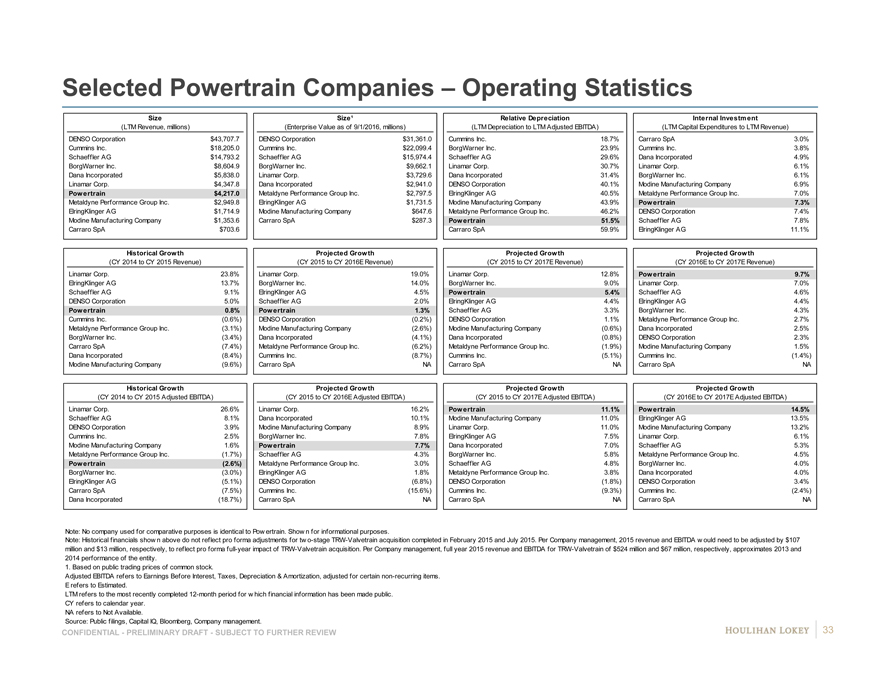
Selected Powertrain Companies – Operating Statistics
Size Size¹Relative DepreciationInternal Investment
(LTM Revenue, millions) (Enterprise Value as of 9/1/2016, millions)(LTM Depreciation to LTM Adjusted EBITDA)(LTM Capital Expenditures to LTM Revenue)
DENSO Corporation $43,707.7 DENSO Corporation$31,361.0Cummins Inc.18.7%Carraro SpA3.0%
Cummins Inc. $18,205.0 Cummins Inc.$22,099.4BorgWarner Inc.23.9%Cummins Inc.3.8%
Schaeffler AG $14,793.2 Schaeffler AG$15,974.4Schaeffler AG29.6%Dana Incorporated4.9%
BorgWarner Inc. $8,604.9 BorgWarner Inc.$9,662.1Linamar Corp.30.7%Linamar Corp.6.1%
Dana Incorporated $5,838.0 Linamar Corp.$3,729.6Dana Incorporated31.4%BorgWarner Inc.6.1%
Linamar Corp. $4,347.8 Dana Incorporated$2,941.0DENSO Corporation40.1%Modine Manufacturing Company6.9%
Powertrain $4,217.0 Metaldyne Performance Group Inc.$2,797.5ElringKlinger AG40.5%Metaldyne Performance Group Inc.7.0%
Metaldyne Performance Group Inc. $2,949.8 ElringKlinger AG$1,731.5Modine Manufacturing Company43.9%Powertrain7.3%
ElringKlinger AG $1,714.9 Modine Manufacturing Company$647.6Metaldyne Performance Group Inc.46.2%DENSO Corporation7.4%
Modine Manufacturing Company $1,353.6 Carraro SpA$287.3Powertrain51.5%Schaeffler AG7.8%
Carraro SpA $703.6 Carraro SpA59.9%ElringKlinger AG11.1%
Historical Growth Projected GrowthProjected GrowthProjected Growth
(CY 2014 to CY 2015 Revenue) (CY 2015 to CY 2016E Revenue)(CY 2015 to CY 2017E Revenue)(CY 2016E to CY 2017E Revenue)
Linamar Corp. 23.8% Linamar Corp.19.0%Linamar Corp.12.8%Powertrain9.7%
ElringKlinger AG 13.7% BorgWarner Inc.14.0%BorgWarner Inc.9.0%Linamar Corp.7.0%
Schaeffler AG 9.1% ElringKlinger AG4.5%Powertrain5.4%Schaeffler AG4.6%
DENSO Corporation 5.0% Schaeffler AG2.0%ElringKlinger AG4.4%ElringKlinger AG4.4%
Powertrain 0.8% Powertrain1.3%Schaeffler AG3.3%BorgWarner Inc.4.3%
Cummins Inc. (0.6%) DENSO Corporation(0.2%)DENSO Corporation1.1%Metaldyne Performance Group Inc.2.7%
Metaldyne Performance Group Inc. (3.1%) Modine Manufacturing Company(2.6%)Modine Manufacturing Company(0.6%)Dana Incorporated2.5%
BorgWarner Inc. (3.4%) Dana Incorporated(4.1%)Dana Incorporated(0.8%)DENSO Corporation2.3%
Carraro SpA (7.4%) Metaldyne Performance Group Inc.(6.2%)Metaldyne Performance Group Inc.(1.9%)Modine Manufacturing Company1.5%
Dana Incorporated (8.4%) Cummins Inc.(8.7%)Cummins Inc.(5.1%)Cummins Inc.(1.4%)
Modine Manufacturing Company (9.6%) Carraro SpANACarraro SpANACarraro SpANA
Historical Growth Projected GrowthProjected GrowthProjected Growth
(CY 2014 to CY 2015 Adjusted EBITDA) (CY 2015 to CY 2016E Adjusted EBITDA) (CY 2015 to CY 2017E Adjusted EBITDA)(CY 2016E to CY 2017E Adjusted EBITDA)
Linamar Corp. 26.6% Linamar Corp.16.2%Powertrain11.1%Powertrain14.5%
Schaeffler AG 8.1% Dana Incorporated10.1%Modine Manufacturing Company11.0%ElringKlinger AG13.5%
DENSO Corporation 3.9% Modine Manufacturing Company8.9%Linamar Corp.11.0%Modine Manufacturing Company13.2%
Cummins Inc. 2.5% BorgWarner Inc.7.8%ElringKlinger AG7.5%Linamar Corp.6.1%
Modine Manufacturing Company 1.6% Powertrain7.7%Dana Incorporated7.0%Schaeffler AG5.3%
Metaldyne Performance Group Inc. (1.7%) Schaeffler AG4.3%BorgWarner Inc.5.8%Metaldyne Performance Group Inc.4.5%
Powertrain (2.6%) Metaldyne Performance Group Inc.3.0%Schaeffler AG4.8%BorgWarner Inc.4.0%
BorgWarner Inc. (3.0%) ElringKlinger AG1.8%Metaldyne Performance Group Inc.3.8%Dana Incorporated4.0%
ElringKlinger AG (5.1%) DENSO Corporation(6.8%)DENSO Corporation(1.8%)DENSO Corporation3.4%
Carraro SpA (7.5%) Cummins Inc.(15.6%)Cummins Inc.(9.3%)Cummins Inc.(2.4%)
Dana Incorporated (18.7%) Carraro SpANACarraro SpANACarraro SpANA
Note: No company used for comparative purposes is identical to Pow ertrain. Show n for informational purposes.
Note: Historical financials show n above do not reflect pro forma adjustments for tw o-stage TRW-Valvetrain acquisition completed in February 2015 and July 2015. Per Company management, 2015 revenue and EBITDA w ould need to be adjusted by $107
million and $13 million, respectively, to reflect pro forma full-year impact of TRW-Valvetrain acquisition. Per Company management, full year 2015 revenue and EBITDA for TRW-Valvetrain of $524 million and $67 million, respectively, approximates 2013 and
2014 performance of the entity.
1. Based on public trading prices of common stock.
Adjusted EBITDA refers to Earnings Before Interest, Taxes, Depreciation & Amortization, adjusted for certain non-recurring items.
E refers to Estimated.
LTM refers to the most recently completed 12-month period for w hich financial information has been made public.
CY refers to calendar year.
NA refers to Not Available.
Source: Public filings, Capital IQ, Bloomberg, Company management.
CONFIDENTIAL—PRELIMINARY DRAFT—SUBJECT TO FURTHER REVIEW 33
|
|

Selected Powertrain Companies – Operating Statistics (cont.)
Pension Pension¹PensionTax²
(LTM Pension Expense to LTM Adjusted EBITDAP) (Adjusted Pension Liability to Adjusted Enterprise Value) (LTM Pension Expense to Adjusted Pension Liability)(3-Year Average Effective Tax Rate)
DENSO Corporation 13.3% Carraro SpA0.0%DENSO Corporation59.5%Powertrain20.0%
Powertrain 11.1% Cummins Inc.0.0%BorgWarner Inc.16.1%Linamar Corp.23.5%
Schaeffler AG 4.7% Linamar Corp.0.0%Schaeffler AG11.1%DENSO Corporation25.9%
ElringKlinger AG 3.4% Metaldyne Performance Group Inc.0.8%ElringKlinger AG8.9%ElringKlinger AG26.2%
Modine Manufacturing Company 3.0% BorgWarner Inc.2.3%Modine Manufacturing Company5.6%Cummins Inc.27.0%
Cummins Inc. 2.5% DENSO Corporation4.5%Metaldyne Performance Group Inc.4.2%BorgWarner Inc.28.4%
BorgWarner Inc. 2.4% ElringKlinger AG5.4%Dana Incorporated(0.3%)Dana Incorporated31.5%
Metaldyne Performance Group Inc. 0.2% Schaeffler AG6.9%Carraro SpANAMetaldyne Performance Group Inc.32.7%
Linamar Corp. 0.0% Modine Manufacturing Company9.0%Cummins Inc.NASchaeffler AG44.4%
Carraro SpA 0.0% Dana Incorporated11.0%Linamar Corp.NAModine Manufacturing Company46.1%
Dana Incorporated (0.2%) PowertrainNACarraro SpANMF
Profitability ProfitabilityProfitabilityProfitability
(LTM Adjusted EBITDA to LTM Revenue) (CY 2016E Adjusted EBITDA to CY 2016E Revenue)(CY 2017E Adjusted EBITDA to CY 2017E Revenue)(LTM Free Cash Flow Conversion)
Schaeffler AG 18.1% Schaeffler AG18.1%Metaldyne Performance Group Inc.18.3%Cummins Inc.75.2%
Linamar Corp. 17.7% Metaldyne Performance Group Inc.18.0%Schaeffler AG18.3%Linamar Corp.65.6%
BorgWarner Inc. 17.3% Linamar Corp.17.2%Linamar Corp.17.0%BorgWarner Inc.64.5%
Metaldyne Performance Group Inc. 16.5% BorgWarner Inc.16.5%BorgWarner Inc.16.5%Metaldyne Performance Group Inc.57.8%
Cummins Inc. 15.2% ElringKlinger AG14.8%ElringKlinger AG16.1%Schaeffler AG56.7%
ElringKlinger AG 14.7% Cummins Inc.14.2%Cummins Inc.14.1%Carraro SpA54.3%
DENSO Corporation 13.1% DENSO Corporation12.6%DENSO Corporation12.8%Dana Incorporated48.5%
Powertrain 10.1% Dana Incorporated11.1%Dana Incorporated11.2%DENSO Corporation43.4%
Dana Incorporated 9.5% Powertrain10.2%Powertrain10.7%Powertrain27.2%
Modine Manufacturing Company 8.5% Modine Manufacturing Company8.9%Modine Manufacturing Company10.0%ElringKlinger AG24.0%
Carraro SpA 6.7% Carraro SpANACarraro SpANAModine Manufacturing Company18.8%
Profitability ProfitabilityProfitabilityProfitability
(LTM Adjusted FCF to LTM Revenue) (CY 2016E Adjusted FCF to CY 2016E Revenue)(CY 2017E Adjusted FCF to CY 2017E Revenue)(3-Year Average Free Cash Flow Conversion)
Linamar Corp. 11.6% Metaldyne Performance Group Inc.10.9%Metaldyne Performance Group Inc.11.3%Cummins Inc.74.1%
Cummins Inc. 11.4% BorgWarner Inc.10.9%BorgWarner Inc.10.7%Dana Incorporated65.1%
BorgWarner Inc. 11.1% Cummins Inc.10.6%Schaeffler AG10.6%Schaeffler AG64.6%
Schaeffler AG 10.3% Schaeffler AG10.5%Cummins Inc.10.3%Metaldyne Performance Group Inc.62.8%
Metaldyne Performance Group Inc. 9.5% Linamar Corp.9.8%Linamar Corp.8.0%BorgWarner Inc.62.1%
DENSO Corporation 5.7% Dana Incorporated5.4%ElringKlinger AG6.6%Linamar Corp.60.9%
Dana Incorporated 4.6% DENSO Corporation5.0%Dana Incorporated6.1%Carraro SpA49.8%
Carraro SpA 3.6% ElringKlinger AG3.6%DENSO Corporation5.6%DENSO Corporation43.4%
ElringKlinger AG 3.5% Modine Manufacturing Company3.4%Modine Manufacturing Company5.0%ElringKlinger AG37.8%
Powertrain 2.7% Powertrain3.2%Powertrain4.4%Modine Manufacturing Company29.6%
Modine Manufacturing Company 1.6% Carraro SpANACarraro SpANAPowertrain29.0%
Note: No company used for comparative purposes is identical to Pow ertrain. Show n for informational purposes.
Note: Historical financials show n above do not reflect pro forma adjustments for tw o-stage TRW-Valvetrain acquisition completed in February 2015 and July 2015. Per Company management, 2015 revenue and EBITDA w ould need to be adjusted by $107
million and $13 million, respectively, to reflect pro forma full-year impact of TRW-Valvetrain acquisition. Per Company management, full year 2015 revenue and EBITDA for TRW-Valvetrain of $524 million and $67 million, respectively, approximates 2013 and
2014 performance of the entity.
1. Based on public trading prices of common stock.
2. Piston’s projected tax rate is 20.0%.
Adjusted EBITDA refers to Earnings Before Interest, Taxes, Depreciation & Amortization, adjusted for certain non-recurring items.
Adjusted EBITDAP refers to Earnings Before Interest, Taxes, Depreciation, Amortization and Pension (and OPEB) Expense, adjusted for certain non-recurring items.
Adjusted FCF refers to Adjusted Free Cash Flow , w hich is represented as Adjusted EBITDA less Capital Expenditures.
E refers to Estimated.
LTM refers to the most recently completed 12-month period for w hich financial information has been made public.
CY refers to calendar year.
NA refers to Not Available.
Source: Public filings, Capital IQ, Bloomberg, Company management.
CONFIDENTIAL—PRELIMINARY DRAFT—SUBJECT TO FURTHER REVIEW 34
|
|
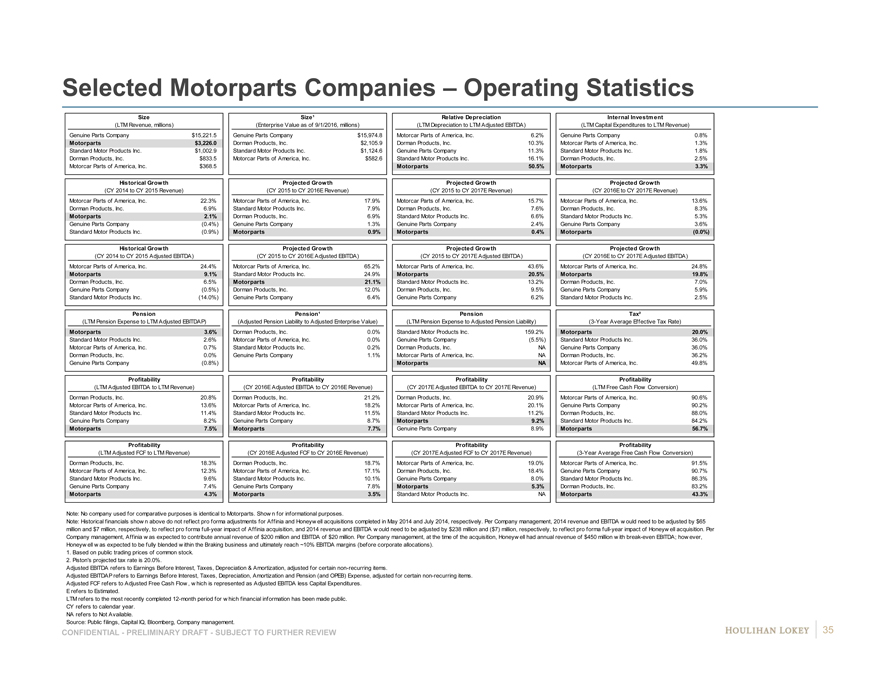
Selected Motorparts Companies – Operating Statistics
Size Size¹Relative DepreciationInternal Investment
(LTM Revenue, millions) (Enterprise Value as of 9/1/2016, millions)(LTM Depreciation to LTM Adjusted EBITDA)(LTM Capital Expenditures to LTM Revenue)
Genuine Parts Company $15,221.5 Genuine Parts Company$15,974.8Motorcar Parts of America, Inc.6.2%Genuine Parts Company0.8%
Motorparts $3,226.0 Dorman Products, Inc.$2,105.9Dorman Products, Inc.10.3%Motorcar Parts of America, Inc.1.3%
Standard Motor Products Inc. $1,002.9 Standard Motor Products Inc.$1,124.6Genuine Parts Company11.3%Standard Motor Products Inc.1.8%
Dorman Products, Inc. $833.5 Motorcar Parts of America, Inc.$582.6Standard Motor Products Inc.16.1%Dorman Products, Inc.2.5%
Motorcar Parts of America, Inc. $368.5 ##########Motorparts50.5%Motorparts3.3%
Historical Growth Projected GrowthProjected GrowthProjected Growth
(CY 2014 to CY 2015 Revenue) (CY 2015 to CY 2016E Revenue)(CY 2015 to CY 2017E Revenue)(CY 2016E to CY 2017E Revenue)
Motorcar Parts of America, Inc. 22.3% Motorcar Parts of America, Inc.17.9%Motorcar Parts of America, Inc.15.7%Motorcar Parts of America, Inc.13.6%
Dorman Products, Inc. 6.9% Standard Motor Products Inc.7.9%Dorman Products, Inc.7.6%Dorman Products, Inc.8.3%
Motorparts 2.1% Dorman Products, Inc.6.9%Standard Motor Products Inc.6.6%Standard Motor Products Inc.5.3%
Genuine Parts Company (0.4%) Genuine Parts Company1.3%Genuine Parts Company2.4%Genuine Parts Company3.6%
Standard Motor Products Inc. (0.9%) Motorparts0.9%Motorparts0.4%Motorparts(0.0%)
Historical Growth Projected GrowthProjected GrowthProjected Growth
(CY 2014 to CY 2015 Adjusted EBITDA) (CY 2015 to CY 2016E Adjusted EBITDA) (CY 2015 to CY 2017E Adjusted EBITDA)(CY 2016E to CY 2017E Adjusted EBITDA)
Motorcar Parts of America, Inc. 24.4% Motorcar Parts of America, Inc.65.2%Motorcar Parts of America, Inc.43.6%Motorcar Parts of America, Inc.24.8%
Motorparts 9.1% Standard Motor Products Inc.24.9%Motorparts20.5%Motorparts19.8%
Dorman Products, Inc. 6.5% Motorparts21.1%Standard Motor Products Inc.13.2%Dorman Products, Inc.7.0%
Genuine Parts Company (0.5%) Dorman Products, Inc.12.0%Dorman Products, Inc.9.5%Genuine Parts Company5.9%
Standard Motor Products Inc. (14.0%) Genuine Parts Company6.4%Genuine Parts Company6.2%Standard Motor Products Inc.2.5%
Pension Pension¹PensionTax²
(LTM Pension Expense to LTM Adjusted EBITDAP) (Adjusted Pension Liability to Adjusted Enterprise Value) (LTM Pension Expense to Adjusted Pension Liability)(3-Year Average Effective Tax Rate)
Motorparts 3.6% Dorman Products, Inc.0.0%Standard Motor Products Inc.159.2%Motorparts20.0%
Standard Motor Products Inc. 2.6% Motorcar Parts of America, Inc.0.0%Genuine Parts Company(5.5%)Standard Motor Products Inc.36.0%
Motorcar Parts of America, Inc. 0.7% Standard Motor Products Inc.0.2%Dorman Products, Inc.NAGenuine Parts Company36.0%
Dorman Products, Inc. 0.0% Genuine Parts Company1.1%Motorcar Parts of America, Inc.NADorman Products, Inc.36.2%
Genuine Parts Company (0.8%) MotorpartsNAMotorcar Parts of America, Inc.49.8%
Profitability ProfitabilityProfitabilityProfitability
(LTM Adjusted EBITDA to LTM Revenue) (CY 2016E Adjusted EBITDA to CY 2016E Revenue) (CY 2017E Adjusted EBITDA to CY 2017E Revenue)(LTM Free Cash Flow Conversion)
Dorman Products, Inc. 20.8% Dorman Products, Inc.21.2%Dorman Products, Inc.20.9%Motorcar Parts of America, Inc.90.6%
Motorcar Parts of America, Inc. 13.6% Motorcar Parts of America, Inc.18.2%Motorcar Parts of America, Inc.20.1%Genuine Parts Company90.2%
Standard Motor Products Inc. 11.4% Standard Motor Products Inc.11.5%Standard Motor Products Inc.11.2%Dorman Products, Inc.88.0%
Genuine Parts Company 8.2% Genuine Parts Company8.7%Motorparts9.2%Standard Motor Products Inc.84.2%
Motorparts 7.5% Motorparts7.7%Genuine Parts Company8.9%Motorparts56.7%
Profitability ProfitabilityProfitabilityProfitability
(LTM Adjusted FCF to LTM Revenue) (CY 2016E Adjusted FCF to CY 2016E Revenue)(CY 2017E Adjusted FCF to CY 2017E Revenue)(3-Year Average Free Cash Flow Conversion)
Dorman Products, Inc. 18.3% Dorman Products, Inc.18.7%Motorcar Parts of America, Inc.19.0%Motorcar Parts of America, Inc.91.5%
Motorcar Parts of America, Inc. 12.3% Motorcar Parts of America, Inc.17.1%Dorman Products, Inc.18.4%Genuine Parts Company90.7%
Standard Motor Products Inc. 9.6% Standard Motor Products Inc.10.1%Genuine Parts Company8.0%Standard Motor Products Inc.86.3%
Genuine Parts Company 7.4% Genuine Parts Company7.8%Motorparts5.3%Dorman Products, Inc.83.2%
Motorparts 4.3% Motorparts3.5%Standard Motor Products Inc.NAMotorparts43.3%
Note: No company used for comparative purposes is identical to Motorparts. Show n for informational purposes.
Note: Historical financials show n above do not reflect pro forma adjustments for Affinia and Honeyw ell acquisitions completed in May 2014 and July 2014, respectively. Per Company management, 2014 revenue and EBITDA w ould need to be adjusted by $65
million and $7 million, respectively, to reflect pro forma full-year impact of Affinia acquisition, and 2014 revenue and EBITDA w ould need to be adjusted by $238 million and ($7) million, respectively, to reflect pro forma full-year impact of Honeyw ell acquisition. Per
Company management, Affinia w as expected to contribute annual revenue of $200 million and EBITDA of $20 million. Per Company management, at the time of the acquisition, Honeyw ell had annual revenue of $450 million w ith break-even EBITDA; how ever,
Honeyw ell w as expected to be fully blended w ithin the Braking business and ultimately reach ~10% EBITDA margins (before corporate allocations).
1. Based on public trading prices of common stock.
2. Piston’s projected tax rate is 20.0%.
Adjusted EBITDA refers to Earnings Before Interest, Taxes, Depreciation & Amortization, adjusted for certain non-recurring items.
Adjusted EBITDAP refers to Earnings Before Interest, Taxes, Depreciation, Amortization and Pension (and OPEB) Expense, adjusted for certain non-recurring items.
Adjusted FCF refers to Adjusted Free Cash Flow , w hich is represented as Adjusted EBITDA less Capital Expenditures.
E refers to Estimated.
LTM refers to the most recently completed 12-month period for w hich financial information has been made public.
CY refers to calendar year.
NA refers to Not Available.
Source: Public filings, Capital IQ, Bloomberg, Company management.
CONFIDENTIAL—PRELIMINARY DRAFT—SUBJECT TO FURTHER REVIEW 35
|
|
Page
1. Executive Summary 3
2. Preliminary Financial Analyses 9
3. Selected Public Market Observations 17
4. Appendix 22
Company Financial Update 23
Cost of Capital Considerations 26
Selected Companies—Operating Statistics 32
Company Financial Performance Observations 36
Implied Premiums Paid Observations 39
Illustrative Preliminary Financial Analyses (EBITDA) 42
5. Disclaimer 54
|
|

Company Historical Budget vs. Actual Performance
The tables below illustrate the financial performance of the Company relative to the budget prepared by the Company’s management in each of the
last two fiscal years.
In order to facilitate a “true” comparison to the budget, the actual performance figures below exclude the impact of acquisitions announced in the
same year (i.e., 2014 budget and actual performance exclude impact of Honeywell and Affinia in the case of Motorparts, and 2015 budget and
actual performance exclude the impact of TRW/Valvetrain in the case of Powertrain).
20142015
(dollars in millions) ActualBudgetVarianceActualBudgetVariance
Powertrain
Revenue 4,4304,3332.2%4,0334,552-11.4%
EBITDA 431438-1.6%374476-21.4%
EBITDA Margin 9.7%10.1%-0.4%9.3%10.5%-1.2%
Motorparts
Revenue 2,8602,935-2.6%3,2533,556-8.5%
EBITDA 188230-18.3%216280-22.9%
EBITDA Margin 6.6%7.8%-1.3%6.6%7.9%-1.2%
Note: 2014 figures for Motorparts exclude impact of Affinia and Honeywell acquisitions.
2015 figures for Powertrain exclude impact of TRW Valvetrain acquisition.
Source: Company management.
CONFIDENTIAL—PRELIMINARY DRAFT—SUBJECT TO FURTHER REVIEW 37
|
|

Historical and Projected Restructuring Activity
The table below shows historical and projected restructuring payments by segment, as well as consolidated restructuring expense.
(dollars in millions) 2008A-2016E-
2015A2020E
2008A 2009A2010A 2011A2012A2013A2014A2015A2016E 2017E 2018E2019E 2020EAvg.Avg.
Restructuring
Powertrain Restructuring Payments $27$17$7$13$27$35$39$2$6$10$15$21$14
Motorparts Restructuring Payments $8$3$6$10$25$24$42$51$15$15$10$13$27
Consolidated Restructuring Payments $40 $94$36$21$15$23$52$59$81$53$21$25$25$43$41
Consolidated Restructuring Expense $132 $32$8$5$26$21$86$89$35$36$15$18$25$50$26
Source: Public filings, Company management.
CONFIDENTIAL—PRELIMINARY DRAFT—SUBJECT TO FURTHER REVIEW 38
|
|
Page
1. Executive Summary 3
2. Preliminary Financial Analyses 9
3. Selected Public Market Observations 17
4. Appendix 22
Company Financial Update 23
Cost of Capital Considerations 26
Selected Companies—Operating Statistics 32
Company Financial Performance Observations 36
Implied Premiums Paid Observations 39
Illustrative Preliminary Financial Analyses (EBITDA) 42
5. Disclaimer 54
|
|
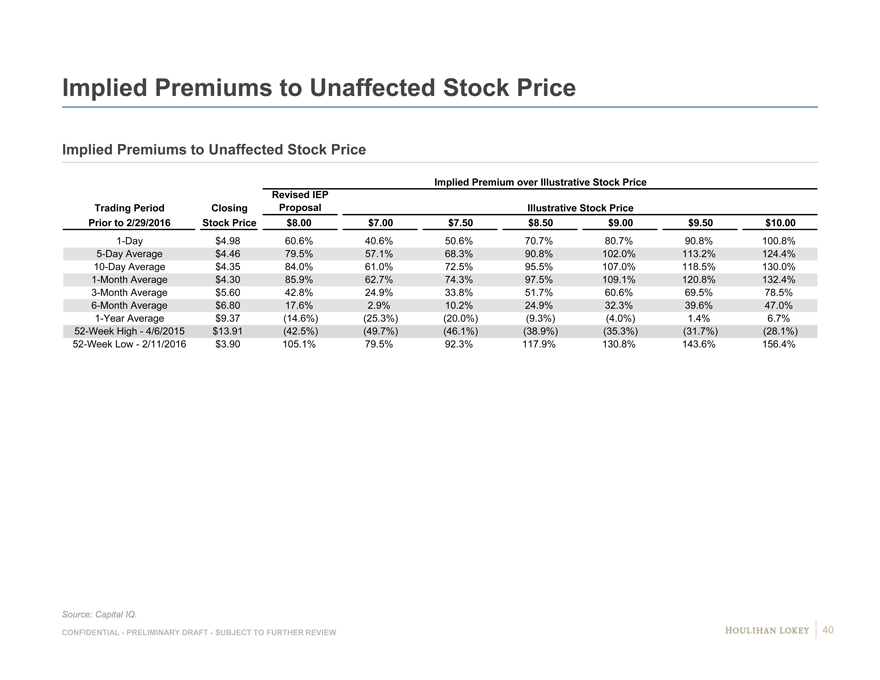
Implied Premiums to Unaffected Stock Price
Implied Premiums to Unaffected Stock Price
Implied Premium over Illustrative Stock Price
Revised IEP
Trading Period Closing ProposalIllustrative Stock Price
Prior to 2/29/2016 Stock Price $8.00$7.00$7.50$8.50$9.00$9.50$10.00
1-Day $4.98 60.6%40.6%50.6%70.7%80.7%90.8%100.8%
5-Day Average $4.46 79.5%57.1%68.3%90.8%102.0%113.2%124.4%
10-Day Average $4.35 84.0%61.0%72.5%95.5%107.0%118.5%130.0%
1-Month Average $4.30 85.9%62.7%74.3%97.5%109.1%120.8%132.4%
3-Month Average $5.60 42.8%24.9%33.8%51.7%60.6%69.5%78.5%
6-Month Average $6.80 17.6%2.9%10.2%24.9%32.3%39.6%47.0%
1-Year Average $9.37 (14.6%)(25.3%)(20.0%)(9.3%)(4.0%)1.4%6.7%
52-Week High—4/6/2015 $13.91 (42.5%)(49.7%)(46.1%)(38.9%)(35.3%)(31.7%)(28.1%)
52-Week Low—2/11/2016 $3.90 105.1%79.5%92.3%117.9%130.8%143.6%156.4%
Source: Capital IQ.
CONFIDENTIAL—PRELIMINARY DRAFT—SUBJECT TO FURTHER REVIEW 40
|
|
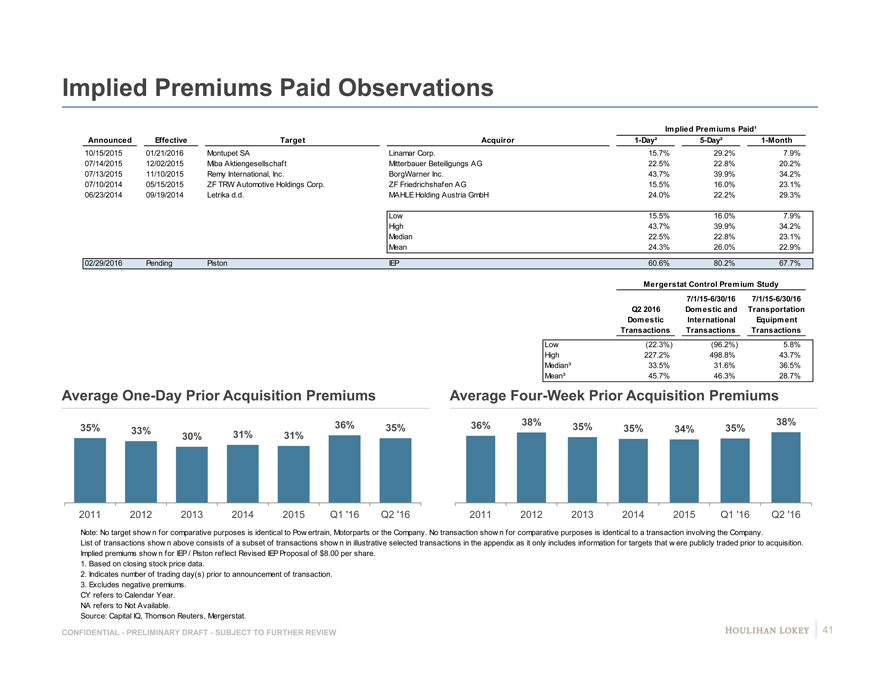
Implied Premiums Paid Observations
Implied Premiums Paid¹
Announced Effective TargetAcquiror1-Day²5-Day²1-Month
10/15/2015 01/21/2016 Montupet SALinamar Corp.15.7%#29.2%#7.9%#
07/14/2015 12/02/2015 Miba AktiengesellschaftMitterbauer Beteiligungs AG22.5%#22.8%#20.2%#
07/13/2015 11/10/2015 Remy International, Inc.BorgWarner Inc.43.7%#39.9%#34.2%#
07/10/2014 05/15/2015 ZF TRW Automotive Holdings Corp.ZF Friedrichshafen AG15.5%#16.0%#23.1%#
06/23/2014 09/19/2014 Letrika d.d.MAHLE Holding Austria GmbH24.0%#22.2%#29.3%#
Low15.5%16.0%7.9%
High43.7%39.9%34.2%
Median22.5%22.8%23.1%
Mean24.3%26.0%22.9%
02/29/2016 Pending PistonIEP60.6%80.2%67.7%
Mergerstat Control Premium Study
7/1/15-6/30/167/1/15-6/30/16
Q2 2016Domestic andTransportation
Domestic ic International al Equipment
TransactionsTransactionsTransactions
Low(22.3%) #(96.2%) #5.8%
High227.2%#498.8%#43.7%
Median³33.5%#31.6%#36.5%
Mean³45.7%#46.3%#28.7%
Average One-Day Prior Acquisition Premiums Average Four-Week Prior Acquisition Premiums
35% 33% 36%35%36%38%35%35%34%35%38%
30%31%31%
2011 2012 201320142015Q1 ‘16Q2 ‘1620112012201320142015Q1 ‘16Q2 ‘16
Note: No target show n for comparative purposes is identical to Pow ertrain, Motorparts or the Company. No transaction show n for comparative purposes is identical to a transaction involving the Company.
List of transactions show n above consists of a subset of transactions show n in illustrative selected transactions in the appendix as it only includes information for targets that w ere publicly traded prior to acquisition.
Implied premiums show n for IEP / Piston reflect Revised IEP Proposal of $8.00 per share.
1. Based on closing stock price data.
2. Indicates number of trading day(s) prior to announcement of transaction.
3. Excludes negative premiums.
CY refers to Calendar Year.
NA refers to Not Available.
Source: Capital IQ, Thomson Reuters, Mergerstat.
CONFIDENTIAL—PRELIMINARY DRAFT—SUBJECT TO FURTHER REVIEW 41
|
|
Page
1. Executive Summary 3
2. Preliminary Financial Analyses 9
3. Selected Public Market Observations 17
4. Appendix 22 Company Financial Update 23 Cost of Capital Considerations 26 Selected Companies—Operating Statistics 32 Company Financial Performance Observations 36 Implied Premiums Paid Observations 39 Illustrative Preliminary Financial Analyses (EBITDA) 42
5. Disclaimer 54
|
|
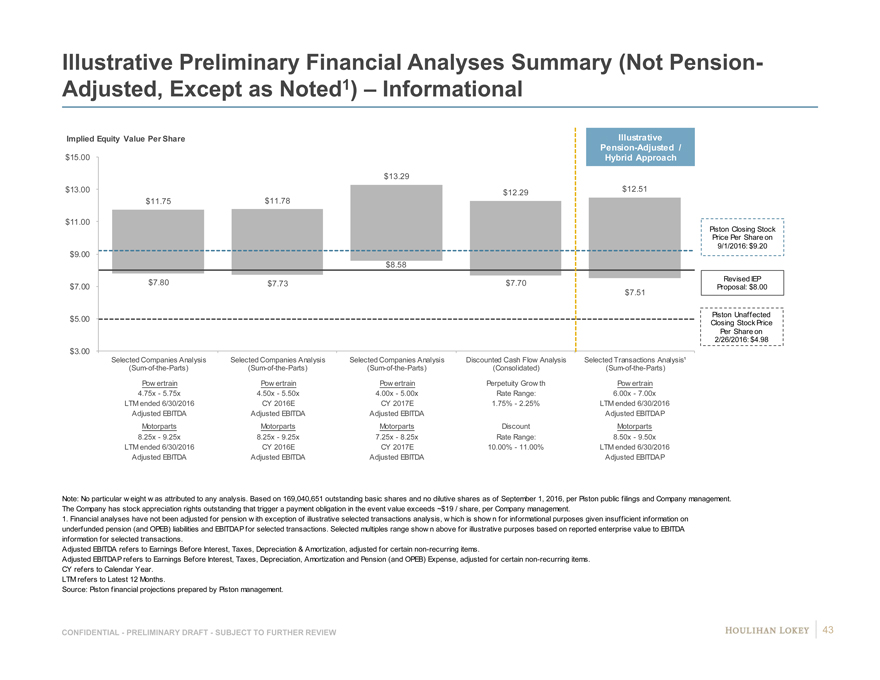
Illustrative Preliminary Financial Analyses Summary (Not Pension-
Adjusted, Except as Noted1) – Informational
Implied Equity Value Per Share Illustrative
Pension-Adjusted /
$15.00 Hybrid Approach
$13.29
$13.00 $12.29$12.51
$11.75 $11.78
$11.00
Piston Closing Stock
Price Per Share on
9/1/2016: $9.20
$9.00
$8.58
$7.80 $7.73 $7.70Revised IEP
$7.00 Proposal: $8.00
$7.51
Piston Unaffected
$5.00 Closing Stock Price
Per Share on
2/26/2016: $4.98
$3.00
Selected Companies Analysis Selected Companies Analysis Selected Companies AnalysisDiscounted Cash Flow AnalysisSelected Transactions Analysis¹
(Sum-of-the-Parts) (Sum-of-the-Parts) (Sum-of-the-Parts)(Consolidated)(Sum-of-the-Parts)
Pow ertrain Pow ertrain Pow ertrainPerpetuity Grow thPow ertrain
4.75x—5.75x 4.50x—5.50x 4.00x—5.00xRate Range:6.00x—7.00x
LTM ended 6/30/2016 CY 2016E CY 2017E1.75%—2.25%LTM ended 6/30/2016
Adjusted EBITDA Adjusted EBITDA Adjusted EBITDAAdjusted EBITDAP
Motorparts Motorparts MotorpartsDiscountMotorparts
8.25x—9.25x 8.25x—9.25x 7.25x—8.25xRate Range:8.50x—9.50x
LTM ended 6/30/2016 CY 2016E CY 2017E10.00%—11.00%LTM ended 6/30/2016
Adjusted EBITDA Adjusted EBITDA Adjusted EBITDAAdjusted EBITDAP
Note: No particular w eight w as attributed to any analysis. Based on 169,040,651 outstanding basic shares and no dilutive shares as of September 1, 2016, per Piston public filings and Company management.
The Company has stock appreciation rights outstanding that trigger a payment obligation in the event value exceeds ~$19 / share, per Company management.
1. Financial analyses have not been adjusted for pension w ith exception of illustrative selected transactions analysis, w hich is show n for informational purposes given insufficient information on
underfunded pension (and OPEB) liabilities and EBITDAP for selected transactions. Selected multiples range show n above for illustrative purposes based on reported enterprise value to EBITDA
information for selected transactions.
Adjusted EBITDA refers to Earnings Before Interest, Taxes, Depreciation & Amortization, adjusted for certain non-recurring items.
Adjusted EBITDAP refers to Earnings Before Interest, Taxes, Depreciation, Amortization and Pension (and OPEB) Expense, adjusted for certain non-recurring items.
CY refers to Calendar Year.
LTM refers to Latest 12 Months.
Source: Piston financial projections prepared by Piston management.
CONFIDENTIAL—PRELIMINARY DRAFT—SUBJECT TO FURTHER REVIEW 43
|
|
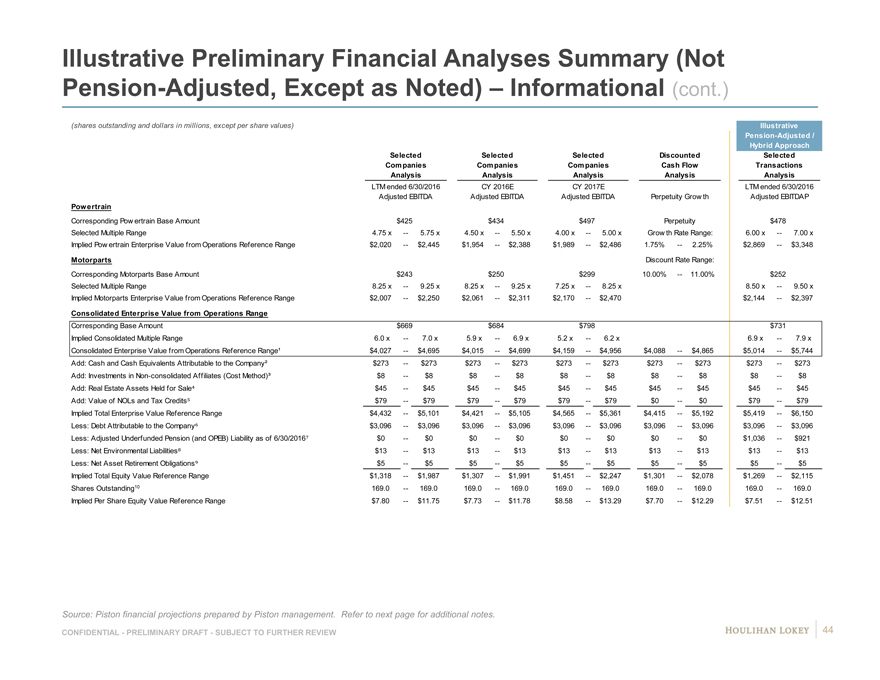
Illustrative Preliminary Financial Analyses Summary (Not
Pension-Adjusted, Except as Noted) – Informational (cont.)
(shares outstanding and dollars in millions, except per share values) Illustrative
Pension-Adjusted /
Hybrid Approach
Selected SelectedSelectedDiscountedSelected
Companies CompaniesCompaniesCash FlowTransactions
Analysis AnalysisAnalysisAnalysisAnalysis
LTM ended 6/30/2016 CY 2016ECY 2017ELTM ended 6/30/2016
Adjusted EBITDA Adjusted EBITDAAdjusted EBITDAPerpetuity Grow thAdjusted EBITDAP
Powertrain Discount Rate Range:
Corresponding Pow ertrain Base Amount $425$434$497Perpetuity$478
Selected Multiple Range 4.75 x —5.75 x4.50 x—5.50 x4.00 x—5.00 xGrow th Rate Range:6.00 x—7.00 x
Implied Pow ertrain Enterprise Value from Operations Reference Range $2,020 —$2,445$1,954—$2,388$1,989—$2,4861.75%—2.25%$2,869—$3,348
Motorparts Discount Rate Range:
Corresponding Motorparts Base Amount $243$250$29910.00%—11.00%$252
Selected Multiple Range 8.25 x —9.25 x8.25 x—9.25 x7.25 x—8.25 x8.50 x—9.50 x
Implied Motorparts Enterprise Value from Operations Reference Range $2,007 —$2,250$2,061—$2,311$2,170—$2,470$2,144—$2,397
Consolidated Enterprise Value from Operations Range
Corresponding Base Amount $669$684$798$731
Implied Consolidated Multiple Range 6.0 x —7.0 x5.9 x—6.9 x5.2 x—6.2 x6.9 x—7.9 x
Consolidated Enterprise Value from Operations Reference Range¹ $4,027 —$4,695$4,015—$4,699$4,159—$4,956$4,088—$4,865$5,014—$5,744
Add: Cash and Cash Equivalents Attributable to the Company² $273 —$273$273—$273$273—$273$273—$273$273—$273
Add: Investments in Non-consolidated Affiliates (Cost Method)³ $8 —$8$8—$8$8—$8$8—$8$8—$8
Add: Real Estate Assets Held for Sale $45 —$45$45—$45$45—$45$45—$45$45—$45
Add: Value of NOLs and Tax Credits $79 —$79$79—$79$79—$79$0—$0$79—$79
Implied Total Enterprise Value Reference Range $4,432 —$5,101$4,421—$5,105$4,565—$5,361$4,415—$5,192$5,419—$6,150
Less: Debt Attributable to the Company $3,096 —$3,096$3,096—$3,096$3,096—$3,096$3,096—$3,096$3,096—$3,096
Less: Adjusted Underfunded Pension (and OPEB) Liability as of 6/30/2016 $0 —$0$0—$0$0—$0$0—$0$1,036—$921
Less: Net Environmental Liabilities $13 —$13$13—$13$13—$13$13—$13$13—$13
Less: Net Asset Retirement Obligations $5 —$5$5—$5$5—$5$5—$5$5—$5
Implied Total Equity Value Reference Range $1,318 —$1,987$1,307—$1,991$1,451—$2,247$1,301—$2,078$1,269—$2,115
Shares Outstanding10 169.0 —169.0169.0—169.0169.0—169.0169.0—169.0169.0—169.0
Implied Per Share Equity Value Reference Range $7.80 —$11.75$7.73—$11.78$8.58—$13.29$7.70—$12.29$7.51—$12.51
Source: Piston financial projections prepared by Piston management. Refer to next page for additional notes.
CONFIDENTIAL—PRELIMINARY DRAFT—SUBJECT TO FURTHER REVIEW
44
|
|
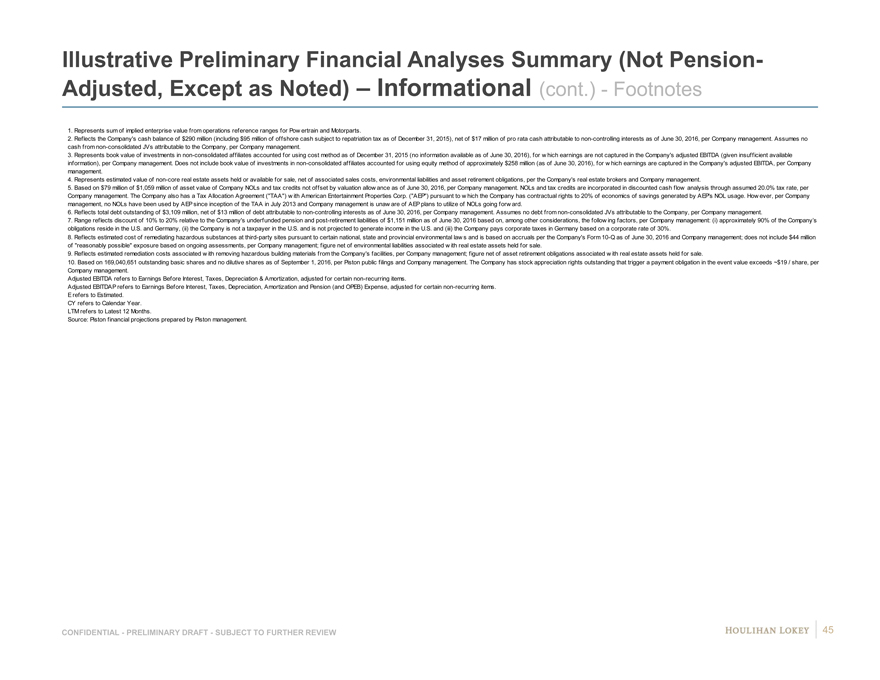
Illustrative Preliminary Financial Analyses Summary (Not Pension-Adjusted, Except as Noted) – Informational (cont.)—Footnotes
1. Represents sum of implied enterprise value from operations reference ranges for Pow ertrain and Motorparts.
2. Reflects the Company’s cash balance of $290 million (including $95 million of offshore cash subject to repatriation tax as of December 31, 2015), net of $17 million of pro rata cash attributable to non-controlling interests as of June 30, 2016, per Company management. Assumes no cash from non-consolidated JVs attributable to the Company, per Company management.
3. Represents book value of investments in non-consolidated affiliates accounted for using cost method as of December 31, 2015 (no information available as of June 30, 2016), for w hich earnings are not captured in the Company’s adjusted EBITDA (given insufficient available information), per Company management. Does not include book value of investments in non-consolidated affiliates accounted for using equity method of approximately $258 million (as of June 30, 2016), for w hich earnings are captured in the Company’s adjusted EBITDA, per Company management.
4. Represents estimated value of non-core real estate assets held or available for sale, net of associated sales costs, environmental liabilities and asset retirement obligations, per the Company’s real estate brokers and Company management.
5. Based on $79 million of $1,059 million of asset value of Company NOLs and tax credits not offset by valuation allow ance as of June 30, 2016, per Company management. NOLs and tax credits are incorporated in discounted cash flow analysis through assumed 20.0% tax rate, per Company management. The Company also has a Tax Allocation Agreement (“TAA”) w ith American Entertainment Properties Corp. (“AEP”) pursuant to w hich the Company has contractual rights to 20% of economics of savings generated by AEP’s NOL usage. How ever, per Company management, no NOLs have been used by AEP since inception of the TAA in July 2013 and Company management is unaw are of AEP plans to utilize of NOLs going forw ard.
6. Reflects total debt outstanding of $3,109 million, net of $13 million of debt attributable to non-controlling interests as of June 30, 2016, per Company management. Assumes no debt from non-consolidated JVs attributable to the Company, per Company management.
7. Range reflects discount of 10% to 20% relative to the Company’s underfunded pension and post-retirement liabilities of $1,151 million as of June 30, 2016 based on, among other considerations, the follow ing factors, per Company management: (i) approximately 90% of the Company’s obligations reside in the U.S. and Germany, (ii) the Company is not a taxpayer in the U.S. and is not projected to generate income in the U.S. and (iii) the Company pays corporate taxes in Germany based on a corporate rate of 30%.
8. Reflects estimated cost of remediating hazardous substances at third-party sites pursuant to certain national, state and provincial environmental law s and is based on accruals per the Company’s Form 10-Q as of June 30, 2016 and Company management; does not include $44 million of “reasonably possible” exposure based on ongoing assessments, per Company management; figure net of environmental liabilities associated w ith real estate assets held for sale.
9. Reflects estimated remediation costs associated w ith removing hazardous building materials from the Company’s facilities, per Company management; figure net of asset retirement obligations associated w ith real estate assets held for sale.
10. Based on 169,040,651 outstanding basic shares and no dilutive shares as of September 1, 2016, per Piston public filings and Company management. The Company has stock appreciation rights outstanding that trigger a payment obligation in the event value exceeds ~$19 / share, per Company management.
Adjusted EBITDA refers to Earnings Before Interest, Taxes, Depreciation & Amortization, adjusted for certain non-recurring items.
Adjusted EBITDAP refers to Earnings Before Interest, Taxes, Depreciation, Amortization and Pension (and OPEB) Expense, adjusted for certain non-recurring items. E refers to Estimated.
CY refers to Calendar Year. LTM refers to Latest 12 Months.
Source: Piston financial projections prepared by Piston management.
CONFIDENTIAL—PRELIMINARY DRAFT—SUBJECT TO FURTHER REVIEW 45
|
|
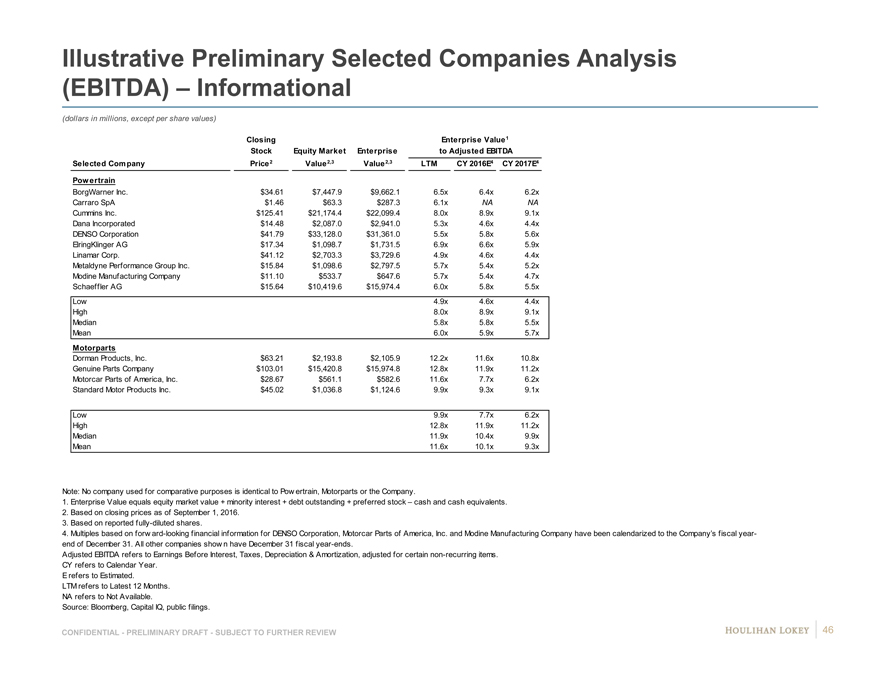
Illustrative Preliminary Selected Companies Analysis
(EBITDA) – Informational
(dollars in millions, except per share values)
Closing Enterprise Value1
Stock Equity MarketEnterpriseto Adjusted EBITDA
Selected Company Price2 Value2,3Value2,3LTMCY 2016E4CY 2017E4
Pow ertrain
BorgWarner Inc. $34.61 $7,447.9$9,662.16.5x6.4x6.2x6 9
Carraro SpA $1.46 $63.3$287.36.1xNANA N NA
Cummins Inc. $125.41 $21,174.4$22,099.48.0x8.9x9.1x9 #
Dana Incorporated $14.48 $2,087.0$2,941.05.3x4.6x4.4x4 8
DENSO Corporation $41.79 $33,128.0$31,361.05.5x5.8x5.6x6 #
ElringKlinger AG $17.34 $1,098.7$1,731.56.9x6.6x5.9x6 #
Linamar Corp. $41.12 $2,703.3$3,729.64.9x4.6x4.4x4 9
Metaldyne Performance Group Inc. $15.84 $1,098.6$2,797.55.7x5.4x5.2x5 8
Modine Manufacturing Company $11.10 $533.7$647.65.7x5.4x4.7x5 #
Schaeffler AG $15.64 $10,419.6$15,974.46.0x5.8x5.5x6 #
Low 4.9x4.6x4.4x
High 8.0x8.9x9.1x
Median 5.8x5.8x5.5x
Mean 6.0x5.9x5.7x
Motorparts
Dorman Products, Inc. $63.21 $2,193.8$2,105.912.2x11.6x10.8x# #
Genuine Parts Company $103.01 $15,420.8$15,974.812.8x11.9x11.2x# #
Motorcar Parts of America, Inc. $28.67 $561.1$582.611.6x7.7x6.2x# 7
Standard Motor Products Inc. $45.02 $1,036.8$1,124.69.9x9.3x9.1x# NA
Low 9.9x7.7x6.2x
High 12.8x11.9x11.2x
Median 11.9x10.4x9.9x
Mean 11.6x10.1x9.3x
Note: No company used for comparative purposes is identical to Pow ertrain, Motorparts or the Company.
1. Enterprise Value equals equity market value + minority interest + debt outstanding + preferred stock – cash and cash equivalents.
2. Based on closing prices as of September 1, 2016.
3. Based on reported fully-diluted shares.
4. Multiples based on forw ard-looking financial information for DENSO Corporation, Motorcar Parts of America, Inc. and Modine Manufacturing Company have been calendarized to the Company’s fiscal year-
end of December 31. All other companies show n have December 31 fiscal year-ends.
Adjusted EBITDA refers to Earnings Before Interest, Taxes, Depreciation & Amortization, adjusted for certain non-recurring items.
CY refers to Calendar Year.
E refers to Estimated.
LTM refers to Latest 12 Months.
NA refers to Not Available.
Source: Bloomberg, Capital IQ, public filings.
CONFIDENTIAL—PRELIMINARY DRAFT—SUBJECT TO FURTHER REVIEW 46
|
|
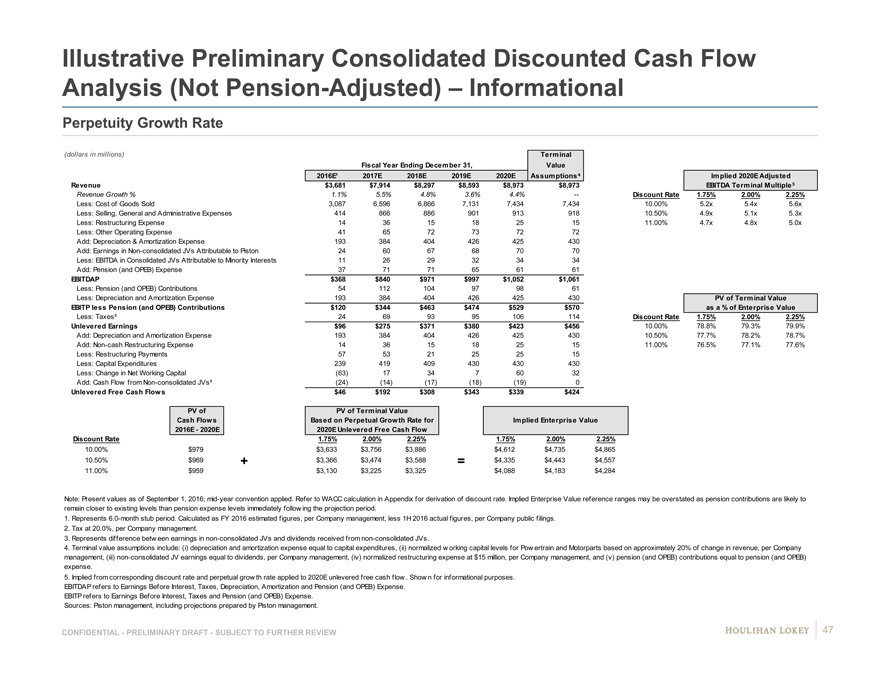
Illustrative Preliminary Consolidated Discounted Cash Flow
Analysis (Not Pension-Adjusted) – Informational
Perpetuity Growth Rate
(dollars in millions) Terminal
Fiscal Year Ending December 31,Value
2016E¹2017E2018E2019E2020E Assumptions Implied 2020E Adjusted
Revenue $3,681$7,914$8,297$8,593$8,973$8,973EBITDA Terminal Multiple
Revenue Growth % 1.1%5.5%4.8%3.6%4.4%—Discount Rate1.75%2.00%2.25%
Less: Cost of Goods Sold 3,0876,5966,8667,1317,4347,43410.00%5.2x5.4x5.6x
Less: Selling, General and Administrative Expenses 414 86688690191391810.50%4.9x5.1x5.3x
Less: Restructuring Expense 14361518251511.00%4.7x4.8x5.0x
Less: Other Operating Expense 416572737272
Add: Depreciation & Amortization Expense 193384404426425430
Add: Earnings in Non-consolidated JVs Attributable to Piston 24 6067687070
Less: EBITDA in Consolidated JVs Attributable to Minority Interests 11 2629323434
Add: Pension (and OPEB) Expense 377171656161
EBITDAP $368$840$971$997$1,052$1,061
Less: Pension (and OPEB) Contributions 54112104979861
Less: Depreciation and Amortization Expense 193384404426425430PV of Terminal Value
EBITP less Pension (and OPEB) Contributions $120 $344$463$474$529$570as a % of Enterprise Value
Less: Taxes² 24699395106114Discount Rate1.75%2.00%2.25%
Unlevered Earnings $96$275$371$380$423$45610.00%78.8%79.3%79.9%
Add: Depreciation and Amortization Expense 19338440442642543010.50%77.7%78.2%78.7%
Add: Non-cash Restructuring Expense 14361518251511.00%76.5%77.1%77.6%
Less: Restructuring Payments 575321252515
Less: Capital Expenditures 239419409430430430
Less: Change in Net Working Capital (63)173476032
Add: Cash Flow from Non-consolidated JVs³ (24)(14)(17)(18)(19)0
Unlevered Free Cash Flows $46$192$308$343$339$424
PV ofPV of Terminal Value
Cash FlowsBased on Perpetual Growth Rate forImplied Enterprise Value
2016E—2020E2020E Unlevered Free Cash Flow
Discount Rate 1.75%2.00%2.25%1.75%2.00%2.25%
10.00% 0.100 $979$3,633$3,756$3,886$4,612$4,735$4,865
10.50% 0.105 $969+$3,366$3,474$3,588=$4,335$4,443$4,557
11.00% 0.110 $959$3,130$3,225$3,325$4,088$4,183$4,284
Note: Present values as of September 1, 2016; mid-year convention applied. Refer to WACC calculation in Appendix for derivation of discount rate. Implied Enterprise Value reference ranges may be overstated as pension contributions are likely to
remain closer to existing levels than pension expense levels immediately follow ing the projection period.
1. Represents 6.0-month stub period. Calculated as FY 2016 estimated figures, per Company management, less 1H 2016 actual figures, per Company public filings.
2. Tax at 20.0%, per Company management.
3. Represents difference betw een earnings in non-consolidated JVs and dividends received from non-consolidated JVs.
4. Terminal value assumptions include: (i) depreciation and amortization expense equal to capital expenditures, (ii) normalized w orking capital levels for Pow ertrain and Motorparts based on approximately 20% of change in revenue, per Company
management, (iii) non-consolidated JV earnings equal to dividends, per Company management, (iv) normalized restructuring expense at $15 million, per Company management, and (v) pension (and OPEB) contributions equal to pension (and OPEB)
expense.
5. Implied from corresponding discount rate and perpetual grow th rate applied to 2020E unlevered free cash flow . Show n for informational purposes.
EBITDAP refers to Earnings Before Interest, Taxes, Depreciation, Amortization and Pension (and OPEB) Expense.
EBITP refers to Earnings Before Interest, Taxes and Pension (and OPEB) Expense.
Sources: Piston management, including projections prepared by Piston management.
CONFIDENTIAL—PRELIMINARY DRAFT—SUBJECT TO FURTHER REVIEW 47
|
|

Illustrative Preliminary Selected Transactions Analysis –
Informational
(dollars in millions) Transaction
Value /LTM
Transaction LTM AdjustedEBITDA
Announced Effective TargetAcquirorValue¹EBITDAMargin %
Powertrain
10/15/2015 01/21/2016 Montupet SALinamar Corp.$954.89.1x18.7%
08/10/2015 10/27/2015 Stackpole International Inc.Johnson Electric Holdings Limited$663.810.6x16.8%
07/31/2015 10/16/2015 Motovario S.p.A.TECO Electric & Machinery Co. Ltd.$204.69.8x16.8%
07/14/2015 12/02/2015 Miba AktiengesellschaftMitterbauer Beteiligungs AG$765.75.0x19.0%
07/13/2015 11/10/2015 Remy International, Inc.BorgWarner Inc.$1,185.19.0x11.8%
02/19/2015 07/01/2015 Delphi Automotive PLC, Thermal BusinessMAHLE Industrial Thermal Systems GmbH & Co. KG$727.09.5x4.9%
07/10/2014 05/15/2015 ZF TRW Automotive Holdings Corp.ZF Friedrichshafen AG$13,029.97.0x10.9%
06/23/2014 09/19/2014 Letrika d.d.MAHLE Holding Austria GmbH$214.37.0x9.1%
10/11/2013 10/11/2013 Stackpole International Inc.CITIC Capital Partners; Crestview Partners L.P.$512.05.4x ²NA N
Low$204.65.0x4.9%
High$13,029.910.6x19.0%
Median$727.09.0x14.3%
Mean$2,028.68.0x13.5%
Motorparts
08/03/2015 08/03/2015 The Carlstar Group LLC, Belts BusinessThe Timken Company$220.010.0x15.7%
08/15/2014 08/15/2014 Schrader International, Inc.Sensata Technologies B.V.$1,004.712.6x16.2%
04/28/2014 05/01/2014 Stanadyne Corporation, Filtration businessCLARCOR Inc.$325.08.2x36.6%
04/04/2014 04/04/2014 Pinafore Holdings B.V. / GatesThe Blackstone Group$7,070.712.4x19.3%
02/10/2014 02/10/2014 Veyance Technologies, Inc.ContiTech AG$1,900.07.3x13.2%
07/18/2013 09/27/2013 Johnson Controls Inc., HomeLink Product LineGentex Corp.$700.09.2x51.9%
04/23/2013 04/23/2013 Sator Holding B.V.LKQ Corp.$272.88.8x8.4%
Low$220.07.3x8.4%
High$7,070.712.6x51.9%
Median$700.09.2x16.2%
Mean$1,641.99.8x23.0%
Note: No target show n for comparative purposes is identical to Pow ertrain, Motorparts or the Company. No transaction show n for comparative purposes is identical to a transaction involving the Company.
Note: No data available relating to pension obligations or EBITDAP.
1. Transaction Value refers to implied enterprise value of target company based on announced transaction equity price and other public information available at time of announcement.
2. Per Amherst Partners “Summary of Automotive M&A and Capital Markets Activity” report dated Q4 2013.
Adjusted EBITDA refers to Earnings Before Interest, Taxes, Depreciation & Amortization, adjusted for certain non-recurring items.
LTM refers to most recently completed 12-month period for w hich financial information has been made public.
NA refers to Not Available.
Source: Capital IQ, public filings.
CONFIDENTIAL—PRELIMINARY DRAFT—SUBJECT TO FURTHER REVIEW 48
|
|
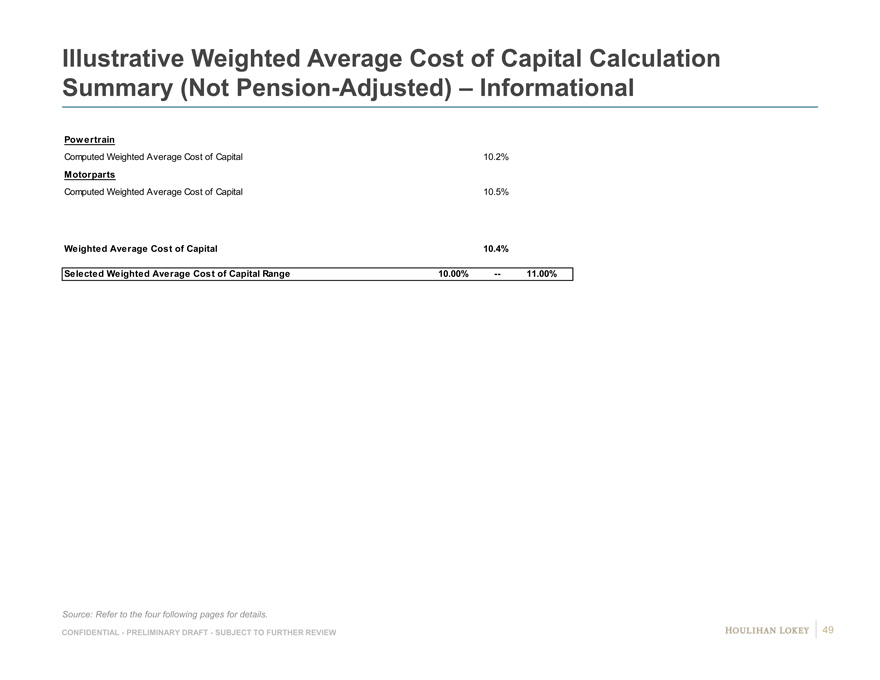
Illustrative Weighted Average Cost of Capital Calculation
Summary (Not Pension-Adjusted) – Informational
Powertrain
Computed Weighted Average Cost of Capital 10.2%
Motorparts
Computed Weighted Average Cost of Capital 10.5%
Weighted Average Cost of Capital 10.4%
Selected Weighted Average Cost of Capital Range 10.00% — 11.00%
Source: Refer to the four following pages for details.
CONFIDENTIAL—PRELIMINARY DRAFT—SUBJECT TO FURTHER REVIEW 49
|
|
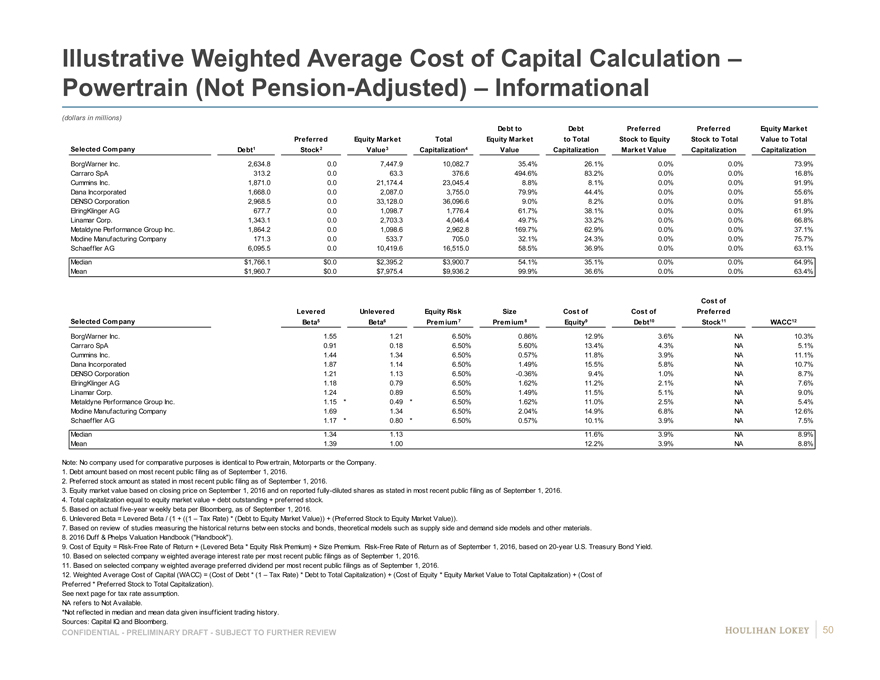
Illustrative Weighted Average Cost of Capital Calculation –
Powertrain (Not Pension-Adjusted) – Informational
(dollars in millions)
Debt toDebtPreferredPreferredEquity Market
PreferredEquity MarketTotalEquity Marketto TotalStock to EquityStock to TotalValue to Total
Selected Company Debt1 Stock2Value3Capitalization4ValueCapitalizationMarket ValueCapitalizationCapitalization
BorgWarner Inc. 2,634.8#0.0#7,447.9#10,082.7#35.4% #26.1% #0.0% #0.0% #73.9%#
Carraro SpA 313.2#0.0#63.3#376.6#494.6% #83.2% #0.0% #0.0% #16.8%#
Cummins Inc. 1,871.0#0.0#21,174.4#23,045.4#8.8% #8.1% #0.0% #0.0% #91.9%#
Dana Incorporated 1,668.0#0.0#2,087.0#3,755.0#79.9% #44.4% #0.0% #0.0% #55.6%#
DENSO Corporation 2,968.5#0.0#33,128.0#36,096.6#9.0% #8.2% #0.0% #0.0% #91.8%#
ElringKlinger AG 677.7#0.0#1,098.7#1,776.4#61.7% #38.1% #0.0% #0.0% #61.9%#
Linamar Corp. 1,343.1#0.0#2,703.3#4,046.4#49.7% #33.2% #0.0% #0.0% #66.8%#
Metaldyne Performance Group Inc. 1,864.2#0.0#1,098.6#2,962.8#169.7% #62.9% #0.0% #0.0% #37.1%#
Modine Manufacturing Company 171.3#0.0#533.7#705.0#32.1% #24.3% #0.0% #0.0% #75.7%#
Schaeffler AG 6,095.5#0.0#10,419.6#16,515.0#58.5% #36.9% #0.0% #0.0% #63.1%#
Median $1,766.1$0.0$2,395.2$3,900.754.1%35.1%0.0%0.0%64.9%
Mean $1,960.7$0.0$7,975.4$9,936.299.9%36.6%0.0%0.0%63.4%
Cost of
LeveredUnleveredEquity RiskSizeCost ofCost ofPreferred
Selected Company Beta5Beta6Premium 7Premium 8Equity9Debt10Stock11WACC12
BorgWarner Inc. 1.55#1.21#6.50%0.86%12.9% #3.6% #NA #10.3%0
Carraro SpA 0.91#0.18#6.50%5.60%13.4% #4.3% #NA #5.1%0
Cummins Inc. 1.44#1.34#6.50%0.57%11.8% #3.9% #NA #11.1%0
Dana Incorporated 1.87#1.14#6.50%1.49%15.5% #5.8% #NA #10.7%0
DENSO Corporation 1.21#1.13#6.50%-0.36%9.4% #1.0% #NA #8.7%0
ElringKlinger AG 1.18#0.79#6.50%1.62%11.2% #2.1% #NA #7.6%0
Linamar Corp. 1.24#0.89#6.50%1.49%11.5% #5.1% #NA #9.0%0
Metaldyne Performance Group Inc. 1.15*0.49*6.50%1.62%11.0% #2.5% #NA #5.4%0
Modine Manufacturing Company 1.69#1.34#6.50%2.04%14.9% #6.8% #NA #12.6%0
Schaeffler AG 1.17*0.80*6.50%0.57%10.1% #3.9% #NA #7.5%0
Median 1.341.1311.6%3.9%NA8.9%
Mean 1.391.0012.2%3.9%NA8.8%
Note: No company used for comparative purposes is identical to Pow ertrain, Motorparts or the Company.
1. Debt amount based on most recent public filing as of September 1, 2016.
2. Preferred stock amount as stated in most recent public filing as of September 1, 2016.
3. Equity market value based on closing price on September 1, 2016 and on reported fully-diluted shares as stated in most recent public filing as of September 1, 2016.
4. Total capitalization equal to equity market value + debt outstanding + preferred stock.
5. Based on actual five-year w eekly beta per Bloomberg, as of September 1, 2016.
6. Unlevered Beta = Levered Beta / (1 + ((1 – Tax Rate) * (Debt to Equity Market Value)) + (Preferred Stock to Equity Market Value)).
7. Based on review of studies measuring the historical returns betw een stocks and bonds, theoretical models such as supply side and demand side models and other materials.
8. 2016 Duff & Phelps Valuation Handbook (“Handbook”).
9. Cost of Equity = Risk-Free Rate of Return + (Levered Beta * Equity Risk Premium) + Size Premium. Risk-Free Rate of Return as of September 1, 2016, based on 20-year U.S. Treasury Bond Yield.
10. Based on selected company w eighted average interest rate per most recent public filings as of September 1, 2016.
11. Based on selected company w eighted average preferred dividend per most recent public filings as of September 1, 2016.
12. Weighted Average Cost of Capital (WACC) = (Cost of Debt * (1 – Tax Rate) * Debt to Total Capitalization) + (Cost of Equity * Equity Market Value to Total Capitalization) + (Cost of
Preferred * Preferred Stock to Total Capitalization).
See next page for tax rate assumption.
NA refers to Not Available.
*Not reflected in median and mean data given insufficient trading history.
Sources: Capital IQ and Bloomberg.
CONFIDENTIAL—PRELIMINARY DRAFT—SUBJECT TO FURTHER REVIEW 50
|
|
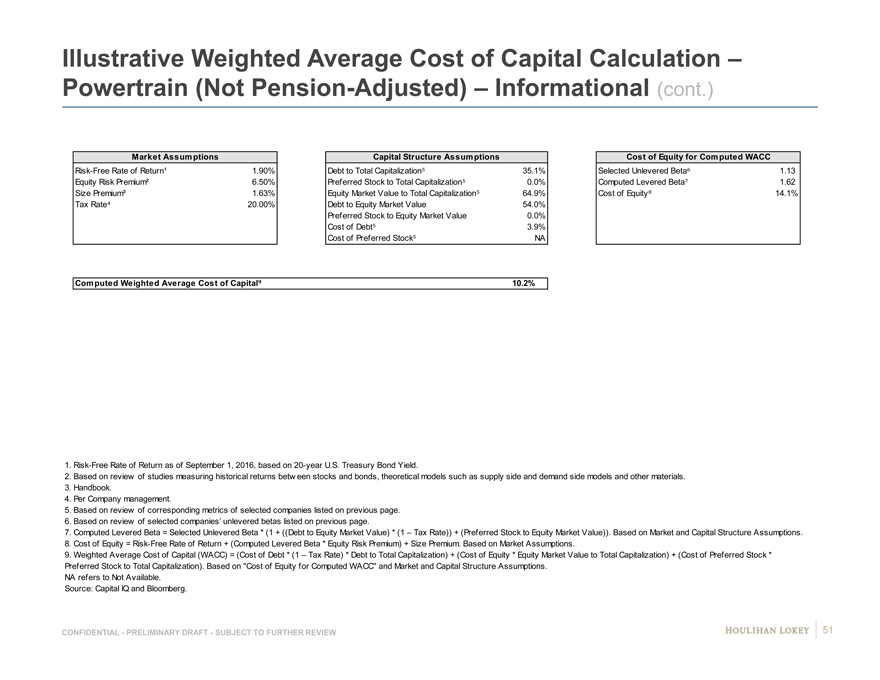
Illustrative Weighted Average Cost of Capital Calculation –
Powertrain (Not Pension-Adjusted) – Informational (cont.)
Market Assumptions Capital Structure AssumptionsCost of Equity for Computed WACC
Risk-Free Rate of Return¹ 1.90% Debt to Total Capitalization 35.1%Selected Unlevered Beta 1.13
Equity Risk Premium² 6.50% Preferred Stock to Total Capitalization 0.0%Computed Levered Beta 1.62
Size Premium³ 1.63%Equity Market Value to Total Capitalization 64.9%Cost of Equity 14.1%
Tax Rate 20.00%Debt to Equity Market Value54.0%
Preferred Stock to Equity Market Value0.0%
Cost of Debt 3.9%
Cost of Preferred Stock NA
Computed Weighted Average Cost of Capital 10.2%
1. Risk-Free Rate of Return as of September 1, 2016, based on 20-year U.S. Treasury Bond Yield.
2. Based on review of studies measuring historical returns betw een stocks and bonds, theoretical models such as supply side and demand side models and other materials.
3. Handbook.
4. Per Company management.
5. Based on review of corresponding metrics of selected companies listed on previous page.
6. Based on review of selected companies’ unlevered betas listed on previous page.
7. Computed Levered Beta = Selected Unlevered Beta * (1 + ((Debt to Equity Market Value) * (1 – Tax Rate)) + (Preferred Stock to Equity Market Value)). Based on Market and Capital Structure Assumptions.
8. Cost of Equity = Risk-Free Rate of Return + (Computed Levered Beta * Equity Risk Premium) + Size Premium. Based on Market Assumptions.
9. Weighted Average Cost of Capital (WACC) = (Cost of Debt * (1 – Tax Rate) * Debt to Total Capitalization) + (Cost of Equity * Equity Market Value to Total Capitalization) + (Cost of Preferred Stock *
Preferred Stock to Total Capitalization). Based on “Cost of Equity for Computed WACC” and Market and Capital Structure Assumptions.
NA refers to Not Available.
Source: Capital IQ and Bloomberg.
CONFIDENTIAL—PRELIMINARY DRAFT—SUBJECT TO FURTHER REVIEW 51
|
|
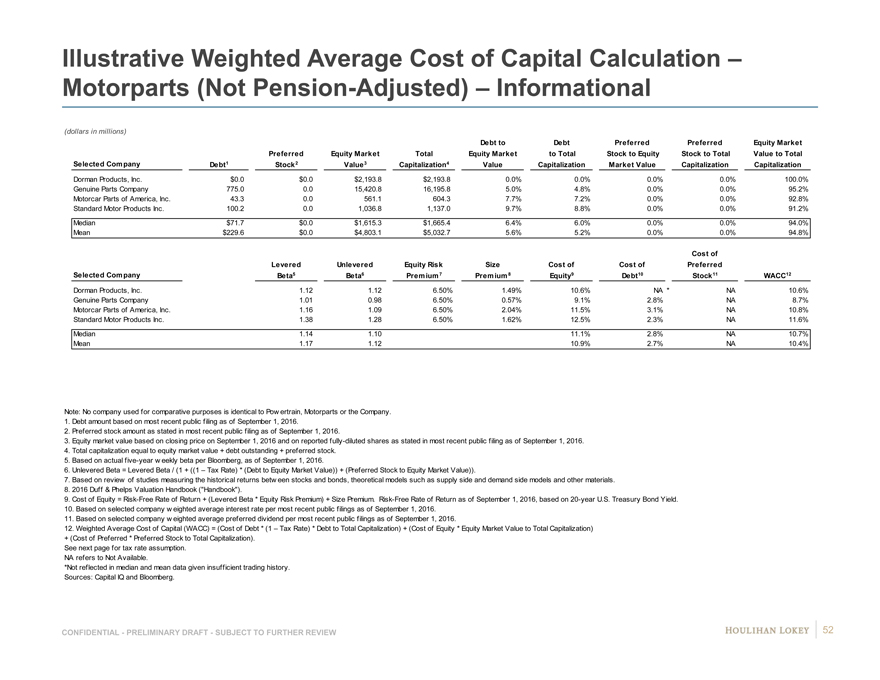
Illustrative Weighted Average Cost of Capital Calculation –
Motorparts (Not Pension-Adjusted) – Informational
(dollars in millions)
Debt toDebtPreferredPreferredEquity Market
PreferredEquity MarketTotalEquity Marketto TotalStock to EquityStock to TotalValue to Total
Selected Company Debt1 Stock2Value3Capitalization4ValueCapitalizationMarket ValueCapitalizationCapitalization
Dorman Products, Inc. $0.0 #$0.0#$2,193.8#$2,193.8#0.0% #0.0% #0.0%#0.0% #100.0%#
Genuine Parts Company 775.0 #0.0#15,420.8#16,195.8#5.0% #4.8% #0.0%#0.0% #95.2%#
Motorcar Parts of America, Inc. 43.3 #0.0#561.1#604.3#7.7% #7.2% #0.0%#0.0% #92.8%#
Standard Motor Products Inc. 100.2 #0.0#1,036.8#1,137.0#9.7% #8.8% #0.0%#0.0% #91.2%#
Median $71.7 $0.0$1,615.3$1,665.46.4%6.0%0.0%0.0%94.0%
Mean $229.6 $0.0$4,803.1$5,032.75.6%5.2%0.0%0.0%94.8%
Cost of
LeveredUnleveredEquity RiskSizeCost ofCost ofPreferred
Selected Company Beta5Beta6Premium 7Premium 8Equity9Debt10Stock11WACC12
Dorman Products, Inc. 1.12#1.12#6.50%1.49%10.6% #NA *NA #10.6%0
Genuine Parts Company 1.01#0.98#6.50%0.57%9.1% #2.8%#NA #8.7%0
Motorcar Parts of America, Inc. 1.16#1.09#6.50%2.04%11.5% #3.1%#NA #10.8%0
Standard Motor Products Inc. 1.38#1.28#6.50%1.62%12.5% #2.3%#NA #11.6%0
Median 1.141.1011.1%2.8%NA10.7%
Mean 1.171.1210.9%2.7%NA10.4%
Note: No company used for comparative purposes is identical to Pow ertrain, Motorparts or the Company.
1. Debt amount based on most recent public filing as of September 1, 2016.
2. Preferred stock amount as stated in most recent public filing as of September 1, 2016.
3. Equity market value based on closing price on September 1, 2016 and on reported fully-diluted shares as stated in most recent public filing as of September 1, 2016.
4. Total capitalization equal to equity market value + debt outstanding + preferred stock.
5. Based on actual five-year w eekly beta per Bloomberg, as of September 1, 2016.
6. Unlevered Beta = Levered Beta / (1 + ((1 – Tax Rate) * (Debt to Equity Market Value)) + (Preferred Stock to Equity Market Value)).
7. Based on review of studies measuring the historical returns betw een stocks and bonds, theoretical models such as supply side and demand side models and other materials.
8. 2016 Duff & Phelps Valuation Handbook (“Handbook”).
9. Cost of Equity = Risk-Free Rate of Return + (Levered Beta * Equity Risk Premium) + Size Premium. Risk-Free Rate of Return as of September 1, 2016, based on 20-year U.S. Treasury Bond Yield.
10. Based on selected company w eighted average interest rate per most recent public filings as of September 1, 2016.
11. Based on selected company w eighted average preferred dividend per most recent public filings as of September 1, 2016.
12. Weighted Average Cost of Capital (WACC) = (Cost of Debt * (1 – Tax Rate) * Debt to Total Capitalization) + (Cost of Equity * Equity Market Value to Total Capitalization)
+ (Cost of Preferred * Preferred Stock to Total Capitalization).
See next page for tax rate assumption.
NA refers to Not Available.
*Not reflected in median and mean data given insufficient trading history.
Sources: Capital IQ and Bloomberg.
CONFIDENTIAL—PRELIMINARY DRAFT—SUBJECT TO FURTHER REVIEW 52
|
|
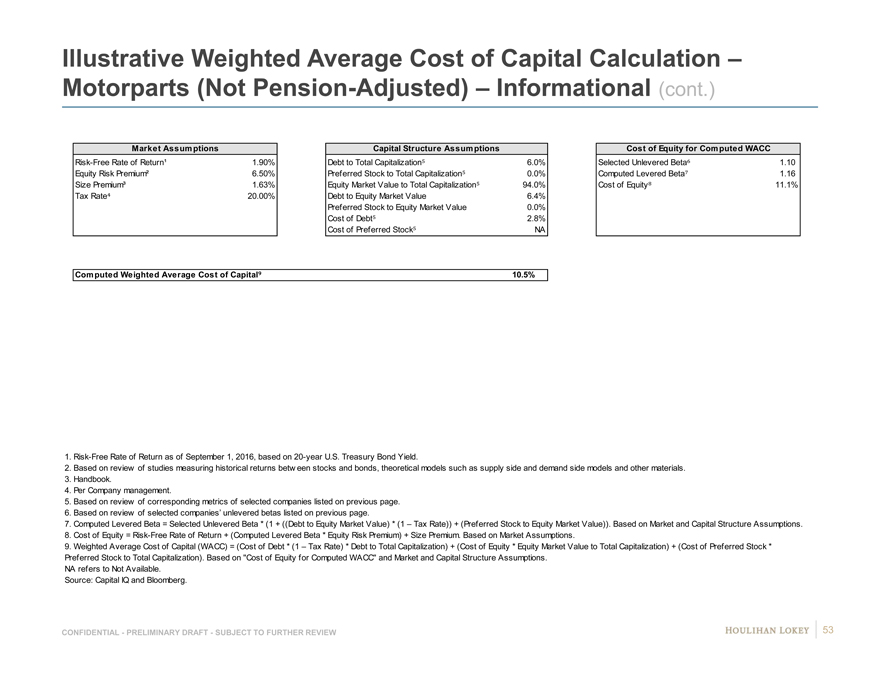
Illustrative Weighted Average Cost of Capital Calculation –
Motorparts (Not Pension-Adjusted) – Informational (cont.)
Market Assumptions Capital Structure AssumptionsCost of Equity for Computed WACC
Risk-Free Rate of Return¹ 1.90% Debt to Total Capitalization 6.0%Selected Unlevered Beta 1.10
Equity Risk Premium² 6.50% Preferred Stock to Total Capitalization 0.0%Computed Levered Beta 1.16
Size Premium³ 1.63%Equity Market Value to Total Capitalization 94.0%Cost of Equity 11.1%
Tax Rate 20.00%Debt to Equity Market Value6.4%
Preferred Stock to Equity Market Value0.0%
Cost of Debt 2.8%
Cost of Preferred Stock NA
Computed Weighted Average Cost of Capital 10.5%
1. Risk-Free Rate of Return as of September 1, 2016, based on 20-year U.S. Treasury Bond Yield.
2. Based on review of studies measuring historical returns betw een stocks and bonds, theoretical models such as supply side and demand side models and other materials.
3. Handbook.
4. Per Company management.
5. Based on review of corresponding metrics of selected companies listed on previous page.
6. Based on review of selected companies’ unlevered betas listed on previous page.
7. Computed Levered Beta = Selected Unlevered Beta * (1 + ((Debt to Equity Market Value) * (1 – Tax Rate)) + (Preferred Stock to Equity Market Value)). Based on Market and Capital Structure Assumptions.
8. Cost of Equity = Risk-Free Rate of Return + (Computed Levered Beta * Equity Risk Premium) + Size Premium. Based on Market Assumptions.
9. Weighted Average Cost of Capital (WACC) = (Cost of Debt * (1 – Tax Rate) * Debt to Total Capitalization) + (Cost of Equity * Equity Market Value to Total Capitalization) + (Cost of Preferred Stock *
Preferred Stock to Total Capitalization). Based on “Cost of Equity for Computed WACC” and Market and Capital Structure Assumptions.
NA refers to Not Available.
Source: Capital IQ and Bloomberg.
CONFIDENTIAL—PRELIMINARY DRAFT—SUBJECT TO FURTHER REVIEW 53
|
|

Page
1. Executive Summary 3
2. Preliminary Financial Analyses 9
3. Selected Public Market Observations 17
4. Appendix 22
5. Disclaimer 54
|
|
Disclaimer
This presentation, and any supplemental information (written or oral) or other documents provided in connection therewith (collectively, the “materials”), are provided solely for the information of the Special Committee (the “Committee”) of the Board of Directors (the “Board”) of Federal-Mogul Holdings Corporation (“Piston” or the “Company”) by Houlihan Lokey in connection with the Committee’s consideration of a potential transaction (the “Transaction”) involving the Company. This presentation is incomplete without reference to, and should be considered in conjunction with, any supplemental information provided by and discussions with Houlihan Lokey in connection therewith. Any defined terms used herein shall have the meanings set forth herein, even if such defined terms have been given different meanings elsewhere in the materials.
The materials are for discussion purposes only. Houlihan Lokey expressly disclaims any and all liability which may be based on the materials and any errors therein or omissions therefrom. The materials were prepared for specific persons familiar with the business and affairs of the Company for use in a specific context and were not prepared with a view to public disclosure or to conform with any disclosure standards under any state, federal or international securities laws or other laws, rules or regulations, and none of the Committee, the Company or Houlihan Lokey takes any responsibility for the use of the materials by persons other than the Committee. The materials are provided on a confidential basis solely for the information of the Committee and may not be disclosed, summarized, reproduced, disseminated or quoted or otherwise referred to, in whole or in part, without Houlihan Lokey’s express prior written consent.
Notwithstanding any other provision herein, the Company (and each employee, representative or other agent of the Company) may disclose to any and all persons without limitation of any kind, the tax treatment and tax structure of any transaction and all materials of any kind (including opinions or other tax analyses, if any) that are provided to the Company relating to such tax treatment and structure. However, any information relating to the tax treatment and tax structure shall remain confidential (and the foregoing sentence shall not apply) to the extent necessary to enable any person to comply with securities laws. For this purpose, the tax treatment of a transaction is the purported or claimed U.S. income or franchise tax treatment of the transaction and the tax structure of a transaction is any fact that may be relevant to understanding the purported or claimed U.S. income or franchise tax treatment of the transaction. If the Company plans to disclose information pursuant to the first sentence of this paragraph, the Company shall inform those to whom it discloses any such information that they may not rely upon such information for any purpose without Houlihan Lokey’s prior written consent. Houlihan Lokey is not an expert on, and nothing contained in the materials should be construed as advice with regard to, legal, accounting, regulatory, insurance, tax or other specialist matters. Houlihan Lokey’s role in reviewing any information is limited solely to performing such a review as it shall deem necessary to support its own advice and analysis and shall not be on behalf of the Committee.
The materials necessarily are based on financial, economic, market and other conditions as in effect on, and the information available to Houlihan Lokey as of, the date of the materials. Although subsequent developments may affect the contents of the materials, Houlihan Lokey has not undertaken, and is under no obligation, to update, revise or reaffirm the materials, except as may be expressly contemplated by Houlihan Lokey’s engagement letter. The materials are not intended to provide the sole basis for evaluation of the Transaction and do not purport to contain all information that may be required. The materials do not address the underlying business decision of the Company or any other party to proceed with or effect the Transaction. The materials do not constitute any opinion, nor do the materials constitute a recommendation to the Board, the Committee, the Company, any security holder of the Company or any other party as to how to vote or act with respect to any matter relating to the Transaction or otherwise or whether to buy or sell any assets or securities of any company. Houlihan Lokey’s only opinion is the opinion, if any, that is actually delivered to the Committee. The materials may not reflect information known to other professionals in other business areas of Houlihan Lokey and its affiliates.
The preparation of the materials was a complex process involving quantitative and qualitative judgments and determinations with respect to the financial, comparative and other analytic methods employed and the adaption and application of these methods to the unique facts and circumstances presented and, therefore, is not readily susceptible to partial analysis or summary description. Furthermore, Houlihan Lokey did not attribute any particular weight to any analysis or factor considered by it, but rather made qualitative judgments as to the significance and relevance of each analysis and factor. Each analytical technique has inherent strengths and weaknesses, and the nature of the available information may further affect the value of particular techniques. Accordingly, the analyses contained in the materials must be considered as a whole. Selecting portions of the analyses, analytic methods and factors without considering all analyses and factors could create a misleading or incomplete view. The materials reflect judgments and assumptions with regard to industry performance, general business, economic, regulatory, market and financial conditions and other matters, many of which are beyond the control of the participants in the Transaction. Any estimates of value contained in the materials are not necessarily indicative of actual value or predictive of future results or values, which may be significantly more or less favorable. Any analyses relating to the value of assets, businesses or securities do not purport to be appraisals or to reflect the prices at which any assets, businesses or securities may actually be sold. The materials do not constitute a valuation opinion or credit rating. In preparing the materials, Houlihan Lokey has not conducted any physical inspection or independent appraisal or evaluation of any of the assets, properties or liabilities (contingent or otherwise) of the Company or any other party and has no obligation to evaluate the solvency of the Company or any other party under any law.
All budgets, projections, estimates, financial analyses, reports and other information with respect to operations (including estimates of potential cost savings and expenses) reflected in the materials have been prepared by management of the relevant party or are derived from such budgets, projections, estimates, financial analyses, reports and other information or from other sources, which involve numerous and significant subjective determinations made by management of the relevant party and/or which such management has reviewed and found reasonable. The budgets, projections and estimates contained in the materials may or may not be achieved and differences between projected results and those actually achieved may be material. Houlihan Lokey has relied upon representations made by management of the Company that such budgets, projections and estimates have been reasonably prepared in good faith on bases reflecting the best currently available estimates and judgments of such management (or, with respect to information obtained from public sources, represent reasonable estimates), and Houlihan Lokey expresses no opinion with respect to such budgets, projections or estimates or the assumptions on which they are based. The scope of the financial analysis contained herein is based on discussions with the Company (including, without limitation, regarding the methodologies to be utilized), and Houlihan Lokey does not make any representation, express or implied, as to the sufficiency or adequacy of such financial analysis or the scope thereof for any particular purpose.
Houlihan Lokey has assumed and relied upon the accuracy and completeness of the financial and other information provided to, discussed with or reviewed by it without (and without assuming responsibility for) independent verification of such information, makes no representation or warranty (express or implied) in respect of the accuracy or completeness of such information and has further relied upon the assurances of the Company that it is not aware of any facts or circumstances that would make such information inaccurate or misleading. In addition, Houlihan Lokey has relied upon and assumed, without independent verification, that there has been no change in the business, assets, liabilities, financial condition, results of operations, cash flows or prospects of the Company or any other participant in the Transaction since the respective dates of the most recent financial statements and other information, financial or otherwise, provided to Houlihan Lokey that would be material to its analyses , and that the final forms of any draft documents reviewed by Houlihan Lokey will not differ in any material respect from such draft documents.
The materials are not an offer to sell or a solicitation of an indication of interest to purchase any security, option, commodity, future, loan or currency. The materials do not constitute a commitment by Houlihan Lokey or any of its affiliates to underwrite, subscribe for or place any securities, to extend or arrange credit, or to provide any other services. In the ordinary course of business, certain of Houlihan Lokey’s affiliates and employees, as well as investment funds in which they may have financial interests or with which they may co-invest, may acquire, hold or sell, long or short positions, or trade or otherwise effect transactions, in debt, equity, and other securities and financial instruments (including loans and other obligations) of, or investments in, one or more parties that may be involved in the Transaction and their respective affiliates or any currency or commodity that may be involved in the Transaction. Houlihan Lokey provides mergers and acquisitions, restructuring and other advisory and consulting services to clients. Houlihan Lokey’s personnel may make statements or provide advice that is contrary to information contained in the materials. Houlihan Lokey’s or its affiliates’ proprietary interests may conflict with the Company’s interests. Houlihan Lokey may have advised, may seek to advise and may in the future advise one or more participants in the Transaction and/or other companies mentioned in the materials.
CONFIDENTIAL—PRELIMINARY DRAFT—SUBJECT TO FURTHER REVIEW 55
|
|

CORPORATEFINANCE
FINANCIALADVISORYSERVICES FINANCIALRESTRUCTURING STRATEGICCONSULTING
HL.com
56
| Exhibit C6
|
Project Piston
PRESENTATI O N T O T H E S P E C I A L C O M M I T T E E
S E P T E M B E R 6 , 2 0 1 6 | C O N F I D E N T I A L
|
|
Table of Contents
Page
1. Executive Summary 3
2. Financial Analyses 8
3. Selected Public Market Observations 16
4. Appendix 21 Cost of Capital Considerations 22 Selected Companies—Operating Statistics 28 Company Financial Performance Observations 32 Implied Premiums Paid Observations 35
5. Disclaimer 37
CONFIDENTIAL 2
|
|
Page
1. Executive Summary 3
2. Financial Analyses 8
3. Selected Public Market Observations 16
4. Appendix 21
5. Disclaimer 37
|
|
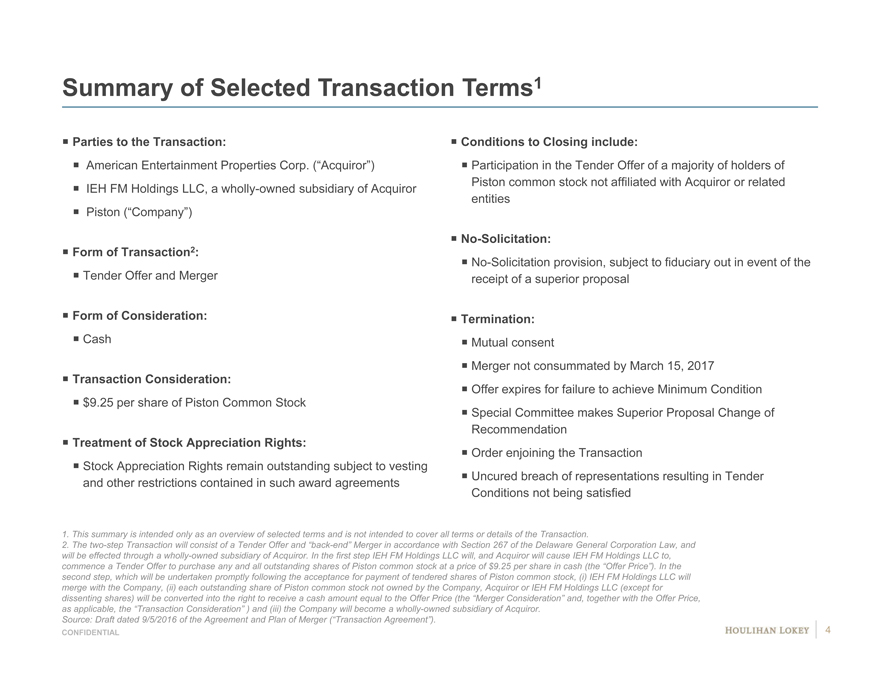
Summary of Selected Transaction Terms1
Parties to the Transaction: Conditions to Closing include:
American Entertainment Properties Corp. (“Acquiror”) Participation in the Tender Offer of a majority of holders of
IEH FM Holdings LLC, a wholly-owned subsidiary of Acquiror Piston common stock not affiliated with Acquiror or related
entities
Piston (“Company”)
No-Solicitation:
Form of Transaction2:
No-Solicitation provision, subject to fiduciary out in event of the
Tender Offer and Merger receipt of a superior proposal
Form of Consideration: Termination:
Cash Mutual consent
Merger not consummated by March 15, 2017
Transaction Consideration:
Offer expires for failure to achieve Minimum Condition
$9.25 per share of Piston Common Stock
Special Committee makes Superior Proposal Change of
Recommendation
Treatment of Stock Appreciation Rights:
Order enjoining the Transaction
Stock Appreciation Rights remain outstanding subject to vesting
and other restrictions contained in such award agreements Uncured breach of representations resulting in Tender
Conditions not being satisfied
1. This summary is intended only as an overview of selected terms and is not intended to cover all terms or details of the Transaction.
2. The two-step Transaction will consist of a Tender Offer and “back-end” Merger in accordance with Section 267 of the Delaware General Corporation Law, and
will be effected through a wholly-owned subsidiary of Acquiror. In the first step IEH FM Holdings LLC will, and Acquiror will cause IEH FM Holdings LLC to,
commence a Tender Offer to purchase any and all outstanding shares of Piston common stock at a price of $9.25 per share in cash (the “Offer Price”). In the
second step, which will be undertaken promptly following the acceptance for payment of tendered shares of Piston common stock, (i) IEH FM Holdings LLC will
merge with the Company, (ii) each outstanding share of Piston common stock not owned by the Company, Acquiror or IEH FM Holdings LLC (except for
dissenting shares) will be converted into the right to receive a cash amount equal to the Offer Price (the “Merger Consideration” and, together with the Offer Price,
as applicable, the “Transaction Consideration” ) and (iii) the Company will become a wholly-owned subsidiary of Acquiror.
Source: Draft dated 9/5/2016 of the Agreement and Plan of Merger (“Transaction Agreement”).
CONFIDENTIAL 4
|
|
Updates to Financial Analyses Since September 5, 2016 Preliminary Discussion Materials
Since the preliminary Special Committee discussion materials on September 5, 2016, the following updates have been made:
Stock prices and other publicly available financial information for the selected companies have been updated to market close as of September 2, 2016 (refer to following page for further details).
LTM: Selected Adjusted Enterprise Value/Adjusted EBITDAP multiple range of 5.50x to 6.50x for Powertrain was unchanged, selected Adjusted Enterprise Value/Adjusted EBITDAP multiple range of 8.50x to 9.50x for Motorparts was unchanged CY 2016E: Selected Adjusted Enterprise Value/Adjusted EBITDAP multiple range of 5.25x to 6.25x for Powertrain was unchanged, selected Adjusted Enterprise Value/Adjusted EBITDAP multiple range of 8.50x to 9.50x for Motorparts was unchanged CY 2017E: Selected Adjusted Enterprise Value/Adjusted EBITDAP multiple range of 4.75x to 5.75x for Powertrain was unchanged, selected Adjusted Enterprise Value/Adjusted EBITDAP multiple range of 7.50x to 8.50x for Motorparts was unchanged
Discounted cash flow analysis reflects updated market data and present value date (see page 15)
Stock prices, betas, risk-free rate and other public information in the weighted average cost of capital calculation have been updated to market close as of September 2, 2016 Pension-adjusted WACC of 10.2% unchanged from September 5, 2016 preliminary Special Committee discussion materials; selected range of discount rates of 9.75% to 10.75% was unchanged
Based on discussions with Company management, there were minor updates to the Company’s historical financials and no changes to the projections
Illustrative Preliminary Financial Analyses (EBITDA) no longer included
CONFIDENTIAL 5
|
|

Recent Market Updates
The below schedule highlights recent changes in market multiples of the selected companies. The schedule shows both updated market multiples
(based on pricing and analyst consensus estimates for each of the selected companies based on information available as of September 2, 2016 market
close) and corresponding September 1, 2016 information included in the September 5, 2016 preliminary Special Committee discussion materials.
(dollars in millions, except per share values) September 1, 2016 September 2, 2016Change
Adjusted Enterprise Value1 Adjusted Enterprise Value1Adjusted Enterprise Value1
to Adjusted EBITDAP to Adjusted EBITDAPto Adjusted EBITDAP
Selected Company LTM CY 2016E2 CY 2017E2LTMCY 2016E2 CY 2017E2LTMCY 2016E2 CY 2017E2
Powertrain
BorgWarner Inc. 6.5x 6.4x6.2x #6.6x6.5x6.2x6 90.1x0.1x0.0x
Carraro SpA 6.1x NANA A6.1xNANA N N0.0xNANA
Cummins Inc. 7.8x 8.6x8.9x #7.8x8.7x8.9x9 #0.0x0.1x0.0x
Dana Incorporated 6.0x 5.1x5.0x #6.0x5.2x5.0x5 90.0x0.1x0.0x
DENSO Corporation 5.0x 5.2x5.0x #5.0x5.2x5.0x5 #0.0x0.0x0.0x
ElringKlinger AG 7.0x 6.8x6.0x #7.1x6.9x6.1x6 #0.1x0.1x0.1x
Linamar Corp. 4.9x 4.6x4.4x #4.8x4.6x4.3x4 9-0.1x0.0x-0.1x
Metaldyne Performance Group Inc. 5.8x 5.5x5.2x #5.8x5.5x5.3x5 90.0x0.0x0.1x
Modine Manufacturing Company 6.0x 5.7x5.1x #6.1x5.8x5.1x5 #0.1x0.1x0.0x
Schaeffler AG 6.1x 6.0x5.7x #6.2x6.1x5.8x6 #0.1x0.1x0.1x
Low 4.9x 4.6x4.4x4.8x4.6x4.3x-0.1x0.0x-0.1x
High 7.8x 8.6x8.9x7.8x8.7x8.9x0.0x0.1x0.0x
Median 6.1x 5.7x5.2x6.1x5.8x5.3x0.0x0.1x0.1x
Mean 6.1x 6.0x5.7x6.2x6.0x5.7x0.0x0.0x0.0x
Motorparts
Dorman Products, Inc. 12.2x 11.6x10.8x #12.3x11.8x11.0x# #0.1x0.2x0.2x
Genuine Parts Company 13.0x 12.1x11.4x #13.1x12.1x11.4x# #0.1x0.0x0.0x
Motorcar Parts of America, Inc. 11.6x 7.7x6.1x #11.7x7.8x6.2x6 70.1x0.1x0.1x
Standard Motor Products Inc. 9.6x 9.1x8.9x #9.7x9.2x9.0x9 N0.1x0.1x0.1x
Low 9.6x 7.7x6.1x9.7x7.8x6.2x0.1x0.1x0.1x
High 13.0x 12.1x11.4x13.1x12.1x11.4x0.1x0.0x0.0x
Median 11.9x 10.3x9.8x12.0x10.5x10.0x0.1x0.2x0.2x
Mean 11.6x 10.1x9.3x11.7x10.2x9.4x0.1x0.1x0.1x
Note: No company used for comparative purposes is identical to Pow ertrain, Motorparts or the Company.
1. Adjusted Enterprise Value equals equity market value + minority interest + debt outstanding + preferred stock – cash and cash equivalents + tax-effected underfunded pension and post-employment liabilities.
2. Multiples based on forw ard-looking financial information for DENSO Corporation, Motorcar Parts of America, Inc. and Modine Manufacturing Company
have been calendarized to the Company’s fiscal year-end of December 31. All other companies show n have December 31 fiscal year-ends.
Adjusted EBITDAP refers to Earnings Before Interest, Taxes, Depreciation, Amortization and Pension (and OPEB) Expense, adjusted for certain non-recurring items.
CY refers to Calendar Year.
E refers to Estimated.
LTM refers to the most recently completed 12-month period for w hich financial information has been made public.
NA refers to Not Available.
Source: Bloomberg, Capital IQ, public filings.
CONFIDENTIAL 6
|
|
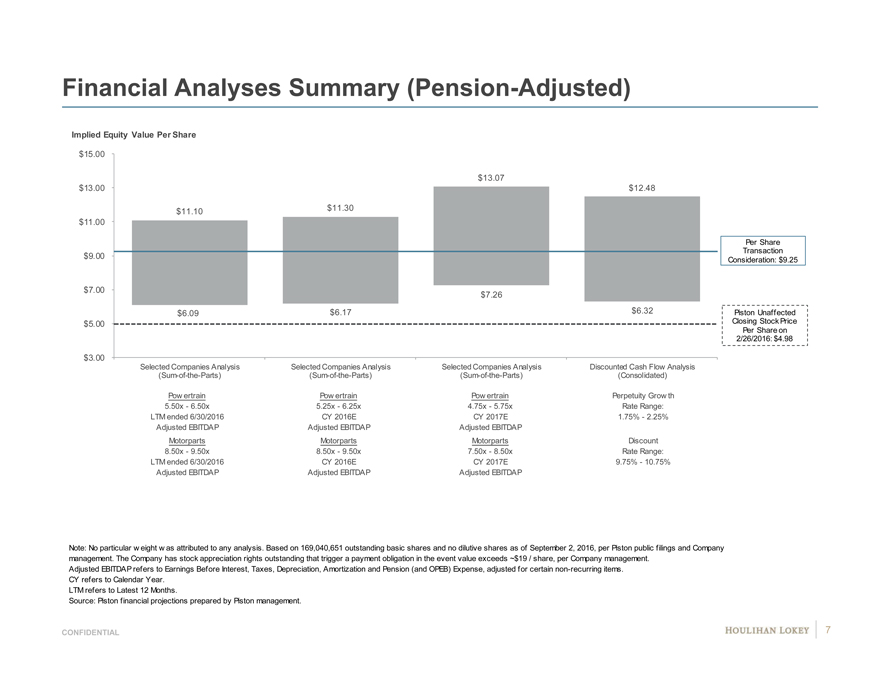
Financial Analyses Summary (Pension-Adjusted)
Implied Equity Value Per Share
$15.00
$13.07
$13.00 $12.48
$11.10 $11.30
$11.00
Per Share
Transaction
$9.00 Consideration: $9.25
$7.00 $7.26
$6.09 $6.17 $6.32Piston Unaffected
$5.00 Closing Stock Price
Per Share on
2/26/2016: $4.98
$3.00
Selected Companies Analysis Selected Companies Analysis Selected Companies AnalysisDiscounted Cash Flow Analysis
(Sum-of-the-Parts) (Sum-of-the-Parts) (Sum-of-the-Parts)(Consolidated)
Pow ertrain Pow ertrain Pow ertrainPerpetuity Grow th
5.50x—6.50x 5.25x—6.25x 4.75x—5.75xRate Range:
LTM ended 6/30/2016 CY 2016E CY 2017E1.75%—2.25%
Adjusted EBITDAP Adjusted EBITDAP Adjusted EBITDAP
Motorparts Motorparts MotorpartsDiscount
8.50x—9.50x 8.50x—9.50x 7.50x—8.50xRate Range:
LTM ended 6/30/2016 CY 2016E CY 2017E9.75%—10.75%
Adjusted EBITDAP Adjusted EBITDAP Adjusted EBITDAP
Note: No particular w eight w as attributed to any analysis. Based on 169,040,651 outstanding basic shares and no dilutive shares as of September 2, 2016, per Piston public filings and Company
management. The Company has stock appreciation rights outstanding that trigger a payment obligation in the event value exceeds ~$19 / share, per Company management.
Adjusted EBITDAP refers to Earnings Before Interest, Taxes, Depreciation, Amortization and Pension (and OPEB) Expense, adjusted for certain non-recurring items.
CY refers to Calendar Year.
LTM refers to Latest 12 Months.
Source: Piston financial projections prepared by Piston management.
CONFIDENTIAL 7
|
|
Page
1. Executive Summary 3
2. Financial Analyses 8
3. Selected Public Market Observations 16
4. Appendix 21
5. Disclaimer 37
|
|
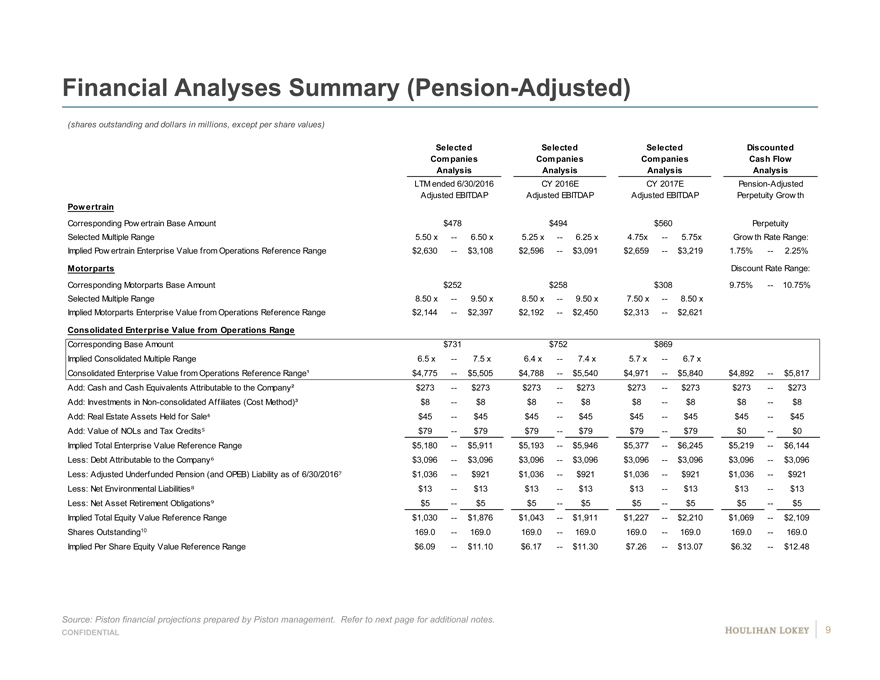
Financial Analyses Summary (Pension-Adjusted)
(shares outstanding and dollars in millions, except per share values)
Selected SelectedSelectedDiscounted
Companies CompaniesCompaniesCash Flow
Analysis AnalysisAnalysisAnalysis
LTM ended 6/30/2016 CY 2016ECY 2017EPension-Adjusted
Adjusted EBITDAP Adjusted EBITDAPAdjusted EBITDAPPerpetuity Grow th
Powertrain Discount Rate Range:
Corresponding Pow ertrain Base Amount $478$494$560Perpetuity
Selected Multiple Range 5.50 x —6.50 x5.25 x—6.25 x4.75x—5.75xGrow th Rate Range:
Implied Pow ertrain Enterprise Value from Operations Reference Range $2,630 —$3,108$2,596—$3,091$2,659—$3,2191.75%—2.25%
Motorparts Discount Rate Range:
Corresponding Motorparts Base Amount $252$258$3089.75%—10.75%
Selected Multiple Range 8.50 x —9.50 x8.50 x—9.50 x7.50 x—8.50 x
Implied Motorparts Enterprise Value from Operations Reference Range $2,144 —$2,397$2,192—$2,450$2,313—$2,621
Consolidated Enterprise Value from Operations Range
Corresponding Base Amount $731$752$869
Implied Consolidated Multiple Range 6.5 x —7.5 x6.4 x—7.4 x5.7 x—6.7 x
Consolidated Enterprise Value from Operations Reference Range¹ $4,775 —$5,505$4,788—$5,540$4,971—$5,840$4,892—$5,817
Add: Cash and Cash Equivalents Attributable to the Company² $273 —$273$273—$273$273—$273$273—$273
Add: Investments in Non-consolidated Affiliates (Cost Method)³ $8 —$8$8—$8$8—$8$8—$8
Add: Real Estate Assets Held for Sale $45 —$45$45—$45$45—$45$45—$45
Add: Value of NOLs and Tax Credits $79 —$79$79—$79$79—$79$0—$0
Implied Total Enterprise Value Reference Range $5,180 —$5,911$5,193—$5,946$5,377—$6,245$5,219—$6,144
Less: Debt Attributable to the Company $3,096 —$3,096$3,096—$3,096$3,096—$3,096$3,096—$3,096
Less: Adjusted Underfunded Pension (and OPEB) Liability as of 6/30/2016 $1,036 —$921$1,036—$921$1,036—$921$1,036—$921
Less: Net Environmental Liabilities $13 —$13$13—$13$13—$13$13—$13
Less: Net Asset Retirement Obligations $5 —$5$5—$5$5—$5$5—$5
Implied Total Equity Value Reference Range $1,030 —$1,876$1,043—$1,911$1,227—$2,210$1,069—$2,109
Shares Outstanding10 169.0 —169.0169.0—169.0169.0—169.0169.0—169.0
Implied Per Share Equity Value Reference Range $6.09 —$11.10$6.17—$11.30$7.26—$13.07$6.32—$12.48
Source: Piston financial projections prepared by Piston management. Refer to next page for additional notes.
CONFIDENTIAL 9
|
|
Financial Analyses Summary (Pension-Adjusted) (cont.) – Footnotes
1. Represents sum of implied enterprise value from operations reference ranges for Pow ertrain and Motorparts.
2. Reflects the Company’s cash balance of $290 million (including $95 million of offshore cash subject to repatriation tax as of December 31, 2015), net of $17 million of pro rata cash attributable to non-controlling interests as of June 30, 2016, per Company management. Assumes no cash from non-consolidated JVs attributable to the Company, per Company management.
3. Represents book value of investments in non-consolidated affiliates accounted for using cost method as of December 31, 2015 (no information available as of June 30, 2016), for w hich earnings are not captured in the Company’s adjusted EBITDA (given insufficient available information), per Company management. Does not include book value of investments in non-consolidated affiliates accounted for using equity method of approximately $258 million (as of June 30, 2016), for w hich earnings are captured in the Company’s adjusted EBITDA, per Company management.
4. Represents estimated value of non-core real estate assets held or available for sale, net of associated sales costs, environmental liabilities and asset retirement obligations, per the Company’s real estate brokers and Company management.
5. Based on $79 million of $1,059 million of asset value of Company NOLs and tax credits not offset by valuation allow ance as of June 30, 2016, per Company management. NOLs and tax credits are incorporated in discounted cash flow analysis through assumed 20.0% tax rate, per Company management. The Company also has a Tax Allocation Agreement (“TAA”) w ith American Entertainment Properties Corp. (“AEP”) pursuant to w hich the Company has contractual rights to 20% of economics of savings generated by AEP’s NOL usage. How ever, per Company management, no NOLs have been used by AEP since inception of the TAA in July 2013 and Company management is unaw are of AEP plans to utilize NOLs going forw ard.
6. Reflects total debt outstanding of $3,109 million, net of $13 million of debt attributable to non-controlling interests as of June 30, 2016, per Company management. Assumes no debt from non-consolidated JVs attributable to the Company, per Company management.
7. Range reflects discount of 10% to 20% relative to the Company’s underfunded pension and post-retirement liabilities of $1,151 million as of June 30, 2016 based on, among other considerations, the follow ing factors, per Company management: (i) approximately 90% of the Company’s obligations reside in the U.S. and Germany, (ii) the Company is not a taxpayer in the U.S. and is not projected to generate income in the U.S. and (iii) the Company pays corporate taxes in Germany based on a corporate rate of 30%.
8. Reflects estimated cost of remediating hazardous substances at third-party sites pursuant to certain national, state and provincial environmental law s and is based on accruals per the Company’s Form 10-Q as of June 30, 2016 and Company management; does not include $44 million of “reasonably possible” exposure based on ongoing assessments, per Company management; figure net of environmental liabilities associated w ith real estate assets held for sale.
9. Reflects estimated remediation costs associated w ith removing hazardous building materials from the Company’s facilities, per Company management; figure net of asset retirement obligations associated w ith real estate assets held for sale.
10. Based on 169,040,651 outstanding basic shares and no dilutive shares as of September 2, 2016, per Piston public filings and Company management. The Company has stock appreciation rights outstanding that trigger a payment obligation in the event value exceeds ~$19 / share, per Company management.
Adjusted EBITDAP refers to Earnings Before Interest, Taxes, Depreciation, Amortization and Pension (and OPEB) Expense, adjusted for certain non-recurring items. E refers to Estimated.
CY refers to Calendar Year. LTM refers to Latest 12 Months.
Source: Piston financial projections prepared by Piston management.
CONFIDENTIAL 10
|
|
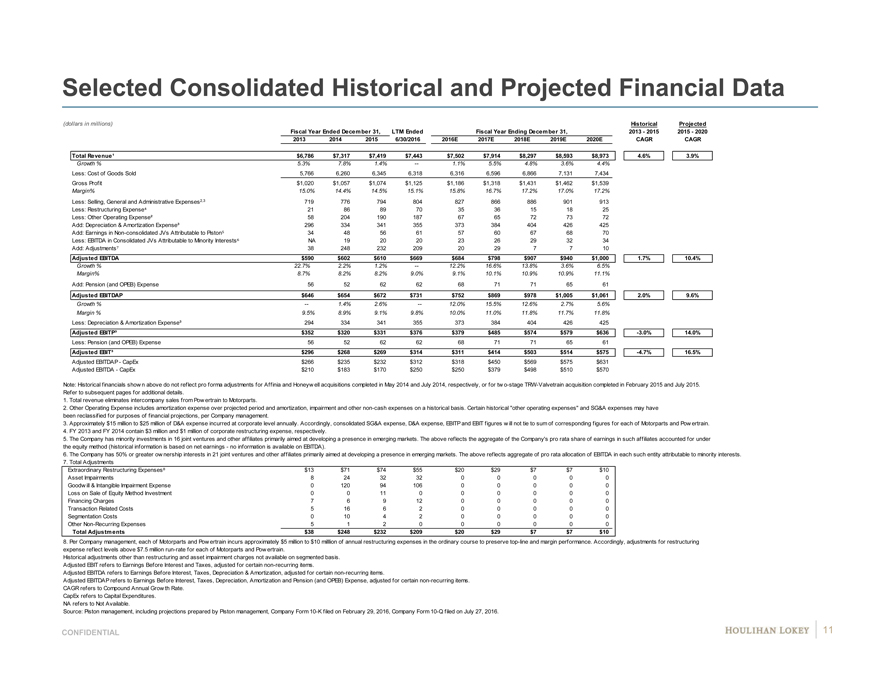
Selected Consolidated Historical and Projected Financial Data
(dollars in millions) HistoricalProjected
Fiscal Year Ended December 31, LTM EndedFiscal Year Ending December 31,2013—20152015—2020
2013 201420156/30/20162016E2017E2018E2019E2020ECAGRCAGR
Total Revenue¹ $6,786 $7,317$7,419$7,443$7,502$7,914$8,297$8,593$8,9734.6%3.9%
Growth % 5.3% 7.8%1.4%—1.1%5.5%4.8%3.6%4.4%
Less: Cost of Goods Sold 5,766 6,2606,3456,3186,3166,5966,8667,1317,434
Gross Profit $1,020 $1,057$1,074$1,125$1,186$1,318$1,431$1,462$1,539
Margin% 15.0% 14.4%14.5%15.1%15.8%16.7%17.2%17.0%17.2%
Less: Selling, General and Administrative Expenses2,3 719 776794804827866886901913
Less: Restructuring Expense 21 8689703536151825
Less: Other Operating Expense² 58 2041901876765727372
Add: Depreciation & Amortization Expense³ 296 334341355373384404426425
Add: Earnings in Non-consolidated JVs Attributable to Piston 34 4856615760676870
Less: EBITDA in Consolidated JVs Attributable to Minority Interests NA 1920202326293234
Add: Adjustments 38 24823220920297710
Adjusted EBITDA $590 $602$610$669$684$798$907$940$1,0001.7%10.4%
Growth % 22.7% 2.2%1.2%—12.2%16.6%13.8%3.6%6.5%
Margin% 8.7% 8.2%8.2%9.0%9.1%10.1%10.9%10.9%11.1%
Add: Pension (and OPEB) Expense 56 5262626871716561
Adjusted EBITDAP $646 $654$672$731$752$869$978$1,005$1,0612.0%9.6%
Growth % — 1.4%2.6%—12.0%15.5%12.6%2.7%5.6%
Margin % 9.5% 8.9%9.1%9.8%10.0%11.0%11.8%11.7%11.8%
Less: Depreciation & Amortization Expense³ 294 334341355373384404426425
Adjusted EBITP³ $352 $320$331$376$379$485$574$579$636-3.0%14.0%
Less: Pension (and OPEB) Expense 56 5262626871716561
Adjusted EBIT³ $296 $268$269$314$311$414$503$514$575-4.7%16.5%
Adjusted EBITDAP—CapEx $266 $235$232$312$318$450$569$575$631
Adjusted EBITDA—CapEx $210 $183$170$250$250$379$498$510$570
Note: Historical financials show n above do not reflect pro forma adjustments for Affinia and Honeyw ell acquisitions completed in May 2014 and July 2014, respectively, or for tw o-stage TRW-Valvetrain acquisition completed in February 2015 and July 2015.
Refer to subsequent pages for additional details.
1. Total revenue eliminates intercompany sales from Pow ertrain to Motorparts.
2. Other Operating Expense includes amortization expense over projected period and amortization, impairment and other non-cash expenses on a historical basis. Certain historical “other operating expenses” and SG&A expenses may have
been reclassified for purposes of financial projections, per Company management.
3. Approximately $15 million to $25 million of D&A expense incurred at corporate level annually. Accordingly, consolidated SG&A expense, D&A expense, EBITP and EBIT figures w ill not tie to sum of corresponding figures for each of Motorparts and Pow ertrain.
4. FY 2013 and FY 2014 contain $3 million and $1 million of corporate restructuring expense, respectively.
5. The Company has minority investments in 16 joint ventures and other affiliates primarily aimed at developing a presence in emerging markets. The above reflects the aggregate of the Company’s pro rata share of earnings in such affiliates accounted for under
the equity method (historical information is based on net earnings—no information is available on EBITDA).
6. The Company has 50% or greater ow nership interests in 21 joint ventures and other affiliates primarily aimed at developing a presence in emerging markets. The above reflects aggregate of pro rata allocation of EBITDA in each such entity attributable to minority interests.
7. Total Adjustments
Extraordinary Restructuring Expenses $13 $71$74$55$20$29$7$7$10
Asset Impairments 8 24323200000
Goodw ill & Intangible Impairment Expense 0 1209410600000
Loss on Sale of Equity Method Investment 0 011000000
Financing Charges 7 691200000
Transaction Related Costs 5 166200000
Segmentation Costs 0 104200000
Other Non-Recurring Expenses 5 12000000
Total Adjustments $38 $248$232$209$20$29$7$7$10
8. Per Company management, each of Motorparts and Pow ertrain incurs approximately $5 million to $10 milllion of annual restructuring expenses in the ordinary course to preserve top-line and margin performance. Accordingly, adjustments for restructuring
expense reflect levels above $7.5 million run-rate for each of Motorparts and Pow ertrain.
Historical adjustments other than restructuring and asset impairment charges not available on segmented basis.
Adjusted EBIT refers to Earnings Before Interest and Taxes, adjusted for certain non-recurring items.
Adjusted EBITDA refers to Earnings Before Interest, Taxes, Depreciation & Amortization, adjusted for certain non-recurring items.
Adjusted EBITDAP refers to Earnings Before Interest, Taxes, Depreciation, Amortization and Pension (and OPEB) Expense, adjusted for certain non-recurring items.
CAGR refers to Compound Annual Grow th Rate.
CapEx refers to Capital Expenditures.
NA refers to Not Available.
Source: Piston management, including projections prepared by Piston management, Company Form 10-K filed on February 29, 2016, Company Form 10-Q filed on July 27, 2016.
CONFIDENTIAL 11
|
|
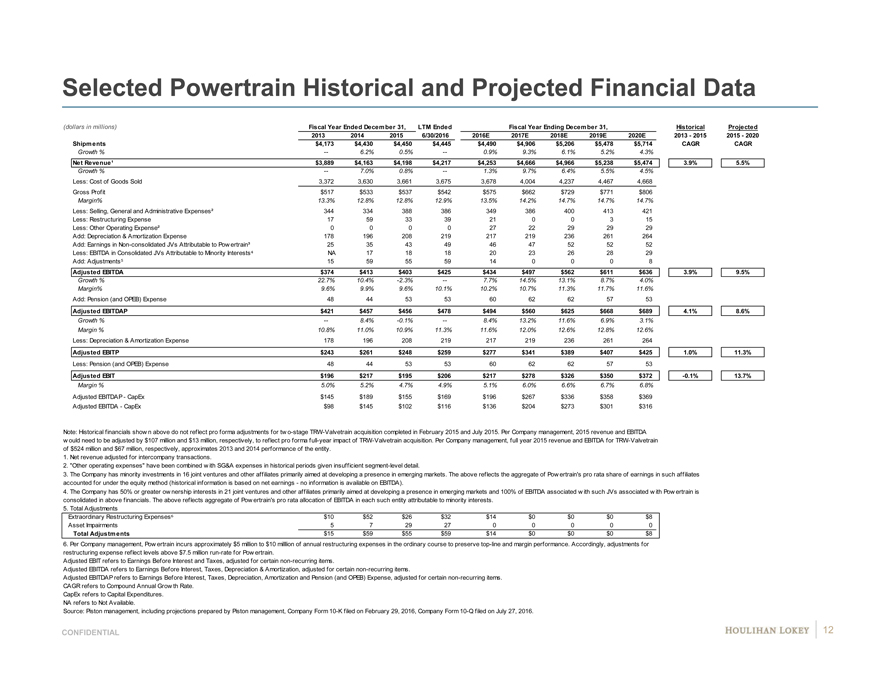
Selected Powertrain Historical and Projected Financial Data
(dollars in millions) Fiscal Year Ended December 31, LTM EndedFiscal Year Ending December 31,HistoricalProjected
2013 201420156/30/20162016E2017E2018E2019E2020E2013—20152015—2020
Shipments $4,173 $4,430$4,450$4,445$4,490$4,906$5,206$5,478$5,714CAGRCAGR
Growth % — 6.2%0.5%—0.9%9.3%6.1%5.2%4.3%
Net Revenue¹ $3,889 $4,163$4,198$4,217$4,253$4,666$4,966$5,238$5,4743.9%5.5%
Growth % — 7.0%0.8%—1.3%9.7%6.4%5.5%4.5%
Less: Cost of Goods Sold 3,372 3,6303,6613,6753,6784,0044,2374,4674,668
Gross Profit $517 $533$537$542$575$662$729$771$806
Margin% 13.3% 12.8%12.8%12.9%13.5%14.2%14.7%14.7%14.7%
Less: Selling, General and Administrative Expenses² 344 334388386349386400413421
Less: Restructuring Expense 17 5933392100315
Less: Other Operating Expense² 0 0002722292929
Add: Depreciation & Amortization Expense 178 196208219217219236261264
Add: Earnings in Non-consolidated JVs Attributable to Pow ertrain³ 25 3543494647525252
Less: EBITDA in Consolidated JVs Attributable to Minority Interests NA 1718182023262829
Add: Adjustments 15 595559140008
Adjusted EBITDA $374 $413$403$425$434$497$562$611$6363.9%9.5%
Growth % 22.7% 10.4%-2.3%—7.7%14.5%13.1%8.7%4.0%
Margin% 9.6% 9.9%9.6%10.1%10.2%10.7%11.3%11.7%11.6%
Add: Pension (and OPEB) Expense 48 4453536062625753
Adjusted EBITDAP $421 $457$456$478$494$560$625$668$6894.1%8.6%
Growth % — 8.4%-0.1%—8.4%13.2%11.6%6.9%3.1%
Margin % 10.8% 11.0%10.9%11.3%11.6%12.0%12.6%12.8%12.6%
Less: Depreciation & Amortization Expense 178 196208219217219236261264
Adjusted EBITP $243 $261$248$259$277$341$389$407$4251.0%11.3%
Less: Pension (and OPEB) Expense 48 4453536062625753
Adjusted EBIT $196 $217$195$206$217$278$326$350$372-0.1%13.7%
Margin % 5.0% 5.2%4.7%4.9%5.1%6.0%6.6%6.7%6.8%
Adjusted EBITDAP—CapEx $145 $189$155$169$196$267$336$358$369
Adjusted EBITDA—CapEx $98 $145$102$116$136$204$273$301$316
Note: Historical financials show n above do not reflect pro forma adjustments for tw o-stage TRW-Valvetrain acquisition completed in February 2015 and July 2015. Per Company management, 2015 revenue and EBITDA
w ould need to be adjusted by $107 million and $13 million, respectively, to reflect pro forma full-year impact of TRW-Valvetrain acquisition. Per Company management, full year 2015 revenue and EBITDA for TRW-Valvetrain
of $524 million and $67 million, respectively, approximates 2013 and 2014 performance of the entity.
1. Net revenue adjusted for intercompany transactions.
2. “Other operating expenses” have been combined w ith SG&A expenses in historical periods given insufficient segment-level detail.
3. The Company has minority investments in 16 joint ventures and other affiliates primarily aimed at developing a presence in emerging markets. The above reflects the aggregate of Pow ertrain’s pro rata share of earnings in such affiliates
accounted for under the equity method (historical information is based on net earnings—no information is available on EBITDA).
4. The Company has 50% or greater ow nership interests in 21 joint ventures and other affiliates primarily aimed at developing a presence in emerging markets and 100% of EBITDA associated w ith such JVs associated w ith Pow ertrain is
consolidated in above financials. The above reflects aggregate of Pow ertrain’s pro rata allocation of EBITDA in each such entity attributable to minority interests.
5. Total Adjustments
Extraordinary Restructuring Expenses $10 $52$26$32$14$0$0$0$8
Asset Impairments 5 7292700000
Total Adjustments $15 $59$55$59$14$0$0$0$8
6. Per Company management, Pow ertrain incurs approximately $5 million to $10 milllion of annual restructuring expenses in the ordinary course to preserve top-line and margin performance. Accordingly, adjustments for
restructuring expense reflect levels above $7.5 million run-rate for Pow ertrain.
Adjusted EBIT refers to Earnings Before Interest and Taxes, adjusted for certain non-recurring items.
Adjusted EBITDA refers to Earnings Before Interest, Taxes, Depreciation & Amortization, adjusted for certain non-recurring items.
Adjusted EBITDAP refers to Earnings Before Interest, Taxes, Depreciation, Amortization and Pension (and OPEB) Expense, adjusted for certain non-recurring items.
CAGR refers to Compound Annual Grow th Rate.
CapEx refers to Capital Expenditures.
NA refers to Not Available.
Source: Piston management, including projections prepared by Piston management, Company Form 10-K filed on February 29, 2016, Company Form 10-Q filed on July 27, 2016.
CONFIDENTIAL 12
|
|
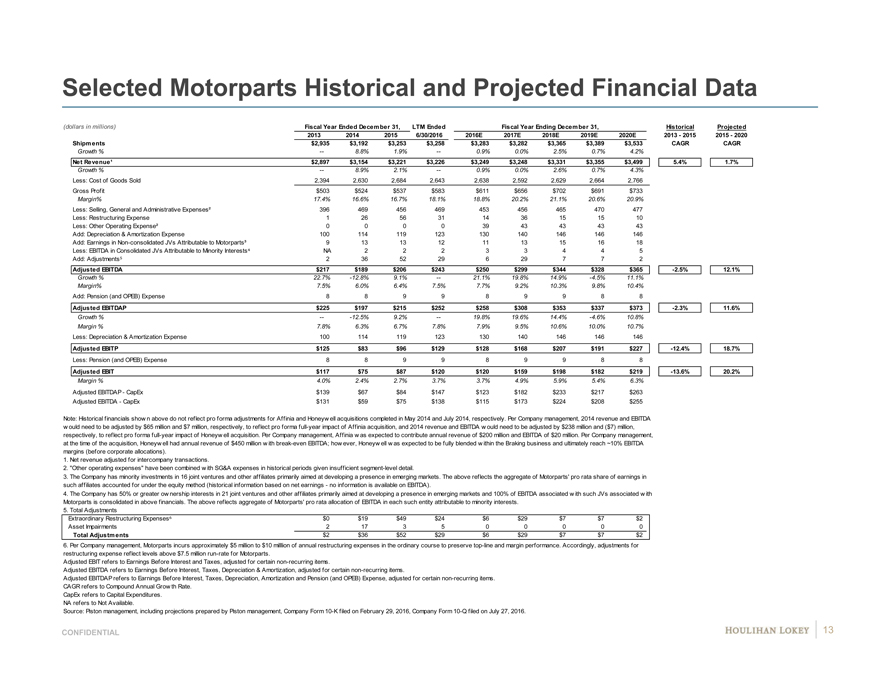
Selected Motorparts Historical and Projected Financial Data
(dollars in millions) Fiscal Year Ended December 31, LTM EndedFiscal Year Ending December 31,HistoricalProjected
2013 201420156/30/20162016E2017E2018E2019E2020E2013—20152015—2020
Shipments $2,935 $3,192$3,253$3,258$3,283$3,282$3,365$3,389$3,533CAGRCAGR
Growth % — 8.8%1.9%—0.9%0.0%2.5%0.7%4.2%
Net Revenue¹ $2,897 $3,154$3,221$3,226$3,249$3,248$3,331$3,355$3,4995.4%1.7%
Growth % — 8.9%2.1%—0.9%0.0%2.6%0.7%4.3%
Less: Cost of Goods Sold 2,394 2,6302,6842,6432,6382,5922,6292,6642,766
Gross Profit $503 $524$537$583$611$656$702$691$733
Margin% 17.4% 16.6%16.7%18.1%18.8%20.2%21.1%20.6%20.9%
Less: Selling, General and Administrative Expenses² 396 469456469453456465470477
Less: Restructuring Expense 1 2656311436151510
Less: Other Operating Expense² 0 0003943434343
Add: Depreciation & Amortization Expense 100 114119123130140146146146
Add: Earnings in Non-consolidated JVs Attributable to Motorparts³ 9 1313121113151618
Less: EBITDA in Consolidated JVs Attributable to Minority Interests NA 22233445
Add: Adjustments 2 365229629772
Adjusted EBITDA $217 $189$206$243$250$299$344$328$365-2.5%12.1%
Growth % 22.7% -12.8%9.1%—21.1%19.8%14.9%-4.5%11.1%
Margin% 7.5% 6.0%6.4%7.5%7.7%9.2%10.3%9.8%10.4%
Add: Pension (and OPEB) Expense 8 89989988
Adjusted EBITDAP $225 $197$215$252$258$308$353$337$373-2.3%11.6%
Growth % — -12.5%9.2%—19.8%19.6%14.4%-4.6%10.8%
Margin % 7.8% 6.3%6.7%7.8%7.9%9.5%10.6%10.0%10.7%
Less: Depreciation & Amortization Expense 100 114119123130140146146146
Adjusted EBITP $125 $83$96$129$128$168$207$191$227-12.4%18.7%
Less: Pension (and OPEB) Expense 8 89989988
Adjusted EBIT $117 $75$87$120$120$159$198$182$219-13.6%20.2%
Margin % 4.0% 2.4%2.7%3.7%3.7%4.9%5.9%5.4%6.3%
Adjusted EBITDAP—CapEx $139 $67$84$147$123$182$233$217$263
Adjusted EBITDA—CapEx $131 $59$75$138$115$173$224$208$255
Note: Historical financials show n above do not reflect pro forma adjustments for Affinia and Honeyw ell acquisitions completed in May 2014 and July 2014, respectively. Per Company management, 2014 revenue and EBITDA
w ould need to be adjusted by $65 million and $7 million, respectively, to reflect pro forma full-year impact of Affinia acquisition, and 2014 revenue and EBITDA w ould need to be adjusted by $238 million and ($7) million,
respectively, to reflect pro forma full-year impact of Honeyw ell acquisition. Per Company management, Affinia w as expected to contribute annual revenue of $200 million and EBITDA of $20 million. Per Company management,
at the time of the acquisition, Honeyw ell had annual revenue of $450 million w ith break-even EBITDA; how ever, Honeyw ell w as expected to be fully blended w ithin the Braking business and ultimately reach ~10% EBITDA
margins (before corporate allocations).
1. Net revenue adjusted for intercompany transactions.
2. “Other operating expenses” have been combined w ith SG&A expenses in historical periods given insufficient segment-level detail.
3. The Company has minority investments in 16 joint ventures and other affiliates primarily aimed at developing a presence in emerging markets. The above reflects the aggregate of Motorparts’ pro rata share of earnings in
such affiliates accounted for under the equity method (historical information based on net earnings—no information is available on EBITDA).
4. The Company has 50% or greater ow nership interests in 21 joint ventures and other affiliates primarily aimed at developing a presence in emerging markets and 100% of EBITDA associated w ith such JVs associated w ith
Motorparts is consolidated in above financials. The above reflects aggregate of Motorparts’ pro rata allocation of EBITDA in each such entity attributable to minority interests.
5. Total Adjustments
Extraordinary Restructuring Expenses $0 $19$49$24$6$29$7$7$2
Asset Impairments 2 173500000
Total Adjustments $2 $36$52$29$6$29$7$7$2
6. Per Company management, Motorparts incurs approximately $5 million to $10 milllion of annual restructuring expenses in the ordinary course to preserve top-line and margin performance. Accordingly, adjustments for
restructuring expense reflect levels above $7.5 million run-rate for Motorparts.
Adjusted EBIT refers to Earnings Before Interest and Taxes, adjusted for certain non-recurring items.
Adjusted EBITDA refers to Earnings Before Interest, Taxes, Depreciation & Amortization, adjusted for certain non-recurring items.
Adjusted EBITDAP refers to Earnings Before Interest, Taxes, Depreciation, Amortization and Pension (and OPEB) Expense, adjusted for certain non-recurring items.
CAGR refers to Compound Annual Grow th Rate.
CapEx refers to Capital Expenditures.
NA refers to Not Available.
Source: Piston management, including projections prepared by Piston management, Company Form 10-K filed on February 29, 2016, Company Form 10-Q filed on July 27, 2016.
CONFIDENTIAL 13
|
|
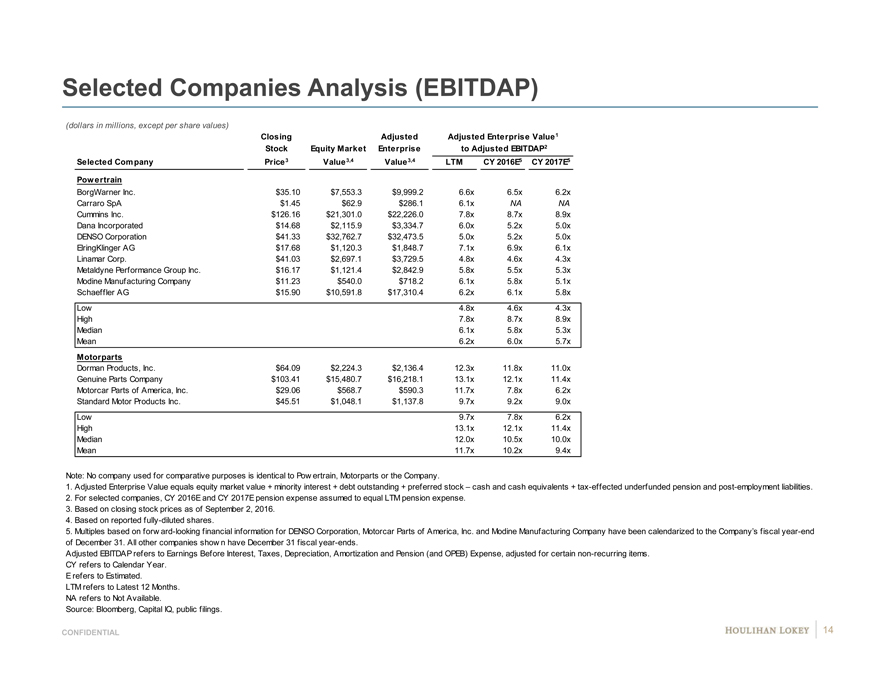
Selected Companies Analysis (EBITDAP)
(dollars in millions, except per share values)
Closing AdjustedAdjusted Enterprise Value1
Stock Equity MarketEnterpriseto Adjusted EBITDAP2
Selected Company Price 3 Value 3,4Value 3,4LTMCY 2016E5CY 2017E5
Powertrain
BorgWarner Inc. $35.10 $7,553.3$9,999.26.6x6.5x6.2x6 9
Carraro SpA $1.45 $62.9$286.16.1xNANA N NA
Cummins Inc. $126.16 $21,301.0$22,226.07.8x8.7x8.9x9 #
Dana Incorporated $14.68 $2,115.9$3,334.76.0x5.2x5.0x5 9
DENSO Corporation $41.33 $32,762.7$32,473.55.0x5.2x5.0x5 #
ElringKlinger AG $17.68 $1,120.3$1,848.77.1x6.9x6.1x6 #
Linamar Corp. $41.03 $2,697.1$3,729.54.8x4.6x4.3x4 9
Metaldyne Performance Group Inc. $16.17 $1,121.4$2,842.95.8x5.5x5.3x5 9
Modine Manufacturing Company $11.23 $540.0$718.26.1x5.8x5.1x5 #
Schaeffler AG $15.90 $10,591.8$17,310.46.2x6.1x5.8x6 #
Low 4.8x4.6x4.3x
High 7.8x8.7x8.9x
Median 6.1x5.8x5.3x
Mean 6.2x6.0x5.7x
Motorparts
Dorman Products, Inc. $64.09 $2,224.3$2,136.412.3x11.8x11.0x# #
Genuine Parts Company $103.41 $15,480.7$16,218.113.1x12.1x11.4x# #
Motorcar Parts of America, Inc. $29.06 $568.7$590.311.7x7.8x6.2x6 7
Standard Motor Products Inc. $45.51 $1,048.1$1,137.89.7x9.2x9.0x9 NA
Low 9.7x7.8x6.2x
High 13.1x12.1x11.4x
Median 12.0x10.5x10.0x
Mean 11.7x10.2x9.4x
Note: No company used for comparative purposes is identical to Pow ertrain, Motorparts or the Company.
1. Adjusted Enterprise Value equals equity market value + minority interest + debt outstanding + preferred stock – cash and cash equivalents + tax-effected underfunded pension and post-employment liabilities.
2. For selected companies, CY 2016E and CY 2017E pension expense assumed to equal LTM pension expense.
3. Based on closing stock prices as of September 2, 2016.
4. Based on reported fully-diluted shares.
5. Multiples based on forw ard-looking financial information for DENSO Corporation, Motorcar Parts of America, Inc. and Modine Manufacturing Company have been calendarized to the Company’s fiscal year-end
of December 31. All other companies show n have December 31 fiscal year-ends.
Adjusted EBITDAP refers to Earnings Before Interest, Taxes, Depreciation, Amortization and Pension (and OPEB) Expense, adjusted for certain non-recurring items.
CY refers to Calendar Year.
E refers to Estimated.
LTM refers to Latest 12 Months.
NA refers to Not Available.
Source: Bloomberg, Capital IQ, public filings.
CONFIDENTIAL 14
|
|
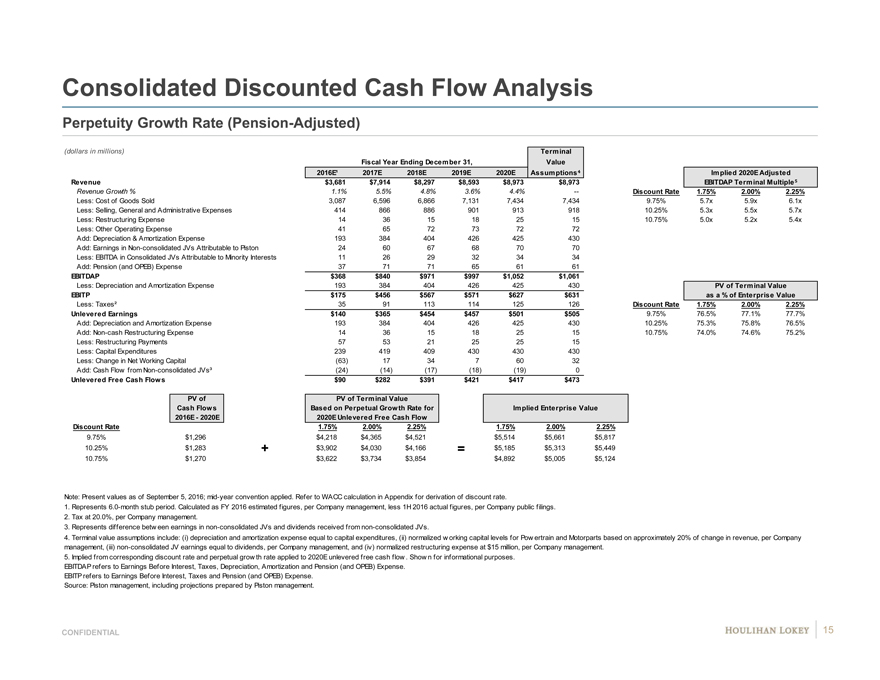
Consolidated Discounted Cash Flow Analysis
Perpetuity Growth Rate (Pension-Adjusted)
(dollars in millions) Terminal
Fiscal Year Ending December 31,Value
2016E¹2017E2018E2019E2020E Assumptions Implied 2020E Adjusted
Revenue $3,681$7,914$8,297$8,593$8,973$8,973EBITDAP Terminal Multiple
Revenue Growth % 1.1%5.5%4.8%3.6%4.4%—Discount Rate1.75%2.00%2.25%
Less: Cost of Goods Sold 3,0876,5966,8667,1317,4347,4349.75%5.7x5.9x6.1x
Less: Selling, General and Administrative Expenses 41486688690191391810.25%5.3x5.5x5.7x
Less: Restructuring Expense 14361518251510.75%5.0x5.2x5.4x
Less: Other Operating Expense 416572737272
Add: Depreciation & Amortization Expense 193384404426425430
Add: Earnings in Non-consolidated JVs Attributable to Piston 24 6067687070
Less: EBITDA in Consolidated JVs Attributable to Minority Interests 11 2629323434
Add: Pension (and OPEB) Expense 377171656161
EBITDAP $368$840$971$997$1,052$1,061
Less: Depreciation and Amortization Expense 193384404426425430PV of Terminal Value
EBITP $175$456$567$571$627$631as a % of Enterprise Value
Less: Taxes² 3591113114125126Discount Rate1.75%2.00%2.25%
Unlevered Earnings $140$365$454$457$501$5059.75%76.5%77.1%77.7%
Add: Depreciation and Amortization Expense 19338440442642543010.25%75.3%75.8%76.5%
Add: Non-cash Restructuring Expense 14361518251510.75%74.0%74.6%75.2%
Less: Restructuring Payments 575321252515
Less: Capital Expenditures 239419409430430430
Less: Change in Net Working Capital (63)173476032
Add: Cash Flow from Non-consolidated JVs³ (24)(14)(17)(18)(19)0
Unlevered Free Cash Flows $90$282$391$421$417$473
PV ofPV of Terminal Value
Cash FlowsBased on Perpetual Growth Rate forImplied Enterprise Value
2016E—2020E2020E Unlevered Free Cash Flow
Discount Rate 1.75%2.00%2.25%1.75%2.00%2.25%
9.75% 0.098 $1,296$4,218$4,365$4,521$5,514$5,661$5,817
10.25% 0.103 $1,283+$3,902$4,030$4,166=$5,185$5,313$5,449
10.75% 0.108 $1,270$3,622$3,734$3,854$4,892$5,005$5,124
Note: Present values as of September 5, 2016; mid-year convention applied. Refer to WACC calculation in Appendix for derivation of discount rate.
1. Represents 6.0-month stub period. Calculated as FY 2016 estimated figures, per Company management, less 1H 2016 actual figures, per Company public filings.
2. Tax at 20.0%, per Company management.
3. Represents difference betw een earnings in non-consolidated JVs and dividends received from non-consolidated JVs.
4. Terminal value assumptions include: (i) depreciation and amortization expense equal to capital expenditures, (ii) normalized w orking capital levels for Pow ertrain and Motorparts based on approximately 20% of change in revenue, per Company
management, (iii) non-consolidated JV earnings equal to dividends, per Company management, and (iv) normalized restructuring expense at $15 million, per Company management.
5. Implied from corresponding discount rate and perpetual grow th rate applied to 2020E unlevered free cash flow . Show n for informational purposes.
EBITDAP refers to Earnings Before Interest, Taxes, Depreciation, Amortization and Pension (and OPEB) Expense.
EBITP refers to Earnings Before Interest, Taxes and Pension (and OPEB) Expense.
Source: Piston management, including projections prepared by Piston management.
CONFIDENTIAL 15
|
|
Page
1. Executive Summary 3
2. Financial Analyses 8
3. Selected Public Market Observations 16
4. Appendix 21
5. Disclaimer 37
|
|
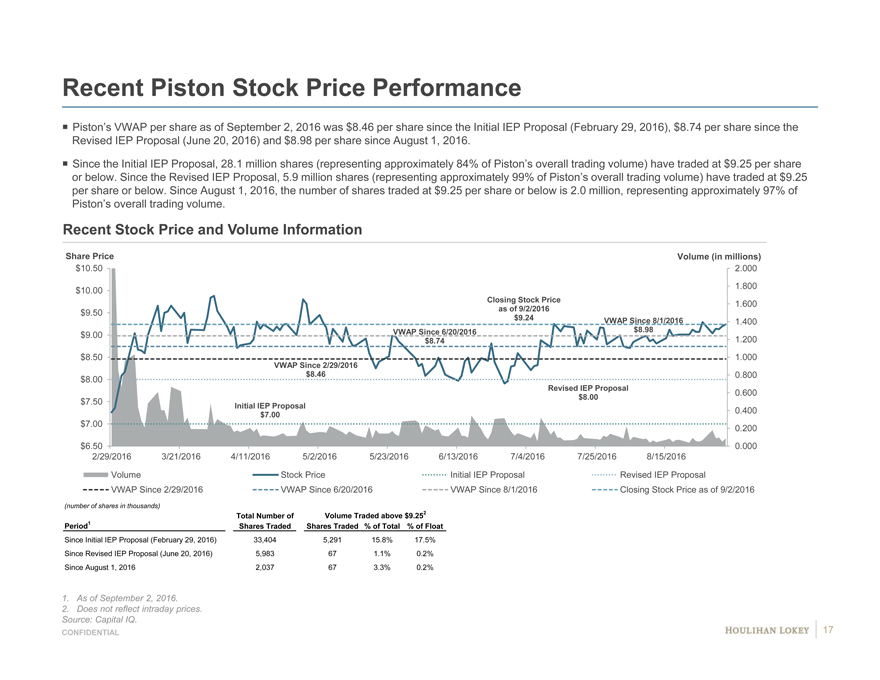
Recent Piston Stock Price Performance
Piston’s VWAP per share as of September 2, 2016 was $8.46 per share since the Initial IEP Proposal (February 29, 2016), $8.74 per share since the
Revised IEP Proposal (June 20, 2016) and $8.98 per share since August 1, 2016.
Since the Initial IEP Proposal, 28.1 million shares (representing approximately 84% of Piston’s overall trading volume) have traded at $9.25 per share
or below. Since the Revised IEP Proposal, 5.9 million shares (representing approximately 99% of Piston’s overall trading volume) have traded at $9.25
per share or below. Since August 1, 2016, the number of shares traded at $9.25 per share or below is 2.0 million, representing approximately 97% of
Piston’s overall trading volume.
Recent Stock Price and Volume Information
Share Price Volume (in millions)
$10.50 2.000
$10.00 1.800
Closing Stock Price1.600
$9.50 as of 9/2/2016
$9.24VWAP Since 8/1/20161.400
$9.00 VWAP Since 6/20/2016$8.98
$8.741.200
$8.50 1.000
VWAP Since 2/29/2016
$8.00 $8.460.800
Revised IEP Proposal0.600
$7.50 $8.00
Initial IEP Proposal
$7.000.400
$7.00 0.200
$6.50 0.000
2/29/2016 3/21/2016 4/11/20165/2/20165/23/20166/13/20167/4/20167/25/20168/15/2016
Volume Stock PriceInitial IEP ProposalRevised IEP Proposal
VWAP Since 2/29/2016 VWAP Since 6/20/2016 VWAP Since 8/1/2016Closing Stock Price as of 9/2/2016
(number of shares in thousands)
Total Number ofVolume Traded above $9.252
Period1 Shares TradedShares Traded% of Total % of Float
Since Initial IEP Proposal (February 29, 2016) 33,404 5,29115.8%17.5%
Since Revised IEP Proposal (June 20, 2016) 5,983 671.1%0.2%
Since August 1, 2016 2,037673.3%0.2%
1. As of September 2, 2016.
2. Does not reflect intraday prices.
Source: Capital IQ.
CONFIDENTIAL 17
|
|
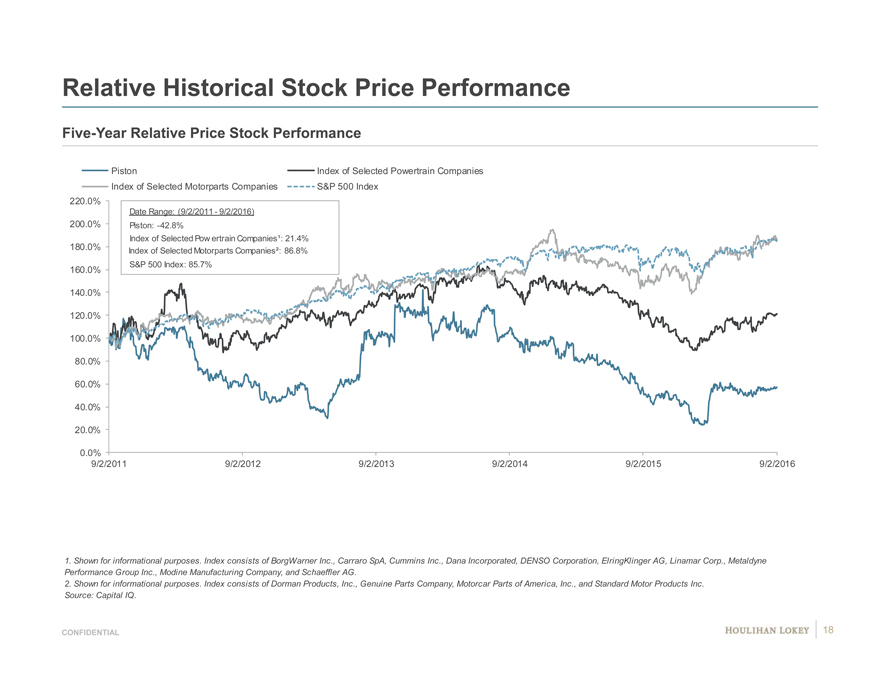
Relative Historical Stock Price Performance
Five-Year Relative Price Stock Performance
Piston Index of Selected Powertrain Companies
Index of Selected Motorparts Companies S&P 500 Index
220.0%
Date Range: (9/2/2011—9/2/2016)
200.0% Piston: -42.8%
Index of Selected Pow ertrain Companies¹: 21.4%
180.0% Index of Selected Motorparts Companies²: 86.8%
160.0% S&P 500 Index: 85.7%
140.0%
120.0%
100.0%
80.0%
60.0%
40.0%
20.0%
0.0%
9/2/2011 9/2/2012 9/2/20139/2/20149/2/20159/2/2016
1. Shown for informational purposes. Index consists of BorgWarner Inc., Carraro SpA, Cummins Inc., Dana Incorporated, DENSO Corporation, ElringKlinger AG, Linamar Corp., Metaldyne
Performance Group Inc., Modine Manufacturing Company, and Schaeffler AG.
2. Shown for informational purposes. Index consists of Dorman Products, Inc., Genuine Parts Company, Motorcar Parts of America, Inc., and Standard Motor Products Inc.
Source: Capital IQ.
CONFIDENTIAL 18
|
|
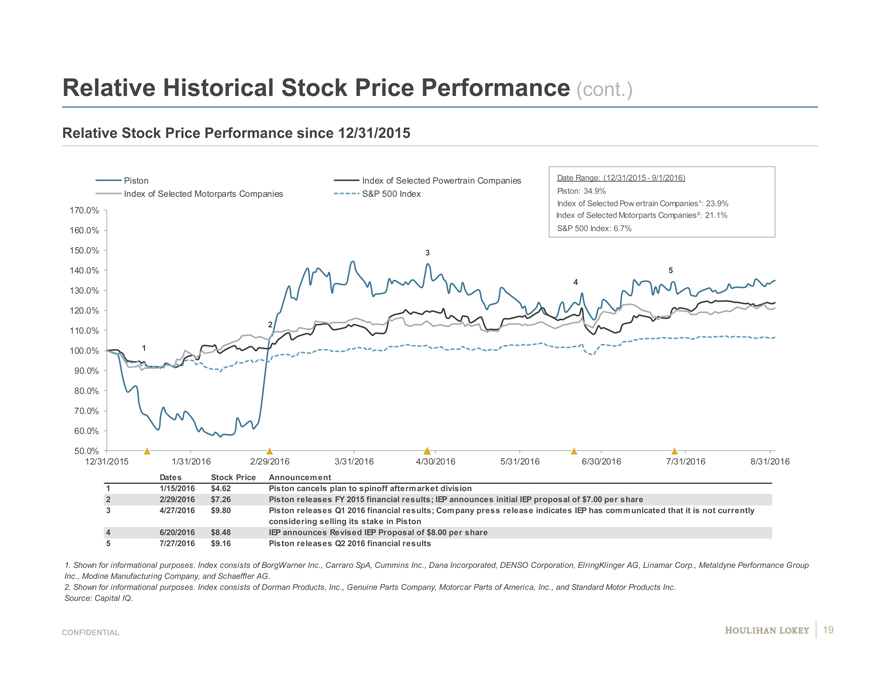
Relative Historical Stock Price Performance (cont.)
Relative Stock Price Performance since 12/31/2015
Piston Index of Selected Powertrain CompaniesDate Range: (12/31/2015—9/1/2016)
Index of Selected Motorparts Companies S&P 500 Index Piston: 34.9%
Index of Selected Pow ertrain Companies¹: 23.9%
170.0% Index of Selected Motorparts Companies²: 21.1%
160.0% S&P 500 Index: 6.7%
150.0% 3
140.0% 5
4
130.0%
120.0%
2
110.0%
100.0% 1
90.0%
80.0%
70.0%
60.0%
50.0%
12/31/2015 1/31/2016 2/29/20163/31/20164/30/20165/31/20166/30/20167/31/20168/31/2016
Dates Stock PriceAnnouncement
1 1/15/2016 $4.62Piston cancels plan to spinoff aftermarket division
2 2/29/2016 $7.26Piston releases FY 2015 financial results; IEP announces initial IEP proposal of $7.00 per share
3 4/27/2016 $9.80Piston releases Q1 2016 financial results; Company press release indicates IEP has communicated that it is not currently
considering selling its stake in Piston
4 6/20/2016 $8.48IEP announces Revised IEP Proposal of $8.00 per share
5 7/27/2016 $9.16Piston releases Q2 2016 financial results
1. Shown for informational purposes. Index consists of BorgWarner Inc., Carraro SpA, Cummins Inc., Dana Incorporated, DENSO Corporation, ElringKlinger AG, Linamar Corp., Metaldyne Performance Group
Inc., Modine Manufacturing Company, and Schaeffler AG.
2. Shown for informational purposes. Index consists of Dorman Products, Inc., Genuine Parts Company, Motorcar Parts of America, Inc., and Standard Motor Products Inc.
Source: Capital IQ.
CONFIDENTIAL 19
|
|
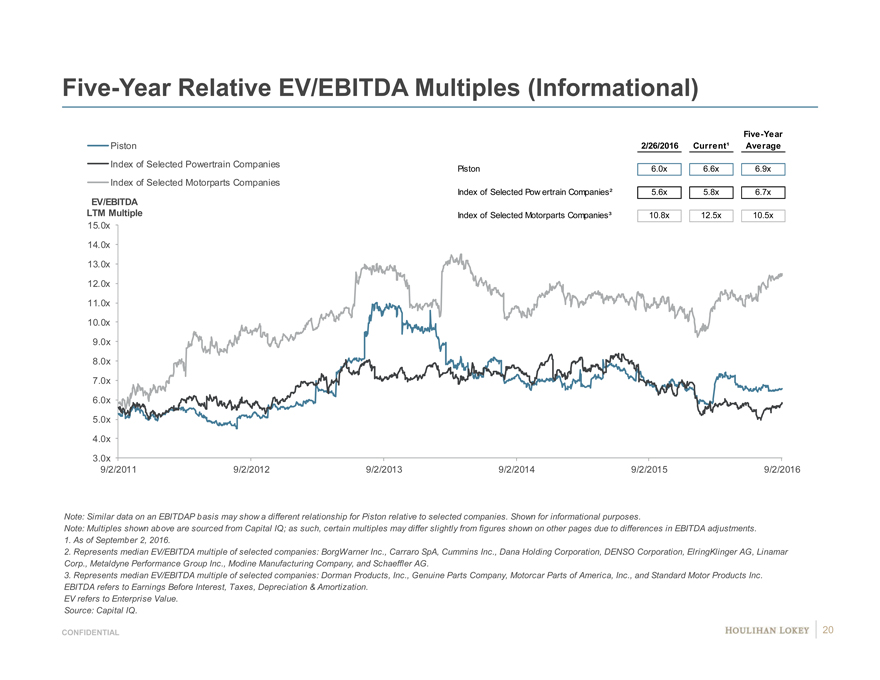
Five-Year Relative EV/EBITDA Multiples (Informational)
Five-Year
Piston 2/26/2016Current¹Average
Index of Selected Powertrain Companies Piston6.0x6.6x6.9x
Index of Selected Motorparts Companies
Index of Selected Pow ertrain Companies²5.6x5.8x6.7x
EV/EBITDA
LTM Multiple Index of Selected Motorparts Companies³10.8x12.5x10.5x
15.0x
14.0x
13.0x
12.0x
11.0x
10.0x
9.0x
8.0x
7.0x
6.0x
5.0x
4.0x
3.0x
9/2/2011 9/2/2012 9/2/20139/2/20149/2/20159/2/2016
Note: Similar data on an EBITDAP basis may show a different relationship for Piston relative to selected companies. Shown for informational purposes.
Note: Multiples shown above are sourced from Capital IQ; as such, certain multiples may differ slightly from figures shown on other pages due to differences in EBITDA adjustments.
1. As of September 2, 2016.
2. Represents median EV/EBITDA multiple of selected companies: BorgWarner Inc., Carraro SpA, Cummins Inc., Dana Holding Corporation, DENSO Corporation, ElringKlinger AG, Linamar
Corp., Metaldyne Performance Group Inc., Modine Manufacturing Company, and Schaeffler AG.
3. Represents median EV/EBITDA multiple of selected companies: Dorman Products, Inc., Genuine Parts Company, Motorcar Parts of America, Inc., and Standard Motor Products Inc.
EBITDA refers to Earnings Before Interest, Taxes, Depreciation & Amortization.
EV refers to Enterprise Value.
Source: Capital IQ.
CONFIDENTIAL 20
|
|
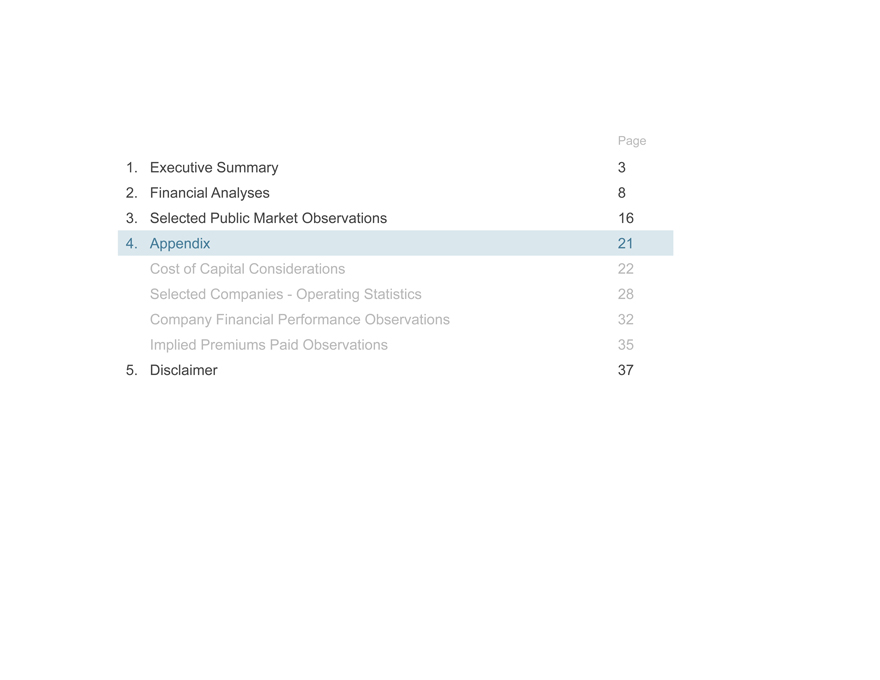
Page
1. Executive Summary 3
2. Financial Analyses 8
3. Selected Public Market Observations 16
4. Appendix 21 Cost of Capital Considerations 22 Selected Companies—Operating Statistics 28 Company Financial Performance Observations 32 Implied Premiums Paid Observations 35
5. Disclaimer 37
|
|
Page
1. Executive Summary 3
2. Financial Analyses 8
3. Selected Public Market Observations 16
4. Appendix 21 Cost of Capital Considerations 22 Selected Companies—Operating Statistics 28 Company Financial Performance Observations 32 Implied Premiums Paid Observations 35
5. Disclaimer 37
|
|
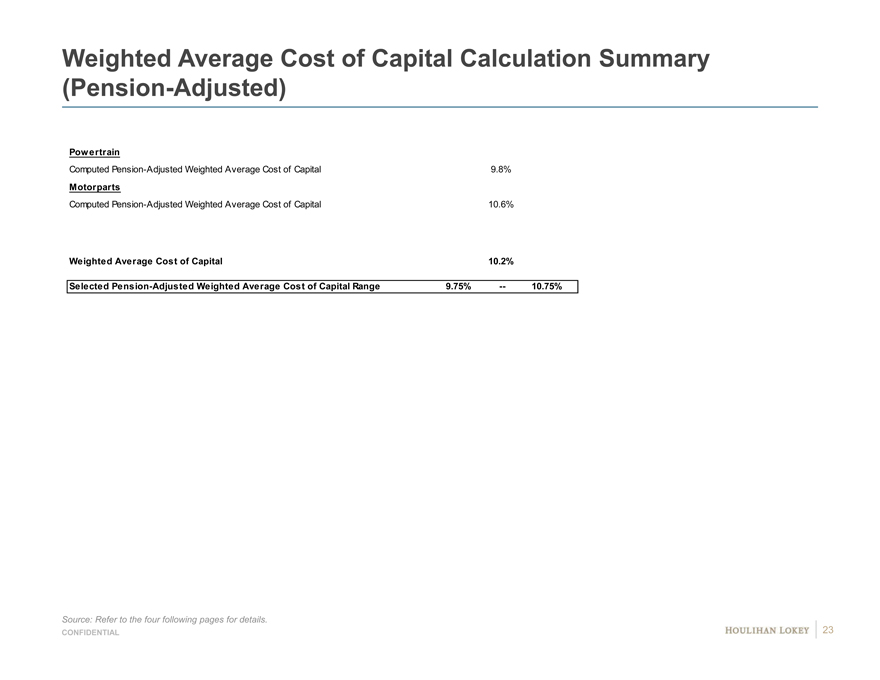
Weighted Average Cost of Capital Calculation Summary
(Pension-Adjusted)
Powertrain
Computed Pension-Adjusted Weighted Average Cost of Capital 9.8%
Motorparts
Computed Pension-Adjusted Weighted Average Cost of Capital 10.6%
Weighted Average Cost of Capital 10.2%
Selected Pension-Adjusted Weighted Average Cost of Capital Range 9.75% — 10.75%
Source: Refer to the four following pages for details.
CONFIDENTIAL 23
|
|
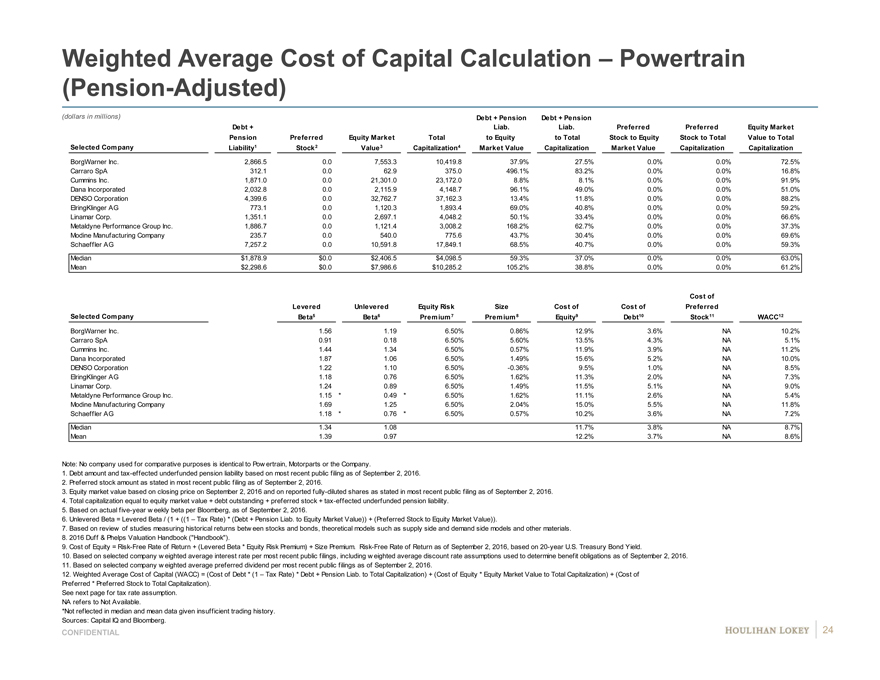
Weighted Average Cost of Capital Calculation – Powertrain
(Pension-Adjusted)
(dollars in millions) Debt + PensionDebt + Pension
Debt + Liab.Liab.PreferredPreferredEquity Market
Pension PreferredEquity MarketTotalto Equityto TotalStock to EquityStock to TotalValue to Total
Selected Company Liability1 Stock2Value3Capitalization4Market ValueCapitalizationMarket ValueCapitalizationCapitalization
BorgWarner Inc. 2,866.5#0.0#7,553.3#10,419.8#37.9% #27.5% #0.0% #0.0%#72.5%#
Carraro SpA 312.1#0.0#62.9#375.0#496.1% #83.2% #0.0% #0.0%#16.8%#
Cummins Inc. 1,871.0#0.0#21,301.0#23,172.0#8.8% #8.1% #0.0% #0.0%#91.9%#
Dana Incorporated 2,032.8#0.0#2,115.9#4,148.7#96.1% #49.0% #0.0% #0.0%#51.0%#
DENSO Corporation 4,399.6#0.0#32,762.7#37,162.3#13.4% #11.8% #0.0% #0.0%#88.2%#
ElringKlinger AG 773.1#0.0#1,120.3#1,893.4#69.0% #40.8% #0.0% #0.0%#59.2%#
Linamar Corp. 1,351.1#0.0#2,697.1#4,048.2#50.1% #33.4% #0.0% #0.0%#66.6%#
Metaldyne Performance Group Inc. 1,886.7#0.0#1,121.4#3,008.2#168.2% #62.7% #0.0% #0.0%#37.3%#
Modine Manufacturing Company 235.7#0.0#540.0#775.6#43.7% #30.4% #0.0% #0.0%#69.6%#
Schaeffler AG 7,257.2#0.0#10,591.8#17,849.1#68.5% #40.7% #0.0% #0.0%#59.3%#
Median $1,878.9$0.0$2,406.5$4,098.559.3%37.0%0.0%0.0%63.0%
Mean $2,298.6$0.0$7,986.6$10,285.2105.2%38.8%0.0%0.0%61.2%
Cost of
LeveredUnleveredEquity RiskSizeCost ofCost ofPreferred
Selected Company Beta5Beta6Premium 7Premium 8Equity9Debt10Stock11WACC12
BorgWarner Inc. 1.56#1.19#6.50%0.86%12.9% #3.6% #NA#10.2%0
Carraro SpA 0.91#0.18#6.50%5.60%13.5% #4.3% #NA#5.1%0
Cummins Inc. 1.44#1.34#6.50%0.57%11.9% #3.9% #NA#11.2%0
Dana Incorporated 1.87#1.06#6.50%1.49%15.6% #5.2% #NA#10.0%0
DENSO Corporation 1.22#1.10#6.50%-0.36%9.5% #1.0% #NA#8.5%0
ElringKlinger AG 1.18#0.76#6.50%1.62%11.3% #2.0% #NA#7.3%0
Linamar Corp. 1.24#0.89#6.50%1.49%11.5% #5.1% #NA#9.0%0
Metaldyne Performance Group Inc. 1.15*0.49*6.50%1.62%11.1% #2.6% #NA#5.4%0
Modine Manufacturing Company 1.69#1.25#6.50%2.04%15.0% #5.5% #NA#11.8%0
Schaeffler AG 1.18*0.76*6.50%0.57%10.2% #3.6% #NA#7.2%0
Median 1.341.0811.7%3.8%NA8.7%
Mean 1.390.9712.2%3.7%NA8.6%
Note: No company used for comparative purposes is identical to Pow ertrain, Motorparts or the Company.
1. Debt amount and tax-effected underfunded pension liability based on most recent public filing as of September 2, 2016.
2. Preferred stock amount as stated in most recent public filing as of September 2, 2016.
3. Equity market value based on closing price on September 2, 2016 and on reported fully-diluted shares as stated in most recent public filing as of September 2, 2016.
4. Total capitalization equal to equity market value + debt outstanding + preferred stock + tax-effected underfunded pension liability.
5. Based on actual five-year w eekly beta per Bloomberg, as of September 2, 2016.
6. Unlevered Beta = Levered Beta / (1 + ((1 – Tax Rate) * (Debt + Pension Liab. to Equity Market Value)) + (Preferred Stock to Equity Market Value)).
7. Based on review of studies measuring historical returns betw een stocks and bonds, theoretical models such as supply side and demand side models and other materials.
8. 2016 Duff & Phelps Valuation Handbook (“Handbook”).
9. Cost of Equity = Risk-Free Rate of Return + (Levered Beta * Equity Risk Premium) + Size Premium. Risk-Free Rate of Return as of September 2, 2016, based on 20-year U.S. Treasury Bond Yield.
10. Based on selected company w eighted average interest rate per most recent public filings, including w eighted average discount rate assumptions used to determine benefit obligations as of September 2, 2016.
11. Based on selected company w eighted average preferred dividend per most recent public filings as of September 2, 2016.
12. Weighted Average Cost of Capital (WACC) = (Cost of Debt * (1 – Tax Rate) * Debt + Pension Liab. to Total Capitalization) + (Cost of Equity * Equity Market Value to Total Capitalization) + (Cost of
Preferred * Preferred Stock to Total Capitalization).
See next page for tax rate assumption.
NA refers to Not Available.
*Not reflected in median and mean data given insufficient trading history.
Sources: Capital IQ and Bloomberg.
CONFIDENTIAL 24
|
|
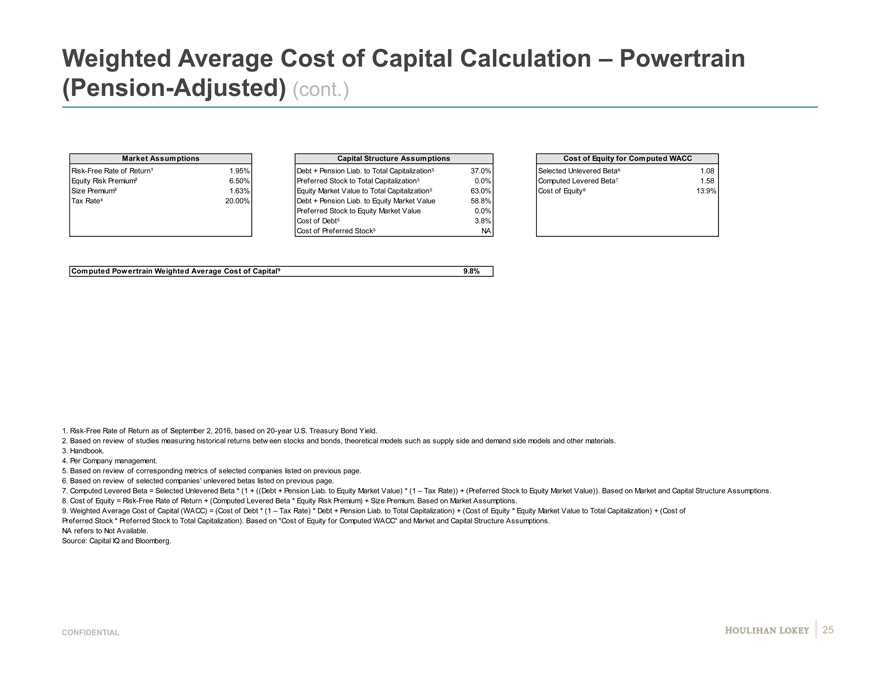
Weighted Average Cost of Capital Calculation – Powertrain
(Pension-Adjusted) (cont.)
Market Assumptions Capital Structure AssumptionsCost of Equity for Computed WACC
Risk-Free Rate of Return¹ 1.95% Debt + Pension Liab. to Total Capitalization 37.0%Selected Unlevered Beta 1.08
Equity Risk Premium² 6.50% Preferred Stock to Total Capitalization 0.0%Computed Levered Beta 1.58
Size Premium³ 1.63%Equity Market Value to Total Capitalization 63.0%Cost of Equity 13.9%
Tax Rate 20.00%Debt + Pension Liab. to Equity Market Value58.8%
Preferred Stock to Equity Market Value0.0%
Cost of Debt 3.8%
Cost of Preferred Stock NA
Computed Powertrain Weighted Average Cost of Capital 9.8%
1. Risk-Free Rate of Return as of September 2, 2016, based on 20-year U.S. Treasury Bond Yield.
2. Based on review of studies measuring historical returns betw een stocks and bonds, theoretical models such as supply side and demand side models and other materials.
3. Handbook.
4. Per Company management.
5. Based on review of corresponding metrics of selected companies listed on previous page.
6. Based on review of selected companies’ unlevered betas listed on previous page.
7. Computed Levered Beta = Selected Unlevered Beta * (1 + ((Debt + Pension Liab. to Equity Market Value) * (1 – Tax Rate)) + (Preferred Stock to Equity Market Value)). Based on Market and Capital Structure Assumptions.
8. Cost of Equity = Risk-Free Rate of Return + (Computed Levered Beta * Equity Risk Premium) + Size Premium. Based on Market Assumptions.
9. Weighted Average Cost of Capital (WACC) = (Cost of Debt * (1 – Tax Rate) * Debt + Pension Liab. to Total Capitalization) + (Cost of Equity * Equity Market Value to Total Capitalization) + (Cost of
Preferred Stock * Preferred Stock to Total Capitalization). Based on “Cost of Equity for Computed WACC” and Market and Capital Structure Assumptions.
NA refers to Not Available.
Source: Capital IQ and Bloomberg.
CONFIDENTIAL 25
|
|

Weighted Average Cost of Capital Calculation – Motorparts
(Pension-Adjusted)
(dollars in millions) Debt + PensionDebt + Pension
Debt + Liab.Liab.PreferredPreferredEquity Market
Pension PreferredEquity MarketTotalto Equityto TotalStock to EquityStock to TotalValue to Total
Selected Company Liability1 Stock2Value3Capitalization4Market ValueCapitalizationMarket ValueCapitalizationCapitalization
Dorman Products, Inc. $0.0 #$0.0#$2,224.3#$2,224.3#0.0% #0.0%#0.0%#0.0% #100.0%#
Genuine Parts Company 958.5 #0.0#15,480.7#16,439.1#6.2% #5.8%#0.0%#0.0% #94.2%#
Motorcar Parts of America, Inc. 43.3 #0.0#568.7#612.0#7.6% #7.1%#0.0%#0.0% #92.9%#
Standard Motor Products Inc. 102.1 #0.0#1,048.1#1,150.2#9.7% #8.9%#0.0%#0.0% #91.1%#
Median $72.7 $0.0$1,636.2$1,687.36.9%6.5%0.0%0.0%93.5%
Mean $276.0 $0.0$4,830.4$5,106.45.9%5.4%0.0%0.0%94.6%
Cost of
LeveredUnleveredEquity RiskSizeCost ofCost ofPreferred
Selected Company Beta5Beta6Premium 7Premium 8Equity9Debt10Stock11WACC12
Dorman Products, Inc. 1.12#1.12#6.50%1.49%10.7%#NA *NA#10.7%0
Genuine Parts Company 1.01#0.97#6.50%0.57%9.1%#3.2%#NA#8.7%0
Motorcar Parts of America, Inc. 1.16#1.09#6.50%2.04%11.5%#3.1%#NA#10.9%0
Standard Motor Products Inc. 1.38#1.28#6.50%1.62%12.6%#2.3%#NA#11.6%0
Median 1.141.1011.1%3.1%NA10.8%
Mean 1.171.1111.0%2.8%NA10.5%
Note: No company used for comparative purposes is identical to Pow ertrain, Motorparts or the Company.
1. Debt amount and tax-effected underfunded pension liability based on most recent public filing as of September 2, 2016.
2. Preferred stock amount as stated in most recent public filing as of September 2, 2016.
3. Equity market value based on closing price on September 2, 2016 and on reported fully-diluted shares as stated in most recent public filing as of September 2, 2016.
4. Total capitalization equal to equity market value + debt outstanding + preferred stock + tax-effected underfunded pension liability.
5. Based on actual five-year w eekly beta per Bloomberg, as of September 2, 2016.
6. Unlevered Beta = Levered Beta / (1 + ((1 – Tax Rate) * (Debt + Pension Liab. to Equity Market Value)) + (Preferred Stock to Equity Market Value)).
7. Based on review of studies measuring historical returns betw een stocks and bonds, theoretical models such as supply side and demand side models and other materials.
8. 2016 Duff & Phelps Valuation Handbook (“Handbook”).
9. Cost of Equity = Risk-Free Rate of Return + (Levered Beta * Equity Risk Premium) + Size Premium. Risk-Free Rate of Return as of September 2, 2016, based on 20-year U.S. Treasury Bond Yield.
10. Based on selected company w eighted average interest rate per most recent public filings, including w eighted average discount rate assumptions used to determine benefit obligations as of September 2, 2016.
11. Based on selected company w eighted average preferred dividend per most recent public filings as of September 2, 2016.
12. Weighted Average Cost of Capital (WACC) = (Cost of Debt * (1 – Tax Rate) * Debt + Pension Liab. to Total Capitalization) + (Cost of Equity * Equity Market Value to Total Capitalization) + (Cost
of Preferred * Preferred Stock to Total Capitalization).
See next page for tax rate assumption.
NA refers to Not Available.
*Not reflected in median and mean data given insufficient trading history.
Sources: Capital IQ and Bloomberg.
CONFIDENTIAL 26
|
|

Weighted Average Cost of Capital Calculation – Motorparts
(Pension-Adjusted) (cont.)
Market Assumptions Capital Structure AssumptionsCost of Equity for Computed WACC
Risk-Free Rate of Return¹ 1.95% Debt + Pension Liab. to Total Capitalization 6.5%Selected Unlevered Beta 1.10
Equity Risk Premium² 6.50% Preferred Stock to Total Capitalization 0.0%Computed Levered Beta 1.17
Size Premium³ 1.63%Equity Market Value to Total Capitalization 93.5%Cost of Equity 11.2%
Tax Rate 20.00%Debt + Pension Liab. to Equity Market Value6.9%
Preferred Stock to Equity Market Value0.0%
Cost of Debt 3.1%
Cost of Preferred Stock NA
Computed Motorparts Weighted Average Cost of Capital 10.6%
1. Risk-Free Rate of Return as of September 2, 2016, based on 20-year U.S. Treasury Bond Yield.
2. Based on review of studies measuring historical returns betw een stocks and bonds, theoretical models such as supply side and demand side models and other materials.
3. Handbook.
4. Per Company management.
5. Based on review of corresponding metrics of selected companies listed on previous page.
6. Based on review of selected companies’ unlevered betas listed on previous page.
7. Computed Levered Beta = Selected Unlevered Beta * (1 + ((Debt + Pension Liab. to Equity Market Value) * (1 – Tax Rate)) + (Preferred Stock to Equity Market Value)). Based on Market and Capital Structure Assumptions.
8. Cost of Equity = Risk-Free Rate of Return + (Computed Levered Beta * Equity Risk Premium) + Size Premium. Based on Market Assumptions.
9. Weighted Average Cost of Capital (WACC) = (Cost of Debt * (1 – Tax Rate) * Debt + Pension Liab. to Total Capitalization) + (Cost of Equity * Equity Market Value to Total Capitalization) + (Cost of
Preferred Stock * Preferred Stock to Total Capitalization). Based on “Cost of Equity for Computed WACC” and Market and Capital Structure Assumptions.
NA refers to Not Available.
Source: Capital IQ and Bloomberg.
CONFIDENTIAL 27
|
|
Page
1. Executive Summary 3
2. Financial Analyses 8
3. Selected Public Market Observations 16
4. Appendix 21
Cost of Capital Considerations 22
Selected Companies—Operating Statistics 28
Company Financial Performance Observations 32
Implied Premiums Paid Observations 35
5. Disclaimer 37
|
|
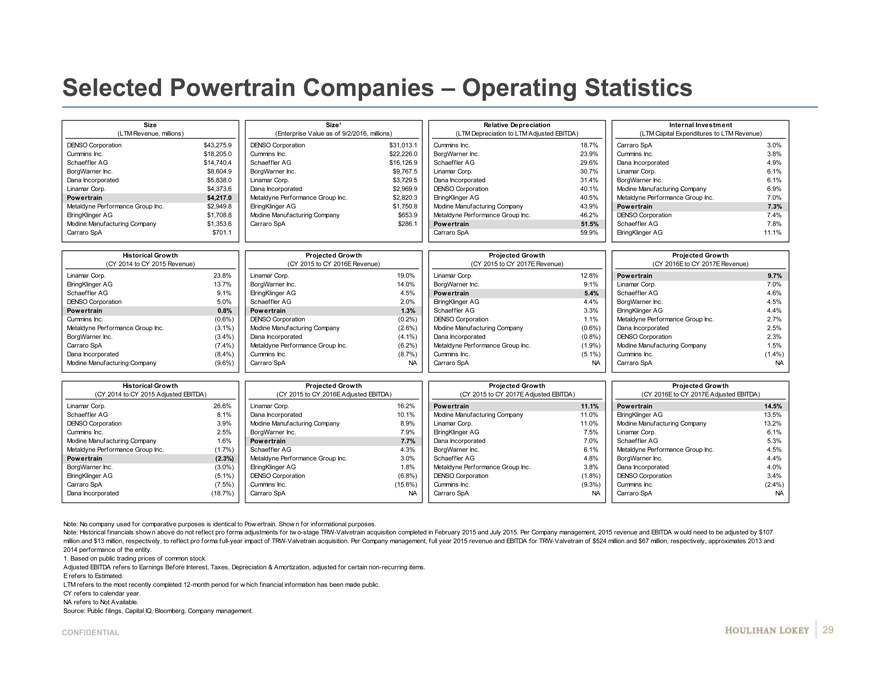
Selected Powertrain Companies – Operating Statistics
Size Size¹Relative DepreciationInternal Investment
(LTM Revenue, millions) (Enterprise Value as of 9/2/2016, millions)(LTM Depreciation to LTM Adjusted EBITDA)(LTM Capital Expenditures to LTM Revenue)
DENSO Corporation $43,275.9 DENSO Corporation$31,013.1Cummins Inc.18.7%Carraro SpA3.0%
Cummins Inc. $18,205.0 Cummins Inc.$22,226.0BorgWarner Inc.23.9%Cummins Inc.3.8%
Schaeffler AG $14,740.4 Schaeffler AG$16,126.9Schaeffler AG29.6%Dana Incorporated4.9%
BorgWarner Inc. $8,604.9 BorgWarner Inc.$9,767.5Linamar Corp.30.7%Linamar Corp.6.1%
Dana Incorporated $5,838.0 Linamar Corp.$3,729.5Dana Incorporated31.4%BorgWarner Inc.6.1%
Linamar Corp. $4,373.6 Dana Incorporated$2,969.9DENSO Corporation40.1%Modine Manufacturing Company6.9%
Powertrain $4,217.0 Metaldyne Performance Group Inc.$2,820.3ElringKlinger AG40.5%Metaldyne Performance Group Inc.7.0%
Metaldyne Performance Group Inc. $2,949.8 ElringKlinger AG$1,750.8Modine Manufacturing Company43.9%Powertrain7.3%
ElringKlinger AG $1,708.8 Modine Manufacturing Company$653.9Metaldyne Performance Group Inc.46.2%DENSO Corporation7.4%
Modine Manufacturing Company $1,353.6 Carraro SpA$286.1Powertrain51.5%Schaeffler AG7.8%
Carraro SpA $701.1 Carraro SpA59.9%ElringKlinger AG11.1%
Historical Growth Projected GrowthProjected GrowthProjected Growth
(CY 2014 to CY 2015 Revenue) (CY 2015 to CY 2016E Revenue)(CY 2015 to CY 2017E Revenue)(CY 2016E to CY 2017E Revenue)
Linamar Corp. 23.8% Linamar Corp.19.0%Linamar Corp.12.8%Powertrain9.7%
ElringKlinger AG 13.7% BorgWarner Inc.14.0%BorgWarner Inc.9.1%Linamar Corp.7.0%
Schaeffler AG 9.1% ElringKlinger AG4.5%Powertrain5.4%Schaeffler AG4.6%
DENSO Corporation 5.0% Schaeffler AG2.0%ElringKlinger AG4.4%BorgWarner Inc.4.5%
Powertrain 0.8% Powertrain1.3%Schaeffler AG3.3%ElringKlinger AG4.4%
Cummins Inc. (0.6%) DENSO Corporation(0.2%)DENSO Corporation1.1%Metaldyne Performance Group Inc.2.7%
Metaldyne Performance Group Inc. (3.1%) Modine Manufacturing Company(2.6%)Modine Manufacturing Company(0.6%)Dana Incorporated2.5%
BorgWarner Inc. (3.4%) Dana Incorporated(4.1%)Dana Incorporated(0.8%)DENSO Corporation2.3%
Carraro SpA (7.4%) Metaldyne Performance Group Inc.(6.2%)Metaldyne Performance Group Inc.(1.9%)Modine Manufacturing Company1.5%
Dana Incorporated (8.4%) Cummins Inc.(8.7%)Cummins Inc.(5.1%)Cummins Inc.(1.4%)
Modine Manufacturing Company (9.6%) Carraro SpANACarraro SpANACarraro SpANA
Historical Growth Projected GrowthProjected GrowthProjected Growth
(CY 2014 to CY 2015 Adjusted EBITDA) (CY 2015 to CY 2016E Adjusted EBITDA) (CY 2015 to CY 2017E Adjusted EBITDA)(CY 2016E to CY 2017E Adjusted EBITDA)
Linamar Corp. 26.6% Linamar Corp.16.2%Powertrain11.1%Powertrain14.5%
Schaeffler AG 8.1% Dana Incorporated10.1%Modine Manufacturing Company11.0%ElringKlinger AG13.5%
DENSO Corporation 3.9% Modine Manufacturing Company8.9%Linamar Corp.11.0%Modine Manufacturing Company13.2%
Cummins Inc. 2.5% BorgWarner Inc.7.9%ElringKlinger AG7.5%Linamar Corp.6.1%
Modine Manufacturing Company 1.6% Powertrain7.7%Dana Incorporated7.0%Schaeffler AG5.3%
Metaldyne Performance Group Inc. (1.7%) Schaeffler AG4.3%BorgWarner Inc.6.1%Metaldyne Performance Group Inc.4.5%
Powertrain (2.3%) Metaldyne Performance Group Inc.3.0%Schaeffler AG4.8%BorgWarner Inc.4.4%
BorgWarner Inc. (3.0%) ElringKlinger AG1.8%Metaldyne Performance Group Inc.3.8%Dana Incorporated4.0%
ElringKlinger AG (5.1%) DENSO Corporation(6.8%)DENSO Corporation(1.8%)DENSO Corporation3.4%
Carraro SpA (7.5%) Cummins Inc.(15.6%)Cummins Inc.(9.3%)Cummins Inc.(2.4%)
Dana Incorporated (18.7%) Carraro SpANACarraro SpANACarraro SpANA
Note: No company used for comparative purposes is identical to Pow ertrain. Show n for informational purposes.
Note: Historical financials show n above do not reflect pro forma adjustments for tw o-stage TRW-Valvetrain acquisition completed in February 2015 and July 2015. Per Company management, 2015 revenue and EBITDA w ould need to be adjusted by $107
million and $13 million, respectively, to reflect pro forma full-year impact of TRW-Valvetrain acquisition. Per Company management, full year 2015 revenue and EBITDA for TRW-Valvetrain of $524 million and $67 million, respectively, approximates 2013 and
2014 performance of the entity.
1. Based on public trading prices of common stock.
Adjusted EBITDA refers to Earnings Before Interest, Taxes, Depreciation & Amortization, adjusted for certain non-recurring items.
E refers to Estimated.
LTM refers to the most recently completed 12-month period for w hich financial information has been made public.
CY refers to calendar year.
NA refers to Not Available.
Source: Public filings, Capital IQ, Bloomberg, Company management.
CONFIDENTIAL 29
|
|
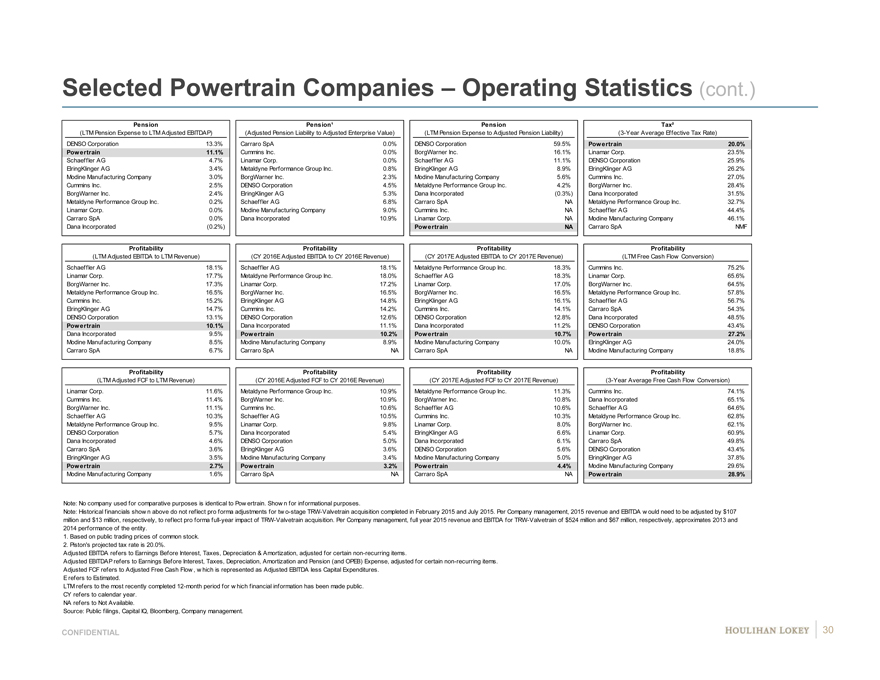
Selected Powertrain Companies – Operating Statistics (cont.)
Pension Pension¹PensionTax²
(LTM Pension Expense to LTM Adjusted EBITDAP) (Adjusted Pension Liability to Adjusted Enterprise Value) (LTM Pension Expense to Adjusted Pension Liability)(3-Year Average Effective Tax Rate)
DENSO Corporation 13.3% Carraro SpA0.0%DENSO Corporation59.5%Powertrain20.0%
Powertrain 11.1% Cummins Inc.0.0%BorgWarner Inc.16.1%Linamar Corp.23.5%
Schaeffler AG 4.7% Linamar Corp.0.0%Schaeffler AG11.1%DENSO Corporation25.9%
ElringKlinger AG 3.4% Metaldyne Performance Group Inc.0.8%ElringKlinger AG8.9%ElringKlinger AG26.2%
Modine Manufacturing Company 3.0% BorgWarner Inc.2.3%Modine Manufacturing Company5.6%Cummins Inc.27.0%
Cummins Inc. 2.5% DENSO Corporation4.5%Metaldyne Performance Group Inc.4.2%BorgWarner Inc.28.4%
BorgWarner Inc. 2.4% ElringKlinger AG5.3%Dana Incorporated(0.3%)Dana Incorporated31.5%
Metaldyne Performance Group Inc. 0.2% Schaeffler AG6.8%Carraro SpANAMetaldyne Performance Group Inc.32.7%
Linamar Corp. 0.0% Modine Manufacturing Company9.0%Cummins Inc.NASchaeffler AG44.4%
Carraro SpA 0.0% Dana Incorporated10.9%Linamar Corp.NAModine Manufacturing Company46.1%
Dana Incorporated (0.2%) PowertrainNACarraro SpANMF
Profitability ProfitabilityProfitabilityProfitability
(LTM Adjusted EBITDA to LTM Revenue) (CY 2016E Adjusted EBITDA to CY 2016E Revenue)(CY 2017E Adjusted EBITDA to CY 2017E Revenue)(LTM Free Cash Flow Conversion)
Schaeffler AG 18.1% Schaeffler AG18.1%Metaldyne Performance Group Inc.18.3%Cummins Inc.75.2%
Linamar Corp. 17.7% Metaldyne Performance Group Inc.18.0%Schaeffler AG18.3%Linamar Corp.65.6%
BorgWarner Inc. 17.3% Linamar Corp.17.2%Linamar Corp.17.0%BorgWarner Inc.64.5%
Metaldyne Performance Group Inc. 16.5% BorgWarner Inc.16.5%BorgWarner Inc.16.5%Metaldyne Performance Group Inc.57.8%
Cummins Inc. 15.2% ElringKlinger AG14.8%ElringKlinger AG16.1%Schaeffler AG56.7%
ElringKlinger AG 14.7% Cummins Inc.14.2%Cummins Inc.14.1%Carraro SpA54.3%
DENSO Corporation 13.1% DENSO Corporation12.6%DENSO Corporation12.8%Dana Incorporated48.5%
Powertrain 10.1% Dana Incorporated11.1%Dana Incorporated11.2%DENSO Corporation43.4%
Dana Incorporated 9.5% Powertrain10.2%Powertrain10.7%Powertrain27.2%
Modine Manufacturing Company 8.5% Modine Manufacturing Company8.9%Modine Manufacturing Company10.0%ElringKlinger AG24.0%
Carraro SpA 6.7% Carraro SpANACarraro SpANAModine Manufacturing Company18.8%
Profitability ProfitabilityProfitabilityProfitability
(LTM Adjusted FCF to LTM Revenue) (CY 2016E Adjusted FCF to CY 2016E Revenue)(CY 2017E Adjusted FCF to CY 2017E Revenue)(3-Year Average Free Cash Flow Conversion)
Linamar Corp. 11.6% Metaldyne Performance Group Inc.10.9%Metaldyne Performance Group Inc.11.3%Cummins Inc.74.1%
Cummins Inc. 11.4% BorgWarner Inc.10.9%BorgWarner Inc.10.8%Dana Incorporated65.1%
BorgWarner Inc. 11.1% Cummins Inc.10.6%Schaeffler AG10.6%Schaeffler AG64.6%
Schaeffler AG 10.3% Schaeffler AG10.5%Cummins Inc.10.3%Metaldyne Performance Group Inc.62.8%
Metaldyne Performance Group Inc. 9.5% Linamar Corp.9.8%Linamar Corp.8.0%BorgWarner Inc.62.1%
DENSO Corporation 5.7% Dana Incorporated5.4%ElringKlinger AG6.6%Linamar Corp.60.9%
Dana Incorporated 4.6% DENSO Corporation5.0%Dana Incorporated6.1%Carraro SpA49.8%
Carraro SpA 3.6% ElringKlinger AG3.6%DENSO Corporation5.6%DENSO Corporation43.4%
ElringKlinger AG 3.5% Modine Manufacturing Company3.4%Modine Manufacturing Company5.0%ElringKlinger AG37.8%
Powertrain 2.7% Powertrain3.2%Powertrain4.4%Modine Manufacturing Company29.6%
Modine Manufacturing Company 1.6% Carraro SpANACarraro SpANAPowertrain28.9%
Note: No company used for comparative purposes is identical to Pow ertrain. Show n for informational purposes.
Note: Historical financials show n above do not reflect pro forma adjustments for tw o-stage TRW-Valvetrain acquisition completed in February 2015 and July 2015. Per Company management, 2015 revenue and EBITDA w ould need to be adjusted by $107
million and $13 million, respectively, to reflect pro forma full-year impact of TRW-Valvetrain acquisition. Per Company management, full year 2015 revenue and EBITDA for TRW-Valvetrain of $524 million and $67 million, respectively, approximates 2013 and
2014 performance of the entity.
1. Based on public trading prices of common stock.
2. Piston’s projected tax rate is 20.0%.
Adjusted EBITDA refers to Earnings Before Interest, Taxes, Depreciation & Amortization, adjusted for certain non-recurring items.
Adjusted EBITDAP refers to Earnings Before Interest, Taxes, Depreciation, Amortization and Pension (and OPEB) Expense, adjusted for certain non-recurring items.
Adjusted FCF refers to Adjusted Free Cash Flow , w hich is represented as Adjusted EBITDA less Capital Expenditures.
E refers to Estimated.
LTM refers to the most recently completed 12-month period for w hich financial information has been made public.
CY refers to calendar year.
NA refers to Not Available.
Source: Public filings, Capital IQ, Bloomberg, Company management.
CONFIDENTIAL 30
|
|
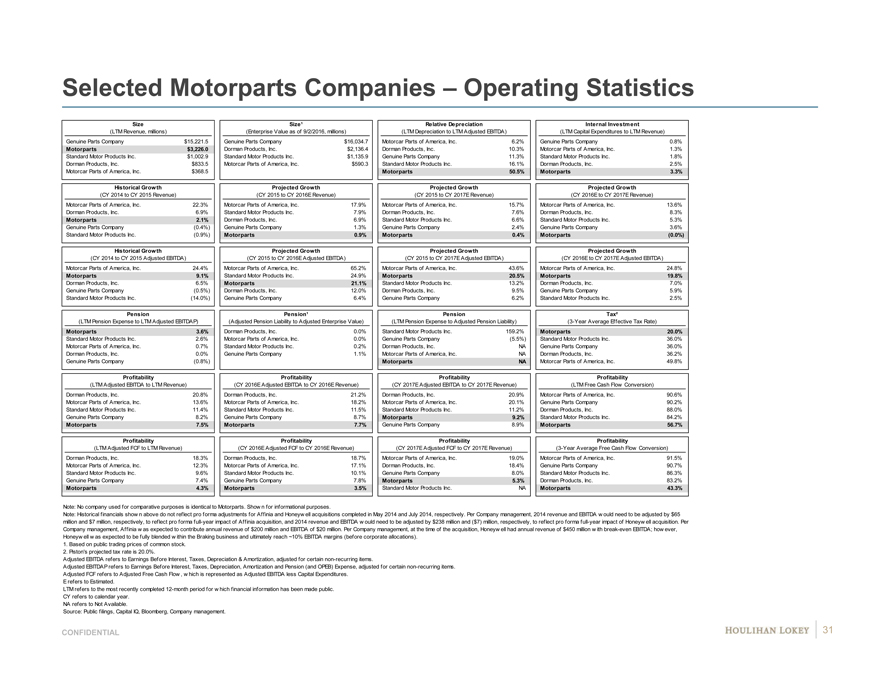
Selected Motorparts Companies – Operating Statistics
Size Size¹Relative DepreciationInternal Investment
(LTM Revenue, millions) (Enterprise Value as of 9/2/2016, millions)(LTM Depreciation to LTM Adjusted EBITDA)(LTM Capital Expenditures to LTM Revenue)
Genuine Parts Company $15,221.5 Genuine Parts Company$16,034.7Motorcar Parts of America, Inc.6.2%Genuine Parts Company0.8%
Motorparts $3,226.0 Dorman Products, Inc.$2,136.4Dorman Products, Inc.10.3%Motorcar Parts of America, Inc.1.3%
Standard Motor Products Inc. $1,002.9 Standard Motor Products Inc.$1,135.9Genuine Parts Company11.3%Standard Motor Products Inc.1.8%
Dorman Products, Inc. $833.5 Motorcar Parts of America, Inc.$590.3Standard Motor Products Inc.16.1%Dorman Products, Inc.2.5%
Motorcar Parts of America, Inc. $368.5 ##########Motorparts50.5%Motorparts3.3%
Historical Growth Projected GrowthProjected GrowthProjected Growth
(CY 2014 to CY 2015 Revenue) (CY 2015 to CY 2016E Revenue)(CY 2015 to CY 2017E Revenue)(CY 2016E to CY 2017E Revenue)
Motorcar Parts of America, Inc. 22.3% Motorcar Parts of America, Inc.17.9%Motorcar Parts of America, Inc.15.7%Motorcar Parts of America, Inc.13.6%
Dorman Products, Inc. 6.9% Standard Motor Products Inc.7.9%Dorman Products, Inc.7.6%Dorman Products, Inc.8.3%
Motorparts 2.1% Dorman Products, Inc.6.9%Standard Motor Products Inc.6.6%Standard Motor Products Inc.5.3%
Genuine Parts Company (0.4%) Genuine Parts Company1.3%Genuine Parts Company2.4%Genuine Parts Company3.6%
Standard Motor Products Inc. (0.9%) Motorparts0.9%Motorparts0.4%Motorparts(0.0%)
Historical Growth Projected GrowthProjected GrowthProjected Growth
(CY 2014 to CY 2015 Adjusted EBITDA) (CY 2015 to CY 2016E Adjusted EBITDA) (CY 2015 to CY 2017E Adjusted EBITDA)(CY 2016E to CY 2017E Adjusted EBITDA)
Motorcar Parts of America, Inc. 24.4% Motorcar Parts of America, Inc.65.2%Motorcar Parts of America, Inc.43.6%Motorcar Parts of America, Inc.24.8%
Motorparts 9.1% Standard Motor Products Inc.24.9%Motorparts20.5%Motorparts19.8%
Dorman Products, Inc. 6.5% Motorparts21.1%Standard Motor Products Inc.13.2%Dorman Products, Inc.7.0%
Genuine Parts Company (0.5%) Dorman Products, Inc.12.0%Dorman Products, Inc.9.5%Genuine Parts Company5.9%
Standard Motor Products Inc. (14.0%) Genuine Parts Company6.4%Genuine Parts Company6.2%Standard Motor Products Inc.2.5%
Pension Pension¹PensionTax²
(LTM Pension Expense to LTM Adjusted EBITDAP) (Adjusted Pension Liability to Adjusted Enterprise Value) (LTM Pension Expense to Adjusted Pension Liability)(3-Year Average Effective Tax Rate)
Motorparts 3.6% Dorman Products, Inc.0.0%Standard Motor Products Inc.159.2%Motorparts20.0%
Standard Motor Products Inc. 2.6% Motorcar Parts of America, Inc.0.0%Genuine Parts Company(5.5%)Standard Motor Products Inc.36.0%
Motorcar Parts of America, Inc. 0.7% Standard Motor Products Inc.0.2%Dorman Products, Inc.NAGenuine Parts Company36.0%
Dorman Products, Inc. 0.0% Genuine Parts Company1.1%Motorcar Parts of America, Inc.NADorman Products, Inc.36.2%
Genuine Parts Company (0.8%) MotorpartsNAMotorcar Parts of America, Inc.49.8%
Profitability ProfitabilityProfitabilityProfitability
(LTM Adjusted EBITDA to LTM Revenue) (CY 2016E Adjusted EBITDA to CY 2016E Revenue) (CY 2017E Adjusted EBITDA to CY 2017E Revenue)(LTM Free Cash Flow Conversion)
Dorman Products, Inc. 20.8% Dorman Products, Inc.21.2%Dorman Products, Inc.20.9%Motorcar Parts of America, Inc.90.6%
Motorcar Parts of America, Inc. 13.6% Motorcar Parts of America, Inc.18.2%Motorcar Parts of America, Inc.20.1%Genuine Parts Company90.2%
Standard Motor Products Inc. 11.4% Standard Motor Products Inc.11.5%Standard Motor Products Inc.11.2%Dorman Products, Inc.88.0%
Genuine Parts Company 8.2% Genuine Parts Company8.7%Motorparts9.2%Standard Motor Products Inc.84.2%
Motorparts 7.5% Motorparts7.7%Genuine Parts Company8.9%Motorparts56.7%
Profitability ProfitabilityProfitabilityProfitability
(LTM Adjusted FCF to LTM Revenue) (CY 2016E Adjusted FCF to CY 2016E Revenue)(CY 2017E Adjusted FCF to CY 2017E Revenue)(3-Year Average Free Cash Flow Conversion)
Dorman Products, Inc. 18.3% Dorman Products, Inc.18.7%Motorcar Parts of America, Inc.19.0%Motorcar Parts of America, Inc.91.5%
Motorcar Parts of America, Inc. 12.3% Motorcar Parts of America, Inc.17.1%Dorman Products, Inc.18.4%Genuine Parts Company90.7%
Standard Motor Products Inc. 9.6% Standard Motor Products Inc.10.1%Genuine Parts Company8.0%Standard Motor Products Inc.86.3%
Genuine Parts Company 7.4% Genuine Parts Company7.8%Motorparts5.3%Dorman Products, Inc.83.2%
Motorparts 4.3% Motorparts3.5%Standard Motor Products Inc.NAMotorparts43.3%
Note: No company used for comparative purposes is identical to Motorparts. Show n for informational purposes.
Note: Historical financials show n above do not reflect pro forma adjustments for Affinia and Honeyw ell acquisitions completed in May 2014 and July 2014, respectively. Per Company management, 2014 revenue and EBITDA w ould need to be adjusted by $65
million and $7 million, respectively, to reflect pro forma full-year impact of Affinia acquisition, and 2014 revenue and EBITDA w ould need to be adjusted by $238 million and ($7) million, respectively, to reflect pro forma full-year impact of Honeyw ell acquisition. Per
Company management, Affinia w as expected to contribute annual revenue of $200 million and EBITDA of $20 million. Per Company management, at the time of the acquisition, Honeyw ell had annual revenue of $450 million w ith break-even EBITDA; how ever,
Honeyw ell w as expected to be fully blended w ithin the Braking business and ultimately reach ~10% EBITDA margins (before corporate allocations).
1. Based on public trading prices of common stock.
2. Piston’s projected tax rate is 20.0%.
Adjusted EBITDA refers to Earnings Before Interest, Taxes, Depreciation & Amortization, adjusted for certain non-recurring items.
Adjusted EBITDAP refers to Earnings Before Interest, Taxes, Depreciation, Amortization and Pension (and OPEB) Expense, adjusted for certain non-recurring items.
Adjusted FCF refers to Adjusted Free Cash Flow , w hich is represented as Adjusted EBITDA less Capital Expenditures.
E refers to Estimated.
LTM refers to the most recently completed 12-month period for w hich financial information has been made public.
CY refers to calendar year.
NA refers to Not Available.
Source: Public filings, Capital IQ, Bloomberg, Company management.
CONFIDENTIAL 31
|
|
Page
1. Executive Summary 3
2. Financial Analyses 8
3. Selected Public Market Observations 16
4. Appendix 21
Cost of Capital Considerations 22
Selected Companies—Operating Statistics 28
Company Financial Performance Observations 32
Implied Premiums Paid Observations 35
5. Disclaimer 37
|
|
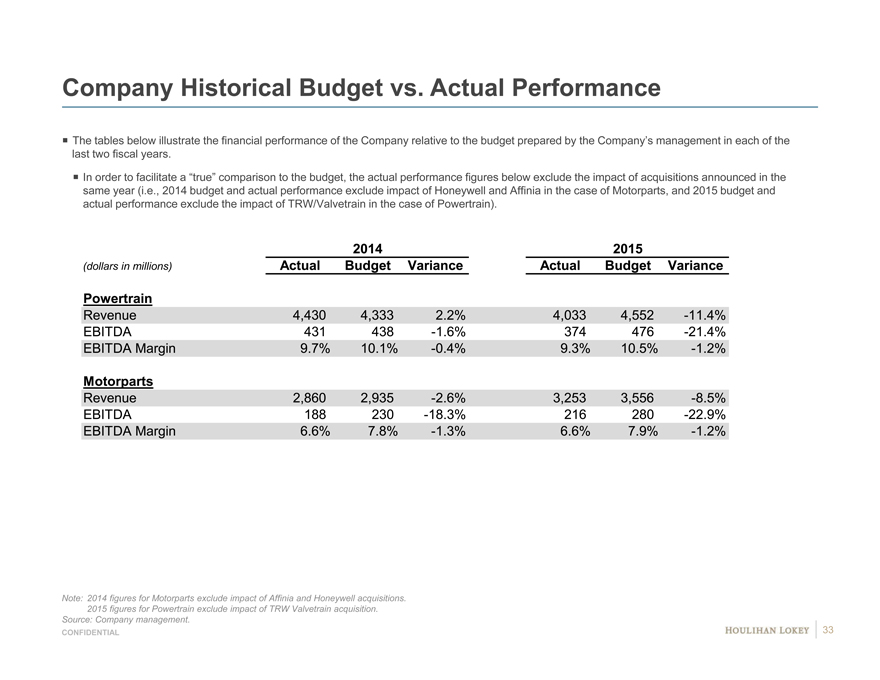
Company Historical Budget vs. Actual Performance
The tables below illustrate the financial performance of the Company relative to the budget prepared by the Company’s management in each of the
last two fiscal years.
In order to facilitate a “true” comparison to the budget, the actual performance figures below exclude the impact of acquisitions announced in the
same year (i.e., 2014 budget and actual performance exclude impact of Honeywell and Affinia in the case of Motorparts, and 2015 budget and
actual performance exclude the impact of TRW/Valvetrain in the case of Powertrain).
20142015
(dollars in millions) ActualBudgetVarianceActualBudgetVariance
Powertrain
Revenue 4,4304,3332.2%4,0334,552-11.4%
EBITDA 431438-1.6%374476-21.4%
EBITDA Margin 9.7%10.1%-0.4%9.3%10.5%-1.2%
Motorparts
Revenue 2,8602,935-2.6%3,2533,556-8.5%
EBITDA 188230-18.3%216280-22.9%
EBITDA Margin 6.6%7.8%-1.3%6.6%7.9%-1.2%
Note: 2014 figures for Motorparts exclude impact of Affinia and Honeywell acquisitions.
2015 figures for Powertrain exclude impact of TRW Valvetrain acquisition.
Source: Company management.
CONFIDENTIAL 33
|
|
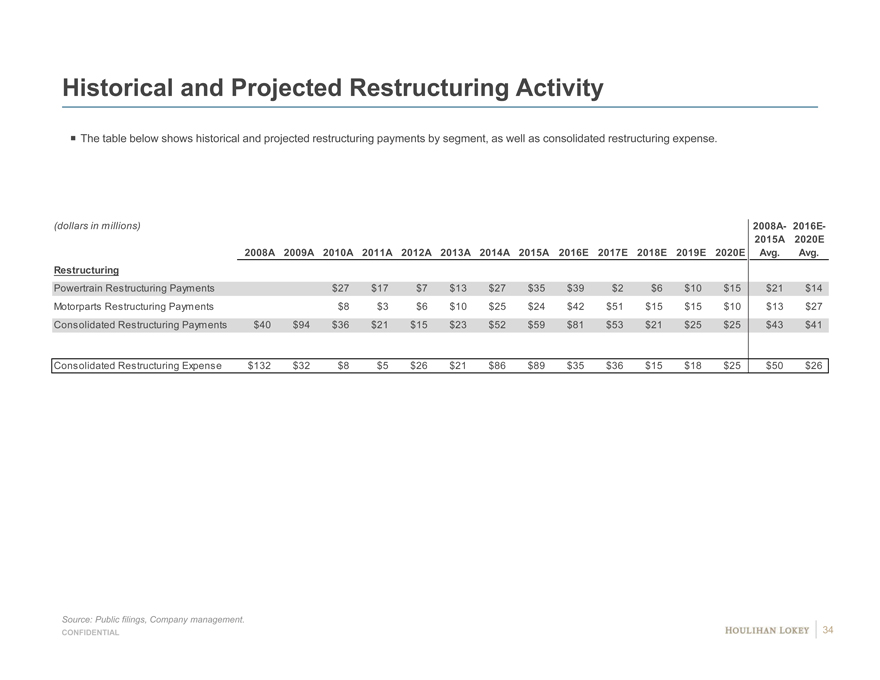
Historical and Projected Restructuring Activity
The table below shows historical and projected restructuring payments by segment, as well as consolidated restructuring expense.
(dollars in millions) 2008A-2016E-
2015A2020E
2008A 2009A2010A2011A2012A2013A2014A2015A2016E2017E 2018E2019E 2020EAvg.Avg.
Restructuring
Powertrain Restructuring Payments $27$17$7$13$27$35$39$2$6$10$15$21$14
Motorparts Restructuring Payments $8$3$6$10$25$24$42$51$15$15$10$13$27
Consolidated Restructuring Payments $40 $94$36$21$15$23$52$59$81$53$21$25$25$43$41
Consolidated Restructuring Expense $132 $32$8$5$26$21$86$89$35$36$15$18$25$50$26
Source: Public filings, Company management.
CONFIDENTIAL 34
|
|
Page
1. Executive Summary 3
2. Financial Analyses 8
3. Selected Public Market Observations 16
4. Appendix 21 Cost of Capital Considerations 22 Selected Companies—Operating Statistics 28 Company Financial Performance Observations 32 Implied Premiums Paid Observations 35
5. Disclaimer 37
|
|
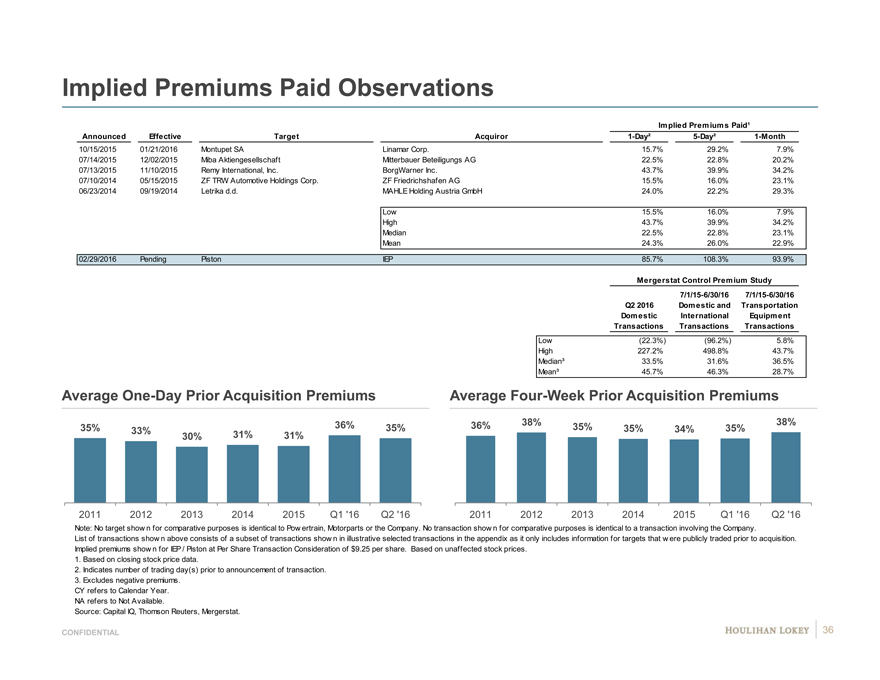
Implied Premiums Paid Observations
Implied Premiums Paid¹
Announced Effective TargetAcquiror1-Day²5-Day²1-Month
10/15/2015 01/21/2016 Montupet SALinamar Corp.15.7%#29.2%#7.9%#
07/14/2015 12/02/2015 Miba AktiengesellschaftMitterbauer Beteiligungs AG22.5%#22.8%#20.2%#
07/13/2015 11/10/2015 Remy International, Inc.BorgWarner Inc.43.7%#39.9%#34.2%#
07/10/2014 05/15/2015 ZF TRW Automotive Holdings Corp.ZF Friedrichshafen AG15.5%#16.0%#23.1%#
06/23/2014 09/19/2014 Letrika d.d.MAHLE Holding Austria GmbH24.0%#22.2%#29.3%#
Low15.5%16.0%7.9%
High43.7%39.9%34.2%
Median22.5%22.8%23.1%
Mean24.3%26.0%22.9%
02/29/2016 Pending PistonIEP85.7%108.3%93.9%
Mergerstat Control Premium Study
7/1/15-6/30/167/1/15-6/30/16
Q2 2016Domestic andTransportation
Domesticic International al Equipment
TransactionsTransactionsTransactions
Low(22.3%) #(96.2%) #5.8%
High227.2%#498.8%#43.7%
Median³33.5%#31.6%#36.5%
Mean³45.7%#46.3%#28.7%
Average One-Day Prior Acquisition Premiums Average Four-Week Prior Acquisition Premiums
35% 33% 36%35%36%38%35%35%34%35%38%
30%31%31%
2011 2012 201320142015Q1 ‘16Q2 ‘1620112012201320142015Q1 ‘16Q2 ‘16
Note: No target show n for comparative purposes is identical to Pow ertrain, Motorparts or the Company. No transaction show n for comparative purposes is identical to a transaction involving the Company.
List of transactions show n above consists of a subset of transactions show n in illustrative selected transactions in the appendix as it only includes information for targets that w ere publicly traded prior to acquisition.
Implied premiums show n for IEP / Piston at Per Share Transaction Consideration of $9.25 per share. Based on unaffected stock prices.
1. Based on closing stock price data.
2. Indicates number of trading day(s) prior to announcement of transaction.
3. Excludes negative premiums.
CY refers to Calendar Year.
NA refers to Not Available.
Source: Capital IQ, Thomson Reuters, Mergerstat.
CONFIDENTIAL 36
|
|
Page
1. Executive Summary 3
2. Financial Analyses 8
3. Selected Public Market Observations 16
4. Appendix 21
5. Disclaimer 37
|
|
Disclaimer
This presentation, and any supplemental information (written or oral) or other documents provided in connection therewith (collectively, the “materials”), are provided solely for the information of the Special Committee (the “Committee”) of the Board of Directors (the “Board”) of Federal-Mogul Holdings Corporation (“Piston” or the “Company”) by Houlihan Lokey in connection with the Committee’s consideration of a potential transaction (the “Transaction”) involving the Company. This presentation is incomplete without reference to, and should be considered in conjunction with, any supplemental information provided by and discussions with Houlihan Lokey in connection therewith. Any defined terms used herein shall have the meanings set forth herein, even if such defined terms have been given different meanings elsewhere in the materials.
The materials are for discussion purposes only. Houlihan Lokey expressly disclaims any and all liability which may be based on the materials and any errors therein or omissions therefrom. The materials were prepared for specific persons familiar with the business and affairs of the Company for use in a specific context and were not prepared with a view to public disclosure or to conform with any disclosure standards under any state, federal or international securities laws or other laws, rules or regulations, and none of the Committee, the Company or Houlihan Lokey takes any responsibility for the use of the materials by persons other than the Committee. The materials are provided on a confidential basis solely for the information of the Committee and may not be disclosed, summarized, reproduced, disseminated or quoted or otherwise referred to, in whole or in part, without Houlihan Lokey’s express prior written consent.
Notwithstanding any other provision herein, the Company (and each employee, representative or other agent of the Company) may disclose to any and all persons without limitation of any kind, the tax treatment and tax structure of any transaction and all materials of any kind (including opinions or other tax analyses, if any) that are provided to the Company relating to such tax treatment and structure. However, any information relating to the tax treatment and tax structure shall remain confidential (and the foregoing sentence shall not apply) to the extent necessary to enable any person to comply with securities laws. For this purpose, the tax treatment of a transaction is the purported or claimed U.S. income or franchise tax treatment of the transaction and the tax structure of a transaction is any fact that may be relevant to understanding the purported or claimed U.S. income or franchise tax treatment of the transaction. If the Company plans to disclose information pursuant to the first sentence of this paragraph, the Company shall inform those to whom it discloses any such information that they may not rely upon such information for any purpose without Houlihan Lokey’s prior written consent. Houlihan Lokey is not an expert on, and nothing contained in the materials should be construed as advice with regard to, legal, accounting, regulatory, insurance, tax or other specialist matters. Houlihan Lokey’s role in reviewing any information is limited solely to performing such a review as it shall deem necessary to support its own advice and analysis and shall not be on behalf of the Committee.
The materials necessarily are based on financial, economic, market and other conditions as in effect on, and the information available to Houlihan Lokey as of, the date of the materials. Although subsequent developments may affect the contents of the materials, Houlihan Lokey has not undertaken, and is under no obligation, to update, revise or reaffirm the materials, except as may be expressly contemplated by Houlihan Lokey’s engagement letter. The materials are not intended to provide the sole basis for evaluation of the Transaction and do not purport to contain all information that may be required. The materials do not address the underlying business decision of the Company or any other party to proceed with or effect the Transaction. The materials do not constitute any opinion, nor do the materials constitute a recommendation to the Board, the Committee, the Company, any security holder of the Company or any other party as to how to vote or act with respect to any matter relating to the Transaction or otherwise or whether to buy or sell any assets or securities of any company. Houlihan Lokey’s only opinion is the opinion, if any, that is actually delivered to the Committee. The materials may not reflect information known to other professionals in other business areas of Houlihan Lokey and its affiliates.
The preparation of the materials was a complex process involving quantitative and qualitative judgments and determinations with respect to the financial, comparative and other analytic methods employed and the adaption and application of these methods to the unique facts and circumstances presented and, therefore, is not readily susceptible to partial analysis or summary description. Furthermore, Houlihan Lokey did not attribute any particular weight to any analysis or factor considered by it, but rather made qualitative judgments as to the significance and relevance of each analysis and factor. Each analytical technique has inherent strengths and weaknesses, and the nature of the available information may further affect the value of particular techniques. Accordingly, the analyses contained in the materials must be considered as a whole. Selecting portions of the analyses, analytic methods and factors without considering all analyses and factors could create a misleading or incomplete view. The materials reflect judgments and assumptions with regard to industry performance, general business, economic, regulatory, market and financial conditions and other matters, many of which are beyond the control of the participants in the Transaction. Any estimates of value contained in the materials are not necessarily indicative of actual value or predictive of future results or values, which may be significantly more or less favorable. Any analyses relating to the value of assets, businesses or securities do not purport to be appraisals or to reflect the prices at which any assets, businesses or securities may actually be sold. The materials do not constitute a valuation opinion or credit rating. In preparing the materials, Houlihan Lokey has not conducted any physical inspection or independent appraisal or evaluation of any of the assets, properties or liabilities (contingent or otherwise) of the Company or any other party and has no obligation to evaluate the solvency of the Company or any other party under any law.
All budgets, projections, estimates, financial analyses, reports and other information with respect to operations (including estimates of potential cost savings and expenses) reflected in the materials have been prepared by management of the relevant party or are derived from such budgets, projections, estimates, financial analyses, reports and other information or from other sources, which involve numerous and significant subjective determinations made by management of the relevant party and/or which such management has reviewed and found reasonable. The budgets, projections and estimates contained in the materials may or may not be achieved and differences between projected results and those actually achieved may be material. Houlihan Lokey has relied upon representations made by management of the Company that such budgets, projections and estimates have been reasonably prepared in good faith on bases reflecting the best currently available estimates and judgments of such management (or, with respect to information obtained from public sources, represent reasonable estimates), and Houlihan Lokey expresses no opinion with respect to such budgets, projections or estimates or the assumptions on which they are based. The scope of the financial analysis contained herein is based on discussions with the Company (including, without limitation, regarding the methodologies to be utilized), and Houlihan Lokey does not make any representation, express or implied, as to the sufficiency or adequacy of such financial analysis or the scope thereof for any particular purpose.
Houlihan Lokey has assumed and relied upon the accuracy and completeness of the financial and other information provided to, discussed with or reviewed by it without (and without assuming responsibility for) independent verification of such information, makes no representation or warranty (express or implied) in respect of the accuracy or completeness of such information and has further relied upon the assurances of the Company that it is not aware of any facts or circumstances that would make such information inaccurate or misleading. In addition, Houlihan Lokey has relied upon and assumed, without independent verification, that there has been no change in the business, assets, liabilities, financial condition, results of operations, cash flows or prospects of the Company or any other participant in the Transaction since the respective dates of the most recent financial statements and other information, financial or otherwise, provided to Houlihan Lokey that would be material to its analyses , and that the final forms of any draft documents reviewed by Houlihan Lokey will not differ in any material respect from such draft documents.
The materials are not an offer to sell or a solicitation of an indication of interest to purchase any security, option, commodity, future, loan or currency. The materials do not constitute a commitment by Houlihan Lokey or any of its affiliates to underwrite, subscribe for or place any securities, to extend or arrange credit, or to provide any other services. In the ordinary course of business, certain of Houlihan Lokey’s affiliates and employees, as well as investment funds in which they may have financial interests or with which they may co-invest, may acquire, hold or sell, long or short positions, or trade or otherwise effect transactions, in debt, equity, and other securities and financial instruments (including loans and other obligations) of, or investments in, one or more parties that may be involved in the Transaction and their respective affiliates or any currency or commodity that may be involved in the Transaction. Houlihan Lokey provides mergers and acquisitions, restructuring and other advisory and consulting services to clients. Houlihan Lokey’s personnel may make statements or provide advice that is contrary to information contained in the materials. Houlihan Lokey’s or its affiliates’ proprietary interests may conflict with the Company’s interests. Houlihan Lokey may have advised, may seek to advise and may in the future advise one or more participants in the Transaction and/or other companies mentioned in the materials.
CONFIDENTIAL 38
|
|
CORPORATEFINANCE
FINANCIALADVISORYSERVICES FINANCIALRESTRUCTURING STRATEGICCONSULTING
HL.com
39
Create E-mail Alert Related Categories
SEC FilingsRelated Entities
Carl IcahnSign up for StreetInsider Free!
Receive full access to all new and archived articles, unlimited portfolio tracking, e-mail alerts, custom newswires and RSS feeds - and more!
