Form FWP TEVA PHARMACEUTICAL INDU Filed by: TEVA PHARMACEUTICAL INDUSTRIES LTD
Teva Pharmaceutical Industries 2016-2019 Preliminary Financial Outlook July 13, 2016 Issuer Free Writing Prospectus Filed Pursuant to Rule 433 Registration Nos. 333-201984 and 333-201984-09 July 13, 2016
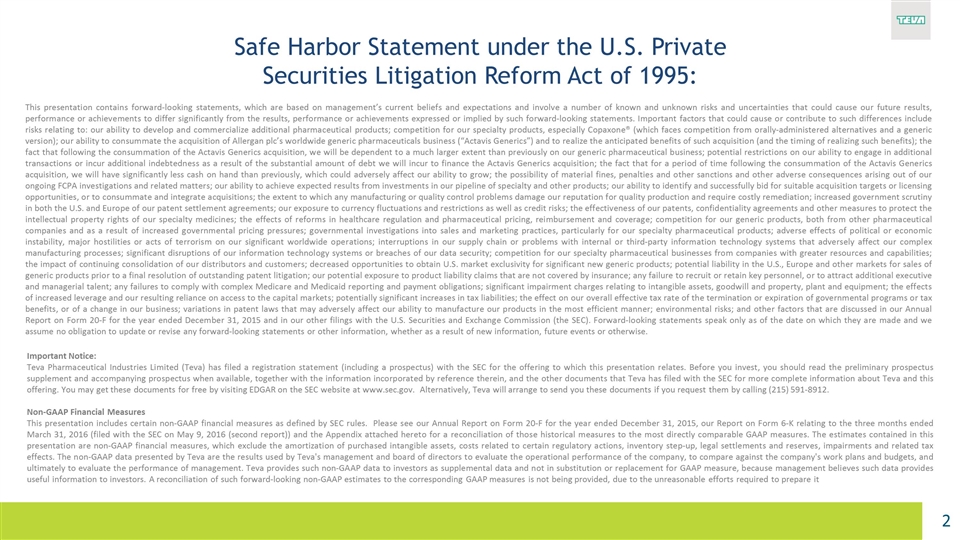
Safe Harbor Statement under the U.S. Private Securities Litigation Reform Act of 1995: Important Notice: Teva Pharmaceutical Industries Limited (Teva) has filed a registration statement (including a prospectus) with the SEC for the offering to which this presentation relates. Before you invest, you should read the preliminary prospectus supplement and accompanying prospectus when available, together with the information incorporated by reference therein, and the other documents that Teva has filed with the SEC for more complete information about Teva and this offering. You may get these documents for free by visiting EDGAR on the SEC website at www.sec.gov. Alternatively, Teva will arrange to send you these documents if you request them by calling (215) 591-8912. Non-GAAP Financial Measures This presentation includes certain non-GAAP financial measures as defined by SEC rules. Please see our Annual Report on Form 20-F for the year ended December 31, 2015, our Report on Form 6-K relating to the three months ended March 31, 2016 (filed with the SEC on May 9, 2016 (second report)) and the Appendix attached hereto for a reconciliation of those historical measures to the most directly comparable GAAP measures. The estimates contained in this presentation are non-GAAP financial measures, which exclude the amortization of purchased intangible assets, costs related to certain regulatory actions, inventory step-up, legal settlements and reserves, impairments and related tax effects. The non-GAAP data presented by Teva are the results used by Teva's management and board of directors to evaluate the operational performance of the company, to compare against the company's work plans and budgets, and ultimately to evaluate the performance of management. Teva provides such non-GAAP data to investors as supplemental data and not in substitution or replacement for GAAP measure, because management believes such data provides useful information to investors. A reconciliation of such forward-looking non-GAAP estimates to the corresponding GAAP measures is not being provided, due to the unreasonable efforts required to prepare it This presentation contains forward-looking statements, which are based on management’s current beliefs and expectations and involve a number of known and unknown risks and uncertainties that could cause our future results, performance or achievements to differ significantly from the results, performance or achievements expressed or implied by such forward-looking statements. Important factors that could cause or contribute to such differences include risks relating to: our ability to develop and commercialize additional pharmaceutical products; competition for our specialty products, especially Copaxone® (which faces competition from orally-administered alternatives and a generic version); our ability to consummate the acquisition of Allergan plc’s worldwide generic pharmaceuticals business (“Actavis Generics”) and to realize the anticipated benefits of such acquisition (and the timing of realizing such benefits); the fact that following the consummation of the Actavis Generics acquisition, we will be dependent to a much larger extent than previously on our generic pharmaceutical business; potential restrictions on our ability to engage in additional transactions or incur additional indebtedness as a result of the substantial amount of debt we will incur to finance the Actavis Generics acquisition; the fact that for a period of time following the consummation of the Actavis Generics acquisition, we will have significantly less cash on hand than previously, which could adversely affect our ability to grow; the possibility of material fines, penalties and other sanctions and other adverse consequences arising out of our ongoing FCPA investigations and related matters; our ability to achieve expected results from investments in our pipeline of specialty and other products; our ability to identify and successfully bid for suitable acquisition targets or licensing opportunities, or to consummate and integrate acquisitions; the extent to which any manufacturing or quality control problems damage our reputation for quality production and require costly remediation; increased government scrutiny in both the U.S. and Europe of our patent settlement agreements; our exposure to currency fluctuations and restrictions as well as credit risks; the effectiveness of our patents, confidentiality agreements and other measures to protect the intellectual property rights of our specialty medicines; the effects of reforms in healthcare regulation and pharmaceutical pricing, reimbursement and coverage; competition for our generic products, both from other pharmaceutical companies and as a result of increased governmental pricing pressures; governmental investigations into sales and marketing practices, particularly for our specialty pharmaceutical products; adverse effects of political or economic instability, major hostilities or acts of terrorism on our significant worldwide operations; interruptions in our supply chain or problems with internal or third-party information technology systems that adversely affect our complex manufacturing processes; significant disruptions of our information technology systems or breaches of our data security; competition for our specialty pharmaceutical businesses from companies with greater resources and capabilities; the impact of continuing consolidation of our distributors and customers; decreased opportunities to obtain U.S. market exclusivity for significant new generic products; potential liability in the U.S., Europe and other markets for sales of generic products prior to a final resolution of outstanding patent litigation; our potential exposure to product liability claims that are not covered by insurance; any failure to recruit or retain key personnel, or to attract additional executive and managerial talent; any failures to comply with complex Medicare and Medicaid reporting and payment obligations; significant impairment charges relating to intangible assets, goodwill and property, plant and equipment; the effects of increased leverage and our resulting reliance on access to the capital markets; potentially significant increases in tax liabilities; the effect on our overall effective tax rate of the termination or expiration of governmental programs or tax benefits, or of a change in our business; variations in patent laws that may adversely affect our ability to manufacture our products in the most efficient manner; environmental risks; and other factors that are discussed in our Annual Report on Form 20-F for the year ended December 31, 2015 and in our other filings with the U.S. Securities and Exchange Commission (the SEC). Forward-looking statements speak only as of the date on which they are made and we assume no obligation to update or revise any forward-looking statements or other information, whether as a result of new information, future events or otherwise.
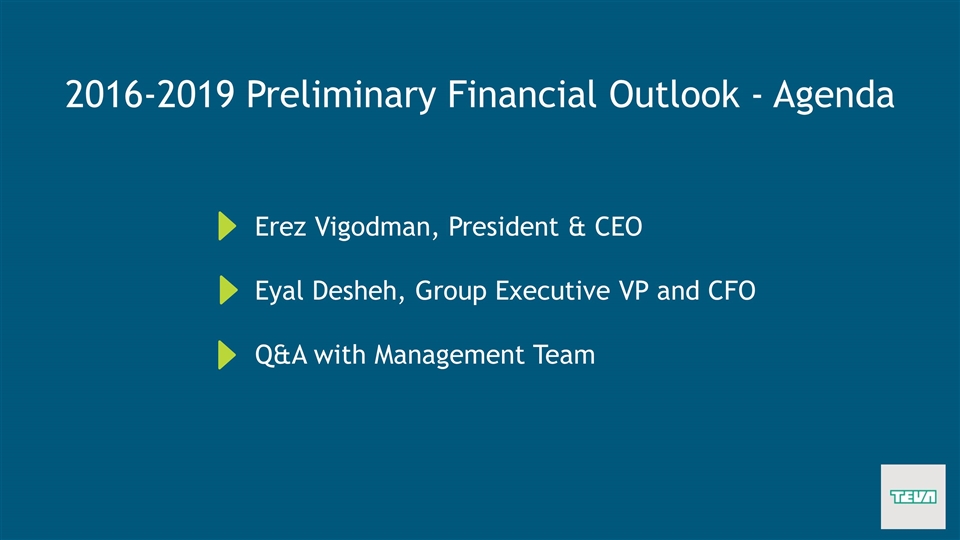
2016-2019 Preliminary Financial Outlook - Agenda Erez Vigodman, President & CEO Eyal Desheh, Group Executive VP and CFO Q&A with Management Team
Erez Vigodman, President & CEO
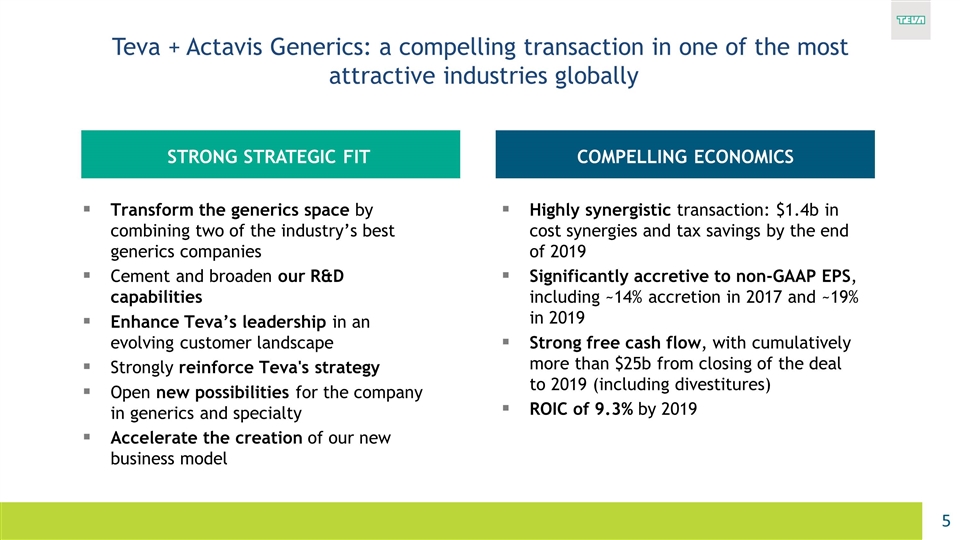
Transform the generics space by combining two of the industry’s best generics companies Cement and broaden our R&D capabilities Enhance Teva’s leadership in an evolving customer landscape Strongly reinforce Teva's strategy Open new possibilities for the company in generics and specialty Accelerate the creation of our new business model Teva + Actavis Generics: a compelling transaction in one of the most attractive industries globally Highly synergistic transaction: $1.4b in cost synergies and tax savings by the end of 2019 Significantly accretive to non‐GAAP EPS, including ~14% accretion in 2017 and ~19% in 2019 Strong free cash flow, with cumulatively more than $25b from closing of the deal to 2019 (including divestitures) ROIC of 9.3% by 2019 STRONG STRATEGIC FIT COMPELLING ECONOMICS
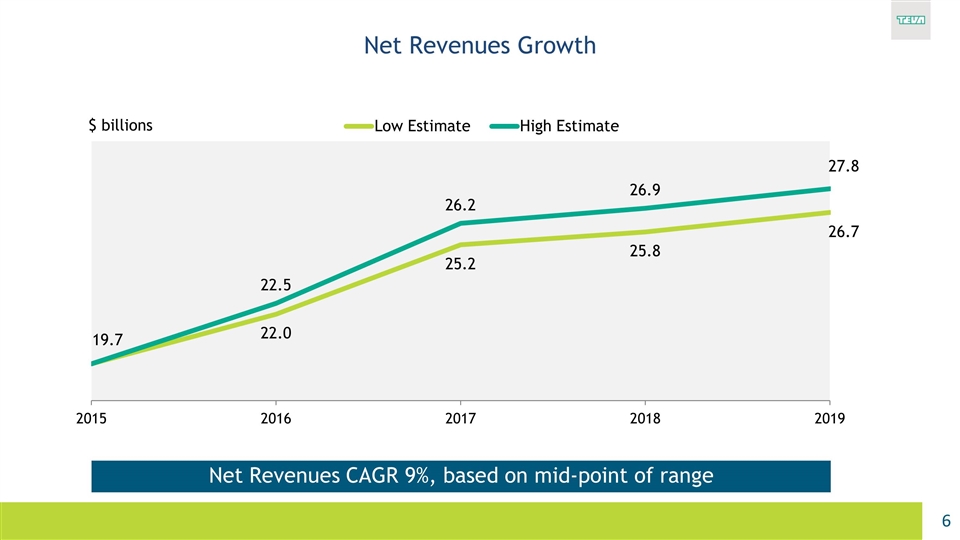
Net Revenues Growth Net Revenues CAGR 9%, based on mid-point of range $ billions
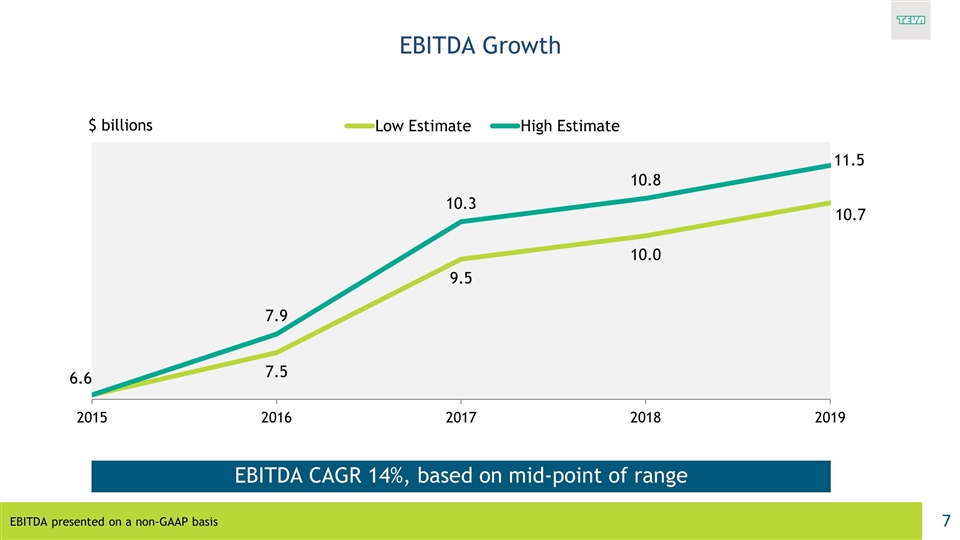
EBITDA Growth EBITDA presented on a non-GAAP basis EBITDA CAGR 14%, based on mid-point of range $ billions
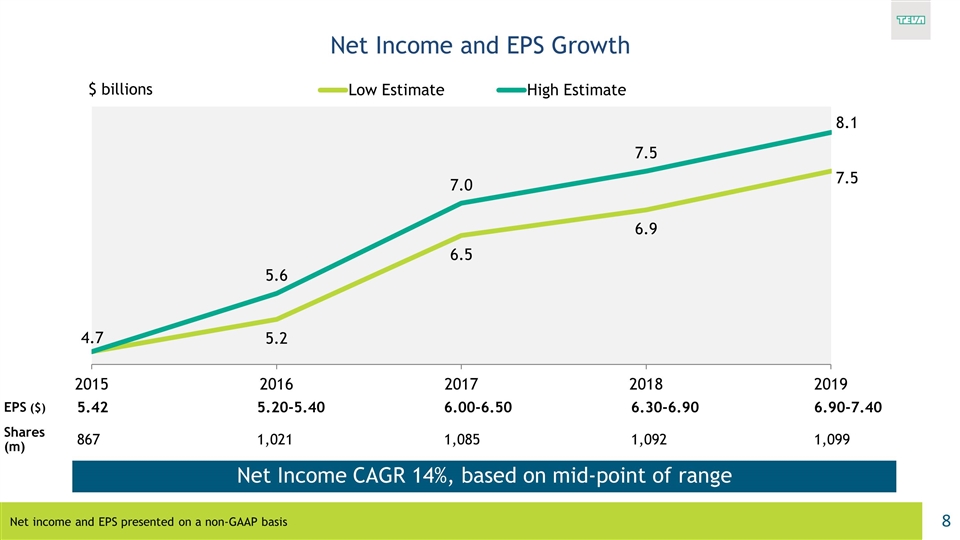
Net Income and EPS Growth EPS ($) 5.42 5.20-5.40 6.00-6.50 6.30-6.90 6.90-7.40 Shares (m) 867 1,021 1,085 1,092 1,099 Net income and EPS presented on a non-GAAP basis Net Income CAGR 14%, based on mid-point of range $ billions
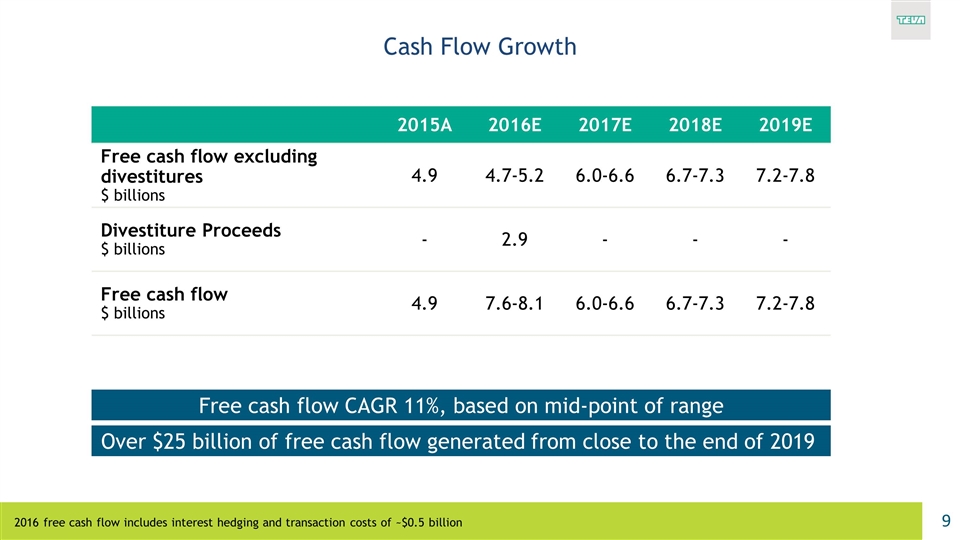
Cash Flow Growth 2015A 2016E 2017E 2018E 2019E Free cash flow excluding divestitures $ billions 4.9 4.7-5.2 6.0-6.6 6.7-7.3 7.2-7.8 Divestiture Proceeds $ billions - 2.9 - - - Free cash flow $ billions 4.9 7.6-8.1 6.0-6.6 6.7-7.3 7.2-7.8 Over $25 billion of free cash flow generated from close to the end of 2019 Free cash flow CAGR 11%, based on mid-point of range 2016 free cash flow includes interest hedging and transaction costs of ~$0.5 billion
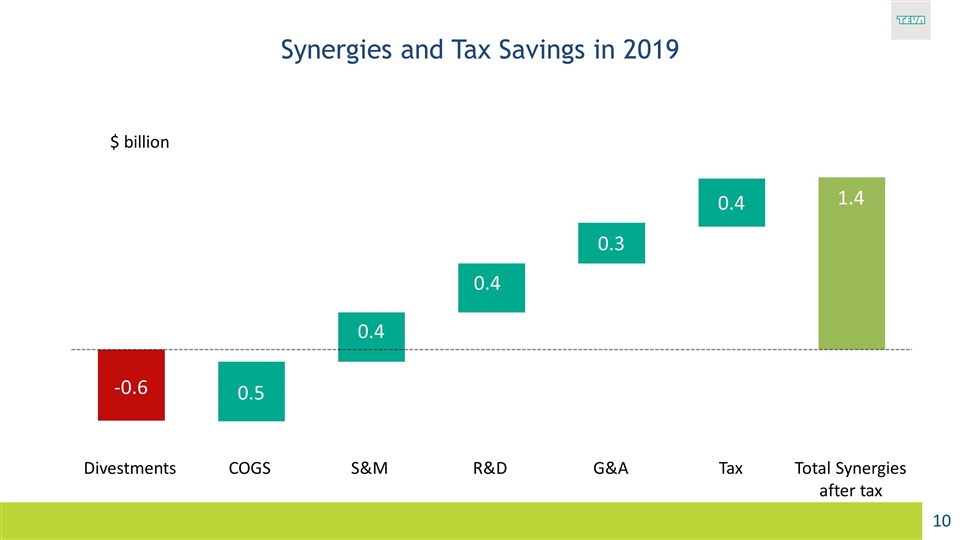
Synergies and Tax Savings in 2019 $ billion 1.4 Tax
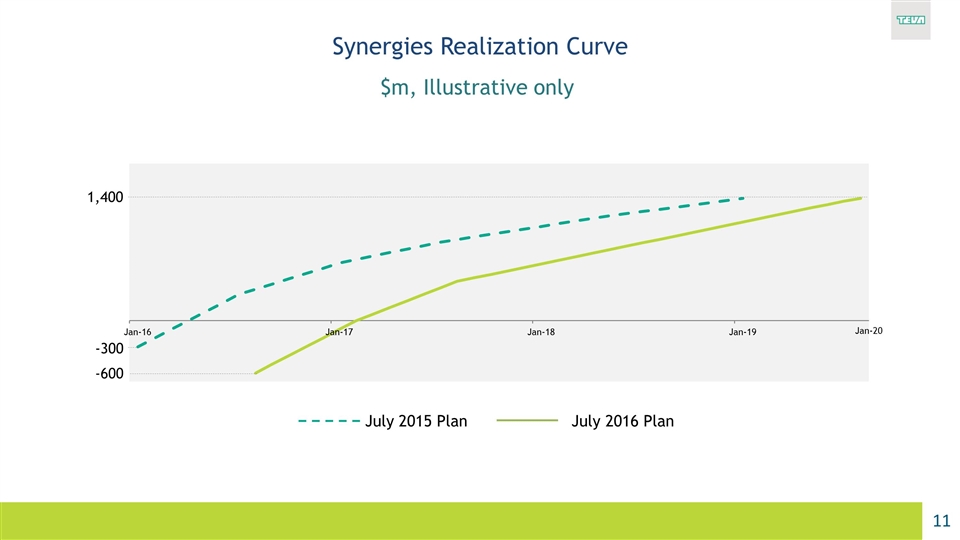
Synergies Realization Curve $m, Illustrative only July 2015 Plan July 2016 Plan Jan-20 -300 -600 1,400
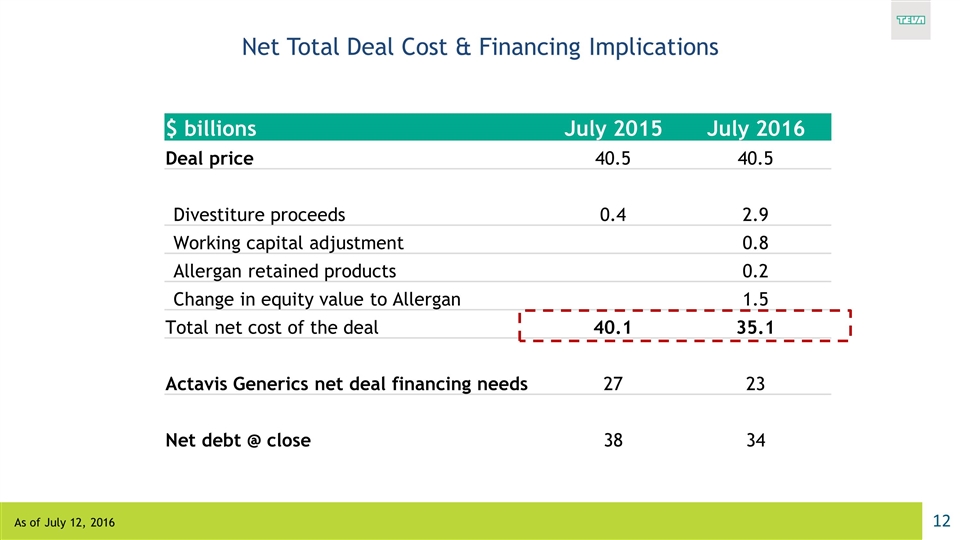
Net Total Deal Cost & Financing Implications $ billions July 2015 July 2016 Deal price 40.5 40.5 Divestiture proceeds 0.4 2.9 Working capital adjustment 0.8 Allergan retained products 0.2 Change in equity value to Allergan 1.5 Total net cost of the deal 40.1 35.1 Actavis Generics net deal financing needs 27 23 Net debt @ close 38 34 As of July 12, 2016
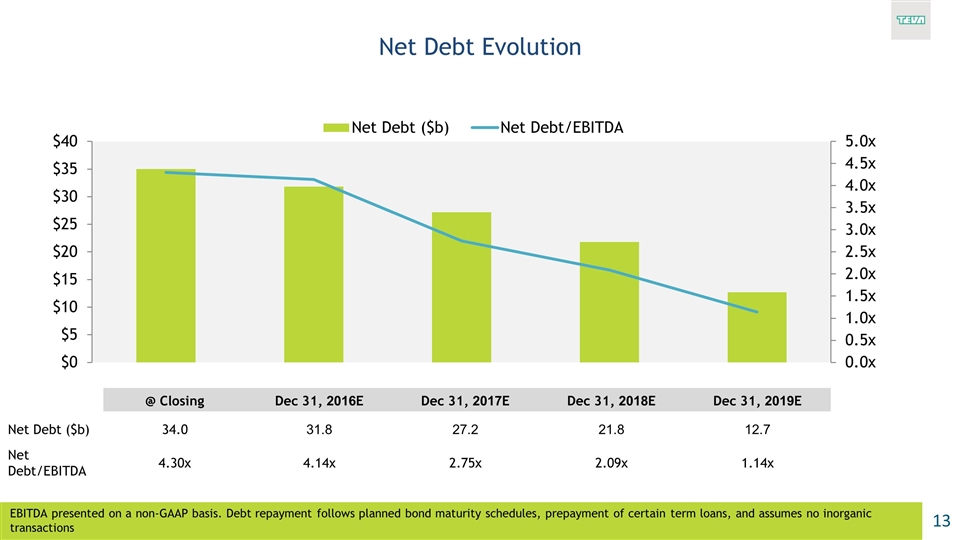
Net Debt Evolution @ Closing Dec 31, 2016E Dec 31, 2017E Dec 31, 2018E Dec 31, 2019E Net Debt ($b) 34.0 31.8 27.2 21.8 12.7 Net Debt/EBITDA 4.30x 4.14x 2.75x 2.09x 1.14x EBITDA presented on a non-GAAP basis. Debt repayment follows planned bond maturity schedules, prepayment of certain term loans, and assumes no inorganic transactions
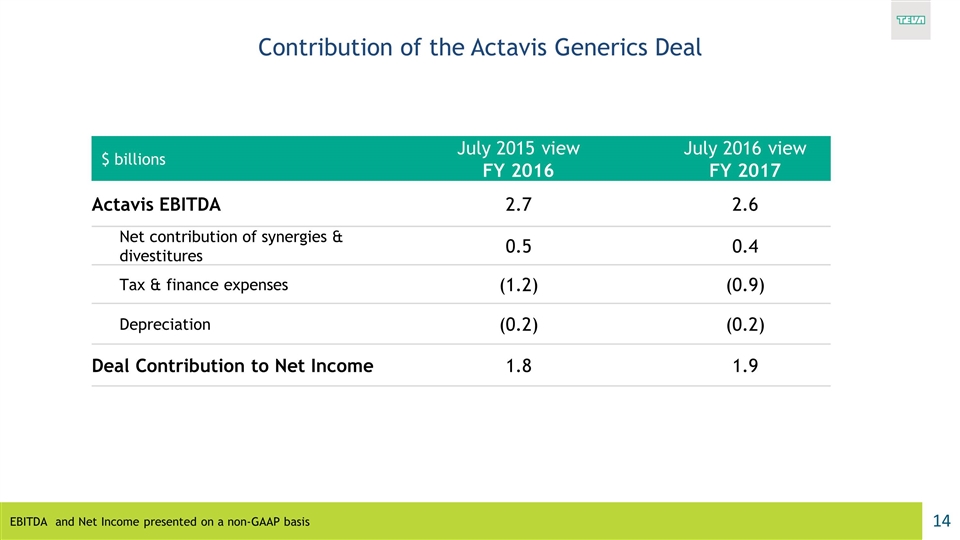
$ billions July 2015 view FY 2016 July 2016 view FY 2017 Actavis EBITDA 2.7 2.6 Net contribution of synergies & divestitures 0.5 0.4 Tax & finance expenses (1.2) (0.9) Depreciation (0.2) (0.2) Deal Contribution to Net Income 1.8 1.9 Contribution of the Actavis Generics Deal EBITDA and Net Income presented on a non-GAAP basis
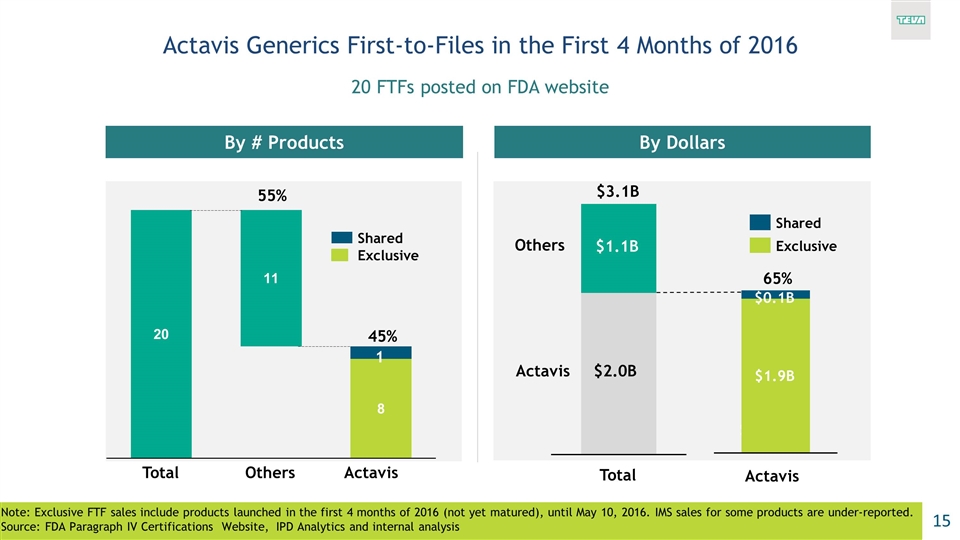
Actavis Generics First-to-Files in the First 4 Months of 2016 20 FTFs posted on FDA website Note: Exclusive FTF sales include products launched in the first 4 months of 2016 (not yet matured), until May 10, 2016. IMS sales for some products are under-reported. Source: FDA Paragraph IV Certifications Website, IPD Analytics and internal analysis By # Products By Dollars 1 45% $2.8B $2.2B (35%) $3.3B $1.9B $0.1B Exclusive 55% $3.1B $2.0B $1.1B 65%
Eyal Desheh, Group Executive VP & CFO
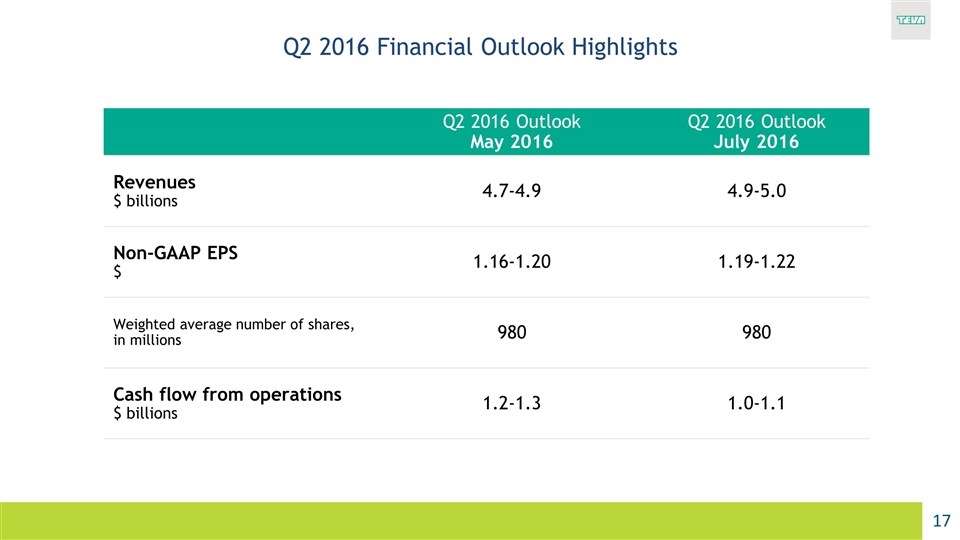
Q2 2016 Financial Outlook Highlights Q2 2016 Outlook May 2016 Q2 2016 Outlook July 2016 Revenues $ billions 4.7-4.9 4.9-5.0 Non-GAAP EPS $ 1.16-1.20 1.19-1.22 Weighted average number of shares, in millions 980 980 Cash flow from operations $ billions 1.2-1.3 1.0-1.1
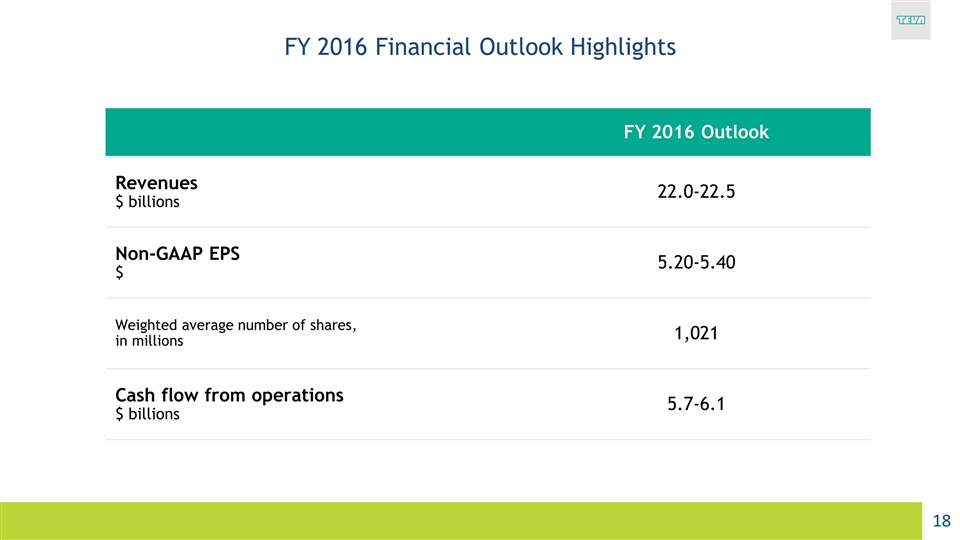
FY 2016 Financial Outlook Highlights FY 2016 Outlook Revenues $ billions 22.0-22.5 Non-GAAP EPS $ 5.20-5.40 Weighted average number of shares, in millions 1,021 Cash flow from operations $ billions 5.7-6.1
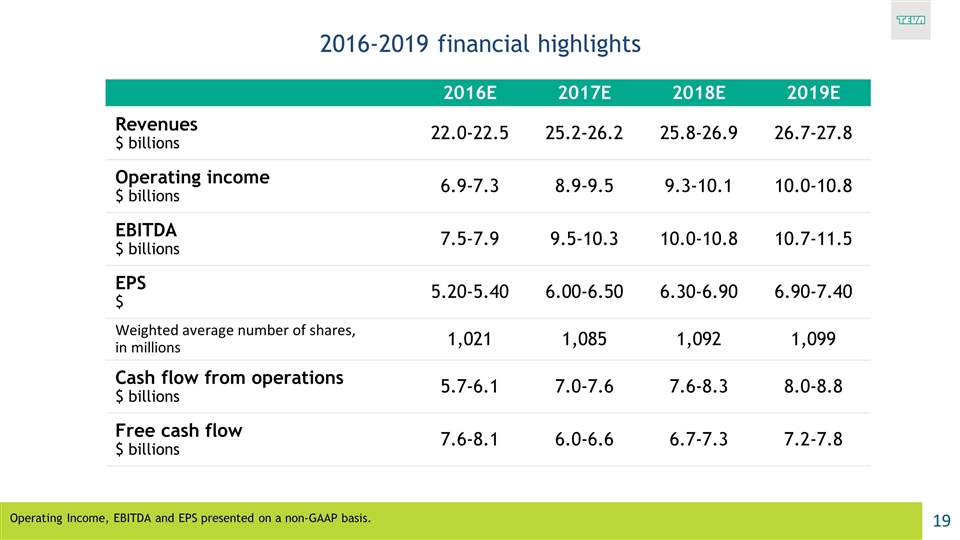
2016-2019 financial highlights 2016E 2017E 2018E 2019E Revenues $ billions 22.0-22.5 25.2-26.2 25.8-26.9 26.7-27.8 Operating income $ billions 6.9-7.3 8.9-9.5 9.3-10.1 10.0-10.8 EBITDA $ billions 7.5-7.9 9.5-10.3 10.0-10.8 10.7-11.5 EPS $ 5.20-5.40 6.00-6.50 6.30-6.90 6.90-7.40 Weighted average number of shares, in millions 1,021 1,085 1,092 1,099 Cash flow from operations $ billions 5.7-6.1 7.0-7.6 7.6-8.3 8.0-8.8 Free cash flow $ billions 7.6-8.1 6.0-6.6 6.7-7.3 7.2-7.8 Operating Income, EBITDA and EPS presented on a non-GAAP basis.
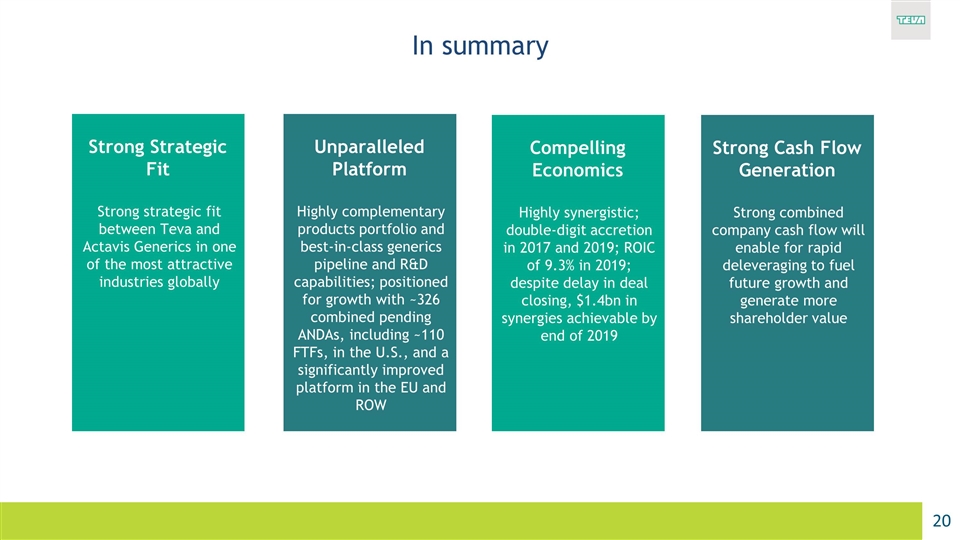
In summary Strong Strategic Fit Strong strategic fit between Teva and Actavis Generics in one of the most attractive industries globally Unparalleled Platform Highly complementary products portfolio and best‐in‐class generics pipeline and R&D capabilities; positioned for growth with ~326 combined pending ANDAs, including ~110 FTFs, in the U.S., and a significantly improved platform in the EU and ROW Compelling Economics Highly synergistic; double-digit accretion in 2017 and 2019; ROIC of 9.3% in 2019; despite delay in deal closing, $1.4bn in synergies achievable by end of 2019 Strong Cash Flow Generation Strong combined company cash flow will enable for rapid deleveraging to fuel future growth and generate more shareholder value

Q&A Thank You
Serious News for Serious Traders! Try StreetInsider.com Premium Free!
You May Also Be Interested In
- Amendment of the terms concerning Convertible Bonds 2021/1, 2021/2, 2021/3, 2021/4 and 2022/1 issued by Digitalist Group Plc
- RROCKET Burns 50% of Its Supply to Fuel Growth and Investor Confidence
- Dimensional Fund Advisors Ltd. : Form 8.3 - QUANEX BUILDING PRODUCTS - Ordinary Shares
Create E-mail Alert Related Categories
SEC FilingsSign up for StreetInsider Free!
Receive full access to all new and archived articles, unlimited portfolio tracking, e-mail alerts, custom newswires and RSS feeds - and more!


 Tweet
Tweet Share
Share