Form FWP DYNEGY INC. Filed by: DYNEGY INC.
Issuer Free Writing Prospectus
Filed Pursuant to Rule 433
Registration Statement No. 333-199179
June 15, 2016
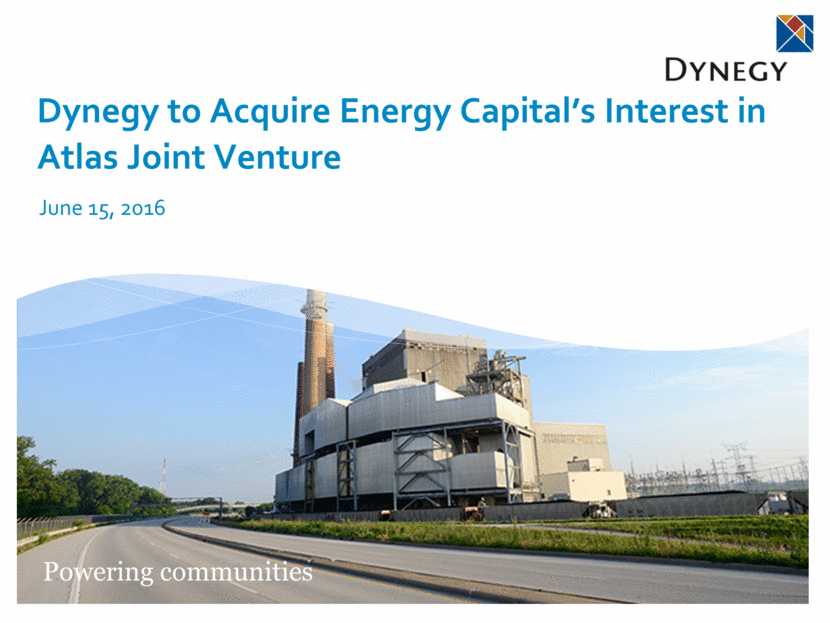
Dynegy to Acquire Energy Capital’s Interest in Atlas Joint Venture June 15, 2016
Disclaimer This presentation contains statements reflecting assumptions, expectations, projections, intentions or beliefs about future events that are intended as “forward looking statements.” You can identify these statements by the fact that they do not relate strictly to historical or current facts. Management cautions that any or all of Dynegy’s forward-looking statements may turn out to be wrong. Please read Dynegy’s annual, quarterly and current reports filed under the Securities Exchange Act of 1934, including its 2015 Form 10-K and first quarter 2016 Form 10-Q for additional information about the risks, uncertainties and other factors affecting these forward-looking statements and Dynegy generally. Dynegy’s actual future results may vary materially from those expressed or implied in any forward-looking statements. All of Dynegy’s forward-looking statements, whether written or oral, are expressly qualified by these cautionary statements and any other cautionary statements that may accompany such forward-looking statements. In addition, Dynegy disclaims any obligation to update any forward-looking statements to reflect events or circumstances after the date hereof. This presentation contains certain non-GAAP financial measures. A “non-GAAP financial measure” is defined as a numerical measure of a company's financial performance that excludes or includes amounts so as to be different than the most directly comparable measure calculated and presented in accordance with GAAP in the statement of income, balance sheet or statement of cash flows of the company. Pursuant to the requirements of Regulation G, Dynegy has provided in the appendix to this presentation a reconciliation of non-GAAP financial measures to the most directly comparable GAAP financial measures. To the extent required, statements disclosing the definitions, utility and purposes of these measures are set forth in Item 2.02 to our current report on Form 8-K filed with the SEC on May 3, 2016, which is available free of charge, www.dynegy.com. 1
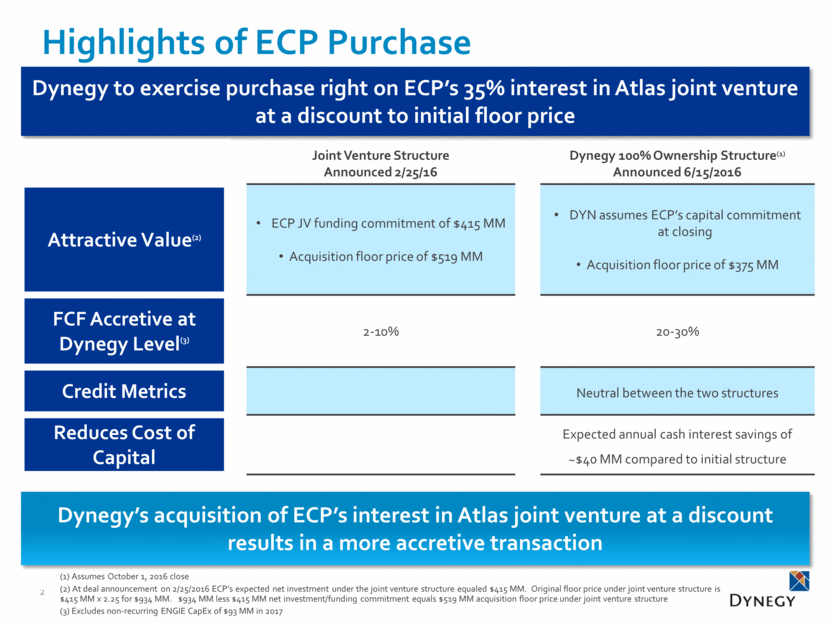
Highlights of ECP Purchase Dynegy to exercise purchase right on ECP’s 35% interest in Atlas joint venture at a discount to initial floor price Joint Venture Structure Announced 2/25/16 Dynegy 100% Ownership Structure(1) Announced 6/15/2016 Attractive Value(2) ECP JV funding commitment of $415 MM Acquisition floor price of $519 MM DYN assumes ECP’s capital commitment at closing Acquisition floor price of $375 MM FCF Accretive at Dynegy Level(3) 2-10% 20-30% Credit Metrics Neutral between the two structures Reduces Cost of Capital Expected annual cash interest savings of ~$40 MM compared to initial structure Dynegy’s acquisition of ECP’s interest in Atlas joint venture at a discount results in a more accretive transaction 2 (1) Assumes October 1, 2016 close (2) At deal announcement on 2/25/2016 ECP’s expected net investment under the joint venture structure equaled $415 MM. Original floor price under joint venture structure is $415 MM x 2.25 for $934 MM. $934 MM less $415 MM net investment/funding commitment equals $519 MM acquisition floor price under joint venture structure (3) Excludes non-recurring ENGIE CapEx of $93 MM in 2017
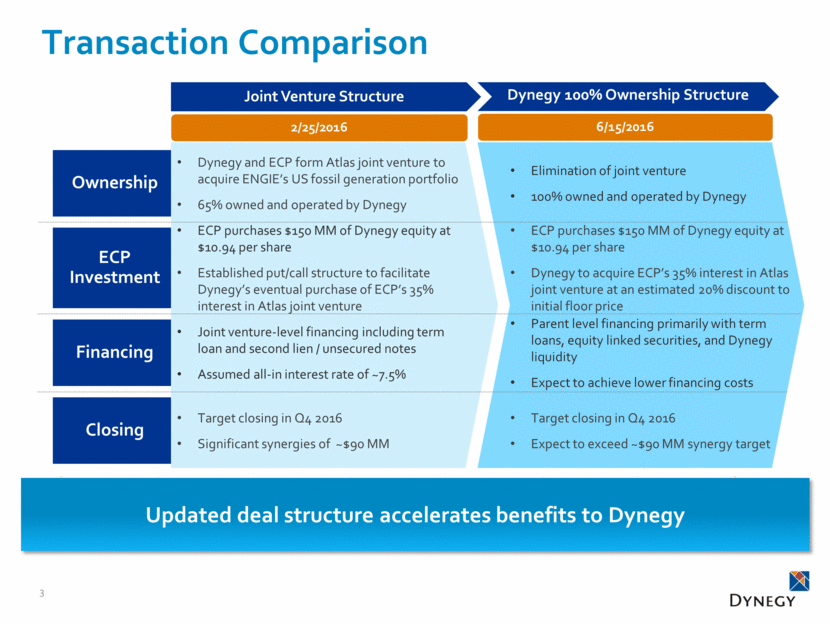
Ownership ECP Investment Financing Closing Transaction Comparison 3 Updated deal structure accelerates benefits to Dynegy Joint Venture Structure Dynegy 100% Ownership Structure 2/25/2016 6/15/2016 Elimination of joint venture 100% owned and operated by Dynegy Dynegy and ECP form Atlas joint venture to acquire ENGIE’s US fossil generation portfolio 65% owned and operated by Dynegy ECP purchases $150 MM of Dynegy equity at $10.94 per share Dynegy to acquire ECP’s 35% interest in Atlas joint venture at an estimated 20% discount to initial floor price ECP purchases $150 MM of Dynegy equity at $10.94 per share Established put/call structure to facilitate Dynegy’s eventual purchase of ECP’s 35% interest in Atlas joint venture Parent level financing primarily with term loans, equity linked securities, and Dynegy liquidity Expect to achieve lower financing costs Joint venture-level financing including term loan and second lien / unsecured notes Assumed all-in interest rate of ~7.5% Target closing in Q4 2016 Significant synergies of ~$90 MM Target closing in Q4 2016 Expect to exceed ~$90 MM synergy target
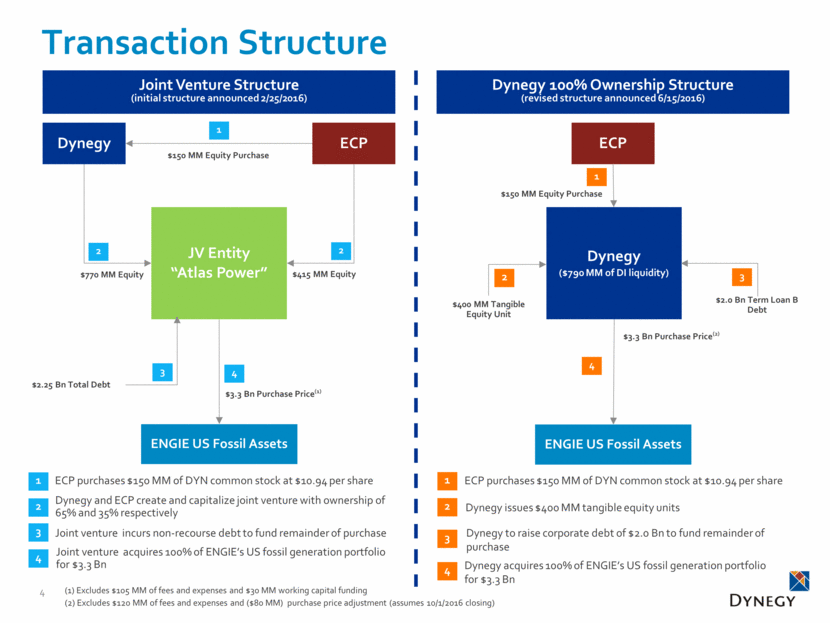
Transaction Structure Dynegy 100% Ownership Structure (revised structure announced 6/15/2016) ECP purchases $150 MM of DYN common stock at $10.94 per share 1 2 3 4 ECP $150 MM Equity Purchase ENGIE US Fossil Assets 1 $2.0 Bn Term Loan B Debt 4 $400 MM Tangible Equity Unit 3 3 Joint Venture Structure (initial structure announced 2/25/2016) JV Entity “Atlas Power” ENGIE US Fossil Assets 2 4 $3.3 Bn Purchase Price(1) Dynegy ECP $150 MM Equity Purchase 1 2 3 ECP purchases $150 MM of DYN common stock at $10.94 per share 1 2 3 4 Dynegy ($790 MM of DI liquidity) 2 $770 MM Equity $415 MM Equity $2.25 Bn Total Debt $3.3 Bn Purchase Price(2) Dynegy and ECP create and capitalize joint venture with ownership of 65% and 35% respectively Joint venture incurs non-recourse debt to fund remainder of purchase Joint venture acquires 100% of ENGIE’s US fossil generation portfolio for $3.3 Bn 4 Dynegy issues $400 MM tangible equity units Dynegy to raise corporate debt of $2.0 Bn to fund remainder of purchase Dynegy acquires 100% of ENGIE’s US fossil generation portfolio for $3.3 Bn (1) Excludes $105 MM of fees and expenses and $30 MM working capital funding (2) Excludes $120 MM of fees and expenses and ($80 MM) purchase price adjustment (assumes 10/1/2016 closing)
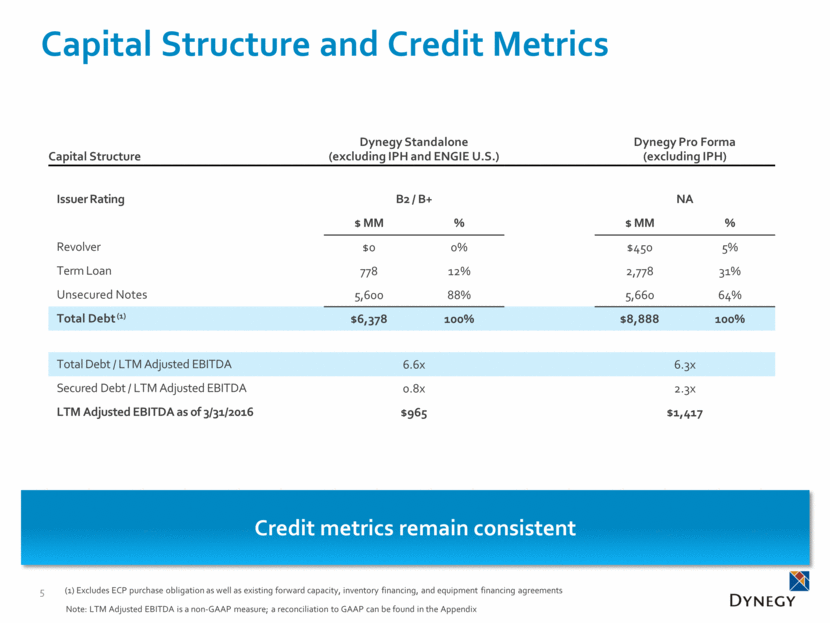
Capital Structure and Credit Metrics Capital Structure Dynegy Standalone (excluding IPH and ENGIE U.S.) Dynegy Pro Forma (excluding IPH) Issuer Rating B2 / B+ NA $ MM % $ MM % Revolver $0 0% $450 5% Term Loan 778 12% 2,778 31% Unsecured Notes 5,600 88% 5,660 64% Total Debt (1) $6,378 100% $8,888 100% Total Debt / LTM Adjusted EBITDA 6.6x 6.3x Secured Debt / LTM Adjusted EBITDA 0.8x 2.3x LTM Adjusted EBITDA as of 3/31/2016 $965 $1,417 (1) Excludes ECP purchase obligation as well as existing forward capacity, inventory financing, and equipment financing agreements Credit metrics remain consistent 5 Note: LTM Adjusted EBITDA is a non-GAAP measure; a reconciliation to GAAP can be found in the Appendix
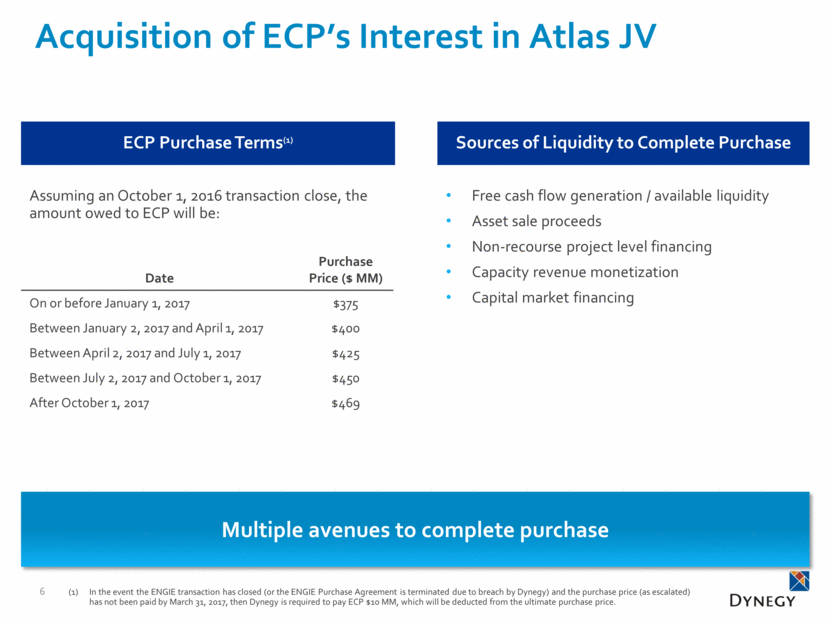
Acquisition of ECP’s Interest in Atlas JV Multiple avenues to complete purchase Free cash flow generation / available liquidity Asset sale proceeds Non-recourse project level financing Capacity revenue monetization Capital market financing Sources of Liquidity to Complete Purchase ECP Purchase Terms(1) 6 Date Purchase Price ($ MM) On or before January 1, 2017 $375 Between January 2, 2017 and April 1, 2017 $400 Between April 2, 2017 and July 1, 2017 $425 Between July 2, 2017 and October 1, 2017 $450 After October 1, 2017 $469 Assuming an October 1, 2016 transaction close, the amount owed to ECP will be: In the event the ENGIE transaction has closed (or the ENGIE Purchase Agreement is terminated due to breach by Dynegy) and the purchase price (as escalated) has not been paid by March 31, 2017, then Dynegy is required to pay ECP $10 MM, which will be deducted from the ultimate purchase price.
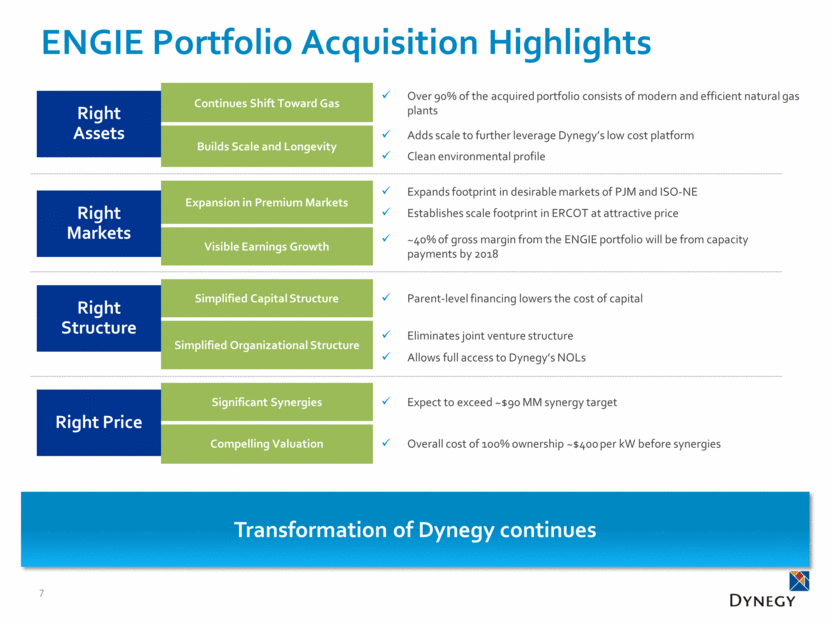
Right Assets Right Markets Right Structure Right Price ENGIE Portfolio Acquisition Highlights Transformation of Dynegy continues Continues Shift Toward Gas Over 90% of the acquired portfolio consists of modern and efficient natural gas plants Builds Scale and Longevity Adds scale to further leverage Dynegy’s low cost platform Clean environmental profile Expansion in Premium Markets Expands footprint in desirable markets of PJM and ISO-NE Establishes scale footprint in ERCOT at attractive price Visible Earnings Growth ~40% of gross margin from the ENGIE portfolio will be from capacity payments by 2018 Simplified Capital Structure Parent-level financing lowers the cost of capital Simplified Organizational Structure Eliminates joint venture structure Allows full access to Dynegy’s NOLs Significant Synergies Expect to exceed ~$90 MM synergy target Compelling Valuation Overall cost of 100% ownership ~$400 per kW before synergies 7
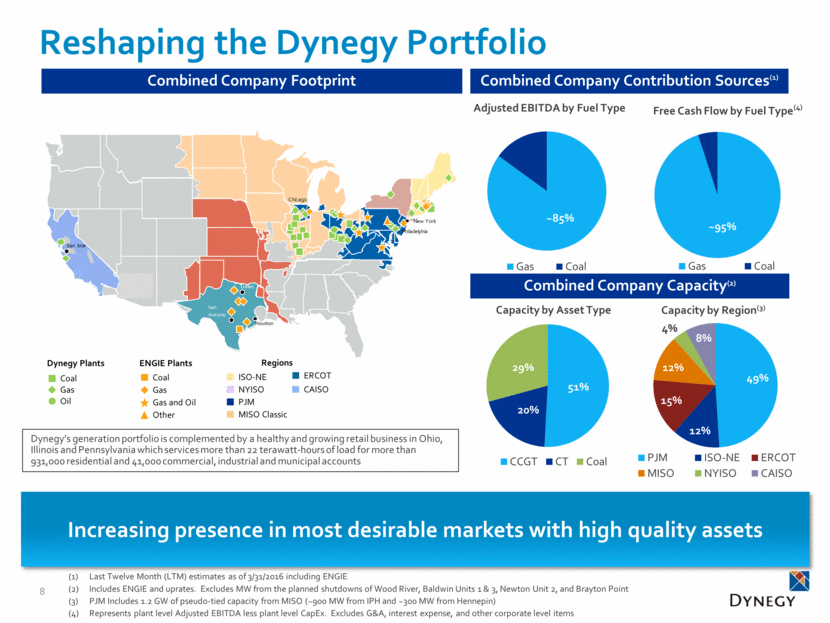
Reshaping the Dynegy Portfolio Combined Company Contribution Sources(1) Combined Company Footprint Increasing presence in most desirable markets with high quality assets Combined Company Capacity(2) Last Twelve Month (LTM) estimates as of 3/31/2016 including ENGIE Includes ENGIE and uprates. Excludes MW from the planned shutdowns of Wood River, Baldwin Units 1 & 3, Newton Unit 2, and Brayton Point PJM Includes 1.2 GW of pseudo-tied capacity from MISO (~900 MW from IPH and ~300 MW from Hennepin) Represents plant level Adjusted EBITDA less plant level CapEx. Excludes G&A, interest expense, and other corporate level items Coal Gas Oil Dynegy Plants ENGIE Plants Coal Gas Gas and Oil Other Regions ISO-NE NYISO PJM MISO Classic ERCOT CAISO Dynegy’s generation portfolio is complemented by a healthy and growing retail business in Ohio, Illinois and Pennsylvania which services more than 22 terawatt-hours of load for more than 931,000 residential and 41,000 commercial, industrial and municipal accounts 8 ~85 % Adjusted EBITDA by Fuel Type Gas Coal ~95 % Free Cash Flow by Fuel Type (4) Gas Coal 51% 20% 29% Capacity by Asset Type CCGT CT Coal 49% 12% 15% 12% 4% 8% Capacity by Region (3) PJM ISO-NE ERCOT MISO NYISO CAISO
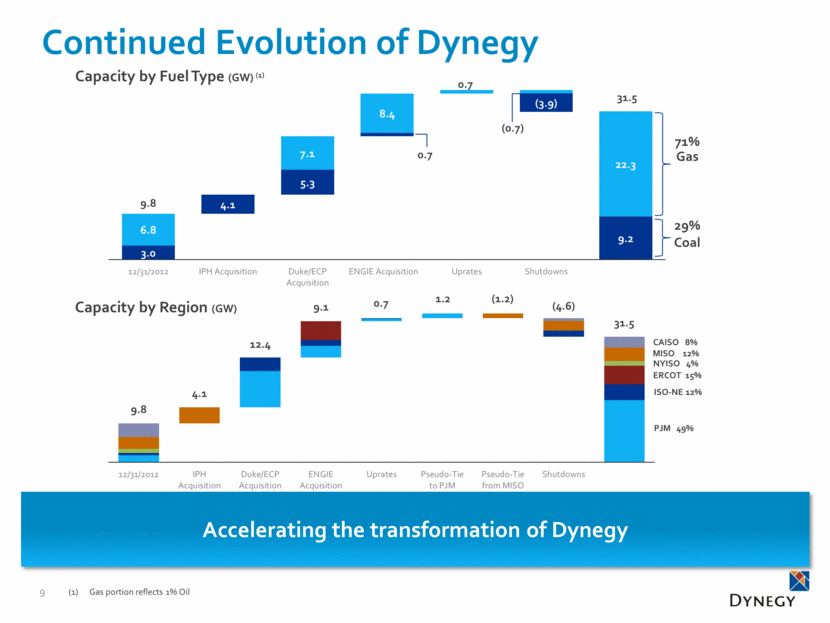
Accelerating the transformation of Dynegy Continued Evolution of Dynegy 9 9.8 31.5 Capacity by Fuel Type (GW) (1) 71% Gas 29% Coal Gas portion reflects 1% Oil Capacity by Region (GW) 9.8 31.5 4.1 12.4 0.7 (4.6) 9.1 CAISO 8% MISO 12% NYISO 4% ERCOT 15% ISO-NE 12% PJM 49% 1.2 (1.2) 9.8 13.8 26.2 35.3 31.4 3.0 4.1 5.3 0.7 (3.9) 9.2 6.8 7.1 8.4 0.7 (0.7) 22.3 12/31/2012 IPH Acquisition Duke/ECP Acquisition ENGIE Acquisition Uprates Shutdowns 12/31/2012 IPH Acquisition Duke/ECP Acquisition ENGIE Acquisition Uprates Pseudo-Tie to PJM Pseudo-Tie from MISO Shutdowns
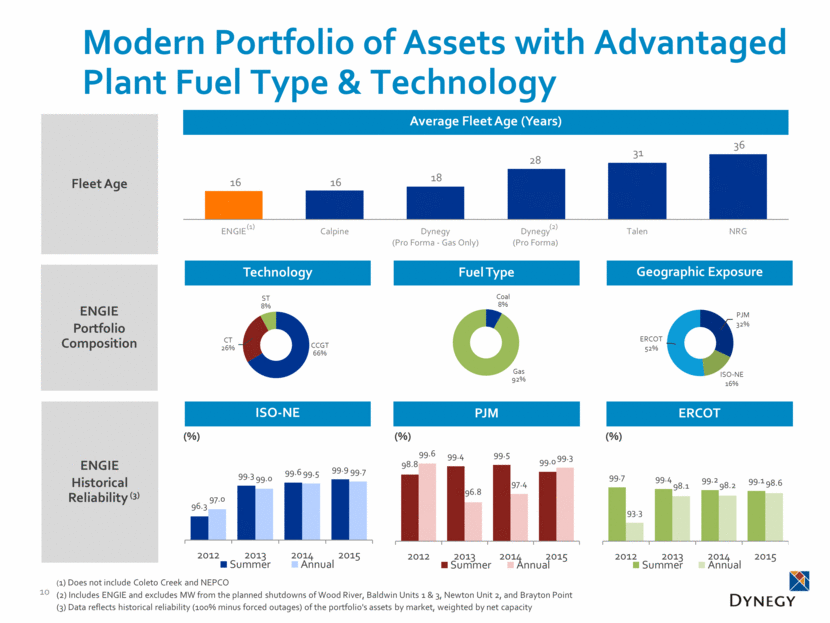
Modern Portfolio of Assets with Advantaged Plant Fuel Type & Technology PJM ISO-NE ERCOT ENGIE Historical Reliability (3) (%) (%) (%) Fleet Age ENGIE Portfolio Composition (1) Does not include Coleto Creek and NEPCO (2) Includes ENGIE and excludes MW from the planned shutdowns of Wood River, Baldwin Units 1 & 3, Newton Unit 2, and Brayton Point (3) Data reflects historical reliability (100% minus forced outages) of the portfolio's assets by market, weighted by net capacity Fuel Type Geographic Exposure Technology Average Fleet Age (Years) (1) (2) 10 96.3 99.3 99.6 99.9 97.0 99.0 99.5 99.7 2012 2013 2014 2015 Summer Annual 98.8 99.4 99.5 99.0 99.6 96.8 97.4 99.3 2012 2013 2014 2015 Summer Annual 99.7 99.4 99.2 99.1 93.3 98.1 98.2 98.6 2012 2013 2014 2015 Summer Annual 16 16 18 28 31 36 ENGIE Calpine Dynegy (Pro Forma - Gas Only) Dynegy (Pro Forma) Talen NRG PJM 32% ISO - NE 16% ERCOT 52% Coal 8% Gas 92% CCGT 66% CT 26% ST 8%
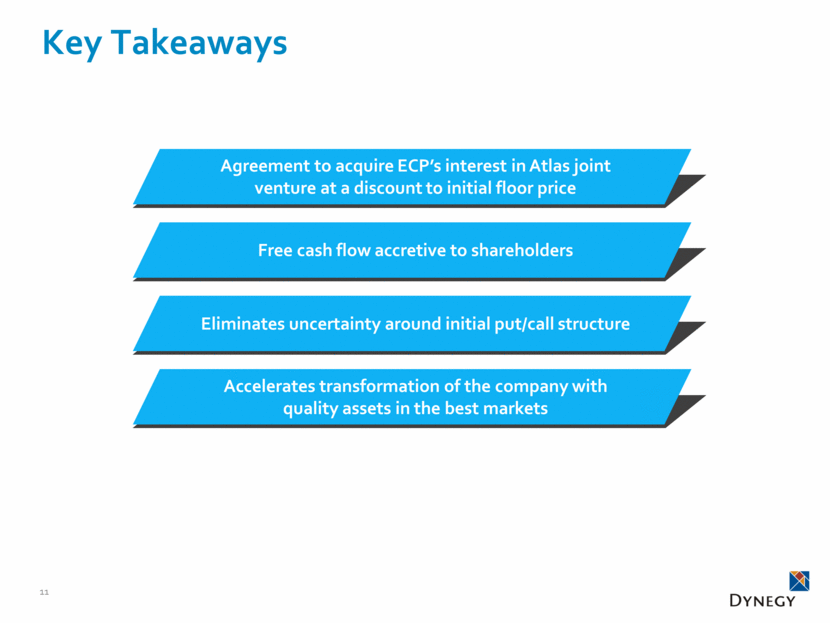
Key Takeaways 11 Agreement to acquire ECP’s interest in Atlas joint venture at a discount to initial floor price Free cash flow accretive to shareholders Eliminates uncertainty around initial put/call structure Accelerates transformation of the company with quality assets in the best markets
Appendix
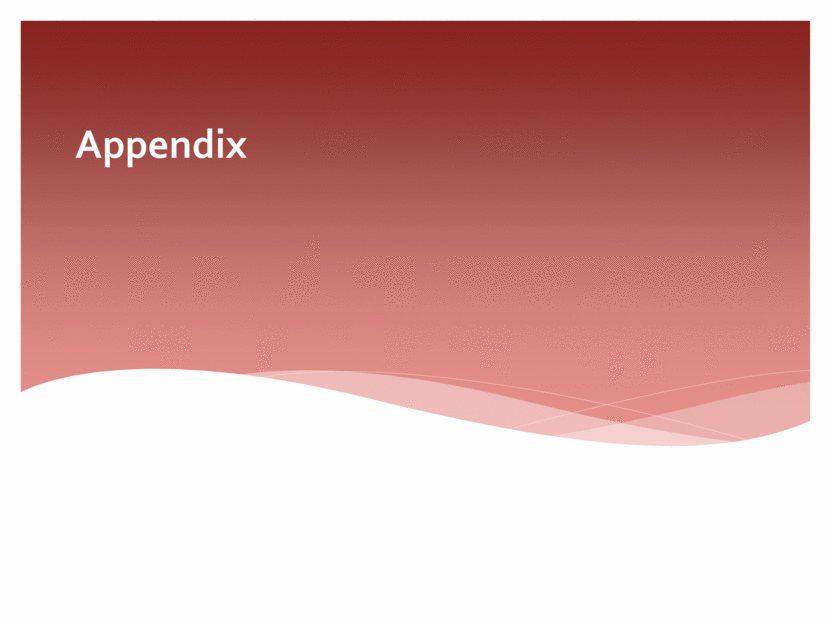
ENGIE Power Portfolio Overview ENGIE Power Fossil Generation Portfolio Capacity by Fuel Type With 92% gas-fired plants, the ENGIE transaction creates a CCGT driven portfolio in desirable markets that complements Dynegy’s existing business Coal Gas – CCGT ERCOT PJM ISO-NE Capacity by Geography Gas - Peakers Coleto Creek (635 MW) Wharton County (85 MW) Hays (1,107 MW) Wise (787 MW) Midlothian (1,712 MW) Ennis (370 MW) Calumet (380 MW) Troy (770MW) Blackstone (544 MW) Milford (171 MW) Bellingham (566 MW) Bellingham – NEA (157 MW) Pleasants (388 MW) Armstrong (753 MW) Sayreville (170 MW) Hopewell (411 MW) NEPCO (52 MW) Coal Gas - CCGT Gas - Peakers 13 8% 66% 26% 52% 32% 16%
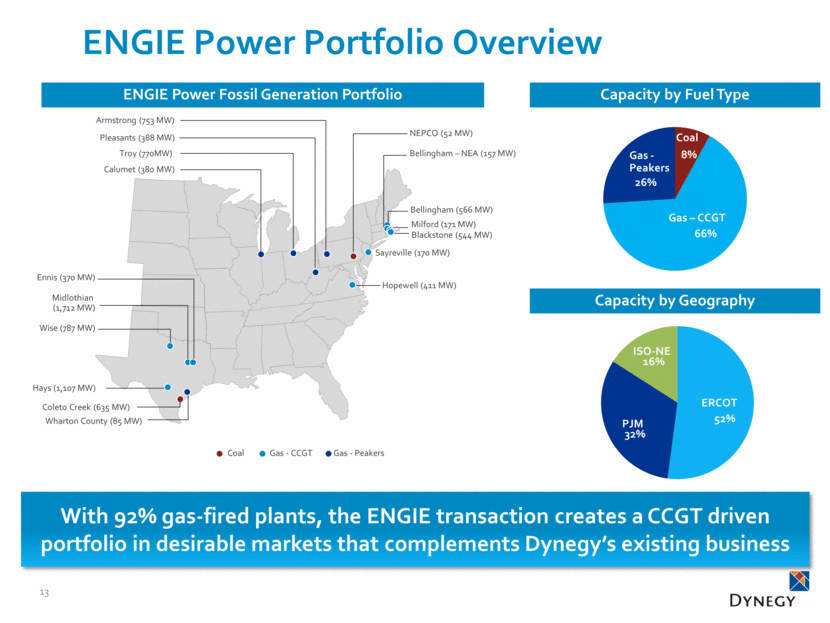
14 ENGIE Power Portfolio Summary Asset Name Commercial Operations Date Ownership Fuel Type Full Load Heat Rate (Btu/kWH) Technology ISO Net MW(1) ISO-NE Bellingham 2002 100% Gas 7,408 CCGT 566 Bellingham - NEA 1991 50% Gas 8,219 CCGT 157 Blackstone 2001 100% Gas 7,350 CCGT 544 Milford 1993 100% Gas 8,291 CCGT 171 Total ISO-NE 1,438 PJM Sayreville 1991 50% Gas 8,122 CCGT 170 Armstrong 2002 100% Gas 10,274 CT 753 Calumet 2002 100% Gas 9,333 CT 380 Pleasants 2002 100% Gas 10,130 CT 388 Troy 2002 100% Gas 10,036 CT 770 NEPCO 1989 100% Coal 13,800 ST 52 Hopewell 1990 100% Gas 8,100 CCGT 411 Total PJM 2,924 ERCOT Coleto Creek 1980 100% Coal 9,900 ST 635 Wharton County 1984 100% Gas 11,775 CT 85 Ennis 2002 100% Gas 6,952 CCGT 370 Midlothian 2000 100% Gas 7,122 CCGT 1,712 Hays 2002 100% Gas 7,135 CCGT 1,107 Wise 2004 100% Gas 7,170 CCGT 787 Total ERCOT 4,696 Total Capacity 9,058 (1) Unit capabilities are based on winter capacity ratings
Appendix Reg G Reconciliations
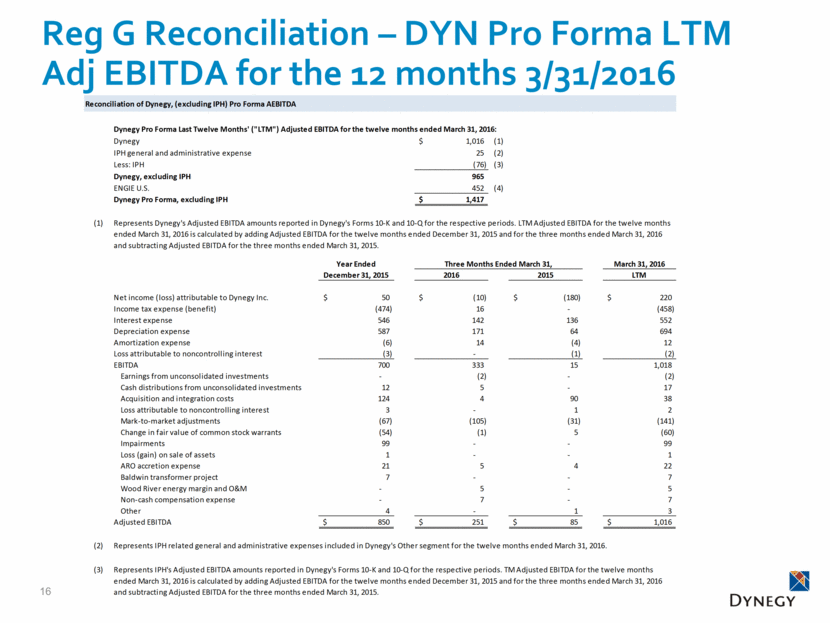
16 Reg G Reconciliation – DYN Pro Forma LTM Adj EBITDA for the 12 months 3/31/2016 Reconciliation of Dynegy, (excluding IPH) Pro Forma AEBITDA Dynegy Pro Forma Last Twelve Months' ("LTM") Adjusted EBITDA for the twelve months ended March 31, 2016: Dynegy 1,016 $ (1) IPH general and administrative expense 25 (2) Less: IPH (76) (3) Dynegy, excluding IPH 965 ENGIE U.S. 452 (4) Dynegy Pro Forma, excluding IPH 1,417 $ (1) March 31, 2016 2016 2015 LTM Net income (loss) attributable to Dynegy Inc. 50 $ (10) $ (180) $ 220 $ Income tax expense (benefit) (474) 16 - (458) Interest expense 546 142 136 552 Depreciation expense 587 171 64 694 Amortization expense (6) 14 (4) 12 Loss attributable to noncontrolling interest (3) - (1) (2) EBITDA 700 333 15 1,018 Earnings from unconsolidated investments - (2) - (2) Cash distributions from unconsolidated investments 12 5 - 17 Acquisition and integration costs 124 4 90 38 Loss attributable to noncontrolling interest 3 - 1 2 Mark-to-market adjustments (67) (105) (31) (141) Change in fair value of common stock warrants (54) (1) 5 (60) Impairments 99 - - 99 Loss (gain) on sale of assets 1 - - 1 ARO accretion expense 21 5 4 22 Baldwin transformer project 7 - - 7 Wood River energy margin and O&M - 5 - 5 Non-cash compensation expense - 7 - 7 Other 4 - 1 3 Adjusted EBITDA 850 $ 251 $ 85 $ 1,016 $ (2) Represents IPH related general and administrative expenses included in Dynegy's Other segment for the twelve months ended March 31, 2016. (3) Represents Dynegy's Adjusted EBITDA amounts reported in Dynegy's Forms 10-K and 10-Q for the respective periods. LTM Adjusted EBITDA for the twelve months ended March 31, 2016 is calculated by adding Adjusted EBITDA for the twelve months ended December 31, 2015 and for the three months ended March 31, 2016 and subtracting Adjusted EBITDA for the three months ended March 31, 2015. Year Ended December 31, 2015 Three Months Ended March 31, Represents IPH's Adjusted EBITDA amounts reported in Dynegy's Forms 10-K and 10-Q for the respective periods. TM Adjusted EBITDA for the twelve months ended March 31, 2016 is calculated by adding Adjusted EBITDA for the twelve months ended December 31, 2015 and for the three months ended March 31, 2016 and subtracting Adjusted EBITDA for the three months ended March 31, 2015.
17 Reg G Reconciliation – DYN Pro Forma LTM Adj EBITDA for the 12 months 3/31/2016 (continued) March 31, 2016 2016 2015 LTM Net income (loss) attributable to Dynegy Inc. 49 $ 14 $ 22 $ 41 $ Depreciation expense 29 9 8 30 Amortization expense (6) (1) (1) (6) EBITDA 72 22 29 65 Loss attributable to noncontrolling interest 3 - 1 2 Mark-to-market adjustments (10) (3) (11) (2) ARO accretion expense 12 2 3 11 Adjusted EBITDA 77 $ 21 $ 22 $ 76 $ March 31, 2016 2016 2015 LTM Net income (loss) (493) $ (2) $ 8 $ (503) $ Plus/(Less): Income tax expense (benefit) 53 (1) 5 47 Interest expense 58 11 14 55 Depreciation 229 57 56 230 EBITDA (153) 65 83 (171) Plus/(Less): Loss on sale of assets 11 3 1 13 Mark-to-market (income) loss, net (5) (8) (33) 20 Impairments 576 6 - 582 Earnings from unconsolidated investments (46) (10) (10) (46) Cash distributions from unconsolidated investments 47 14 6 55 Change in fair value of employee-related warrants (1) - - (1) Non-cash compensation expense (1) - - (1) Other, net - 1 - 1 Adjusted EBITDA 428 $ 71 $ 47 $ 452 $ Represents ENGIE U.S. historical amounts reported in Dynegy's Form 8-K filed on June 15, 2016 (in millions). TM Adjusted EBITDA for the twelve months ended March 31, 2016 is calculated by adding Adjusted EBITDA for the twelve months ended December 31, 2015 and for the three months ended March 31, 2016 and subtracting Adjusted EBITDA for the three months ended March 31, 2015. Year Ended December 31, 2015 Three Months Ended March 31, Year Ended December 31, 2015 Three Months Ended March 31,

Serious News for Serious Traders! Try StreetInsider.com Premium Free!
You May Also Be Interested In
- Green Energy Park Raises 30 million US Dollars in Initial Equity Funding to Accelerate the Energy Transition and to Build One of the Largest Renewable Hydrogen Production and Export Terminal Facilitie
- GXO helps Virgin Media O2 cut single use plastic
- Agronomics Limited Announces Solar Foods Raises an Additional EUR8 Million
Create E-mail Alert Related Categories
SEC FilingsSign up for StreetInsider Free!
Receive full access to all new and archived articles, unlimited portfolio tracking, e-mail alerts, custom newswires and RSS feeds - and more!


 Tweet
Tweet Share
Share