Form 8-K Wendy's Co For: Nov 04
UNITED STATES
SECURITIES AND EXCHANGE COMMISSION
Washington, D.C. 20549
FORM 8-K
CURRENT REPORT
Pursuant to Section 13 or 15(d)
of the Securities Exchange Act of 1934
Date of Report (Date of earliest event reported): November 4, 2015
THE WENDY’S COMPANY
(Exact name of registrant as specified in its charter)
| Delaware | 1-2207 | 38-0471180 | ||
| (State or other jurisdiction of incorporation) |
(Commission File Number) |
(IRS Employer Identification No.) |
| One Dave Thomas Blvd., Dublin, Ohio | 43017 | |
| (Address of principal executive offices) | (Zip Code) |
Registrant’s telephone number, including area code: (614) 764-3100
Not Applicable
(Former name or former address, if changed since last report.)
Check the appropriate box below if the Form 8-K filing is intended to simultaneously satisfy the filing obligation of the registrant under any of the following provisions:
| ¨ | Written communications pursuant to Rule 425 under the Securities Act (17 CFR 230.425) |
| ¨ | Soliciting material pursuant to Rule 14a-12 under the Exchange Act (17 CFR 240.14a-12) |
| ¨ | Pre-commencement communications pursuant to Rule 14d-2(b) under the Exchange Act (17 CFR 240.14d-2(b)) |
| ¨ | Pre-commencement communications pursuant to Rule 13e-4(c) under the Exchange Act (17 CFR 240.13e-4(c)) |
| Item 7.01 | Regulation FD Disclosure. |
On November 4, 2015, management of The Wendy’s Company (the “Company”) gave a slide presentation during the Company’s fiscal 2015 third quarter conference call. The presentation materials are attached hereto as Exhibit 99.1 and incorporated herein by reference. These materials may also be used by the Company at one or more subsequent conferences with analysts and investors.
The information contained in the attached presentation materials is summary information that is intended to be considered in the context of the Company’s Securities and Exchange Commission filings and other public announcements. The Company undertakes no duty or obligation to publicly update or revise this information, although it may do so from time to time.
The information in this Current Report on Form 8-K, including the exhibit furnished pursuant to Item 9.01, shall not be deemed “filed” for the purposes of Section 18 of the Securities Exchange Act of 1934 or otherwise subject to the liabilities under that section. Furthermore, the information in this Current Report on Form 8-K, including the exhibit furnished pursuant to Item 9.01, shall not be deemed to be incorporated by reference into the filings of the Company under the Securities Act of 1933.
| Item 9.01 | Financial Statements and Exhibits. |
| (d) | Exhibits. |
| Exhibit No. | Description | |
| 99.1 | Conference call slide presentation materials used beginning on November 4, 2015. | |
SIGNATURES
Pursuant to the requirements of the Securities and Exchange Act of 1934, the registrant has duly caused this report to be signed on its behalf by the undersigned hereunto duly authorized.
| THE WENDY’S COMPANY |
| Date: November 4, 2015 |
By: | /s/ Dana Klein | ||||
| Dana Klein Senior Vice President – Corporate and Securities Counsel, and Assistant Secretary | ||||||
EXHIBIT INDEX
| Exhibit No. | Description | |
| 99.1 | Conference call slide presentation materials used beginning on November 4, 2015. | |
Third-Quarter 2015 Conference Call November 4, 2015
DAVID POPLAR Vice President Investor Relations
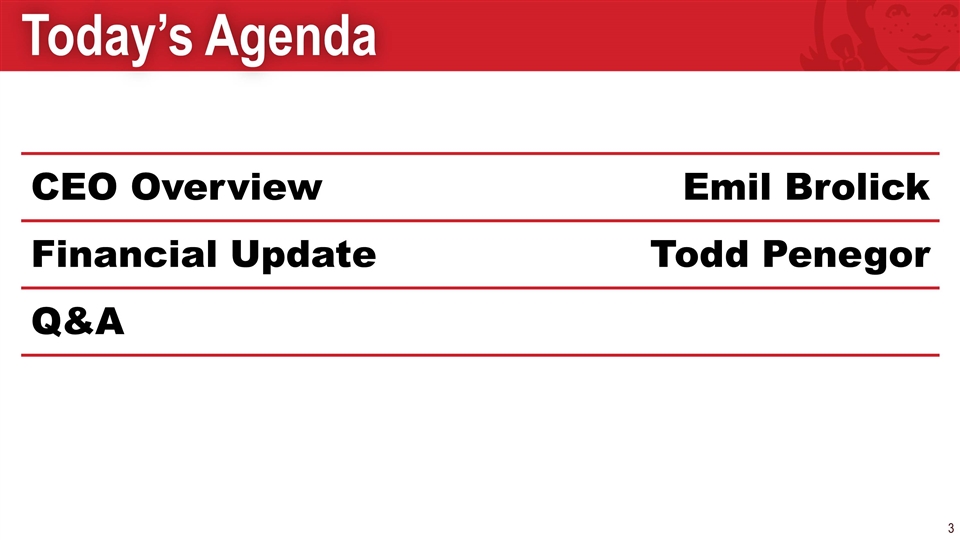
Today’s Agenda CEO Overview Emil Brolick Financial Update Todd Penegor Q&A
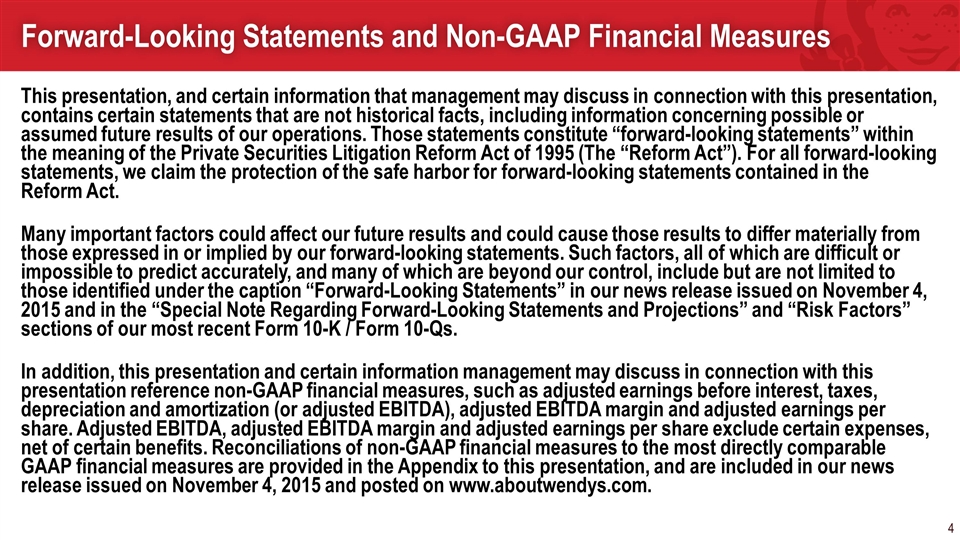
This presentation, and certain information that management may discuss in connection with this presentation, contains certain statements that are not historical facts, including information concerning possible or assumed future results of our operations. Those statements constitute “forward-looking statements” within the meaning of the Private Securities Litigation Reform Act of 1995 (The “Reform Act”). For all forward-looking statements, we claim the protection of the safe harbor for forward-looking statements contained in the Reform Act. Many important factors could affect our future results and could cause those results to differ materially from those expressed in or implied by our forward-looking statements. Such factors, all of which are difficult or impossible to predict accurately, and many of which are beyond our control, include but are not limited to those identified under the caption “Forward-Looking Statements” in our news release issued on November 4, 2015 and in the “Special Note Regarding Forward-Looking Statements and Projections” and “Risk Factors” sections of our most recent Form 10-K / Form 10-Qs. In addition, this presentation and certain information management may discuss in connection with this presentation reference non-GAAP financial measures, such as adjusted earnings before interest, taxes, depreciation and amortization (or adjusted EBITDA), adjusted EBITDA margin and adjusted earnings per share. Adjusted EBITDA, adjusted EBITDA margin and adjusted earnings per share exclude certain expenses, net of certain benefits. Reconciliations of non-GAAP financial measures to the most directly comparable GAAP financial measures are provided in the Appendix to this presentation, and are included in our news release issued on November 4, 2015 and posted on www.aboutwendys.com. Forward-Looking Statements and Non-GAAP Financial Measures
EMIL BROLICK President & CEO
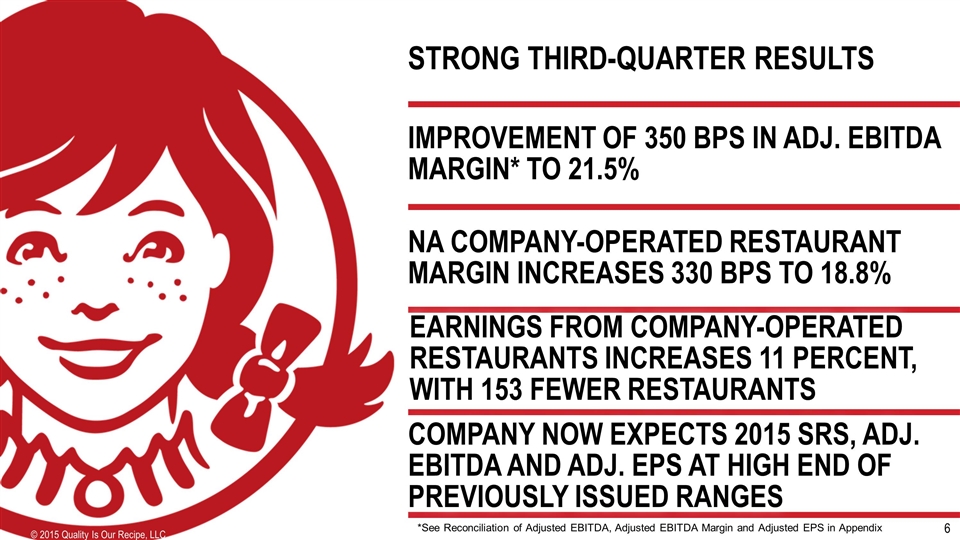
NA COMPANY-OPERATED RESTAURANT MARGIN INCREASES 330 BPS TO 18.8% IMPROVEMENT OF 350 BPS IN ADJ. EBITDA MARGIN* TO 21.5% COMPANY NOW EXPECTS 2015 SRS, ADJ. EBITDA AND ADJ. EPS AT HIGH END OF PREVIOUSLY ISSUED RANGES STRONG THIRD-QUARTER RESULTS *See Reconciliation of Adjusted EBITDA, Adjusted EBITDA Margin and Adjusted EPS in Appendix EARNINGS from Company-operated restaurants INCREASES 11 percent, with 153 fewer restaurants
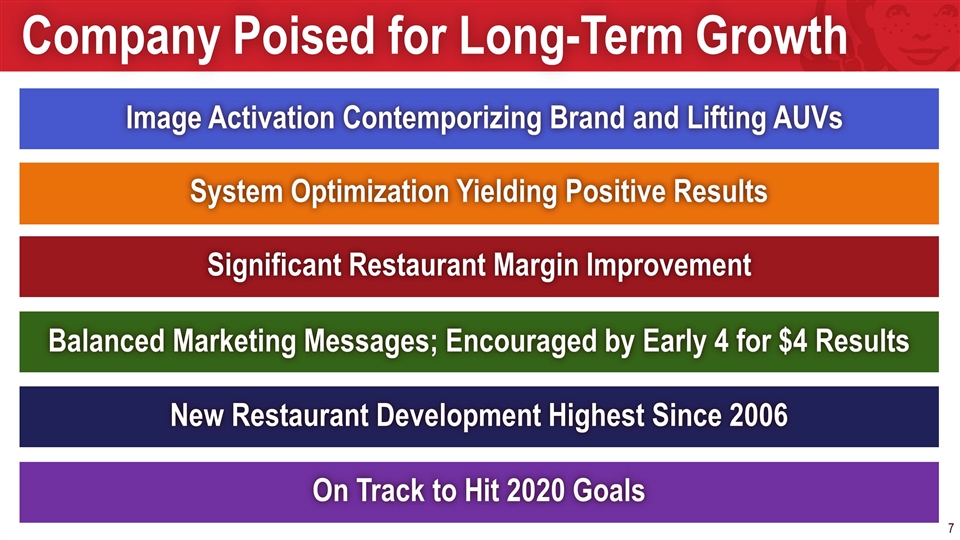
Company Poised for Long-Term Growth On Track to Hit 2020 Goals New Restaurant Development Highest Since 2006 Balanced Marketing Messages; Encouraged by Early 4 for $4 Results Significant Restaurant Margin Improvement System Optimization Yielding Positive Results Image Activation Contemporizing Brand and Lifting AUVs
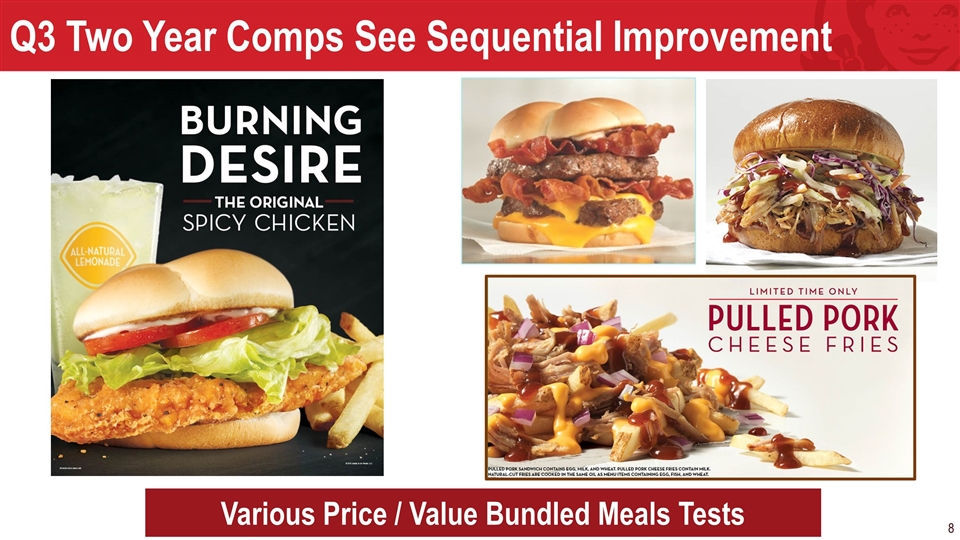
Q3 Two Year Comps See Sequential Improvement Various Price / Value Bundled Meals Tests
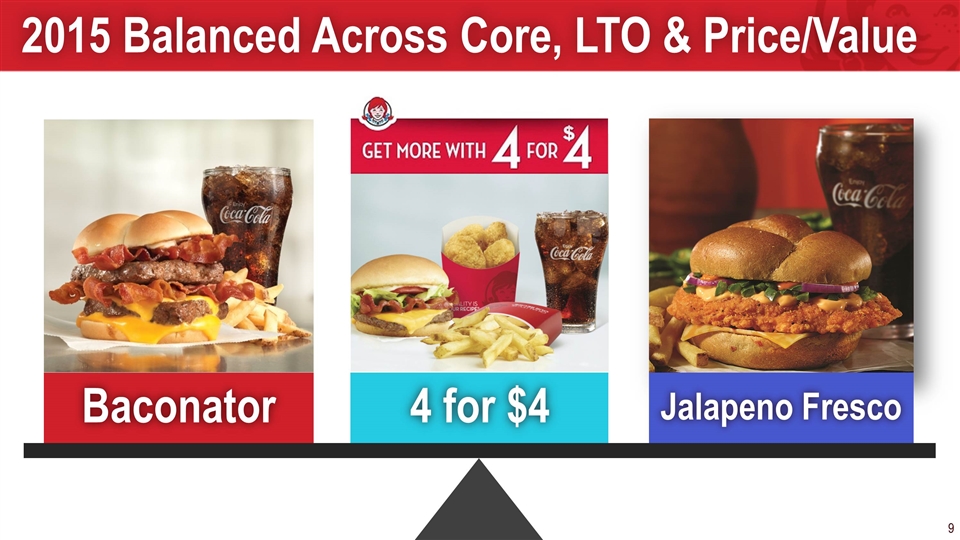
2015 Balanced Across Core, LTO & Price/Value Jalapeno Fresco 4 for $4 Baconator
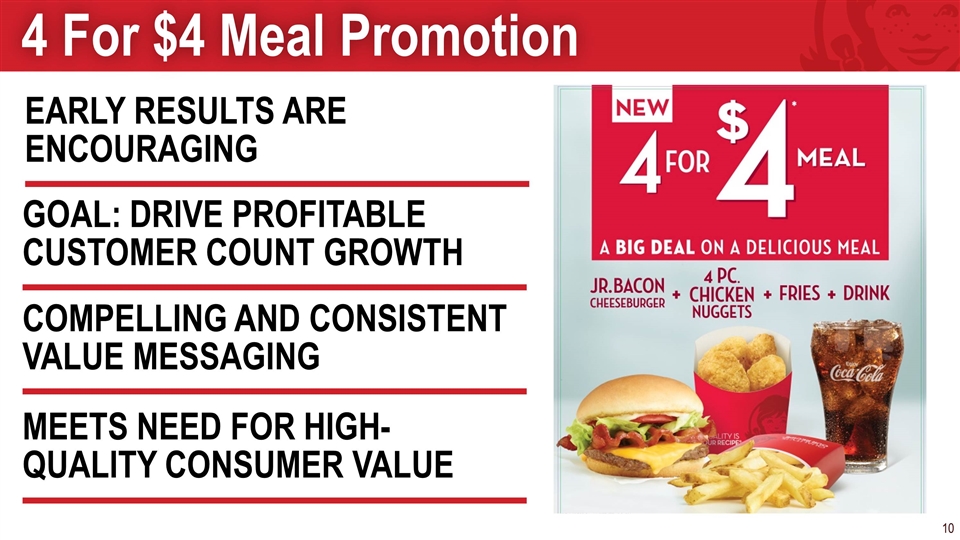
4 For $4 Meal Promotion GOAL: DRIVE PROFITABLE CUSTOMER COUNT GROWTH COMPELLING AND CONSISTENT VALUE MESSAGING MEETS NEED FOR HIGH-QUALITY CONSUMER VALUE EARLY RESULTS ARE ENCOURAGING
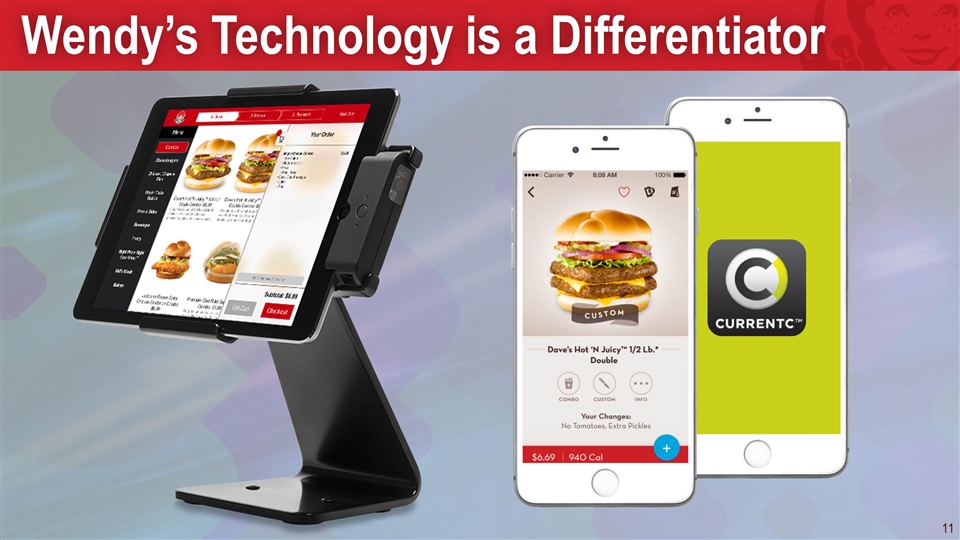
Wendy’s Technology is a Differentiator
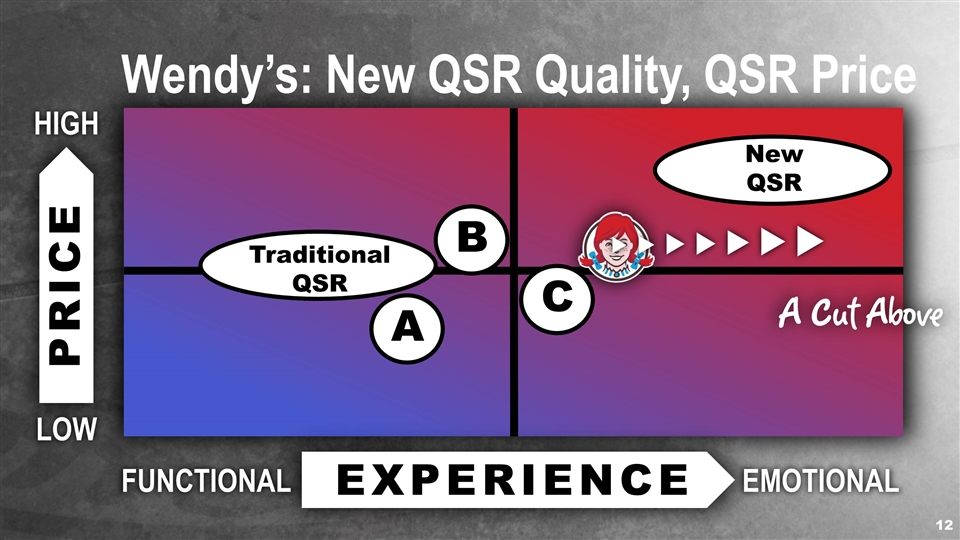
EXPERIENCE PRICE HIGH LOW FUNCTIONAL EMOTIONAL Wendy’s: New QSR Quality, QSR Price A B C New QSR Traditional QSR
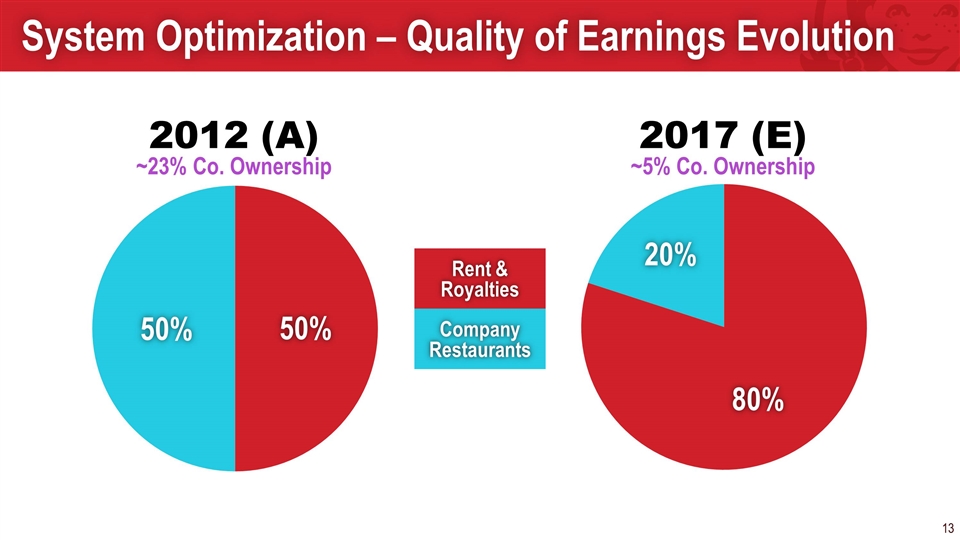
System Optimization – Quality of Earnings Evolution 2012 (A) ~23% Co. Ownership 2017 (E) ~5% Co. Ownership Rent & Royalties Company Restaurants
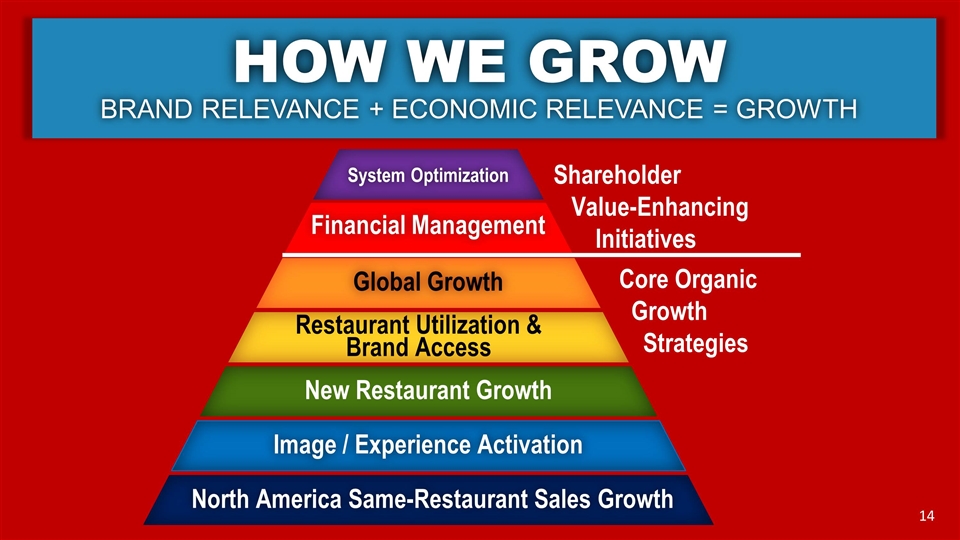
HOW WE GROW BRAND RELEVANCE + ECONOMIC RELEVANCE = GROWTH Financial Management Global Growth Restaurant Utilization & Brand Access System Optimization New Restaurant Growth Image / Experience Activation North America Same-Restaurant Sales Growth Shareholder Value-Enhancing Initiatives Core Organic Growth Strategies
TODD PENEGOR Chief Financial Officer
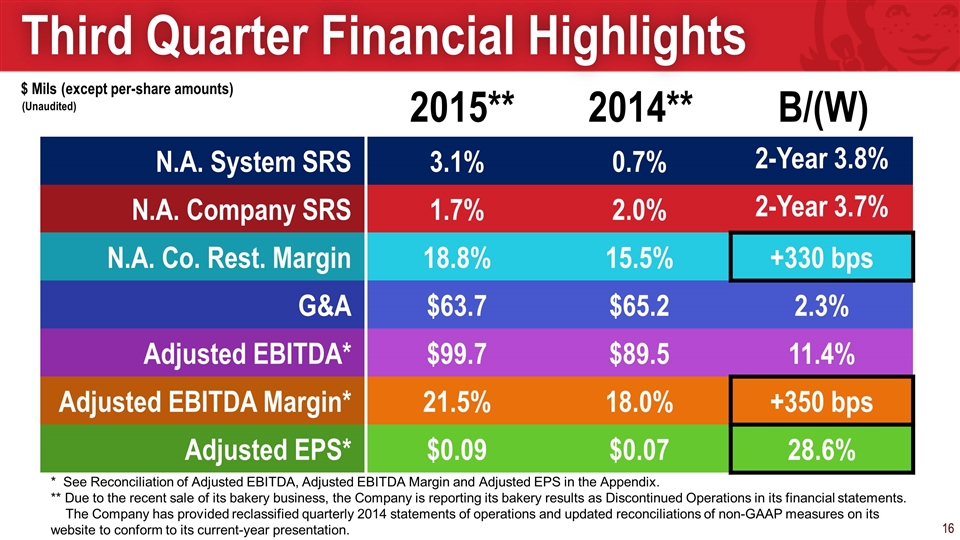
$ Mils (except per-share amounts) Third Quarter Financial Highlights N.A. System SRS 3.1% 0.7% 2-Year 3.8% N.A. Company SRS 1.7% 2.0% 2-Year 3.7% N.A. Co. Rest. Margin 18.8% 15.5% +330 bps G&A $63.7 $65.2 2.3% Adjusted EBITDA* $99.7 $89.5 11.4% Adjusted EBITDA Margin* 21.5% 18.0% +350 bps Adjusted EPS* $0.09 $0.07 28.6% 2015** 2014** B/(W) * See Reconciliation of Adjusted EBITDA, Adjusted EBITDA Margin and Adjusted EPS in the Appendix. ** Due to the recent sale of its bakery business, the Company is reporting its bakery results as Discontinued Operations in its financial statements. The Company has provided reclassified quarterly 2014 statements of operations and updated reconciliations of non-GAAP measures on its website to conform to its current-year presentation. (Unaudited)
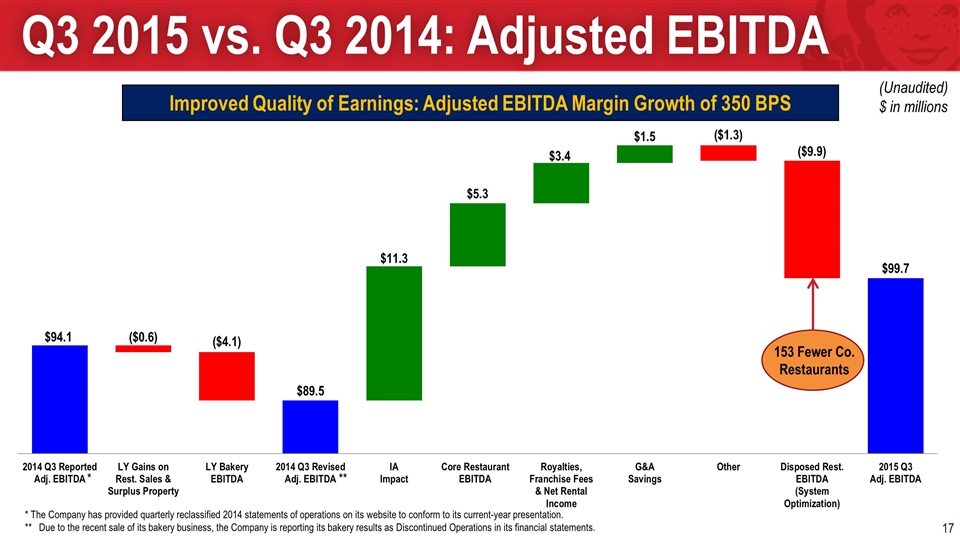
Q3 2015 vs. Q3 2014: Adjusted EBITDA * The Company has provided quarterly reclassified 2014 statements of operations on its website to conform to its current-year presentation. ** Due to the recent sale of its bakery business, the Company is reporting its bakery results as Discontinued Operations in its financial statements. (Unaudited) $ in millions Improved Quality of Earnings: Adjusted EBITDA Margin Growth of 350 BPS ** * 153 Fewer Co. Restaurants
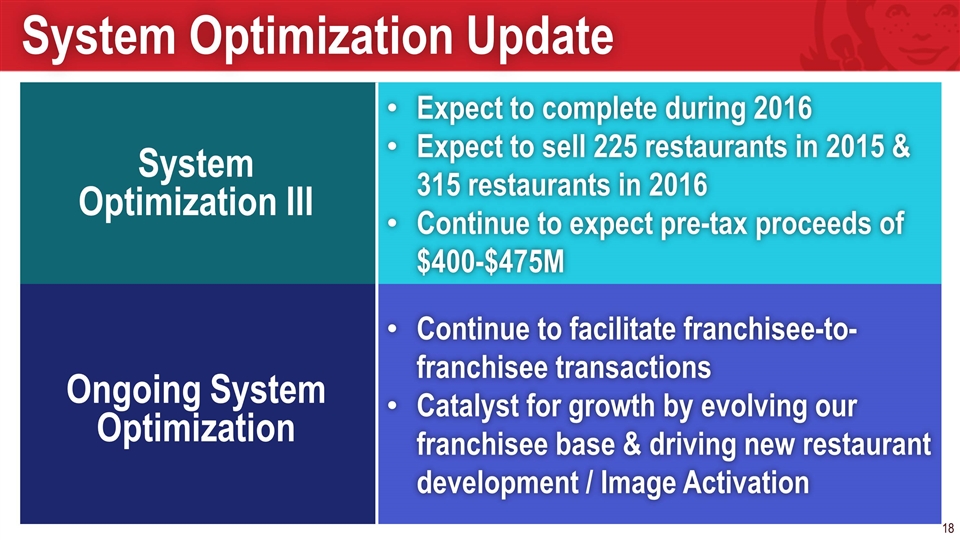
System Optimization Update System Optimization III Expect to complete during 2016 Expect to sell 225 restaurants in 2015 & 315 restaurants in 2016 Continue to expect pre-tax proceeds of $400-$475M Ongoing System Optimization Continue to facilitate franchisee-to- franchisee transactions Catalyst for growth by evolving our franchisee base & driving new restaurant development / Image Activation
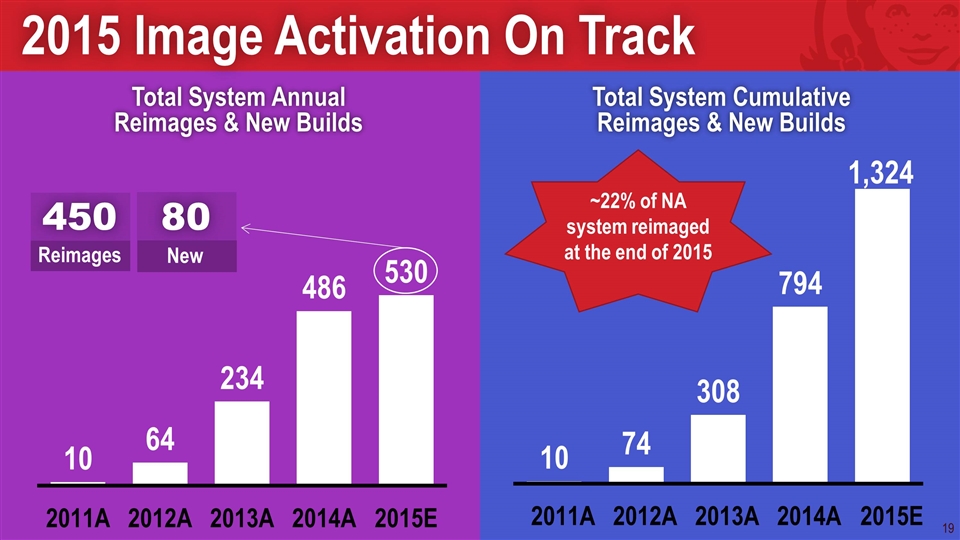
2015 Image Activation On Track Total System Annual Reimages & New Builds Total System Cumulative Reimages & New Builds 450 Reimages 80 New ~22% of NA system reimaged at the end of 2015
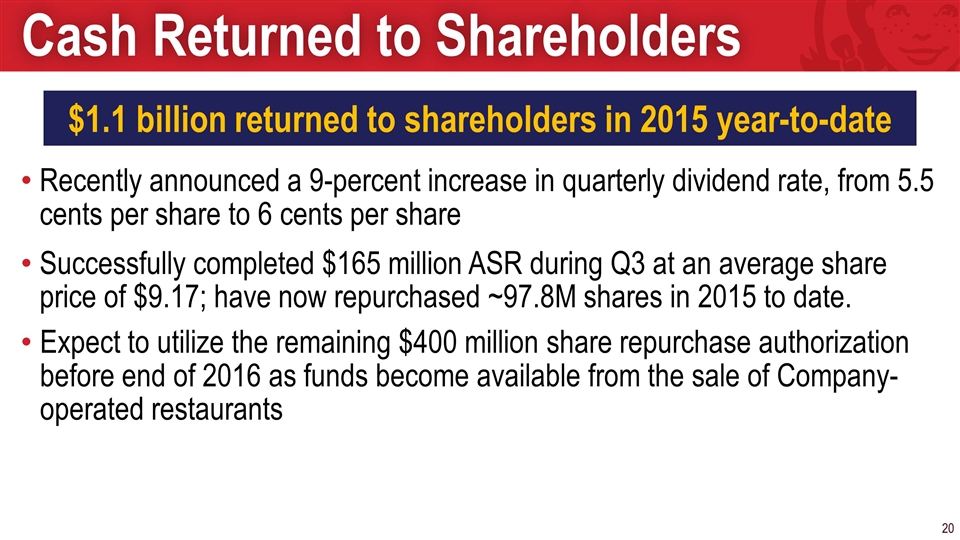
Recently announced a 9-percent increase in quarterly dividend rate, from 5.5 cents per share to 6 cents per share Successfully completed $165 million ASR during Q3 at an average share price of $9.17; have now repurchased ~97.8M shares in 2015 to date. Expect to utilize the remaining $400 million share repurchase authorization before end of 2016 as funds become available from the sale of Company-operated restaurants Cash Returned to Shareholders $1.1 billion returned to shareholders in 2015 year-to-date
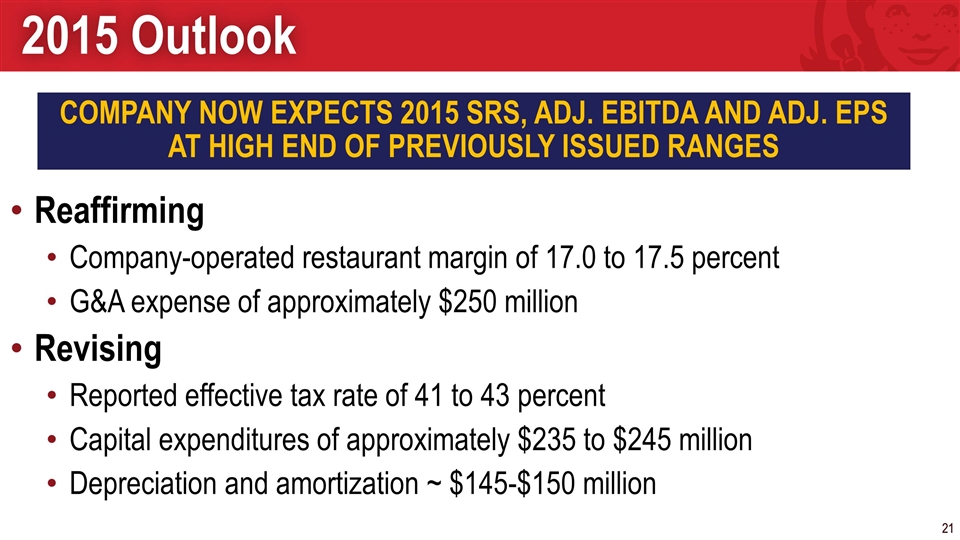
2015 Outlook Reaffirming Company-operated restaurant margin of 17.0 to 17.5 percent G&A expense of approximately $250 million Revising Reported effective tax rate of 41 to 43 percent Capital expenditures of approximately $235 to $245 million Depreciation and amortization ~ $145-$150 million COMPANY NOW EXPECTS 2015 SRS, ADJ. EBITDA AND ADJ. EPS AT HIGH END OF PREVIOUSLY ISSUED RANGES
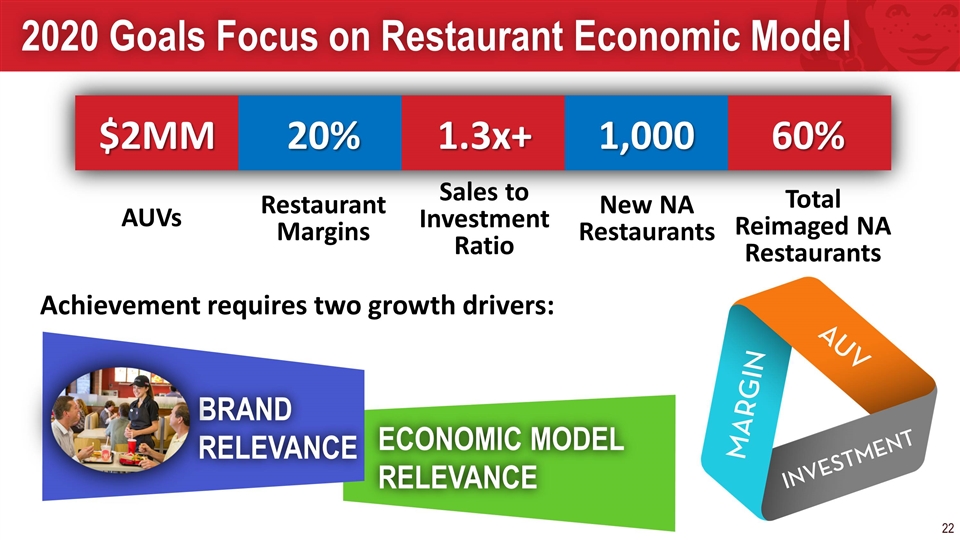
2020 Goals Focus on Restaurant Economic Model $2MM 20% 1.3x+ 1,000 AUVs Restaurant Margins Sales to Investment Ratio New NA Restaurants 60% Total Reimaged NA Restaurants BRAND RELEVANCE ECONOMIC MODEL RELEVANCE Achievement requires two growth drivers:
DAVID POPLAR Vice President Investor Relations (614) 764-3311 [email protected]
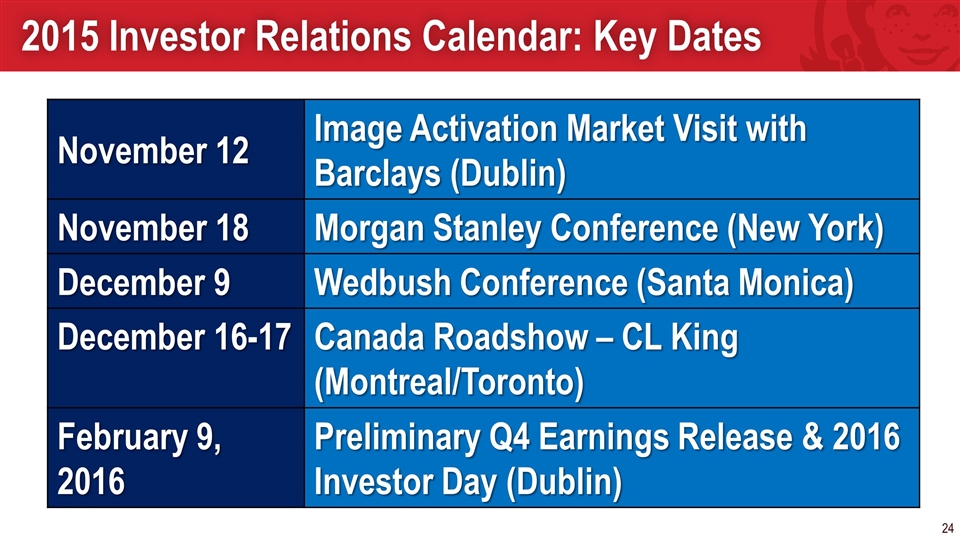
2015 Investor Relations Calendar: Key Dates November 12 Image Activation Market Visit with Barclays (Dublin) November 18 Morgan Stanley Conference (New York) December 9 Wedbush Conference (Santa Monica) December 16-17 Canada Roadshow – CL King (Montreal/Toronto) February 9, 2016 Preliminary Q4 Earnings Release & 2016 Investor Day (Dublin)

Q&A
Appendix
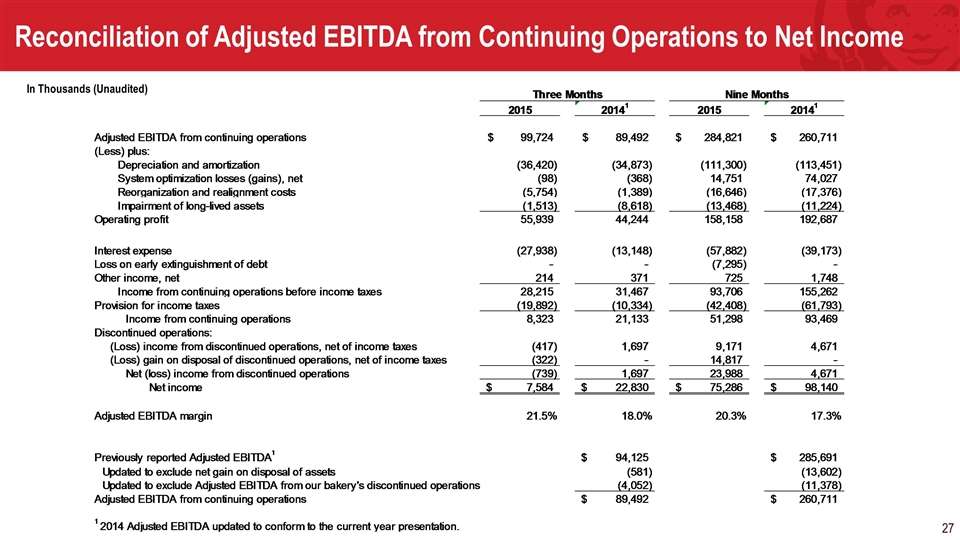
Reconciliation of Adjusted EBITDA from Continuing Operations to Net Income In Thousands (Unaudited)
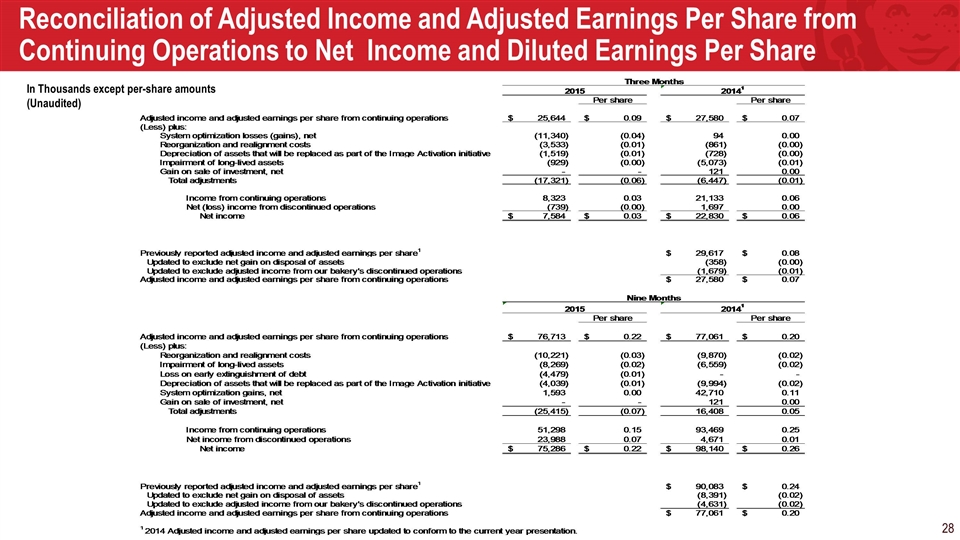
Reconciliation of Adjusted Income and Adjusted Earnings Per Share from Continuing Operations to Net Income and Diluted Earnings Per Share In Thousands except per-share amounts (Unaudited)
Serious News for Serious Traders! Try StreetInsider.com Premium Free!
You May Also Be Interested In
- Notice of AGM
- Flash News: OKX Wallet Now Supports Reading of Staked STONE
- Information relating to the total number of voting rights and shares making up the share capital at 26 April 2024 – post blocs acquisition by the Consortium
Create E-mail Alert Related Categories
SEC FilingsSign up for StreetInsider Free!
Receive full access to all new and archived articles, unlimited portfolio tracking, e-mail alerts, custom newswires and RSS feeds - and more!


 Tweet
Tweet Share
Share