

Form 8-K VISA INC. For: Jul 21
 Tweet
Tweet Share
ShareUNITED STATES
SECURITIES AND EXCHANGE COMMISSION
WASHINGTON, D.C. 20549
FORM 8-K
CURRENT REPORT
Pursuant to Section 13 or 15(d) of the Securities Exchange Act of 1934
Date of Report (Date of earliest event reported): July 21, 2016
VISA INC.
(Exact name of Registrant as Specified in Its Charter)
| Delaware | 001-33977 | 26-0267673 | ||
| (State or Other Jurisdiction of Incorporation) |
(Commission File Number) |
(IRS Employer Identification No.) |
| P.O. Box 8999 San Francisco, California |
94128-8999 | |
| (Address of Principal Executive Offices) | (Zip Code) |
Registrant’s Telephone Number, Including Area Code: (650) 432-3200
N/A
(Former Name or Former Address, if Changed Since Last Report)
Check the appropriate box below if the Form 8-K filing is intended to simultaneously satisfy the filing obligation of the registrant under any of the following provisions (see General Instructions A.2. below):
| ¨ | Written communications pursuant to Rule 425 under the Securities Act (17 CFR 230.425) |
| ¨ | Soliciting material pursuant to Rule 14a-12 under the Exchange Act (17 CFR 240.14a-12) |
| ¨ | Pre-commencement communications pursuant to Rule 14d-2(b) under the Exchange Act (17 CFR 240.14d-2(b)) |
| ¨ | Pre-commencement communications pursuant to Rule 13e-4(c) under the Exchange Act (17 CFR 240.13e-4(c)) |
Item 2.02 Results of Operations and Financial Condition.
On July 21, 2016, Visa Inc. (the “Company”) issued a press release announcing financial results for the Company’s fiscal third quarter, ended June 30, 2016.
A copy of the press release is attached hereto as Exhibit 99.1. All information in the press release is furnished but not filed.
On July 21, 2016, the Company will host a conference call to discuss financial results for its fiscal third quarter ended June 30, 2016.
A copy of the presentation to be used during the conference call is attached hereto as Exhibit 99.2. All information in the presentation is furnished but not filed.
| Item 9.01 | Financial Statements and Exhibits. |
| (d) | Exhibits |
| 99.1 | Press Release of Visa Inc., dated July 21, 2016 | |
| 99.2 | Presentation of Visa Inc., dated July 21, 2016 | |
SIGNATURES
Pursuant to the requirements of the Securities Exchange Act of 1934, the registrant has duly caused this report to be signed on its behalf by the undersigned hereunto duly authorized.
| VISA INC. | ||||||
| Date: July 21, 2016 |
By: | /s/ Vasant M. Prabhu | ||||
| Vasant M. Prabhu Chief Financial Officer | ||||||
EXHIBIT INDEX
| Exhibit Number |
Description | |
| 99.1 | Press Release of Visa Inc., dated July 21, 2016 | |
| 99.2 | Presentation of Visa Inc., dated July 21, 2016 |
Exhibit 99.1

Visa Inc. Reports Fiscal Third Quarter 2016 Results and Announces a New $5.0 Billion Share Repurchase Program
| • | GAAP quarterly net income of $412 million or $0.17 per share including special items related to the acquisition of Visa Europe |
| • | Adjusted quarterly net income of $1.6 billion or $0.69 per share excluding special items related to the acquisition of Visa Europe |
| • | The Company authorized a new $5.0 billion share repurchase program |
San Francisco, CA, July 21, 2016 – Visa Inc. (NYSE: V) today announced financial results for the Company’s fiscal third quarter 2016, ended June 30, 2016. GAAP net income for the quarter, inclusive of special items related to the acquisition of Visa Europe, was $412 million, a decrease of 76% over the prior year’s results, or $0.17 per share, a decrease of 75% nominally over the prior year’s results, primarily due to the impact of the Visa Europe-related special items noted below.
The Company did not include Visa Europe’s financial results from June 21, 2016 through June 30, 2016, nor the dilutive impact of the outstanding shares of series B and C convertible participating preferred stock in the calculation of basic or diluted earnings per share as the effects were immaterial. The Company’s unaudited consolidated balance sheets and statements of cash flow reflect preliminary balances related to the acquisition of Visa Europe as of June 30, 2016, pending final valuation. All references to earnings per share assume fully-diluted class A share count, excluding the preferred stock, unless otherwise noted.
During the fiscal third quarter of 2016, the Company recorded the following special items which are non-recurring and have no impact on operating performance:
| • | $1.9 billion Visa Europe Framework Agreement loss in operating expense related to the effective settlement of the Framework Agreement between Visa Inc. and Visa Europe upon consummation of the transaction; |
| • | $152 million in operating expense for acquisition-related costs including $60 million of transaction expenses recorded in professional fees and $92 million of U.K. stamp duty recorded in general and administrative expenses; |
1
| • | $145 million gain in other non-operating (expense) income related to euro-denominated bank balances associated with the upfront cash consideration for the acquisition of Visa Europe; and |
| • | $42 million loss in other non-operating (expense) income related to currency forward contracts entered into to mitigate a portion of the foreign currency exchange rate risk associated with the upfront cash consideration for the acquisition of Visa Europe. |
Excluding these special items, adjusted net income for the quarter was $1.6 billion, a decrease of 10% over the prior year’s adjusted results. Adjusted earnings per share was $0.69, a decrease of 7% nominally or 4% in constant dollars over the prior year’s adjusted results. The prior year’s adjusted results were positively impacted by a $280 million tax benefit.
Net operating revenue in the fiscal third quarter of 2016 was $3.6 billion, an increase of 3% nominally or 6% on a constant dollar basis over the prior year, driven by continued growth in processed transactions and nominal payments volume. Currency rate shifts versus the prior year negatively impacted reported net operating revenue growth by approximately 3 percentage points.
“We continue to be pleased with our performance as we delivered consistent and predictable results. While little has changed in the global economic environment, and cross-border commerce continues to be challenged by a strong U.S. dollar, domestic consumer spend across the globe remains strong and resilient,” said Charlie Scharf, Chief Executive Officer of Visa Inc. “Furthermore, we are delighted to have closed our purchase of Visa Europe and remain confident that operating as a unified global business will quickly bring meaningful value to our clients and the economies in Europe.“
“Reflective of our continued confidence in the business and our desire to offset dilution from the preferred stock issuance, we have repurchased $5.5 billion in common stock year-to-date and our board has increased our buyback authorization by $5.0 billion to $7.3 billion. This also delivers on our ongoing commitment to return excess cash to shareholders,” added Scharf.
“Looking ahead, we expect next quarter results to improve modestly, similar to first-half of the year results. As we look toward fiscal full-year 2017, our underlying business is strong, and with the lapping effect of several items, based on what we know today and assuming similar consumer spending patterns, we feel good about our ability to produce stronger revenue and earnings growth,” continued Scharf.
Fiscal Third Quarter 2016 Financial Highlights:
Payments volume growth, on a constant dollar basis, for the three months ended March 31, 2016 on which fiscal third quarter service revenue is recognized, was 12% over the prior year at $1.3 trillion.
Payments volume growth, on a constant dollar basis, for the three months ended June 30, 2016, was 10% over the prior year at $1.3 trillion.
Cross-border volume growth, on a constant dollar basis, was 5% for the three months ended June 30, 2016.
Total processed transactions, which represent transactions processed by VisaNet, for the three months ended June 30, 2016, were 19.8 billion, a 10% increase over the prior year.
2
Fiscal third quarter 2016 service revenues were $1.6 billion, an increase of 6% over the prior year, and are recognized based on payments volume in the prior quarter. All other revenue categories are recognized based on current quarter activity. Data processing revenues rose 10% over the prior year to $1.5 billion. International transaction revenues grew 4% over the prior year to $1.1 billion. Other revenues were $209 million, an increase of 5% over the prior year. Client incentives, which are a contra revenue item, were $839 million and represent 18.8% of gross revenues.
GAAP operating expenses were $3.2 billion, a 155% increase over the prior year, in the fiscal third quarter, including special items which are non-recurring. Adjusted operating expenses, which excludes special items, were $1.2 billion, a 7% decline over the prior year, primarily due to decreases in personnel and marketing expenses.
Summary Table of Adjustments to Earnings:
| Three Months Ended June 30, 2016 | ||||||||||||
| (in millions, except percentages) | Operating Expenses |
Operating Margin(1) |
Non- operating (Expense) Income |
|||||||||
| As reported |
$ | 3,202 | 12 | % | ($ | 6 | ) | |||||
| Acquisition-related costs |
(152 | ) | 4 | % | — | |||||||
| Visa Europe Framework Agreement loss |
(1,877 | ) | 52 | % | — | |||||||
| Net losses on currency forward contracts |
— | — | % | 42 | ||||||||
| Foreign exchange gain on euro deposits |
— | — | % | (145 | ) | |||||||
|
|
|
|
|
|
|
|||||||
| As adjusted |
$ | 1,173 | 68 | % | ($ | 109 | ) | |||||
| (1) | Figures in the table may not recalculate exactly due to rounding. Operating margin is calculated based on unrounded numbers. |
GAAP effective tax rate was 2.3% for the quarter ended June 30, 2016, including a one-time $693 million tax benefit related to the Visa Europe Framework Agreement loss. Excluding the tax impact from the special items, the adjusted effective income tax rate was 30.4% for the fiscal third quarter.
3
Summary Table of Adjustments to Effective Income Tax Rate:
| Three Months Ended June 30, 2016 | ||||||||||||
| Income Before Income Taxes |
Income Tax Provision |
Effective Income Tax Rate(1) |
||||||||||
| (in millions, except for percentages) | ||||||||||||
| As reported |
$ | 422 | $ | 10 | 2.3% | |||||||
| Acquisition-related costs |
152 | 56 | ||||||||||
| Visa Europe Framework Agreement loss |
1,877 | 693 | ||||||||||
| Net losses on currency forward contracts |
42 | 8 | ||||||||||
| Foreign exchange gain on euro deposits |
(145 | ) | (54 | ) | ||||||||
|
|
|
|
|
|
|
|||||||
| As adjusted |
$ | 2,348 | $ | 713 | 30.4% | |||||||
|
|
|
|
|
|
|
|||||||
| (1) | Figures in the table may not recalculate exactly due to rounding. Effective income tax rate figures are calculated based on unrounded numbers. |
Cash, cash equivalents, and available-for-sale investment securities were $12.4 billion at June 30, 2016.
The weighted-average number of diluted shares of class A common stock outstanding was 2.4 billion for the quarter ended June 30, 2016.
The Company’s adjusted quarterly net income and earnings per share are non-GAAP financial measures that are reconciled to their most directly comparable U.S. GAAP financial measures in the accompanying financial tables.
Notable Events:
On June 21, 2016, the Company acquired 100% of the share capital of Visa Europe. The acquisition positions Visa to create additional value through increased scale, efficiencies realized by the integration of both businesses, and benefits related to Visa Europe’s transition from an association to a for-profit enterprise. At the closing of the transaction, the Company:
| • | Paid up-front cash consideration of €12.2 billion ($13.9 billion); |
4
| • | Issued preferred stock of the Company convertible upon certain conditions into 78.7 million shares of class A common stock equivalent to a value of approximately €5.3 billion ($6.1 billion) at the closing stock price of $77.33 on June 21, 2016; and |
| • | Agreed to pay an additional €1.0 billion, plus 4% compound annual interest, on the third anniversary of the closing. |
During the three months ended June 30, 2016, the Company repurchased 21.7 million shares of class A common stock, at an average price of $77.53 per share, using $1.7 billion of cash on hand. Fiscal year to date through June 30, 2016, the Company repurchased a total of 71.6 million shares of class A common stock, at an average price of $76.09 per share, using $5.5 billion of cash on hand.
The board of directors has authorized a new $5.0 billion class A common stock share repurchase program. The Company currently has $7.3 billion of funds, authorized by the board of directors, available for share repurchase.
On July 19, 2016, the board of directors declared a quarterly cash dividend of $0.14 per share of class A common stock (determined in the case of class B and C common stock and series B and C convertible participating preferred stock on an as-converted basis) payable on September 6, 2016, to all holders of record of the Company’s common and preferred stock as of August 19, 2016.
Financial Outlook for Fiscal Full-Year 2016:
Visa Inc. updates its financial outlook for the following metrics for fiscal full-year 2016 to include Visa Europe. In addition, Visa Inc. provides the impact from Visa Europe on net revenue growth and earnings per share for the fiscal fourth quarter 2016:
| Financial Metric | U.S. GAAP | Adjusted* | ||||||
| Annual net revenue growth: | • | 7% to 8% range on a constant dollar basis (excluding Europe) | • | 7% to 8% range on a constant dollar basis (excluding Europe) | ||||
| • | About 3 ppts of negative foreign currency impact | • | About 3 ppts of negative foreign currency impact | |||||
| • | Incremental 3 to 4 ppts from Europe in fiscal full-year | • | Incremental 3 to 4 ppts from Europe in fiscal full-year | |||||
| • | Incremental 13 to 14 ppts from Europe in fiscal fourth quarter | • | Incremental 13 to 14 ppts from Europe in fiscal fourth quarter | |||||
| Client incentives as % of gross revenues: | • | Around 18.5% | • | Around 18.5% | ||||
| Annual operating margin: | • | Low-to-mid 50s | • | Mid 60s | ||||
| Effective tax rate: | • | Mid 20s | • | About 30% | ||||
| Annual diluted class A common stock earnings per share: | • | Negative low single-digit constant dollar EPS growth | • | Low double-digit constant dollar EPS growth | ||||
| • | About 4 ppts of negative foreign currency impact | • | About 4 ppts of negative foreign currency impact | |||||
| • | Europe net income offsets debt interest expense in fiscal fourth quarter | • | Europe net income offsets debt interest expense in fiscal fourth quarter | |||||
| Annual adjusted free cash flow: | • | About $7 billion | • | About $7 billion | ||||
| * | Adjusted outlook on annual operating margin, effective tax rate and annual diluted class A common stock earnings per share excludes the impact of previously recorded non-recurring special items related to our acquisition of Visa Europe, outlined in our Q3 Non-GAAP financial results. |
Fiscal Third Quarter 2016 Earnings Results Conference Call Details: Visa’s executive management team will host a live audio webcast beginning at 5:00 p.m. Eastern Time (2:00 p.m. Pacific Time) today to discuss the financial results and business highlights. All interested parties are invited to listen to the live webcast at http://investor.visa.com. A replay of the webcast will be available on the Visa Investor Relations website for 30 days. Investor information, including supplemental financial information, is available on Visa Inc.’s Investor Relations website at http://investor.visa.com.
5
About Visa Inc.
Visa Inc. (NYSE: V) is a global payments technology company that connects consumers, businesses, financial institutions, and governments in more than 200 countries and territories to fast, secure and reliable electronic payments. We operate one of the world’s most advanced processing networks — VisaNet — that is capable of handling more than 65,000 transaction messages a second, with fraud protection for consumers and assured payment for merchants. Visa is not a bank and does not issue cards, extend credit or set rates and fees for consumers. Visa’s innovations, however, enable its financial institution customers to offer consumers more choices: pay now with debit, pay ahead with prepaid or pay later with credit products. For more information, visit usa.visa.com/about-visa, visacorporate.tumblr.com and @VisaNews.
Forward-Looking Statements:
This Press Release contains forward-looking statements within the meaning of the U.S. Private Securities Litigation Reform Act of 1995. Forward-looking statements generally are identified by words such as “estimates,” “expectation,” “outlook”, “may,” “projects,” “could,” “should,” “will,” “will continue” and other similar expressions. Examples of forward-looking statements include, but are not limited to, statements we make about our revenue, client incentives, operating margin, tax rate, earnings per share, free cash flow, and the growth of those items.
By their nature, forward-looking statements: (i) speak only as of the date they are made; (ii) are not statements of historical fact or guarantees of future performance; and (iii) are subject to risks, uncertainties, assumptions or changes in circumstances that are difficult to predict or quantify. Therefore, actual results could differ materially and adversely from our forward-looking statements due to a variety of factors, including the following:
| • | the impact of laws, regulations and marketplace barriers, including: |
| • | increased regulation of fees, transaction routing, payment card practices or other aspects of the payments industry in the U.S., including new or revised regulations issued under the Dodd-Frank Wall Street Reform and Consumer Protection Act; |
| • | increased regulation in Europe and other jurisdictions outside of the U.S.; |
| • | increased government support of national payment networks outside the U.S.; and |
| • | increased regulation of consumer privacy, data use and security; |
| • | developments in litigation and government enforcement, including those affecting interchange reimbursement fees, antitrust and tax; |
| • | new lawsuits, investigations or proceedings, or changes to our potential exposure in connection with pending lawsuits, investigations or proceedings; |
| • | economic factors, such as: |
| • | uncertainty surrounding the Brexit, including the spillover to economic fragility in the Eurozone, the U.S. and in other advanced and emerging markets; |
| • | general economic, political and social conditions in mature and emerging markets globally; |
| • | general stock market fluctuations which may impact consumer spending; |
| • | material changes in cross-border activity, foreign exchange controls and fluctuations in currency exchange rates; and |
| • | material changes in our financial institution clients’ performance compared to our estimates; |
| • | industry developments, such as competitive pressure, rapid technological developments and disintermediation from our payments network; |
6
| • | system developments, such as: |
| • | disruption of our transaction processing systems or the inability to process transactions efficiently; |
| • | account data breaches or increased fraudulent or other illegal activities involving Visa-branded cards or payment products; and |
| • | failure to maintain systems interoperability with Visa Europe; |
| • | the loss of organizational effectiveness or key employees; |
| • | the failure to integrate acquisitions successfully, achieve the anticipated benefits of the acquisitions, or effectively develop new products and businesses; |
| • | natural disasters, terrorist attacks, military or political conflicts, and public health emergencies; and |
| • | various other factors, including those more fully described in our filings with the U.S. Securities and Exchange Commission, including our Annual Report on Form 10-K for the year ended September 30, 2015, and our subsequent reports on Forms 10-Q and 8-K. |
You should not place undue reliance on such statements. Except as required by law, we do not intend to update or revise any forward–looking statements as a result of new information, future developments or otherwise.
Contacts:
Investor Relations: Jack Carsky or Victoria Hyde-Dunn, 650-432-7644, [email protected]
Media Relations: Connie Kim, 212-521-3962, [email protected]
7
VISA INC.
CONSOLIDATED BALANCE SHEETS
(UNAUDITED)
| June 30, 2016 |
September 30, 2015 |
|||||||
| (in millions, except par value data) | ||||||||
| Assets |
||||||||
| Cash and cash equivalents |
$ | 5,887 | $ | 3,518 | ||||
| Restricted cash—litigation escrow |
1,027 | 1,072 | ||||||
| Investment securities: |
||||||||
| Trading |
69 | 66 | ||||||
| Available-for-sale |
2,796 | 2,431 | ||||||
| Settlement receivable |
1,499 | 408 | ||||||
| Accounts receivable |
1,066 | 847 | ||||||
| Customer collateral |
1,032 | 1,023 | ||||||
| Current portion of client incentives |
291 | 303 | ||||||
| Prepaid expenses and other current assets |
707 | 353 | ||||||
|
|
|
|
|
|||||
| Total current assets |
14,374 | 10,021 | ||||||
| Investment securities, available-for-sale |
3,762 | 3,384 | ||||||
| Client incentives |
537 | 110 | ||||||
| Property, equipment and technology, net |
2,136 | 1,888 | ||||||
| Other assets |
936 | 778 | ||||||
| Intangible assets, net |
27,078 | 11,361 | ||||||
| Goodwill |
15,044 | 11,825 | ||||||
|
|
|
|
|
|||||
| Total assets |
$ | 63,867 | $ | 39,367 | ||||
|
|
|
|
|
|||||
| Liabilities |
||||||||
| Accounts payable |
$ | 115 | $ | 127 | ||||
| Settlement payable |
1,999 | 780 | ||||||
| Customer collateral |
1,032 | 1,023 | ||||||
| Accrued compensation and benefits |
511 | 503 | ||||||
| Client incentives |
1,953 | 1,049 | ||||||
| Accrued liabilities |
1,195 | 849 | ||||||
| Accrued litigation |
978 | 1,024 | ||||||
|
|
|
|
|
|||||
| Total current liabilities |
7,783 | 5,355 | ||||||
| Long-term debt |
15,879 | — | ||||||
| Deferred tax liabilities |
4,977 | 3,273 | ||||||
| Deferred purchase consideration |
1,209 | — | ||||||
| Other liabilities |
1,192 | 897 | ||||||
|
|
|
|
|
|||||
| Total liabilities |
31,040 | 9,525 | ||||||
|
|
|
|
|
|||||
| Equity |
||||||||
| Preferred stock, $0.0001 par value, 25 shares authorized and 5 issued and outstanding as follows: |
||||||||
| Series A convertible participating preferred stock, none issued |
— | — | ||||||
| Series B convertible participating preferred stock, 2 shares issued and outstanding at June 30, 2016 |
2,516 | — | ||||||
| Series C convertible participating preferred stock, 3 shares issued and outstanding at June 30, 2016 |
3,201 | — | ||||||
| Class A common stock, $0.0001 par value, 2,001,622 shares authorized, 1,891 and 1,950 shares issued and outstanding at June 30, 2016 and September 30, 2015, respectively |
— | — | ||||||
| Class B common stock, $0.0001 par value, 622 shares authorized, 245 shares issued and outstanding at June 30, 2016 and September 30, 2015 |
— | — | ||||||
| Class C common stock, $0.0001 par value, 1,097 shares authorized, 17 and 20 shares issued and outstanding at June 30, 2016 and September 30, 2015, respectively |
— | — | ||||||
| Treasury stock |
(170 | ) | — | |||||
| Right to recover for covered losses |
(25 | ) | ||||||
| Additional paid-in capital |
17,514 | 18,073 | ||||||
| Accumulated income |
10,334 | 11,843 | ||||||
| Accumulated other comprehensive loss, net: |
||||||||
| Investment securities, available-for-sale |
30 | 5 | ||||||
| Defined benefit pension and other postretirement plans |
(126 | ) | (161 | ) | ||||
| Derivative instruments classified as cash flow hedges |
(42 | ) | 83 | |||||
| Foreign currency translation adjustments |
(405 | ) | (1 | ) | ||||
|
|
|
|
|
|||||
| Total accumulated other comprehensive loss, net |
(543 | ) | (74 | ) | ||||
|
|
|
|
|
|||||
| Total equity |
32,827 | 29,842 | ||||||
|
|
|
|
|
|||||
| Total liabilities and equity |
$ | 63,867 | $ | 39,367 | ||||
|
|
|
|
|
|||||
8
VISA INC.
CONSOLIDATED STATEMENT OF OPERATIONS
(UNAUDITED)
| Three Months Ended June 30, |
Nine Months Ended June 30, |
|||||||||||||||
| 2016(1) | 2015 | 2016(1) | 2015 | |||||||||||||
| (in millions, except per share data) | ||||||||||||||||
| Operating Revenues |
||||||||||||||||
| Service revenues |
$ | 1,635 | $ | 1,550 | $ | 4,979 | $ | 4,665 | ||||||||
| Data processing revenues |
1,541 | 1,400 | 4,493 | 4,123 | ||||||||||||
| International transaction revenues |
1,084 | 1,039 | 3,160 | 2,973 | ||||||||||||
| Other revenues |
209 | 199 | 605 | 607 | ||||||||||||
| Client incentives |
(839 | ) | (670 | ) | (2,416 | ) | (2,059 | ) | ||||||||
|
|
|
|
|
|
|
|
|
|||||||||
| Total operating revenues |
3,630 | 3,518 | 10,821 | 10,309 | ||||||||||||
|
|
|
|
|
|
|
|
|
|||||||||
| Operating Expenses |
||||||||||||||||
| Personnel |
509 | 566 | 1,536 | 1,558 | ||||||||||||
| Marketing |
189 | 224 | 569 | 619 | ||||||||||||
| Network and processing |
123 | 117 | 377 | 340 | ||||||||||||
| Professional fees |
138 | 82 | 276 | 229 | ||||||||||||
| Depreciation and amortization |
120 | 130 | 361 | 375 | ||||||||||||
| General and administrative |
246 | 137 | 566 | 404 | ||||||||||||
| Litigation provision |
— | — | 1 | 3 | ||||||||||||
| Visa Europe Framework Agreement loss |
1,877 | — | 1,877 | — | ||||||||||||
|
|
|
|
|
|
|
|
|
|||||||||
| Total operating expenses |
3,202 | 1,256 | 5,563 | 3,528 | ||||||||||||
|
|
|
|
|
|
|
|
|
|||||||||
| Operating income |
428 | 2,262 | 5,258 | 6,781 | ||||||||||||
|
|
|
|
|
|
|
|
|
|||||||||
| Non-operating (Expense) Income |
||||||||||||||||
| Interest expense |
(131 | ) | 8 | (292 | ) | (2 | ) | |||||||||
| Other |
125 | (102 | ) | 536 | (67 | ) | ||||||||||
|
|
|
|
|
|
|
|
|
|||||||||
| Total non-operating (expense) income |
(6 | ) | (94 | ) | 244 | (69 | ) | |||||||||
|
|
|
|
|
|
|
|
|
|||||||||
| Income before income taxes |
422 | 2,168 | 5,502 | 6,712 | ||||||||||||
| Income tax provision |
10 | 471 | 1,442 | 1,896 | ||||||||||||
|
|
|
|
|
|
|
|
|
|||||||||
| Net income |
$ | 412 | $ | 1,697 | $ | 4,060 | $ | 4,816 | ||||||||
|
|
|
|
|
|
|
|
|
|||||||||
| Basic earnings per share |
||||||||||||||||
| Class A common stock |
$ | 0.17 | $ | 0.69 | $ | 1.69 | $ | 1.96 | ||||||||
|
|
|
|
|
|
|
|
|
|||||||||
| Class B common stock |
$ | 0.29 | $ | 1.14 | $ | 2.79 | $ | 3.23 | ||||||||
|
|
|
|
|
|
|
|
|
|||||||||
| Class C common stock |
$ | 0.69 | $ | 2.78 | $ | 6.76 | $ | 7.84 | ||||||||
|
|
|
|
|
|
|
|
|
|||||||||
| Basic weighted-average shares outstanding |
||||||||||||||||
| Class A common stock |
1,899 | 1,955 | 1,915 | 1,964 | ||||||||||||
|
|
|
|
|
|
|
|
|
|||||||||
| Class B common stock |
245 | 245 | 245 | 245 | ||||||||||||
|
|
|
|
|
|
|
|
|
|||||||||
| Class C common stock |
18 | 20 | 19 | 21 | ||||||||||||
|
|
|
|
|
|
|
|
|
|||||||||
| Diluted earnings per share |
||||||||||||||||
| Class A common stock |
$ | 0.17 | $ | 0.69 | $ | 1.69 | $ | 1.96 | ||||||||
|
|
|
|
|
|
|
|
|
|||||||||
| Class B common stock |
$ | 0.28 | $ | 1.14 | $ | 2.78 | $ | 3.22 | ||||||||
|
|
|
|
|
|
|
|
|
|||||||||
| Class C common stock |
$ | 0.69 | $ | 2.77 | $ | 6.75 | $ | 7.82 | ||||||||
|
|
|
|
|
|
|
|
|
|||||||||
| Diluted weighted-average shares outstanding |
||||||||||||||||
| Class A common stock |
2,386 | 2,448 | 2,406 | 2,462 | ||||||||||||
|
|
|
|
|
|
|
|
|
|||||||||
| Class B common stock |
245 | 245 | 245 | 245 | ||||||||||||
|
|
|
|
|
|
|
|
|
|||||||||
| Class C common stock |
18 | 20 | 19 | 21 | ||||||||||||
|
|
|
|
|
|
|
|
|
|||||||||
| (1) | We did not include Visa Europe’s financial results in our unaudited consolidated statements of operations from the acquisition date, June 21, 2016, through June 30, 2016 as the impact is immaterial. The dilutive impact of the outstanding shares of series B and C convertible participating preferred stock from June 21, 2016 through June 30, 2016 was also not included in the calculation of basic or diluted earnings per share as the effect is immaterial. |
9
VISA INC.
CONSOLIDATED STATEMENTS OF CASH FLOWS
(UNAUDITED)
| Nine Months Ended June 30, | ||||||||
| 2016 | 2015 | |||||||
| (in millions, except noted otherwise) | ||||||||
| Operating Activities |
||||||||
| Net income |
$ | 4,060 | $ | 4,816 | ||||
| Adjustments to reconcile net income to net cash provided by operating activities: |
||||||||
| Client incentives |
2,416 | 2,059 | ||||||
| Fair value adjustment for the Visa Europe put option |
(255 | ) | 110 | |||||
| Share-based compensation |
152 | 139 | ||||||
| Excess tax benefit for share-based compensation |
(51 | ) | (78 | ) | ||||
| Depreciation and amortization of property, equipment, technology and intangible assets |
361 | 375 | ||||||
| Deferred income taxes |
(603 | ) | 196 | |||||
| Litigation provision |
1 | 3 | ||||||
| Other |
43 | 15 | ||||||
| Change in operating assets and liabilities: |
||||||||
| Settlement receivable |
332 | 82 | ||||||
| Accounts receivable |
(92 | ) | (64 | ) | ||||
| Client incentives |
(2,638 | ) | (2,093 | ) | ||||
| Other assets |
(552 | ) | (342 | ) | ||||
| Accounts payable |
(35 | ) | (52 | ) | ||||
| Settlement payable |
(368 | ) | (95 | ) | ||||
| Accrued and other liabilities |
398 | 141 | ||||||
| Accrued litigation |
(47 | ) | (362 | ) | ||||
|
|
|
|
|
|||||
| Net cash provided by operating activities |
3,122 | 4,850 | ||||||
|
|
|
|
|
|||||
| Investing Activities |
||||||||
| Purchases of property, equipment, technology and intangible assets |
(382 | ) | (276 | ) | ||||
| Proceeds from sales of property, equipment and technology |
— | 10 | ||||||
| Investment securities, available-for-sale: |
||||||||
| Purchases |
(26,883 | ) | (2,315 | ) | ||||
| Proceeds from maturities and sales |
26,193 | 1,410 | ||||||
| Acquisitions, net of $2.8 billion cash received from Visa Europe |
(9,082 | ) | (93 | ) | ||||
| Purchases of / contributions to other investments |
(9 | ) | (22 | ) | ||||
| Proceeds / distributions from other investments |
4 | 10 | ||||||
|
|
|
|
|
|||||
| Net cash used in investing activities |
(10,159 | ) | (1,276 | ) | ||||
|
|
|
|
|
|||||
| Financing Activities |
||||||||
| Repurchase of class A common stock |
(5,300 | ) | (2,910 | ) | ||||
| Treasury stock—class C common stock |
(170 | ) | — | |||||
| Dividends paid |
(1,011 | ) | (885 | ) | ||||
| Proceeds from issuance of senior notes |
15,971 | — | ||||||
| Debt issuance costs |
(98 | ) | — | |||||
| Payments from litigation escrow account—U.S. retrospective responsibility plan |
45 | 355 | ||||||
| Cash proceeds from issuance of common stock under employee equity plans |
69 | 68 | ||||||
| Restricted stock and performance-based shares settled in cash for taxes |
(89 | ) | (105 | ) | ||||
| Excess tax benefit for share-based compensation |
51 | 78 | ||||||
|
|
|
|
|
|||||
| Net cash provided by (used in) financing activities |
9,468 | (3,399 | ) | |||||
|
|
|
|
|
|||||
| Effect of exchange rate changes on cash and cash equivalents |
(62 | ) | 1 | |||||
|
|
|
|
|
|||||
| Increase in cash and cash equivalents |
2,369 | 176 | ||||||
| Cash and cash equivalents at beginning of year |
3,518 | 1,971 | ||||||
|
|
|
|
|
|||||
| Cash and cash equivalents at end of period |
$ | 5,887 | $ | 2,147 | ||||
|
|
|
|
|
|||||
| Supplemental Disclosure |
||||||||
| Series B and C convertible participating preferred stock issued in Visa Europe acquisition |
$ | 5,717 | $ | — | ||||
| Deferred purchase consideration recorded for Visa Europe acquisition |
$ | 1,236 | $ | — | ||||
| Income taxes paid, net of refunds |
$ | 2,043 | $ | 1,892 | ||||
| Interest payments on debt |
$ | 244 | $ | — | ||||
| Accruals related to purchases of property, equipment, technology and intangible assets |
$ | 29 | $ | 67 | ||||
10
VISA INC.
FISCAL 2016 AND 2015 QUARTERLY RESULTS OF OPERATIONS
(UNAUDITED)
| Fiscal 2016 Quarter Ended | Fiscal 2015 Quarter Ended | |||||||||||||||||||
| June 30, 2016(1) |
March 31, 2016 |
December 31, 2015 |
September 30, 2015 |
June 30, 2015 |
||||||||||||||||
| (in millions) | ||||||||||||||||||||
| Operating Revenues |
||||||||||||||||||||
| Service revenues |
$ | 1,635 | $ | 1,699 | $ | 1,645 | $ | 1,637 | $ | 1,550 | ||||||||||
| Data processing revenues |
1,541 | 1,473 | 1,479 | 1,429 | 1,400 | |||||||||||||||
| International transaction revenues |
1,084 | 1,045 | 1,031 | 1,091 | 1,039 | |||||||||||||||
| Other revenues |
209 | 198 | 198 | 216 | 199 | |||||||||||||||
| Client incentives |
(839 | ) | (789 | ) | (788 | ) | (802 | ) | (670 | ) | ||||||||||
|
|
|
|
|
|
|
|
|
|
|
|||||||||||
| Total operating revenues |
3,630 | 3,626 | 3,565 | 3,571 | 3,518 | |||||||||||||||
|
|
|
|
|
|
|
|
|
|
|
|||||||||||
| Operating Expenses |
||||||||||||||||||||
| Personnel |
509 | 528 | 499 | 521 | 566 | |||||||||||||||
| Marketing |
189 | 186 | 194 | 253 | 224 | |||||||||||||||
| Network and processing |
123 | 126 | 128 | 134 | 117 | |||||||||||||||
| Professional fees |
138 | 66 | 72 | 107 | 82 | |||||||||||||||
| Depreciation and amortization |
120 | 121 | 120 | 119 | 130 | |||||||||||||||
| General and administrative |
246 | 164 | 156 | 143 | 137 | |||||||||||||||
| Litigation provision |
— | 1 | — | 11 | — | |||||||||||||||
| Visa Europe Framework Agreement loss |
1,877 | — | — | — | — | |||||||||||||||
|
|
|
|
|
|
|
|
|
|
|
|||||||||||
| Total operating expenses |
3,202 | 1,192 | 1,169 | 1,288 | 1,256 | |||||||||||||||
|
|
|
|
|
|
|
|
|
|
|
|||||||||||
| Operating income |
428 | 2,434 | 2,396 | 2,283 | 2,262 | |||||||||||||||
|
|
|
|
|
|
|
|
|
|
|
|||||||||||
| Non-operating (Expense) Income |
||||||||||||||||||||
| Interest expense |
(131 | ) | (132 | ) | (29 | ) | — | 8 | ||||||||||||
| Other |
125 | 139 | 272 | — | (102 | ) | ||||||||||||||
|
|
|
|
|
|
|
|
|
|
|
|||||||||||
| Total non-operating (expense) income |
(6 | ) | 7 | 243 | — | (94 | ) | |||||||||||||
|
|
|
|
|
|
|
|
|
|
|
|||||||||||
| Income before income taxes |
422 | 2,441 | 2,639 | 2,283 | 2,168 | |||||||||||||||
| Income tax provision |
10 | 734 | 698 | 771 | 471 | |||||||||||||||
|
|
|
|
|
|
|
|
|
|
|
|||||||||||
| Net income |
$ | 412 | $ | 1,707 | $ | 1,941 | $ | 1,512 | $ | 1,697 | ||||||||||
|
|
|
|
|
|
|
|
|
|
|
|||||||||||
| (1) | We did not include Visa Europe’s financial results in our unaudited consolidated statements of operations from the acquisition date, June 21, 2016, through June 30, 2016 as the impact is immaterial. |
11
VISA INC.
RECONCILIATION OF NON-GAAP FINANCIAL RESULTS
(UNAUDITED)
Our financial results during the three and nine months ended June 30, 2016 reflect the impact of significant items that we do not believe are indicative of our operating performance, as they are either non-recurring or have no cash impact. As such, we believe the presentation of adjusted financial results excluding the following items, all of which are related to the acquisition of Visa Europe, provides a clearer understanding of our operating performance for the periods presented.
| • | Acquisition-related costs. During the three months ended June 30, 2016, we incurred $152 million of non-recurring acquisition costs in operating expense as a result of the Visa Europe transaction. This amount is comprised of $60 million of transcation expenses recorded in professional fees, and $92 million of U.K. stamp duty recorded in general and administrative expenses. Net of related tax benefit of $56 million, determined by applying applicable federal and state tax rates, the adjustment to net income was an increase of $96 million. |
| • | Visa Europe Framework Agreement loss. Upon consummation of the transaction, on June 21, 2016, we recorded a non-recurring loss of $1.9 billion, before tax, in operating expense resulting from the effective settlement of the Framework Agreement between Visa and Visa Europe. Net of related tax benefit of $693 million, determined by applying applicable federal and state tax rates, the adjustment to net income was an increase of $1.2 billion. |
| • | Net (losses) gains on currency forward contracts. During the second and third quarter of fiscal 2016, we entered into currency forward contracts to mitigate a portion of the foreign currency exchange rate risk associated with the upfront cash consideration paid in the Visa Europe acquisition. As a result, we recorded non-recurring, net losses of $42 million and net gains of $74 million, before tax, in other non-operating income for the three and nine months ended June 30, 2016, respectively. Net of related tax benefit of $8 million and tax expense of $27 million for the three and nine months ended June 30, 2016, respectively, determined by applying applicable federal and state tax rates, the adjustment to net income was an increase of $34 million and a decrease of $47 million, respectively. |
| • | Foreign exchange gain on euro deposits. During the three months ended June 30, 2016, we recorded a non-recurring foreign exchange gain of $145 million, before tax, in other non-operating income resulting from holding euro-denominated bank balances for a short period in advance of the closing date of the Visa Europe transaction. Net of related tax expense of $54 million, determined by applying applicable federal and state tax rates, the impact to net income was a decrease of $91 million. |
| • | Revaluation of Visa Europe put option. During the first quarter of fiscal 2016 and the third quarter of fiscal 2015, we recorded a decrease of $255 million and an increase of $110 million, respectively, in the fair value of the Visa Europe put option, resulting in the recognition of non-cash income and expense in other non-operating income. These amounts are not subject to income tax and therefore have no impact on the reported income tax provision. |
Adjusted operating expenses, operating margin, non-operating income, income before income taxes, income tax, effective income tax rate, net income, and diluted earnings per share are non-GAAP financial measures and should not be relied upon as substitutes for measures calculated in accordance with U.S. GAAP. The following tables reconcile the as-reported operating expenses, operating margin, non-operating income, income before income taxes, income taxes, effective income tax rate, net income and diluted earnings per share, which are calculated in accordance with U.S. GAAP, to the respective non-GAAP adjusted financial measures for the three and nine months ended June 30, 2016 and 2015:
| Three Months Ended June 30, 2016 | ||||||||||||||||||||||||||||||||
| (in millions, except percentages and per share data) |
Operating Expenses |
Operating Margin(1) |
Non- operating (Expense) Income |
Income Before Income Taxes |
Income Taxes | Effective Income Tax Rate(2) |
Net Income | Diluted Earnings Per Share(1) |
||||||||||||||||||||||||
| As reported |
$ | 3,202 | 12 | % | $ | (6 | ) | $ | 422 | $ | 10 | 2.3 | % | $ | 412 | $ | 0.17 | |||||||||||||||
| Acquisition-related costs |
(152 | ) | 4 | % | — | 152 | 56 | 96 | 0.04 | |||||||||||||||||||||||
| Visa Europe Framework Agreement loss |
(1,877 | ) | 52 | % | — | 1,877 | 693 | 1,184 | 0.50 | |||||||||||||||||||||||
| Net losses on currency forward contracts |
— | — | % | 42 | 42 | 8 | 34 | 0.01 | ||||||||||||||||||||||||
| Foreign exchange gain on euro deposits |
— | — | % | (145 | ) | (145 | ) | (54 | ) | (91 | ) | (0.04 | ) | |||||||||||||||||||
|
|
|
|
|
|
|
|
|
|
|
|
|
|
|
|
|
|||||||||||||||||
| As adjusted |
$ | 1,173 | 68 | % | $ | (109 | ) | 2,348 | $ | 713 | 30.4 | % | $ | 1,635 | $ | 0.69 | ||||||||||||||||
|
|
|
|
|
|
|
|
|
|
|
|
|
|
|
|
|
|||||||||||||||||
| Diluted weighted-average shares outstanding, as reported |
2,386 | |||||||||||||||||||||||||||||||
| Nine Months Ended June 30, 2016 | ||||||||||||||||||||||||||||||||
| (in millions, except percentages and per share data) |
Operating Expenses |
Operating Margin(1) |
Non- operating (Expense) Income |
Income Before Income Taxes |
Income Taxes | Effective Income Tax Rate(2) |
Net Income | Diluted Earnings Per Share(1) |
||||||||||||||||||||||||
| As reported |
$ | 5,563 | 49 | % | $ | 244 | $ | 5,502 | $ | 1,442 | 26.2 | % | $ | 4,060 | $ | 1.69 | ||||||||||||||||
| Acquisition-related costs |
(152 | ) | 1 | % | — | 152 | 56 | 96 | 0.04 | |||||||||||||||||||||||
| Visa Europe Framework Agreement loss |
(1,877 | ) | 17 | % | — | 1,877 | 693 | 1,184 | 0.49 | |||||||||||||||||||||||
| Net gains on currency forward contracts |
— | — | % | (74 | ) | (74 | ) | (27 | ) | (47 | ) | (0.02 | ) | |||||||||||||||||||
| Foreign exchange gain on euro deposits |
— | — | % | (145 | ) | (145 | ) | (54 | ) | (91 | ) | (0.04 | ) | |||||||||||||||||||
| Revaluation of Visa Europe put option |
— | — | % | (255 | ) | (255 | ) | — | (255 | ) | (0.11 | ) | ||||||||||||||||||||
|
|
|
|
|
|
|
|
|
|
|
|
|
|
|
|
|
|||||||||||||||||
| As adjusted |
$ | 3,534 | 67 | % | $ | (230 | ) | $ | 7,057 | $ | 2,110 | 29.9 | % | $ | 4,947 | $ | 2.06 | |||||||||||||||
|
|
|
|
|
|
|
|
|
|
|
|
|
|
|
|
|
|||||||||||||||||
| Diluted weighted-average shares outstanding, as reported |
2,406 | |||||||||||||||||||||||||||||||
| Three Months Ended June 30, 2015 |
Nine Months Ended June 30, 2015 |
|||||||||||||||||||||||
| (in millions, except per share data) | Non- operating (Expense) Income |
Net Income | Diluted Earnings per Share(1) |
Non- operating (Expense) Income |
Net Income | Diluted Earnings per Share(1) |
||||||||||||||||||
| As reported |
$ | (94 | ) | $ | 1,697 | $ | 0.69 | $ | (69 | ) | $ | 4,816 | $ | 1.96 | ||||||||||
| Revaluation of Visa Europe put option |
110 | 110 | 0.04 | 110 | 110 | 0.04 | ||||||||||||||||||
|
|
|
|
|
|
|
|
|
|
|
|
|
|||||||||||||
| As adjusted |
$ | 16 | $ | 1,807 | $ | 0.74 | $ | 41 | $ | 4,926 | $ | 2.00 | ||||||||||||
|
|
|
|
|
|
|
|
|
|
|
|
|
|||||||||||||
| Diluted weighted-average shares outstanding, as reported |
2,448 | 2,462 | ||||||||||||||||||||||
| (1) | Figures in the table may not recalculate exactly due to rounding. Operating margin, effective income tax rate and diluted earnings per share figures are calculated based on unrounded numbers. |
12

Operational Performance Data
The tables below provide information regarding the available operational results for the 3 months ended June 30, 2016, as well as the prior four quarterly reporting periods and the 12 months ended June 30, 2016 and 2015, for cards carrying the Visa, Visa Electron and Interlink brands. Sections 1-3 below do not reflect our acquisition of Visa Europe in June 2016. Europe volume is provided in Section 4 below.
1. Branded Volume and Transactions
The tables present regional total volume, payments volume, and cash volume, and the number of payments transactions, cash transactions, accounts and cards for cards carrying the Visa, Visa Electron and Interlink brands. Card counts include PLUS proprietary cards. Nominal and constant dollar growth rates over prior years are provided for volume-based data.
| For the 3 Months Ended June 30, 2016 | ||||||||||||||||||||||||||||||||||||||||||||||
| Total Volume ($ billions) |
Growth (Nominal USD) |
Growth (Constant USD) |
Payments Volume ($ billions) |
Growth (Nominal USD) |
Growth (Constant USD) |
Payments Transactions (millions) |
Cash Volume ($ billions) |
Growth (Nominal USD) |
Growth (Constant USD) |
Cash |
||||||||||||||||||||||||||||||||||||
| All Visa Credit & Debit |
||||||||||||||||||||||||||||||||||||||||||||||
| Asia Pacific |
$ | 531 | 4.2% | 7.3% | $ | 393 | 7.9% | 10.2% | 5,042 | $ | 138 | -5.0% | -0.4% | 1,013 | ||||||||||||||||||||||||||||||||
| Canada |
62 | 0.2% | 6.1% | 57 | 0.0% | 5.9% | 737 | 5 | 1.7% | 7.7% | 11 | |||||||||||||||||||||||||||||||||||
| CEMEA |
233 | -2.1% | 11.2% | 64 | 4.7% | 18.2% | 2,415 | 169 | -4.5% | 8.8% | 1,255 | |||||||||||||||||||||||||||||||||||
| LAC |
223 | -5.9% | 10.7% | 85 | -3.8% | 13.8% | 2,866 | 138 | -7.1% | 8.9% | 1,127 | |||||||||||||||||||||||||||||||||||
| US |
883 | 9.1% | 9.1% | 749 | 9.6% | 9.6% | 14,725 | 134 | 6.4% | 6.4% | 967 | |||||||||||||||||||||||||||||||||||
|
|
|
|
|
|
|
|
|
|
||||||||||||||||||||||||||||||||||||||
| Visa Inc. |
1,932 | 4.1% | 8.9% | 1,347 | 7.5% | 10.2% | 25,784 | 584 | -2.9% | 5.9% | 4,373 | |||||||||||||||||||||||||||||||||||
| Visa Credit Programs |
||||||||||||||||||||||||||||||||||||||||||||||
| US |
$ | 390 | 10.9% | 10.9% | $ | 376 | 10.9% | 10.9% | 4,655 | $ | 15 | 10.9% | 10.9% | 17 | ||||||||||||||||||||||||||||||||
| International |
512 | 4.4% | 9.7% | 476 | 4.9% | 9.7% | 6,621 | 36 | -2.3% | 8.5% | 159 | |||||||||||||||||||||||||||||||||||
|
|
|
|
|
|
|
|
|
|
||||||||||||||||||||||||||||||||||||||
| Visa Inc. |
902 | 7.1% | 10.2% | 851 | 7.5% | 10.2% | 11,276 | 51 | 1.2% | 9.2% | 176 | |||||||||||||||||||||||||||||||||||
| Visa Debit Programs |
||||||||||||||||||||||||||||||||||||||||||||||
| US |
$ | 493 | 7.7% | 7.7% | $ | 373 | 8.3% | 8.3% | 10,070 | $ | 120 | 5.9% | 5.9% | 950 | ||||||||||||||||||||||||||||||||
| International |
536 | -3.4% | 7.9% | 123 | 5.1% | 16.7% | 4,438 | 413 | -5.6% | 5.6% | 3,248 | |||||||||||||||||||||||||||||||||||
|
|
|
|
|
|
|
|
|
|
||||||||||||||||||||||||||||||||||||||
| Visa Inc. |
1,029 | 1.6% | 7.8% | 496 | 7.5% | 10.3% | 14,509 | 533 | -3.3% | 5.6% | 4,198 | |||||||||||||||||||||||||||||||||||
| For the 3 Months Ended March 31, 2016 | ||||||||||||||||||||||||||||||||||||||||||||||
| Total Volume ($ billions) |
Growth (Nominal USD) |
Growth (Constant USD) |
Payments Volume ($ billions) |
Growth (Nominal USD) |
Growth (Constant USD) |
Payments Transactions (millions) |
Cash Volume ($ billions) |
Growth (Nominal USD) |
Growth (Constant USD) |
Cash |
Accounts |
Cards (millions) | ||||||||||||||||||||||||||||||||||
| All Visa Credit & Debit |
||||||||||||||||||||||||||||||||||||||||||||||
| Asia Pacific |
$ | 511 | 3.2% | 8.9% | $ | 376 | 9.6% | 14.4% | 4,745 | $ | 135 | -11.1% | -3.8% | 1,017 | 753 | 856 | ||||||||||||||||||||||||||||||
| Canada |
51 | -5.1% | 5.0% | 46 | -5.3% | 4.7% | 659 | 5 | -2.4% | 8.0% | 11 | 47 | 54 | |||||||||||||||||||||||||||||||||
| CEMEA |
205 | -3.4% | 8.4% | 57 | 4.8% | 17.2% | 2,185 | 148 | -6.2% | 5.3% | 1,161 | 330 | 321 | |||||||||||||||||||||||||||||||||
| LAC |
204 | -16.2% | 9.0% | 79 | -15.3% | 14.7% | 2,799 | 124 | -16.7% | 5.7% | 1,076 | 417 | 451 | |||||||||||||||||||||||||||||||||
| US |
824 | 10.1% | 10.1% | 695 | 10.6% | 10.6% | 13,635 | 129 | 7.4% | 7.4% | 935 | 660 | 826 | |||||||||||||||||||||||||||||||||
|
|
|
|
|
|
|
|
|
|
|
| ||||||||||||||||||||||||||||||||||||
| Visa Inc. |
1,794 | 2.4% | 9.3% | 1,253 | 7.3% | 12.0% | 24,022 | 541 | -7.3% | 3.4% | 4,201 | 2,207 | 2,508 | |||||||||||||||||||||||||||||||||
| Visa Credit Programs |
||||||||||||||||||||||||||||||||||||||||||||||
| US |
$ | 349 | 10.5% | 10.5% | $ | 335 | 10.6% | 10.6% | 4,068 | $ | 14 | 8.8% | 8.8% | 16 | 255 | 333 | ||||||||||||||||||||||||||||||
| International |
475 | 2.5% | 11.9% | 445 | 3.8% | 13.1% | 6,263 | 30 | -14.0% | -2.9% | 157 | 506 | 566 | |||||||||||||||||||||||||||||||||
|
|
|
|
|
|
|
|
|
|
|
| ||||||||||||||||||||||||||||||||||||
| Visa Inc. |
824 | 5.8% | 11.3% | 780 | 6.6% | 12.0% | 10,331 | 44 | -7.7% | 0.6% | 173 | 761 | 899 | |||||||||||||||||||||||||||||||||
| Visa Debit Programs |
||||||||||||||||||||||||||||||||||||||||||||||
| US |
$ | 475 | 9.8% | 9.8% | $ | 360 | 10.7% | 10.7% | 9,566 | $ | 115 | 7.2% | 7.2% | 919 | 405 | 493 | ||||||||||||||||||||||||||||||
| International |
495 | -8.3% | 5.6% | 113 | 1.8% | 16.9% | 4,125 | 382 | -10.9% | 2.7% | 3,109 | 1,040 | 1,116 | |||||||||||||||||||||||||||||||||
|
|
|
|
|
|
|
|
|
|
|
| ||||||||||||||||||||||||||||||||||||
| Visa Inc. |
970 | -0.2% | 7.6% | 473 | 8.4% | 12.1% | 13,691 | 497 | -7.3% | 3.7% | 4,028 | 1,446 | 1,609 | |||||||||||||||||||||||||||||||||
Operational Performance Data
| For the 3 Months Ended December 31, 2015 | ||||||||||||||||||||||||||||||||||||||||||||||||||||
| Total Volume ($ billions) |
Growth (Nominal USD) |
Growth (Constant USD) |
Payments Volume ($ billions) |
Growth (Nominal USD) |
Growth (Constant USD) |
Payments Transactions (millions) |
Cash Volume ($ billions) |
Growth (Nominal USD) |
Growth (Constant USD) |
Cash Transactions (millions) |
Accounts (millions) |
Cards (millions) |
||||||||||||||||||||||||||||||||||||||||
| All Visa Credit & Debit |
||||||||||||||||||||||||||||||||||||||||||||||||||||
| Asia Pacific |
$ | 524 | 2.5% | 10.4% | $ | 387 | 7.8% | 15.6% | 4,900 | $ | 137 | -10.0% | -2.1% | 1,003 | 745 | 840 | ||||||||||||||||||||||||||||||||||||
| Canada |
59 | -10.7% | 5.2% | 55 | -10.9% | 4.9% | 723 | 4 | -8.3% | 8.0% | 11 | 47 | 54 | |||||||||||||||||||||||||||||||||||||||
| CEMEA |
228 | -13.5% | 6.1% | 60 | -6.8% | 12.6% | 2,099 | 168 | -15.7% | 4.0% | 1,236 | 336 | 326 | |||||||||||||||||||||||||||||||||||||||
| LAC |
237 | -17.0% | 10.2% | 90 | -17.5% | 14.0% | 2,918 | 147 | -16.7% | 8.0% | 1,174 | 416 | 451 | |||||||||||||||||||||||||||||||||||||||
| US |
842 | 9.1% | 9.1% | 714 | 9.7% | 9.7% | 13,975 | 128 | 5.8% | 5.8% | 936 | 648 | 820 | |||||||||||||||||||||||||||||||||||||||
|
|
|
|
|
|
|
|
|
|
|
|
|
|
|
|||||||||||||||||||||||||||||||||||||||
| Visa Inc. |
1,890 | -0.4% | 9.1% | 1,306 | 4.9% | 11.6% | 24,615 | 584 | -10.6% | 3.9% | 4,360 | 2,192 | 2,490 | |||||||||||||||||||||||||||||||||||||||
| Visa Credit Programs |
||||||||||||||||||||||||||||||||||||||||||||||||||||
| US |
$ | 372 | 9.1% | 9.1% | $ | 358 | 9.2% | 9.2% | 4,393 | $ | 14 | 8.0% | 8.0% | 17 | 255 | 336 | ||||||||||||||||||||||||||||||||||||
| International |
505 | -1.2% | 12.3% | 470 | 0.7% | 13.7% | 6,506 | 34 | -20.8% | -4.0% | 164 | 508 | 561 | |||||||||||||||||||||||||||||||||||||||
|
|
|
|
|
|
|
|
|
|
|
|
|
|
|
|||||||||||||||||||||||||||||||||||||||
| Visa Inc. |
876 | 3.0% | 10.9% | 828 | 4.2% | 11.7% | 10,900 | 48 | -14.0% | -0.8% | 181 | 763 | 896 | |||||||||||||||||||||||||||||||||||||||
| Visa Debit Programs |
||||||||||||||||||||||||||||||||||||||||||||||||||||
| US |
$ | 470 | 9.0% | 9.0% | $ | 356 | 10.1% | 10.1% | 9,582 | $ | 114 | 5.6% | 5.6% | 919 | 392 | 484 | ||||||||||||||||||||||||||||||||||||
| International |
543 | -11.8% | 6.3% | 121 | -4.1% | 15.2% | 4,134 | 422 | -13.7% | 4.0% | 3,260 | 1,036 | 1,110 | |||||||||||||||||||||||||||||||||||||||
|
|
|
|
|
|
|
|
|
|
|
|
|
|
|
|||||||||||||||||||||||||||||||||||||||
| Visa Inc. |
1,013 | -3.2% | 7.5% | 478 | 6.2% | 11.4% | 13,715 | 536 | -10.3% | 4.3% | 4,179 | 1,429 | 1,594 | |||||||||||||||||||||||||||||||||||||||
| For the 3 Months Ended September 30, 2015 | ||||||||||||||||||||||||||||||||||||||||||||||||||||
| Total Volume ($ billions) |
Growth (Nominal USD) |
Growth (Constant USD) |
Payments Volume ($ billions) |
Growth (Nominal USD) |
Growth (Constant USD) |
Payments Transactions (millions) |
Cash Volume ($ billions) |
Growth (Nominal USD) |
Growth (Constant USD) |
Cash Transactions (millions) |
Accounts (millions) |
Cards (millions) |
||||||||||||||||||||||||||||||||||||||||
| All Visa Credit & Debit |
||||||||||||||||||||||||||||||||||||||||||||||||||||
| Asia Pacific |
$ | 510 | 0.7% | 11.0% | $ | 372 | 5.5% | 16.4% | 4,670 | $ | 138 | -10.3% | -1.2% | 1,029 | 738 | 835 | ||||||||||||||||||||||||||||||||||||
| Canada |
58 | -12.0% | 5.2% | 54 | -12.1% | 5.1% | 698 | 5 | -11.3% | 6.0% | 12 | 43 | 50 | |||||||||||||||||||||||||||||||||||||||
| CEMEA |
232 | -17.1% | 9.1% | 61 | -9.8% | 16.9% | 1,915 | 171 | -19.4% | 6.6% | 1,195 | 333 | 321 | |||||||||||||||||||||||||||||||||||||||
| LAC |
227 | -17.5% | 10.8% | 85 | -18.1% | 13.5% | 2,706 | 142 | -17.2% | 9.3% | 1,093 | 415 | 450 | |||||||||||||||||||||||||||||||||||||||
| US |
822 | 8.7% | 8.7% | 693 | 9.7% | 9.7% | 13,656 | 129 | 3.9% | 3.9% | 958 | 630 | 802 | |||||||||||||||||||||||||||||||||||||||
|
|
|
|
|
|
|
|
|
|
|
|
|
|
|
|||||||||||||||||||||||||||||||||||||||
| Visa Inc. |
1,849 | -1.8% | 9.5% | 1,265 | 3.9% | 12.0% | 23,644 | 584 | -12.3% | 4.7% | 4,286 | 2,159 | 2,458 | |||||||||||||||||||||||||||||||||||||||
| Visa Credit Programs |
||||||||||||||||||||||||||||||||||||||||||||||||||||
| US |
$ | 359 | 9.8% | 9.8% | $ | 345 | 10.1% | 10.1% | 4,221 | $ | 14 | 2.8% | 2.8% | 17 | 250 | 329 | ||||||||||||||||||||||||||||||||||||
| International |
491 | -2.8% | 14.0% | 456 | -0.4% | 15.5% | 6,214 | 35 | -25.6% | -2.7% | 164 | 499 | 558 | |||||||||||||||||||||||||||||||||||||||
|
|
|
|
|
|
|
|
|
|
|
|
|
|
|
|||||||||||||||||||||||||||||||||||||||
| Visa Inc. |
850 | 2.2% | 12.2% | 800 | 3.9% | 13.1% | 10,435 | 50 | -19.1% | -1.2% | 181 | 749 | 887 | |||||||||||||||||||||||||||||||||||||||
| Visa Debit Programs |
||||||||||||||||||||||||||||||||||||||||||||||||||||
| US |
$ | 463 | 7.9% | 7.9% | $ | 349 | 9.2% | 9.2% | 9,435 | $ | 114 | 4.1% | 4.1% | 941 | 380 | 473 | ||||||||||||||||||||||||||||||||||||
| International |
536 | -13.9% | 7.0% | 116 | -9.0% | 12.5% | 3,774 | 420 | -15.1% | 5.6% | 3,165 | 1,030 | 1,099 | |||||||||||||||||||||||||||||||||||||||
|
|
|
|
|
|
|
|
|
|
|
|
|
|
|
|||||||||||||||||||||||||||||||||||||||
| Visa Inc. |
999 | -5.0% | 7.4% | 464 | 4.0% | 10.0% | 13,209 | 535 | -11.6% | 5.3% | 4,105 | 1,410 | 1,572 | |||||||||||||||||||||||||||||||||||||||
Operational Performance Data
| For the 3 Months Ended June 30, 2015 | ||||||||||||||||||||||||||||||||||||||||||||||||||||
| Total Volume ($ billions) |
Growth (Nominal USD) |
Growth (Constant USD) |
Payments Volume ($ billions) |
Growth (Nominal USD) |
Growth (Constant USD) |
Payments Transactions (millions) |
Cash Volume ($ billions) |
Growth (Nominal USD) |
Growth (Constant USD) |
Cash Transactions (millions) |
Accounts (millions) |
Cards (millions) |
||||||||||||||||||||||||||||||||||||||||
| All Visa Credit & Debit |
||||||||||||||||||||||||||||||||||||||||||||||||||||
| Asia Pacific |
$ | 510 | 4.3% | 10.8% | $ | 364 | 7.9% | 15.0% | 4,394 | $ | 145 | -3.7% | 1.1% | 1,003 | 725 | 822 | ||||||||||||||||||||||||||||||||||||
| Canada |
62 | -4.9% | 6.1% | 57 | -5.1% | 5.9% | 680 | 5 | -2.4% | 8.9% | 12 | 42 | 49 | |||||||||||||||||||||||||||||||||||||||
| CEMEA |
238 | -13.8% | 7.8% | 61 | -5.9% | 15.5% | 1,784 | 177 | -16.2% | 5.4% | 1,195 | 332 | 321 | |||||||||||||||||||||||||||||||||||||||
| LAC |
237 | -10.8% | 10.8% | 89 | -11.9% | 11.7% | 2,598 | 148 | -10.1% | 10.3% | 1,071 | 415 | 447 | |||||||||||||||||||||||||||||||||||||||
| US |
810 | 8.0% | 8.0% | 683 | 8.8% | 8.8% | 13,267 | 126 | 3.8% | 3.8% | 951 | 628 | 798 | |||||||||||||||||||||||||||||||||||||||
|
|
|
|
|
|
|
|
|
|
|
|
|
|
|
|||||||||||||||||||||||||||||||||||||||
| Visa Inc. |
1,855 | 0.6% | 9.0% | 1,254 | 5.3% | 10.9% | 22,723 | 602 | -8.0% | 5.0% | 4,231 | 2,141 | 2,438 | |||||||||||||||||||||||||||||||||||||||
| Visa Credit Programs |
||||||||||||||||||||||||||||||||||||||||||||||||||||
| US |
$ | 352 | 11.3% | 11.3% | $ | 339 | 11.7% | 11.7% | 4,075 | $ | 13 | 3.5% | 3.5% | 16 | 246 | 323 | ||||||||||||||||||||||||||||||||||||
| International |
491 | 0.6% | 12.8% | 453 | 3.0% | 14.3% | 5,917 | 37 | -21.6% | -3.5% | 160 | 496 | 554 | |||||||||||||||||||||||||||||||||||||||
|
|
|
|
|
|
|
|
|
|
|
|
|
|
|
|||||||||||||||||||||||||||||||||||||||
| Visa Inc. |
843 | 4.8% | 12.2% | 792 | 6.6% | 13.1% | 9,992 | 51 | -16.2% | -1.6% | 176 | 742 | 877 | |||||||||||||||||||||||||||||||||||||||
| Visa Debit Programs |
||||||||||||||||||||||||||||||||||||||||||||||||||||
| US |
$ | 458 | 5.6% | 5.6% | $ | 344 | 6.2% | 6.2% | 9,192 | $ | 113 | 3.8% | 3.8% | 935 | 382 | 476 | ||||||||||||||||||||||||||||||||||||
| International |
555 | -8.5% | 7.2% | 117 | -4.5% | 11.0% | 3,539 | 438 | -9.6% | 6.2% | 3,120 | 1,017 | 1,085 | |||||||||||||||||||||||||||||||||||||||
|
|
|
|
|
|
|
|
|
|
|
|
|
|
|
|||||||||||||||||||||||||||||||||||||||
| Visa Inc. |
1,013 | -2.7% | 6.4% | 462 | 3.2% | 7.3% | 12,731 | 551 | -7.1% | 5.7% | 4,055 | 1,399 | 1,561 | |||||||||||||||||||||||||||||||||||||||
Operational Performance Data
| For the 12 Months Ended June 30, 2016 | ||||||||||||||||||||||||||||||||||||||||||||||||
| Total Volume ($ billions) |
Growth (Nominal USD) |
Growth (Constant USD) |
Payments Volume ($ billions) |
Growth (Nominal USD) |
Growth (Constant USD) |
Payments Transactions (millions) |
Cash Volume ($ billions) |
Growth (Nominal USD) |
Growth (Constant USD) |
Cash |
||||||||||||||||||||||||||||||||||||||
| All Visa Credit & Debit |
||||||||||||||||||||||||||||||||||||||||||||||||
| Asia Pacific |
$ | 2,075 | 2.7% | 9.4% | $ | 1,528 | 7.7% | 14.1% | 19,357 | $ | 548 | -9.1% | -1.9% | 4,062 | ||||||||||||||||||||||||||||||||||
| Canada |
230 | -7.1% | 5.4% | 212 | -7.3% | 5.2% | 2,816 | 19 | -5.2% | 7.4% | 46 | |||||||||||||||||||||||||||||||||||||
| CEMEA |
897 | -9.6% | 8.7% | 241 | -2.3% | 16.2% | 8,614 | 656 | -12.1% | 6.2% | 4,848 | |||||||||||||||||||||||||||||||||||||
| LAC |
891 | -14.4% | 10.2% | 339 | -14.1% | 14.0% | 11,288 | 551 | -14.6% | 8.0% | 4,470 | |||||||||||||||||||||||||||||||||||||
| US |
3,371 | 9.2% | 9.2% | 2,850 | 9.9% | 9.9% | 55,991 | 520 | 5.9% | 5.9% | 3,795 | |||||||||||||||||||||||||||||||||||||
|
|
|
|
|
|
|
|
|
|
||||||||||||||||||||||||||||||||||||||||
| Visa Inc. |
7,464 | 1.0% | 9.2% | 5,170 | 5.9% | 11.4% | 98,066 | 2,294 | -8.4% | 4.5% | 17,220 | |||||||||||||||||||||||||||||||||||||
| Visa Credit Programs |
||||||||||||||||||||||||||||||||||||||||||||||||
| US |
$ | 1,470 | 10.1% | 10.1% | $ | 1,412 | 10.2% | 10.2% | 17,337 | $ | 58 | 7.6% | 7.6% | 67 | ||||||||||||||||||||||||||||||||||
| International |
1,983 | 0.7% | 11.9% | 1,847 | 2.2% | 12.9% | 25,604 | 136 | -16.5% | -0.4% | 643 | |||||||||||||||||||||||||||||||||||||
|
|
|
|
|
|
|
|
|
|
||||||||||||||||||||||||||||||||||||||||
| Visa Inc. |
3,453 | 4.5% | 11.1% | 3,259 | 5.5% | 11.7% | 42,941 | 193 | -10.5% | 1.9% | 710 | |||||||||||||||||||||||||||||||||||||
| Visa Debit Programs |
||||||||||||||||||||||||||||||||||||||||||||||||
| US |
$ | 1,901 | 8.6% | 8.6% | $ | 1,438 | 9.5% | 9.5% | 38,653 | $ | 463 | 5.7% | 5.7% | 3,728 | ||||||||||||||||||||||||||||||||||
| International |
2,111 | -9.5% | 6.7% | 473 | -1.8% | 15.3% | 16,471 | 1,638 | -11.5% | 4.5% | 12,782 | |||||||||||||||||||||||||||||||||||||
|
|
|
|
|
|
|
|
|
|
||||||||||||||||||||||||||||||||||||||||
| Visa Inc. |
4,012 | -1.8% | 7.6% | 1,911 | 6.5% | 10.9% | 55,125 | 2,101 | -8.2% | 4.7% | 16,510 | |||||||||||||||||||||||||||||||||||||
| For the 12 Months Ended June 30, 2015 | ||||||||||||||||||||||||||||||||||||||||||||||||
| Total Volume ($ billions) |
Growth (Nominal USD) |
Growth (Constant USD) |
Payments Volume ($ billions) |
Growth (Nominal USD) |
Growth (Constant USD) |
Payments Transactions (millions) |
Cash Volume ($ billions) |
Growth (Nominal USD) |
Growth (Constant USD) |
Cash |
Accounts |
Cards (millions) |
||||||||||||||||||||||||||||||||||||
| All Visa Credit & Debit |
||||||||||||||||||||||||||||||||||||||||||||||||
| Asia Pacific |
$ | 2,021 | 4.9% | 9.1% | $ | 1,419 | 7.6% | 12.4% | 16,673 | $ | 603 | -0.8% | 2.0% | 3,922 | 725 | 822 | ||||||||||||||||||||||||||||||||
| Canada |
248 | -1.9% | 7.3% | 228 | -2.1% | 7.1% | 2,603 | 20 | 0.4% | 9.9% | 47 | 42 | 49 | |||||||||||||||||||||||||||||||||||
| CEMEA |
992 | -8.1% | 12.5% | 247 | 1.4% | 21.4% | 6,501 | 746 | -10.8% | 9.8% | 4,692 | 332 | 321 | |||||||||||||||||||||||||||||||||||
| LAC |
1,041 | -1.8% | 12.1% | 395 | -1.5% | 12.9% | 10,291 | 646 | -2.0% | 11.6% | 4,299 | 415 | 447 | |||||||||||||||||||||||||||||||||||
| US |
3,086 | 8.7% | 8.7% | 2,594 | 9.5% | 9.5% | 50,382 | 491 | 4.8% | 4.8% | 3,707 | 628 | 798 | |||||||||||||||||||||||||||||||||||
|
|
|
|
|
|
|
|
|
|
|
|
|
|||||||||||||||||||||||||||||||||||||
| Visa Inc. |
7,389 | 3.2% | 9.6% | 4,883 | 7.0% | 10.9% | 86,451 | 2,505 | -3.3% | 7.0% | 16,666 | 2,141 | 2,438 | |||||||||||||||||||||||||||||||||||
| Visa Credit Programs |
||||||||||||||||||||||||||||||||||||||||||||||||
| US |
$ | 1,335 | 12.5% | 12.5% | $ | 1,282 | 12.6% | 12.6% | 15,388 | $ | 54 | 9.1% | 9.1% | 65 | 246 | 323 | ||||||||||||||||||||||||||||||||
| International |
1,969 | 2.5% | 11.2% | 1,807 | 4.7% | 12.4% | 22,768 | 162 | -17.3% | -2.1% | 663 | 496 | 554 | |||||||||||||||||||||||||||||||||||
|
|
|
|
|
|
|
|
|
|
|
|
|
|||||||||||||||||||||||||||||||||||||
| Visa Inc. |
3,305 | 6.3% | 11.7% | 3,089 | 7.8% | 12.5% | 38,157 | 216 | -12.0% | 0.8% | 727 | 742 | 877 | |||||||||||||||||||||||||||||||||||
| Visa Debit Programs |
||||||||||||||||||||||||||||||||||||||||||||||||
| US |
$ | 1,751 | 6.0% | 6.0% | $ | 1,313 | 6.6% | 6.6% | 34,994 | $ | 438 | 4.3% | 4.3% | 3,642 | 382 | 476 | ||||||||||||||||||||||||||||||||
| International |
2,333 | -2.6% | 9.7% | 482 | 2.4% | 14.2% | 13,301 | 1,852 | -3.9% | 8.5% | 12,297 | 1,017 | 1,085 | |||||||||||||||||||||||||||||||||||
|
|
|
|
|
|
|
|
|
|
|
|
|
|||||||||||||||||||||||||||||||||||||
| Visa Inc. |
4,084 | 0.9% | 7.9% | 1,795 | 5.5% | 8.3% | 48,294 | 2,289 | -2.4% | 7.6% | 15,939 | 1,399 | 1,561 | |||||||||||||||||||||||||||||||||||
Operational Performance Data
2. Cross-Border Volume
The table below represents cross-border volume growth for cards carrying the Visa, Visa Electron, Interlink and PLUS brands. Cross-border volume refers to payments and cash volume where the issuing country is different from the merchant country.
| Period |
Growth (Nominal USD) |
Growth (Constant USD) |
||||||
| 3 Months Ended |
||||||||
| Jun 30, 2016 |
2 | % | 5 | % | ||||
| Mar 31, 2016 |
0 | % | 5 | % | ||||
| Dec 31, 2015 |
-4 | % | 4 | % | ||||
| Sep 30, 2015 |
-4 | % | 5 | % | ||||
| Jun 30, 2015 |
0 | % | 8 | % | ||||
| 12 Months Ended |
||||||||
| Jun 30, 2016 |
-1 | % | 5 | % | ||||
| Jun 30, 2015 |
4 | % | 9 | % | ||||
3. Visa Processed Transactions
The table below represents transactions involving Visa, Visa Electron, Interlink and PLUS cards processed on Visa’s networks.
| Period |
Processed Transactions (millions) |
Growth | ||||||
| 3 Months Ended |
||||||||
| Jun 30, 2016 |
19,778 | 10 | % | |||||
| Mar 31, 2016 |
18,475 | 9 | % | |||||
| Dec 31, 2015 |
18,986 | 8 | % | |||||
| Sep 30, 2015 |
18,365 | 8 | % | |||||
| Jun 30, 2015 |
18,024 | 8 | % | |||||
| 12 Months Ended |
||||||||
| Jun 30, 2016 |
75,603 | 9 | % | |||||
| Jun 30, 2015 |
69,595 | 10 | % | |||||
Operational Performance Data
4. Europe Branded Volume and Transactions – Supplement
The table below reflects Europe total volume, payments volume and cash volume, and the number of payments transactions, cash transactions, accounts and cards for cards carrying the Visa and Visa Electron brands. Card counts include PLUS proprietary cards. Nominal and constant dollar growth rates over prior years are provided for volume-based data. Results may not agree with previously published Visa Europe figures due to different exchange rates used for currency conversions.
Note: This is a one-time disclosure to provide Europe operational performance metrics. In subsequent quarters, Europe volume on a going forward basis will be incorporated into Sections 1-3 above.
| For the 3 Months Ended | ||||||||||||||||||||||||||||||||||||||||||||||||
| Total Volume ($ billions) |
Growth (Nominal USD) |
Growth (Constant USD) |
Payments Volume ($ billions) |
Growth (Nominal USD) |
Growth (Constant USD) |
Payments Transactions (millions) |
Cash Volume ($ billions) |
Growth (Nominal USD) |
Growth (Constant USD) |
Cash |
Accounts |
Cards (millions) |
||||||||||||||||||||||||||||||||||||
| June 30, 2016 | $ | 656 | 2.1% | 5.9% | $ | 475 | 2.5% | 6.6% | 9,229 | $ | 181 | 0.9% | 4.1% | 1,442 | ||||||||||||||||||||||||||||||||||
| March 31, 2016 | $ | 606 | 1.5% | 5.2% | $ | 448 | 3.3% | 6.9% | 8,660 | $ | 158 | -3.2% | 0.6% | 1,301 | 470 | 529 | ||||||||||||||||||||||||||||||||
| December 31, 2015 | $ | 656 | -4.6% | 6.3% | $ | 478 | -2.3% | 8.1% | 9,149 | $ | 178 | -10.3% | 1.8% | 1,437 | 462 | 527 | ||||||||||||||||||||||||||||||||
| September 30, 2015 | $ | 657 | -8.5% | 5.6% | $ | 474 | -6.3% | 7.4% | 8,675 | $ | 183 | -13.7% | 1.2% | 1,462 | 447 | 524 | ||||||||||||||||||||||||||||||||
| June 30, 2015 | $ | 642 | -9.7% | 6.0% | $ | 463 | -7.6% | 7.8% | 8,340 | $ | 179 | -14.8% | 1.7% | 1,456 | 446 | 518 | ||||||||||||||||||||||||||||||||
|
For the 12 Months Ended |
||||||||||||||||||||||||||||||||||||||||||||||||
| Total Volume ($ billions) |
Growth (Nominal USD) |
Growth (Constant USD) |
Payments Volume ($ billions) |
Growth (Nominal USD) |
Growth (Constant USD) |
Payments Transactions (millions) |
Cash Volume ($ billions) |
Growth (Nominal USD) |
Growth (Constant USD) |
Cash |
||||||||||||||||||||||||||||||||||||||
| June 30, 2016 | $ | 2,575 | -2.7% | 5.8% | $ | 1,875 | -0.9% | 7.3% | 35,713 | $ | 700 | -7.1% | 2.0% | 5,642 | ||||||||||||||||||||||||||||||||||
Operational Performance Data
Footnote
Payments volume represents the aggregate dollar amount of purchases made with cards carrying the Visa, Visa Electron and Interlink brands for the relevant period; and cash volume represents the aggregate dollar amount of cash disbursements obtained with these cards for the relevant period and includes the impact of balance transfers and convenience checks; but excludes proprietary PLUS volume. Total volume represents payments volume plus cash volume.
Visa payment products are comprised of credit and debit programs, and data relating to each program is included in the tables. Debit programs include Visa’s signature based and Interlink (PIN) debit programs.
The data presented is based on results reported quarterly by Visa’s financial institution clients on their operating certificates. Estimates may be utilized if data is unavailable.
On occasion, previously presented information may be updated. Prior period updates, if any, are not material.
Visa’s CEMEA region is comprised of countries in Central Europe, the Middle East and Africa. Several European Union countries in Central Europe, Israel and Turkey are not included in CEMEA. LAC is comprised of countries in Central and South America and the Caribbean. International includes Asia Pacific, Canada, CEMEA and LAC.
Information denominated in U.S. dollars is calculated by applying an established U.S. dollar/local currency exchange rate for each local currency in which Visa Inc. volumes are reported (“Nominal USD”). These exchange rates are calculated on a quarterly basis using the established exchange rate for each quarter. To eliminate the impact of foreign currency fluctuations against the U.S. dollar in measuring performance, Visa Inc. also reports year-over-year growth in total volume, payments volume and cash volume on the basis of local currency information (“Constant USD”). This presentation represents Visa’s historical methodology which may be subject to review and refinement.
| Exhibit 99.2
|

Visa Inc.
Fiscal Third Quarter 2016 Financial Results
July 21, 2016
|
|
Forward-Looking Statements
This presentation contains forward-looking statements within the meaning of the U.S. Private Securities Litigation Reform Act of 1995. Forward-looking statements generally are identified by words such as “estimates,” “believe,“ “outlook,” “will,” “continue” and other similar expressions. Examples of forward-looking statements include, but are not limited to, statements we make about our revenue, client incentives, operating margin, tax rate, earnings per share, free cash flow, and the growth of those items.
By their nature, forward-looking statements: (i) speak only as of the date they are made; (ii) are not statements of historical fact or guarantees of future performance; and (iii) are subject to risks, uncertainties, assumptions or changes in circumstances that are difficult to predict or quantify. Therefore, actual results could differ materially and adversely from our forward-looking statements due to a variety of factors, including the following: the impact of laws, regulations and marketplace barriers, including: increased regulation of fees, transaction routing, payment card practices or other aspects of the payments industry in the U.S., including new or revised regulations issued under the Dodd-Frank Wall Street Reform and Consumer Protection Act;
increased regulation in Europe and other jurisdictions outside of the U.S.;
increased government support of national payments networks outside the U.S.; and increased regulation of consumer privacy, data use and security;
developments in litigation and government enforcement, including those affecting interchange reimbursement fees, antitrust and tax;
new lawsuits, investigations or proceedings, or changes to our potential exposure in connection with pending lawsuits, investigations or proceedings; economic factors, such as: uncertainty surrounding the Brexit, including the spillover to economic fragility in the Eurozone, the U.S. and in other advanced and emerging markets; general economic, political and social conditions in mature and emerging markets globally; general stock market fluctuations which may impact consumer spending; material changes in cross-border activity, foreign exchange controls and fluctuations in currency exchange rates; and material changes in our financial institution clients’ performance compared to our estimates;
industry developments, such as competitive pressure, rapid technological developments and disintermediation from our payments network;
system developments, such as:
disruption of our transaction processing systems or the inability to process transactions efficiently;
account data breaches or increased fraudulent or other illegal activities involving Visa-branded cards or payment products; and failure to maintain systems interoperability with Visa Europe; the loss of organizational effectiveness or key employees;
the failure to integrate acquisitions successfully, achieve the anticipated benefits of the acquisitions, or effectively develop new products and businesses; natural disasters, terrorist attacks, military or political conflicts, and public health emergencies; and various other factors, including those more fully described in our filings with the U.S. Securities and Exchange Commission, including our Annual Report on
Form 10-K for the year ended September 30, 2015, and our subsequent reports on Forms 10-Q and 8-K.
You should not place undue reliance on such statements. Except as required by law, we do not intend to update or revise any forward–looking statements as a result of new information, future developments or otherwise.
2 Fiscal Third Quarter 2016 Financial Results
|
|
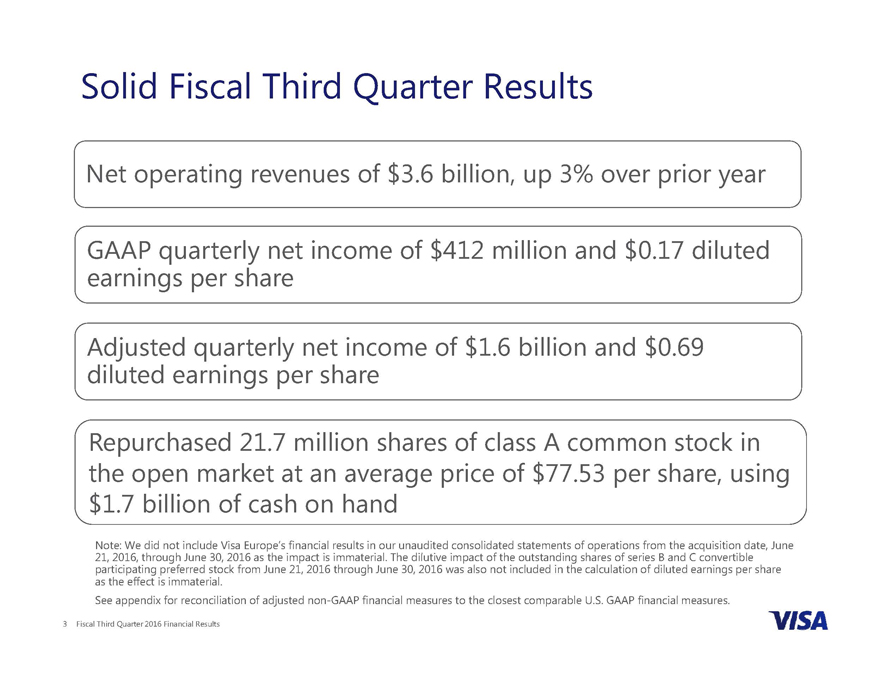
Solid Fiscal Third Quarter Results
Net operating revenues of $3.6 billion, up 3% over prior year
earnings GAAP quarterly per share net income of $412 million and $0.17 diluted Adjusted diluted earnings quarterly per net share income of $1.6 billion and $0.69 Repurchased 21.7 million shares of class A common stock in the open market at an average price of $77.53 per share, using
$1.7 billion of cash on hand
21, Note: 2016, We through did not include June 30, Visa 2016 Europe’s as the impact financial is results immaterial in our . The unaudited dilutive impact consolidated of the statements outstanding of shares operations of series from B and the acquisition C convertible date, June as participating the effect is preferred immaterial stock . from June 21, 2016 through June 30, 2016 was also not included in the calculation of diluted earnings per share See appendix for reconciliation of adjusted non-GAAP financial measures to the closest comparable U.S. GAAP financial measures.
3 Fiscal Third Quarter 2016 Financial Results
|
|
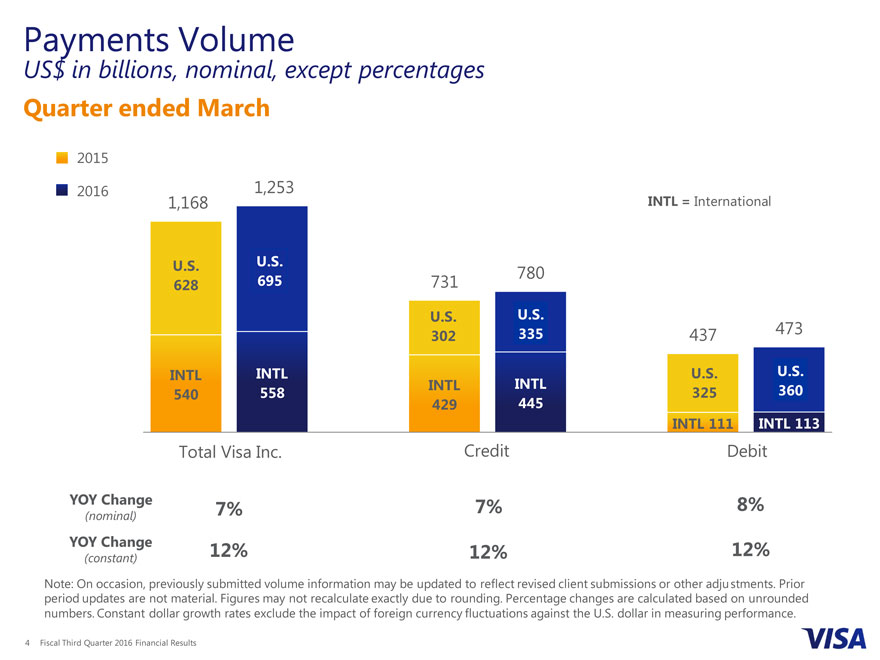
Payments Volume
US$ in billions, nominal, except percentages
Quarter ended March
2015
2016 1,253
1,168 INTL = International
U.S. [SERIES NAME] 780
628 [VALUE] 731
U.S.[SERIES NAME]
302[VALUE]437473
[SERIES NAME] INTL U.S.[SERIES NAME]
[VALUE] 558 [SERIES NAME]INTL325[VALUE]
[VALUE]445
INTL 111INTL 113
Total Visa Inc. Credit Debit
YOY Change 7% 7%8%
(nominal)
YOY Change 12% 12%12%
(constant)
Note: On occasion, previously submitted volume information may be updated to reflect revised client submissions or other adjustments. Prior period updates are not material. Figures may not recalculate exactly due to rounding. Percentage changes are calculated based on unrounded numbers. Constant dollar growth rates exclude the impact of foreign currency fluctuations against the U.S. dollar in measuring performance.
4 Fiscal Third Quarter 2016 Financial Results
|
|
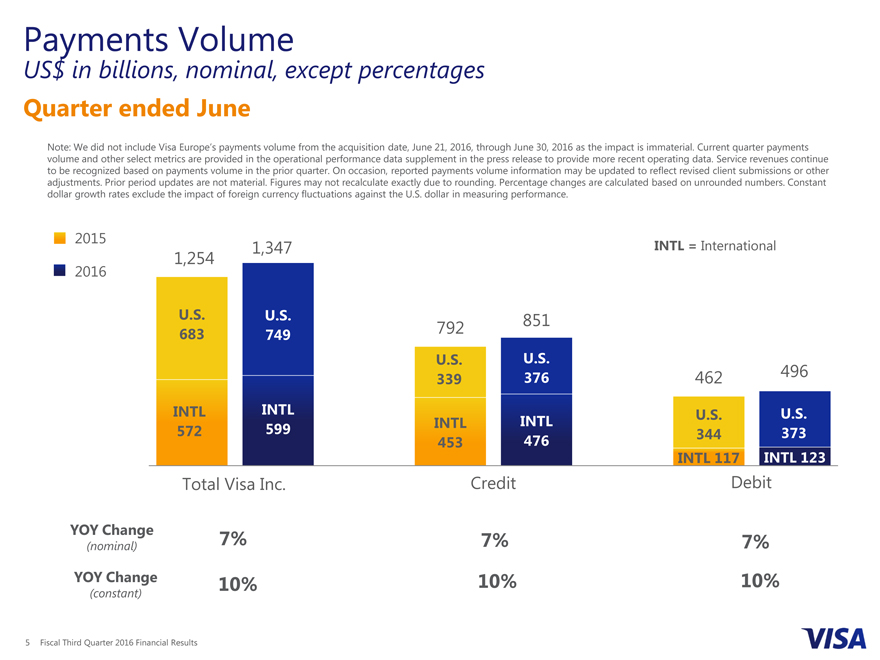
Payments Volume
US$ in billions, nominal, except percentages
Quarter ended June
Note: We did not include Visa Europe’s payments volume from the acquisition date, June 21, 2016, through June 30, 2016 as the impact is immaterial. Current quarter payments volume and other select metrics are provided in the operational performance data supplement in the press release to provide more recent operating data. Service revenues continue to be recognized based on payments volume in the prior quarter. On occasion, reported payments volume information may be updated to reflect revised client submissions or other adjustments. Prior period updates are not material. Figures may not recalculate exactly due to rounding. Percentage changes are calculated based on unrounded numbers. Constant dollar growth rates exclude the impact of foreign currency fluctuations against the U.S. dollar in measuring performance.
2015 1,347 INTL = International
1,254
2016
U.S. 683 U.S. 851 U.S. 749 792 INTL 572 U.S.
376 462 496
U.S. 339 INTL INTL 453 U.S. 599 U.S. 344 INTL U.
373 476
319
INTL 117 INTL 123
Total Visa Inc. Credit INTL 109 Debit INTL 127
YOY Change 7% 7%
(nominal) 7%
YOY Change 10% 10% 10%
(constant)
5 Fiscal Third Quarter 2016 Financial Results
|
|
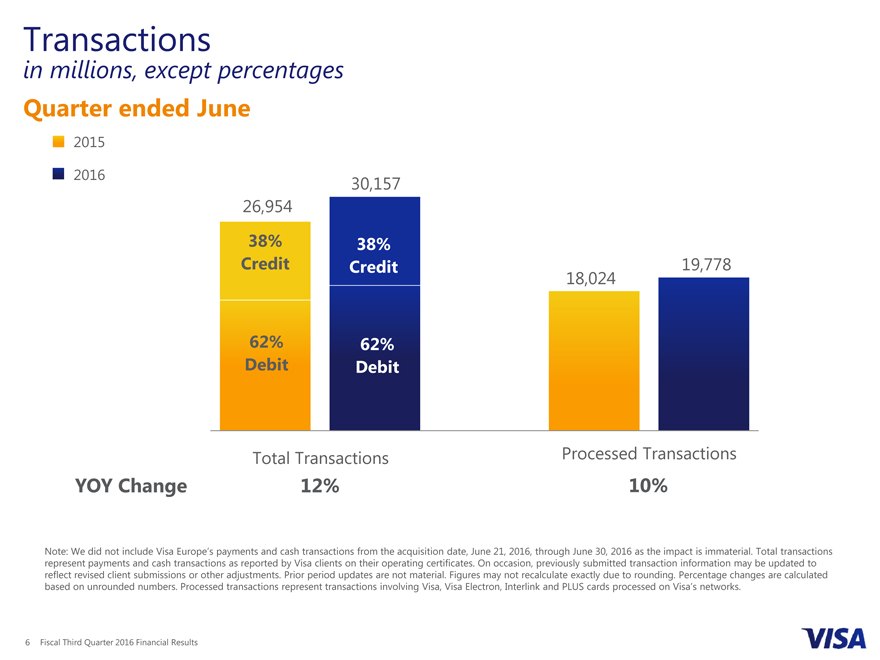
Transactions
in millions, except percentages
Quarter ended June
2015
2016 30,157 26,954
38% Credit 62% Debit 38% Credit 62% Debit 19,778 18,024
Total Transactions Processed Transactions
YOY Change 12% 10%
Note: We did not include Visa Europe’s payments and cash transactions from the acquisition date, June 21, 2016, through June 30, 2016 as the impact is immaterial. Total transactions represent payments and cash transactions as reported by Visa clients on their operating certificates. On occasion, previously submitted transaction information may be updated to reflect revised client submissions or other adjustments. Prior period updates are not material. Figures may not recalculate exactly due to rounding. Percentage changes are calculated based on unrounded numbers. Processed transactions represent transactions involving Visa, Visa Electron, Interlink and PLUS cards processed on Visa’s networks.
6 Fiscal Third Quarter 2016 Financial Results
|
|
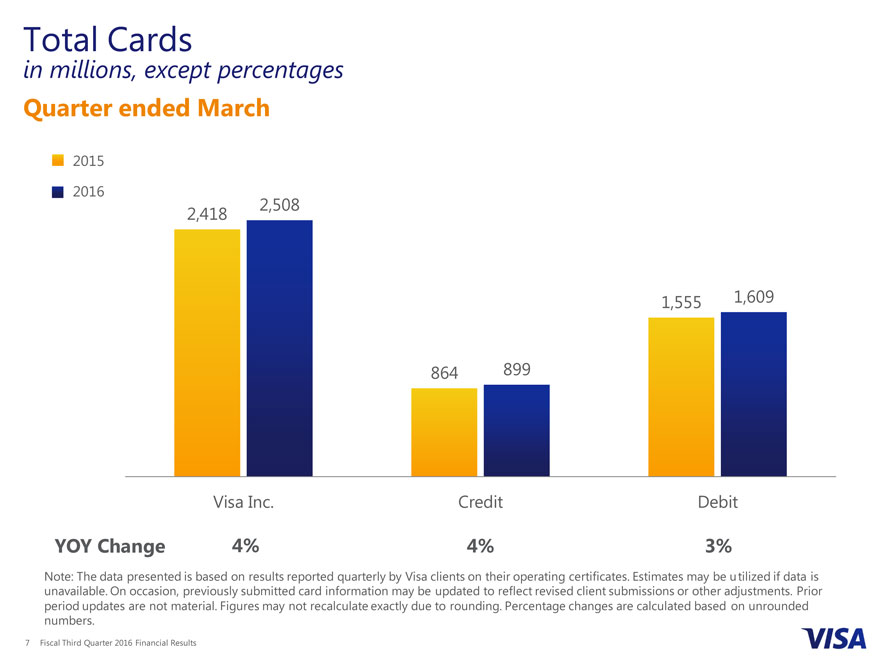
Total Cards
in millions, except percentages
Quarter ended March
2015
2016
2,418 2,508
1,555
1,609
864 899
Visa Inc. CreditDebit
YOY Change 4% 4%3%
Note: The data presented is based on results reported quarterly by Visa clients on their operating certificates. Estimates may be utilized if data is unavailable. On occasion, previously submitted card information may be updated to reflect revised client submissions or other adjustments. Prior period updates are not material. Figures may not recalculate exactly due to rounding. Percentage changes are calculated based on unrounded numbers.
7 Fiscal Third Quarter 2016 Financial Results
|
|
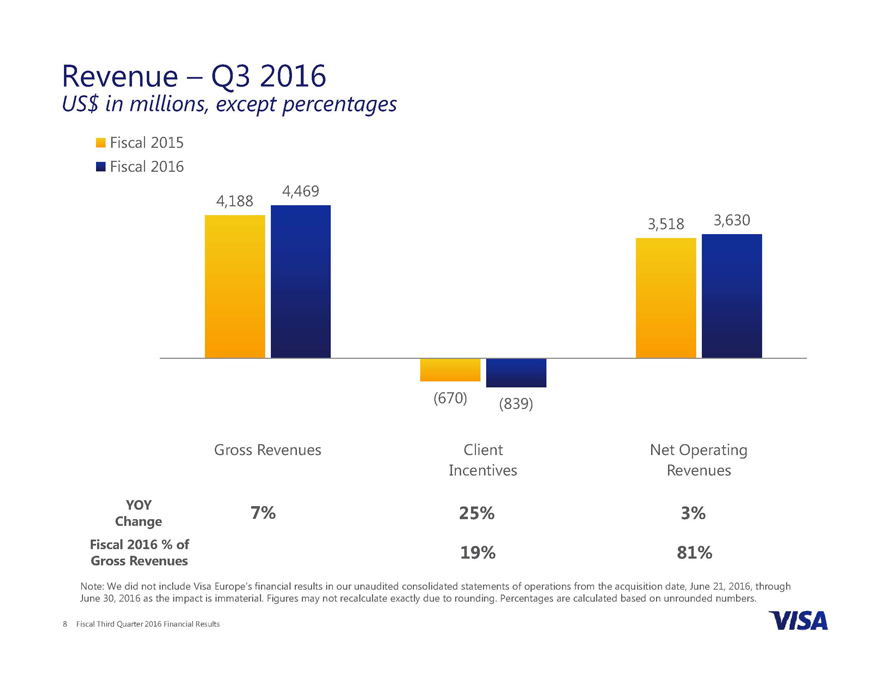
Revenue – Q3 2016
US$ in millions, except percentages
Fiscal 2015 Fiscal 2016
4,469 4,188
3,518 3,630
(670) (839)
Gross Revenues Client Net Operating Incentives Revenues
YOY 7% 25% 3%
Change
Fiscal 2016 % of 19% 81% Gross Revenues
Note: We did not include Visa Europe’s financial results in our unaudited consolidated statements of operations from the acquisition date, June 21, 2016, through June 30, 2016 as the impact is immaterial. Figures may not recalculate exactly due to rounding. Percentages are calculated based on unrounded numbers.
8 Fiscal Third Quarter 2016 Financial Results
|
|
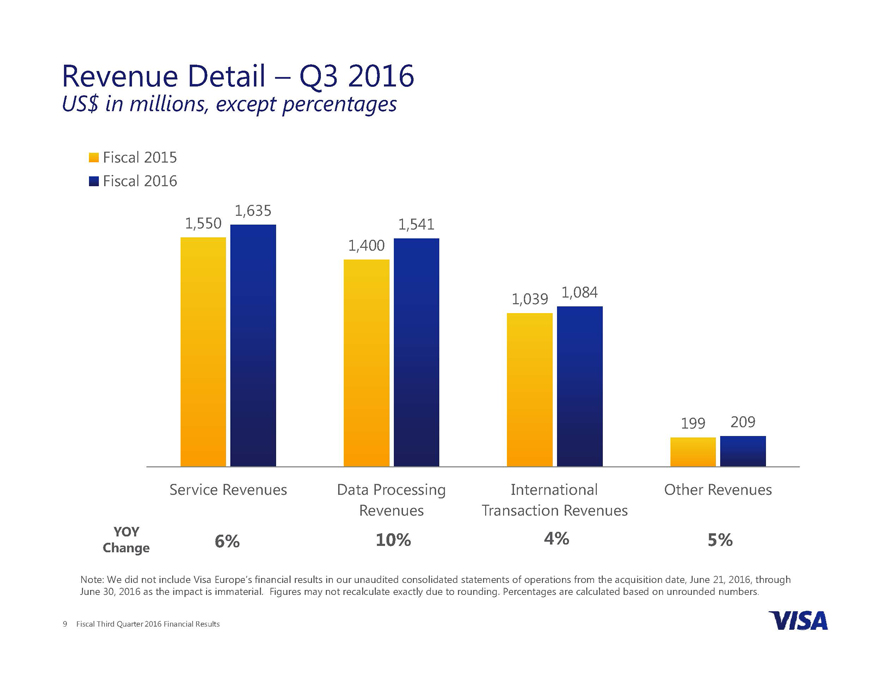
Revenue Detail – Q3 2016
US$ in millions, except percentages
Fiscal 2015 Fiscal 2016
1,635
1,550 1,541 1,400
1,039 1,084
199 209
Service Revenues Data Processing International Other Revenues Revenues Transaction Revenues
YOY 6% 10% 4% 5%
Change
Note: We did not include Visa Europe’s financial results in our unaudited consolidated statements of operations from the acquisition date, June 21, 2016, through June 30, 2016 as the impact is immaterial. Figures may not recalculate exactly due to rounding. Percentages are calculated based on unrounded numbers.
9 Fiscal Third Quarter 2016 Financial Results
|
|
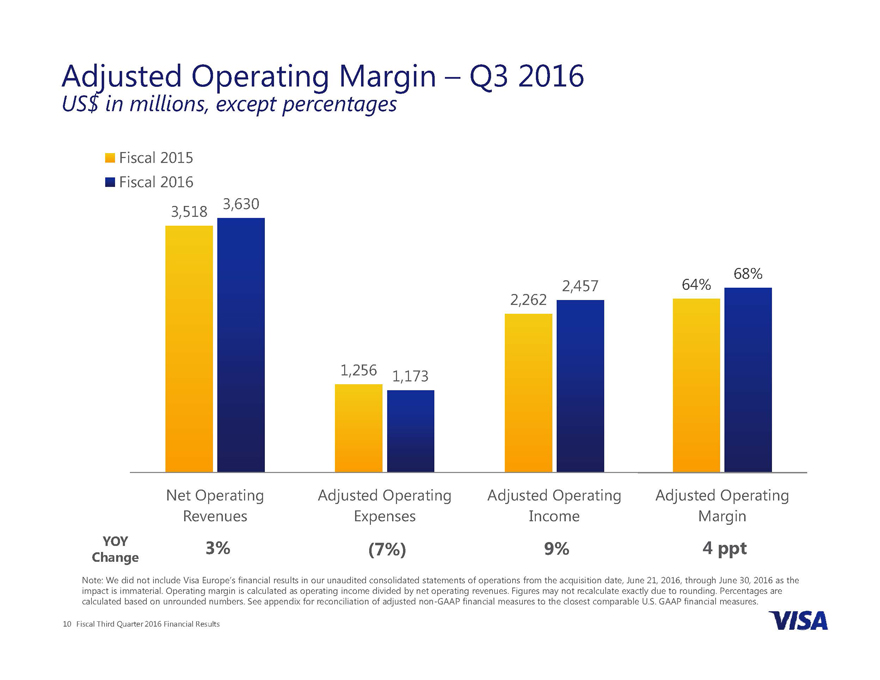
Adjusted Operating Margin – Q3 2016
US$ in millions, except percentages
Fiscal 2015 Fiscal 2016
3,518 3,630
68% 2,457 64% ,
1,256 1,173
Net Operating Adjusted Operating Adjusted Operating Adjusted Operating Revenues Expenses Income Margin
YOY 3%4 (7%) 9% ppt
Change
Note: We did not include Visa Europe’s financial results in our unaudited consolidated statements of operations from the acquisition date, June 21, 2016, through June 30, 2016 as the impact is immaterial. Operating margin is calculated as operating income divided by net operating revenues. Figures may not recalculate exactly due to rounding. Percentages are calculated based on unrounded numbers. See appendix for reconciliation of adjusted non-GAAP financial measures to the closest comparable U.S. GAAP financial measures.
10 Fiscal Third Quarter 2016 Financial Results
|
|
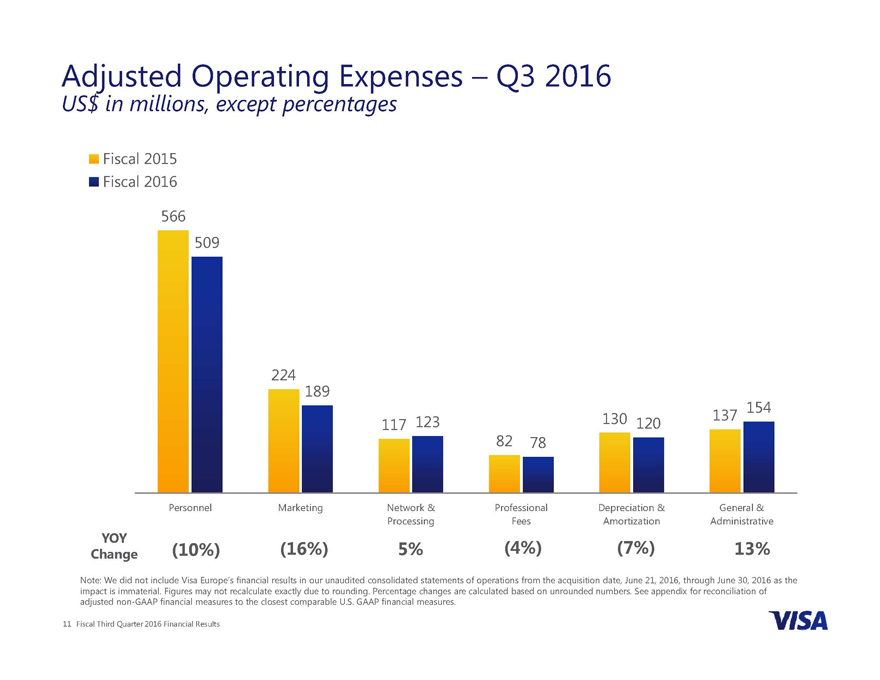
Adjusted Operating Expenses – Q3 2016
US$ in millions, except percentages
Fiscal 2015 Fiscal 2016 566 509
224 189
137 154 117 123 130 120
82 78
Personnel Marketing Network & Professional Depreciation & General & Processing Fees Amortization Administrative
YOY (4%) (7%)
Change (10%) (16%) 5% 13%
Note: We did not include Visa Europe’s financial results in our unaudited consolidated statements of operations from the acquisition date, June 21, 2016, through June 30, 2016 as the impact is immaterial. Figures may not recalculate exactly due to rounding. Percentage changes are calculated based on unrounded numbers. See appendix for reconciliation of adjusted non-GAAP financial measures to the closest comparable U.S. GAAP financial measures.
11 Fiscal Third Quarter 2016 Financial Results
|
|
Other Financial Results and Highlights
Cash, cash equivalents and available-for-sale investment securities of $12.4 billion at the end of the fiscal third quarter
Adjusted free cash flow of $2.0 billion for the fiscal third quarter
• Capital expenditures of $132 million during the fiscal third quarter
Authorized a new $5.0 billion share repurchase program
Note: 2016, through We did not June include 30, 2016 Visa as Europe’s the impact financial is immaterial. results in We our included unaudited preliminary consolidated balances statements of Visa of Europe operations as of from June the 30, 2016 acquisition in our date, unaudited June 21, consolidated balance sheets, pending final valuation.
See appendix for reconciliation of adjusted non-GAAP financial measures to the closest comparable U.S. GAAP financial measures.
12 Fiscal Third Quarter 2016 Financial Results
|
|
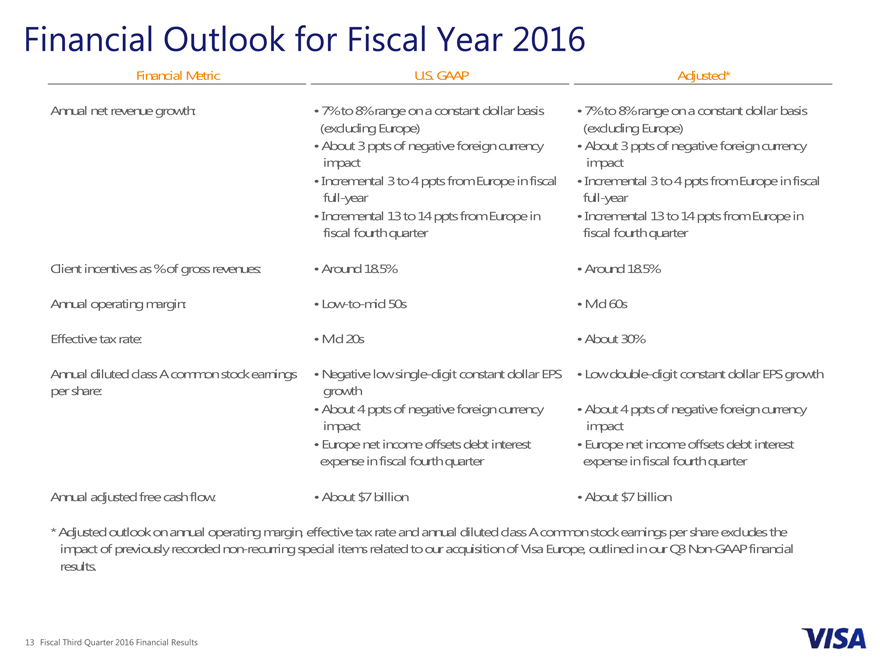
Financial Outlook for Fiscal Year 2016 Financial Metric Annual net revenue growth: Client incentives as % of gross revenues: Annual operating margin: Effective tax rate: Annual diluted class A common stock earnings per share: Annual adjusted free cash flow: U.S. GAAP • 7% to 8% range on a constant dollar basis (excluding Europe) • About 3 ppts of negative foreign currency impact • Incremental 3 to 4 ppts from Europe in fiscal full-year • Incremental 13 to 14 ppts from Europe in fiscal fourth quarter • Around 18.5% • Low-to-mid 50s • Mid 20s • Negative low single-digit constant dollar EPS growth • About 4 ppts of negative foreign currency impact • Europe net income offsets debt interest expense in fiscal fourth quarter • About $7 billion Adjusted* • 7% to 8% range on a constant dollar basis (excluding Europe) • About 3 ppts of negative foreign currency impact • Incremental 3 to 4 ppts from Europe in fiscal full-year • Incremental 13 to 14 ppts from Europe in fiscal fourth quarter • Around 18.5% • Mid 60s • About 30% • Low double-digit constant dollar EPS growth • About 4 ppts of negative foreign currency impact • Europe net income offsets debt interest expense in fiscal fourth quarter • About $7 billion * Adjusted outlook on annual operating margin, effective tax rate and annual diluted class A common stock earnings per share excludes the impact of previously recorded non-recurring special items related to our acquisition of Visa Europe, outlined in our Q3 Non-GAAP financial results.
|
|

Appendix
|
|
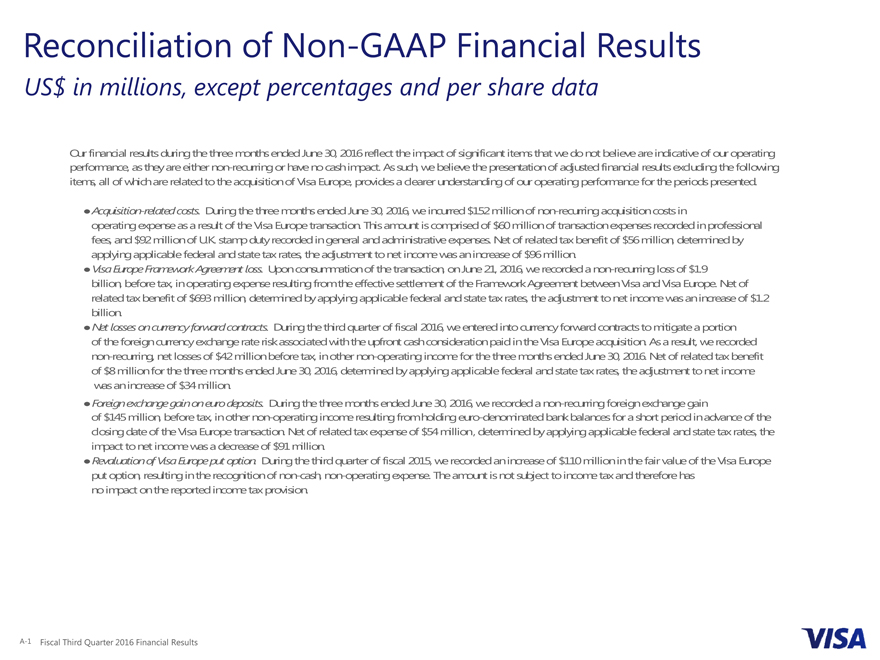
Reconciliation of Non-GAAP Financial Results
US$ in millions, except percentages and per share data
Our financial results during the three months ended June 30, 2016 reflect the impact of significant items that we do not believe are indicative of our operating performance, as they are either non-recurring or have no cash impact. As such, we believe the presentation of adjusted financial results excluding the following items, all of which are related to the acquisition of Visa Europe, provides a clearer understanding of our operating performance for the periods presented.
Š Acquisition-related costs. During the three months ended June 30, 2016, we incurred $152 million of non-recurring acquisition costs in operating expense as a result of the Visa Europe transaction. This amount is comprised of $60 million of transaction expenses recorded in professional fees, and $92 million of U.K. stamp duty recorded in general and administrative expenses. Net of related tax benefit of $56 million, determined by applying applicable federal and state tax rates, the adjustment to net income was an increase of $96 million.
Š Visa Europe Framework Agreement loss. Upon consummation of the transaction, on June 21, 2016, we recorded a non-recurring loss of $1.9 billion, before tax, in operating expense resulting from the effective settlement of the Framework Agreement between Visa and Visa Europe. Net of related tax benefit of $693 million, determined by applying applicable federal and state tax rates, the adjustment to net income was an increase of $1.2 billion.
Š Net losses on currency forward contracts. During the third quarter of fiscal 2016, we entered into currency forward contracts to mitigate a portion of the foreign currency exchange rate risk associated with the upfront cash consideration paid in the Visa Europe acquisition. As a result, we recorded non-recurring, net losses of $42 million before tax, in other non-operating income for the three months ended June 30, 2016. Net of related tax benefit of $8 million for the three months ended June 30, 2016, determined by applying applicable federal and state tax rates, the adjustment to net income was an increase of $34 million.
Š Foreign exchange gain on euro deposits. During the three months ended June 30, 2016, we recorded a non-recurring foreign exchange gain of $145 million, before tax, in other non-operating income resulting from holding euro-denominated bank balances for a short period in advance of the closing date of the Visa Europe transaction. Net of related tax expense of $54 million, determined by applying applicable federal and state tax rates, the impact to net income was a decrease of $91 million.
Š Revaluation of Visa Europe put option. During the third quarter of fiscal 2015, we recorded an increase of $110 million in the fair value of the Visa Europe put option, resulting in the recognition of non-cash, non-operating expense. The amount is not subject to income tax and therefore has no impact on the reported income tax provision.
A-1 Fiscal Third Quarter 2016 Financial Results
|
|
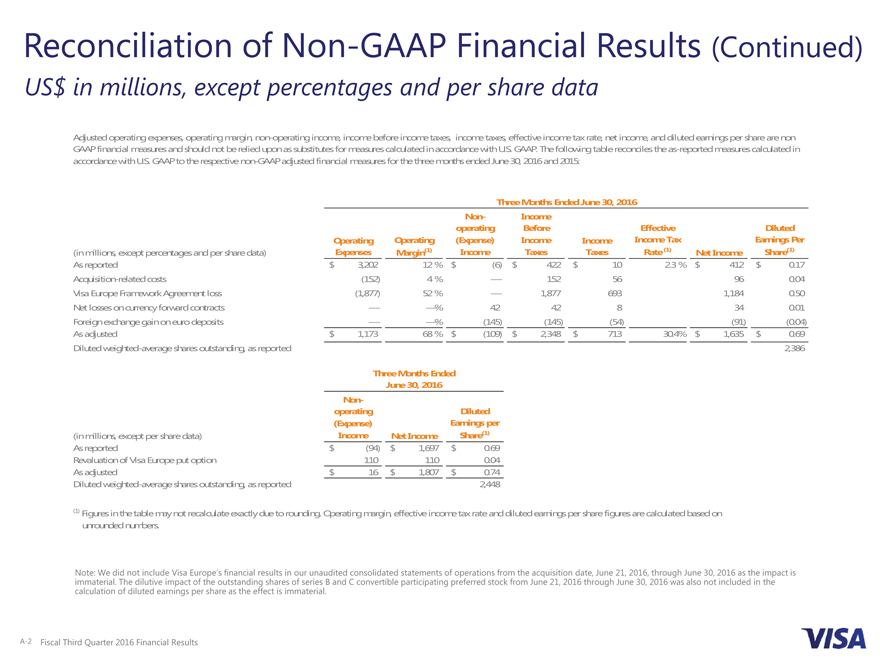
Reconciliation of Non-GAAP Financial Results (Continued)
US$ in millions, except percentages and per share data
Adjusted operating expenses, operating margin, non-operating income, income before income taxes, income taxes, effective income tax rate, net income, and diluted earnings per share are non GAAP financial measures and should not be relied upon as substitutes for measures calculated in accordance with U.S. GAAP. The following table reconciles the as-reported measures calculated in accordance with U.S. GAAP to the respective non-GAAP adjusted financial measures for the three months ended June 30, 2016 and 2015:
Three Months Ended June 30, 2016 Non- Income operating Before Effective Diluted Operating Operating (Expense) Income Income Income Tax Earnings Per
(in millions, except percentages and per share data) Expenses Margin(1) Income Taxes Taxes Rate (1) Net Income Share(1)
As reported $ 3,202 12 % $ (6) $ 422 $ 10 2.3 % $ 412 $ 0.17 Acquisition-related costs (152) 4 % — 152 56 96 0.04 Visa Europe Framework Agreement loss (1,877) 52 % — 1,877 693 1,184 0.50 Net losses on currency forward contracts — —% 42 42 8 34 0.01 Foreign exchange gain on euro deposits — —% (145) (145) (54) (91) (0.04) As adjusted $ 1,173 68 % $ (109) $ 2,348 $ 713 30.4% $ 1,635 $ 0.69 Diluted weighted-average shares outstanding, as reported 2,386
Three Months Ended June 30, 2016 Non-operating Diluted (Expense) Earnings per
(in millions, except per share data) Income Net Income Share(1)
As reported $ (94) $ 1,697 $ 0.69 Revaluation of Visa Europe put option 110 110 0.04
, .
Diluted weighted-average shares outstanding, as reported 2,448
(1) Figures in the table may not recalculate exactly due to rounding. Operating margin, effective income tax rate and diluted earnings per share figures are calculated based on unrounded numbers.
Note: immaterial. We did The not dilutive include impact Visa Europe’s of the outstanding financial results shares in of our series unaudited B and C consolidated convertible participating statements of preferred operations stock from from the June acquisition 21, 2016 date, through June 21, June 2016, 30, 2016 through was June also not 30, 2016 included as the in impact the is calculation of diluted earnings per share as the effect is immaterial.
A-2 Fiscal Third Quarter 2016 Financial Results
|
|

Calculation of Adjusted Free Cash Flow
US$ in millions
Management believes that presentation of adjusted free cash flow is useful to measure the Company’s generation of cash available to first re-invest in the business and then return excess cash to shareholders through stock buybacks and cash dividends. During the three months ended June 30, 2016, we generated adjusted free cash flow of $2.0 billion, and returned $2.0 billion to investors through stock buybacks of $1.7 billion, and dividends paid of $335 million. During the nine months ended June 30, 2016, we generated adjusted free cash flow of $ 4.4 billion, and returned $6.5 billion(1) to investors through stock buybacks of $5.5 billion, and dividends paid of $1.0 billion. We define adjusted free cash flow as cash provided by operating activities adjusted to reflect capital investments made in the business, then further adjusted for Visa-specific transactions that are not related to our core operations. Adjusted free cash flow is a non-GAAP performance measure and should not be relied upon as a substitute for measures calculated in accordance with U.S. GAAP. The following table reconciles as-reported net cash provided by operating activities to non-GAAP adjusted free cash flow.
Three Months Ended Nine Months Ended June 30, 2016 June 30, 2016 Net cash provided by operating activities 303 3,122 Add (less): Capital expenditures (132) (382) Visa Europe Framework Agreement loss 1,877 1,877 Settlement payments funded by litigation escrow 34 45 Foreign exchange gain on EUR deposits (145) (145) Net losses (gains) on currency forward contracts 42 (74)
Adjusted Free Cash Flow 1,979 4,443
(1) Funds returned to investors were greater than free cash flow generated as a result of the Company’s increased share buybacks during the current period, funded by cash received in our debt issuance in December 2015. The Company did not repurchase any shares during the fourth quarter of fiscal 2015.
as Note: the We impact did not is immaterial. include Visa We Europe’s included financial preliminary results balances in our unaudited of Visa Europe consolidated as of June statements 30, 2016 in of our operations unaudited from consolidated the acquisition balance date, sheets, June 21, pending 2016, through final valuation. June 30, 2016
A-3 Fiscal Third Quarter 2016 Financial Results
Serious News for Serious Traders! Try StreetInsider.com Premium Free!
You May Also Be Interested In
- Midday movers: Tesla, Boeing rise; Uber, Old Dominion Freight fall
- Visa (V) PT Raised to $315 at RBC Capital
- NorthWestern Reports First Quarter 2024 Financial Results
Create E-mail Alert Related Categories
SEC FilingsSign up for StreetInsider Free!
Receive full access to all new and archived articles, unlimited portfolio tracking, e-mail alerts, custom newswires and RSS feeds - and more!
