

Form 8-K Unum Group For: Dec 16
 Tweet
Tweet Share
Share�
�
UNITED STATES
SECURITIES AND EXCHANGE COMMISSION
Washington, D.C. 20549
�
�
FORM 8-K
�
�
Current Report
Pursuant to Section�13 or 15(d)
of The Securities Exchange Act of 1934
Date of Report (Date of earliest event reported): December�16, 2014
�
�
UNUM GROUP
(Exact name of registrant as specified in its charter)
�
�
�
| Delaware | � | 001-11294 | � | 62-1598430 |
| (State or other jurisdiction of incorporation) |
� | (Commission File Number) |
� | (IRS Employer Identification No.) |
1 Fountain Square
Chattanooga, Tennessee 37402
(Address of principal executive offices) (Zip Code)
(423) 294-1011
(Registrant�s telephone number, including area code)
Not Applicable
(Former name or former address, if changed since last report)
�
�
Check the appropriate box below if the Form 8-K filing is intended to simultaneously satisfy the filing obligation of the registrant under any of the following provisions (see General Instruction A.2. below):
�
| � | Written communications pursuant to Rule 425 under the Securities Act (17 CFR 230.425) |
�
| � | Soliciting material pursuant to Rule 14a-12 under the Exchange Act (17 CFR 240.14a-12) |
�
| � | Pre-commencement communications pursuant to Rule 14d-2(b) under the Exchange Act (17 CFR 240.14d-2(b)) |
�
| � | Pre-commencement communications pursuant to Rule 13e-4(c) under the Exchange Act (17 CFR 240.13e-4(c)) |
�
�
�
| Item�7.01 | Regulation FD Disclosure. |
On December�16, 2014, senior management of Unum Group is hosting its 2015 outlook meeting in New York City with analysts and investors. A news release highlighting recent financial results and outlook to be presented at the meeting is furnished herewith as Exhibit 99.1 and incorporated herein by reference. For the benefit of all investors, the slide presentation to be delivered at the meeting is furnished herewith as Exhibit 99.2 and incorporated herein by reference.
In accordance with General Instruction B.2 of Form 8-K, the information in this report, including Exhibits 99.1 and 99.2, shall not be deemed �filed� for purposes of Section�18 of the Securities Exchange Act of 1934 (the �Exchange Act�), or otherwise subject to the liabilities of that section, nor shall it be deemed to be incorporated by reference into any of Unum Group�s filings under the Securities Act of 1933 or the Exchange Act, except as shall be expressly set forth by specific reference in such filing.
�
| Item�9.01 | Financial Statements and Exhibits. |
(d) Exhibits. The following exhibits are furnished (but not filed) with this report:
�
| 99.1 | �� | News release of Unum Group dated December�16, 2014, announcing highlights of 2015 outlook meeting. |
| 99.2 | �� | Slide presentation of Unum Group at its 2015 outlook meeting on December 16, 2014. |
SIGNATURES
Pursuant to the requirements of the Securities Exchange Act of 1934, the registrant has duly caused this report to be signed on its behalf by the undersigned hereunto duly authorized.
�
| � | � | Unum Group | ||||
| � | � | (Registrant) | ||||
| Date: December 16, 2014 | � | � | By: | � | /s/ Susan N. Roth | |
| � | � | Name: | � | Susan N. Roth | ||
| � | � | Title: | � | Vice President, Transactions, SEC | ||
| � | � | � | and Corporate Secretary | |||
INDEX TO EXHIBITS
�
| Exhibit |
�� | Description |
| 99.1 | �� | News release of Unum Group dated December 16, 2014, announcing highlights of 2015 outlook meeting. |
| 99.2 | �� | Slide presentation of Unum Group at its 2015 outlook meeting on December 16, 2014. |
Exhibit 99.1
�

|
� | � | � | ��������1 Fountain Square | ||
| � | � | � | ��������Chattanooga, TN 37402 ��������www.unum.com |
�
| �� | FOR IMMEDIATE RELEASE | |||
| news | �� | Contacts: | �� | Thomas A. H. White 423 294 8996 � Matt Barnett 423 294 7498 |
Unum Group Announces Highlights of
2015 Outlook Meeting
Sees Continuation of Strong Operating Performance and Solid Capital Position
CHATTANOOGA, TN (December 16, 2014) � Unum Group (NYSE: UNM) senior management is hosting a meeting today in New York City with analysts and investors to provide an update of the Company�s recent results and its outlook for 2015. This morning�s presentation will include the following highlights:
�
| � | � | � | The Company will confirm its previously provided outlook for 2014 operating earnings per share growth of five percent to ten percent. |
�
| � | � | � | The Company is in the process of completing a review of the adequacy of the reserves supporting its closed block of long-term care business and anticipates that in the fourth quarter of 2014 it will increase reserves reported under generally accepted accounting principles (GAAP) by approximately $400 million to $500 million, after tax. Further, the Company anticipates that its capital metrics for year-end 2014 will be slightly above its previously provided outlook. |
�
| � | � | � | Turning to its 2015 outlook, the Company anticipates growth in operating earnings per share to be within a range of 2 percent to 5 percent, with anticipated share repurchases within a range of $400 million to $600 million. |
�Thus far in the fourth quarter, we have continued to experience a number of the very positive trends which we�ve seen throughout the year including strong sales momentum, accelerating premium growth and favorable risk results,� said Thomas R. Watjen, president and chief executive officer. �For this reason, we continue to be very comfortable with our previously provided outlook for 2014 of operating earnings growth of five to ten percent. We expect these positive trends to continue into next year, which is reflected in the 2015 outlook we will discuss with investors today. Unfortunately, today�s persistently low interest rates are a challenge, but even with these headwinds
�
UNUM IS A REGISTERED TRADEMARK AND MARKETING BRAND OF UNUM GROUP AND ITS INSURING SUBSIDIARIES.
�
we expect to maintain solid operating margins and significant financial flexibility in 2015 to support the needs of the businesses, while also continuing to return capital to our shareholders.�
The Company also is announcing that, as part of its annual reserve review, it expects to increase the reserves supporting its long-term care business. �The long-term care business remains a very challenging business, especially in this low interest rate environment, and continues to be an area of great focus for our management team,� added Watjen. �I am quite confident that we are taking all of the right actions to manage this difficult business, and the steps we are outlining today will enable us to better position this business for the future. As we will discuss with investors, these actions do not have any impact on our core businesses or capital management strategy for 2015.�
Also, the Company will discuss additional details of its 2015 financial plan and capital management plans.
�
| � | � | � | Primary factors impacting the 2015 outlook include the expectation of continued momentum in premium income growth of 4 percent to 6 percent for its core operations along with generally stable risk experience, offset in part by the continued negative effects of today�s low interest rate environment including a reduction of 50 basis points to the discount rate which the Company anticipates implementing in the fourth quarter of 2014 for new group long-term disability claim incurrals in Unum US. |
�
| � | � | � | The Company currently estimates its year-end 2014 capital metrics, after consideration of the anticipated GAAP reserve increase and a statutory reserve increase of approximately $150 million for its First Unum subsidiary, will be slightly above the outlook provided a year ago, with the weighted average risk-based capital ratio for the Company�s traditional U.S. insurance companies exceeding 400 percent and cash and marketable securities in its holding companies exceeding $500 million. |
�
| � | � | � | The Company continues to anticipate the generation of strong cash flow from its operations in 2015 which will support planned share repurchases within a range of $400 million to $600 million. In addition, management expects that in May 2015 it will recommend to its Board of Directors to again increase its common stock dividend. |
�
2
UNUM IS A REGISTERED TRADEMARK AND MARKETING BRAND OF UNUM GROUP AND ITS INSURING SUBSIDIARIES.
�
| � | � | � | Finally, the Company expects to maintain a strong capital position and is establishing an outlook for year-end 2015 weighted average risk-based capital ratio to be within a range of 375 percent to 400 percent and cash and marketable securities in its holding companies to be in excess of $500 million. |
Executive vice president and chief financial officer, Richard P. McKenney, said �Due to strong operational trends in our core businesses, we expect to close 2014 with capital metrics consistent with our original plans for the year. Looking forward, we are confident in the strength of our franchise which we expect to enable us to maintain significant financial flexibility while also maintaining a strong return of capital to our shareholders.�
OTHER INFORMATION
Low-income Housing Tax Credits
As previously discussed in the Company�s most recent Form 10-Q, the Financial Accounting Standards Board issued an update, which the Company intends to adopt effective January�1, 2015, to provide guidance on the accounting and reporting for investments in affordable housing projects that qualify for low-income housing tax credits.�Amortization will be reported through the income tax line under the revised guidance rather than as negative net investment income, which will increase the Company�s before-tax income but also increase the 2015 effective tax rate to an expected range of 31 percent to 32 percent.�The Company estimates that adoption of this update will result in a cumulative effect adjustment that will decrease the opening balance of 2015 retained earnings between�$25.0 million and�$35.0 million, with an immaterial decrease in net income in 2015 and in each of the years preceding to which the retrospective adoption is applied.
Pension Plan Change
Also as previously discussed in the Company�s most recent Form 10-Q, in September 2014, the Company amended its U.S. qualified defined benefit pension plan to allow a limited-time offer of benefit payouts to eligible former employees with a vested right to a pension benefit.�The offer provided eligible former employees, regardless of age, with an option to elect to receive a lump-sum settlement of his or her entire accrued pension benefit in December 2014 or to elect receipt of monthly pension benefits commencing in January 2015.�Upon
�
3
UNUM IS A REGISTERED TRADEMARK AND MARKETING BRAND OF UNUM GROUP AND ITS INSURING SUBSIDIARIES.
�
distribution of the lump-sum payouts, the Company will account for the payouts as settlements and will recognize in income the applicable portion of the unrecognized actuarial loss pertaining to the settled benefit obligation and currently included in accumulated other comprehensive income.�The Company currently estimates that the unrecognized actuarial loss that will be recognized in its results during the fourth quarter of 2014 will be within the range of $40 million to $55 million, after applicable income tax.�The ultimate payout amount will depend on participant election rates.�The loss associated with the payout is subject to certain economic factors such as the discount rate at the time of settlement and the current year�s asset performance relative to the assumed long-term rate of return on plan assets.
The meeting, which is being held today at the Grand Hyatt New York, will begin at 8:30 a.m. and will be simulcast in a listen-only mode on the �Investors� page of the Company�s website (www.unum.com) approximately 15 minutes prior to the start of the meeting.
The presentation will be available on the �News and Events� page and will remain on the website for one year after the event.
ABOUT UNUM GROUP
Unum (www.unum.com) is one of the leading providers of employee benefits products and services and the largest provider of disability insurance products in the United States and the United Kingdom.
SAFE HARBOR STATEMENT
Certain information in this press release constitutes �forward-looking statements� within the meaning of the Private Securities Litigation Reform Act of 1995. Forward-looking statements are those not based on historical information, but rather relate to our outlook, future operations, strategies, financial results, or other developments and speak only as of the date made. These forward-looking statements, including statements about growth in after-tax operating income per share, anticipated reserve increases, the loss associated with the pension payout, weighted average risk-based capital ratios and cash and marketable securities, premium income growth, and share repurchases, are subject to numerous assumptions, risks, and uncertainties, many of which are beyond our control. The following factors, in addition to other
�
4
UNUM IS A REGISTERED TRADEMARK AND MARKETING BRAND OF UNUM GROUP AND ITS INSURING SUBSIDIARIES.
�
factors mentioned from time to time, may cause actual results to differ materially from those contemplated by the forward-looking statements: (1)�unfavorable economic or business conditions, both domestic and foreign; (2)�sustained periods of low interest rates; (3)�fluctuation in insurance reserve liabilities and claim payments due to changes in claim incidence, recovery rates, mortality rates, and offsets due to, among other factors, the rate of unemployment and consumer confidence, the emergence of new diseases, epidemics, or pandemics, new trends and developments in medical treatments, the effectiveness of our claims operational processes, and changes in government programs; (4)�legislative, regulatory, or tax changes, both domestic and foreign, including the effect of potential legislation and increased regulation in the current political environment; (5)�investment results, including, but not limited to, changes in interest rates, defaults, changes in credit spreads, impairments, and the lack of appropriate investments in the market which can be acquired to match our liabilities; (6)�the failure of cyber or other information security systems, as well as the occurrence of events unanticipated in our disaster recovery systems; (7)�ineffectiveness of our derivatives hedging programs due to changes in the economic environment, counterparty risk, ratings downgrades, capital market volatility, changes in interest rates, and/or regulation; (8)�increased competition from other insurers and financial services companies due to industry consolidation, new entrants to our markets, or other factors; (9)�changes in our financial strength and credit ratings; (10)�damage to our reputation due to, among other factors, regulatory investigations, legal proceedings, external events, and/or inadequate or failed internal controls and procedures; (11)�actual experience that deviates from our assumptions used in pricing, underwriting, and reserving; (12)�actual persistency and/or sales growth that is higher or lower than projected; (13)�changes in demand for our products due to, among other factors, changes in societal attitudes, the rate of unemployment, consumer confidence, and/or legislative and regulatory changes, including healthcare reform; (14)�effectiveness of our risk management program; (15)�contingencies and the level and results of litigation; (16)�changes in accounting standards, practices, or policies; (17)�fluctuation in foreign currency exchange rates; (18)�ability to generate sufficient internal liquidity and/or obtain external financing; (19)�availability of reinsurance in the market and the ability of our reinsurers to meet their obligations to us; (20)�recoverability and/or realization of the carrying value of our intangible assets, long-lived assets, and deferred tax assets; and (21)�terrorism, both within the U.S. and abroad, ongoing military actions, and heightened security measures in response to these types of threats.
�
5
UNUM IS A REGISTERED TRADEMARK AND MARKETING BRAND OF UNUM GROUP AND ITS INSURING SUBSIDIARIES.
�
For further discussion about risks and uncertainties which could cause actual results to differ from those contained in the forward-looking statements, see Part I, Item�1A of our annual report on Form 10-K for the year ended December�31, 2013, and our subsequently filed Form 10-Qs. The forward-looking statements in this press release are being made as of the date of this press release, and the Company expressly disclaims any obligation to update or revise any forward-looking statement contained herein, even if made available on our website or otherwise.
###
�
6
UNUM IS A REGISTERED TRADEMARK AND MARKETING BRAND OF UNUM GROUP AND ITS INSURING SUBSIDIARIES.
 2015 Outlook Meeting
December 16, 2014 | New York
Exhibit 99.2 |
 2
Safe Harbor Statement and Non-GAAP Financial Measures
Certain information in this presentation constitutes "forward-looking statements" within
the meaning of the Private Securities Litigation Reform Act of 1995.� Forward-looking statements are
those not based on historical information, but rather relate to our outlook, future operations,
strategies, financial results, or other developments and speak only as of the date made.� These
forward-looking statements, including statements about growth in after-tax operating income
per share, anticipated reserve increases, the loss associated with the pension payout, weighted
average risk-based capital ratios and cash and marketable securities, premium income growth, and
share repurchases are subject to numerous assumptions, risks, and uncertainties, many of which
are beyond our control.� The following factors, in addition to other factors mentioned from time to time, may cause actual results to differ materially from those contemplated by the
forward-looking statements: (1) unfavorable economic or business conditions, both domestic and
foreign; (2) sustained periods of low interest rates; (3) fluctuation in insurance reserve
liabilities and claim payments due to changes in claim incidence, recovery rates, mortality rates, and
offsets due to, among other factors, the rate of unemployment and consumer confidence, the
emergence of new diseases, epidemics, or pandemics, new trends and developments in medical treatments, the effectiveness of our claims operational processes, and changes in
government programs; (4) legislative, regulatory, or tax changes, both domestic and foreign, including
the effect of potential legislation and increased regulation in the current political
environment; (5) investment results, including, but not limited to, changes in interest rates,
defaults, changes in credit spreads, impairments, and the lack of appropriate investments in the
market which can be acquired to match our liabilities; (6) the failure of cyber or other information
security systems, as well as the occurrence of events unanticipated in our disaster recovery
systems; (7) ineffectiveness of our derivatives hedging programs due to changes in the economic
environment, counterparty risk, ratings downgrades, capital market volatility, changes in
interest rates, and/or regulation; (8) increased competition from other insurers and financial
services companies due to industry consolidation, new entrants to our markets, or other factors; (9)
changes in our financial strength and credit ratings; (10) damage to our reputation due to, among
other factors, regulatory investigations, legal proceedings, external events, and/or inadequate
or failed internal controls and procedures; (11) actual experience that deviates from our assumptions used in pricing, underwriting, and reserving; (12) actual persistency and/or
sales growth that is higher or lower than projected; (13) changes in demand for our products due to,
among other factors, changes in societal attitudes, the rate of unemployment, consumer
confidence, and/or legislative and regulatory changes, including healthcare reform; (14) effectiveness
of our risk management program; (15) contingencies and the level and results of litigation;
(16) changes in accounting standards, practices, or policies; (17) fluctuation in foreign currency exchange rates; (18) ability to generate sufficient internal liquidity and/or obtain
external financing; (19) availability of reinsurance in the market and the ability of our reinsurers
to meet their obligations to us; (20) recoverability and/or realization of the carrying value of our
intangible assets, long-lived assets, and deferred tax assets; and (21) terrorism, both within the
U.S. and abroad, ongoing military actions, and heightened security measures in response to
these types of threats.� For further discussion about risks and uncertainties which could cause
actual results to differ from those contained in the forward-looking statements, see Part I, Item
1A of our annual report on Form 10-K for the year ended December 31, 2013, and our subsequently
filed Form 10-Qs.� The forward-looking statements in this press release are being made
as of the date of this press release, and the Company expressly disclaims any obligation to update or
revise any forward-looking statement contained herein, even if made available on our
website or otherwise.
In analyzing performance, Unum sometimes uses non-GAAP financial measures that differ from what is
reported under GAAP.� This presentation contains non-GAAP financial measures,
including operating earnings per share, operating return on equity, book value per share (excluding
accumulated other comprehensive income, or AOCI), and before tax operating income.� Please
refer to the Appendix for a reconciliation of the non-GAAP financial measures used in this presentation to the most directly comparable GAAP measures.
|
 3
Today�s Participants
Business Segment Presidents
Rick McKenney
President and Chief Executive Officer
Tom Watjen
Executive Vice President and Chief Financial Officer
Tom White
Senior Vice President, Investor Relations
Mike Simonds
President and Chief Executive Officer, Unum US
Peter O�Donnell
President and Chief Executive Officer, Unum UK
Randy Horn
Chief Executive Officer, Colonial Life
Jack McGarry
President and Chief Executive Officer, Closed Block
Tim Arnold
President, Colonial Life |
 4
Agenda
Introduction
State of the Business
Financial Performance
Investment Performance
Closed Block
2015 Outlook
Questions & Answers
Core Business Segment Overviews
Unum US
Unum UK
Colonial Life
Closing Comments
Questions & Answers
Appendix |
 Introduction |
 Introduction
A TRACK RECORD OF CONSISTENCY AND PREDICTABILITY�
6
$0.00
$1.00
$2.00
$3.00
$4.00
2004*
2005*
2006*
2007*
2008
2009
2010
2011
2012
2013
2014
* Does not reflect impact of ASU 2010-26.
+5-10%
OPERATING EPS
7.2%
CAGR
*
* December 31, 2007 common shares outstanding
0.0%
5.0%
10.0%
15.0%
20.0%
25.0%
30.0%
35.0%
31.9%
2004
2005
2006
2007
2008
2009
2010
2011
2012
2013
2014
DIVIDEND HISTORY
$0.00
$0.10
$0.20
$0.30
$0.40
$0.50
$0.60
$0.70
$0.80
2004
2005
2006
2007
2008
2009
2010
2011
2012
2013
2014
1.0%
CAGR
14.4%
CAGR
BOOK VALUE PER SHARE
(ex AOCI)
$19.37
$20.77
$20.74
$20.99
$20.84
$23.20
$25.69
$26.33
$29.55
$32.32
$34.52
2004*
2005*
2006*
2007*
2008
2009
2010
2011
2012
2013
3Q14
9.2%
CAGR
* Does not reflect impact of ASU 2010-26.
2.7%
CAGR
STOCK REPURCHASE HISTORY
(CUMULATIVE % OF FLOAT*) |
 Sales Growth*
Premium Growth*
Introduction
12-Month Rolling Sales ($MM)
(CAGR: 8.8%)
* Core Operations, Excludes the Closed Block
* Core Operations, Excludes the Closed Block
Year-over-Year Change
(CAGR: 2.9%)
�
AND THE EMERGENCE OF PROFITABLE GROWTH
$1,100
$1,150
$1,200
$1,250
$1,300
2Q13
3Q13
4Q13
1Q14
2Q14
3Q14
-3.0%
-2.0%
-1.0%
0.0%
1.0%
2.0%
3.0%
4.0%
5.0%
2Q13
3Q13
4Q13
1Q14
2Q14
3Q14
7
Strong
Momentum |
 8
Introduction
WHY ... ATTRACTIVE BUSINESSES
* 9 months 2014 Operating Return on Equity
78%
84%
90%
91%
66%
27%
92%
65%
76%
In the US
In the UK
Yet
13.5%
17.1%
18.2%
Operating ROE*
Percent Purchased at Workplace
P
AYCHECK TO
P
AYCHECK
L
IFE
D
ISABILITY
R
ETIREMENT
SAVINGS H
EALTHCARE
U
NUM
US
C
OLONIAL
L
IFE
U
NUM
UK
NEED FOR COVERAGE WORKPLACE IS A POWERFUL
DISTRIBUTION CHANNEL CAPABLE
OF GENERATING ATTRACTIVE FINANCIAL RETURNS
L
ACK
B
ASIC
D
ISABILITY
LACK BASIC DISABILITY
OF CONSUMERS
LIVE
LACK SUFFICIENT LIFE
LACK SUFFICIENT LIFE |
 9
Introduction
WHY�
EXPERIENCED MANAGEMENT TEAM AND HIGHLY ENGAGED EMPLOYEES
Years with Unum
Company Leaders
*
Current
Position
Total
Years In
Financial
Services
Tom Watjen, President & CEO
12 Yrs
20 Yrs
33 Yrs
Rick McKenney, Chief Financial Officer
5 Yrs
5 Yrs
21 Yrs
Jack McGarry, CEO, Closed Block
2 Yrs
29 Yrs
33 Yrs
Mike Simonds, CEO, Unum US
1 Yr
17 Yrs
20 Yrs
Peter O�Donnell, CEO, Unum UK
2 Yrs
4 Yrs
27 Yrs
Randy Horn, CEO, Colonial Life
11 Yrs
11 Yrs
40 Yrs
Tim Arnold, President, Colonial Life
<1 Yr
30 Yrs
30 Yrs
Breege Farrell, EVP, Chief Investment Officer
4 Yrs
4 Yrs
28 Yrs
Joe Foley, SVP, Corp Marketing & PR
8 Yrs
35 Yrs
35 Yrs
Roger Martin, CFO, US Finance
3 Yrs
29 Yrs
29 Yrs
Steve Mitchell, SVP, LTC Actuary
1 Yr
29 Yrs
29 Yrs
Tom White, SVP, Investor Relations
14 Yrs
32 Yrs
32 Yrs
* Represents those leaders in attendance at Investor Meeting
ENGAGEMENT |
 10
Introduction
WHY�
A HISTORY OF TRANSPARENCY AND ADDRESSING ISSUES AS THEY EMERGE
|
 11
Rate Environment
Management Actions
Introduction
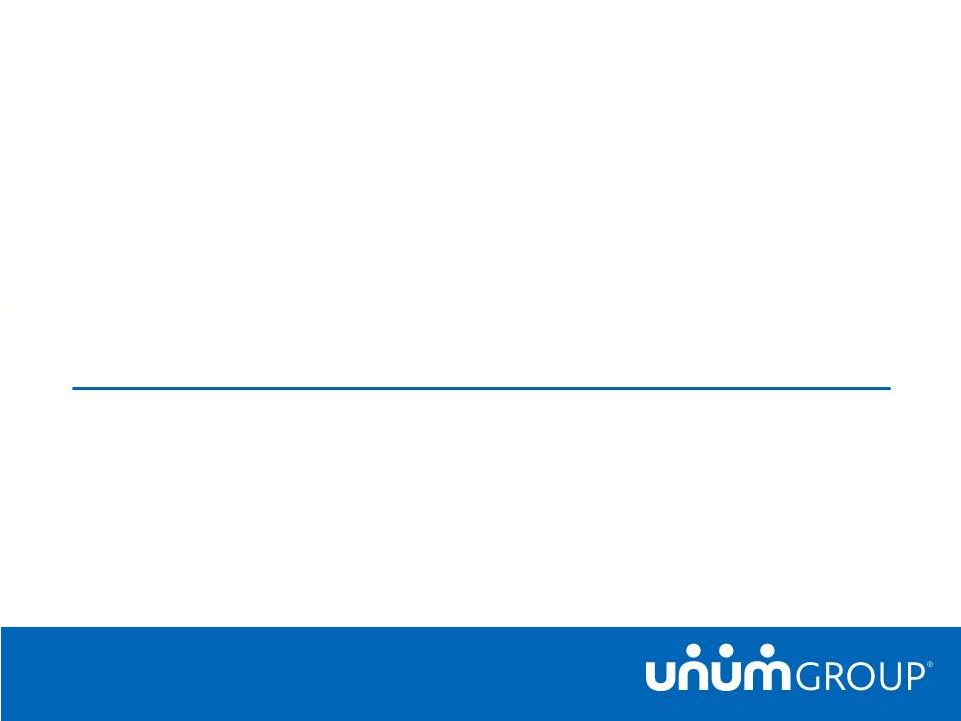
OPERATING IN A LOW INTEREST RATE ENVIRONMENT�
Source: Barclays Capital; U.S. Credit 7-10 years yield to worst, Sterling
Corporate 7-10 years yield to worst
UK-LTD
US-LTD
US-Grp Life
UK-Grp Life
LTC
US-VWB
Colonial Life
CDB
ID-RI
HIGH
RE-PRICING FLEXIBILITY
LOW
HIGH
LOW
2.0
2.5
3.0
3.5
4.0
4.5
5.0
5.5
6.0
6.5
7.0
2010
2011
2012
2013
2014
US
UK |
 12
Introduction
WHY�
A HISTORY OF TRANSPARENCY AND ADDRESSING ISSUES AS THEY EMERGE
|
 13
Action
Expected
in
4Q2014
Strengthen Long-term care GAAP reserves by $600 to $800 million
Implications
Year-end 2014 capital metrics remain within or above our original 2014 outlook
range Includes First Unum (New York) statutory reserve increase of
approximately $150 million No on-going impact on Core Operations (and
minimal impact on Closed Block) 2015 capital management outlook remains
generally consistent with 2014 Introduction
REPOSITION LTC BLOCK� ACTION AND
IMPLICATIONS |
 14
Introduction
CONTINUED STRONG OUTLOOK
*� Consolidated After-Tax Operating Earnings including Corporate
Segment 2015 Outlook
Sales Growth
Premium Growth
Operating
Earnings Growth
Operating ROE
2015
Normalized
2015
Normalized
2015
Normalized
2015
Normalized
Unum US
2-4%
8-10%
4-6%
4-7%
1-3%
4-7%
12-14%
12-14%
Unum UK (�)
7-9%
10-12%
0-2%
4-7%
1-3%
4-7%
16-18%
15-20%
Colonial Life
5-8%
6-8%
2-4%
5-7%
2-4%
4-6%
15-17%
15-17%
Core Operations
4-6%
8-10%
4-6%
4-7%
1-3%
4-7%
13-14%
14-16%
Closed Block
(4-6)%
(4-6)%
(10-12)%
(4-6)%
2-3%
2-3%
Total Operations *
2-4%
3-5%
0-2%
4-7%
10-12%
10-12%
Capital Management
2-3%
4-5%
0-1%
0-1%
TOTAL
2-5%
8-11%
11-12%
11-13% |
 State of the Business |
 Financial Performance |
 17
We continue to expect 2014 full year operating earnings per share growth in our
range of 5% to 10% 4Q2014 operating trends
Sales and premium growth trends remain solid, with continued momentum
Generally solid risk results
Continued pressure on net investment income
o
Includes 50 basis point reduction in LTD new claim discount rate
Potential LTC reserve review implications
Strengthen GAAP reserves by $600 to $800 million
Solid capital position; within or above our original outlook
Includes First Unum (New York) reserve strengthening of approximately $150
million Solid capital generation and return to shareholders
$300 million share repurchases (no share repurchases in 4Q2014)
14% dividend increase
Financial Performance
2014 OUTLOOK |
 18
OPERATING EARNINGS GROWTH
Original 2014 Outlook
5% to 10%
Premium Growth
Risk
Interest Rates
+
+
-
-
Current 2014 Outlook
5% to 10%
Financial Performance
DRIVERS OF 2014 FINANCIAL PERFORMANCE |
 19
Financial Performance
CONSISTENTLY STRONG RETURNS
YTD 2014 Operating Return on Equity
(as of 9/30/14)
18%
12%
20%
8%
14%
34%
YTD % AVERAGE CONSOLIDATED GAAP EQUITY
Unum
US���������������
Group Disability
Unum
US���������������
Group Life and AD&D
Unum US
Supplemental &
Voluntary
Unum UK
Colonial Life
Closed Block
12.1%
16.4%
13.1%
18.2%
17.1%
2.9%
3Q14 YTD Actual
Total
11.0%
Average
equity
excludes
negative
allocation
of
corporate
deficit
and
will
therefore
not
add
to
100% |
 20
Premium Growth
2014
Outlook
YTD
Actual
Unum US
0 �
2%
2.3%
Unum UK (�) 0 �
2%
1.4%
Colonial Life
2 �
4%
3.1%
Total *
1 �
3%
3.1%
Financial Performance
IMPROVING GROWTH IN OUR CORE BUSINESSES
Sales Growth
2014
Outlook
YTD
Actual
Unum US
7 �
10%
18.3%
Unum UK (�) 4 �
7%
0.0%
Colonial Life
4 �
7%
9.0%
Total *
5 �
9%
14.7%
* Total Core Business Segments |
 21
Sales Growth*
Premium Growth*
Financial Performance
IMPROVING GROWTH IN OUR CORE BUSINESSES
12-Month Rolling Sales ($MM)
(4-Year CAGR: 3.5%)
* Core Operations, Excludes the Closed Block
Trendline: 3Q10 �
1Q13
* Core Operations, Excludes the Closed Block
Year-over-Year % Change
(4-Year CAGR: 2.3%)
ACA
Distraction
$1,050
$1,100
$1,150
$1,200
$1,250
$1,300
$1,350
3.0%
2.0%
1.0%
0.0%
1.0%
2.0%
3.0%
4.0%
5.0%
Strong
Momentum
ACA
Distraction
-
-
- |
 22
Financial Performance
STEADY, FAVORABLE RISK EXPERIENCE
*Year to Date through September 30, 2014
UNUM
UK
UNUM
US
COLONIAL
LIFE
BENEFIT RATIOS
�
73.4%
72.5%
72.7%
71.6%
70.3%
2010
2011
2012
2013
2014*
49.7%
51.9%
52.5%
52.5%
51.7%
2010
2011
2012
2013
2014*
67.0%
71.8%
77.9%
74.3%
71.7%
2010
2011
2012
2013
2014*
�
�
Excluding Reserve Adjustments |
 23
($ millions)
Combined Statutory Net Income
*
Financial Performance
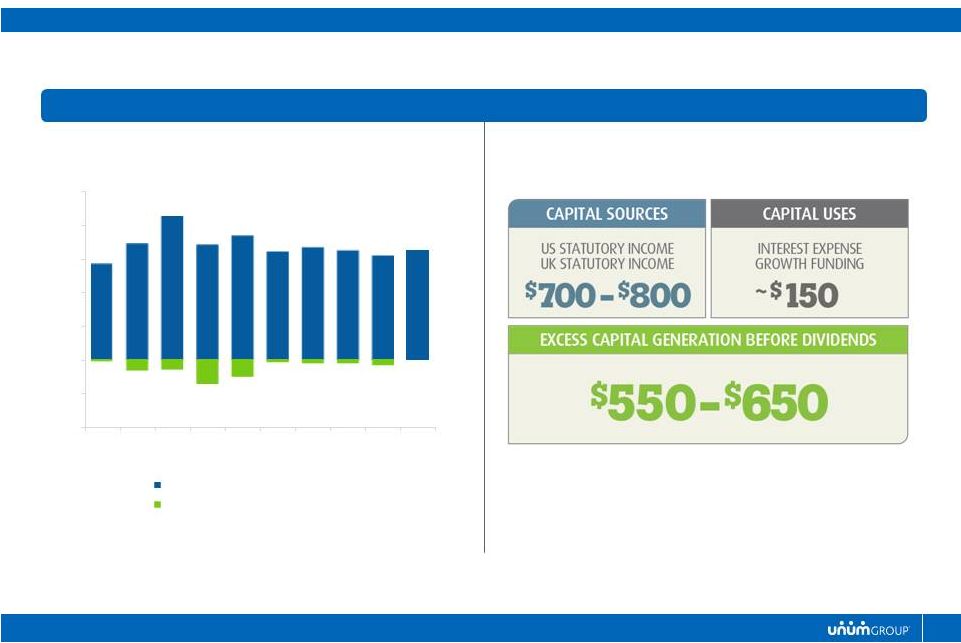
CAPITAL GENERATION
*� Statutory Net Income for traditional US Insurance Companies
�
Estimate
($ millions)
Capital Generation Model
2005
2006
2007
2008
2009
2010
2011
2012
2013
2014�
$0.6
-$8.2
$64.1
$58.3
$141.2
-$102.0
-$16.9
$21.1
-$25.3
-$33.0
-
-
-
-
$574.0
$689.4
$850.3
$682.0
$741.2
$645.7
$664.0
$649.8
$617.5
~ $650.0
After-
tax Operating Income
Net Realized Investment Gains (Losses) |
 24
Financial Performance
ACTIVE CAPITAL DEPLOYMENT
2008
2009
$700 million
---
2010
2011
$356 million
$620 million
$104 million
$105 million
$115 million
$121 million
2012
$500 million
$134 million
TOTAL
$2,796 million*
$883 million
2013
$319 million
$147 million
2014
$301 million*
$157 million
*December 31, 2007 common shares outstanding; Through September 30, 2014.
8.3%
8.3%
12.8%
19.9%
26.4%
29.5%
31.9%
---
+10.0%
+23.3%
+40.0%
+73.3%
+93.3%
+120.0%
�
3Q
quarterly dividend paid
Cumulative
% of
shares*
Cumulative
increase
�
Share Repurchases
Dividends Paid |
 25
Risk Based
Capital
Holding Companies�
Cash and
Marketable Securities
Year-End 2013
405%
$514 million
September 2014
400%
$720 million
Original 2014 Outlook
375% -
400%
>$500 million
Financial Performance
STRONG CAPITAL POSITION |
 Investment Performance |
 27
Asset Quality
Interest Rate Management
Investment Performance |
 (Book Value -
$42.4B)
Invested Asset Distribution
Credit Losses Relative to Moody�s Index
Investment Performance
ASSET QUALITY
Investment grade corporate bonds remain our core holding.
1
Formerly 5.12% due to Lehman; Moody�s has subsequently removed it
Investment
Grade Private
Placements
11.9%
High Yield
7.9%
Cash,
Government
Agencies
7.2%
Municipals
4.1%
Investment
Grade
Corporate
57.3%
Mortgage-
Backed
Securities &
Other
Securitized
Assets
5.4%
Secuirites &
Commercial
Mortgage
Loans
4.3%
Other
Investments
1.9%
0.30%
0.30%
0.30%
0.20%
0.40%
0.45%
0.64%
0.02%
0.05%
0.05%
0.00%
0.00%
0.0%
0.5%
1.0%
1.5%
2.0%
2.5%
3.0%
2008
2009
2010
2011
2012
2013
3Q14
Market
Unum
2.21%
2.63%
1
28 |
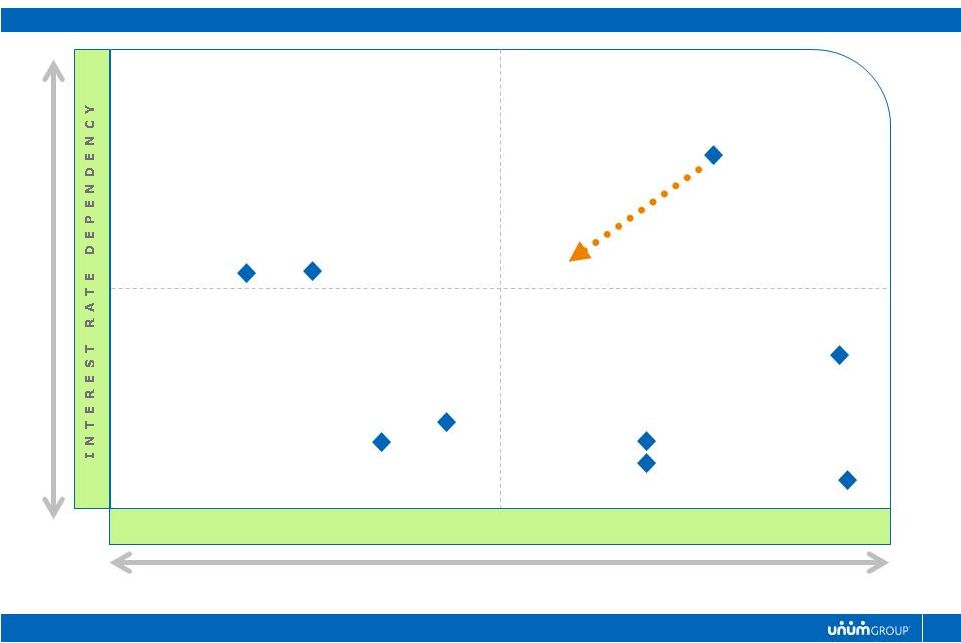
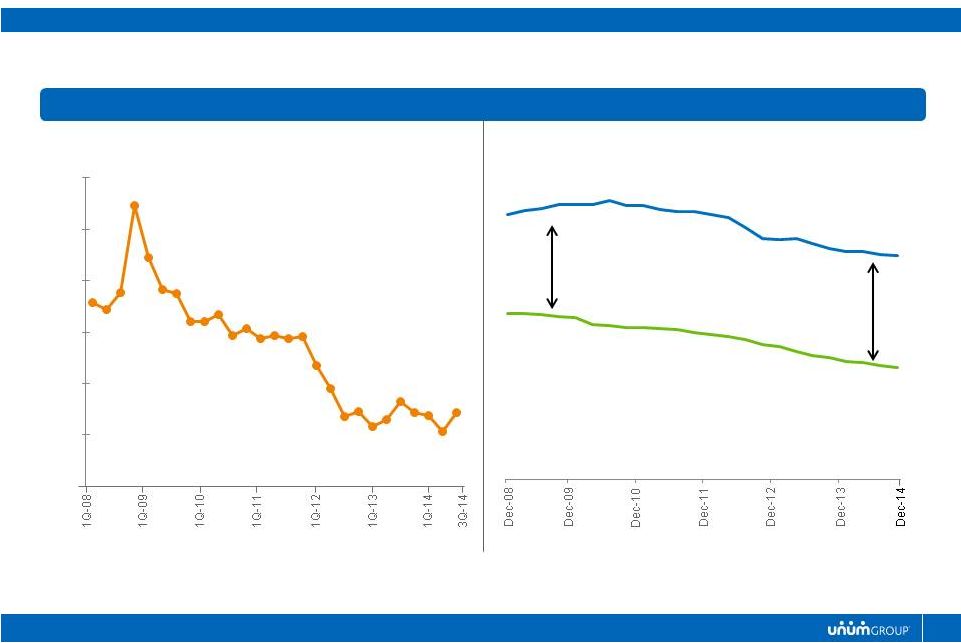
 Barclays Single-A Intermediate OAS
10-Year Treasury
Investment Grade Bond Spreads
Investment Performance
IMPLICATIONS OF LOW INTEREST RATES
3.00%
2.50%
1.00%
0.00%
3.50%
2.00%
1.50%
0.50%
2.50%
1.00%
0.00%
2.00%
1.50%
0.50%
29 |
 30
Pricing Flexibility
Discount Rate Adjustments
Manageable Investable Cash Flows
Disciplined Asset Selection
Investment Performance
MANAGING LOW INTEREST RATES |
 31
Investment Performance
PRODUCT LINE SENSITIVITIES
UK-LTD
US-LTD
US-Grp Life
UK-Grp Life
LTC
US-VWB
Colonial Life
CDB
ID-RI
LOW
HIGH
LOW
HIGH
R
E
-
P
R
I
C
I
N
G
F
L
E
X
I
B
I
L
I
T
Y |
 32
(Target Margin = 60 bps)
Total Portfolio Purchase Yields
Unum US LTD
Investment Performance
PURCHASE YIELDS AND MARGINS
3.0%
4.0%
5.0%
6.0%
7.0%
8.0%
9.0%
Portfolio Yield
Liability
Discount Rate
81 bps
91 bps |
 33
Investment Performance
MANAGEABLE INVESTABLE CASH FLOW
Unum US -
LTD
Colonial
ID �
Closed Block
Long-term Care
$8.8
billion
$900
million
$45.6
billion
$240
million
$8.2
billion
$2.6
billion
$270
million
$9.1
billion
$75
million
Unum -
Combined
Unum US �
ID -
Recently Issued
$2.1
billion
$90
million
$3.0
billion
Portfolio Size
2015 Investable Cash Flow
Portfolio Size
2015 Investable Cash Flow
Portfolio Size
2015 Investable Cash Flow
Portfolio Size
2015 Investable Cash Flow
Portfolio Size
2015 Investable Cash Flow
Portfolio Size
2015 Investable Cash Flow |
 Closed Block |
 35
Closed Block
BUSINESS SNAPSHOT
Legacy Discontinued Blocks
Individual Disability
Long Term Care
Distribution
IDI Sales discontinued in mid-1990�s
ILTC Sales discontinued in 2009
GLTC Sales discontinued in 2011
Size and Scale
Total Reserves of $29 billion
GAAP Equity of $2.9 billion
325 Claims Management resources
Closed
Block
*
Premium Income
$1.3 billion
Before Tax Operating Income
$119 million
Operating Return on Equity
2.8%
* 4 Quarters Ending 9/30/2014
50%
50%
Premium Distribution
*
($m)
Individual Disability
Long Term Care |
 36
We are conducting a comprehensive review of all assumptions underlying our Long
Term Care reserves.
Potential GAAP Impacts:
Before-tax charge of $600 million to $800 million anticipated.
Primarily attributable to reduction in the discount rate in response to current
low interest rate environment.
Potential Statutory Impacts:
First Unum (New York) reserve strengthening of approximately $150 million.
Negligible impact on future statutory earnings and free cash flow generation.
Closed Block
2014 LONG TERM CARE RESERVE REVIEW |
 37
Operational Effectiveness
High quality claims management
Cost efficient customer service capabilities
Effective implementation of approved rate increases
LTC Rate Increases
Continue to pursue justified rate increases
Offer enhanced policyholder options
Lead regulatory outreach program
Financial Analysis
Use new experience analysis tools to manage the blocks
Capital Management
Invest in modeling and analytical capabilities
Monitor capital markets development
Closed Block
2015 KEY PRIORITIES |
 38
Closed Block
2015 FINANCIAL OUTLOOK
2015 Outlook
Normalized
Sales Growth
N/A
N/A
Premium Growth
(4 -
6)%
(4 -
6)%
Operating Earnings Growth
(10 �
12)%
(4 -
6)%
Operating ROE
2 -
3%
2 -
3% |
 2015 Outlook |
 40
Continued favorable premium growth trends
Persistency remains stable
Expect generally stable risk results through disciplined pricing, risk selection
and renewals
Full year impact of Group LTD 4Q discount rate adjustment
Continued Pressure on net investment income from lower investment yields
Operating EPS growth of 2% to 5%
Continued steady capital generation and deployment:
$400 to $600 million of share repurchases
Increasing dividend
2015 Outlook
KEY MESSAGES |
 41
2015 Outlook
FACTORS IMPACTING OUR 2015 OUTLOOK
+2-3%
+4-5%
(3-4)%
0-(1)%
2%
to
5%
Growth
0%
Premium Growth
and Favorable Risk
Yield and Discount
Rate Pressure
Closed Block, Tax
and Other
Capital
Management
2015 Outlook |
 42
2015 Outlook
CAPITAL OUTLOOK
Capital Management Criteria
Sept 2014
2014 Projection
2015
Projection
Risk-Based Capital Ratio for Traditional U.S.
Insurance Companies
400%
~400%
Holding
Companies�
Cash
and
Marketable Securities ($ millions)
$720
>$500
>$500
375%
-
400% |
 43
2015 Outlook
BUSINESS SEGMENT OUTLOOK
*� Consolidated After-Tax Operating Earnings including Corporate
Segment Sales
Growth
Premium
Growth
Operating
Earnings
Growth
Operating
ROE
Unum US
2 -
4%
4 -
6%
1
-
3%
12 -
14%
Unum UK (�)
7 -
9%
0 -
2%
1 -
3%
16 -
18%
Colonial Life
5 -
8%
2 -
4%
2 -
4%
15 -
17%
Core Operations
4 -
6%
4 -
6%
1 -
3%
13 -
14%
Closed Block
(4
-
6)%
2 -
3%
Total Operations*
2 -
4%
0 -
2%
10 -
12%
Capital Management
2 -
3%
0 -
1%
Total
2 -
5%
11 -
12%
(10 -
12)% |
 Questions & Answers |
 Core Business Segment Overviews |
 Unum US |
 47
Unum US
BUSINESS SNAPSHOT
Employee Benefits
Group Long Term and Short Term Disability
Group Life and AD&D
Voluntary Benefits
Individual Disability Benefits
Market Characteristics
Top 3 market share position across all major
product categories
Strong need for financial protection,
increasing due to healthcare changes
Technology enabling new distribution
Unum US
*
Earned Premium
$4.6 billion
Before Tax Operating Income
$861 million
Operating Return on Equity
13.6%
* 4 Quarters Ending 9/30/2014
+18%� Growth
44%
21%
28%
7%
Sales Distribution*
(Trailing 4 Quarters Growth)
Core Group (<2,000 ee's)
Large Employer Group
(>2,000 ee's)
Voluntary Benefits
IDI-Recently Issued
+5% Growth
+15% Growth
+17% Growth |
 48
Broad & Diverse Client Base
Strong service �
93% client satisfaction
Unmatched expertise �
2,500 benefits
professionals
Disciplined pricing & underwriting using
largest, most diverse private data set
Strong persistency �
90% YTD 2014
Predictable benefit ratios
Accelerating growth with additional
opportunity in existing client base; ~2.5
products per client today vs ~7 per fully
integrated client
Unum US
UNIQUE IN FINANCIAL PROTECTION EMPLOYEE BENEFITS
Industry Leading Performance
Industry Leading Capabilities
LTD Employer Clients for Top 5 Carriers
<100 Employees
44% of Fortune 100
With Unum Benefits
Source:� GenRe 2013
AND
44,000
27,000
20,000
19,000
12,000
UNM
#2
#3
#4
#5 |
 49
Unum US
GROWTH BY ENGAGING CLIENTS AND THEIR EMPLOYEES
ACA
Distraction
% of Sales with
Employee Contribution
12-Month
Rolling Sales ($MM)
% of Sales from
Existing Clients
Opportunities Within Existing
Client Base
6.5%
(CAGR)
Market Moving to
Employee Pay
Improving Sales
Momentum
100%
100%
$600
$650
$700
$750
$800
$850
$900
52%
56%
60%
63%
63%
2010
2011
2012
2013
3Q14
46%
31%
54%
69%
2003
2013
Employer
Employee |
 50
Strong growth momentum
Continued strong persistency with deeper relationships
Strong
sales
growth
within
existing
clients,
partially
offset
by
our
expectation
that
new
large
case
sales will not duplicate 2014
Stable
risk
environment
as
the
economy
gradually
improves
Operating Efficiency gains
based on service model and cross-business centers of
excellence
Continued
pricing
discipline
to
mitigate
interest
rate
pressures
Continued
investment
in
our
franchise
Active client management and a differentiated integrated experience across Group,
VB and IDI Consumer marketing, new enrollment and self service
technologies Building on key product and distribution partnerships including
40+ benefit administration/enrollment platform connects
Unum US
2015 BUSINESS OUTLOOK |
 51
2015 Growth Outlook
Unum US
INTEREST RATE IMPACT TO 2015 OUTLOOK
2014 BTOE
Growth
Risk &
Operating
Expense
NII & Discount
Rate
2015 BTOE
4%-6%
4%-6%
(7%-9%)
1%-3% |
 52
Unum US
2015 FINANCIAL OUTLOOK
* 6-8% excluding large employer group
2015 Outlook
Normalized
Sales Growth*
2
-
4%
8
-
10%
Premium Growth
4 -
6%
4 -
7%
Operating Earnings Growth
1 -
3%
4 -
7%
Operating ROE
12
-
14%
12
-
14% |
 Unum UK |
 54
Unum UK
BUSINESS SNAPSHOT
Primary Products
Group Income Protection
Group Life and Group Dependents
Supplementary and Voluntary products:
Group Critical Illness, Individual Income
Protection (Closed)
Market Share
# 1 Group Income Protection
# 4 Group Life
# 3 Group Critical Illness
Market Scope
Over 10,000 employers served
Over 1.5 million employees insured
* * Calculated in U.S. dollars
*�� 4 Quarters Ending 9/30/2014
69%
21%
10%
Premium Distribution
*
(�m)
Group Income
Protection
Group Life and
Critical Illness
Supplemental and
Voluntary
Unum UK
*
�360 million
Before Tax Operating Income
�88 million
Operating Return on Equity
18.6%**
Earned Premium |
 55
Unum UK
STRATEGY
Deliver Industry-leading Customer Experience
Grow Group
Income
Protection
Market
Grow Group
Risk Block
Introduce
Related
Products and
Services
Simplify our Processes and Operations
Develop Talent and Leadership
Capital Management Strategy |
 56
Unum UK
2015 BUSINESS OUTLOOK
Primary focus remains expanding the UK
Group Income Protection market.
Re-pricing and re-positioning of our group
life block is complete. We are now
looking to grow our group risk business:
Develop the UK short-term disability
market via Sick Pay Insurance product
Prudently target attractive segments of
the Group Life market
Launch updated value proposition to
grow our Group Critical Illness block
We will explore opportunities outside the
traditional UK product and distribution
channel to expand our offering
We will continue to deploy reinsurance
where appropriate and economic to help
manage risk
During 2015 we are investing in the technology required to accelerate growth and
improve operational efficiencies, while continuing to place rate to offset
interest rate pressures. 225
250
275
2013
2014 (FC)
2015 (P)
Group Income Protection
70
90
110
130
2013
2014 (FC)
2015 (P)
Group Life
(ex Dependents) |
 57
Unum UK
2015 KEY PRIORITIES
Expand the Market
Focus on education and CRM to grow the Group Income Protection market
Become provider of choice for brokers across all group risk products
Explore portfolio diversification opportunities
Build Capabilities to Enable Profitable Growth
Simplify and streamline our operations
Enhance the productivity of our brokerage distribution channel
Explore demand-generation approaches, partnerships and new products
Leverage corporate expertise and capabilities
Risk Management
Maintain efficient and economical reinsurance arrangements
Prepare the business for transition to Solvency II capital requirements starting
in 2016 Continue underwriting and pricing discipline to mitigate interest
rate pressures |
 58
Unum UK
2015 FINANCIAL OUTLOOK
2015 Outlook
Normalized
Sales Growth
7 -
9%
10 -
12%
Premium Growth
0 -
2%
4 -
7%
Operating Earnings Growth
1 -
3%
4 -
7%
Operating ROE
16 -
18%
15 -
20% |
 Colonial Life |
 60
Colonial Life
BUSINESS SNAPSHOT
Colonial
Life
***
Earned Premium
$1.26 billion
Before Tax Operating Income
$295 million
Operating Return on Equity
16.9%
* * Sales Premium as of 9/30/2014
* * * 4 Quarters Ending 9/30/2014
* Market share based on Eastbridge U.S. Worksite /Voluntary Carrier Sales Report
for 2013 +5% Growth
+4% Growth
+29% Growth
38%
32%
12%
18%
Sales
Distribution
**
(YTD 2014 Growth)
Small Commercial
(< 100 ee's)
Med. Commercial
(100 to 999 ee's)
Large Commercial
(1,000+ ee's)
Public Sector
+12% Growth
Primary Products
Accident, Sickness and Disability
Life (Term, UL, WL)
Cancer and Critical Illness
Market Share
*
# 5 Voluntary Carrier with 6% market share
Product Sales:
o
# 2 in STD and� Cancer
o
# 3 in Accident
o
# 4 in Hospital Indemnity, UL & WL, and Critical Illness
Size and Scale
Over 80,000 businesses served
Over 3 million policies in force
Over 10,000 career agents and 14,000 brokers under
contract |
 61
Colonial Life
2015 BUSINESS OUTLOOK
Our 2014 sales success points to execution of our strategic initiatives and
investments in sales leadership, distribution effectiveness and sales
support. Strong sales fundamentals through third quarter 2014:
o
New accounts up 9%
o
New account sales up 17% and existing account sales up 6%
o
New rep recruits up 19%
o
New rep sales up 42%
Positive sales trends are continuing into fourth quarter
Key drivers in our 2015 plan:
Current market environment offers considerable opportunities to meet emerging
needs of employers, brokers, and consumers.
Positive sales momentum from 2014 and the potential in our target markets.
Sustained improvement in distribution effectiveness.
Four
key
areas
of
focus
�
growth,
customer
experience,
productivity,
and
talent.
Achieving our 2015 growth objectives will be supported by a continued focus on
third- party connectivity, enrollment solutions, service capabilities and
operational excellence.
2015 operating earnings growth is expected to be in the 2-4% range, with
continued strong profit margins and operating ROE levels.�
|
 62
Colonial Life
2015
PLAN
DRIVERS
-
MARKETPLACE
Provide solutions for employers to contain costs, administer benefits
and help employees make benefits decisions
Focus on small employers to expand the market and offset broker exit
Employers
Leverage broad expertise and partnerships to offer flexible, turnkey
enrollment solutions
Attract local and regional brokers adding voluntary to their portfolios
Brokers
Improve decision support tools and package products to drive
participation and penetration
Invest in customer service and mobile capabilities to improve retention
Consumers |
 63
Colonial Life
2015 KEY PRIORITIES
Grow distribution footprint through sales organization and alliances
Achieve balanced sales among target markets
Introduce new and updated products
Growth
Reduce customer effort for consumers and partners
Enhance administration capabilities for group and individual products
Deliver better experiences through web-based services
Customer
Experience
Leverage cross-enterprise assets
Improve tools to incrementally drive efficiency
Enable partners to more easily connect with us
Productivity
Build upon investment in sales leadership and talent profiles
Drive leadership development throughout the organization
Emphasis on collaboration and empowerment
Talent |
 64
Colonial Life
2015 FINANCIAL OUTLOOK
2015 Outlook
Normalized
Sales Growth
5 -
8%
6 -
8%
Premium Growth
2 -
4%
5 -
7%
Operating Earnings Growth
2 -
4%
4 -
6%
Operating ROE
15 -17%
15 -17% |
 Closing Comments |
 66
Good operating businesses with positive long-term trends
An intense focus on the management of our closed block
Solid financial foundation and predictable cash flow remain an asset
We
are
confident
we
are
taking
the
actions
needed
to
continue
to
build
value
Closing Comments
�
�and a commitment to disciplined growth
�
�consistent with our history with these types of issues
�
�leading to significant financial flexibility
�
�just as we have done in the past |
 67
Closing Comments
CONTINUED STRONG OUTLOOK
*� Consolidated After-Tax Operating Earnings including Corporate
Segment 2015 Outlook
Sales Growth
Premium Growth
Operating
Earnings Growth
Operating ROE
2015
Normalized
2015
Normalized
2015
Normalized
2015
Normalized
Unum US
2-4%
8-10%
4-6%
4-7%
1-3%
4-7%
12-14%
12-14%
Unum UK (�)
7-9%
10-12%
0-2%
4-7%
1-3%
4-7%
16-18%
15-20%
Colonial Life
5-8%
6-8%
2-4%
5-7%
2-4%
4-6%
15-17%
15-17%
Core Operations
4-6%
8-10%
4-6%
4-7%
1-3%
4-7%
13-14%
14-16%
Closed Block
(4-6)%
(4-6)%
(10-12)%
(4-6)%
2-3%
2-3%
Total Operations *
2-4%
3-5%
0-2%
4-7%
10-12%
10-12%
Capital Management
2-3%
4-5%
0-1%
0-1%
TOTAL
2-5%
8-11%
11-12%
11-13% |
 Questions & Answers |
 Appendix
Reconciliation of Non-GAAP Financial Measures |
  70
Appendix
RECONCILIATION OF NON-GAAP FINANCIAL MEASURES
After-Tax
Average
Operating
Allocated
Annualized
Earnings (Loss)
Equity*
Operating Return
On Equity
Nine Months Ended September 30, 2014
Unum US
Group Disability
138.9
$�����������������
��������� 1,528.2
$�������������
12.1%
Group Life and Accidental Death and Dismemberment
119.8
�����������������
����������� 974.7
�����������������
� 16.4%
Supplemental and Voluntary
163.2
�����������������
����������� 1,655.9
���������������
13.1%
Total Unum US
421.9
�����������������
����������� 4,158.8
$�������������
13.5%
Unum UK
87.1
�����������������
������������� 636.4
�����������������
� 18.2%
Colonial Life
146.9
�����������������
����������� 1,148.6
���������������
17.1%
Closed Block
61.1
�����������������
������������� 2,780.1
���������������
2.9%
Corporate
(35.4)
�����������������
������������ (461.1)
�����������������
Total
681.6
$�����������������
��������� 8,262.8
$�������������
11.0%
* Excludes unrealized gain on securities and net gain on cash flow hedges and is calculated using the
stockholders' equity balances presented below. (in millions)
Nine Months Ended
September 30, 2014*
2013
2012
2011
2010
2009
2008
2007**
2006**
2005**
2004**
After-tax Operating Earnings
2.64
$�������������
��������������
3.32
$�������������
���� 3.15
$�������������
���� 2.98
$�������������
���� 2.73
$�������������
���� 2.64
$�������������
���� 2.54
$�������������
���� 2.25
$�������������
���� 1.85
$�������������
���� 1.69
$�������������
���� 1.78
$�������������
���� Net Realized Investment Gain (Loss), Net of Tax
0.10
0.02
0.13
(0.01)
0.05
-
(0.89)
(0.12)
0.01
(0.02)
0.06
Non-operating Retirement-related Loss, Net of Tax
(0.01)
(0.08)
(0.11)
(0.07)
(0.06)
(0.09)
(0.03)
(0.04)
(0.05)
(0.05)
(0.04)
Costs Related to Early Retirement of Debt, Net of Tax
(0.04)
-
-
-
-
-
-
-
-
-
-
Deferred Acquisition Costs and Reserve Charges for
Closed Block, Net of Tax
-
-
-
(2.04)
-
-
-
-
-
-
(2.37)
Regulatory Reassessment Charges, Net of Tax
-
-
-
-
-
-
-
(0.10)
(0.79)
(0.16)
(0.29)
Special Tax Items and Debt Extinguishment Costs
-
-
-
0.08
(0.03)
-
-
(0.10)
0.23
0.14
0.17
Unclaimed Death Benefits Reserve Increase, Net of Tax
-
(0.24)
-
-
-
-
-
-
-
-
-
Group Life Waiver of Premium Benefit Reserve
Reduction, Net of Tax
-
0.21
-
-
-
-
-
-
-
-
-
Other, Net of Tax
-
-
-
-
-
-
-
-
(0.04)
0.01
0.01
Income from Continuing Operations
2.69
3.23
3.17
0.94
2.69
2.55
1.62
1.89
1.21
1.61
(0.68)
Income from Discontinued Operations
-
-
-
-
-
-
-
0.02
0.02
0.03
(0.18)
Net Income (Loss)
2.69
$�������������
��������������
3.23
$�������������
���� 3.17
$�������������
���� 0.94
$�������������
���� 2.69
$�������������
���� 2.55
$�������������
���� 1.62
$�������������
���� 1.91
$�������������
���� 1.23
$�������������
���� 1.64
$�������������
���� (0.86)
$�������������
��� * Assuming dilution per share.
** Does not reflect the impact of ASU 2010-26.
September 30
2014
2013
2012
2011
2010
2009
2008
2007**
2006**
2005**
2004**
Total Stockholders' Equity (Book Value)
36.69
$�������������
������������
33.30
$�������������
�� 31.87
$�������������
�� 27.91
$�������������
�� 26.80
$�������������
�� 24.25
$�������������
�� 17.94
$�������������
�� 22.28
$�������������
�� 22.53
$�������������
�� 24.66
$�������������
�� 24.36
$�������������
�� Net Unrealized Gain (Loss) on Securities
1.83
0.52
3.23
2.11
1.31
1.16
(2.53)
0.99
1.56
3.49
4.41
Net Gain on Cash Flow Hedges
1.52
1.52
1.48
1.39
1.14
1.12
1.38
0.50
0.57
0.91
0.80
Subtotal
33.34
31.26
27.16
24.41
24.35
21.97
19.09
20.79
20.40
20.26
19.15
Foreign Currency Translation Adjustment
(0.27)
(0.18)
(0.26)
(0.41)
(0.34)
(0.23)
(0.52)
0.35
0.34
0.07
0.33
Subtotal
33.61
31.44
27.42
24.82
24.69
22.20
19.61
20.44
20.06
20.19
18.82
Unrecognized Pension and Postretirement Benefit Costs
(0.91)
(0.88)
(2.13)
(1.51)
(1.00)
(1.00)
(1.23)
(0.55)
(0.68)
(0.58)
(0.55)
Total Stockholders' Equity, Excluding Accumulated
Other Comprehensive Income
34.52
$�������������
������������
32.32
$�������������
�� 29.55
$�������������
�� 26.33
$�������������
�� 25.69
$�������������
�� 23.20
$�������������
�� 20.84
$�������������
�� 20.99
$�������������
�� 20.74
$�������������
�� 20.77
$�������������
�� 19.37
$�������������
�� Year Ended December 31*
December 31
(per share) |
  71
Appendix
RECONCILIATION OF NON-GAAP FINANCIAL MEASURES
Nine Months Ended
September 30, 2014
After-tax Operating Earnings
681.6
$�����������������
��������� Net Realized Investment Gain, Net of
Tax 24.0
�����������������
������������� Non-operating
Retirement-related Loss, Net of Tax (2.7)
�����������������
�������������� Costs
Related to Early Retirement of Debt, Net of Tax (10.4)
�����������������
������������ Net Income
692.5
$�����������������
��������� Four Quarters Ended
September 30, 2014
(in millions)
Operating Income (Loss) by Segment
Unum US
861.0
$�����������������
��������� Unum UK
145.5
�����������������
����������� Colonial Life
295.3
�����������������
����������� Closed Block
119.4
�����������������
����������� Corporate
(142.7)
�����������������
���������� Total Before Tax Operating
Earnings 1,278.5
�����������������
�������� Net Realized Investment Gain
42.7
�����������������
������������� Non-operating
Retirement-related Loss (6.6)
�����������������
�������������� Costs
Related to Early Retirement of Debt (13.2)
�����������������
������������ Unclaimed Death Benefits
Reserve Increase (95.5)
�����������������
������������ Group Life Waiver of
Premium Benefit Reserve Reduction 85.0
�����������������
������������� Income Tax
(377.2)
�����������������
���������� Net Income
913.7
$�����������������
��������� After-Tax
Average
Operating
Allocated
Annualized
Earnings (Loss)
Equity*
Operating Return
On Equity
Four Quarters Ended September 30, 2014
Unum US
564.2
$�����������������
��������� 4,153.4
$�������������
13.6%
Unum UK
116.8
�����������������
����������� 629.6
�����������������
� 18.6%
Colonial Life
192.0
�����������������
����������� 1,138.5
���������������
16.9%
Closed Block
78.2
�����������������
������������� 2,747.9
���������������
2.8%
Corporate
(45.8)
�����������������
������������ (547.5)
�����������������
Total
905.4
$�����������������
��������� 8,121.9
$�������������
* Excludes unrealized gain on securities and net gain on cash flow hedges and is calculated using the
stockholders' equity balances presented below. (in millions) |
 72
Appendix
RECONCILIATION OF NON-GAAP FINANCIAL MEASURES
Four Quarters Ended
September 30, 2014
(in millions)
After-tax Operating Income
905.4
$����������������
Net Realized Investment Gain, Net of Tax
29.8
�����������������
���� Non-operating Retirement-related Loss, Net of Tax
(4.2)
�����������������
����� Costs Related to Early Retirement of Debt, Net of Tax
(10.4)
�����������������
�� Unclaimed Death Benefits Reserve Increase, Net of Tax
(62.1)
�����������������
�� Group Life Waiver of Premium Benefit Reserve Reduction, Net of Tax
55.2
�����������������
���� Net Income
913.7
$����������������
September 30
December 31
September 30
2014
2013
2013
Total Stockholders' Equity, As Reported
9,244.0
$�����������������
����� 8,659.1
$�������������
8,669.9
$�������������
Net Unrealized Gain on Securities
462.0
�����������������
����������� 135.7
�����������������
� 427.4
�����������������
� Net Gain on Cash Flow Hedges
383.5
�����������������
����������� 396.3
�����������������
� 397.2
�����������������
� Total Stockholders' Equity, As Adjusted
8,398.5
$�����������������
����� 8,127.1
$�������������
7,845.3
$�������������
Average Stockholders' Equity Excluding Net Unrealized
Gain on Securities and Net Gain on Cash Flow Hedges:
YTD September 30, 2014
8,262.8
$�����������������
����� Four Quarters Ended September 30, 2014
8,121.9
$�����������������
����� benefit ratio
benefit ratio
Year Ended December 31, 2013
Premium Income
4,517.1
$�����������������
����� 1,232.2
$�������������
Benefits and Change Reserves for Future Benefits
3,222.4
�����������������
�������� 667.0
�����������������
� Unclaimed Death Benefits Reserve Increase
(75.4)
�����������������
������������ (20.1)
�����������������
�� Group Life Waiver of Premium Benefit Reserve Reduction
85.0
�����������������
������������� -
�����������������
�������� Benefits and Change in Reserves for Future
Benefits, Excluding Reserve Adjustments
3,232.0
�����������������
�������� 71.6%
646.9
�����������������
� 52.5%
Unum US
Colonial Life
(in millions) |
Serious News for Serious Traders! Try StreetInsider.com Premium Free!
You May Also Be Interested In
- Relay Resources Welcomes New Chief Revenue Officer to Leadership Team
- HRT Class Action Notice: Robbins LLP Reminds Stockholders of the Lead Plaintiff Deadline in the HireRight Holdings Corp. Class Action
- NorthWestern Reports First Quarter 2024 Financial Results
Create E-mail Alert Related Categories
SEC FilingsSign up for StreetInsider Free!
Receive full access to all new and archived articles, unlimited portfolio tracking, e-mail alerts, custom newswires and RSS feeds - and more!
