

Form 8-K US BANCORP \DE\ For: May 18
 Tweet
Tweet Share
Share
UNITED STATES
SECURITIES AND EXCHANGE COMMISSION
WASHINGTON, D.C. 20549
FORM 8-K
CURRENT REPORT
PURSUANT TO SECTION 13 OR 15(d)
OF THE SECURITIES EXCHANGE ACT OF 1934
Date of Report: May 18, 2015
(Date of earliest event reported)
U.S. BANCORP
(Exact name of registrant as specified in its charter)
Delaware
(State or other jurisdiction of incorporation)
| 1-6880 | 41-0255900 | |
| (Commission file number) | (IRS Employer Identification No.) |
800 Nicollet Mall
Minneapolis, Minnesota 55402
(Address of principal executive offices, including zip code)
(651) 466-3000
(Registrant’s telephone number, including area code)
Not Applicable
(Former name or former address, if changed since last report)
Check the appropriate box below if the Form 8-K filing is intended to simultaneously satisfy the filing obligation of the registrant under any of the following provisions:
| ¨ | Written communications pursuant to Rule 425 under the Securities Act (17 CFR 230.425) |
| ¨ | Soliciting material pursuant to Rule 14a-12 under the Exchange Act (17 CFR 240.14a-12) |
| ¨ | Pre-commencement communications pursuant to Rule 14d-2(b) under the Exchange Act (17 CFR 240.14d-2(b)) |
| ¨ | Pre-commencement communications pursuant to Rule 13e-4(c) under the Exchange Act (17 CFR 240.13e-4(c)) |
| Item 7.01 | Regulation FD Disclosure. |
As previously announced, Andrew Cecere, U.S. Bancorp’s Vice Chairman and Chief Operating Officer, and Kathleen A. Rogers, U.S. Bancorp’s Vice Chairman and Chief Financial Officer, will make a presentation at the Barclays Americas Select Franchise Conference in London, England, at 8:30 a.m. local time (2:30 a.m. Central time) on Tuesday, May 19, 2015. A copy of the presentation slides, which will be discussed during the presentation, is attached hereto as Exhibit 99.1. These slides can also be accessed on U.S. Bancorp’s website at usbank.com by clicking on “About U.S. Bank” and then “Webcasts & Presentations” under the “Investor/Shareholder Information” heading, which is located at the left side of the bottom of the page. A live audio webcast of the presentation can also be accessed at this location on the website, and a replay of the webcast will be available at the same location on the website and will remain posted for 90 days.
The information in this Current Report on Form 8-K, including Exhibit 99.1 attached hereto, is being furnished and shall not be deemed “filed” for purposes of Section 18 of the Securities Exchange Act of 1934, as amended, or otherwise subject to the liabilities of that Section. The information in this Current Report on Form 8-K, including Exhibit 99.1 attached hereto, shall not be incorporated by reference into any registration statement or other document pursuant to the Securities Act of 1933, except as otherwise expressly stated in such filing.
| Item 9.01 | Financial Statements and Exhibits. |
| (d) | Exhibits. |
| 99.1 | Barclays Americas Select Franchise Conference Slides |
2
SIGNATURE
Pursuant to the requirements of the Securities Exchange Act of 1934, the registrant has duly caused this report to be signed on its behalf by the undersigned hereunto duly authorized.
| U.S. BANCORP | ||
| By: | /s/ James L. Chosy | |
| James L. Chosy Executive Vice President, General Counsel and Corporate Secretary | ||
Date: May 18, 2015
3
 Barclays Americas Select
Franchise Conference 2015
Andy Cecere
Vice Chairman and COO
Kathy Rogers
Vice Chairman and CFO
May 19, 2015
Exhibit 99.1 |
 2
Forward-looking Statement
and Additional Information
The
following
information
appears
in
accordance
with
the
Private
Securities
Litigation
Reform
Act
of
1995:
This presentation contains forward-looking statements about U.S. Bancorp.
Statements that are not historical or current facts, including statements
about beliefs and expectations, are forward-looking statements and are based on the information available to, and assumptions and
estimates
made
by,
management
as
of
the
date
made.
These
forward-looking
statements
cover,
among
other
things,
anticipated
future
revenue
and
expenses
and
the
future
plans
and
prospects
of
U.S.
Bancorp.
Forward-looking
statements
involve
inherent
risks
and
uncertainties,
and
important factors could cause actual results to differ materially from those
anticipated. A reversal or slowing of the current economic recovery or
another
severe
contraction
could
adversely
affect
U.S.
Bancorp’s
revenues
and
the
values
of
its
assets
and
liabilities.
Global
financial
markets
could experience a recurrence of significant turbulence, which could reduce the
availability of funding to certain financial institutions and lead to
a
tightening
of
credit,
a
reduction
of
business
activity,
and
increased
market
volatility.
Stress
in
the
commercial
real
estate
markets,
as
well
as
a
downturn
in
the
residential
real
estate
markets,
could
cause
credit
losses
and
deterioration
in
asset
values.
In
addition,
U.S.
Bancorp’s
business
and financial performance is likely to be negatively impacted by
recently enacted and future legislation and regulation. U.S. Bancorp’s
results could also be adversely affected by deterioration in general
business and economic conditions; changes in interest rates; deterioration in the
credit quality of its loan portfolios or in the value of the collateral securing
those loans; deterioration in the value of securities held in its investment
securities portfolio; legal and regulatory developments; litigation; increased competition from both banks and non-banks; changes in
customer behavior and preferences; breaches in data security; effects of mergers
and acquisitions and related integration; effects of critical accounting
policies and judgments; and management’s ability to effectively manage credit risk, residual value risk, market risk, operational risk,
compliance risk, strategic risk, interest rate risk, liquidity risk and
reputational risk. For discussion of these and other risks that may cause
actual results to differ from expectations, refer to U.S. Bancorp’s Annual Report on
Form 10-K for the year ended December 31, 2014, on file with the Securities and
Exchange Commission, including the sections entitled “Risk
Factors”
and “Corporate Risk Profile”
contained in Exhibit 13, and all subsequent filings with the Securities and
Exchange Commission under Sections 13(a), 13(c), 14 or 15(d) of the
Securities Exchange Act of 1934. Forward-looking statements speak only as of the date they are made,
and U.S. Bancorp undertakes no obligation to update them in light of new
information or future events. This
presentation
includes
non-GAAP
financial
measures
to
describe
U.S.
Bancorp’s
performance.
The
calculations
of
these
measures
are
provided within or in the appendix of the presentation. These disclosures
should not be viewed as a substitute for operating results determined in
accordance with GAAP, nor are they necessarily comparable to non-GAAP performance measures that may be presented by other
companies. |
 3
Agenda
Overview
Business Lines
Financial Management
Capital Management
Long-term Goals
2Q15 Update |
 4
U.S. Bancorp |
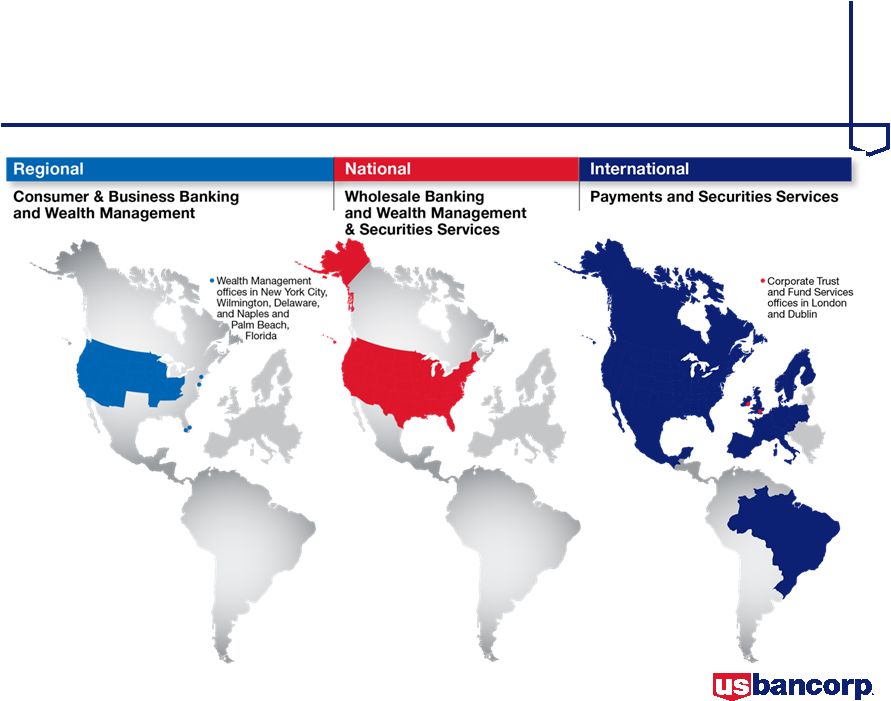
 5
U.S. Bancorp European Presence
European Offices
Elavon
Corporate Trust/Fund Services
Cherrywood
Dublin
Arklow
London
Diegem
Frankfurt
Oslo
Warsaw
Madrid
Watford |
 6
U.S. Bancorp Dimensions
Assets
$410 billion
Deposits
$287 billion
Loans
$245 billion
Customers
18.5 million
NYSE Traded
USB
Market Capitalization
$78 billion
Founded
1863
Bank Branches
3,172
ATMs
5,016
1Q15 Dimensions
As of 3/31/15, market capitalization as of 5/8/15 |
 7
Industry Position
Source: company reports, SNL and FactSet
Assets and deposits as of 3/31/15, market value as of 5/8/15
U.S.
U.S.
U.S.
Rank
Company
$ Billions
Rank
Company
$ Billions
Rank
Company
$ Billions
1
J.P. Morgan
$2,577
1
J.P. Morgan
$1,368
1
Wells Fargo
$289
2
Bank of America
2,144
2
Wells Fargo
1,197
2
J.P. Morgan
243
3
Citigroup
1,832
3
Bank of America
1,153
3
Bank of America
173
4
Wells Fargo
1,738
4
Citigroup
900
4
Citigroup
164
5
U.S. Bancorp
410
5
U.S. Bancorp
287
5
U.S. Bancorp
78
6
PNC
351
6
PNC
237
6
PNC
48
7
SunTrust
190
7
SunTrust
144
7
BB&T
28
8
BB&T
189
8
BB&T
131
8
SunTrust
22
9
Fifth Third
140
9
Fifth Third
103
9
Fifth Third
16
10
Regions
122
10
Regions
97
10
Regions
13
Assets
Deposits
Market Value |
 8
Agenda
Overview
Business Lines
Financial Management
Capital Management
Long-term Goals
2Q15 Update |
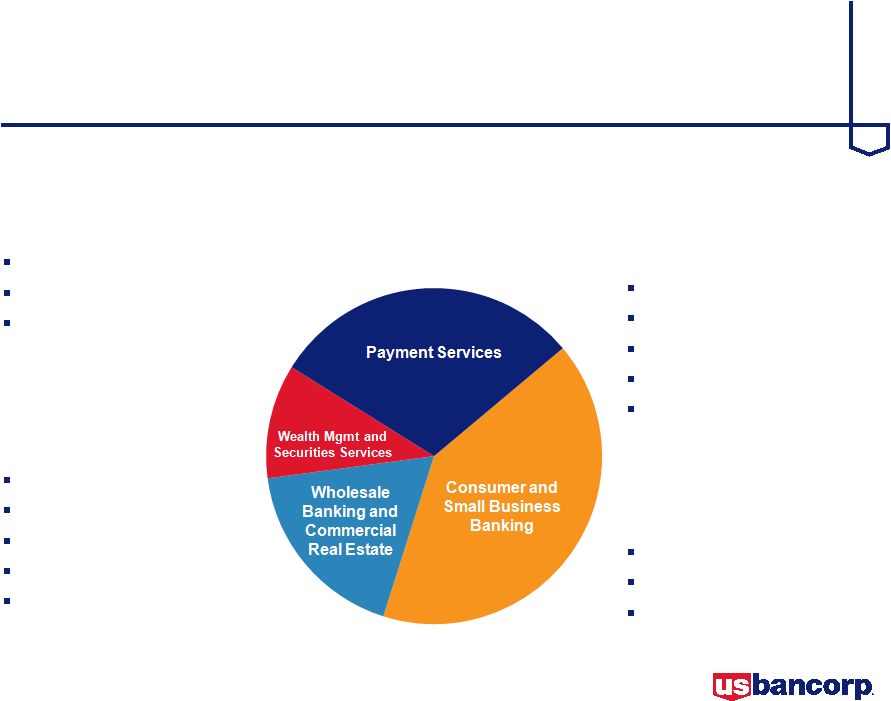 9
Business Mix
Payment Services
Retail Payment Solutions
Corporate Payment Systems
Global Merchant Acquiring
Wealth Management
and Securities Services
Wealth Management
Asset Management
Corporate Trust Services
Fund Services
Institutional Trust & Custody
Consumer and Small
Business Banking
Branch Banking
Small Business Banking
Consumer Lending
Mortgage Banking
Omnichannel
Wholesale Banking and
Commercial Real Estate
Corporate Banking
Commercial Banking
Commercial Real Estate
Revenue Mix
By Business Line |
 10
Payment Services
Business Line Summary
Provides a full suite of payment processing services to
consumers, small businesses, corporations and
merchants –
a unique position versus other banks
Expanding internationally in merchant acquiring through
continued investment in partnerships and our international
merchant payment platform
Leading player in payments innovation and emerging
technologies including enhanced security and
authentication
Business Line Scale
Ranking
Annual Volume
#5 U.S. credit card issuer
$64 billion
#5 U.S. debit card issuer
$58 billion
#3 U.S. corporate card issuer
$54 billion
#5 U.S. merchant acquirer /
$375 billion
#7 European merchant acquirer
Retail Payment
Solutions
59%
Global
Merchant
Acquiring
30%
Corporate
Payment
Systems
11%
Revenue Contribution
to USB
Payment Services
Revenue Mix
30%
Source: The Nilson Report (Visa and MasterCard issuers)
Revenue contribution and mix full year 2014; Revenue contribution percentages
exclude Treasury and Corporate Support |
 11
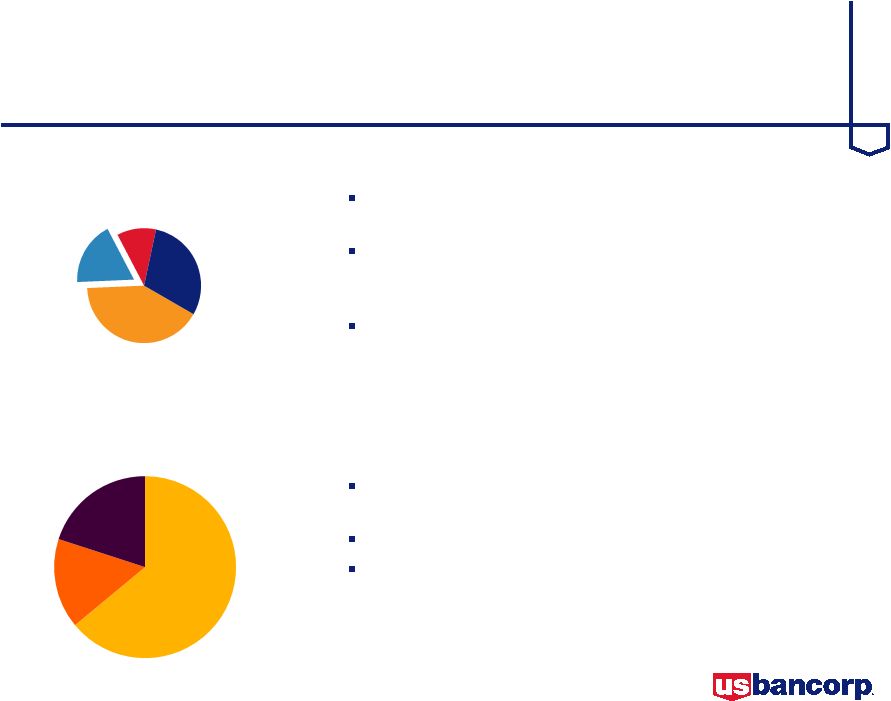
Wealth Management and Securities Services
Business Line Summary
Delivers a full array of wealth management services
through differentiated service delivery models to address
the needs of a broad range of clients
Leading provider of corporate trust services in the U.S.
with a growing international presence
Continued opportunity to expand all businesses through
new products and services, building deeper relationships
and strategic acquisitions
Business Line Scale
$128 billion in assets under management and $5.0 trillion
in assets under administration
#1 U.S. corporate trustee
#1 U.S. municipal trustee
#1 U.S. structured trustee
#3 Third party mutual fund servicer
Wealth
Management
41%
Fund
Services
19%
Corporate
Trust
30%
Revenue Contribution
to USB
Wealth Mgmt and
Securities Services
Revenue Mix
11%
Source: Securities Data Corp (corporate trust) based on number of issues,
Investment Company Institute (fund services) Revenue contribution and mix
full year 2014; Revenue contribution percentages exclude Treasury and Corporate Support
US Bank
Asset Mgmt
1%
Institutional
Trust & Custody
9% |
 12
Consumer and Small Business Banking
Business Line Summary
Provides a full suite of banking products and services to
consumer and small business customers across 25-state
branch footprint
Differentiating U.S. Bank from competitors through
continued improvement in the customer experience,
investments in innovative products and deeper customer
relationships
Omnichannel strategy driving investments in industry-
leading digital channel capabilities and new state-of-the-
art branch formats
Business Line Scale
25 contiguous state distribution footprint;
#4 U.S. branch network;
#1 in-store and on-site branch network
#5 U.S. mortgage originator
A leading SBA lender
Mortgage
Banking
23%
Community
Banking
27%
Consumer and Small
Business Banking
Revenue Mix
41%
Metropolitan
Banking
28%
In-store and
On-site Banking
7%
Consumer
Lending
15%
Source: SNL and Inside Mortgage Finance
Revenue contribution and mix full year 2014; Revenue contribution percentages
exclude Treasury and Corporate Support Revenue Contribution
to USB |
 13
Wholesale Banking and Commercial
Real Estate
Business Line Summary
Provides products and services to 90% of the Fortune
500 and 87% of the Fortune 1,000
Expanded loan capital markets and derivatives,
enhanced foreign exchange capabilities, added high-
grade fixed income and municipal bond capabilities
National Commercial Real Estate business is
relationship-based and serves strong national and
regional developers
Business Line Scale
$3.0 billion of revenue in 2014, $85 billion in loans and
$86 billion in deposits (1Q15 average balances)
A leading treasury management provider
A leading provider of banking services to federal, state
and municipal governments
Corporate
Banking
64%
Commercial
Real Estate
20%
Commercial
Banking
16%
Wholesale Banking
and Commercial RE
Revenue Mix
18%
Revenue contribution and mix full year 2014; Revenue contribution percentages
exclude Treasury and Corporate Support Revenue Contribution
to USB |
 14
Agenda
Overview
Business Lines
Financial Management
Capital Management
Long-term Goals
2Q15 Update |
 15
Strong Diversification
Revenue Mix
By Business Line
Consumer and
Small Business
Banking
41%
Payment Services
30%
Wealth Mgmt and
Securities Services
11%
Wholesale
Banking and
Commercial
Real Estate
18%
Fee Income / Total Revenue
Full year 2014, taxable-equivalent basis
Business
line
revenue
percentages
exclude
Treasury
and
Corporate
Support,
see
appendix |
 16
Peer Banks
Peer Bank Ticker Symbols
BAC
Bank of America
PNC
PNC
BBT
BB&T
RF
Regions
FITB
Fifth Third
STI
SunTrust
JPM
J.P. Morgan
USB
U.S. Bancorp
KEY
KeyCorp
WFC
Wells Fargo
Bank of America
SunTrust
Wells Fargo
KeyCorp
BBT
Fifth Third
Regions
PNC
J.P. Morgan
U.S. Bancorp |
 17
Industry Leading Returns
Source: SNL and company reports; Peer banks: BAC, BBT, FITB, JPM, KEY, PNC, RF, STI
and WFC Efficiency ratio computed as noninterest expense divided by the sum
of net interest income on a taxable-equivalent basis and noninterest
income excluding net securities gains (losses) Return on
Average Assets
Return on Average
Common Equity
Efficiency Ratio
2014
1Q15 |
 18
Efficient Expense Platform
Single processing platforms
Full consolidation of acquisitions
Operating scale in all significant
businesses
Business line monthly review
process
Source of
Competitive Advantage
Source: SNL and company reports; Peer banks: BAC, BBT, FITB, JPM, KEY, PNC, RF, STI
and WFC Efficiency ratio computed as noninterest expense divided by the sum
of net interest income on a taxable-equivalent basis and noninterest
income excluding net securities gains (losses) 2014 Efficiency Ratio
|
 19
Loan and Deposit Growth
$ in billions
Prior 5 Years
Average Balances
Year-Over-Year Growth
Prior 5 Quarters
Average Balances
Year-Over-Year Growth
Loans
Deposits
5%
5%
7%
6%
7%
6%
6%
7%
8%
4%
7%
6%
6%
4%
15%
11%
6%
7%
10%
6% |
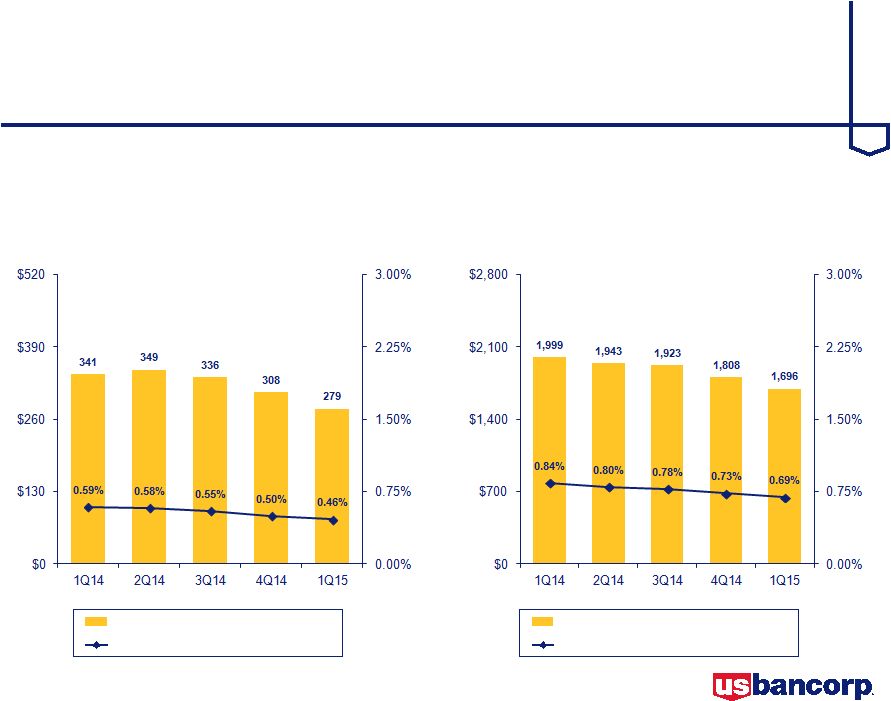 20
Credit Quality
$ in millions
Net Charge-offs
Net Charge-offs (Left Scale)
NCOs to Avg Loans (Right Scale)
Nonperforming Assets
Nonperforming Assets (Left Scale)
NPAs to Loans plus ORE (Right Scale) |
 21
Credit Quality
$ in millions
Reserve release is calculated as net charge-offs less provision for credit
losses over the five-quarter period Allowance to Loans
Reserve Release / Net Income
(Prior 5 quarters)
Total Allowance for Credit Losses (Left Scale)
Allowance % of period-end loans (Right Scale) |
 22
Top of Class Debt Ratings
Debt ratings: holding company as of 5/8/15
Flight to quality
Funding advantage
Advantages
Peer Debt Ratings
op=outlook positive / on=outlook negative / s=outlook stable / wn=watch negative /
wp=watch positive Holding
Company
Rating
Outlook
Rating
Outlook
Rating
Outlook
Rating
Outlook
USB
A1
s
A+
s
AA-
s
AA
s
WFC
A2
s
A+
on
AA-
s
AA
s
BBT
A2
wn
A-
s
A+
s
A (high)
s
JPM
A3
s
A
on
A+
s
A (high)
s
PNC
A3
s
A-
s
A+
s
A (high)
s
BAC
Baa2
wp
A-
on
A
on
A (low)
s
FITB
Baa1
s
BBB+
s
A
s
A (low)
s
STI
Baa1
s
BBB+
s
BBB+
op
A (low)
s
KEY
Baa1
s
BBB+
s
A-
s
BBB (high)
s
RF
Ba1
wp
BBB
s
BBB
s
BBB
s
Moody's
S&P
Fitch
DBRS |
 23
Agenda
Overview
Business Lines
Financial Management
Capital Management
Long-term Goals
2Q15 Update |
 24
Capital Management
Capital Requirement
* Based on the Basel III fully implemented standardized approach
Earnings Distribution Target
8.0%
Internal
Buffer
1.0%
2.5%
Capital
Conservation
Buffer
4.5%
Minimum
Capital
Requirement
9.2%*
Common Equity Tier 1
Basel III Target
USB 1Q15
Reported
Reinvest and
Acquisitions
Dividends
Share
Repurchases
20 -
40%
30 -
40%
30 -
40%
Dividends
30%
Reinvestment
30%
Share Repurchases
40%
Assumed ROTCE
20%
Discretionary Distributions
70%
Balance Sheet Growth
6%
Hypothetical Earnings Distribution Example |
 25
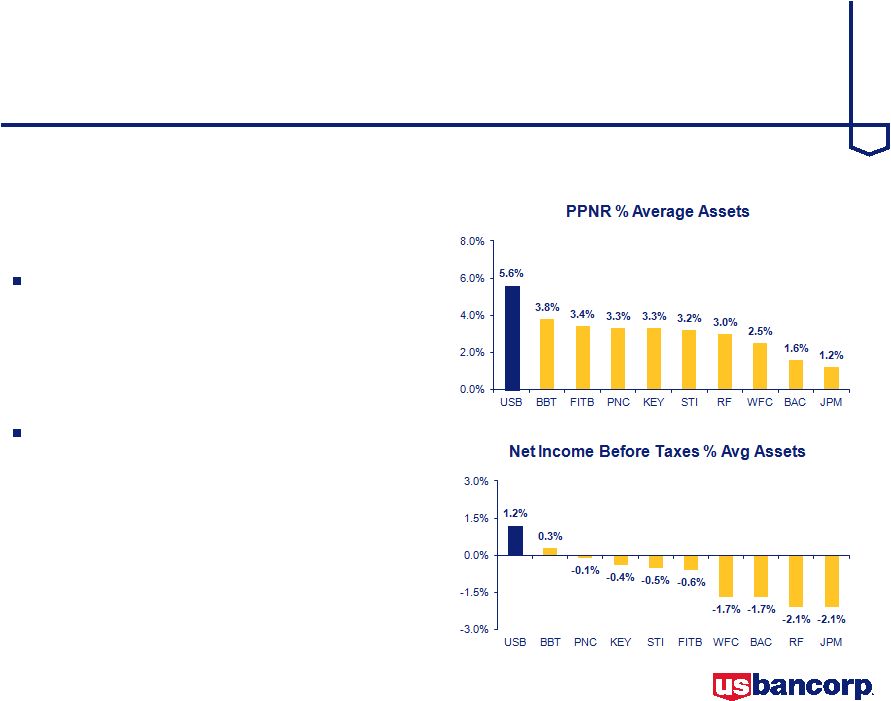
Stress Test Results
Dodd-Frank Act Stress Test
results and USB internal stress
test results and methodologies
released March 5, 2015
Comprehensive Capital
Analysis and Review results
released March 11, 2015
•
The Federal Reserve did not
object to USB’s capital plan
PPNR = Pre-Provision Net Revenue
Source: Federal Reserve, estimates in the severely adverse scenario
Stress Test Results |
 26
Capital Actions
62%
11%
32%
Payout Ratio
71%
72%
Share repurchase authorization
and expected dividend increase
announced March 11
•
Expect to increase annual
dividend from $0.98 to $1.02,
a 4.1% increase, effective
2Q15
•
One-year authorization to
repurchase up to $3.0 billion of
outstanding stock effective
April 1, 2015
Capital Actions
th |
 27
Agenda
Overview
Business Lines
Financial Management
Capital Management
Long-term Goals
2Q15 Update |
 28
Long-term Goals
Long-term Goals
•
ROE 16-19%
•
ROA 1.60-1.90%
•
Efficiency Ratio low 50s
•
Earnings distribution 60-80%
Current Status
2014 Profitability:
•
ROE 14.7%
•
ROA 1.54%
•
Efficiency Ratio 53.2%
2014 Capital distributions:
•
Distributed 72% of earnings
(dividends 31%, share repurchases 41%)
Optimal business line mix
Investments generating
positive returns
Profitability:
Capital distributions:
Four simple and stable business lines
Mortgage, wealth management, corporate
banking, international payments, branch
technology, internet and mobile channels,
and select acquisitions |
 29
Agenda
Overview
Business Lines
Financial Management
Capital Management
Long-term Goals
2Q15 Update |
 30
2Q15 Update
Business Climate
Loan Growth
Net Interest Margin
Credit Quality
Noninterest Income / Expense |
 Appendix |
 32
Non-GAAP Financial Measures
March 31,
December 31,
September 30,
June 30,
March 31,
(Dollars in Millions, Unaudited)
2015
2014
2014
2014
2014
Total equity
$44,965
$44,168
$43,829
$43,386
$42,743
Preferred stock
(4,756)
(4,756)
(4,756)
(4,756)
(4,756)
Noncontrolling interests
(688)
(689)
(688)
(686)
(689)
Goodwill (net of deferred tax liability) (1)
(8,360)
(8,403)
(8,503)
(8,548)
(8,352)
Intangible assets, other than mortgage servicing rights
(783)
(824)
(877)
(925)
(804)
Tangible common equity (a)
30,378
29,496
29,005
28,471
28,142
Tangible common equity (as calculated above)
30,378
29,496
29,005
28,471
28,142
Adjustments (2)
158
172
187
224
239
Common equity tier 1 capital estimated for the Basel III fully
implemented standardized and advanced approaches (b)
30,536
29,668
29,192
28,695
28,381
Total assets
410,233
402,529
391,284
389,065
371,289
Goodwill (net of deferred tax liability) (1)
(8,360)
(8,403)
(8,503)
(8,548)
(8,352)
Intangible assets, other than mortgage servicing rights
(783)
(824)
(877)
(925)
(804)
Tangible assets (c)
401,090
393,302
381,904
379,592
362,133
Risk-weighted assets, determined in accordance with
prescribed regulatory requirements (d)
327,709
317,398
311,914
309,929
302,841
Adjustments (3)
3,153
11,110
12,837
12,753
13,238
Risk-weighted assets estimated for the Basel III fully
implemented standardized approach
(e) 330,862
328,508
324,751
322,682
316,079
Risk-weighted assets, determined in accordance with
prescribed transitional advanced approaches regulatory
requirements 254,892
248,596
243,909
241,929
Adjustments (4)
3,321
3,270
3,443
3,383
Risk-weighted assets estimated for the Basel III fully
implemented advanced approaches
(f) 258,213
251,866
247,352
245,312
Ratios
Tangible common equity to tangible assets (a)/(c)
7.6
%
7.5
%
7.6
%
7.5
%
7.8
%
Tangible common equity to risk-weighted assets (a)/(d)
9.3
9.3
9.3
9.2
9.3
Common equity tier 1
capital to risk-weighted assets estimated for the Basel III
fully implemented standardized approach (b)/(e) 9.2
9.0
9.0
8.9
9.0
Common equity tier 1 capital to risk-weighted assets estimated for
the Basel III fully implemented advanced approaches (b)/(f)
11.8
11.8
11.8
11.7
(1) Includes goodwill related to certain investments in unconsolidated
financial institutions per prescribed regulatory requirements.
(2) Includes net losses on cash flow hedges included in accumulated
other comprehensive income and other adjustments. (3) Includes
higher risk-weighting for unfunded loan commitments, investment securities, residential mortgages, mortgage servicing rights and other adjustments.
(4)
Primarily reflects higher risk-weighting for mortgage servicing
rights. |
 33
Non-GAAP Financial Measures
Line of Business Financial Performance
Taxable-equivalent basis, excluding securities gains (losses) net
$ in millions
Revenue
Line of Business Financial Performance
FY 2014
Wholesale Banking and Commercial Real Estate
3,037
$
Consumer and Small Business Banking
6,915
Wealth Management and Securities Services
1,765
Payment Services
5,032
Treasury and Corporate Support
3,412
Consolidated Company
20,161
Less Treasury and Corporate Support
3,412
Consolidated Company excluding Treasury and Corporate Support
16,749
$
Percent of Total
Wholesale Banking and Commercial Real Estate
15%
Consumer and Small Business Banking
34%
Wealth Management and Securities Services
9%
Payment Services
25%
Treasury and Corporate Support
17%
Total
100%
Percent of Total excluding Treasury and Corporate Support
Wholesale Banking and Commercial Real Estate
18%
Consumer and Small Business Banking
41%
Wealth Management and Securities Services
11%
Payment Services
30%
Total
100% |
 Barclays Americas Select
Franchise Conference 2015
May 19, 2015 |
Serious News for Serious Traders! Try StreetInsider.com Premium Free!
You May Also Be Interested In
- U.S. Bank CFO Survey: Corporate Finance Leaders Tighten Belts Amid Uncertainty
- ENDEAVOR ALERT: Bragar Eagel & Squire, P.C. Investigates Merger of EDR and Encourages Investors to Contact the Firm
- Dicello Levitt LLP Announces Investor Class Action Lawsuit Filed Against QuidelOrtho Corp. f/k/a Quidel Corp. (NASDAQ: QDEL) And Lead Plaintiff Deadline
Create E-mail Alert Related Categories
SEC FilingsSign up for StreetInsider Free!
Receive full access to all new and archived articles, unlimited portfolio tracking, e-mail alerts, custom newswires and RSS feeds - and more!
