Form 8-K Triumph Bancorp, Inc. For: Aug 30
UNITED STATES
SECURITIES AND EXCHANGE COMMISSION
WASHINGTON, D.C. 20549
FORM 8-K
CURRENT REPORT
PURSUANT TO SECTION 13 OR 15(D)
OF THE SECURITIES EXCHANGE ACT OF 1934
Date of Report (Date of earliest event reported): August 30, 2016
TRIUMPH BANCORP, INC.
(Exact name of registrant as specified in its charter)
|
Texas |
001-36722 |
20-0477066 |
|
(State or Other Jurisdiction of Incorporation) |
(Commission File Number) |
(IRS Employer Identification No.) |
|
|
|
|
|
12700 Park Central Drive, Suite 1700, Dallas, Texas |
|
75251 |
|
(Address of Principal Executive Offices) |
|
(Zip Code) |
(214) 365-6900
(Registrant’s telephone number, including area code)
(Former Name or Former Address, if Changed Since Last Report)
Check the appropriate box below if the Form 8-K filing is intended to simultaneously satisfy the filing obligation of the registrant under any of the following provisions (see General Instructions A.2. below):
|
¨ |
Written communications pursuant to Rule 425 under the Securities Act (17 CFR 230.425) |
|
¨ |
Soliciting material pursuant to Rule 14a-12 under the Exchange Act (17 CFR 240.14a-12) |
|
¨ |
Pre-commencement communications pursuant to Rule 14d-2(b) under the Exchange Act (17 CFR 240.14d-2b) |
|
¨ |
Pre-commencement communications pursuant to Rule 13e-4(c) under the Exchange Act (17 CFR 240.13e-4c) |
Item 7.01.Regulation FD Disclosure
On August 30, 2016, Aaron Graft, Vice Chairman and Chief Executive Officer of Triumph Bancorp, Inc. (the “Company”), is presenting at the Midwest IDEAS Investor Conference at the Hard Rock Hotel in Chicago, IL. A copy of the materials for such presentation is attached as Exhibit 99.1. The information in this Item 7.01, including Exhibit 99.1, shall be considered furnished for purposes of the Securities Exchange Act of 1934 and shall not be deemed “filed” for any purpose.
Forward-Looking Statements
This current report on Form 8-K and the attachments contained herein contain forward-looking statements. Any statements about our expectations, beliefs, plans, predictions, forecasts, objectives, assumptions or future events or performance are not historical facts and may be forward-looking. You can identify forward-looking statements by the use of forward-looking terminology such as “believes,” “expects,” “could,” “may,” “will,” “should,” “seeks,” “likely,” “intends,” “plans,” “pro forma,” “projects,” “estimates” or “anticipates” or the negative of these words and phrases or similar words or phrases that are predictions of or indicate future events or trends and that do not relate solely to historical matters. You can also identify forward-looking statements by discussions of strategy, plans or intentions. Forward-looking statements involve numerous risks and uncertainties and you should not rely on them as predictions of future events. Forward-looking statements depend on assumptions, data or methods that may be incorrect or imprecise and we may not be able to realize them. We do not guarantee that the transactions and events described will happen as described (or that they will happen at all). The following factors, among others, could cause actual results and future events to differ materially from those set forth or contemplated in the forward-looking statements: our limited operating history as an integrated company; business and economic conditions generally and in the bank and non-bank financial services industries, nationally and within our local market area; our ability to mitigate our risk exposures; our ability to maintain our historical earnings trends; risks related to the integration of acquired businesses (including our acquisition of ColoEast Bankshares, Inc.) and any future acquisitions; changes in management personnel; interest rate risk; concentration of our factoring services in the transportation industry; credit risk associated with our loan portfolio; lack of seasoning in our loan portfolio; deteriorating asset quality and higher loan charge-offs; time and effort necessary to resolve nonperforming assets; inaccuracy of the assumptions and estimates we make in establishing reserves for probable loan losses and other estimates; lack of liquidity; fluctuations in the fair value and liquidity of the securities we hold for sale; impairment of investment securities, goodwill, other intangible assets or deferred tax assets; risks related to our asset management business; our risk management strategies; environmental liability associated with our lending activities; increased competition in the bank and non-bank financial services industries, nationally, regionally or locally, which may adversely affect pricing and terms; the obligations associated with being a public company; the accuracy of our financial statements and related disclosures; material weaknesses in our internal control over financial reporting; system failures or failures to prevent breaches of our network security; the institution and outcome of litigation and other legal proceedings against us or to which we become subject; changes in carry-forwards of net operating losses; changes in federal tax law or policy; the impact of recent and future legislative and regulatory changes, including changes in banking, securities and tax laws and regulations, such as the Dodd-Frank Wall Street Reform and Consumer Protection Act (the “Dodd-Frank Act”) and their application by our regulators; governmental monetary and fiscal policies; changes in the scope and cost of the Federal Deposit Insurance Corporation insurance and other coverages; failure to receive regulatory approval for future acquisitions; increases in our capital requirements; and risk retention requirements under the Dodd-Frank Act.
While forward-looking statements reflect our good-faith beliefs, they are not guarantees of future performance. All forward-looking statements are necessarily only estimates of future results. Accordingly, actual results may differ materially from those expressed in or contemplated by the particular forward-looking statement, and, therefore, you are cautioned not to place undue reliance on such statements. Further, any forward-looking statement speaks only as of the date on which it is made, and we undertake no obligation to update any forward-looking statement to reflect events or circumstances after the date on which the statement is made or to reflect the occurrence of unanticipated events or circumstances, except as required by applicable law. For a discussion of such risks and uncertainties, which could cause actual results to differ from those contained in the forward-looking statements, see “Risk Factors” and the forward-looking statement disclosure contained in Triumph’s Annual Report on Form 10-K, filed with the Securities and Exchange Commission on February 26, 2016.
Item 9.01. Financial Statements and Exhibits
(d) Exhibits.
|
|
|
|
|
|
|
Exhibit |
Description |
|
99.1 |
Triumph Bancorp, Inc. Investor Presentation |
SIGNATURE
Pursuant to the requirements of the Securities Exchange Act of 1934, the registrant has duly caused this report to be signed on its behalf by the undersigned, hereunto duly authorized.
|
|
||
|
|
|
|
|
|
|
|
|
|
|
TRIUMPH BANCORP, INC.
|
|
|
|
|
|
|
By: |
/s/ Adam D. Nelson |
|
|
|
Name: Adam D. Nelson Title: Executive Vice President & General Counsel |
Date: August 30, 2016
EXHIBIT INDEX
|
|
|
|
|
|
|
|
|
|
Exhibit |
Description |
|
99.1 |
Triumph Bancorp, Inc. Investor Presentation |

IDEAS CONFERENCE Exhibit 99.1
IDEAS CONFERENCE – PAGE DISCLAIMER Forward-Looking Statements This presentation contains forward-looking statements. Any statements about our expectations, beliefs, plans, predictions, forecasts, objectives, assumptions or future events or performance are not historical facts and may be forward-looking. You can identify forward-looking statements by the use of forward-looking terminology such as “believes,” “expects,” “could,” “may,” “will,” “should,” “seeks,” “likely,” “intends,” “plans,” “pro forma,” “projects,” “estimates” or “anticipates” or the negative of these words and phrases or similar words or phrases that are predictions of or indicate future events or trends and that do not relate solely to historical matters. You can also identify forward-looking statements by discussions of strategy, plans or intentions. Forward-looking statements involve numerous risks and uncertainties and you should not rely on them as predictions of future events. Forward-looking statements depend on assumptions, data or methods that may be incorrect or imprecise and we may not be able to realize them. We do not guarantee that the transactions and events described will happen as described (or that they will happen at all). The following factors, among others, could cause actual results and future events to differ materially from those set forth or contemplated in the forward-looking statements: our limited operating history as an integrated company; business and economic conditions generally and in the bank and non-bank financial services industries, nationally and within our local market area; our ability to mitigate our risk exposures; our ability to maintain our historical earnings trends; risks related to the integration of acquired businesses (including our acquisition of ColoEast Bankshares, Inc.) and any future acquisitions; changes in management personnel; interest rate risk; concentration of our factoring services in the transportation industry; credit risk associated with our loan portfolio; lack of seasoning in our loan portfolio; deteriorating asset quality and higher loan charge-offs; time and effort necessary to resolve nonperforming assets; inaccuracy of the assumptions and estimates we make in establishing reserves for probable loan losses and other estimates; lack of liquidity; fluctuations in the fair value and liquidity of the securities we hold for sale; impairment of investment securities, goodwill, other intangible assets or deferred tax assets; risks related to our asset management business; our risk management strategies; environmental liability associated with our lending activities; increased competition in the bank and non-bank financial services industries, nationally, regionally or locally, which may adversely affect pricing and terms; the obligations associated with being a public company; the accuracy of our financial statements and related disclosures; material weaknesses in our internal control over financial reporting; system failures or failures to prevent breaches of our network security; the institution and outcome of litigation and other legal proceedings against us or to which we become subject; changes in carry-forwards of net operating losses; changes in federal tax law or policy; the impact of recent and future legislative and regulatory changes, including changes in banking, securities and tax laws and regulations, such as the Dodd-Frank Wall Street Reform and Consumer Protection Act (the “Dodd-Frank Act”) and their application by our regulators; governmental monetary and fiscal policies; changes in the scope and cost of the Federal Deposit Insurance Corporation insurance and other coverages; failure to receive regulatory approval for future acquisitions; increases in our capital requirements; and risk retention requirements under the Dodd-Frank Act. While forward-looking statements reflect our good-faith beliefs, they are not guarantees of future performance. All forward-looking statements are necessarily only estimates of future results. Accordingly, actual results may differ materially from those expressed in or contemplated by the particular forward-looking statement, and, therefore, you are cautioned not to place undue reliance on such statements. Further, any forward-looking statement speaks only as of the date on which it is made, and we undertake no obligation to update any forward-looking statement to reflect events or circumstances after the date on which the statement is made or to reflect the occurrence of unanticipated events or circumstances, except as required by applicable law. For a discussion of such risks and uncertainties, which could cause actual results to differ from those contained in the forward-looking statements, see “Risk Factors” and the forward-looking statement disclosure contained in Triumph’s Annual Report on Form 10-K, filed with the Securities and Exchange Commission on February 26, 2016. Non-GAAP Financial Measures This presentation includes certain non‐GAAP financial measures intended to supplement, not substitute for, comparable GAAP measures. Reconciliations of non‐GAAP financial measures to GAAP financial measures are provided at the end of the presentation. Numbers in this presentation may not sum due to rounding. Unless otherwise referenced, all data presented is as of June 30, 2016.
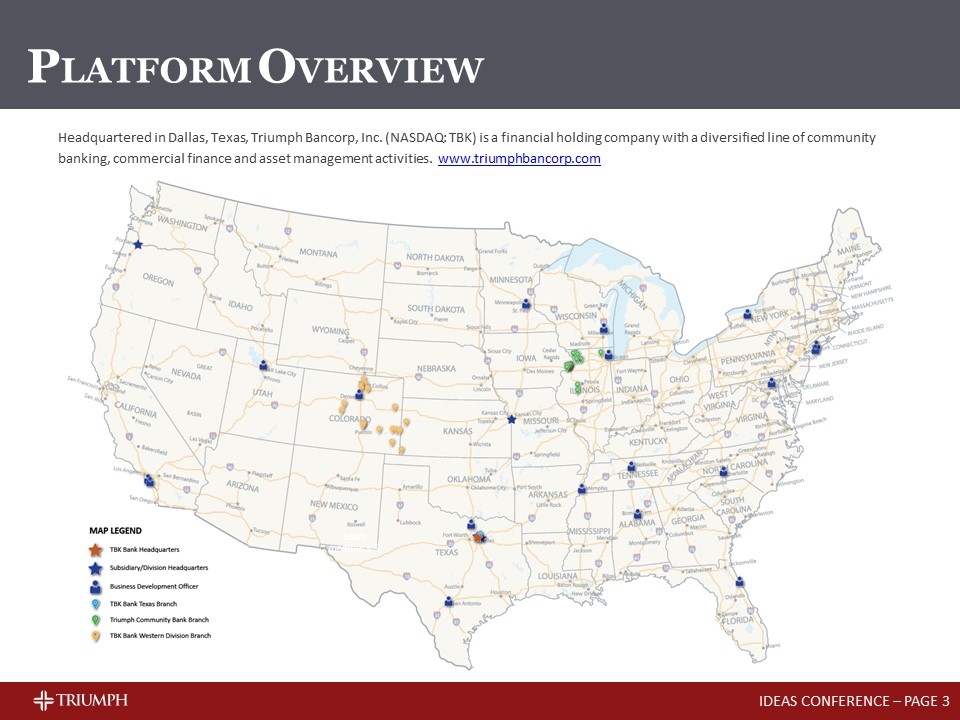
IDEAS CONFERENCE – PAGE Headquartered in Dallas, Texas, Triumph Bancorp, Inc. (NASDAQ: TBK) is a financial holding company with a diversified line of community banking, commercial finance and asset management activities. www.triumphbancorp.com team members(2) PLATFORM OVERVIEW
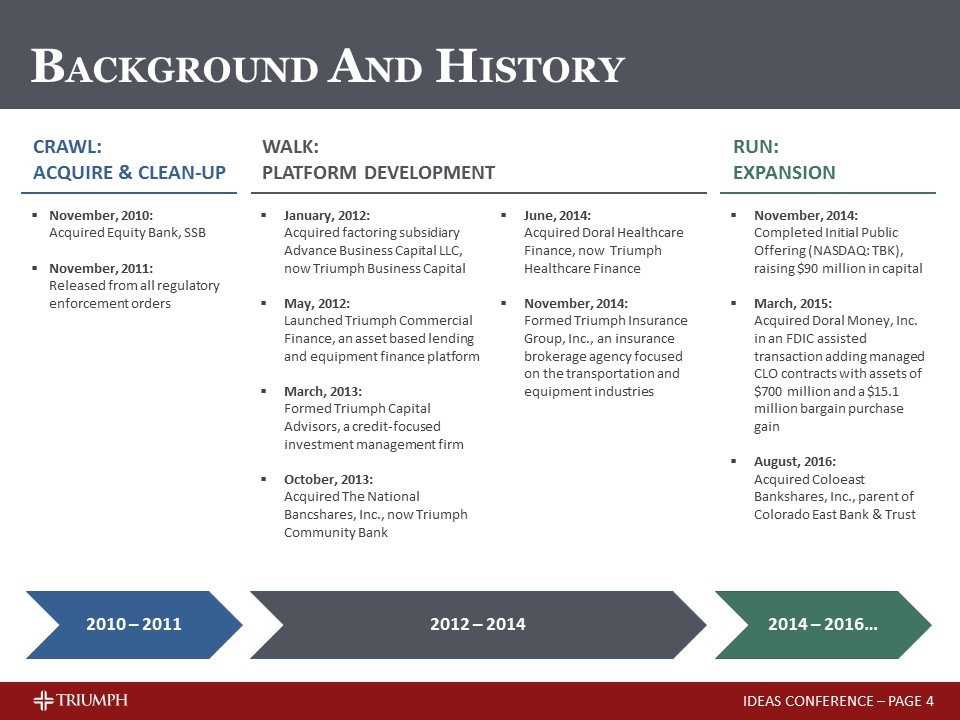
IDEAS CONFERENCE – PAGE BACKGROUND AND HISTORY November, 2010: Acquired Equity Bank, SSB November, 2011: Released from all regulatory enforcement orders CRAWL: Acquire & Clean-up 2010 – 2011 2012 – 2014 WALK: Platform Development June, 2014: Acquired Doral Healthcare Finance, now Triumph Healthcare Finance November, 2014: Formed Triumph Insurance Group, Inc., an insurance brokerage agency focused on the transportation and equipment industries January, 2012: Acquired factoring subsidiary Advance Business Capital LLC, now Triumph Business Capital May, 2012: Launched Triumph Commercial Finance, an asset based lending and equipment finance platform March, 2013: Formed Triumph Capital Advisors, a credit-focused investment management firm October, 2013: Acquired The National Bancshares, Inc., now Triumph Community Bank 2014 – 2016… RUN: Expansion November, 2014: Completed Initial Public Offering (NASDAQ: TBK), raising $90 million in capital March, 2015: Acquired Doral Money, Inc. in an FDIC assisted transaction adding managed CLO contracts with assets of $700 million and a $15.1 million bargain purchase gain August, 2016: Acquired Coloeast Bankshares, Inc., parent of Colorado East Bank & Trust
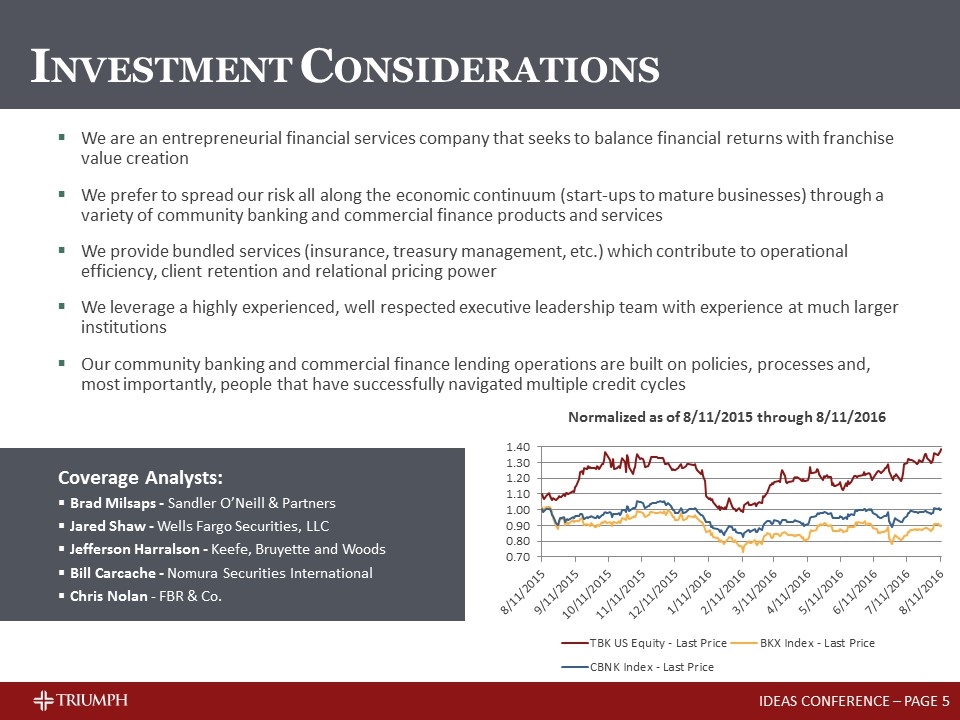
IDEAS CONFERENCE – PAGE INVESTMENT CONSIDERATIONS We are an entrepreneurial financial services company that seeks to balance financial returns with franchise value creation We prefer to spread our risk all along the economic continuum (start-ups to mature businesses) through a variety of community banking and commercial finance products and services We provide bundled services (insurance, treasury management, etc.) which contribute to operational efficiency, client retention and relational pricing power We leverage a highly experienced, well respected executive leadership team with experience at much larger institutions Our community banking and commercial finance lending operations are built on policies, processes and, most importantly, people that have successfully navigated multiple credit cycles Coverage Analysts: Brad Milsaps - Sandler O’Neill & Partners Jared Shaw - Wells Fargo Securities, LLC Jefferson Harralson - Keefe, Bruyette and Woods Bill Carcache - Nomura Securities International Chris Nolan - FBR & Co.
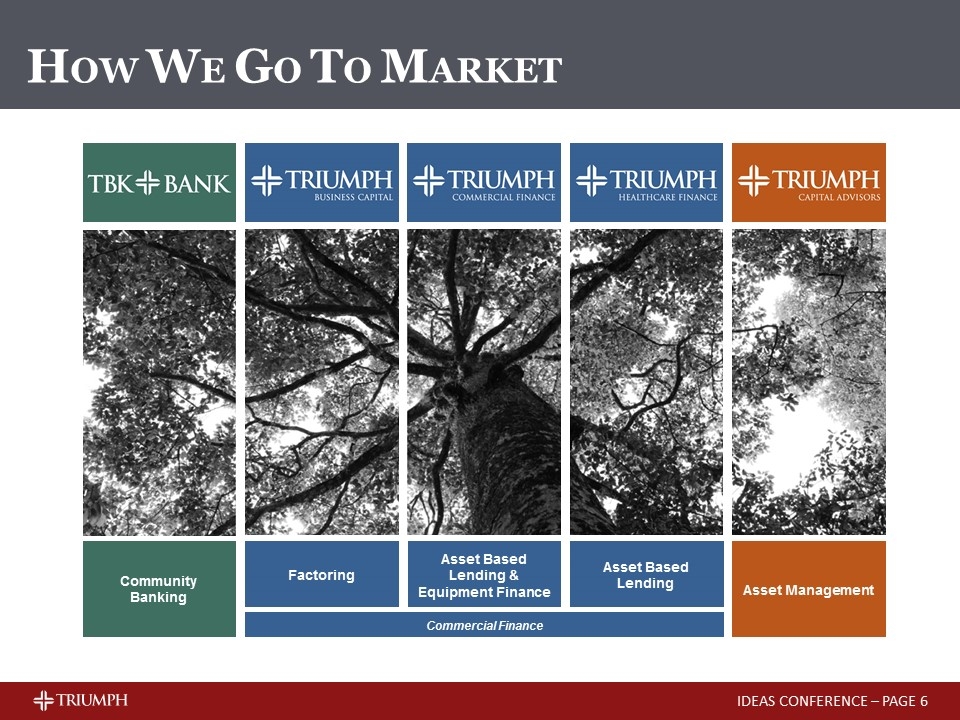
HOW WE GO TO MARKET IDEAS CONFERENCE – PAGE Commercial Finance Community Banking Asset Management Factoring Asset Based Lending & Equipment Finance Asset Based Lending
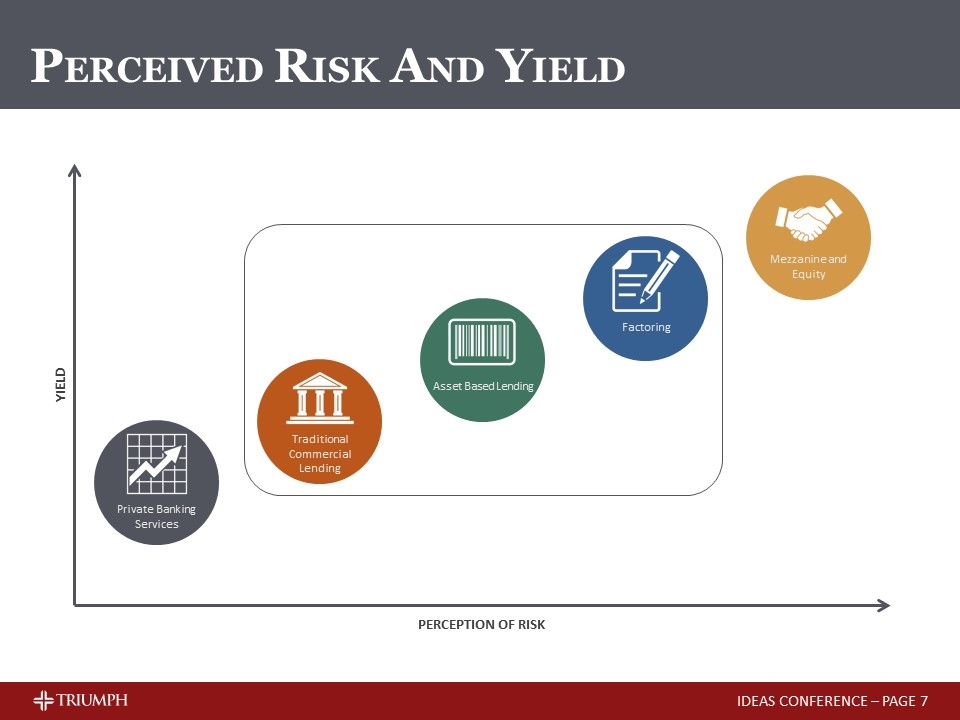
Private Banking Services Traditional Commercial Lending Asset Based Lending Factoring Mezzanine and Equity YIELD PERCEPTION OF RISK PERCEIVED RISK AND YIELD IDEAS CONFERENCE – PAGE
HOW WE GO TO MARKET IDEAS CONFERENCE – PAGE Commercial Finance Community Banking Asset Management Factoring Asset Based Lending & Equipment Finance Asset Based Lending
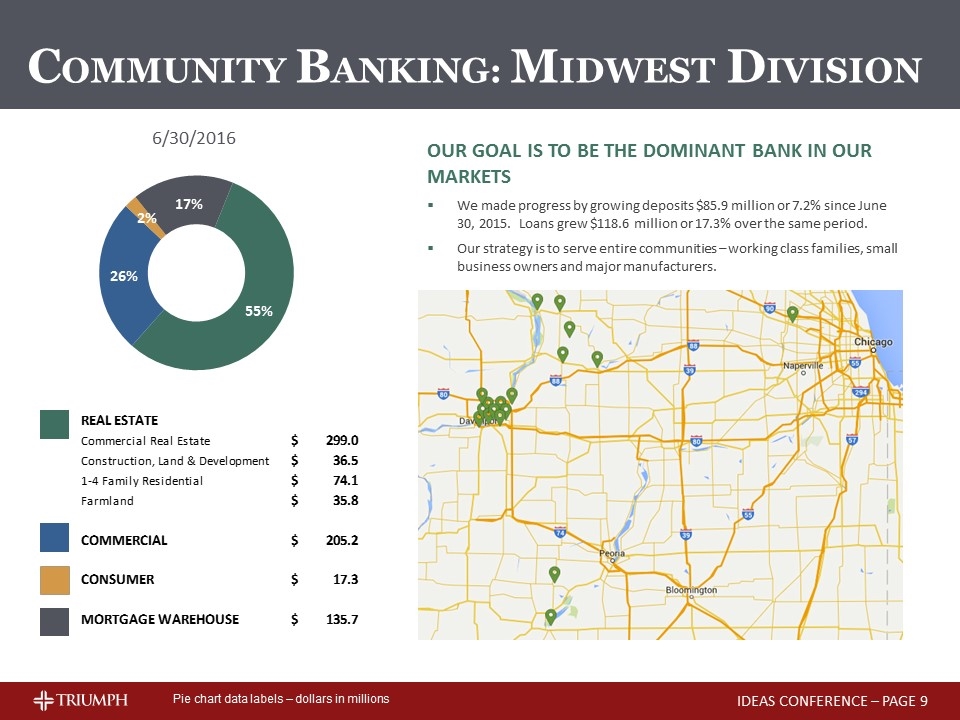
6/30/2016 Our goal is to be the dominant bank in our markets We made progress by growing deposits $85.9 million or 7.2% since June 30, 2015. Loans grew $118.6 million or 17.3% over the same period. Our strategy is to serve entire communities – working class families, small business owners and major manufacturers. Pie chart data labels – dollars in millions COMMUNITY BANKING: MIDWEST DIVISION IDEAS CONFERENCE – PAGE 42185 42277 42369 42460 42551 Q2 2015 Q3 2015 Q4 2015 Q1 2016 Q2 2016 Community Banking 685.02599999999995 687.54200000000003 770.9 717.72799999999995 803.58500000000004 Equipment 138.018 143.483 148.95099999999999 159.755 167 0.275153929675928 Commercial Finance: Asset based lending (General) 64.835999999999999 85.641000000000005 75.134 85.739000000000004 114.63200000000001 0.18887092974018549 Asset based lending (Healthcare) 65.082999999999998 66.831999999999994 80.2 79.58 81.664000000000001 0.13455191923985022 Premium Finance 0 0 1.6120000000000001 3.5059999999999998 6.117 1.0078542442081746E-2 Factored receivables 199.71600000000001 201.803 215.08799999999999 199.53200000000001 237.52 0.39134467890195462 Q2 2016 Commercial Finance Products $606.93299999999999 Community Banking $803.58500000000004 Real Estate & Farmland $445.40499999999997 Commercial Real Estate $298.99099999999999 Commercial $205.09500000000003 Construction, Land Development, Land $36.497999999999998 Consumer $17.338999999999999 1-4 Family Residential Properties $74.120999999999995 Mortgage Warehouse $135.74600000000001 Farmland $35.795000000000002 Commercial $205.09500000000003 Consumer $17.338999999999999 Community Banking Mortgage Warehouse $135.74600000000001 REAL ESTATE Commercial Real Estate $299 Construction, Land & Development $36.5 1-4 Family Residential $74.099999999999994 Farmland $35.799999999999997 0.55426619461537996 COMMERCIAL $205.2 Rounded 0.25535568732616959 CONSUMER $17.3 2.1528525296017224E-2 MORTGAGE WAREHOUSE $135.69999999999999 0.16886825911384609 FACTORED RECEIVABLES $237.52 EQUIPMENT FINANCE $167 ASSET BASED LENDING $114.63200000000001 HEALTHCARE ASSET $81.664000000000001 BASED LENDING PREMIUM FINANCE $6.117
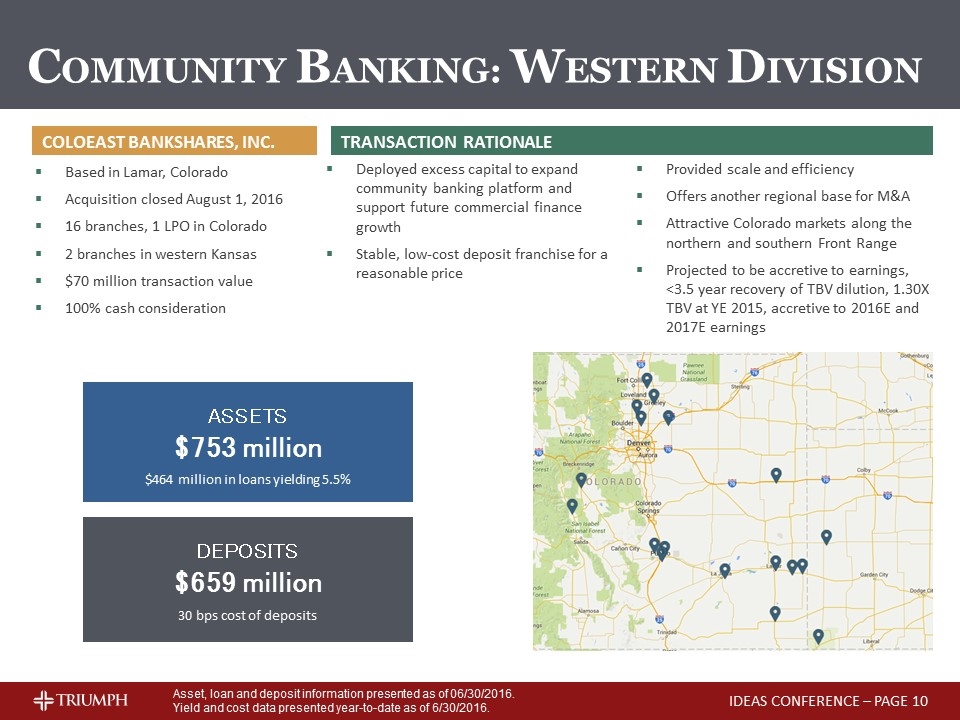
TRANSACTION RATIONALE Deployed excess capital to expand community banking platform and support future commercial finance growth Stable, low-cost deposit franchise for a reasonable price Based in Lamar, Colorado Acquisition closed August 1, 2016 16 branches, 1 LPO in Colorado 2 branches in western Kansas $70 million transaction value 100% cash consideration Asset, loan and deposit information presented as of 06/30/2016. Yield and cost data presented year-to-date as of 6/30/2016. ASSETS $753 million $464 million in loans yielding 5.5% DEPOSITS $659 million 30 bps cost of deposits COLOEAST BANKSHARES, Inc. COMMUNITY BANKING: WESTERN DIVISION Provided scale and efficiency Offers another regional base for M&A Attractive Colorado markets along the northern and southern Front Range Projected to be accretive to earnings, <3.5 year recovery of TBV dilution, 1.30X TBV at YE 2015, accretive to 2016E and 2017E earnings IDEAS CONFERENCE – PAGE
HOW WE GO TO MARKET IDEAS CONFERENCE – PAGE Commercial Finance Community Banking Asset Management Factoring Asset Based Lending & Equipment Finance Asset Based Lending
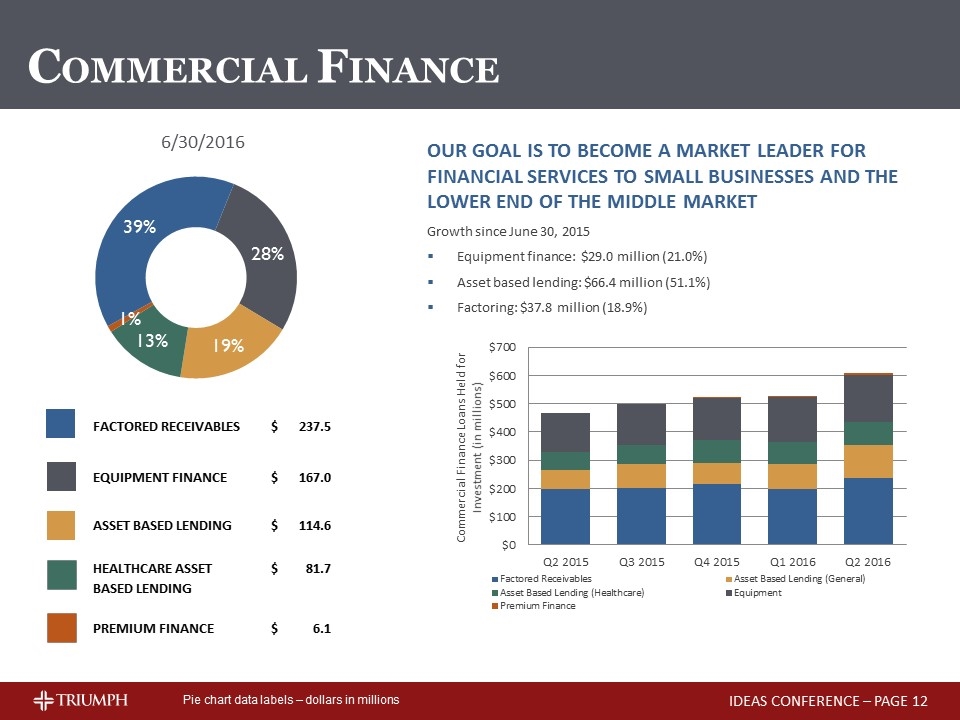
6/30/2016 Our goal is to become a market leader for financial services to small businesses and the lower end of the middle market Growth since June 30, 2015 Equipment finance: $29.0 million (21.0%) Asset based lending: $66.4 million (51.1%) Factoring: $37.8 million (18.9%) Pie chart data labels – dollars in millions COMMERCIAL FINANCE IDEAS CONFERENCE – PAGE 42185 42277 42369 42460 42551 Q2 2015 Q3 2015 Q4 2015 Q1 2016 Q2 2016 Community Banking 685.02599999999995 687.54200000000003 770.9 717.72799999999995 803.58500000000004 Equipment 138.018 143.483 148.95099999999999 159.755 167 0.275153929675928 Commercial Finance: Asset based lending (General) 64.835999999999999 85.641000000000005 75.134 85.739000000000004 114.63200000000001 0.18887092974018549 Asset based lending (Healthcare) 65.082999999999998 66.831999999999994 80.2 79.58 81.664000000000001 0.13455191923985022 Premium Finance 0 0 1.6120000000000001 3.5059999999999998 6.117 1.0078542442081746E-2 Factored receivables 199.71600000000001 201.803 215.08799999999999 199.53200000000001 237.52 0.39134467890195462 Q2 2016 Commercial Finance Products $606.93299999999999 Community Banking $803.58500000000004 Real Estate & Farmland $445.40499999999997 Commercial Real Estate $298.99099999999999 Commercial $205.09500000000003 Construction, Land Development, Land $36.497999999999998 Consumer $17.338999999999999 1-4 Family Residential Properties $74.120999999999995 Mortgage Warehouse $135.74600000000001 Farmland $35.795000000000002 Commercial $205.09500000000003 Consumer $17.338999999999999 Community Banking Mortgage Warehouse $135.74600000000001 REAL ESTATE Commercial Real Estate $299 Construction, Land & Development $36.5 1-4 Family Residential $74.099999999999994 Farmland $35.799999999999997 0.55426619461537996 COMMERCIAL $205.2 Rounded 0.25535568732616959 CONSUMER $17.3 2.1528525296017224E-2 MORTGAGE WAREHOUSE $135.69999999999999 0.16886825911384609 FACTORED RECEIVABLES $237.5 EQUIPMENT FINANCE $167 ASSET BASED LENDING $114.6 HEALTHCARE ASSET $81.7 BASED LENDING PREMIUM FINANCE $6.1
HOW WE GO TO MARKET IDEAS CONFERENCE – PAGE Commercial Finance Community Banking Asset Management Factoring Asset Based Lending & Equipment Finance Asset Based Lending
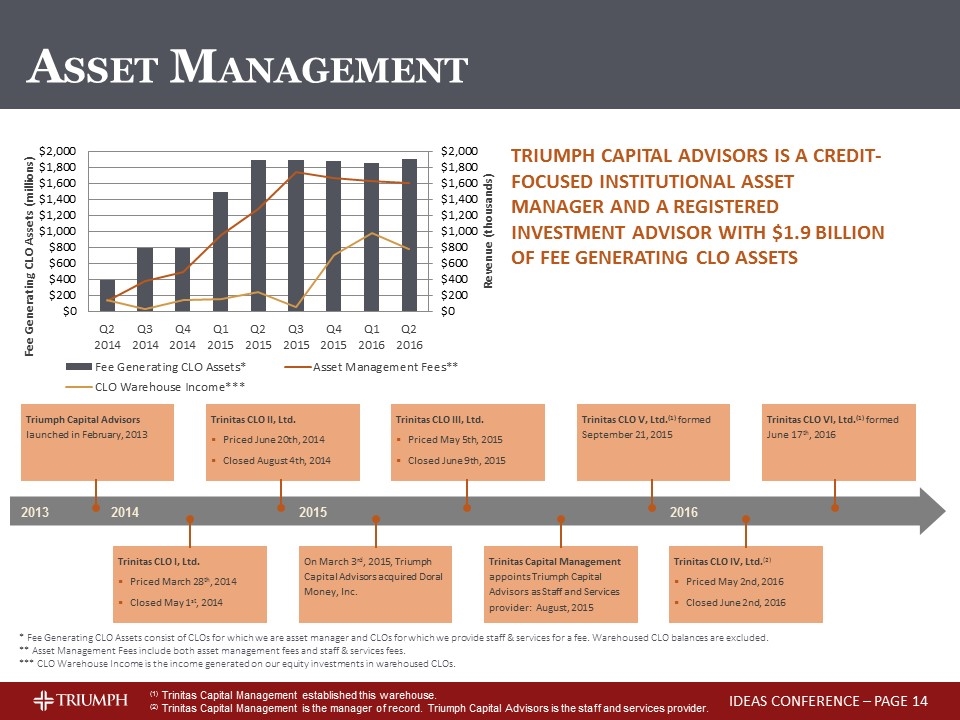
2013 * Fee Generating CLO Assets consist of CLOs for which we are asset manager and CLOs for which we provide staff & services for a fee. Warehoused CLO balances are excluded. ** Asset Management Fees include both asset management fees and staff & services fees. *** CLO Warehouse Income is the income generated on our equity investments in warehoused CLOs. Triumph Capital Advisors is a credit-focused institutional asset manager and a registered investment advisor with $1.9 billion of fee generating CLO assets 2014 2015 Triumph Capital Advisors launched in February, 2013 On March 3rd, 2015, Triumph Capital Advisors acquired Doral Money, Inc. Trinitas CLO I, Ltd. Priced March 28th, 2014 Closed May 1st, 2014 Trinitas CLO II, Ltd. Priced June 20th, 2014 Closed August 4th, 2014 Trinitas CLO III, Ltd. Priced May 5th, 2015 Closed June 9th, 2015 ASSET MANAGEMENT 2016 Trinitas CLO VI, Ltd.(1) formed June 17th, 2016 Trinitas CLO IV, Ltd.(2) Priced May 2nd, 2016 Closed June 2nd, 2016 (1) Trinitas Capital Management established this warehouse. (2) Trinitas Capital Management is the manager of record. Triumph Capital Advisors is the staff and services provider. Trinitas CLO V, Ltd.(1) formed September 21, 2015 Trinitas Capital Management appoints Triumph Capital Advisors as Staff and Services provider: August, 2015 IDEAS CONFERENCE – PAGE
FINANCIAL HIGHLIGHTS IDEAS CONFERENCE – PAGE
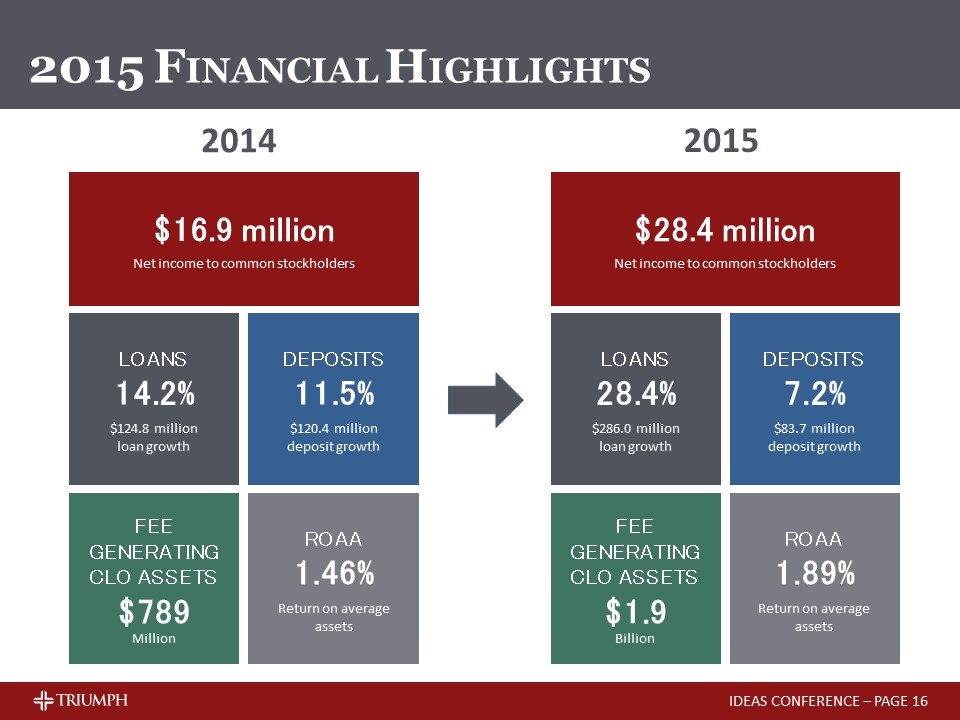
$28.4 million Net income to common stockholders LOANS 28.4% $286.0 million loan growth DEPOSITS 7.2% $83.7 million deposit growth ROAA 1.89% Return on average assets FEE GENERATING CLO ASSETS $1.9 Billion 2015 FINANCIAL HIGHLIGHTS $16.9 million Net income to common stockholders LOANS 14.2% $124.8 million loan growth DEPOSITS 11.5% $120.4 million deposit growth ROAA 1.46% Return on average assets FEE GENERATING CLO ASSETS $789 Million 2014 2015 IDEAS CONFERENCE – PAGE
FINANCIAL HIGHLIGHTS IDEAS CONFERENCE – PAGE
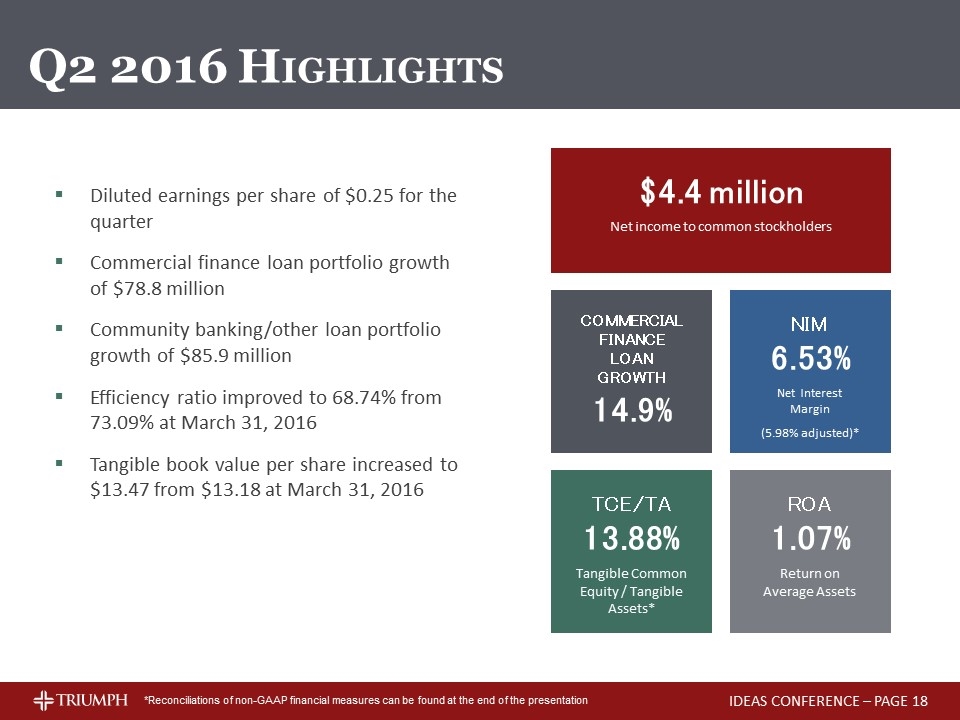
Diluted earnings per share of $0.25 for the quarter Commercial finance loan portfolio growth of $78.8 million Community banking/other loan portfolio growth of $85.9 million Efficiency ratio improved to 68.74% from 73.09% at March 31, 2016 Tangible book value per share increased to $13.47 from $13.18 at March 31, 2016 $4.4 million Net income to common stockholders COMMERCIAL FINANCE LOAN GROWTH 14.9% NIM 6.53% Net Interest Margin (5.98% adjusted)* ROA 1.07% Return on Average Assets TCE/TA 13.88% Tangible Common Equity / Tangible Assets* Q2 2016 HIGHLIGHTS *Reconciliations of non-GAAP financial measures can be found at the end of the presentation IDEAS CONFERENCE – PAGE
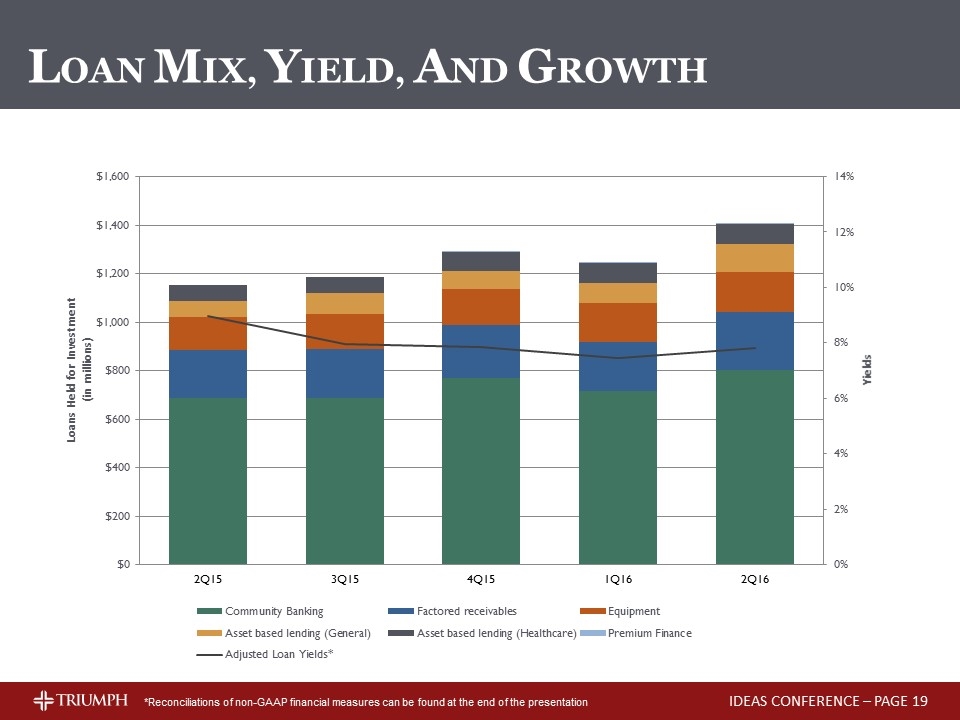
LOAN MIX, YIELD, AND GROWTH *Reconciliations of non-GAAP financial measures can be found at the end of the presentation IDEAS CONFERENCE – PAGE
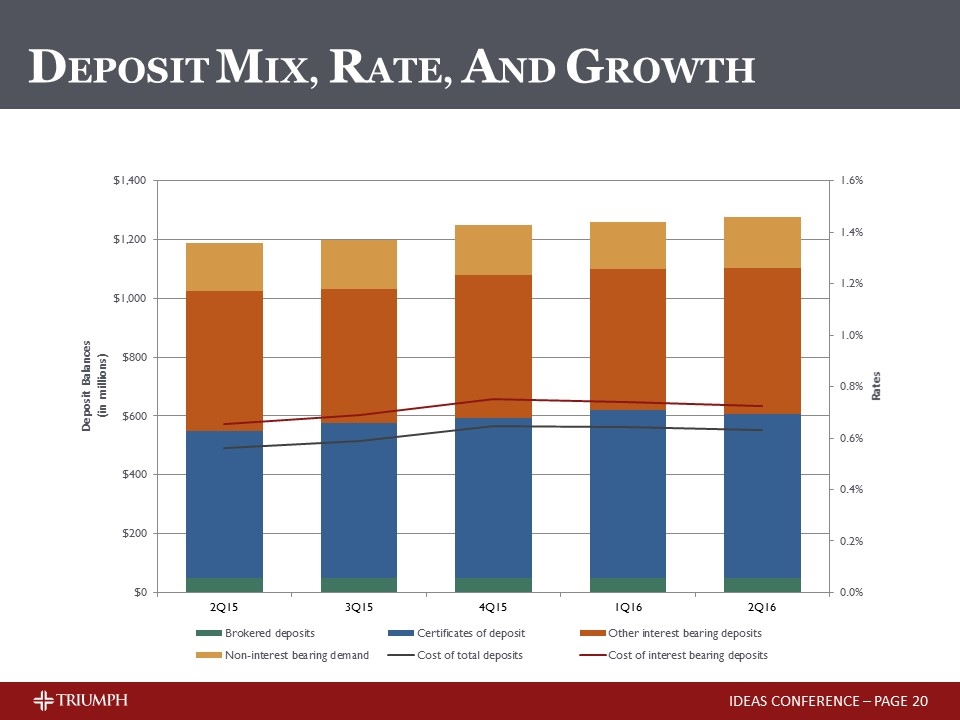
DEPOSIT MIX, RATE, AND GROWTH IDEAS CONFERENCE – PAGE

GOALS & WHERE WE GO FROM HERE IDEAS CONFERENCE – PAGE
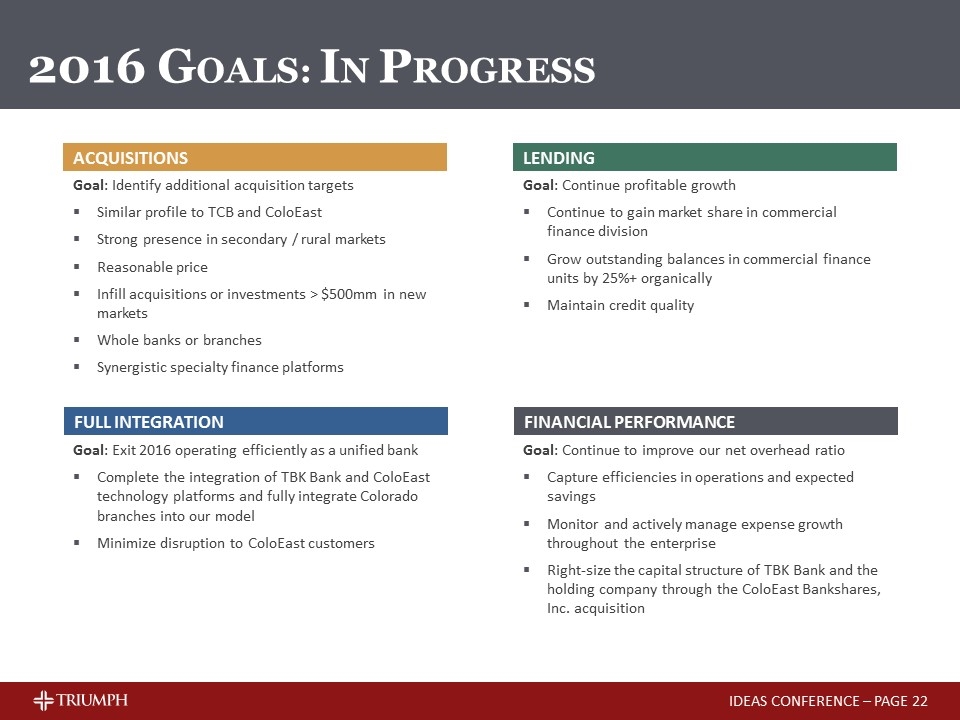
lending Acquisitions 2016 GOALS: IN PROGRESS Goal: Continue to improve our net overhead ratio Capture efficiencies in operations and expected savings Monitor and actively manage expense growth throughout the enterprise Right-size the capital structure of TBK Bank and the holding company through the ColoEast Bankshares, Inc. acquisition Goal: Identify additional acquisition targets Similar profile to TCB and ColoEast Strong presence in secondary / rural markets Reasonable price Infill acquisitions or investments > $500mm in new markets Whole banks or branches Synergistic specialty finance platforms Goal: Exit 2016 operating efficiently as a unified bank Complete the integration of TBK Bank and ColoEast technology platforms and fully integrate Colorado branches into our model Minimize disruption to ColoEast customers Goal: Continue profitable growth Continue to gain market share in commercial finance division Grow outstanding balances in commercial finance units by 25%+ organically Maintain credit quality IDEAS CONFERENCE – PAGE Financial performance Full integration
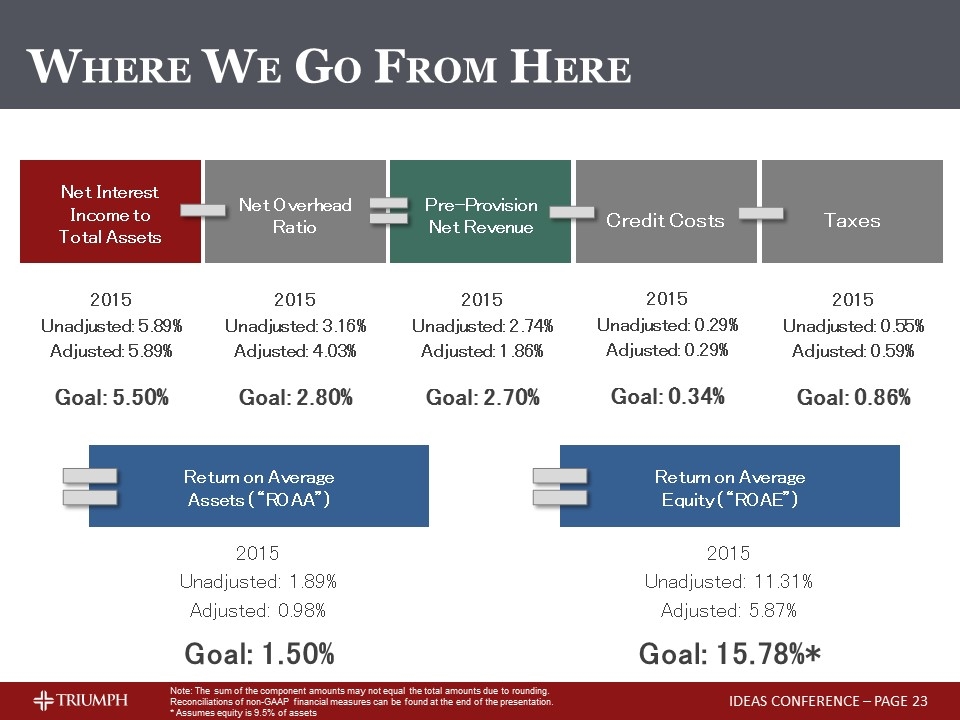
WHERE WE GO FROM HERE Return on Average Assets (“ROAA”) 2015 Unadjusted: 1.89% Adjusted: 0.98% Goal: 1.50% Net Overhead Ratio Net Interest Income to Total Assets Credit Costs Pre-Provision Net Revenue Taxes Note: The sum of the component amounts may not equal the total amounts due to rounding. Reconciliations of non-GAAP financial measures can be found at the end of the presentation. * Assumes equity is 9.5% of assets 2015 Unadjusted: 5.89% Adjusted: 5.89% Goal: 5.50% 2015 Unadjusted: 3.16% Adjusted: 4.03% Goal: 2.80% 2015 Unadjusted: 2.74% Adjusted: 1.86% Goal: 2.70% 2015 Unadjusted: 0.29% Adjusted: 0.29% Goal: 0.34% 2015 Unadjusted: 0.55% Adjusted: 0.59% Goal: 0.86% IDEAS CONFERENCE – PAGE Return on Average Equity (“ROAE”) 2015 Unadjusted: 11.31% Adjusted: 5.87% Goal: 15.78%*

APPENDIX
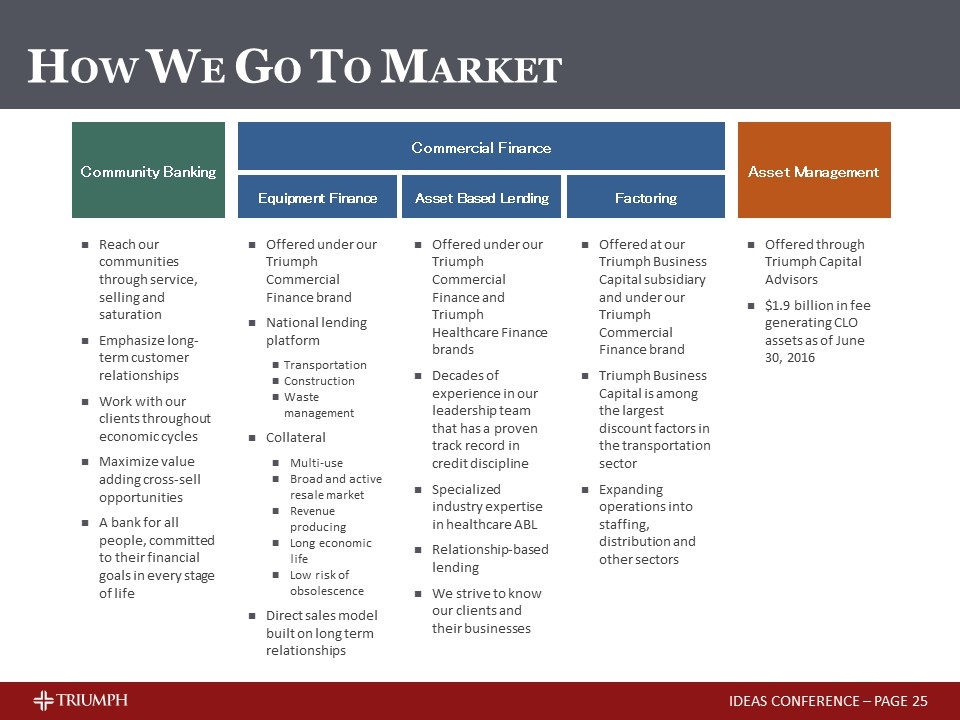
Community Banking Reach our communities through service, selling and saturation Emphasize long-term customer relationships Work with our clients throughout economic cycles Maximize value adding cross-sell opportunities A bank for all people, committed to their financial goals in every stage of life Factoring Offered at our Triumph Business Capital subsidiary and under our Triumph Commercial Finance brand Triumph Business Capital is among the largest discount factors in the transportation sector Expanding operations into staffing, distribution and other sectors Asset Based Lending Offered under our Triumph Commercial Finance and Triumph Healthcare Finance brands Decades of experience in our leadership team that has a proven track record in credit discipline Specialized industry expertise in healthcare ABL Relationship-based lending We strive to know our clients and their businesses Equipment Finance Offered under our Triumph Commercial Finance brand National lending platform Transportation Construction Waste management Collateral Multi-use Broad and active resale market Revenue producing Long economic life Low risk of obsolescence Direct sales model built on long term relationships Asset Management Offered through Triumph Capital Advisors $1.9 billion in fee generating CLO assets as of June 30, 2016 Commercial Finance HOW WE GO TO MARKET IDEAS CONFERENCE – PAGE
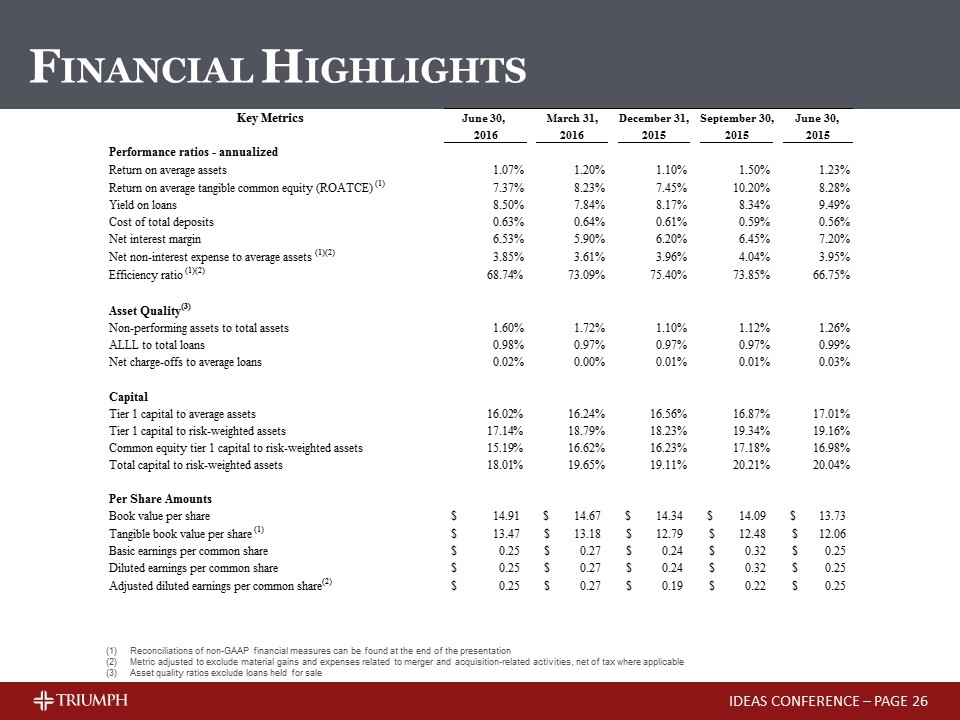
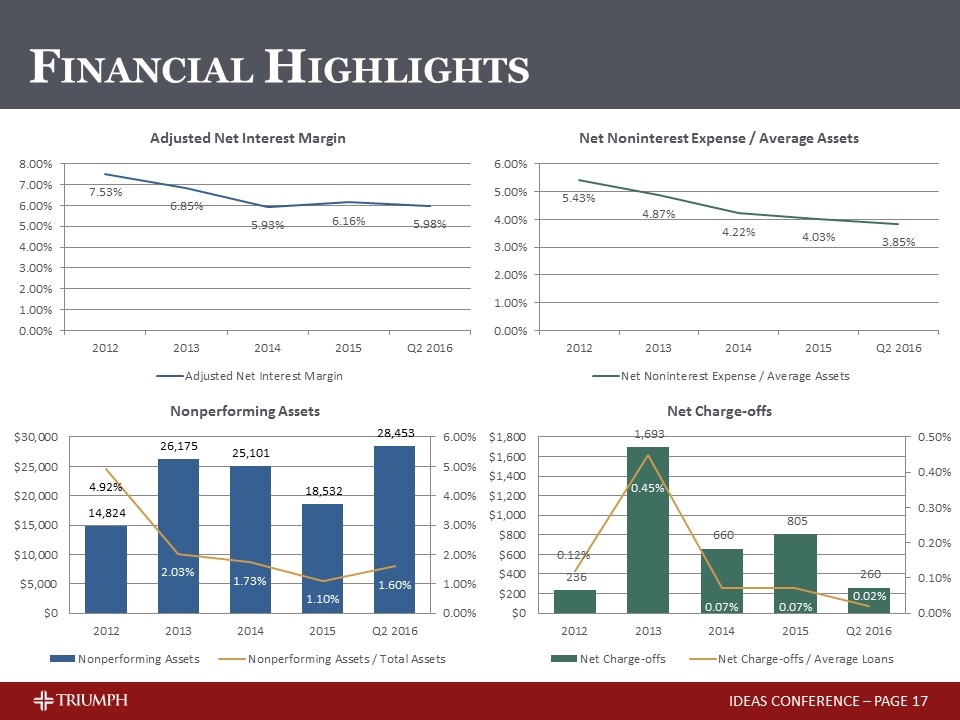
FINANCIAL HIGHLIGHTS Reconciliations of non-GAAP financial measures can be found at the end of the presentation Metric adjusted to exclude material gains and expenses related to merger and acquisition-related activities, net of tax where applicable Asset quality ratios exclude loans held for sale IDEAS CONFERENCE – PAGE 42551 42460 42369 42277 42185 As of and For the Three Months Ended Key Metrics June 30, March 31, December 31, September 30, June 30, 2016 2016 2015 2015 2015 Performance ratios - annualized Return on average assets Return on average assets 1.0674547900535052E-2 1.1966119434092952E-2 1.1010161353075008E-2 1.5020682981696912E-2 1.2347404317062754E-2 Return on average tangible common equity (ROATCE) Return on average tangible common equity (ROATCE) (1) 7.374386390880229E-2 8.228918603421137E-2 7.4497863158859354E-2 0.10203104285871456 8.2822836753880177E-2 Yield on loans Yield on loans 8.5000000000000006E-2 7.8399999999999997E-2 8.1699999999999995E-2 8.3393056676373922E-2 9.4944990035923063E-2 Cost of total deposits Cost of total deposits 6.294009519880947E-3 6.4457419322120537E-3 6.1061876467827661E-3 5.8852630913512095E-3 5.6097701311609068E-3 Net interest margin Net interest margin 6.5285878056964272E-2 5.9042361671899191E-2 6.2014715303038224E-2 6.453943023929222E-2 7.1999999999999995E-2 Net noninterest expense to average assets * Net non-interest expense to average assets (1)(2) 3.8454449851627055E-2 3.6082516141338401E-2 3.9624798740137912E-2 4.0433937534310162E-2 3.9462048685496381E-2 Efficiency ratio * Efficiency ratio (1)(2) 0.68743871513102284 0.73090644339279209 0.75401320298690522 0.73847093921857587 0.66753926701570676 Asset Quality(3) Nonperforming assets to total assets Non-performing assets to total assets 1.5954401576767908E-2 1.7213583403197664E-2 1.0957032577648252E-2 1.1220598179390419E-2 1.2602609499110353E-2 ALLL to total loans ALLL to total loans 9.7637889059196698E-3 9.7067039106145253E-3 9.7276460366054248E-3 9.7392982879454248E-3 9.943791810209086E-3 Net charge-offs to average loans Net charge-offs to average loans 20216707553661752.20216707554% 0.000000000000000% 13057887722384251.130578877223843% 71247937672647485.712479376726475% 33566027134224565.335660271342246% Capital Tier 1 capital to average assets Tier 1 capital to average assets 0.16016301346287154 0.16239999999999999 0.16560370302429414 0.16867377990679888 0.1701 Tier 1 capital to risk-weighted assets Tier 1 capital to risk-weighted assets 0.17138530020339404 0.18790000000000001 0.18229999999999999 0.19339328651541973 0.19159999999999999 Common equity tier 1 capital to risk-weighted assets Common equity tier 1 capital to risk-weighted assets 0.15190831175754529 0.16619999999999999 0.1623 0.17179944765737226 0.16980000000000001 Total capital to risk-weighted assets Total capital to risk-weighted assets 0.18009725306868427 0.19650000000000001 0.19109999999999999 0.20211485520698524 0.20039999999999999 Per Share Amounts Book value per share Book value per share $14.911910747666727 $14.67453038155141 $14.335077008802211 $14.089352740942495 $13.731660106450438 Tangible book value per share Tangible book value per share (1) $13.467204585968915 $13.18259962866262 $12.789177744724778 $12.482080266087628 $12.05914015918788 Basic earnings per share Basic earnings per common share $0.24812873510521288 $0.27006809871285342 $0.24301653264314707 $0.32358998408211775 $0.25165614009452675 Diluted earnings per share Diluted earnings per common share $0.24561230832499889 $0.26759971928577253 $0.24072139059966988 $0.3189070282330756 $0.2502109749029191 Adjusted diluted earnings per share Adjusted diluted earnings per common share(2) $0.24558565194510656 $0.26837665910207986 $0.19 $0.22466051083467745 $0.25019893257062986 Net noninterest expense to average assets Unadjusted Net noninterest expense to average assets (1) 3.8454449851627055E-2 3.6082516141338401E-2 3.742732692185357E-2 3.6104231415205072E-2 3.9462048685496381E-2
COMMERCIAL FINANCE PRIMER IDEAS CONFERENCE – PAGE
ASSET BASED LENDING (ABL) IDEAS CONFERENCE – PAGE
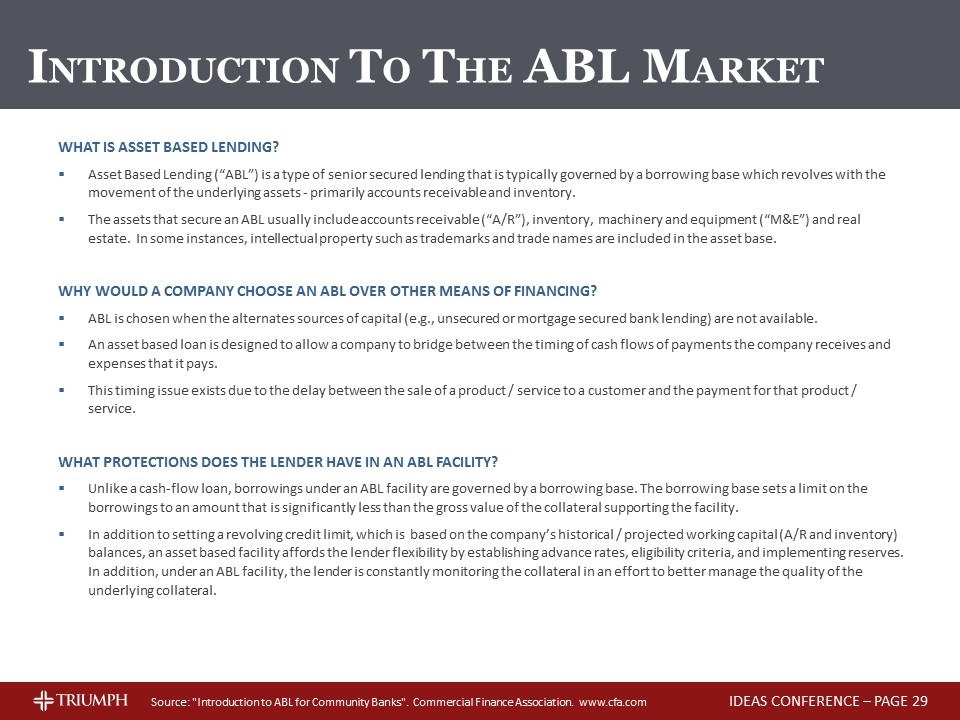
What is Asset Based Lending? Asset Based Lending (“ABL”) is a type of senior secured lending that is typically governed by a borrowing base which revolves with the movement of the underlying assets - primarily accounts receivable and inventory. The assets that secure an ABL usually include accounts receivable (“A/R”), inventory, machinery and equipment (“M&E”) and real estate. In some instances, intellectual property such as trademarks and trade names are included in the asset base. Why would a company choose an ABL over other means of financing? ABL is chosen when the alternates sources of capital (e.g., unsecured or mortgage secured bank lending) are not available. An asset based loan is designed to allow a company to bridge between the timing of cash flows of payments the company receives and expenses that it pays. This timing issue exists due to the delay between the sale of a product / service to a customer and the payment for that product / service. What protections does the lender have in an ABL facility? Unlike a cash-flow loan, borrowings under an ABL facility are governed by a borrowing base. The borrowing base sets a limit on the borrowings to an amount that is significantly less than the gross value of the collateral supporting the facility. In addition to setting a revolving credit limit, which is based on the company’s historical / projected working capital (A/R and inventory) balances, an asset based facility affords the lender flexibility by establishing advance rates, eligibility criteria, and implementing reserves. In addition, under an ABL facility, the lender is constantly monitoring the collateral in an effort to better manage the quality of the underlying collateral. Source: "Introduction to ABL for Community Banks". Commercial Finance Association. www.cfa.com INTRODUCTION TO THE ABL MARKET IDEAS CONFERENCE – PAGE
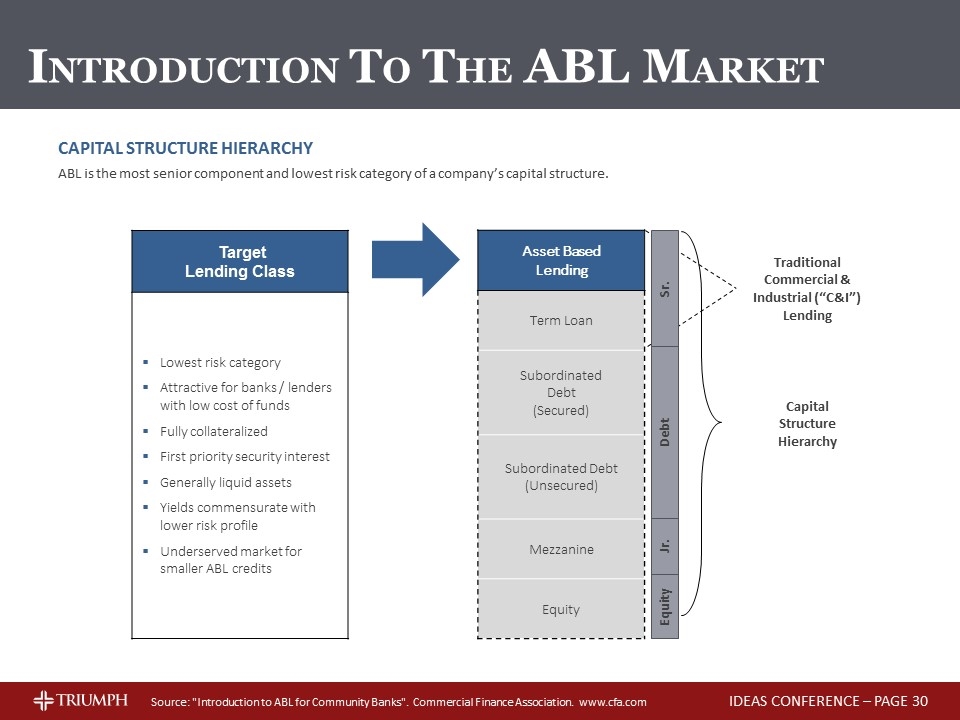
Capital Structure Hierarchy ABL is the most senior component and lowest risk category of a company’s capital structure. Target Lending Class Lowest risk category Attractive for banks / lenders with low cost of funds Fully collateralized First priority security interest Generally liquid assets Yields commensurate with lower risk profile Underserved market for smaller ABL credits Asset Based Lending Term Loan Subordinated Debt (Secured) Subordinated Debt (Unsecured) Mezzanine Equity Equity Capital Structure Hierarchy Traditional Commercial & Industrial (“C&I”) Lending Source: "Introduction to ABL for Community Banks". Commercial Finance Association. www.cfa.com Jr. Debt Sr. INTRODUCTION TO THE ABL MARKET IDEAS CONFERENCE – PAGE
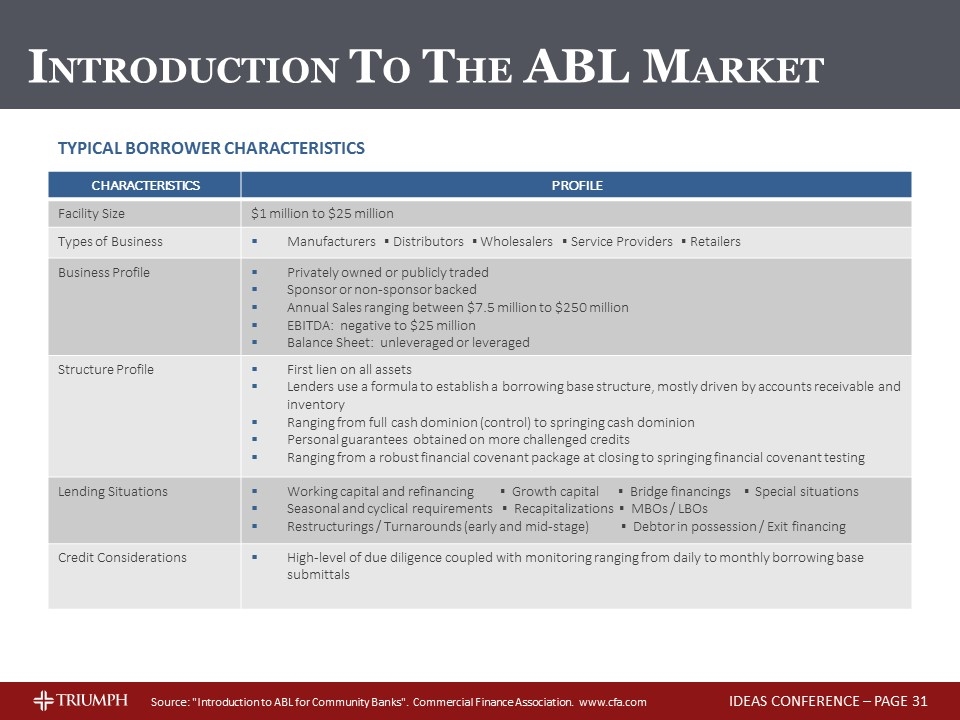
CHARACTERISTICS PROFILE Facility Size $1 million to $25 million Types of Business Manufacturers ▪ Distributors ▪ Wholesalers ▪ Service Providers ▪ Retailers Business Profile Privately owned or publicly traded Sponsor or non-sponsor backed Annual Sales ranging between $7.5 million to $250 million EBITDA: negative to $25 million Balance Sheet: unleveraged or leveraged Structure Profile First lien on all assets Lenders use a formula to establish a borrowing base structure, mostly driven by accounts receivable and inventory Ranging from full cash dominion (control) to springing cash dominion Personal guarantees obtained on more challenged credits Ranging from a robust financial covenant package at closing to springing financial covenant testing Lending Situations Working capital and refinancing ▪ Growth capital ▪ Bridge financings ▪ Special situations Seasonal and cyclical requirements ▪ Recapitalizations ▪ MBOs / LBOs Restructurings / Turnarounds (early and mid-stage) ▪ Debtor in possession / Exit financing Credit Considerations High-level of due diligence coupled with monitoring ranging from daily to monthly borrowing base submittals Source: "Introduction to ABL for Community Banks". Commercial Finance Association. www.cfa.com Typical Borrower Characteristics INTRODUCTION TO THE ABL MARKET IDEAS CONFERENCE – PAGE
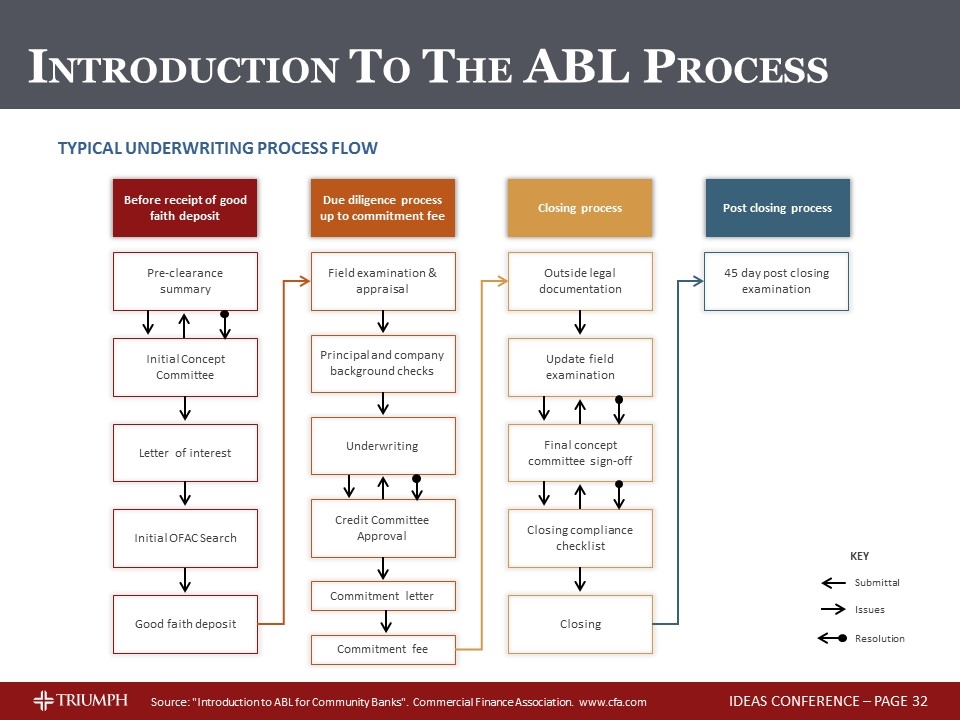
Source: "Introduction to ABL for Community Banks". Commercial Finance Association. www.cfa.com Typical Underwriting Process Flow Before receipt of good faith deposit Due diligence process up to commitment fee Closing process Post closing process Pre-clearance summary Initial Concept Committee Letter of interest Initial OFAC Search Good faith deposit Field examination & appraisal Principal and company background checks Underwriting Credit Committee Approval Commitment letter Commitment fee Outside legal documentation Update field examination Final concept committee sign-off Closing compliance checklist Closing 45 day post closing examination Submittal Issues Resolution KEY INTRODUCTION TO THE ABL PROCESS IDEAS CONFERENCE – PAGE
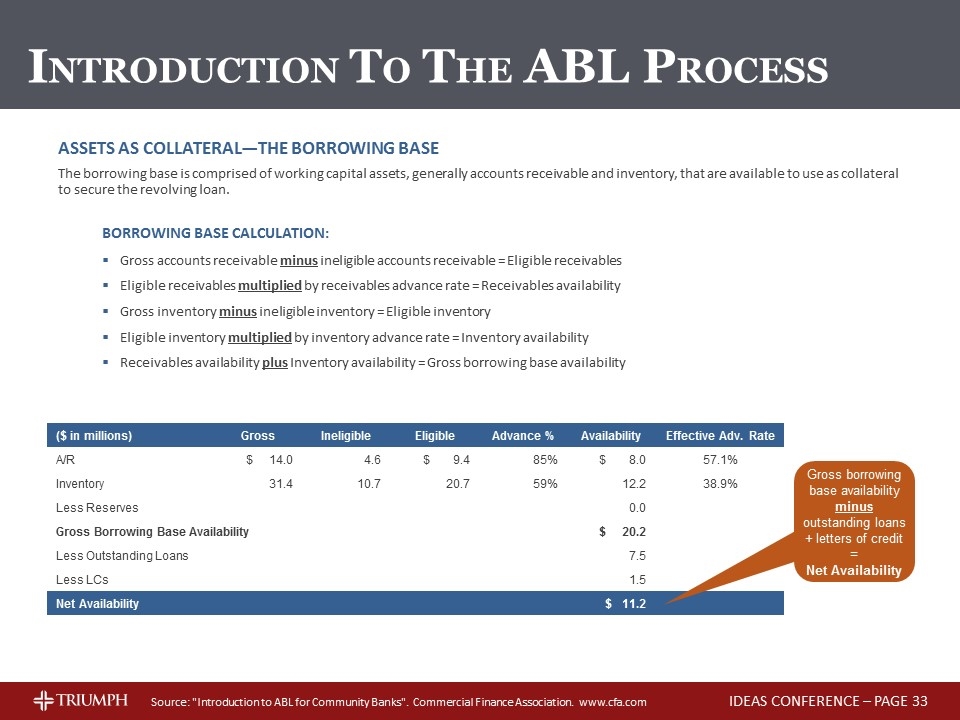
Source: "Introduction to ABL for Community Banks". Commercial Finance Association. www.cfa.com Assets as Collateral—The Borrowing Base The borrowing base is comprised of working capital assets, generally accounts receivable and inventory, that are available to use as collateral to secure the revolving loan. Borrowing Base Calculation: Gross accounts receivable minus ineligible accounts receivable = Eligible receivables Eligible receivables multiplied by receivables advance rate = Receivables availability Gross inventory minus ineligible inventory = Eligible inventory Eligible inventory multiplied by inventory advance rate = Inventory availability Receivables availability plus Inventory availability = Gross borrowing base availability ($ in millions) Gross Ineligible Eligible Advance % Availability Effective Adv. Rate A/R $ 14.0 4.6 $ 9.4 85% $ 8.0 57.1% Inventory 31.4 10.7 20.7 59% 12.2 38.9% Less Reserves 0.0 Gross Borrowing Base Availability $ 20.2 Less Outstanding Loans 7.5 Less LCs 1.5 Net Availability $ 11.2 Gross borrowing base availability minus outstanding loans + letters of credit = Net Availability INTRODUCTION TO THE ABL PROCESS IDEAS CONFERENCE – PAGE
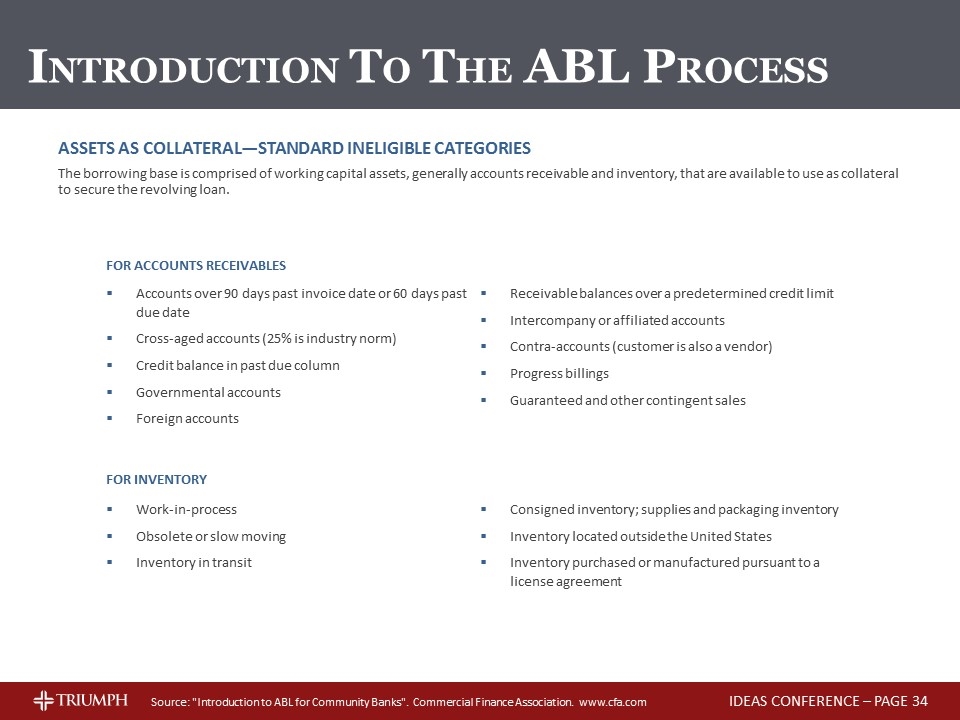
For Inventory Work-in-process Obsolete or slow moving Inventory in transit Consigned inventory; supplies and packaging inventory Inventory located outside the United States Inventory purchased or manufactured pursuant to a license agreement For Accounts Receivables Source: "Introduction to ABL for Community Banks". Commercial Finance Association. www.cfa.com Assets as Collateral—Standard Ineligible Categories The borrowing base is comprised of working capital assets, generally accounts receivable and inventory, that are available to use as collateral to secure the revolving loan. Accounts over 90 days past invoice date or 60 days past due date Cross-aged accounts (25% is industry norm) Credit balance in past due column Governmental accounts Foreign accounts Receivable balances over a predetermined credit limit Intercompany or affiliated accounts Contra-accounts (customer is also a vendor) Progress billings Guaranteed and other contingent sales INTRODUCTION TO THE ABL PROCESS IDEAS CONFERENCE – PAGE
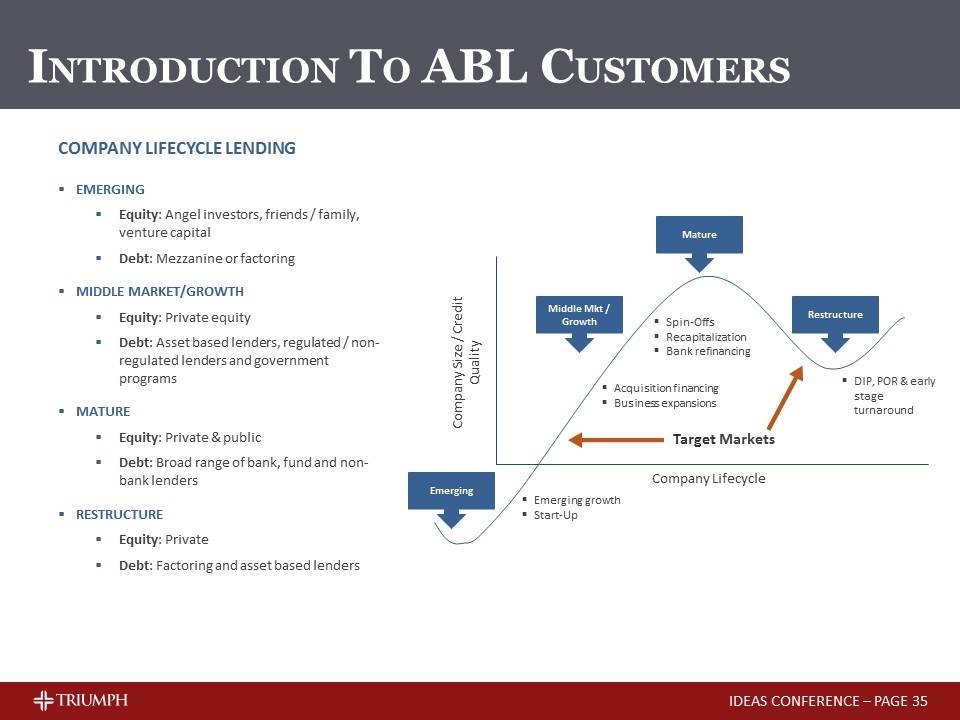
Emerging Middle Mkt / Growth Mature Restructure Emerging growth Start-Up Acquisition financing Business expansions Spin-Offs Recapitalization Bank refinancing DIP, POR & early stage turnaround Company Lifecycle Company Size / Credit Quality Target Markets Company Lifecycle Lending Emerging Equity: Angel investors, friends / family, venture capital Debt: Mezzanine or factoring Middle Market/Growth Equity: Private equity Debt: Asset based lenders, regulated / non-regulated lenders and government programs Mature Equity: Private & public Debt: Broad range of bank, fund and non-bank lenders Restructure Equity: Private Debt: Factoring and asset based lenders INTRODUCTION TO ABL CUSTOMERS IDEAS CONFERENCE – PAGE
FACTORING IDEAS CONFERENCE – PAGE
Invoice factoring is a style of working capital finance by which businesses (“clients”) sell their invoices (“accounts” or “accounts receivable”) to a third party commercial financial company, also known as a “factor”. Accounts are typically sold at a discount to their face value, thereby generating fee revenue for the factor. By selling its accounts, rather than borrowing from a bank, a factoring transaction simply converts one asset (accounts) into another asset (cash). Factoring does not put debt on a client’s balance sheet as there are no loans to repay. Upon acquiring the accounts, the factor (i.e., Triumph Business Capital) is provided a perfected interest in the acquired assets enabling it to collect directly from the client’s customer (referred to as the “account debtor”), which becomes the factor’s primary source of repayment. Transactions are 100% business-to-business, without involvement of non-commercial consumers. In the transportation sector, for example, the account debtors are ultimately the shippers who procure trucking services from Triumph Business Capital’s clients. Intermediaries, such as freight brokers and logistics companies, may be involved in the transaction as well. Because the invoices represent completed services with documented acceptance, freight bills represent some of the strongest collateral available to factors , and are substantially free of setoff or recoupment. Since trucking firms typically carry freight for different commodities, credit risk is enhanced by a broad range of industry diversification. To further reduce their exposure, many factors will engage only in ‘recourse’ factoring transactions, in which the factor may “charge back” uncollected or problem accounts to the client, regardless of reason for non-payment. In “non-recourse” factoring, the factor assumes full responsibility for the credit risk associated with the account debtor. Triumph Business Capital offers factoring in both “recourse” and “non-recourse” structures. Beginning in 2014, Triumph Business Capital expanded its product offering to non-transportation, or “General”, clients, which present collateral with credit qualities and servicing protocols that are fundamentally similar to its existing transportation portfolio. The four basic factoring “products” are illustrated on the following page. FACTORING OVERVIEW IDEAS CONFERENCE – PAGE
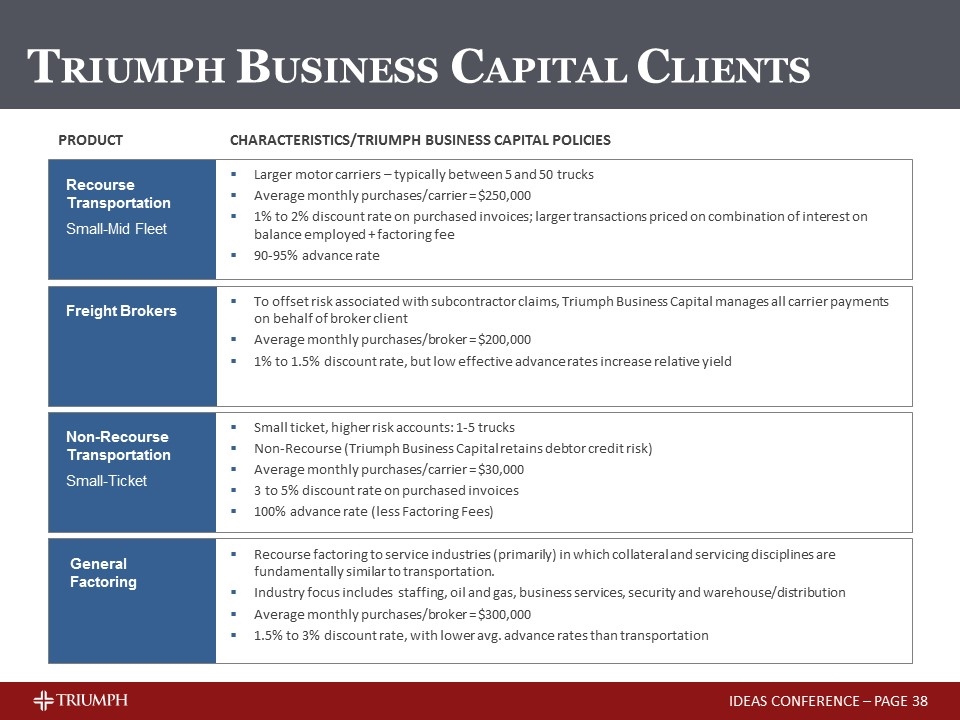
Non-Recourse Transportation Small-Ticket Recourse Transportation Small-Mid Fleet Freight Brokers General Factoring Small ticket, higher risk accounts: 1-5 trucks Non-Recourse (Triumph Business Capital retains debtor credit risk) Average monthly purchases/carrier = $30,000 3 to 5% discount rate on purchased invoices 100% advance rate (less Factoring Fees) To offset risk associated with subcontractor claims, Triumph Business Capital manages all carrier payments on behalf of broker client Average monthly purchases/broker = $200,000 1% to 1.5% discount rate, but low effective advance rates increase relative yield Larger motor carriers – typically between 5 and 50 trucks Average monthly purchases/carrier = $250,000 1% to 2% discount rate on purchased invoices; larger transactions priced on combination of interest on balance employed + factoring fee 90-95% advance rate Recourse factoring to service industries (primarily) in which collateral and servicing disciplines are fundamentally similar to transportation. Industry focus includes staffing, oil and gas, business services, security and warehouse/distribution Average monthly purchases/broker = $300,000 1.5% to 3% discount rate, with lower avg. advance rates than transportation Product Characteristics/Triumph Business Capital Policies TRIUMPH BUSINESS CAPITAL CLIENTS IDEAS CONFERENCE – PAGE

In all cases, a factor is in a primary, first-lien position against its client’s accounts receivable. There may be other liens on the accounts, but these are subordinate to the factor. An acceptable invoice is one that has no outstanding contingencies affecting the purchaser’s obligation for payment. In evaluating accounts receivable, a factor must first determine which assets are ineligible for advances. This process requires clearly defined procedures relating to account delinquencies, cross-aging, accounts due from affiliates (or otherwise subject to setoff), account debtor concentrations, etc. Most factors advance up to 95% of the face value of the invoice. The unfunded portion is held in a “client reserve’’, which factors use as protection against uncollected and/or doubtful accounts. When the invoices are paid, the factor will classify the client reserve as earned (or “cash reserve”), from which will be subtracted applicable discount fees, short-pays and any other amounts owed by the client to the factor. As an example, if a recourse factoring transaction has a 90 day repurchase provision, the factor may debit expired/ineligible accounts from the client’s reserve account. Factors ultimately distribute the cash reserve balances to the client’s designated bank account on a periodic basis, provided that the aggregate reserve does not fall below the contracted threshold against aggregate purchases. Given the strength of the contractual structure, a factor’s substantive risk of loss tends to be associated with client fraud – such as collateral misrepresentation and/or conversion of cash payments. Consequently, the most effective risk management programs focus on ongoing fraud detection, monitoring and vigilance, in addition to initial underwriting disciplines. The page which follows provides an example of a typical factoring transaction. COLLATERAL ACCEPTABILITY AND CLIENT RESERVES IDEAS CONFERENCE – PAGE
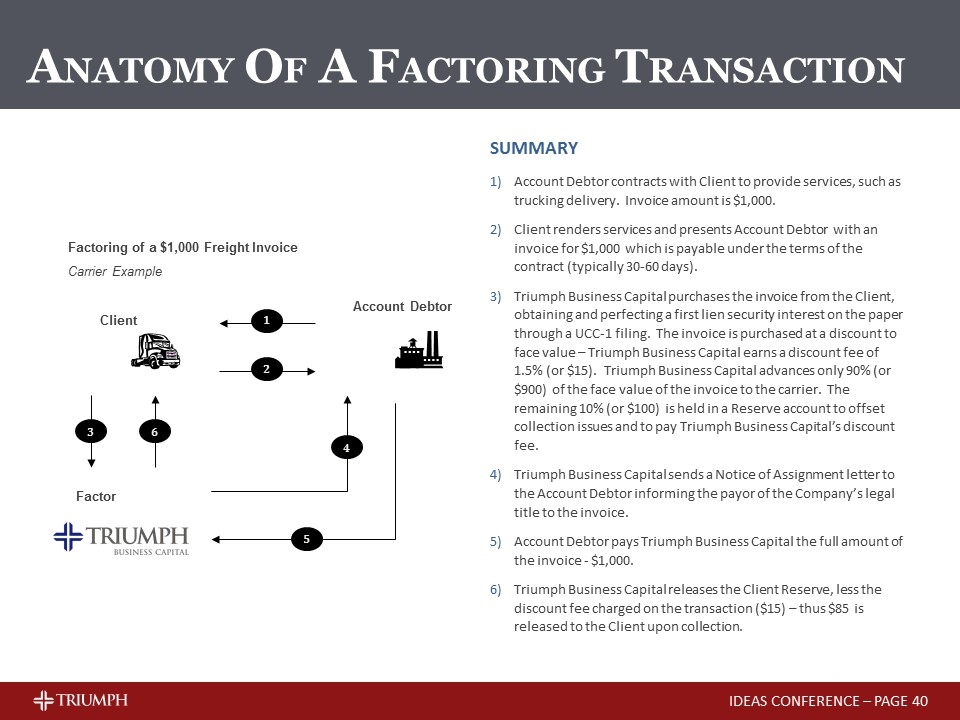
Factoring of a $1,000 Freight Invoice Carrier Example Client Account Debtor Factor 1 2 3 6 4 5 Summary Account Debtor contracts with Client to provide services, such as trucking delivery. Invoice amount is $1,000. Client renders services and presents Account Debtor with an invoice for $1,000 which is payable under the terms of the contract (typically 30-60 days). Triumph Business Capital purchases the invoice from the Client, obtaining and perfecting a first lien security interest on the paper through a UCC-1 filing. The invoice is purchased at a discount to face value – Triumph Business Capital earns a discount fee of 1.5% (or $15). Triumph Business Capital advances only 90% (or $900) of the face value of the invoice to the carrier. The remaining 10% (or $100) is held in a Reserve account to offset collection issues and to pay Triumph Business Capital’s discount fee. Triumph Business Capital sends a Notice of Assignment letter to the Account Debtor informing the payor of the Company’s legal title to the invoice. Account Debtor pays Triumph Business Capital the full amount of the invoice - $1,000. Triumph Business Capital releases the Client Reserve, less the discount fee charged on the transaction ($15) – thus $85 is released to the Client upon collection. ANATOMY OF A FACTORING TRANSACTION IDEAS CONFERENCE – PAGE
NON-GAAP FINANCIAL RECONCILATIONS IDEAS CONFERENCE – PAGE
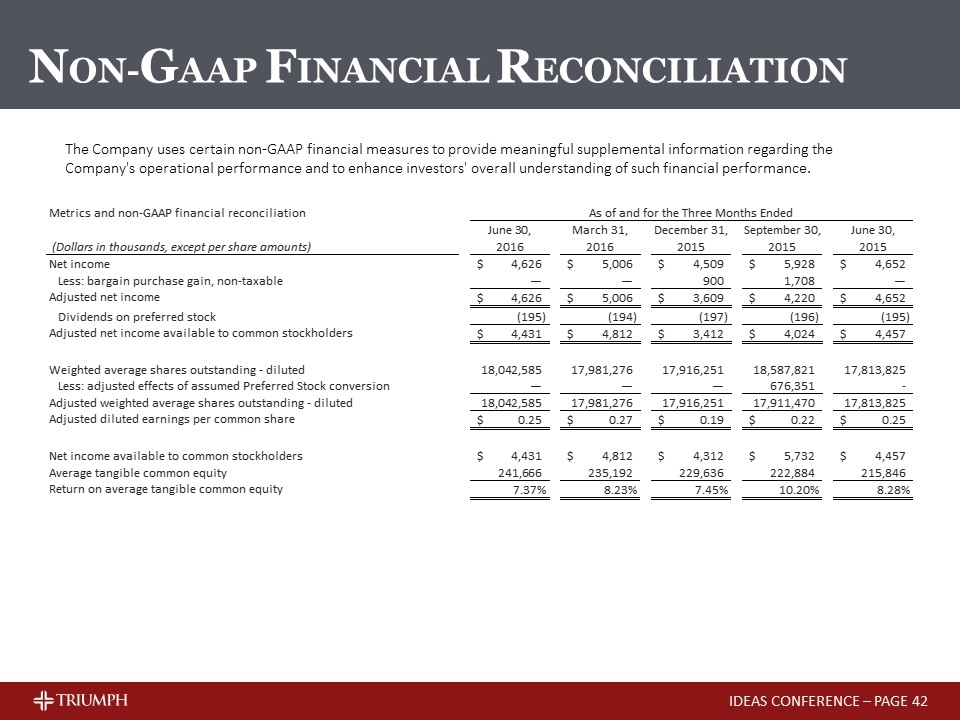
NON-GAAP FINANCIAL RECONCILIATION The Company uses certain non-GAAP financial measures to provide meaningful supplemental information regarding the Company's operational performance and to enhance investors' overall understanding of such financial performance. IDEAS CONFERENCE – PAGE Metrics and non-GAAP financial reconciliation As of and for the Three Months Ended June 30, March 31, December 31, September 30, June 30, (Dollars in thousands, except per share amounts) 2016 2016 2015 2015 2015 Net income $4,626 $5,006 $4,509 $5,928 $4,652 Less: bargain purchase gain, non-taxable 0 0 900 1,708 0 Adjusted net income $4,626 $5,006 $3,609 $4,220 $4,652 Dividends on preferred stock -,195 -,194 -,197 -,196 -,195 Adjusted net income available to common stockholders $4,431 $4,812 $3,412 $4,024 $4,457 Weighted average shares outstanding - diluted 18,042,585 17,981,276 17,916,251.228260871 18,587,821 17,813,825 Less: adjusted effects of assumed Preferred Stock conversion 0 0 0 ,676,351 0 Adjusted weighted average shares outstanding - diluted 18,042,585 17,981,276 17,916,251.228260871 17,911,470 17,813,825 Adjusted diluted earnings per common share $0.24558565194510656 $0.26761170897994113 $0.19044162512177512 $0.22466051083467745 $0.25019893257062986 Net income available to common stockholders $4,431 $4,812 $4,312 $5,732 $4,457 Average tangible common equity ,241,665.64849015599 ,235,191.51529098698 ,229,635.61567069197 ,222,884.39175000001 ,215,845.60004000002 Return on average tangible common equity 7.374397117143669E-2 8.2289355624981242E-2 7.4497987842097685E-2 0.1020308635251115 8.2822990223868825E-2 Metrics and non-GAAP financial reconciliation (cont'd) As of and for the Three Months Ended June 30, March 31, December 31, September 30, June 30, (Dollars in thousands, except per share amounts) 2016 2016 2015 2015 2015 Efficiency ratio: Net interest income $25,907 $22,489 $23,050 $23,231 $24,645 Non-interest income 3,668 4,981 5,571 6,298 4,769 Operating revenue 29,575 27,470 28,621 29,529 29,414 Less: bargain purchase gain 0 0 900 1,708 0 Adjusted operating revenue $29,575 $27,470 $27,721 $27,821 $29,414 Total non-interest expenses $20,331 $20,078 $20,902 $20,545 $19,635 Efficiency ratio 0.68743871513102284 0.73090644339279209 0.75401320298690522 0.73847093921857587 0.66753926701570676 Net non-interest expense to average assets ratio: Total non-interest expenses $20,331 $20,078 $20,902 $20,545 $19,635 Total non-interest income $3,668 $4,981 $5,571 $6,298 $4,769 Less: bargain purchase gain 0 0 900 1,708 0 Adjusted non-interest income $3,668 $4,981 $4,671 $4,590 $4,769 Adjusted net non-interest expenses $16,663 $15,097 $16,231 $15,955 $14,866 Average total assets 1,742,941.6025053489 1,682,640.3261250083 1,624,890.9971008352 1,565,697.7617899999 1,511,045.2271500002 Net non-interest expense to average assets ratio 3.8451213559815241E-2 3.6086025786411083E-2 3.9630183425081428E-2 4.0429085233219919E-2 3.9461004585432884E-2 Metrics and non-GAAP financial reconciliation (cont'd) As of and for the Three Months Ended June 30, March 31, December 31, September 30, June 30, (Dollars in thousands, except per share amounts) 2016 2016 2015 2015 2015 Reported yield on loans 8.500000000000001% 7.84% 8.17% 8.339305667637392% 9.494499003592306% Effect of accretion income on acquired loans -0.69% -0.37% -0.326781499036891% -0.379776514834469% -0.5343431197411% Adjusted yield on loans 7.8145862782929204E-2 7.4673496519255061E-2 7.8432185009631089E-2 7.959529152802923E-2 8.9601558838512063E-2 Reported net interest margin 6.528587805696427% 5.904236167189919% 6.201471530303822% 6.453943023929222% 7.2% Effect of accretion income on acquired loans -0.55% -0.29% -0.26% -0.31% -0.42% Adjusted net interest margin 5.9751386852355905E-2 5.6056483316736079E-2 5.941208443951064E-2 6.1436271756382291E-2 6.7780562435600544E-2 Total stockholders' equity $,279,763 $,274,114 $,268,038 $,263,919 $,257,479 Less: Preferred stock liquidation preference 9,746 9,746 9,746 9,746 9,746 Total common stockholders' equity ,270,017 ,264,368 ,258,292 ,254,173 ,247,733 Less: Goodwill and other intangibles 26,160 26,877 27,854 28,995 30,174 Tangible common stockholders' equity $,243,857 $,237,491 $,230,438 $,225,178 $,217,559 Common shares outstanding at end of period 18,107,493 18,015,423 18,018,200 18,040,072 18,041,072 Tangible book value per share $13.46718731300904 $13.182649111264276 $12.789179829283725 $12.482100958355376 $12.059094936265428 Total assets at end of period $1,783,395 $1,687,795 $1,691,313 $1,581,463 $1,529,259 Less: Goodwill and other intangibles 26,160 26,877 27,854 28,995 30,174 Adjusted total assets at period end $1,757,235 $1,660,918 $1,663,459 $1,552,468 $1,499,085 Tangible common stockholders' equity ratio 0.13877312937654895 0.14298779349733098 0.13852941370962554 0.14504517967520103 0.14512786132874386
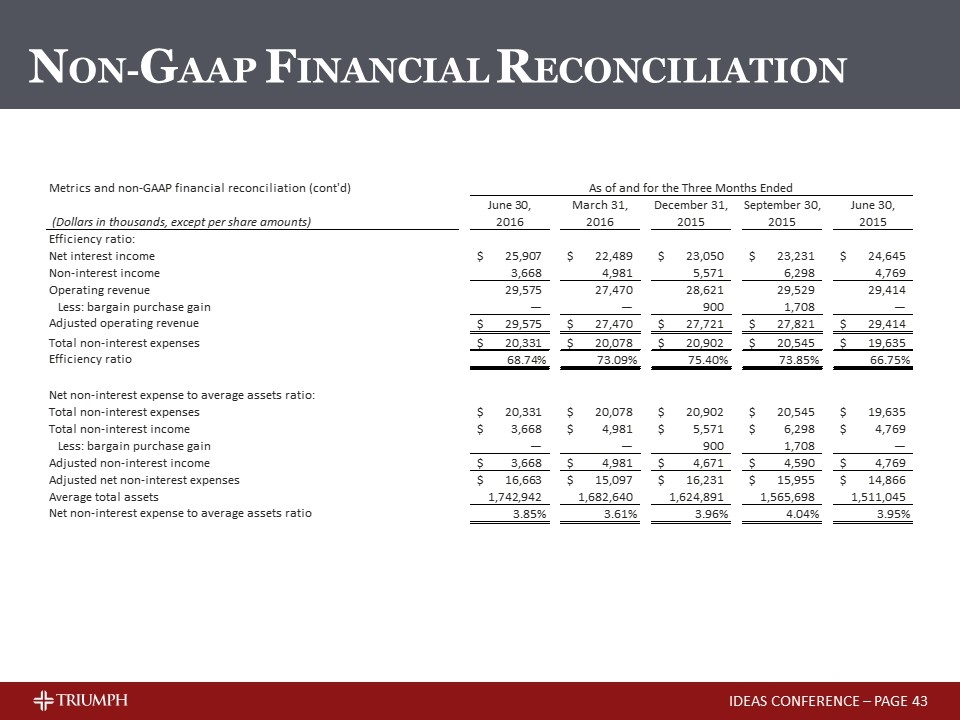
NON-GAAP FINANCIAL RECONCILIATION IDEAS CONFERENCE – PAGE Metrics and non-GAAP financial reconciliation As of and for the Three Months Ended June 30, March 31, December 31, September 30, June 30, (Dollars in thousands, except per share amounts) 2016 2016 2015 2015 2015 Net income $4,626 $5,006 $4,509 $5,928 $4,652 Less: bargain purchase gain, non-taxable 0 0 900 1,708 0 Adjusted net income $4,626 $5,006 $3,609 $4,220 $4,652 Dividends on preferred stock -,195 -,194 -,197 -,196 -,195 Adjusted net income available to common stockholders $4,431 $4,812 $3,412 $4,024 $4,457 Weighted average shares outstanding - diluted 18,042,585 17,981,276 17,916,251.228260871 18,587,821 17,813,825 Less: adjusted effects of assumed Preferred Stock conversion 0 0 0 ,676,351 0 Adjusted weighted average shares outstanding - diluted 18,042,585 17,981,276 17,916,251.228260871 17,911,470 17,813,825 Adjusted diluted earnings per common share $0.24558565194510656 $0.26761170897994113 $0.19044162512177512 $0.22466051083467745 $0.25019893257062986 Net income available to common stockholders $4,431 $4,812 $4,312 $5,732 $4,457 Average tangible common equity ,241,665.64849015599 ,235,191.51529098698 ,229,635.61567069197 ,222,884.39175000001 ,215,845.60004000002 Return on average tangible common equity 7.374397117143669E-2 8.2289355624981242E-2 7.4497987842097685E-2 0.1020308635251115 8.2822990223868825E-2 Metrics and non-GAAP financial reconciliation (cont'd) As of and for the Three Months Ended June 30, March 31, December 31, September 30, June 30, (Dollars in thousands, except per share amounts) 2016 2016 2015 2015 2015 Efficiency ratio: Net interest income $25,907 $22,489 $23,050 $23,231 $24,645 Non-interest income 3,668 4,981 5,571 6,298 4,769 Operating revenue 29,575 27,470 28,621 29,529 29,414 Less: bargain purchase gain 0 0 900 1,708 0 Adjusted operating revenue $29,575 $27,470 $27,721 $27,821 $29,414 Total non-interest expenses $20,331 $20,078 $20,902 $20,545 $19,635 Efficiency ratio 0.68743871513102284 0.73090644339279209 0.75401320298690522 0.73847093921857587 0.66753926701570676 Net non-interest expense to average assets ratio: Total non-interest expenses $20,331 $20,078 $20,902 $20,545 $19,635 Total non-interest income $3,668 $4,981 $5,571 $6,298 $4,769 Less: bargain purchase gain 0 0 900 1,708 0 Adjusted non-interest income $3,668 $4,981 $4,671 $4,590 $4,769 Adjusted net non-interest expenses $16,663 $15,097 $16,231 $15,955 $14,866 Average total assets 1,742,941.6025053489 1,682,640.3261250083 1,624,890.9971008352 1,565,697.7617899999 1,511,045.2271500002 Net non-interest expense to average assets ratio 3.8451213559815241E-2 3.6086025786411083E-2 3.9630183425081428E-2 4.0429085233219919E-2 3.9461004585432884E-2 Metrics and non-GAAP financial reconciliation (cont'd) As of and for the Three Months Ended June 30, March 31, December 31, September 30, June 30, (Dollars in thousands, except per share amounts) 2016 2016 2015 2015 2015 Reported yield on loans 8.500000000000001% 7.84% 8.17% 8.339305667637392% 9.494499003592306% Effect of accretion income on acquired loans -0.69% -0.37% -0.326781499036891% -0.379776514834469% -0.5343431197411% Adjusted yield on loans 7.8145862782929204E-2 7.4673496519255061E-2 7.8432185009631089E-2 7.959529152802923E-2 8.9601558838512063E-2 Reported net interest margin 6.528587805696427% 5.904236167189919% 6.201471530303822% 6.453943023929222% 7.2% Effect of accretion income on acquired loans -0.55% -0.29% -0.26% -0.31% -0.42% Adjusted net interest margin 5.9751386852355905E-2 5.6056483316736079E-2 5.941208443951064E-2 6.1436271756382291E-2 6.7780562435600544E-2 Total stockholders' equity $,279,763 $,274,114 $,268,038 $,263,919 $,257,479 Less: Preferred stock liquidation preference 9,746 9,746 9,746 9,746 9,746 Total common stockholders' equity ,270,017 ,264,368 ,258,292 ,254,173 ,247,733 Less: Goodwill and other intangibles 26,160 26,877 27,854 28,995 30,174 Tangible common stockholders' equity $,243,857 $,237,491 $,230,438 $,225,178 $,217,559 Common shares outstanding at end of period 18,107,493 18,015,423 18,018,200 18,040,072 18,041,072 Tangible book value per share $13.46718731300904 $13.182649111264276 $12.789179829283725 $12.482100958355376 $12.059094936265428 Total assets at end of period $1,783,395 $1,687,795 $1,691,313 $1,581,463 $1,529,259 Less: Goodwill and other intangibles 26,160 26,877 27,854 28,995 30,174 Adjusted total assets at period end $1,757,235 $1,660,918 $1,663,459 $1,552,468 $1,499,085 Tangible common stockholders' equity ratio 0.13877312937654895 0.14298779349733098 0.13852941370962554 0.14504517967520103 0.14512786132874386

NON-GAAP FINANCIAL RECONCILIATION IDEAS CONFERENCE – PAGE Metrics and non-GAAP financial reconciliation As of and for the Three Months Ended June 30, March 31, December 31, September 30, June 30, (Dollars in thousands, except per share amounts) 2016 2016 2015 2015 2015 Net income $4,626 $5,006 $4,509 $5,928 $4,652 Less: bargain purchase gain, non-taxable 0 0 900 1,708 0 Adjusted net income $4,626 $5,006 $3,609 $4,220 $4,652 Dividends on preferred stock -,195 -,194 -,197 -,196 -,195 Adjusted net income available to common stockholders $4,431 $4,812 $3,412 $4,024 $4,457 Weighted average shares outstanding - diluted 18,042,585 17,981,276 17,916,251.228260871 18,587,821 17,813,825 Less: adjusted effects of assumed Preferred Stock conversion 0 0 0 ,676,351 0 Adjusted weighted average shares outstanding - diluted 18,042,585 17,981,276 17,916,251.228260871 17,911,470 17,813,825 Adjusted diluted earnings per common share $0.24558565194510656 $0.26761170897994113 $0.19044162512177512 $0.22466051083467745 $0.25019893257062986 Net income available to common stockholders $4,431 $4,812 $4,312 $5,732 $4,457 Average tangible common equity ,241,665.64849015599 ,235,191.51529098698 ,229,635.61567069197 ,222,884.39175000001 ,215,845.60004000002 Return on average tangible common equity 7.374397117143669E-2 8.2289355624981242E-2 7.4497987842097685E-2 0.1020308635251115 8.2822990223868825E-2 Metrics and non-GAAP financial reconciliation (cont'd) As of and for the Three Months Ended June 30, March 31, December 31, September 30, June 30, (Dollars in thousands, except per share amounts) 2016 2016 2015 2015 2015 Efficiency ratio: Net interest income $25,907 $22,489 $23,050 $23,231 $24,645 Non-interest income 3,668 4,981 5,571 6,298 4,769 Operating revenue 29,575 27,470 28,621 29,529 29,414 Less: bargain purchase gain 0 0 900 1,708 0 Adjusted operating revenue $29,575 $27,470 $27,721 $27,821 $29,414 Total non-interest expenses $20,331 $20,078 $20,902 $20,545 $19,635 Efficiency ratio 0.68743871513102284 0.73090644339279209 0.75401320298690522 0.73847093921857587 0.66753926701570676 Net non-interest expense to average assets ratio: Total non-interest expenses $20,331 $20,078 $20,902 $20,545 $19,635 Total non-interest income $3,668 $4,981 $5,571 $6,298 $4,769 Less: bargain purchase gain 0 0 900 1,708 0 Adjusted non-interest income $3,668 $4,981 $4,671 $4,590 $4,769 Adjusted net non-interest expenses $16,663 $15,097 $16,231 $15,955 $14,866 Average total assets 1,742,941.6025053489 1,682,640.3261250083 1,624,890.9971008352 1,565,697.7617899999 1,511,045.2271500002 Net non-interest expense to average assets ratio 3.8451213559815241E-2 3.6086025786411083E-2 3.9630183425081428E-2 4.0429085233219919E-2 3.9461004585432884E-2 Metrics and non-GAAP financial reconciliation (cont'd) As of and for the Three Months Ended June 30, March 31, December 31, September 30, June 30, (Dollars in thousands, except per share amounts) 2016 2016 2015 2015 2015 Reported yield on loans 8.500000000000001% 7.84% 8.17% 8.339305667637392% 9.494499003592306% Effect of accretion income on acquired loans -0.69% -0.37% -0.326781499036891% -0.379776514834469% -0.5343431197411% Adjusted yield on loans 7.8145862782929204E-2 7.4673496519255061E-2 7.8432185009631089E-2 7.959529152802923E-2 8.9601558838512063E-2 Reported net interest margin 6.528587805696427% 5.904236167189919% 6.201471530303822% 6.453943023929222% 7.2% Effect of accretion income on acquired loans -0.55% -0.29% -0.26% -0.31% -0.42% Adjusted net interest margin 5.9751386852355905E-2 5.6056483316736079E-2 5.941208443951064E-2 6.1436271756382291E-2 6.7780562435600544E-2 Total stockholders' equity $,279,763 $,274,114 $,268,038 $,263,919 $,257,479 Less: Preferred stock liquidation preference 9,746 9,746 9,746 9,746 9,746 Total common stockholders' equity ,270,017 ,264,368 ,258,292 ,254,173 ,247,733 Less: Goodwill and other intangibles 26,160 26,877 27,854 28,995 30,174 Tangible common stockholders' equity $,243,857 $,237,491 $,230,438 $,225,178 $,217,559 Common shares outstanding at end of period 18,107,493 18,015,423 18,018,200 18,040,072 18,041,072 Tangible book value per share $13.46718731300904 $13.182649111264276 $12.789179829283725 $12.482100958355376 $12.059094936265428 Total assets at end of period $1,783,395 $1,687,795 $1,691,313 $1,581,463 $1,529,259 Less: Goodwill and other intangibles 26,160 26,877 27,854 28,995 30,174 Adjusted total assets at period end $1,757,235 $1,660,918 $1,663,459 $1,552,468 $1,499,085 Tangible common stockholders' equity ratio 0.13877312937654895 0.14298779349733098 0.13852941370962554 0.14504517967520103 0.14512786132874386
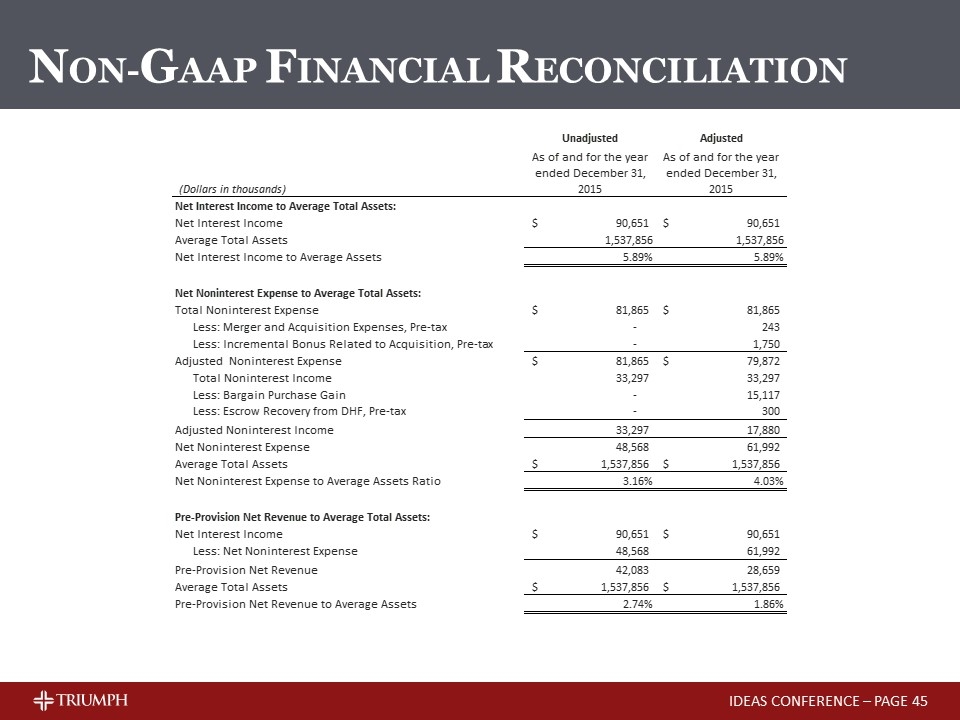
NON-GAAP FINANCIAL RECONCILIATION IDEAS CONFERENCE – PAGE Non-GAAP Reconciliation Unadjusted Adjusted Unadjusted Adjusted (Dollars in thousands) As of and for the year ended December 31, 2015 As of and for the year ended December 31, 2015 (Dollars in thousands) As of and for the year ended December 31, 2015 As of and for the year ended December 31, 2015 Net Interest Income to Average Total Assets: Credit Costs to Average Total Assets: Net Interest Income $90,651 $90,651 Provision for Loan Losses $4,528.6317099999997 $4,528.6317099999997 Average Total Assets 1537856.16192271 1537856.16192271 Average Total Assets 1,537,856.16192271 1,537,856.16192271 Net Interest Income to Average Assets 5.8946345077333678E-2 5.8946345077333678E-2 Credit Costs to Average Assets 2.9447693627849187E-3 2.9447693627849187E-3 Net Noninterest Expense to Average Total Assets: Taxes to Average Total Assets: Total Noninterest Expense $81,865 $81,865 Income Tax Expense $8,420.5420799999993 $8,420.5420799999993 Less: Merger and Acquisition Expenses, Pre-tax 0 243 Add: Tax Effect of Merger and Acquisition Expenses 0 85 Less: Incremental Bonus Related to Acquisition, Pre-tax 0 1,750 Add: Tax Effect of Incremental Bonus related to Acquisition 0 612 Adjusted Noninterest Expense $81,865 $79,872 Less: Tax Effect of Escrow Recovery from DHF 0 105 Total Noninterest Income 33,297 33,297 Adjusted Tax Expense 8,420.5420799999993 9,012.5420799999993 Less: Bargain Purchase Gain 0 15,117 Average Total Assets 1,537,856.16192271 1,537,856.16192271 Less: Escrow Recovery from DHF, Pre-tax 0 300 Taxes to Average Assets 5.4755069352339083E-3 5.8604584116189627E-3 Adjusted Noninterest Income 33,297 17,880 Net Noninterest Expense 48,568 61,992 Return on Average Total Assets:* Average Total Assets $1,537,856.16192271 $1,537,856.16192271 Net Interest Income to Average Assets 5.8946345077333678E-2 5.8946345077333678E-2 Net Noninterest Expense to Average Assets Ratio 3.1581627204508966E-2 4.0310662033888972E-2 Less: Net Noninterest Expense to Average Assets Ratio 3.1581627204508966E-2 4.0310662033888972E-2 Pre-Provision Net Revenue to Average Assets 2.7364717872824712E-2 1.8635683043444706E-2 Pre-Provision Net Revenue to Average Total Assets: Less: Credit Costs to Average Assets 2.9447693627849187E-3 2.9447693627849187E-3 Net Interest Income $90,651 $90,651 Less: Taxes to Average Assets 5.4755069352339083E-3 5.8604584116189627E-3 Less: Net Noninterest Expense 48,568 61,992 Return on Average Assets 1.8944441574805883E-2 9.8304552690408227E-3 Pre-Provision Net Revenue 42,083 28,659 Average Total Assets $1,537,856.16192271 $1,537,856.16192271 Return on Average Equity: Pre-Provision Net Revenue to Average Assets 2.7364717872824715E-2 1.8635683043444703E-2 Net Interest Income $90,651 $90,651 Adjusted Noninterest Income 33,297 17,880 Less: Adjusted Noninterest Expense 81,865 79,872 Less: Provision for Loan Losses 4,528.6317099999997 4,528.6317099999997 Less Adjusted Income Tax Expense 8,420.5420799999993 9,012.5420799999993 Adjusted Net Income 29,132.826209999999 15,116.826209999999 Average Total Equity ,257,551 ,257,551 Return on Average Equtiy 0.11311478584823977 5.8694496274524263E-2 Less: bargain purchase gain #REF! Less: escrow recovery from DHF, pre-tax 300 Adjusted operating revenue #REF! Total noninterest expenses #REF! Less: merger and acquisition expenses, pre-tax 243 Less: incremental bonus related to acquisition, pre-tax 1,750 Adjusted noninterest expenses #REF! Efficiency ratio #REF! Net noninterest expense to average assets ratio: Total noninterest expenses #REF! Less: merger and acquisition expenses 243 Less: incremental bonus related to acquisition, pre-tax 1,750 Adjusted noninterest expense #REF! Total noninterest income #REF! Less: gain on branch sale #REF! Less: bargain purchase gain #REF! Less: escrow recovery from DHF, pre-tax 300 Adjusted noninterest income #REF! Adjusted net noninterest expenses #REF! Average Total Assets 1,537,856 Net noninterest expense to average assets ratio #REF! Checks #REF! #REF! #REF! #REF! #REF! #REF! #REF! #REF! #REF! #REF! #REF!
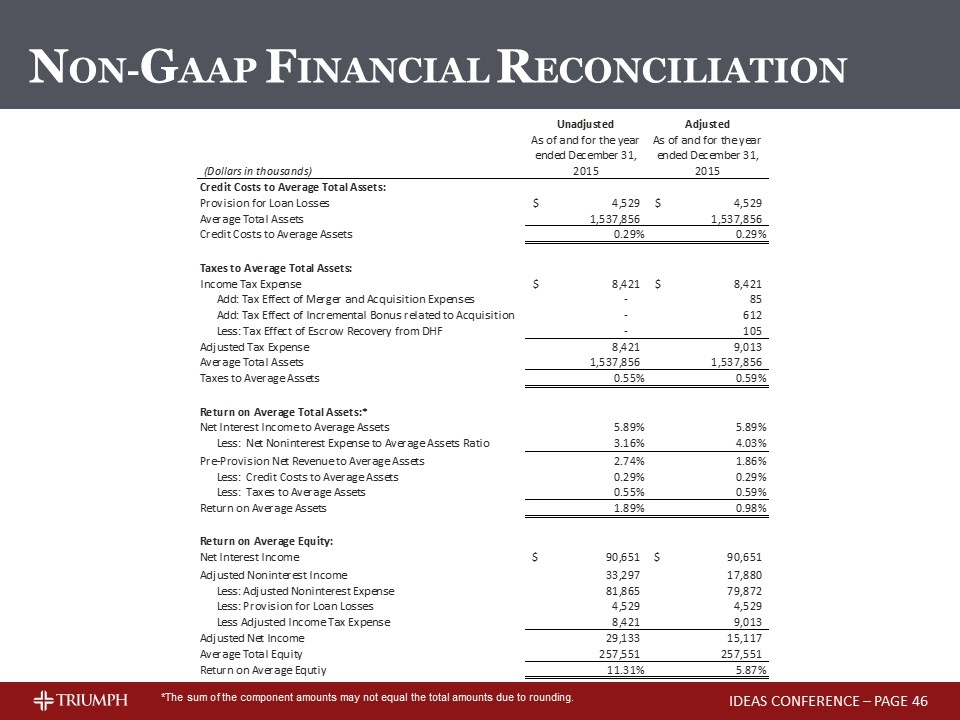
NON-GAAP FINANCIAL RECONCILIATION IDEAS CONFERENCE – PAGE *The sum of the component amounts may not equal the total amounts due to rounding. Non-GAAP Reconciliation Unadjusted Adjusted Unadjusted Adjusted (Dollars in thousands) As of and for the year ended December 31, 2015 As of and for the year ended December 31, 2015 (Dollars in thousands) As of and for the year ended December 31, 2015 As of and for the year ended December 31, 2015 Net Interest Income to Average Total Assets: Credit Costs to Average Total Assets: Net Interest Income $90,651 $90,651 Provision for Loan Losses $4,528.6317099999997 $4,528.6317099999997 Average Total Assets 1537856.16192271 1537856.16192271 Average Total Assets 1,537,856.16192271 1,537,856.16192271 Net Interest Income to Average Assets 5.8946345077333678E-2 5.8946345077333678E-2 Credit Costs to Average Assets 2.9447693627849187E-3 2.9447693627849187E-3 Net Noninterest Expense to Average Total Assets: Taxes to Average Total Assets: Total Noninterest Expense $81,865 $81,865 Income Tax Expense $8,420.5420799999993 $8,420.5420799999993 Less: Merger and Acquisition Expenses, Pre-tax 0 243 Add: Tax Effect of Merger and Acquisition Expenses 0 85 Less: Incremental Bonus Related to Acquisition, Pre-tax 0 1,750 Add: Tax Effect of Incremental Bonus related to Acquisition 0 612 Adjusted Noninterest Expense $81,865 $79,872 Less: Tax Effect of Escrow Recovery from DHF 0 105 Total Noninterest Income 33,297 33,297 Adjusted Tax Expense 8,420.5420799999993 9,012.5420799999993 Less: Bargain Purchase Gain 0 15,117 Average Total Assets 1,537,856.16192271 1,537,856.16192271 Less: Escrow Recovery from DHF, Pre-tax 0 300 Taxes to Average Assets 5.4755069352339083E-3 5.8604584116189627E-3 Adjusted Noninterest Income 33,297 17,880 Net Noninterest Expense 48,568 61,992 Return on Average Total Assets:* Average Total Assets $1,537,856.16192271 $1,537,856.16192271 Net Interest Income to Average Assets 5.8946345077333678E-2 5.8946345077333678E-2 Net Noninterest Expense to Average Assets Ratio 3.1581627204508966E-2 4.0310662033888972E-2 Less: Net Noninterest Expense to Average Assets Ratio 3.1581627204508966E-2 4.0310662033888972E-2 Pre-Provision Net Revenue to Average Assets 2.7364717872824712E-2 1.8635683043444706E-2 Pre-Provision Net Revenue to Average Total Assets: Less: Credit Costs to Average Assets 2.9447693627849187E-3 2.9447693627849187E-3 Net Interest Income $90,651 $90,651 Less: Taxes to Average Assets 5.4755069352339083E-3 5.8604584116189627E-3 Less: Net Noninterest Expense 48,568 61,992 Return on Average Assets 1.8944441574805883E-2 9.8304552690408227E-3 Pre-Provision Net Revenue 42,083 28,659 Average Total Assets $1,537,856.16192271 $1,537,856.16192271 Return on Average Equity: Pre-Provision Net Revenue to Average Assets 2.7364717872824715E-2 1.8635683043444703E-2 Net Interest Income $90,651 $90,651 Adjusted Noninterest Income 33,297 17,880 Less: Adjusted Noninterest Expense 81,865 79,872 Less: Provision for Loan Losses 4,528.6317099999997 4,528.6317099999997 Less Adjusted Income Tax Expense 8,420.5420799999993 9,012.5420799999993 Adjusted Net Income 29,132.826209999999 15,116.826209999999 Average Total Equity ,257,551 ,257,551 Return on Average Equtiy 0.11311478584823977 5.8694496274524263E-2 Less: bargain purchase gain #REF! Less: escrow recovery from DHF, pre-tax 300 Adjusted operating revenue #REF! Total noninterest expenses #REF! Less: merger and acquisition expenses, pre-tax 243 Less: incremental bonus related to acquisition, pre-tax 1,750 Adjusted noninterest expenses #REF! Efficiency ratio #REF! Net noninterest expense to average assets ratio: Total noninterest expenses #REF! Less: merger and acquisition expenses 243 Less: incremental bonus related to acquisition, pre-tax 1,750 Adjusted noninterest expense #REF! Total noninterest income #REF! Less: gain on branch sale #REF! Less: bargain purchase gain #REF! Less: escrow recovery from DHF, pre-tax 300 Adjusted noninterest income #REF! Adjusted net noninterest expenses #REF! Average Total Assets 1,537,856 Net noninterest expense to average assets ratio #REF! Checks #REF! #REF! #REF! #REF! #REF! #REF! #REF! #REF! #REF! #REF! #REF!
Serious News for Serious Traders! Try StreetInsider.com Premium Free!
You May Also Be Interested In
- Trailbreaker Commences Drilling at the Liberty Copper Property, BC.
- ACM Research Announces Preliminary Unaudited Revenue and Shipments for the First Quarter 2024
- Ocugen to Present on Modifier Gene Therapy Platform at Association for Research in Vision and Ophthalmology 2024 Annual Meeting
Create E-mail Alert Related Categories
SEC FilingsSign up for StreetInsider Free!
Receive full access to all new and archived articles, unlimited portfolio tracking, e-mail alerts, custom newswires and RSS feeds - and more!


 Tweet
Tweet Share
Share