Form 8-K PEABODY ENERGY CORP For: Nov 20
UNITED STATES
SECURITIES AND EXCHANGE COMMISSION
Washington, D.C. 20549
FORM 8-K
CURRENT REPORT
Pursuant to Section 13 or 15(d) of the Securities Exchange Act of 1934 | |||||||
Date of Report (Date of earliest event reported): November 20, 2014 | |||||||
PEABODY ENERGY CORPORATION | |||||||
(Exact name of registrant as specified in its charter) | |||||||
Delaware | 1-16463 | 13-4004153 | |||||
(State or other jurisdiction of incorporation or organization) | (Commission File Number) | (I.R.S. Employer Identification No.) | |||||
701 Market Street, St. Louis, Missouri | 63101-1826 | ||||||
(Address of principal executive offices) | �(Zip Code) | ||||||
Registrant's telephone number, including area code: (314) 342-3400 | |||||||
N/A | |||||||
(Former name or former address, if changed since last report.) | |||||||
Check the appropriate box below if the Form 8-K filing is intended to simultaneously satisfy the filing obligation of the registrant under any of the following provisions: | |||||||
���Written communications pursuant to Rule 425 under the Securities Act (17 CFR 230.425) | |||||||
���Soliciting material pursuant to Rule 14a-12 under the Exchange Act (17 CFR 240.14a-12) | |||||||
���Pre-commencement communications pursuant to Rule 14d-2(b) under the Exchange Act (17 CFR 240.14d-2(b)) | |||||||
���Pre-commencement communications pursuant to Rule 13e-4(c) under the Exchange Act (17 CFR 240.13e-4(c)) | |||||||
Item 7.01 ����Regulation FD Disclosure.
Peabody Energy Corporation ("Peabody") management will present to attendees of the Goldman Sachs Global Metals and Mining Conference in New York, New York on November 20, 2014. A copy of the related written presentation is furnished as Exhibit 99.1 hereto.
The information furnished in this Item 7.01, including Exhibit 99.1 hereto, shall not be deemed "filed" for purposes of Section 18 of the Securities and Exchange Act of 1934, as amended (the "Exchange Act"), or otherwise subject to the liabilities of that section, nor shall such information be deemed incorporated by reference in any filings under the Securities Act of 1933, as amended, or the Exchange Act, except as shall be expressly set forth by specific reference in such filing.
Item 9.01����Financial Statements and Exhibits.
(d) Exhibits.
Exhibit No. | Description of Exhibit |
99.1 | Peabody management written presentation dated November 20, 2014. |
2
SIGNATURES
Pursuant to the requirements of the Securities Exchange Act of 1934, the registrant has duly caused this report to be signed on its behalf by the undersigned hereunto duly authorized.
PEABODY ENERGY CORPORATION | |
November 20, 2014 | By: /s/ Kenneth L. Wagner |
Name: Kenneth L. Wagner | |
Title: Vice President, General Counsel - Corporate and Assistant Secretary | |
3
EXHIBIT INDEX
� | � |
Exhibit No. | Description |
99.1 | Peabody management written presentation dated November 20, 2014. |
4

Goldman Sachs Global Metals & Mining Conference November 20, 2014 Exhibit 99.1
�

Statement on Forward-Looking Information Certain statements in this presentation are forward-looking as defined in the Private Securities Litigation Reform Act of 1995. The company uses words such as
anticipate,
believe,
expect,
may,
forecast,
project,
should,
estimate,
plan,
outlook,
target
or other similar words to identify forward-looking statements. These forward-looking statements are based on numerous assumptions that the company believes are reasonable, but they are open to a wide range of uncertainties and business risks that may cause actual results to differ materially from expectations as of November 20, 2014. These factors are difficult to accurately predict and may be beyond the companys control. The company does not undertake to update its forward-looking statements. Factors that could affect the companys results include, but are not limited to: global supply and demand for coal, including seaborne thermal and metallurgical coal; price volatility and customer procurement practices, particularly in international seaborne products and in the companys trading and brokerage businesses; impact of alternative energy sources, including natural gas and renewables; global steel demand and the downstream impact on metallurgical coal prices; impact of weather and natural disasters on demand and production; reductions and/or deferrals of purchases by major customers and ability to renew sales contracts; credit and performance risks associated with customers, suppliers, contract miners, co-shippers, and trading, banks and other financial counterparties; geologic, equipment, permitting, site access, operational risks and new technologies related to mining; transportation availability, performance and costs; availability, timing of delivery and costs of key supplies, capital equipment or commodities such as diesel fuel, steel, explosives and tires; impact of take-or-pay agreements for rail and port commitments for the delivery of coal; successful implementation of business strategies; negotiation of labor contracts, employee relations and workforce availability; changes in postretirement benefit and pension obligations and their related funding requirements; replacement and development of coal reserves; availability, access to and related cost of capital and financial markets; ability to secure our obligations for land reclamation, federal and state workers compensation, federal coal leases and other obligations related to the companys operations; effects of changes in interest rates and currency exchange rates (primarily the Australian dollar); effects of acquisitions or divestitures; economic strength and political stability of countries in which the company has operations or serves customers; legislation, regulations and court decisions or other government actions, including, but not limited to, new environmental and mine safety requirements; changes in income tax regulations, sales-related royalties, or other regulatory taxes and changes in derivative laws and regulations; litigation, including claims not yet asserted; and other risks detailed in the companys reports filed with the United States Securities and Exchange Commission (SEC). 2
�

Coal: Global Markets Face Headwinds; Potential for Improvement in 2015 Coal accounts for 40% of electricity generation; Urbanization and industrialization trends expected to drive sustained long-term coal demand growth 3 Global Coal Demand Seaborne Metallurgical Coal Seaborne Thermal Coal U.S. Powder River Basin Thermal Coal Markets well supplied; Supply growth slowing as further production cutbacks are realized and investment remains limited Supply expected to moderate; New coal-fueled generation continues to be added to meet rising demand for affordable electricity Rail performance has impacted PRB volumes leading to greater coal conservation; Gradual improvement expected as carriers invest capital Source: IEA World Energy Outlook 2013; Peabody Global Analytics.
�

Peabody Energy: Well-Positioned Coal Company 4 Global Scope Superior Asset Base Low-Cost U.S. Position Strong Metallurgical Coal Portfolio Competitive Advantage Proven Track Record Tier one assets in U.S. West, U.S. Midwest and Australia targeting highest-growth regions 8 billion tons of coal reserves and ~500,000 acres of surface land in U.S. and Australia Largest U.S. coal producer; Superior margins to peers in Powder River Basin Largest seaborne low-vol PCI supplier and leading Australian metallurgical coal presence Well-capitalized platform and $2.3 billion of liquidity Sustainable cost reductions and portfolio optimization; Organizational restructuring Source: Peabody Global Analytics. Reserves and acres of surface land based on 2013 10-K filing. Liquidity as of Sept. 30, 2014. PRB margins compared to NYSE-listed peers.
�

Global Coal Markets 5 Singapore
�

Expanding Global Energy Needs Lead to Rising Coal Demand 6 Global Coal Demand (MTOE) Global Energy Demand (MTOE) Global Electricity Use (TWh) 0 3,000 6,000 9,000 12,000 15,000 18,000 2010 2020P 2030P 0 6,000 12,000 18,000 24,000 30,000 36,000 2010 2020P 2030P 0 1,000 2,000 3,000 4,000 5,000 2010 2020P 2030P Source: International Energy Agency (IEA), 2013 World Energy Outlook (Current Policies Scenario). Energy and coal demand in Million Tonnes of Oil Equivalent (MTOE). Electricity use in terawatt-hours (TWh). +38% +69% +48%
�
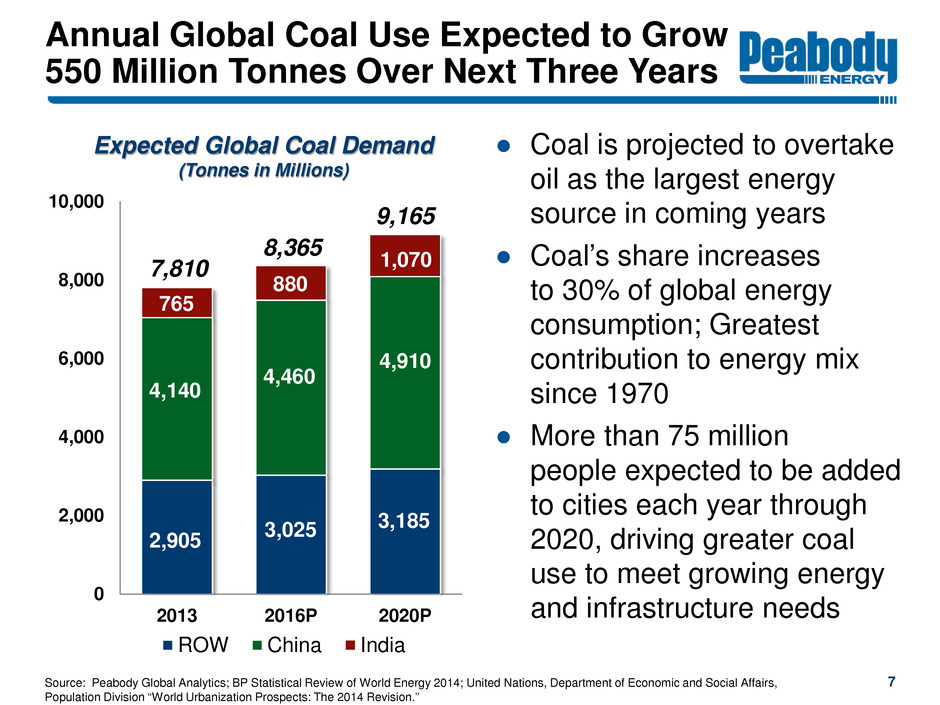
0 2,000 4,000 6,000 8,000 10,000 2013 2016P 2020P ROW China India Annual Global Coal Use Expected to Grow 550 Million Tonnes Over Next Three Years � Coal is projected to overtake oil as the largest energy source in coming years � Coals share increases to 30% of global energy consumption; Greatest contribution to energy mix since 1970 � More than 75 million people expected to be added to cities each year through 2020, driving greater coal use to meet growing energy and infrastructure needs Source: Peabody Global Analytics; BP Statistical Review of World Energy 2014; United Nations, Department of Economic and Social Affairs, Population Division
World Urbanization Prospects: The 2014 Revision.
Expected Global Coal Demand (Tonnes in Millions) 2,905 3,025 4,460 4,140 880 765 7,810 8,365 7 9,165 1,070 4,910 3,185
�

Seaborne Metallurgical Supply Growth Slowing; Fundamentals Likely to Improve Source: Peabody Global Analytics. U.S., Australia and Canadian seaborne exports represented. 8 � Market well-supplied; Production growth from investment momentum and unit cost management coming to an end � Demand continuing to rise on steel production growth � Some 30 million tons of announced production cutbacks YTD; Less than 10 million tons have been implemented � Lack of metallurgical coal investment expected to result in supply shortfalls over time 118 118 127 134 134 100 110 120 130 140 1H 2H 1H 2H 1H 2H 1H 2H Seaborne Metallurgical Supply from Major Exporters (Tonnes in Millions) 125 135 2012 2013 2014 2015
�

Metallurgical Coal Essential for Rising Steel Production in Asia � Global seaborne metallurgical coal demand expected to rise over next several years � Asian steel primarily produced in blast furnaces requiring metallurgical coals � Newer blast furnaces increase demand for PCI coals as producers look to offset higher-cost coke PCI projected to be fastest- growing metallurgical coal � Projected long-term fundamentals remain sound on increasing urbanization 9 Source: Peabody Global Analytics. Metallurgical Coal Used to Make Coke Coke and PCI Coal Converted to Pig Iron in Blast Furnace Pig Iron Used in Steel Production PCI Coal Used as Partial Replacement for Coke Greater Imports Needed to Meet Rising Steel Needs
�

30 Countries Add 348 GW of New Coal Generation Capacity Since 2010 800+ New Generating Units Come Online 10 Source: Platts World Electric Power Plant database. Generation capacity represented in megawatts, excluding China, India and United States.
�

U.S. Coal Demand Increases; Fuels 40% of Electricity Generation in the U.S. Source: Peabody Global Analytics and EIA. YTD through October 2014 compared to April 2012. 11 34% 40% 26% 20% 14% 0% 10% 20% 30% 40% 50% � U.S. coal use rebounds 20% from 2012 lows � Coal use up 2% YTD; Gas generation down 1% � SPRB most competitive against natural gas SPRB: $2.50 to $2.75/mmBtu ILB: $3.50 to $3.75/mmBtu CAPP: $4.50+/mmBtu � Coal demand expected to increase 15 million tons in 2014 Share of U.S. Electric Power Sector Generation C oa l N at ur al G as N uc le ar Ot he r C oa l A pr il 20 12
�

SPRB Demand Exceeds Supply Leading to Declining Stockpiles � Shipments lagging demand for second year in a row � Rail performance and moderate summer weather impact near-term U.S. fundamentals 2014 transaction volume down on rail issues Rail investment expected to lead to gradual improvement � Demand projected to exceed supply and lead to lower inventory levels SPRB inventories expected to end year at less than 40 days Source: Peabody Global Analytics and EIA. 2014 projected shipments based on annualized rate through September 2014. 12 300 325 350 375 400 425 2012 2013 2014P 2015P SPRB Electricity Generation Demand and Shipments (Tons in Millions) SPRB Coal Use SPRB Shipments SPRB Shipments
�

Source: Peabody Global Analytics. SPRB and Illinois Basin: 75 Million Ton Demand Increase Forecast by 2016 Expected SPRB and ILB Generation Demand (Tons in Millions) +35 0 200 400 600 2013 Retirements Utilization Switching 2016P -55 +30 510 585 13 +100 SPRB and ILB +75 � SPRB and ILB demand expected to increase in next three years � Increased power plant utilization and basin switching expected to more than offset retirements Coal fleet utilization ~60% of capacity in 2013, remaining fleet expected to run over 70% by 2016 � Significant coal-fueled generation of ~250 GW projected to remain on line in 2016
�
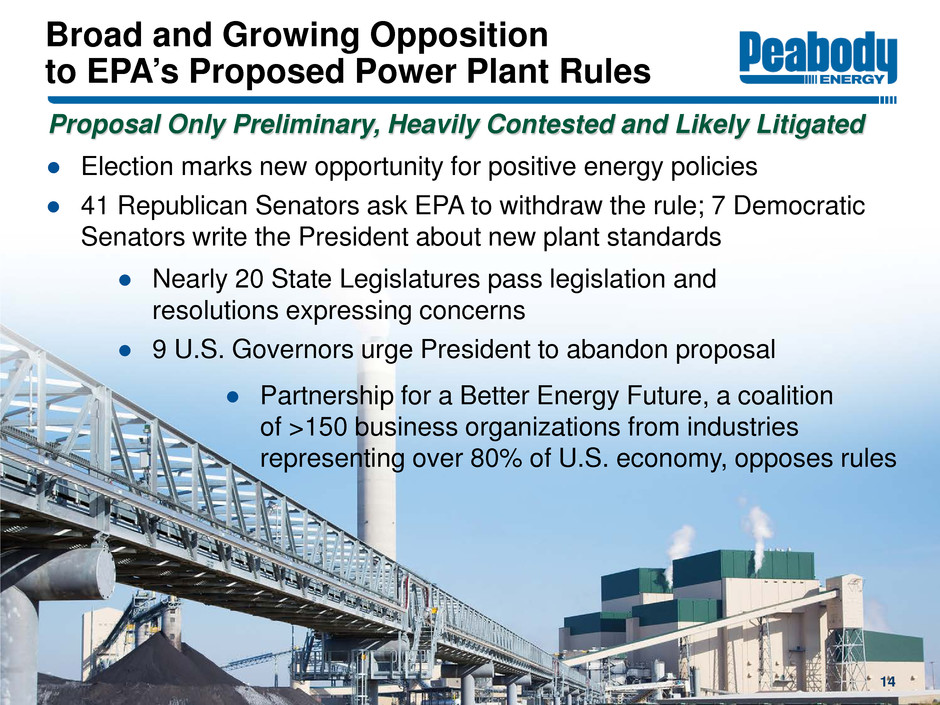
Broad and Growing Opposition to EPAs Proposed Power Plant Rules � Election marks new opportunity for positive energy policies � 41 Republican Senators ask EPA to withdraw the rule; 7 Democratic Senators write the President about new plant standards 14 � Nearly 20 State Legislatures pass legislation and resolutions expressing concerns � 9 U.S. Governors urge President to abandon proposal � Partnership for a Better Energy Future, a coalition of >150 business organizations from industries representing over 80% of U.S. economy, opposes rules Proposal Only Preliminary, Heavily Contested and Likely Litigated
�

Coal: Least Expensive and Most Reliable Form of Electricity Generation 15 Source: Peabody Energy Analytics. � Urbanization trends lead to greater coal use to fuel growing electricity and steel demand � IEA and other observers project coal will overtake oil as worlds largest energy source in coming years � Coal is the only affordable fuel, at scale, to meet rising energy needs Advantages of Coal Lead to Rising Demand
�

Peabody Energy Overview 16 Wilpinjong Mine
�

Peabody: Worlds Largest Private-Sector Coal Company Metallurgical and Thermal Coal Customers in Over 25 Countries Essen Beijing Ulaanbaatar Jakarta Balikpapan New Delhi Brisbane, QLD Newcastle, NSW London (From U.S.) St. Louis, MO Singapore Mining Operations and Trading Sales Reserves SPRB 135 3.4 Midwest 26 3.2 Southwest 16 0.5 Colorado 7 0.2 Australia 35 0.9 Trading 32 - Total Tons 252 8.3 Million Billion Reported 2013 sales volumes. Reserves based on 2013 10-K filing. Total sales and reserves variances are based on rounding calculations. Green shading indicates countries served by Peabody. (to Europe) Operating Regions Customers Served Corporate Office Regional Offices Trading/Business Development Offices Coal Flows 17
�

18 Delivering on Long-Term Journey to Reshape Peabodys Asset Base " Diverse Global Platform " Largest U.S. Producer " Largest Producer and Reserve Holder in SPRB " Largest Seaborne Supplier of Low-Vol PCI Coal " Third-Largest Australian Reserve Holder " Fourth-Largest Seaborne Metallurgical Coal Supplier Leading Position in High-Growth Low-Cost U.S. Basins Strong Global Presence in High-Growth Markets Strategy Results " Completed 3 Major Acquisitions and Mine Expansions in Australia " Increased PRB and ILB Investments " Expanded Trading Offices " Entered China and Mongolia " Exited from Appalachia Operations Actions
�
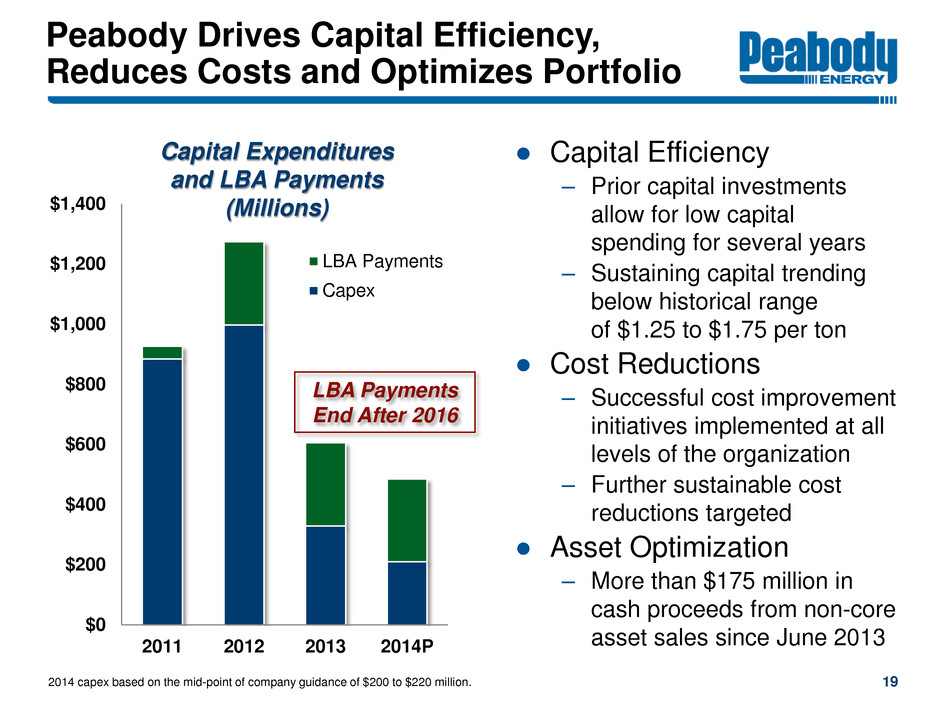
Peabody Drives Capital Efficiency, Reduces Costs and Optimizes Portfolio � Capital Efficiency Prior capital investments allow for low capital spending for several years Sustaining capital trending below historical range of $1.25 to $1.75 per ton � Cost Reductions Successful cost improvement initiatives implemented at all levels of the organization Further sustainable cost reductions targeted � Asset Optimization More than $175 million in cash proceeds from non-core asset sales since June 2013 19 $0 $200 $400 $600 $800 $1,000 $1,200 $1,400 2011 2012 2013 2014P LBA Payments Capex LBA Payments End After 2016 Capital Expenditures and LBA Payments (Millions) 2014 capex based on the mid-point of company guidance of $200 to $220 million. , 2014.
�

Peabodys Industry-Leading Powder River Basin Gross Margins Expand in 2014 � Peabody PRB gross margins double peers on contracting strategies and sustainable cost reductions Leveraging previous investments in equipment, infrastructure and technology Driving best-in-class continuous improvement Benefits from superior overburden ratios, geographic position � Flagship North Antelope Rochelle Mine worlds largest and most productive coal mine Secured LBAs; 2 billion tons of high-quality coal reserves 20 Largest Producer and Reserve Holder in SPRB North Antelope Rochelle Mine Source: Company reports. Average peer PRB margins include ACI, CLD and ANR. Gross margins exclude depreciation, depletion and amortization, and asset retirement obligation expenses. YTD margins as of Sept. 30, 2014. 26% 26% 21% 13% 0% 5% 10% 15% 20% 25% 30% 2012 - 2013 YTD 2014 Peabody PRB Gross Margins Versus Peer Average P ea bo dy P ee rs
�

Midwest Portfolio Well Positioned: Anchored by Key Mines 21 � Peabody Illinois Basin operations strategically located to serve local customer base � Bear Run Mine is largest surface mine in Eastern U.S. Produces 8+ million tons per year � Gateway Mine among lowest cost mines in region Gateway North to extend production in 2015 26 Million Tons Shipped in 2013; 3 Billion Tons of Reserves Production and reserves based on 2013 10-K filing.
�
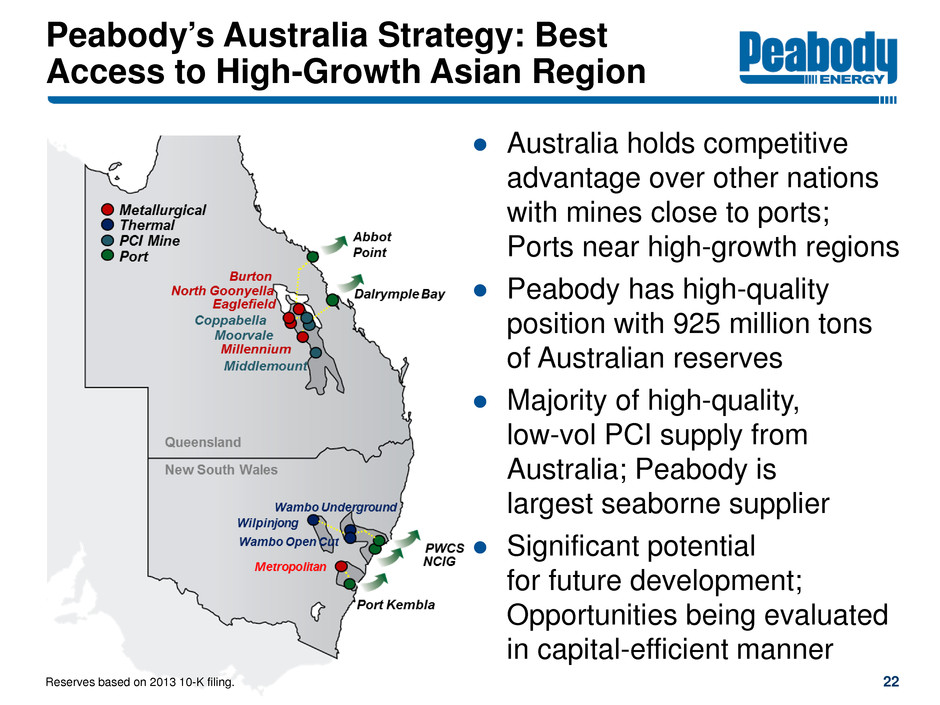
22 22 25 ~ 8 15 17 Peabodys Australia Strategy: Best Access to High-Growth Asian Region � Australia holds competitive advantage over other nations with mines close to ports; Ports near high-growth regions � Peabody has high-quality position with 925 million tons of Australian reserves � Majority of high-quality, low-vol PCI supply from Australia; Peabody is largest seaborne supplier � Significant potential for future development; Opportunities being evaluated in capital-efficient manner Reserves based on 2013 10-K filing.
�
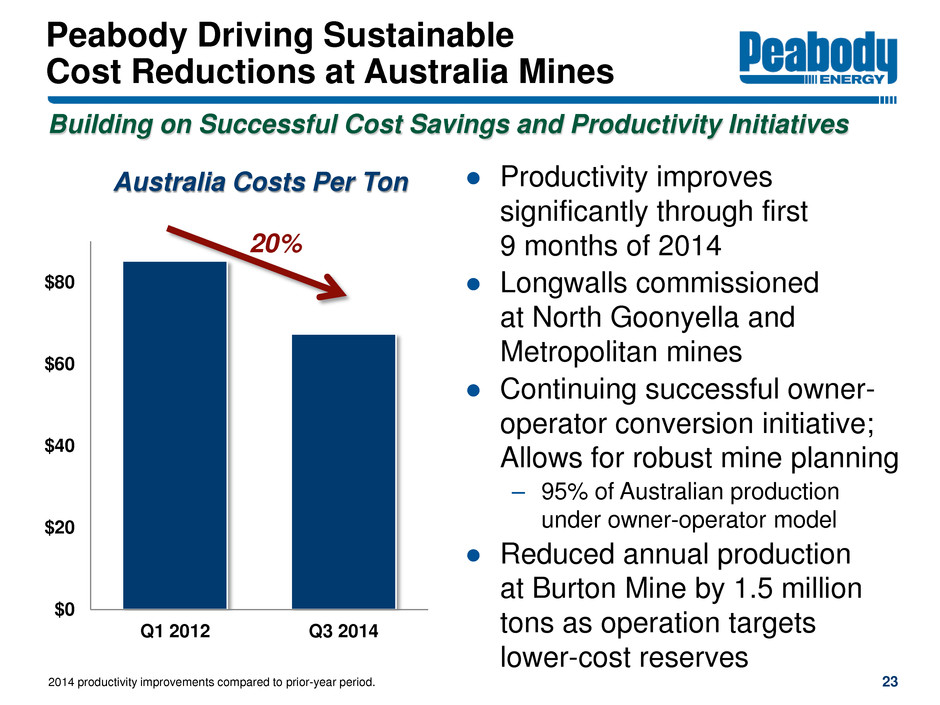
Peabody Driving Sustainable Cost Reductions at Australia Mines � Productivity improves significantly through first 9 months of 2014 � Longwalls commissioned at North Goonyella and Metropolitan mines � Continuing successful owner- operator conversion initiative; Allows for robust mine planning 95% of Australian production under owner-operator model � Reduced annual production at Burton Mine by 1.5 million tons as operation targets lower-cost reserves 23 2014 productivity improvements compared to prior-year period. 30, 2014. Building on Successful Cost Savings and Productivity Initiatives $0 $20 $40 $60 $80 Q1 2012 Q3 2014 Australia Costs Per Ton 20%
�

Peabodys Core Strengths Targeted to Create Long-Term Value 24 Superior Asset Base " Leading reserve position " Geographic diversity " Access to high- growth regions " Leading presence in growing markets Best-In- Class Operations " Continuous focus on safety " Aggressive cost containment " Strong productivity improvements Solid Financial Position " Well-capitalized platform " $2.3 billion of liquidity " No significant debt maturities until 2016 " Focus on long- term debt reduction Major Growth Potential " Long-term expansion opportunities " Asian partnerships and joint ventures " Thought leader in sustainable mining, energy access and clean coal solutions Liquidity as of Sept. 30, 2014.
�

PeabodyEnergy.com AdvancedEnergyForLife.com
�

Appendix: Peabody Energy Full-Year Targets 26 2014 Australian Coal Sales 36 to 38 million tons, including 16 to 17 million tons of metallurgical coal and 12 to 13 million tons of seaborne thermal coal 2014 Australian Operating Costs Approximately $70 per ton 2014 U.S. Coal Sales 185 to 190 million tons 2014 U.S. Operating Costs Per Ton 1 to 3 percent below 2013 levels 2014 U.S. Revenues Per Ton 2 to 4 percent below 2013 levels 2014 Total Coal Sales 245 to 255 million tons 2014 Capital Spending $200 to $220 million
�
Serious News for Serious Traders! Try StreetInsider.com Premium Free!
You May Also Be Interested In
- Dicello Levitt LLP Announces Investor Class Action Lawsuit Filed Against QuidelOrtho Corp. f/k/a Quidel Corp. (NASDAQ: QDEL) And Lead Plaintiff Deadline
- ENDEAVOR ALERT: Bragar Eagel & Squire, P.C. Investigates Merger of EDR and Encourages Investors to Contact the Firm
- LINCOLN ALERT: Bragar Eagel & Squire, P.C. Announces that a Class Action Lawsuit Has Been Filed Against Lincoln National Corporation and Encourages Investors to Contact the Firm
Create E-mail Alert Related Categories
SEC FilingsSign up for StreetInsider Free!
Receive full access to all new and archived articles, unlimited portfolio tracking, e-mail alerts, custom newswires and RSS feeds - and more!


 Tweet
Tweet Share
Share