

Form 8-K OLD NATIONAL BANCORP For: Feb 17
 Tweet
Tweet Share
Share
UNITED STATES
SECURITIES AND EXCHANGE COMMISSION
WASHINGTON, DC 20549
FORM 8-K
CURRENT REPORT
Pursuant to Section 13 or 15(d)
of the Securities Exchange Act of 1934
Date of report (Date of earliest event reported): February 17, 2015
OLD NATIONAL BANCORP
(Exact name of Registrant as specified in its charter)
| Indiana | 001-15817 | 35-1539838 | ||
| (State or other jurisdiction of incorporation) |
(Commission File Number) |
(IRS Employer Identification No.) |
| One Main Street Evansville, Indiana |
47708 | |
| (Address of Principal Executive Offices) | (Zip Code) |
Registrant’s telephone number, including area code: (812) 464-1294
(Former name or former address if changed since last report.)
Check the appropriate box below if the Form 8-K filing is intended to simultaneously satisfy the filing obligation of the registrant under any of the following provisions:
| ¨ | Written communications pursuant to Rule 425 under the Securities Act (17 CFR 230.425) |
| ¨ | Soliciting material pursuant to Rule 14a-12 under the Exchange Act (17 CFR 240.14a-12) |
| ¨ | Pre-commencement communications pursuant to Rule 14d-2(b) under the Exchange Act (17 CFR 240.14d-2(b)) |
| ¨ | Pre-commencement communications pursuant to Rule 13e-4(c) under the Exchange Act (17 CFR 240.13e-4(c)) |
| Item 7.01 | Regulation FD Disclosure |
The executive officers of Old National Bancorp intend to use the materials filed herewith, in whole or in part, in one or more meetings with investors and analysts. A copy of the investor presentation is attached hereto as Exhibit 99.1.
Old National Bancorp does not intend for this Item 7.01 or Exhibit 99.1 to be treated as “filed” for purposes of the Securities Exchange Act of 1934, as amended, or incorporated by reference into its filings under the Securities Act of 1933, as amended.
| Item 9.01 | Financial Statements and Exhibits |
| (d) | Exhibits. The following exhibit is furnished herewith: |
The following exhibit shall not be deemed to be “filed” for purposes of the Securities Exchange Act of 1934, as amended:
| 99.1 | Old National Bancorp Investment Thesis |
* * * * * * *
2
SIGNATURE
Pursuant to the requirements of the Securities Exchange Act of 1934, the Registrant has duly caused this report to be signed on its behalf by the undersigned hereunto duly authorized.
Date: February 17, 2015
| OLD NATIONAL BANCORP | ||||||
| By: | /s/ Christopher A. Wolking | |||||
| Christopher A. Wolking | ||||||
| Senior Executive Vice President and | ||||||
| Chief Financial Officer | ||||||
3
Exhibit Index
| Exhibit No. |
Description | |
| 99.1 | Old National Bancorp Investment Thesis | |
4
 Investment Thesis
Financial Data as of 12-31-14
Dated: February 17, 2015
Exhibit 99.1 |
 Investment Thesis
Executive Summary
Slides 2 to 19
Financial Data as of 12-31-14
Dated: February 17, 2015
*
*
*
* |
 3
Forward-Looking Statement
This presentation contains certain forward-looking statements within the meaning of
the Private Securities Litigation Reform Act of 1995. These statements
include, but are not limited to, descriptions of Old National Bancorp’s (“Old
National’s”) financial condition, results of operations, asset and credit
quality trends and profitability. Forward- looking statements can be
identified by the use of the words “anticipate,” “believe,” “expect,” “intend,” “could” and
“should,” and other words of similar meaning. These forward-looking
statements express management’s current expectations or forecasts of future
events and, by their nature, are subject to risks and uncertainties and there are a
number of factors that could cause actual results to differ materially from those in such
statements. Factors that might cause such a difference include, but are not
limited to: expected cost savings, synergies and other financial benefits from the
recently completed mergers might not be realized within the expected timeframes and costs or
difficulties relating to integration matters might be greater than expected; market,
economic, operational, liquidity, credit and interest rate risks associated with
Old National’s business; competition; government legislation and policies
(including the impact of the Dodd-Frank Wall Street Reform and Consumer Protection Act and its related
regulations); ability of Old National to execute its business plan; changes in the
economy which could materially impact credit quality trends and the ability to
generate loans and gather deposits; failure or circumvention of our internal
controls; failure or disruption of our information systems; significant changes in accounting, tax or regulatory
practices or requirements; new legal obligations or liabilities or unfavorable
resolutions of litigations; other matters discussed in this presentation and other
factors identified in our Annual Report on Form 10-K and other periodic
filings with the SEC. These forward-looking statements are made only as of the
date of this presentation, and Old National does not undertake an obligation to
release revisions to these forward-looking statements to reflect events or
conditions after the date of this
presentation. |
 4
Non-GAAP Financial Measures
These slides contain non-GAAP financial measures. For
purposes of Regulation G, a non-GAAP financial measure is a
numerical measure of the registrant's historical or future
financial performance, financial position or cash flows that
excludes amounts, or is subject to adjustments that have the
effect of excluding amounts, that are included in the most
directly comparable measure calculated and presented in
accordance with GAAP in the statement of income, balance
sheet or statement of cash flows (or equivalent statements) of
the registrant; or includes amounts, or is subject to adjustments
that have the effect of including amounts, that are excluded
from the most directly comparable measure so calculated and
presented. In this regard, GAAP refers to generally accepted
accounting principles in the United States. Pursuant to the
requirements of Regulation G, Old National Bancorp has
provided reconciliations within the slides, as necessary, of the
non-GAAP financial measure to the most directly comparable
GAAP financial measure. |
 5
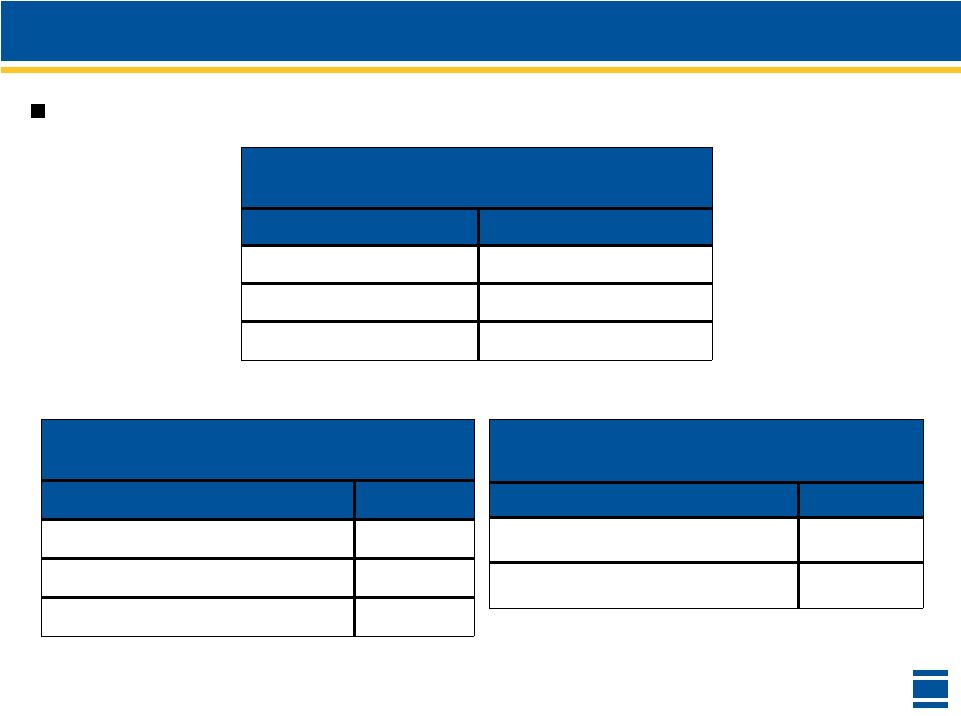
Snapshot of Old National
Source: SNL Financial, Company filings, FactSet Estimates
Note: Market data as of February 6, 2015; financial information as of December 31, 2014.
Summary Overview
Company Description
Headquarters
Evansville, IN
Market Cap (millions)
$ 1,628
2015E P / E
12.8 x
P / TBV
182%
Dividend Yield
3.4 %
LTM Average Daily Volume
677,985
Total Assets
$ 11,648
Trust Assets Under Management
$ 7,441
Total Deposits
$ 8,491
4Q14 ROAA
1.03 %
$ in millions, except noted
–
195 financial centers
–
211 ATMs
Focused on community banking with a full suite of product offerings:
–
Retail and small business
–
Wealth management
–
Leasing
Guided by three strategic imperatives
–
Strengthen the risk profile
–
Enhance management discipline
–
Achieve consistent quality earnings
–
Investment services
–
Capital markets
–
Insurance
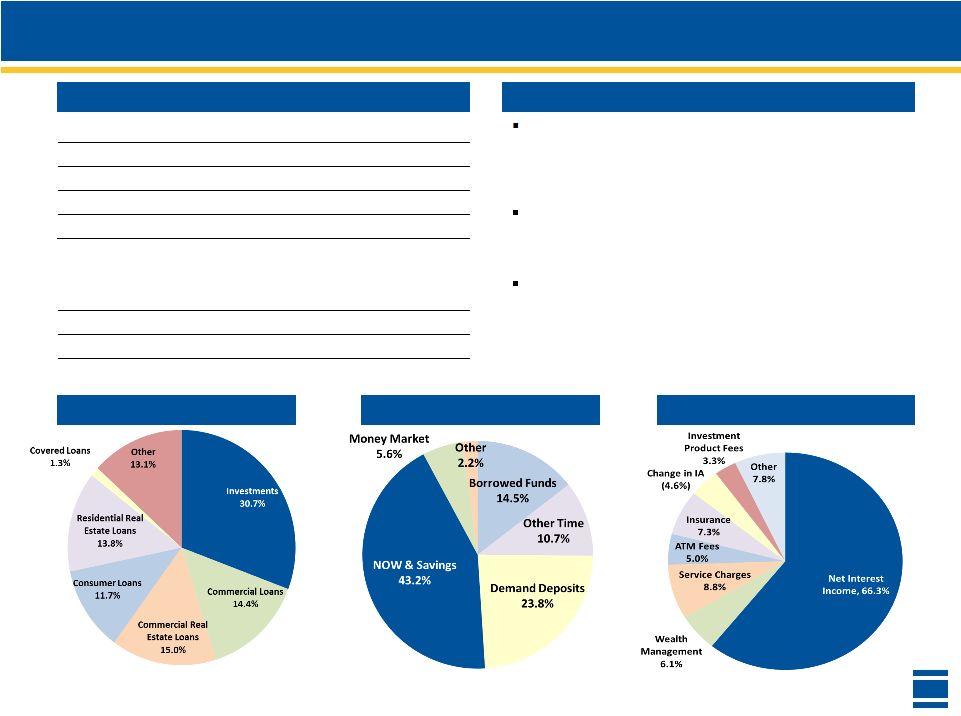
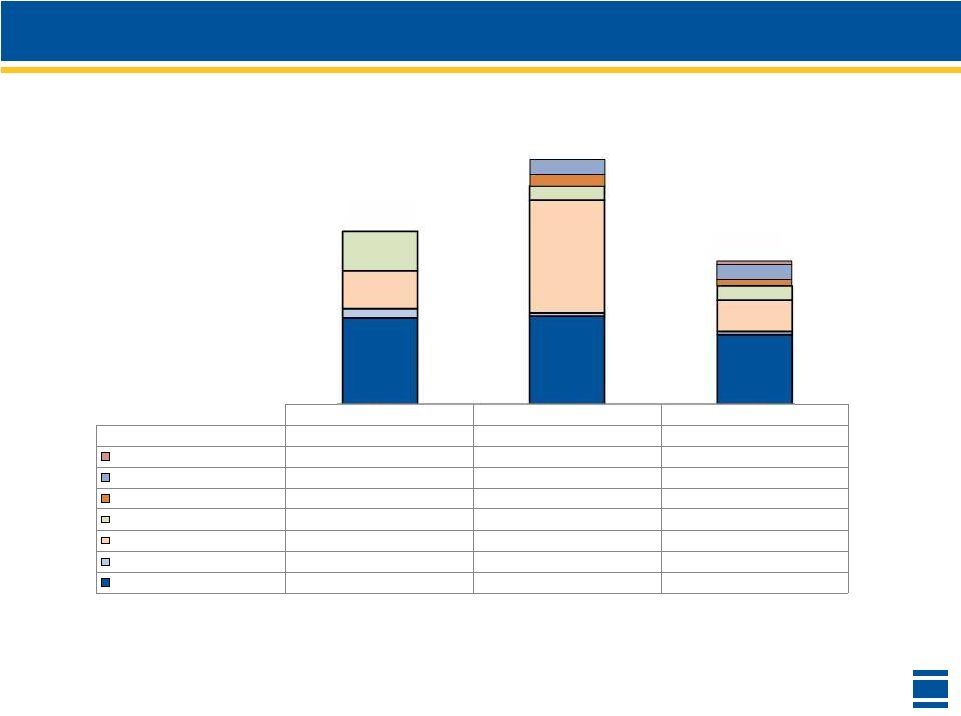
Asset Mix
Liability Breakdown
4Q14 Revenue Breakdown
Largest financial services bank holding company headquartered in Indiana with
a presence throughout Indiana, Western Kentucky and Louisville, Southern
Illinois and Central and Western Michigan
|
 6
Attractive footprint that offers both leading share in mature markets
and room to expand in higher growth markets
Consistent financial performance with distinct revenue streams and
improving efficiency
Diverse loan portfolio with growth accelerating while maintaining
strong credit metrics
Disciplined acquisitions that are exceeding expectations with robust
future opportunities
Steward of capital –
organic growth, dividend / share repurchases,
and acquisitions
Achieving strategic imperatives
Investment Thesis |
 7
Commitment to Excellence |
 8
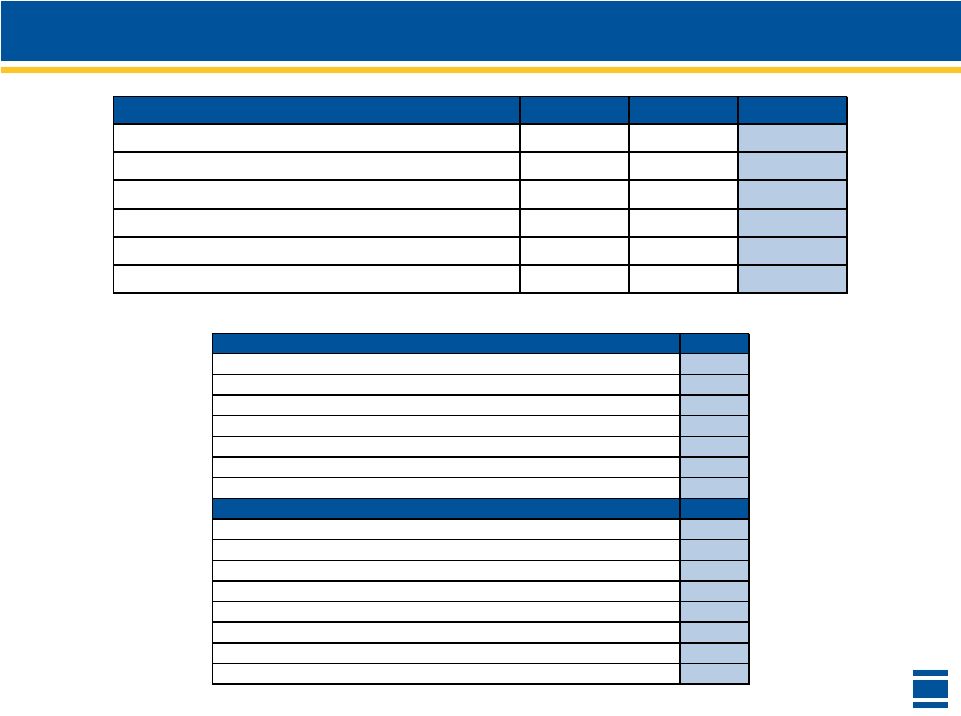
Our Indiana Footprint
Economic Vital Signs
Indicator
Outlook
Latest Statistics (December 2014)
Trend (YoY change from Dec. 2013)
Jobs
Employment
Unemployed
3,267,300
189,500
•
Labor Force increased 83,100
•
Unemployment rate decreased to 5.6%
(December 2013 rate was 6.7%)
Unemployment
Insurance Claims
Initial Claims
Weeks Claimed
27,922
144,182
•
Initial claims decreased 23.2%
•
Weeks claimed decreased 36.8%
Home Sales
Units Sold
Median Home Price
5,994
$125,000
•
The number of home sales increased 8.5%
•
The median sale price increased 5.2%
Regional Spending
Net Sales Tax Collected
$617.1 MM
•
Sales tax collections increased 5.4%
Local Indiana HQ
Stock Performance
Price Change during 4Q14
CMI: 10.0%
LLY: 6.0%
NI: 3.8%
SPG: 10.4%
STLD: (10.6)%
ANTM: 6.4%
ZMH: 12.6%
•
Stock prices have generally increased as
overall economy improves
Sources: US Bureau of Labor Statistics, US Dept. of Labor, Indiana Association of Realtors, IN Dept.
of Revenue and Bloomberg Strong
Stable or Mixed Decline
|
 9
4.6%
2.6%
2.2%
5.7%
0.0%
4.7%
USA
Indiana
Michigan
Ann Arbor
Kalamazoo
Grand Rapids
Our Michigan Footprint
Projected 2019 Median Household Income
Ann Arbor, Michigan (MSA Population: 354,530)
Kalamazoo, Michigan (MSA Population: 332,269)
Projected 2014-2019 Median HHI Growth
Grand Rapids, Michigan (MSA Population: 1,017,542)
$53,941
$48,365
$47,494
$62,065
$43,734
$53,389
USA
Indiana
Michigan
Ann Arbor
Kalamazoo
Grand Rapids
(1)
Crain’s Detroit Business, article published July 16, 2014
Michigan named "most improved" in ranking of pro-business states in 2014 by
the American Economic Institute
(improved
from
39th
to
18th)
1
Highest
median
household
income
MSA
in
Michigan
December
2014
unemployment
rate
of
3.2%,
compared
to
the
national
rate
of
5.6%
Listed
in
Forbes’
2013
“Best
Places
for
Business
and
Careers”
and
was
Livability.com’s
13th
“Best
Place
to
Live”
Popular area for healthcare and pharmaceutical
organizations, with major companies such as Pfizer, Perrigo
and Stryker housing large operations
December 2014 unemployment rate of 4.5% compared to the
national rate of 5.6%
Home to five of the world’s leading office furniture
companies.
December 2014 unemployment rate of 3.6%, compared to the
national rate of 5.6%
Source: SNL Financial and Bureau of Labor Statistics as of October 2014 |
 10
Indiana’s Economic Achievements
“AAA”
Credit Rating –
Fitch, Moody’s and Standard and
Poor’s
1
3
rd
Best
U.S.
State
for
Manufacturing
Jobs
2
6
th
Best
State
for
Business
–
CEO
Magazine
3
280 new manufacturing jobs created –
Berry Plastics,
Evansville,
Indiana
4
230
new
jobs
created
–
GE
Aviation,
Lafayette,
Indiana
5
Sources:
(1)
December 2013
(2)
June 2013; National Association of Manufacturers
(3)
May 2014
(4)
January 2014 press release of Berry Plastics
(5)
January 2015 press release of GE Aviation |
 11
Executing the Plan –
4Q14 Highlights
•
Execution of our M&A strategy of adding higher-growth markets
Continue to
Grow Core
Revenue
•
Organic
loan
growth
of
$51.9
million
1
,
or
3.4%
annualized,
over
3Q14
and
organic
growth
of
$339.6
million
1
,
or
7.0%,
over
4Q13
•
Revenue
growth
2
of
11.9%
from
4Q13
•
Organic growth in Banking, Wealth Management and Insurance
•
Core net interest margin decreased 17 bps from 3Q14
Reduce
Operating
Expenses
Transform
the
Franchise
Into Higher-
Growth
Markets
•
Operational
expenses
3
increased
$.4
million
from
3Q14
•
Expected Tower cost savings of 35%+ on track as announced
•
Expected United Bancorp, Inc. cost savings of 32% on track as announced
1
Excluding change in FDIC covered loans and loans acquired in the
Tower, United and Lafayette acquisitions
2
Excluding changes in securities gains, accretion income and amortization of the
indemnification asset 3
Refer to slide 41 for a definition of operational expenses
Ann Arbor, MI –
United Bancorp acquisition closed and fully converted
Lafayette,
IN
–
LSB
Financial
Corp.
acquisition
closed
–
anticipate
1Q15
conversion
Grand
Rapids,
MI
–Founders
Financial
Corporation
acquisition
closed
–
anticipate
2Q15
conversion |
 12
4Q14 Financials
Net income of $29.3 million or $.25 per share
–
19.1% increase over the $24.5 million in net
income in 4Q13
Included in 4Q14 are the following pre-tax
items
–
$3.1 million in merger and integration charges
–
$6.2 million amortization of the indemnification
asset
–
$16.6
million
in
accretion
income
1
1
Income in excess of contractual interest |
 13
2014 Financials
Net income of $103.7 million or $.95 per share
–
2.7% increase over the $100.9 million in net
income in 2013
Included in 2014 are the following pre-tax
items
–
$15.6 million in merger and integration charges
–
$43.2 million amortization of the indemnification
asset
–
$86.5
million
in
accretion
income
1
1
Income in excess of contractual interest |
 14
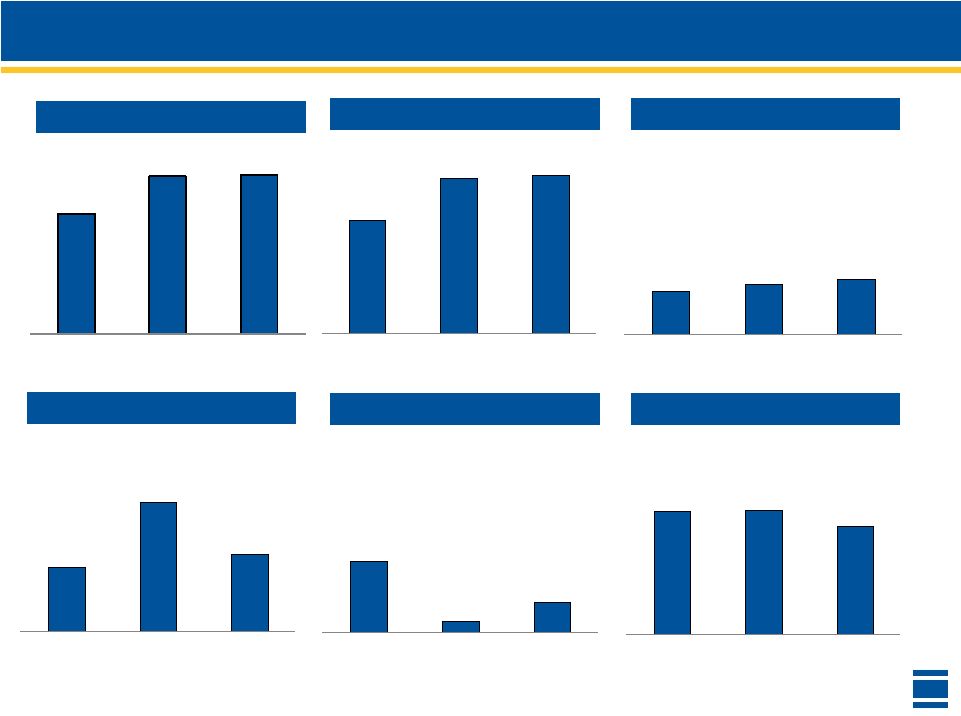
3.30%
3.32%
3.15%
4Q13
3Q14
4Q14
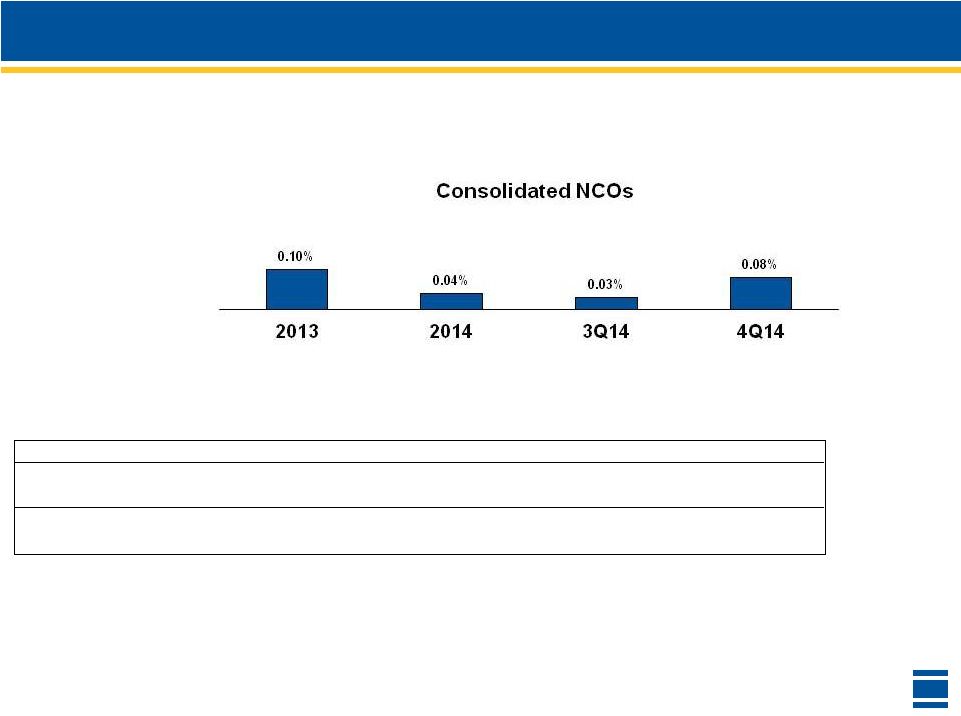
0.19%
0.03%
0.08%
4Q13
3Q14
4Q14
$43.2
$86.9
$51.9
4Q13
3Q14
4Q14
$28.6
$33.1
$36.5
4Q13
3Q14
4Q14
$85.1
$90.7
$91.1
4Q13
3Q14
4Q14
$111.9
$124.9
$125.2
4Q13
3Q14
4Q14
Basic Banking
Adjusted
Income
3
Operational
Expenses
2
Organic
Loan
Growth
4
Core
NIM
5
Consolidated NCOs
$ in millions
1
Refer to slide 39
2
Refer to slide 41
End of period balances
3
See appendix for non-GAAP reconciliation
4
Refer to slide 22
5
Refer to slide 32
Revenue
1 |
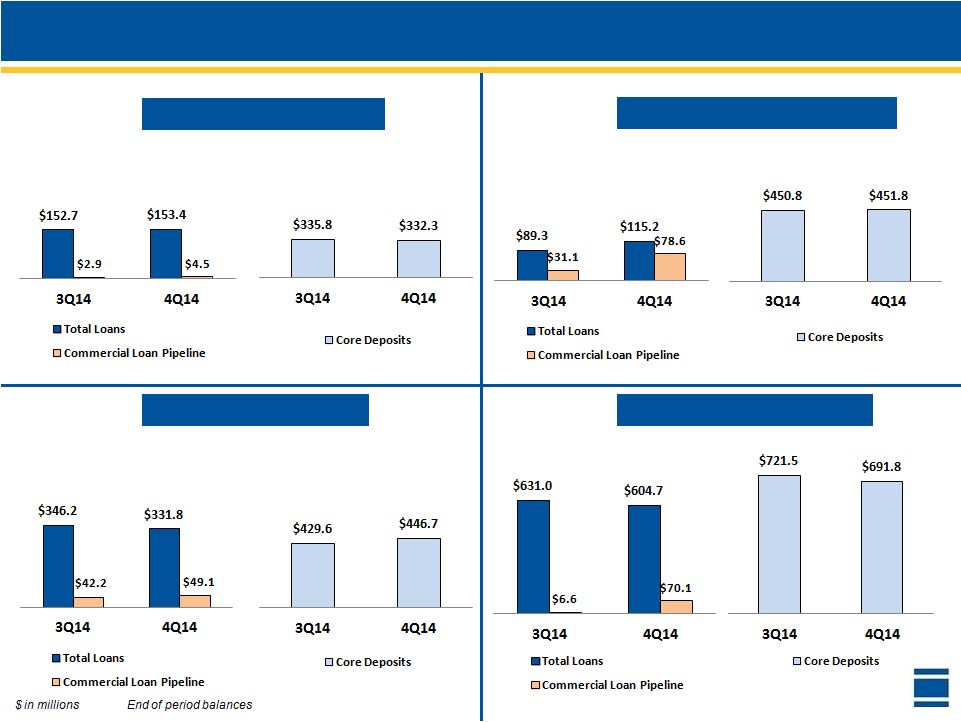 Update on New Markets
Ft Wayne, IN
Ann Arbor, MI
Columbus, IN
MI / Northern IN
(Indiana Community —
Closed 9/15/12)
(BofA Branches —
Closed 7/12/13)
(Tower —
Closed 4/25/14)
(United —
Closed 7/31/14)
15 |
 16
Fee-Based Business Revenue
$ in millions
ONB Less Tower & United
Tower
United |
 17
Net Charge-Offs / Provision
$ in millions
1
Excludes FDIC-covered loans
2013
2014
3Q14
4Q14
($3.9)
$4.4
$3.0
$0.7
($2.3)
$3.1
$2.6
$0.9
1
Provision for Loan Losses
Consolidated Provision for
Loan Losses |
 18
$ in millions
Credit Quality –
Excluding Covered Loans
$135.4
$170.5
$194.8
$121.8
$116.5
4Q13
3Q14
4Q14
Special Mention Loans
$63.2
$100.6
$107.8
$87.2
$93.8
4Q13
3Q14
4Q14
Substandard Accruing Loans
$96.6
$125.4
$125.7
$81.1
$73.9
4Q13
3Q14
4Q14
Substandard Nonaccruing + Doubtful
Loans
Excludes loans acquired through Tower, United and Lafayette transactions
|
 19
2015 Initiatives –
Execution is KEY
Grow organic revenue
–
Redesigned checking product lineup
New checking account product has reduced attrition over 50%
–
Leverage fee income businesses
Enhanced referral program
Sales summit
Leverage new markets
Improve operating leverage
Close/consolidate 19 banking centers
Sale of Southern Illinois market (12 locations)
Sale of 5 banking centers (4 in Eastern Indiana + 1 in Ohio)
Early retirement program
–
Gains on sales should offset costs associated with these actions
–
New
efficiency
ratio
target
is
63.0%
in
4Q15
–
in
2015,
25%
of
short-term
incentives
Prudent use of capital
–
Recently announced 9% increase in cash dividend
–
Share buyback program
–
Pause means pause
Anticipated timing of branch actions: 6 consolidations mid-March, 13
consolidations mid-May, sales should be completed by mid 3Q15 Approx. $620
million in deposits and $200 million in loans combined
Recently announced actions should provide annualized noninterest expense savings of $23
million to $27 million
|
 Investment Thesis
Financial Data as of 12-31-14
Dated: February 17, 2015
*
*
*
*
* |
 21
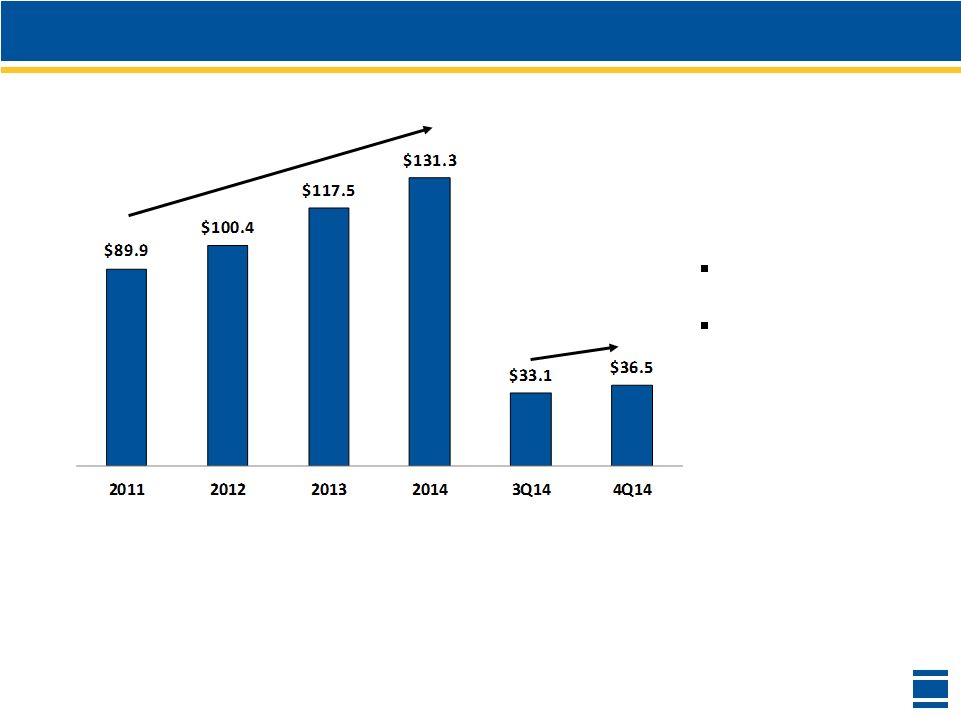
Adjusted
Income
1
–
Strong
Growth
$ in millions
Adjusted income represents income before taxes less accretion income, change in
indemnification assets, merger/integration expenses and costs associated with
branch divestitures CAGR of 13.5%
from 2011 to 2014
Growth of 10.3%
3Q14 vs 4Q14
13.5%
10.3%
1
Non-GAAP financial measure which Management believes is useful in evaluating the financial results
of the Company – see Appendix for Non-GAAP reconciliation |
 22
$6,097.0
$6,384.0
$235.1
$51.9
3Q14
Loans Obtained
Through LSB Acquisition
Organic Growth
4Q14
Loan Growth –
Excluding Covered Loans
$ in millions
1
Loan production net of principal pay-downs, prepayments and loan sales to the
secondary market $4,872.8
$6,384.0
$1,171.6
$339.6
4Q13
Loans Obtained
Through Tower, United
& LSB Acquisitions
Organic Growth
4Q14
End of Period Balance
1
1 |
 23
Loan Production Trends
$ in millions
Commercial
Residential Mortgage
Consumer Direct
Consumer Indirect
Full-year total production increased 10.7% over 2013
|
 24
Commercial Loans
$ in millions
1% of line utilization = $13.5
million in outstandings
37.7%
2007-2008 Average = 39.9%
39.1%
Commercial Line Utilization
Commercial Loan Pipeline |
 25
Loan Concentrations –
Excluding Covered Loans
At 12-31-14
Commercial
Commercial Real Estate
Diversified Commercial Loan Portfolio |
 26
Credit Quality –
Excluding Covered Loans
See Appendix for definition of Peer Group
1
As a % of end of period total loans
Peer Group data per SNL Financial
1.07%
0.81%
4Q13
3Q14
4Q14
30+
Day
Delinquent Loans
ONB
Peer Group Average
0.00%
0.01%
0.01%
0.40%
4Q13
3Q14
4Q14
90+
Day
Delinquent Loans
ONB
Peer Group Average
0.42%
0.43%
0.45%
0.29%
1
1 |
 27
Credit Quality –
ALLL and Mark Summary
$ in millions
1
Non-GAAP financial measure which Management believes useful to demonstrate that
the remaining discount considers credit risk and should be included as part
of total coverage N/A = not
applicable At December 31, 2014
ONB Legacy
Monroe
Integra
Indiana
Community
Tower
United
Lafayette
Total
Allowance for Loan Losses (ALLL)
$42.8
$1.3
$3.6
-
-
$0.1
-
$47.8
Loan Mark
N/A
$7.4
$37.2
$24.4
$21.1
$35.7
$22.6
$148.5
Total ALLL/Mark
$42.8
$8.8
$40.8
$24.4
$21.1
$35.8
$22.6
$196.3
Pre-Mark Loan Balance
$4,859.9
$115.5
$193.3
$177.4
$310.1
$553.7
$256.8
$6,466.7
ALLL/Pre-Mark Loan Balance
0.88%
1.15%
1.87%
0.00%
0.00%
0.03%
0.00%
0.74%
Mark/Pre-Mark Loan Balance
N/A
6.44%
19.26%
13.77%
6.81%
6.44%
8.82%
2.30%
0.88%
7.59%
21.13%
13.77%
6.81%
6.46%
8.82%
3.04%
Combined ALLL & Mark/Pre-Mark
Loan Balance
1 |
 28
Conservative Lending Limits/Risk Grades
Borrower
1
Asset
Quality
Rating
(Risk Grades)
In-House
Lending
Limit
1
($ in millions)
0 –
Investment Grade
$30
1 –
Minimal Risk
$25
2 –
Modest Risk
$25
3 –
Average Risk
$22.5
4 –
Monitor
$15
5 –
Weak Monitor
$10
6 –
Watch
$7.5
7 –
Criticized (Special Mention)
$5
In-house lending limits conservative relative to ONB’s legal lending limit
at 12-31-14 of $142.4 million per borrower
1
Includes entire relationship with borrower
Borrower
1
Asset
Quality
Rating
(Risk Grades)
8 –
Classified (Problem)
9 –
Nonaccrual |
 29
Indemnification Asset Balance
At December 31, 2014, $9.7 million of the remaining IA balance is expected to
be
amortized
and
reported
in
noninterest
income
over
the
next
21
months
$ in millions |
 30
Investment Portfolio Purchases 4Q14
1
1
Data as of December 31, 2014
Q4 2014 Purchases-
Book Value
Treasuries
8,043,738
Agencies
101,523,641
Pools
52,122,658
CMOs
6,704,359
Municipals
56,123,782
Corporates
26,817,592
ABS
28,311,522
Equity
0
Total
279,647,292
0.00%
1.00%
2.00%
3.00%
4.00%
5.00%
Total
ABS
Corporates
Municipals
CMOs
Pools
Agencies
Treasuries
2.29%
1.49%
2.32%
4.79%
1.69%
2.45%
1.61%
0.35%
T/E Book Yield of Purchases
0.00
2.00
4.00
6.00
8.00
10.00
12.00
Total
ABS
Corporates
Municipals
CMOs
Pools
Agencies
Treasuries
3.78
0.35
4.57
9.23
2.41
3.94
2.60
1.10
Duration of Purchases |
 31
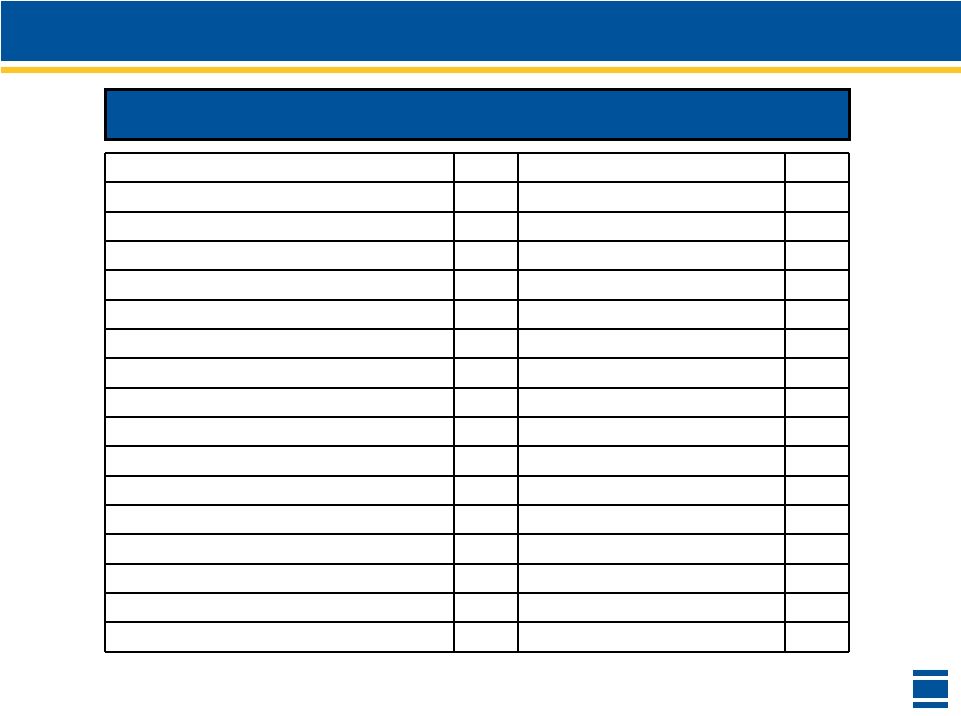
CD Maturity Schedule
Represents CD maturities at December 31, 2014
Bucket
Amount
($ in 000's)
Rate
0-30 days
69,665
0.59%
31-60 days
57,873
0.70%
61-90 days
69,507
0.55%
91-120 days
58,398
0.92%
121-150 days
36,586
0.47%
151-180 days
53,533
0.43%
181-210 days
46,855
0.62%
211-240 days
40,688
0.49%
241-270 days
45,310
0.89%
271-300 days
45,988
1.74%
301-330 days
32,864
0.94%
331-365 days
43,976
0.91%
1-2 years
257,087
2.02%
2-3 years
98,146
0.81%
3-4 years
59,874
1.19%
4-5 years
46,822
1.51%
Over 5 years
25,846
1.59% |
 32
Net
Interest
Margin
1
1
Fully
taxable
equivalent
basis,
non-GAAP
financial
measure
which
Management
believes
is
useful
in
evaluating
the
financial
results
of
the
Company
–
see
Appendix for Non-GAAP reconciliation
2
ONB Core includes contractual interest income of Monroe, Integra, IN Community,
Tower, United and Lafayette loans 2
4Q13
3Q14
4Q14
Total NIM
4.11%
4.78%
3.83%
Lafayette Accretion
0.00%
0.00%
0.03%
United Accretion
0.00%
0.14%
0.14%
Tower Accretion
0.00%
0.11%
0.06%
IN Community Accretion
0.37%
0.13%
0.13%
Integra Accretion
0.35%
1.05%
0.29%
Monroe Accretion
0.09%
0.03%
0.03%
ONB Core
3.30%
3.32%
3.15%
4.78%
4.11%
3.83% |
 33
Core Net Interest Margin
1
1
Refer to slide 32 |
 34
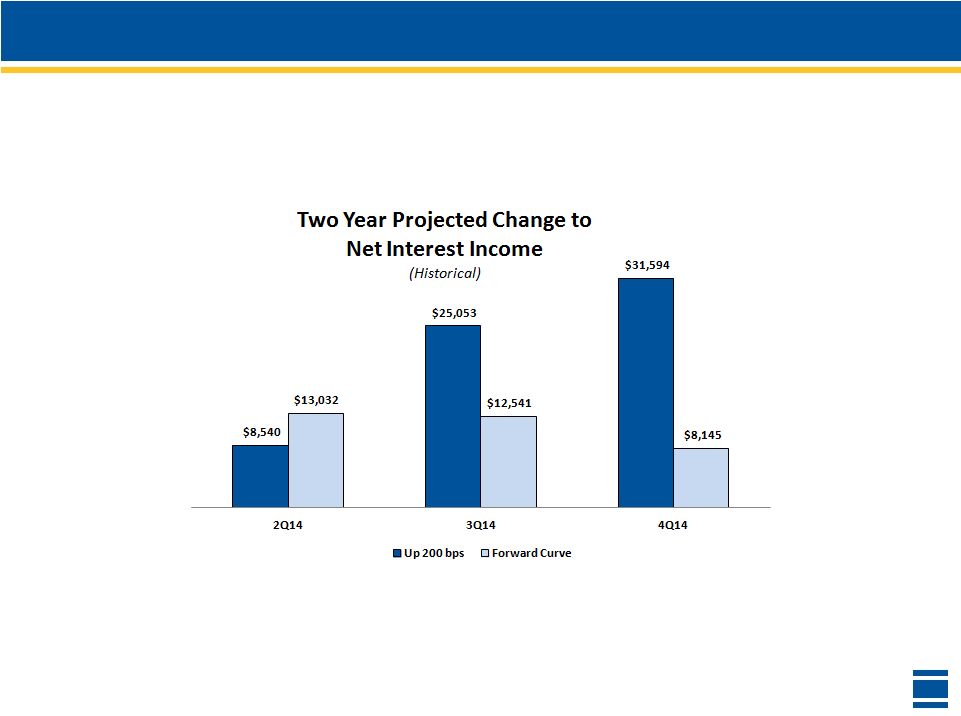
Modeled Interest Rate Sensitivity
$ in thousands
Change to Net Interest Income based on a one year time horizon
Refer to slide 36 for rate curves
Total non-maturity, interest-
bearing accounts increase from
0.08% to 0.39% in the “Up 100
bps”
scenario
21.6% of total non-interest
bearing DDA are considered rate
sensitive
43% of C&I and CRE loans
reprice within one year
17% of loans have floors; less
than 1% of these loans are
currently below their floor rates
Investment portfolio duration of
3.76 at 12/31/14, down from 4.16
at 9/30/14.
3Q14
2Q14 |
 35
Modeled Interest Rate Sensitivity
$ in thousands
Change to Net Interest Income based on a one year time horizon
Refer to slide 36 for rate curves |
 36
Interest Rate Curves |
 37
Tangible Common Book Value
1
Non-GAAP financial measure management believes is useful in evaluating the financial results of
the Company – see Appendix for Non-GAAP reconciliation
1 |
 38
Capital Ratios
Peer Group data per SNL Financial
See Appendix for definition of Peer Group
1
See Appendix for Non-GAAP reconciliation
On October 23, 2014, ONB Board of Directors authorized repurchase of up to 6.0
million shares through January,
2016
As of January 21, 2015, 1.1 million shares of ONB common stock have been
repurchased under the repurchase
plan |
 39
Total Revenue –
Positive Trends
$ in millions
Revenue
growth
1
of
11.9% from 4Q13
11.9%
Revenue less securities gains, accretion income and amortization of indemnification asset 1
|
 40
Noninterest Income
$ in millions
$(3.4)
$(19.1)
$(6.2)
$12.8
$12.5
$12.0
$7.9
$8.1
$7.9
$19.8
$23.4
$25.1
$7.0
$6.8
$6.8
$44.1
$31.7
$45.6
4Q13
3Q14
4Q14
Debit Card and ATM Fees
Fee-based business: Wealth Management, Insurance, Mortgage and
Investments
Other Income
Service Charges on Deposits
Amortization of Idemnification Asset |
 41
*Other Expenses include:
In 4Q13, $.5 in BSA/AML penalties, $.4 million in pension adjustments and a $.3
million reversal of provision for unfunded commitments
In 3Q14, $1.0 million reversal of hospitalization expense, a $0.7 million adjustment
in incentive of stock-based compensation and a $.3 million impairment on
a branch held for sale In 4Q14, a $1.4 million reversal of lease termination
fee, a $1.0 million reversal of hospitalization expense and a $.9 million
reversal of provision for unfunded commitments
$85.1
$90.7
$91.1
$0.6
$2.5
$3.6
$3.1
$4.5
$5.7
$2.6
$2.1
$1.4
$88.2
$100.0
$100.1
4Q13
3Q14
4Q14
Operational Expenses
Other Expenses*
Merger/Integration Costs
United Operational Costs
Tower Operational Costs
Lafayette Operational Costs
$ in millions
Operational expenses = total noninterest expense less Tower, United and Lafayette
operational costs, merger/integration costs and other expenses Noninterest
Expense – Well Controlled
Reported 4Q14
efficiency ratio of
69.54%
4Q14 efficiency ratio
excluding
merger/integration
costs
of
67.34%
1
Anticipated
merger/integration
costs in 1Q15 of $4.0
million to $5.0 million
($1.4)
1
Non-GAAP financial measure which Management believes is useful in evaluating
the financial results of the Company – see Appendix for Non-GAAP
reconciliation ($3.3) |
 42
Returned to
community
bank model
2004
2005
Sold non-
strategic
market –
Clarksville, TN
–
5 branches
2006
Sold non-
strategic market
–
O’Fallon, IL –
1 branch
2007
2008
2009
2010
2011
2012
2013
Acquired St.
Joseph Capital –
Entry into
Northern IN
market
February, 2007
Acquired 65
Charter One
branches
throughout
Indiana
March, 2009
Acquired Monroe
Bancorp –
Enhanced
Bloomington, IN
presence
January, 2011
Acquired Indiana
Community –
Entry into
Columbus, IN
September, 2012
FDIC-assisted
acquisition of
Integra Bank
July, 2011
Sold non-
strategic
market –
Chicago-area -
4 branches
Consolidation of
21 branches
Acquired 24
MI / IN branches
July, 2013
Consolidation
of 2 branches
Consolidation
of 8 branches
Consolidation
of 1 branch
Consolidation
of 10 branches
Consolidation
of 12 branches
Consolidation
of 44 branches
Consolidation
of 5 branches
Sold 12
branches
Consolidation
of 22 branches
Acquired 209
Sold 22
Consolidated 129
Acquired Tower
Financial –
Enhancing Ft.
Wayne, IN
presence April,
2014
Transforming Old National’s Landscape
Acquired
United
Bancorp —
Entering Ann
Arbor, MI July,
2014
2014
Consolidation
of 4 branches
Acquired LSB
Financial Corp.–
Enhancing
Lafayette, IN
presence
November 1,
2014
Acquired
Founders
Financial
Corporation–
Entry into
Grand
Rapids , MI
January 1, 2015
2015 |
 43
Strategy
Process
Emerging Trends
Focus on community banks with strong
client relationships and deposit
franchises
Mid-sized markets within or near existing
franchise with above average growth
rates
Must pass rigorous due diligence process
Must align both strategically and
culturally
Must meet/exceed financial targets
Must enhance Old National’s mission of
being a true “community bank”
M&A –
Partnerships
Rising M&A competition is increasing
price multiples
Resurgence of MOEs giving potential
targets an alternative to selling
Cash deals becoming more in favor by
targets
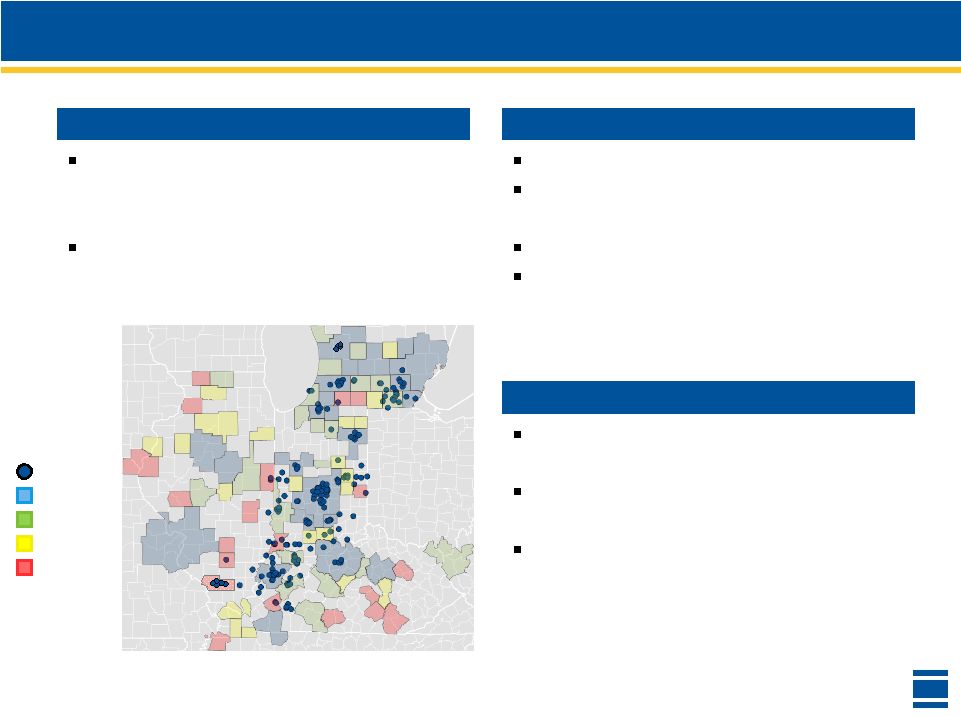
Legend
ONB
1
st
Quartile
2
nd
Quartile
3
rd
Quartile
4
th
Quartile
Represents MSAs with more than 15,000 households in IN,KY,IL, southern MI, Cincinnati and St. Louis.
MSA quartile rankings weighted as follows: 25% number of households, 20% median HH income, 10%
unemployment, 10% median HH income 5-year growth, 10% population 5-year growth, 10% deposits/branch ratio and
15% households/branch ratio. |
 44
Shifting to higher-growth
markets from lower-growth
markets
–
Entry and fill-in of existing
higher-growth markets
through strategic acquisitions
Acquired 209 branches since
2004
–
Sale or consolidations in
lower-growth, non-core
markets
Consolidated 129 branches
Sold 22 branches
44
Old National’s Landscape |
 45
$ in millions
N/A equals not applicable
(1) Based on end of quarter assets immediately preceding announcement date
Completed Acquisitions
Acquisition
RBS
Citizens-65
Branches
Monroe
Integra Bank
Indiana
community
BofA -
24
Branches
Tower
Financial
United
Bancorp
LSB
Founders
Deal Type
Branch Deal
Traditional
FDIC-Assisted
Traditional
Branch Deal
Traditional
Traditional
Traditional
Traditional
Principal Geography
Indianapolis,
IN
Bloomington,
IN
Evansville,
IN
Columbus,
IN
/
I-65
Corridor
Southwest
MI
/
Northern
IN
Fort
Wayne,
IN
Ann
Arbor,
MI
Lafayette,
IN
Grand
Rapids,
MI
Purchase Price at Announcement
$16
$84
N/A
$79
$23
$108
$173
$67
$88
NA
$838
$1,900
$985
N/A
$681
$919
$366
$466
% Stock Consideration at Announcement
0%
100%
N/A
100%
0%
71%
80%
75%
54%
Announce Date
11/24/2008
10/6/2010
7/29/2011
1/25/2012
1/9/2013
9/10/2013
1/8/2014
6/4/2014
7/28/2014
Close Date
3/20/2009
1/1/2011
7/29/2011
9/15/2012
7/12/2013
4/25/2014
7/31/2014
11/1/2014
1/1/2015
Total Assets at Announcement
1 |
 46
Committed to Strong Corporate Governance
Stock ownership guidelines have been
established for named executive officers as
follows:
As of December 31, 2014, each named
executive officer has met their stock
ownership requirement
Position or Salary
Target Ownership Guidelines
Chief Executive Officer
5X salary in stock or 200,000 shares
Chief Operating Officer
4X salary in stock or 100,000 shares
Salary equal to or greater than $250,000
3X salary in stock or 50,000 shares
Salary below $250,000
2X salary in stock or 25,000 shares
Salary equal to or less than $150,000
1X salary in stock or 15,000 shares |
 47
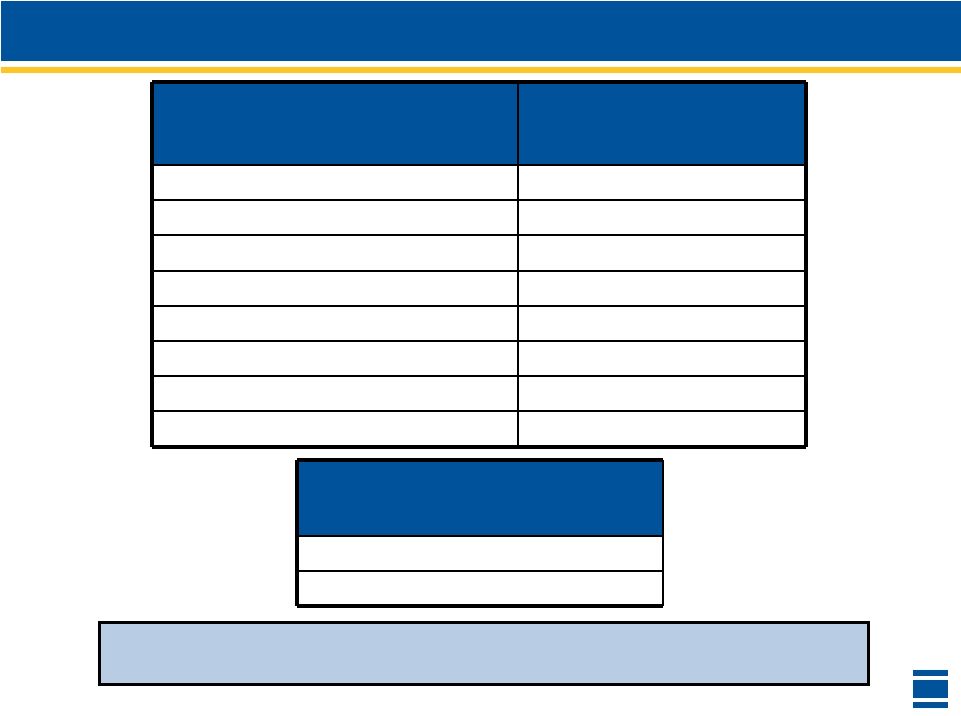
Executive Compensation
Tied to long term shareholder value:
Short Term Incentive Plan
(CEO, CFO, CBA, CCO, Chief Legal Counsel)
Performance Measure
Weight
Corporate Net Income
60%
Net Charge-Offs
15%
Efficiency Ratio
25%
Long Term Incentive Plan
(CFO,CBA, CCO, Chief Legal Counsel)
Performance Measure
Weight
Performance-based
75%
(67% TSR & 33% EPS Growth)
Service-based
25%
Long Term Incentive Plan
(CEO)
Performance Measure
Weight
Performance-based
100%
(75% TSR & 25% EPS Growth) |
 Appendix
*
*
*
*
*
* |
 49
Tangible Common Equity
Tangible Common Equity – 9/30/2014
$876.7
4Q14 Earnings
29.3
4Q14 Dividend
(12.9)
4Q14 Share Repurchase
(10.6)
Issuance of Shares from Acquisition
51.8
Changes in OCI – Securities
5.5
Changes in OCI – Other
(4.6)
Increase in Goodwill & Intangibles
(39.0)
Tangible Common Equity – 12/31/2014
$896.2
$ in millions |
 50
2011
2012
2013
2014
4Q13
3Q14
4Q14
Total Revenues
$455.8
$498.6
$502.2
$531.5
$125.6
$142.8
$140.5
Less: Provision for Loan Losses
($7.5)
($5.0)
$2.3
($3.1)
($2.3)
($2.6)
($0.9)
Less: Noninterest Expense
($348.5)
($365.8)
($362.0)
($386.4)
($88.2)
($100.0)
($100.1)
Taxable Equivalent Adjustment
$11.8
$13.2
$16.9
$17.0
$4.4
$4.5
$4.3
Pre-tax Income (FTE)
$111.6
$141.0
$159.4
$159.0
$39.5
$44.7
$43.8
Less: Total Accretion
$36.9
$57.5
$59.0
$86.5
$16.8
$34.3
$16.6
Change in IA
($0.4)
$3.4
$9.3
$43.2
$3.4
$19.1
$6.2
Mergers/Integration Expenses
$16.9
$7.9
$5.9
$15.6
$2.5
$3.6
$3.1
Branch Divestitures
($1.2)
$5.7
$1.9
$0.0
$0.0
$0.0
$0.0
Adjusted Income
$89.9
$100.4
$117.5
$131.3
$28.6
$33.1
$36.5
Non-GAAP Reconciliations
$ in millions |
    51
Non-GAAP Reconciliations
$ in millions
end of period balances
4Q13
3Q14
4Q14
Total Shareholders’ Equity
$1,162.6
$1,407.2
$1,465.8
Deduct: Goodwill and Intangible Assets
(378.7)
(530.5)
(569.5)
Tangible Common Shareholders’ Equity
$784.0
$876.7
$896.2
Total Assets
$9,581.7
$11,179.8
$11,647.6
Add: Trust Overdrafts
0.1
0.1
0.2
Deduct: Goodwill and Intangible Assets
(378.7)
(530.5)
(569.5)
Tangible Assets
$9,203.1
$10,649.4
$11,078.2
Tangible Equity to Tangible Assets
8.52%
8.23%
8.09%
Tangible Common Equity to Tangible
Assets
8.52%
8.23%
8.09%
Net Income
$24.5
$29.1
$29.3
After-Tax Intangible Amortization
1.5
2.2
2.5
Tangible Net Income
$26.1
$31.3
$31.7
ROTCE
13.31%
14.29%
14.15% |
 52
Non-GAAP Reconciliations
$ in millions
end of period balances
4Q13
3Q14
4Q14
Total Shareholders’ Equity
$1,162.6
$1,407.2
$1,465.8
Deduct: Goodwill and Intangible Assets
(378.7)
(530.5)
(569.5)
Tangible Common Shareholders’ Equity
$784.0
$876.7
$896.2
Risk Weighted Assets
$5,734.0
$7,063.5
$7,333.4
Tangible Common Equity to Risk Weighted Assets
13.67%
12.41%
12.22%
end of period balances
3Q11
3Q12
3Q13
1Q14
2Q14
3Q14
4Q14
Total Shareholders’ Equity
$1,027.7
$1,186.8
$1,159.3
$1,185.2
$1,277.3
$1,407.2
$1,465.8
Deduct: Goodwill and Intangible Assets
(302.3)
(371.2)
(379.3)
(376.8)
(439.3)
(530.5)
(569.5)
Tangible Common Shareholders’ Equity
$725.4
$815.6
$779.9
$808.4
$838.1
$876.7
$896.2
Common Shares Issued and Outstanding at Period End
94,752
101,403
100,693
100,084
105,851
113,984
116,847
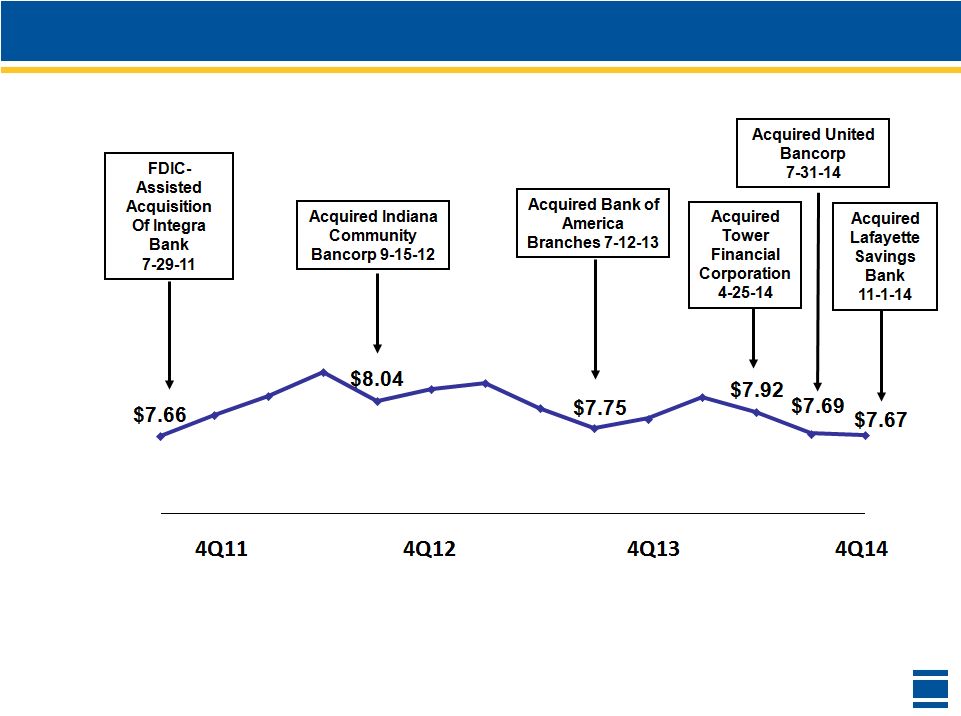
Tangible Common Book Value
7.66
$8.04
$7.75
$8.08
$7.92
$7.69
$7.67 |
 53
Non-GAAP Reconciliations
4Q13
3Q14
4Q14
Net Interest Income ($ in 000's)
$81,187
$108,367
$90,043
Taxable Equivalent Adjustment
4,359
4,488
4,324
Net Interest Income – Taxable Equivalent
$85,546
$112,855
$94,367
Average Earning Assets
$8,322,334
$9,444,853
$9,858,522
Net Interest Margin
3.90%
4.59%
3.65%
Net Interest Margin – Fully Taxable Equivalent
4.11%
4.78%
3.83%
Efficiency Ratio - As Reported
4Q14
Net Interest Income (FTE) ($ in millions)
$94.4
Noninterest Income Less Security Gains
45.6
Revenue Less Security Gains
139.9
Noninterest Expense
100.1
Intangible Amortization
2.8
Noninterest Expense Less Intangible Amortization
97.3
Efficiency Ratio
69.54%
Efficiency Ratio Excluding Acquisition Costs
4Q14
Net Interest Income (FTE) ($ in millions)
$94.4
Noninterest Income Less Security Gains
45.6
Revenue Less Security Gains
139.9
Noninterest Expense
100.1
Intangible Amortization
2.8
Acquisition Costs
3.1
Noninterest Expense Less Intangible Amortization and Acquisition Costs
94.2
Efficiency Ratio
67.34% |
 54
Old National’s Peer Group
Associated Banc-Corporation
ASB
MB Financial Inc.
MBFI
BancFirst Corporation
BANF
National Penn Bancshares Inc.
NPBC
BancorpSouth, Inc.
BXS
Park National Corporation
PRK
Bank of Hawaii Corporation
BOH
PrivateBancorp, Inc.
PVTB
Chemical Financial Corporation
CHFC
Prosperity Bancshares Inc.
PB
Commerce Bancshares, Inc.
CBSH
Renasant Corporation
RNST
Cullen/Frost Bankers, Inc.
CFR
South State Corporation
SSB
F.N.B. Corporation
FNB
Susquehanna Bancshares, Inc.
SUSQ
First Commonwealth Financial Corporation
FCF
TCF Financial Corporation
TCB
First Finanacial Bancorp.
FFBC
TFS Financial Corporation
TFSL
First Merchants Corporation
FRME
Trustmark Corporation
TRMK
First Midwest Bancorp Inc.
FMBI
UMB Financial Corporation
UMBF
FirstMerit Corporation
FMER
United Bankshares Inc.
UBSI
Flagstar Bancorp Inc.
FBC
Valley National Bancorp
VLY
Fulton Financial Corporation
FULT
WesBanco Inc.
WSBC
Home Bancshares, Inc.
HOMB
Wintrust Financial Corporation
WTFC
IberiaBank Corporation
IBKC
•
Like-size, publicly-traded financial services companies, generally in the
Midwest, serving comparable demographics with comparable services as ONB
|
 55
Investor Contact
Additional information can be found on the
Investor Relations web pages at
www.oldnational.com
Investor Inquiries:
Lynell J. Walton, CPA
SVP –
Director of Investor Relations
812-464-1366
lynell.walton@oldnational.com |
Serious News for Serious Traders! Try StreetInsider.com Premium Free!
You May Also Be Interested In
- Old National Bancorp Reports First Quarter 2024 Results
- Form 8.5 (EPT/RI) - Accrol Group Holdings Plc
- CTT Systems AB (publ.) - Interim Report First Quarter 2024
Create E-mail Alert Related Categories
SEC FilingsSign up for StreetInsider Free!
Receive full access to all new and archived articles, unlimited portfolio tracking, e-mail alerts, custom newswires and RSS feeds - and more!
