

Form 8-K NAVISTAR INTERNATIONAL For: Jul 21
 Tweet
Tweet Share
Share
UNITED STATES
SECURITIES AND EXCHANGE COMMISSION
Washington, D.C. 20549
FORM 8-K
CURRENT REPORT
Pursuant to Section 13 or 15(d)
of the Securities Exchange Act of 1934
Date of Report (Date of earliest event reported): July 21, 2015

NAVISTAR INTERNATIONAL CORPORATION
(Exact name of registrant as specified in its charter)
| Delaware | 1-9618 | 36-3359573 | ||
| (State or other jurisdiction of incorporation or organization) |
(Commission File No.) |
(I.R.S. Employer Identification No.) |
| 2701 Navistar Drive Lisle, Illinois |
60532 | |
| (Address of principal executive offices) | (Zip Code) |
Registrant’s telephone number, including area code: (331) 332-5000
(Former name or former address, if changed since last report.)
Check the appropriate box below if the Form 8-K filing is intended to simultaneously satisfy the filing obligation of the registrant under any of the following provisions:
| ¨ | Written communications pursuant to Rule 425 under the Securities Act (17 CFR 230.425) |
| ¨ | Soliciting material pursuant to Rule 14a-12 under the Exchange Act (17 CFR 240.14a-12) |
| ¨ | Pre-commencement communications pursuant to Rule 14d-2(b) under the Exchange Act (17 CFR 240.14d-2(b)) |
| ¨ | Pre-commencement communications pursuant to Rule 13e-4(c) under the Exchange Act (17 CFR 240.13e-4(c)) |
ITEM 7.01. REGULATION FD DISCLOSURE.
In accordance with General Instruction B.2. to Form 8-K, the following information shall not be deemed “filed” for purposes of Section 18 of the Securities Exchange Act of 1934, as amended, nor shall it be deemed incorporated by reference in any filing under the Securities Act of 1933, as amended, except as shall be expressly set forth by specific reference in such a filing.
On July 20, 2015, Navistar International Corporation (the “Company”) issued a press release announcing that it is refinancing the $697.5 million Senior Secured Term Loan facility of Navistar, Inc., which matures in August 2017, with a new $1.040 billion Senior Secured Term Loan that will mature in August 2020.
In connection with the proposed Senior Secured Term Loan refinancing, the Company intends to make a presentation to prospective lenders on July 21, 2015. Information from the lender presentation related to the Company is furnished as Exhibit 99.1 to this Current Report on Form 8-K and is incorporated by reference herein.
Navistar International Corporation (NYSE: NAV) is a holding company whose subsidiaries and affiliates produce International® brand commercial and military trucks, MaxxForce® brand diesel engines, and IC Bus™ brand school and commercial buses. The Company also provides truck and diesel engine service parts. Another affiliate offers financing services. Additional information is available at www.navistar.com.
| ITEM 9.01. | FINANCIAL STATEMENTS AND EXHIBITS |
(d) Exhibits.
The following documents are filed herewith:
| Exhibit |
Description | |
| 99.1 | Lender Presentation to be held on July 21st | |
Forward Looking Statements
Information provided and statements contained in this report that are not purely historical are forward-looking statements within the meaning of Section 27A of the Securities Act of 1933, as amended, Section 21E of the Securities Exchange Act of 1934, as amended, and the Private Securities Litigation Reform Act of 1995. Such forward-looking statements only speak as of the date of this report and the Company assumes no obligation to update the information included in this report. Such forward-looking statements include information concerning our possible or assumed future results of operations, including descriptions of our business strategy. These statements often include words such as “believe,” “expect,” “anticipate,” “intend,” “plan,” “estimate,” or similar expressions. These statements are not guarantees of performance or results and they involve risks, uncertainties, and assumptions. For a further description of these factors, see the risk factors set forth in our filings with the Securities and Exchange Commission, including our annual report on Form 10-K for the fiscal year ended October 31, 2014 and our quarterly report on Form 10-Q for the quarter ended April 30, 2015. Although we believe that these forward-looking statements are based on reasonable assumptions, there are many factors that could affect our actual financial results or results of operations and could cause actual results to differ materially from those in the forward-looking statements. All future written and oral forward-looking statements by us or persons acting on our behalf are expressly qualified in their entirety by the cautionary statements contained or referred to above. Except for our ongoing obligations to disclose material information as required by the federal securities laws, we do not have any obligations or intention to release publicly any revisions to any forward-looking statements to reflect events or circumstances in the future or to reflect the occurrence of unanticipated events.
SIGNATURE
Pursuant to the requirements of the Securities Exchange Act of 1934, the registrant has duly caused this report to be signed on its behalf by the undersigned hereunto duly authorized.
| NAVISTAR INTERNATIONAL CORPORATION | ||
| (Registrant) | ||
| By: | /s/ WALTER G. BORST | |
| Name: | Walter G. Borst | |
| Title: | Executive Vice President and Chief Financial Officer | |
Dated: July 21, 2015
EXHIBIT INDEX
| Exhibit |
Description | |
| 99.1 | Lender Presentation to be held on July 21st | |
 Exhibit
99.1 International
® is a registered trademark of , Inc. |
 1 Safe Harbor Statement Information provided and statements contained in this report that are not purely historical are
forward-looking statements within the meaning of Section 27A of the Securities Act
of 1933, as amended, Section 21E of the Securities Exchange Act of 1934,
as amended, and the Private Securities Litigation Reform Act of 1995.
Such forward-looking statements only speak as of the date of this
report and the Company assumes no obligation to update the information included in this report. Such forward-looking statements include information concerning our possible or assumed
future results of operations, including descriptions of our business strategy. These
statements often include words such as “believe,”
“expect,” “anticipate,” “intend,” “plan,” “estimate,” or similar expressions. These statements are not guarantees of performance or results and they involve risks,
uncertainties, and assumptions. For a further description of these factors, see the
risk factors set forth in our filings with the Securities and Exchange
Commission, including our annual report on Form 10-K for the year
ended October 31, 2014 and our quarterly report on Form 10-Q for the
quarter ended April 30, 2015. Although we believe that these forward-looking
statements are based on reasonable assumptions, there are many factors
that could affect our actual financial results or results of operations
and could cause actual results to differ materially from those in the forward- looking statements. All future written and oral forward-looking statements by us or persons acting on
our behalf are expressly qualified in their entirety by the cautionary statements
contained or referred to above. Except for our ongoing obligations to
disclose material information as required by the federal securities laws,
we do not have any obligations or intention to release publicly any revisions to any forward-looking statements to reflect events or circumstances in the future or to reflect the
occurrence of unanticipated events. |
 2 Troy Clarke President & Chief Executive Officer |
 3 Leading manufacturer of commercial trucks, buses and defense vehicles Number of active employees: ~14,200 2014 revenue: ~$10.8 billion Ranked #276 in 2014 U.S. Fortune 500 Strong and diverse product line- up One of the largest parts distribution networks in the U.S. Well capitalized and profitable captive finance company Who is Navistar? 9900i DuraStar ProStar + TranStar PayStar TerraStar WorkStar LoneStar |
 4 2012-2014 Turnaround Accomplishments Navistar has completed 10 years of progress in the last 2 years Navistar has completed 10 years of progress in the last 2 years Divested Non-core Businesses and Joint Ventures Consolidated Manufacturing Initiated Lean Practices Lowered Break- Even Point Changed Engine Technology EGR SCR Reduced Warranty Improved Quality Expanded EBITDA Margin This disciplined approach has positioned Navistar for improved profit and market share |
 5 Excellence in Operations Vision Areas of Focus: 2015 & Beyond Foundation: Drive to Deliver, 2012 – 2014 Excellence in Operations $120 million lower manufacturing cost $640 million in structural cost savings Significant material cost reductions Significant working capital reductions Flawless product launches Product quality significantly improved • Close the cost gap • New product launches • Increased brand consideration • Target customers • Manage used truck inventory • Best-in-class technology integration • Connected vehicle leadership • Lowest industry dwell time • Lean organization • Recruit and retain key skills and leadership talent Finish the Turnaround Uptime Leaders |
 6 Company Highlights Overall industry outlook steady heading into 2016 with favorable mix that will benefit the company After the successful execution of our SCR emission program, Navistar is refreshing the product portfolio to focus on quality, driver experience, fuel economy and the connected vehicle OnCommand Connection is the industry leading connected truck application, having positive impact on many parts of the business Best-in-class integration allows Navistar to partner with global suppliers:
increase speed to market, deliver leading-edge technology and provide
customer choice
Quality, reliability and customer support driving significant improvements
in Uptime
Improved margin profile with 50% lower break-even than 2012 will
continue to improve through relentless cost reduction and production
efforts Balance sheet flexibility to execute on “Uptime” strategy |
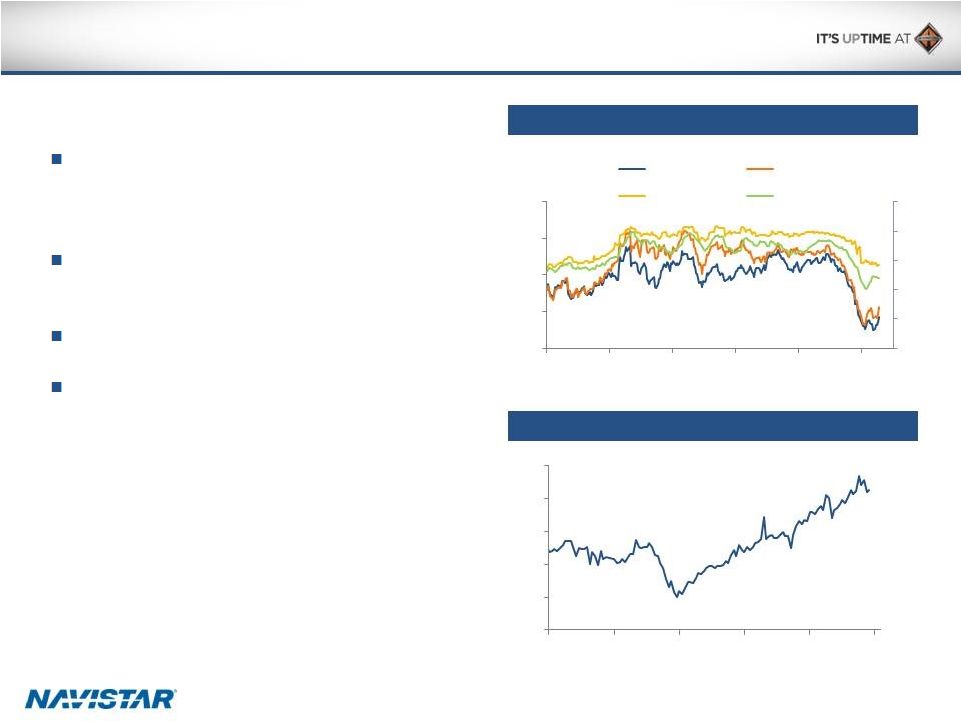 Industry
Growth Drivers Diesel and Crude Oil Prices
Purchasing power of truck owners continues
to improve due to tonnage increases and
decline in fuel prices
Truck tonnage index of 132.1 in May 2015, not
far from an all-time high of 135.8
Average age of class 8 vehicles above norm
Industry volume expected to increase from
342,000 units in 2014 to 365,000 units in 2015
(6.7% growth) and is expected to remain flat in
2016 $/Bbl (WTIC, BRENT) $/Gal (Diesel, Regular) ATA Truck Tonnage Index 0 1 2 3 4 5 30 60 90 120 150 2010 2011 2012 2013 2014 2015 WTIC Brent Diesel Regular 90 100 110 120 130 140 2005 2007 2009 2011 2013 2015 7 |
 8 +750 bps 8.9% 30.0% Segment Leadership, Positioned for Growth Note: Based on market share position determined by brand in U.S. and Canada; growth rates and estimates assume mid-point of range (as per
February 4, 2015 Analyst Day)
Bus Medium Class 8 – Heavy Class 8 – Severe Navistar Volume (units sold) 10,900 9,900 11,400 2014 2015E 12.6% Navistar Market Share 19,000 15,000 20,000 2014 2015E 26,800 25,800 27,800 2014 2015E 9,300 9,000 10,300 2014 2015E 40% 35% 45% 2014 2015E 24% 21% 27% 2014 2015E 14% 14% 16% 2014 2015E 15% 16% 17% 2014 2015E '14-'15 Growth Rate 5.8% +0 bps +450 bps +100 bps '14-'15 Share increase On track to deliver share targets in 3 of 4 product lines… On track to deliver share targets in 3 of 4 product lines… |
 9 Navistar’s Product Offensive Focused-Spec’d Trucks Project Horizon Alternative Fuels Premium Vocational |
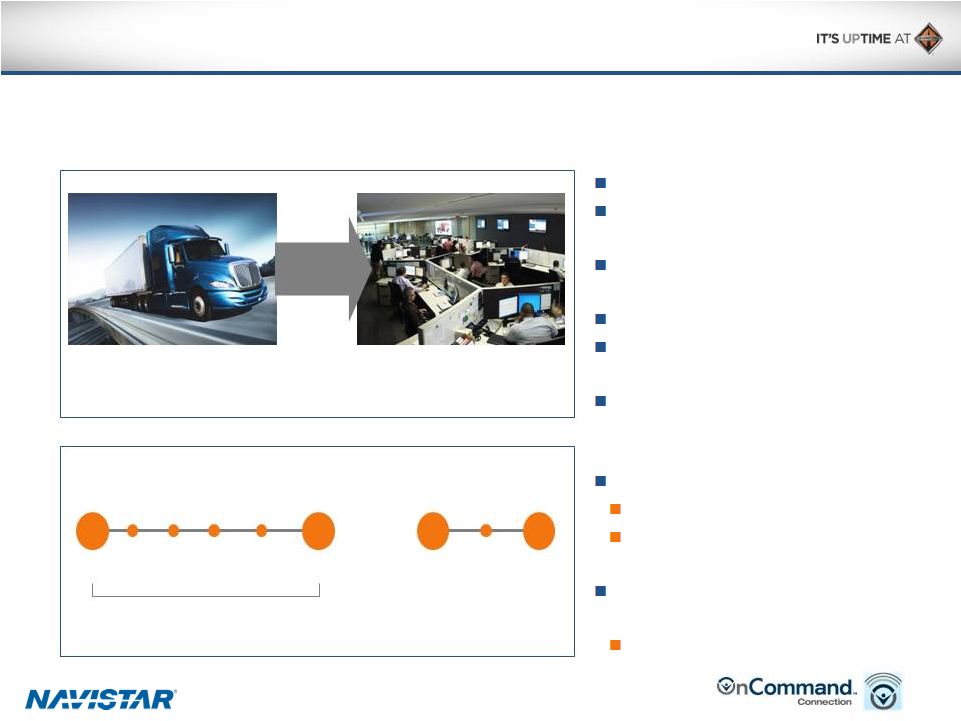 10 Connected Vehicle – Differentiation that Creates Value Navistar is leading the way with its remote diagnostic tool… OnCommand Connection…to be the industry leader in Uptime! Navistar is leading the way with its remote diagnostic tool… OnCommand Connection…to be the industry leader in Uptime! Over 130,000 vehicles connected Standard offering on International trucks Remote diagnostic and performance monitoring Leading Uptime tool Integrated customer support through dealers, parts and service Extensive database for analytic applications of products and services Drives product consideration Improves mix and revenue Provides additional opportunity in parts business Provides large fleet service to small fleet Lower cost of ownership Remote diagnostic and performance monitoring Customer support center Vehicle diagnostics/rooting Customer Service arrives writes up Diagnostics Parts availability Repairs start Customer back on the road Customer arrives Repairs start Customer back on the road Wait period eliminated by on-board vehicle diagnostics Yesterday Today Proactive diagnostics and repair planning improve Uptime Over 130,000 vehicles connected 10 |
 11 Best-In-Class Integration Leading supplier technology integration allows Navistar to deliver… Leading-edge technology Bendix Wingman Fusion Integrated and validated engineering Eaton Cummins SmartAdvantage AMT PSI Propane engine Customer choice in transmissions, axles, collision mitigation tools, etc. Speed to market Leverage suppliers’ technology spend |
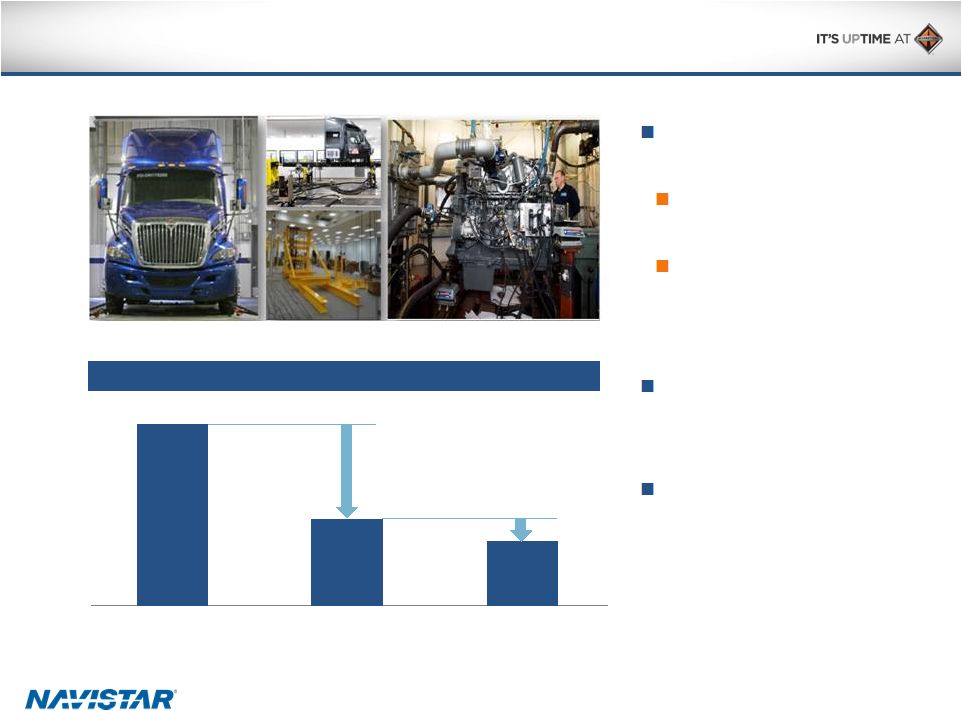 12 ProStar w/2010 Emission EGR engine ProStar w/2013 Emission SCR engine 2015 ProStar w/2013 Emission SCR engine Significant Improvements in Product Quality Leaders in engineering validation: 200 validation vehicles and engines More than 11 million equivalent miles of testing ProStar with Navistar engines: Repair rates ProStar with Navistar engines: Repair rates Today’s Navistar engines are twice as reliable as 2010 models Approaching warranty expense of less than 2.5% of revenue Twice as reliable Targeting 25% improvement |
 13 Supporting Customers Through Parts and Service 2014 Revenue: $2.5 billion National Account Customers North America Parts demonstrates continued growth through the turnaround period Parts remain a key component of profitability and cash generation OnCommand Connection technology plays a key role in parts and services growth and customer Uptime All Makes Proprietary FY12 FY13 FY14 North America Parts Segment Profit |
 14 Parts and Service Supported by the Broadest Dealer Network in the Industry 800+ Dealer Locations 8,000 Service Bays 7,600 Technicians $350 million Parts Inventory Recognized Market Leadership Leading Uptime |
 15 Walter Borst Executive Vice-President and Chief Financial Officer |
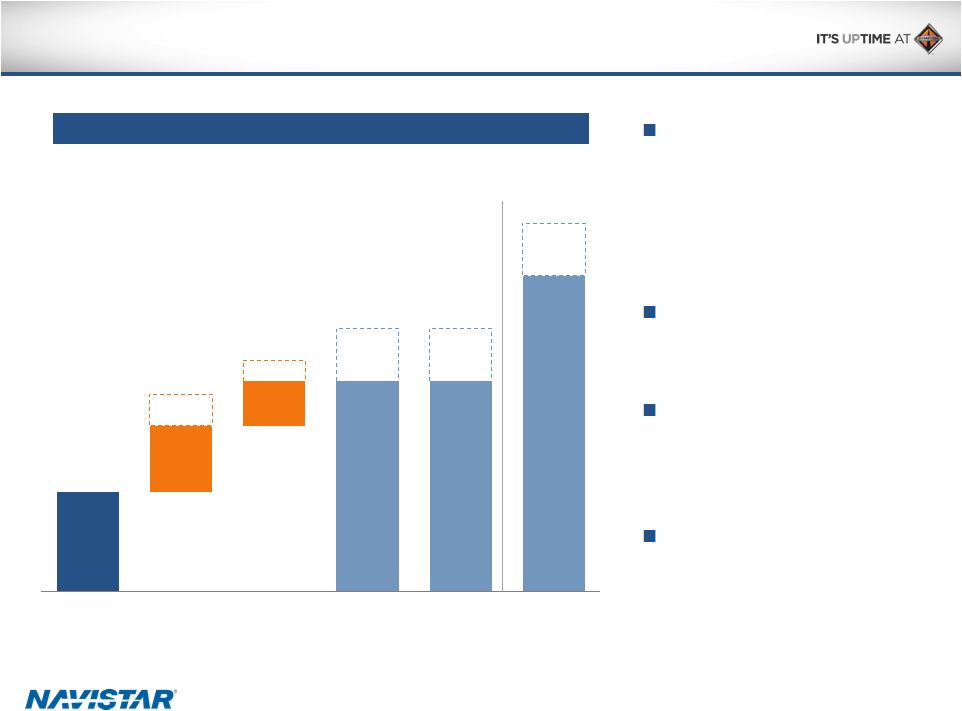 16 Adjusted EBITDA Margin Adjusted EBITDA Margin EBITDA Margin Goals Remain on Track 3.8% 2.5% 1.7% 1.2% 0.8% 8-10% 8-10% 12-14% Q2 2015 margin Cost improvements Revenue drivers Q4 2015E margin 2016E / 2017E Industry Benchmark Adjusted EBITDA for Q3 within communicated range and solid plans in place to achieve at least 8% adjusted EBITDA margin in Q4 2015 Near term adjusted EBITDA target sustainable in 2016 and 2017 Cost improvements continue to be significant portion of near-term plans to grow adjusted EBITDA Upside opportunities in cost and revenue depending on pace of market share recovery Note: This slide contains non-GAAP information; please see the REG G in appendix for a detailed reconciliation
|
 17 Growing Core North America Truck Revenue Revenue drivers Revenue drivers Increased year-over-year volumes Enhanced value proposition for customer driving sales through improved quality, reliability and technology Shift in mix toward higher margin products and dealer led sales Leading supplier technology and customer choice ¹ Assumes mid-point of range |
 18 Four Pronged Cost Approach to Improving Returns Material costs Structural costs Manufacturing costs Warranty costs Lowered break-even point by more than 50% since 2012 |
 19 Material Cost Savings Gross Material Savings (A) Gross Material Savings (A) 1.5–1.8% Material and logistics savings driven by: Design cost reductions Supplier consolidation Make vs. buy studies Logistics optimization Optimizing supply footprint Benchmarking material costs 2015 material savings will have a greater impact on margins as incremental SCR costs have been largely offset (A) Excludes incremental SCR costs 1.2% 1.7% 2013 2014 2015E |
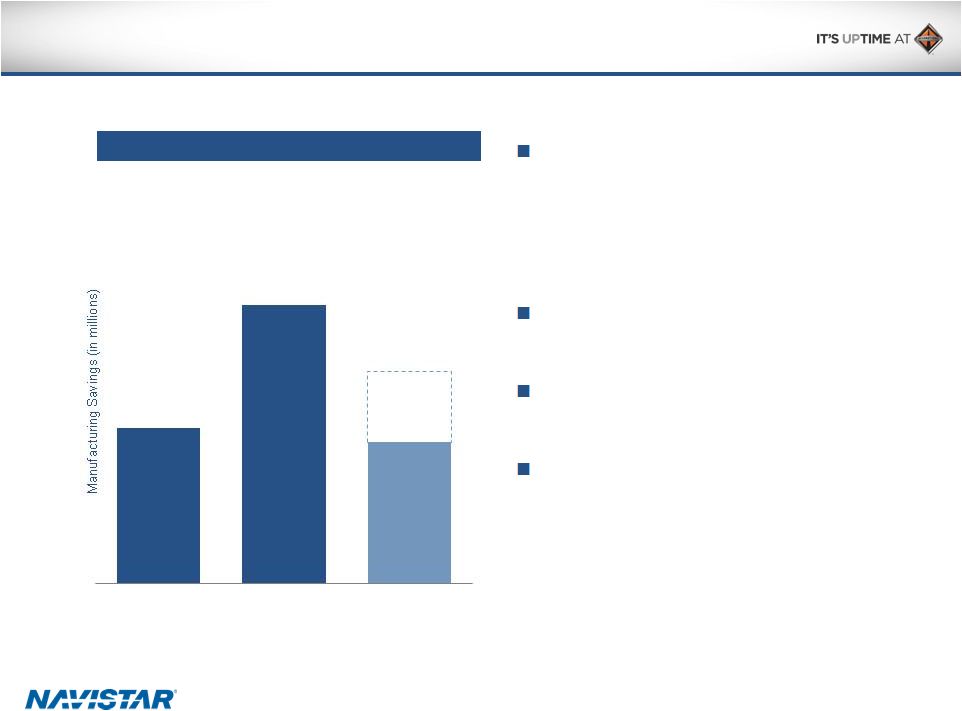 20 Manufacturing Cost Improvements Manufacturing Savings Manufacturing Savings $40–60 Previously announced consolidation of mid-range engine operations and closure of foundry operations will deliver $35 million of savings Implementation of lean in our plants making significant progress Increasing manufacturing productivity Continuing to study utilization / footprint optimization $44 $79 2013 2014 2015E |
 21 Structural Cost Improvements Structural Costs Structural Costs 15% 12% 2013 2014 2015E 10–11% Target Intense focus to drive SG&A costs towards industry benchmarks Engineering expense projected to decline year-over-year as a result of shift in engine strategy $640 million in cost savings since 2012 have helped to offset business headwinds Lower revenue impacting current structural cost percentage |
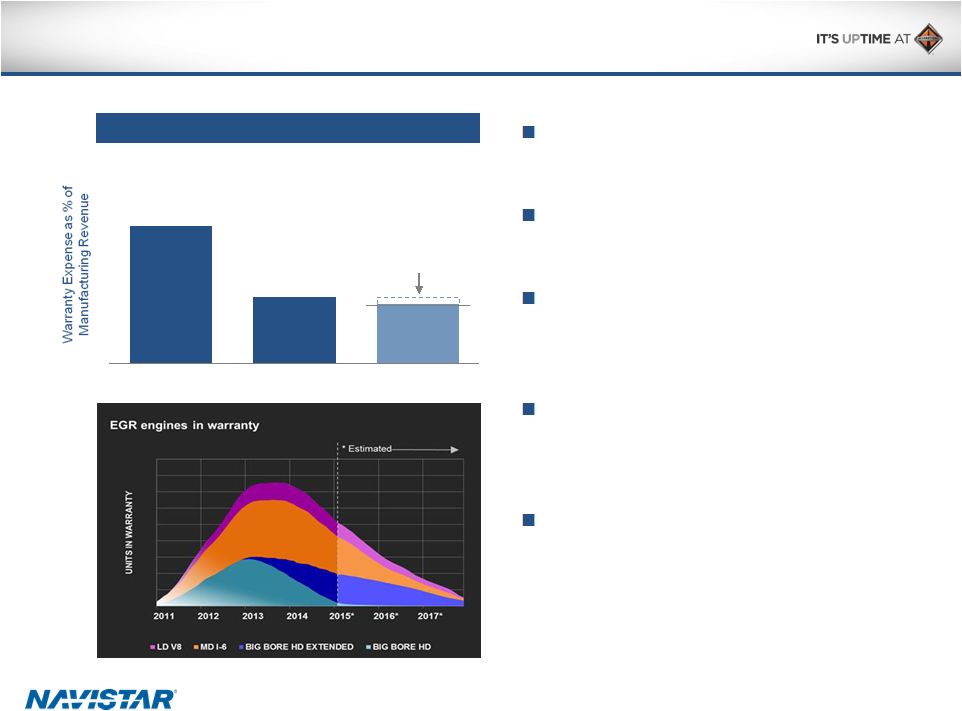 22 Warranty Cost Improvements Warranty Expense Warranty Expense 7.7% 3.7% 2013 2014 2015E 3.3–3.7% Target 4% point improvement achieved ahead of plan Q1 and Q2 2015 run rates less than 3% of revenue Majority of 13L legacy MaxxForce engines out of standard warranty and extended warranty cycle OnCommand Connection helping to drive preventative measures and increase Uptime Warranty spend will approach warranty expense by 2018 |
 23 Improving Balance Sheet Flexibility Balance sheet goals Balance sheet goals 2014 Further improvement in liquidity Pension & OPEB funding vs. expense Warranty spend vs. expense Lower Used Truck inventory levels Risk reduction Debt maturity schedule Lower leverage over time 2017 MFG Interest CapEx Pension & OPEB Warranty Used Truck Inventory Manufacturing Cash uses decline significantly by 2017 Manufacturing Cash uses decline significantly by 2017 Manufacturing Cash uses decline by $200 million in 2017 |
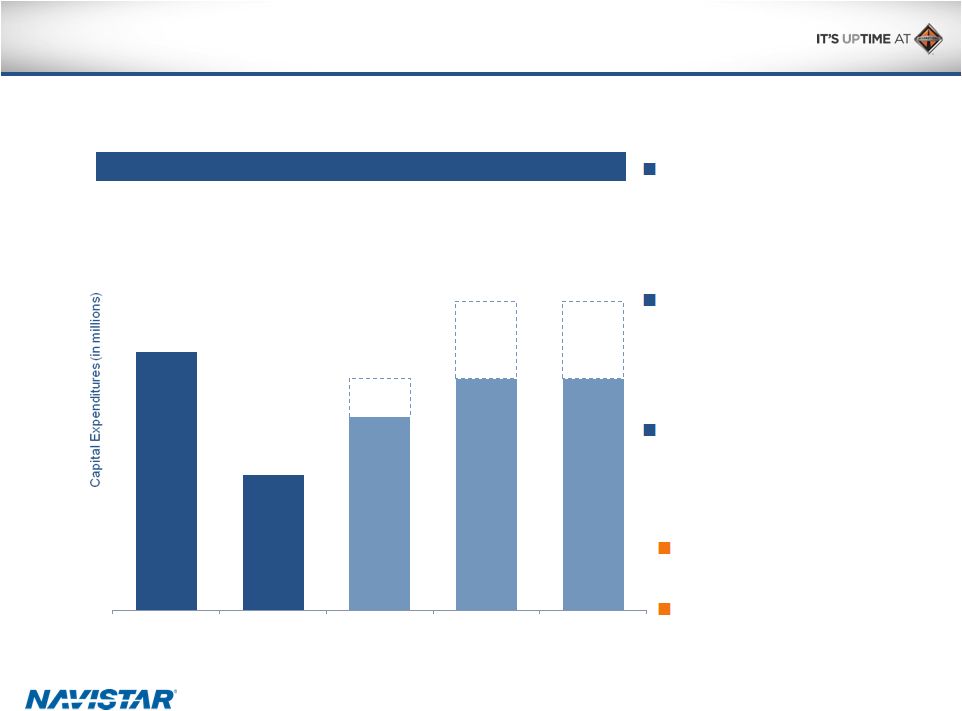 24 Capital Spending Not Expected to Return to Historical Levels as We Continue to Partner We continue to invest in our products to solidify our place as a market leader Leveraging our partnerships reduces the need for capital expenditures We anticipate that capital expenditures will increase, but not return to historical levels Fewer proprietary engine programs More efficient spending $167 $88 $125 - $150 $150 - $200 $150 - $200 2013 2014 2015E 2016E 2017E Capital Expenditures Capital Expenditures |
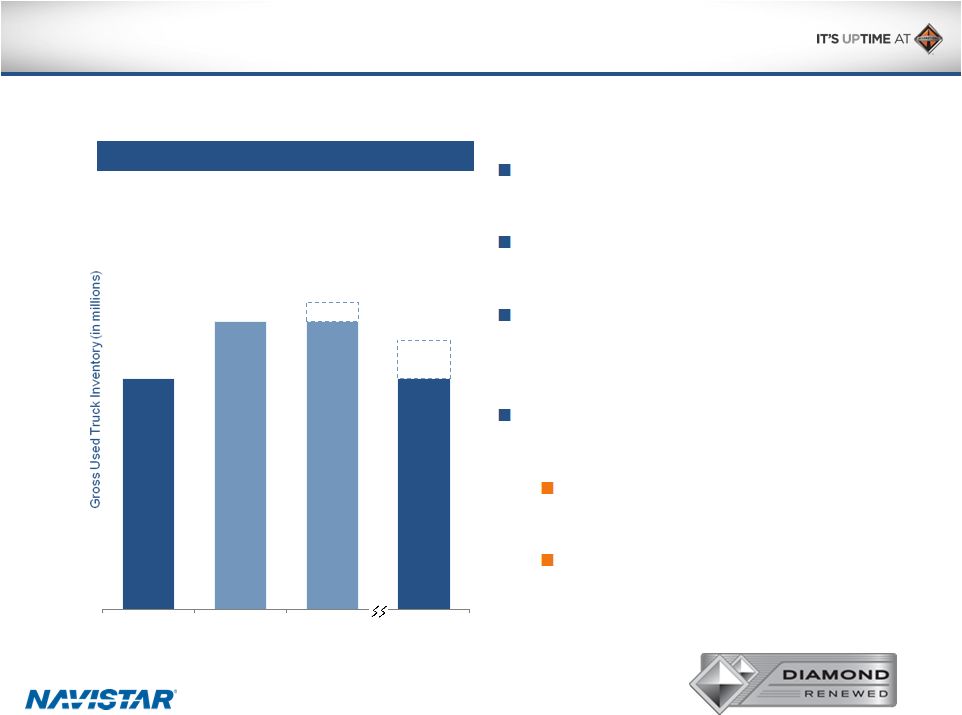 25 Used Truck Inventory Elevated in Near-Term Before Declining Need to take trades to manage new truck sales Balancing Profit, Residuals and Working Capital requirements Used Truck inventory will improve over time as the amount of EGR units moves through trade cycle Robust demand-generation efforts to manage used truck inventory Diamond Renewed certified used truck program Export sales Gross Used Truck Inventory Gross Used Truck Inventory $300 $375 $375-$400 $300-$350 2014 2015 Q2 Peak 2017E |
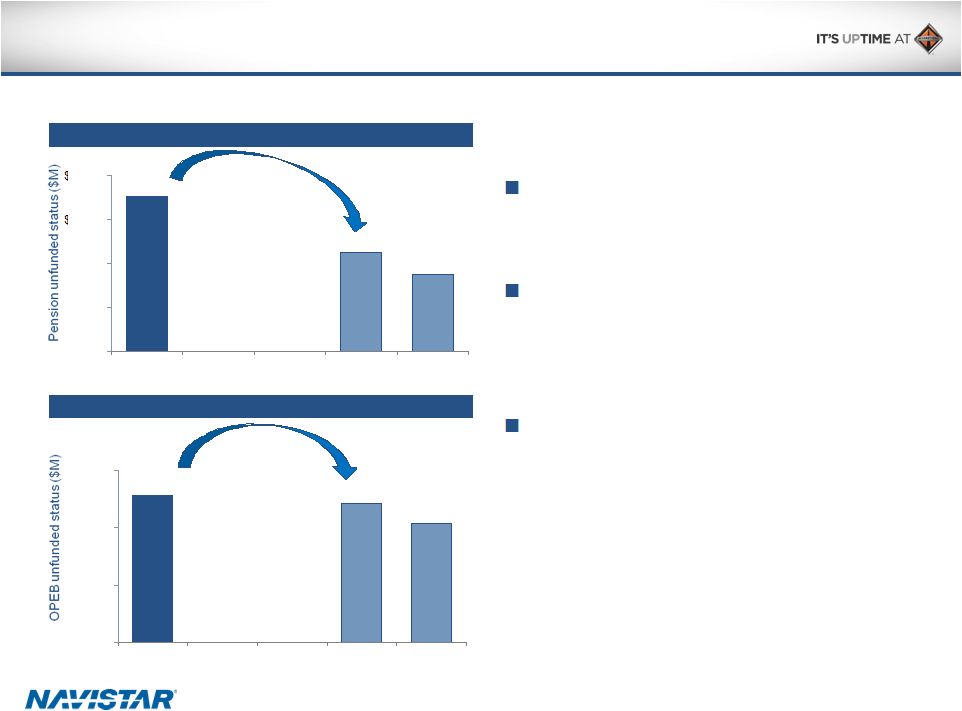 26 Pension and OPEB Unfunded Status Forecast to Improve Materially by 2017 Pension unfunded status Pension unfunded status OPEB unfunded status OPEB unfunded status $1,414 $900 $700 $0 $400 $800 $1,200 $1,600 2014 2017E 2017E (+100 bps) $1,542 $1,450 $1,250 $0 $600 $1,200 $1,800 2014 2017E 2017E (+100 bps) $3 billion unfunded Pension and OPEB at end of FY2014 Anticipate 21% decrease in unfunded status by 2017 under current assumptions (A) Additional upside exists if discount rates increase (A) Excludes any potential impact due to mortality assumptions |
 27 Pro Forma Manufacturing Cash Balance $722 $777 $1,152 $1,100 $1,186 $1,505 $1,523 $1,099 $1,060 $1,098 $1,018 $733 $784 $1,106 2007 2008 2009 2010 2011 2012 2013 Q1 2014 Q2 2014 Q3 2014 Q4 2014 Q1 2015 Q2 2015 Q2 FY15 Pro Forma Note: This slide contains non-GAAP information; please see the REG G in appendix for a detailed reconciliation; cash balance includes marketable
securities; Q2 FY15 Pro Forma manufacturing cash includes accrued
interest and expenses of $20 million Manufacturing Cash
Balance Manufacturing Cash Balance
Refinancing adds significant liquidity to Navistar’s balance sheet
|
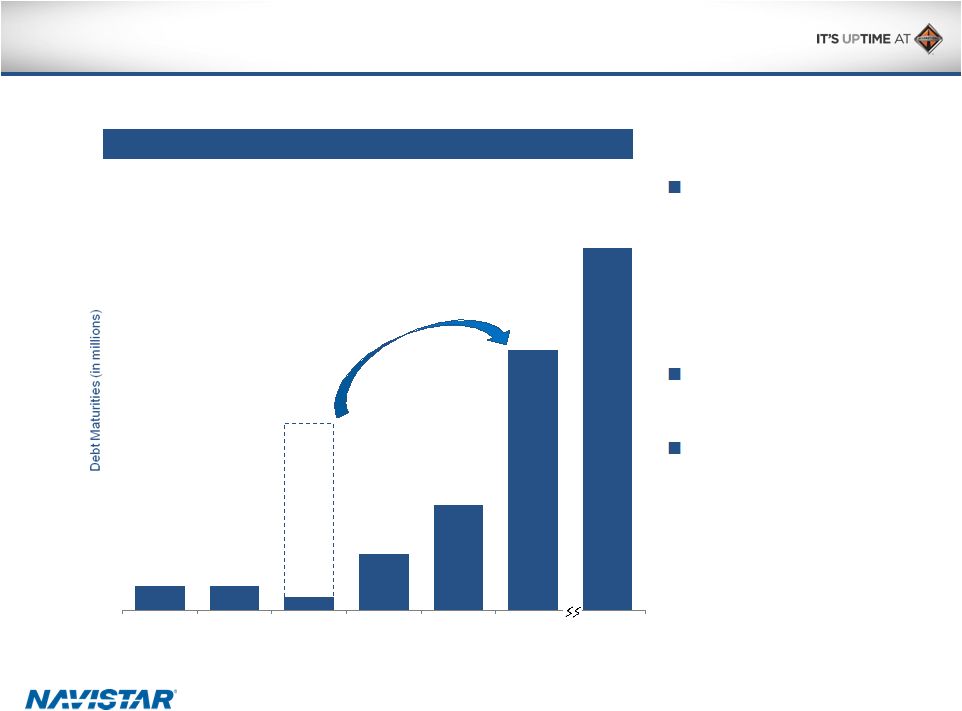 28 No Material Near-Term Debt Maturities Debt maturity profile significantly extended during 2014 and 2015, providing additional financial flexibility Seeking to reduce leverage over time Pro forma, the refinancing shifts ~$700 million of debt maturing in 2017 to 2020 $100 $100 $54 $227 $421 $1,040 $1,444 2015 2016 2017 2018 2019 2020 Thereafter Note: Total manufacturing debt of $2.91B, as of April 30, 2015. $748 Debt Maturities Debt Maturities |
 29 U.S. Environmental Protection Agency (“EPA”) Lawsuit In February 2012, Navistar, Inc. received a Notice of Violation ("NOV") from the EPA.
The NOV pertained to approximately 7,600 diesel engines which, according to the EPA,
were produced by Navistar, Inc. in 2010 and, therefore, should have met
the EPA's 2010 emissions standards. Navistar, Inc. previously provided
information to the EPA evidencing its belief that the engines were in
fact produced in 2009. The NOV contains the EPA's conclusion that
Navistar, Inc.'s alleged production of the engines in 2010 violated the Federal Clean
Air Act. In July 2014, the Department of Justice ("DOJ") informed
Navistar, Inc. that the matter had been referred by the EPA to the
DOJ. Navistar, Inc. and the DOJ had been in discussions concerning this
matter. On July 14, 2015, the DOJ filed a lawsuit against Navistar
International Corporation and Navistar, Inc. (collectively, the
“Company”) alleging that during 2010 the Company introduced
into commerce approximately 7,750 heavy-duty diesel engines that did not meet the
EPA’s emissions standards applicable to 2010 engines, resulting in
violations of the Federal Clean Air Act. The lawsuit requests injunctive
relief and the assessment of civil penalties of up to $37,500 for each
violation. On July 15, 2015, Navistar International Corporation filed a Current Report on Form 8-K disclosing the commencement of the litigation. The Company disputes the allegations in the lawsuit and intends to defend itself. |
 30 Company Highlights Overall industry outlook steady heading into 2016 with favorable mix that will benefit the company After the successful execution of our SCR emission program, Navistar is refreshing the product portfolio to focus on quality, driver experience, fuel economy and the connected vehicle OnCommand Connection is the industry leading connected truck application, having positive impact on many parts of the business Best-in-class integration allows Navistar to partner with global suppliers:
increase speed to market, deliver leading-edge technology and provide
customer choice
Quality, reliability and customer support driving significant improvements
in Uptime
Improved margin profile with 50% lower break-even than 2012 will
continue to improve through relentless cost reduction and production
efforts Balance sheet flexibility to execute on “Uptime” strategy |
 International ® is a registered trademark of , Inc. Appendix |
 32 Q2 2015 Financial Results Generated positive manufacturing cash flow Increased core chargeouts (A) to 18,600 trucks Up 38% from Q1 2015 Up 10% from Q2 2014 Grew adjusted EBITDA Achieving cost reductions Taking actions towards improving capacity utilization Investing in the core business (A) Includes U.S. and Canada School bus and Class 6-8 medium and heavy truck. |
 33 Q2 2015 Income Statement Summary Quarters Ended April 30 $ in millions, except per share and units 2015 2014 Chargeouts (A) 18,600 16,900 Sales and Revenues $2,693 $2,746 Income (Loss) from Continuing Operations, Net of Tax (B) $(64) ($298) Diluted Income (Loss) Per Share from Continuing Operations (B) ($0.78) ($3.66) EBITDA $85 ($119) Note: This slide contains non-GAAP information; please see the REG G in appendix for a detailed reconciliation. (A) Includes U.S. and Canada School bus and Class 6-8 medium and heavy truck. (B) Amounts attributable to Navistar International Corporation. |
 34 Q2 2015 Manufacturing Cash Summary and Guidance Guidance (A) Actual Q1 2015 Manufacturing Cash Balance (B) $733 $733 Consolidated Adjusted EBITDA (C) $100 - $150 $102 Capex/Cash Interest/Pension & OPEB Funding ($120) - ($110) ($114) Change in Net Working Capital/Debt and Warranty/Other ^ ($13) - $27 $63 Q2 2015 Manufacturing Cash Balance** $700-800 $784 Note: This slide contains non-GAAP information; please see the REG G in appendix for a detailed reconciliation.
(A) Guidance as provided on 3/3/2015. (B) Cash balance includes marketable securities. (C) Excluding one-time items and pre-existing warranty. |
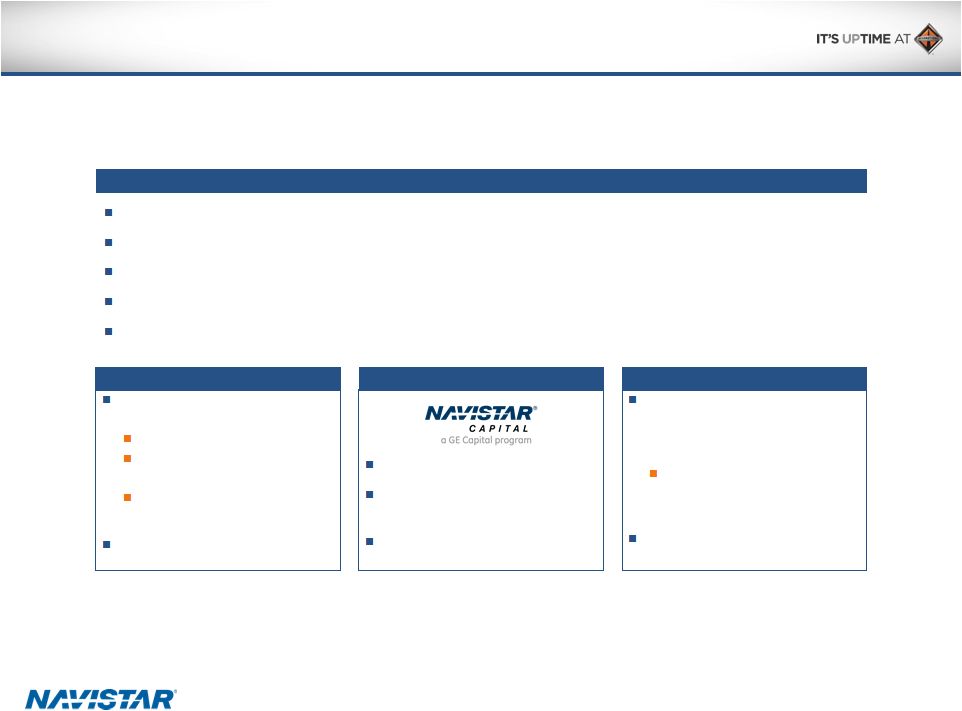 35 Navistar Financial Corporation Highlights Highlights Financial Services Segment profit of $22 million for Q2 2015, $46 million YTD U.S. financing availability of $232 million as of April 30, 2015 Financial Services Debt/Equity Leverage of 3.9:1 Retail accounts funding facility renewed in May 2015 for $100 million GE announced intent to sell assets of GE Capital which include Navistar Capital
Dealer floor plan Retail Notes Bank Facility NFSC wholesale trust as of April 2015 $1 billion funding facility Variable portion matures January 2016 Term portions mature September 2015 and October 2016 On balance sheet Broader product offering Enhanced ability to support large fleets Better access to less expensive capital $764 million facility ($500 million revolver and $264 million term loan matures in December 2016) as of April 30, 2015 Funding for retail notes, wholesale notes, retail accounts and dealer open accounts On balance sheet |
 36 Navistar’s Product Line-Up Class 8 heavy duty on-highway Class 8 heavy duty on-highway 6/7 Med. 6/7 Med. Class 8 severe Class 8 severe Bus and other Bus and other Our vision is to be the truck maker that customers can count on to help them win…by providing industry-leading Uptime, outstanding fuel efficiency and low cost
of ownership Supplier partner Engine model ProStar LoneStar 9900i TranStar PayStar WorkStar DuraStar Bus Global/ Other ISX-15 ISB-6.7 ISL-G Navistar N13 Navistar N10 Navistar N9 Propane 8.8L |
 37 Retail Market Share in Commercial Vehicles Three Months Ended April 30, 2015 January 31, 2015 October 31, 2014 July 31, 2014 April 30, 2014 Core Markets (U.S. and Canada) Class 6 and 7 medium trucks 27% 21% 19% 20% 26% Class 8 heavy trucks 12% 10% 15% 14% 14% Class 8 severe service trucks 15% 14% 14% 15% 17% Combined class 8 trucks 13% 11% 15% 14% 15% Class 6/7 Medium-Duty Class 8 Severe Service Class 8 Heavy |
 38 Worldwide Engine Shipments Three months ended April 30, % Change Six months ended April 30, % Change (in units) 2015 2014 Change 2015 2014 Change OEM sales-South America 11,600 24,500 (12,900) (53)% 27,300 44,900 (17,600) (39)% Intercompany sales 7,000 10,100 3,100) (31)% 13,600 19,600 (6,000) (31)% Other OEM sales 2,600 2,900 (300) (10)% 5,500 5,300 200 4 % Total sales 21,200 37,500 (16,300) (43)% 46,400 69,800 (23,400) (34)% |
 39 SEC Regulation G Non-GAAP Reconciliation SEC Regulation G Non-GAAP Reconciliation The financial measures presented below are unaudited and not in accordance with, or an alternative for, financial measures
presented in accordance with U.S. generally accepted accounting principles
("GAAP"). The non-GAAP financial information presented
herein should be considered supplemental to, and not as a substitute for, or superior to, financial measures calculated in accordance with GAAP and are reconciled to the most appropriate GAAP number below.
Earnings (loss) Before Interest, Income Taxes, Depreciation, and Amortization
(“EBITDA”): We define EBITDA as our consolidated net income
(loss) from continuing operations attributable to Navistar International
Corporation, net of tax, plus manufacturing interest expense, income taxes, and
depreciation and amortization. We believe EBITDA provides meaningful
information to the performance of our business and therefore we use it to supplement our GAAP reporting. We have chosen to provide this supplemental information to investors, analysts and other interested parties to enable
them to perform additional analyses of operating results.
Adjusted EBITDA: We believe that adjusted EBITDA, which excludes certain identified items that we do not consider to be part of our ongoing
business, improves the comparability of year to year results, and is representative of
our underlying performance. Management uses this information to assess
and measure the performance of our operating segments. We have chosen to provide this supplemental information to investors, analysts and other interested parties to enable them to perform additional analyses of
operating results, to illustrate the results of operations giving effect to the
non-GAAP adjustments shown in the below reconciliations, and
to provide an additional measure of performance. Adjusted EBITDA
margin: We define Adjusted EBITDA margin as a percentage of the Company's
consolidated sales and revenues. We have chosen to provide this
supplemental information to investors, analysts and other interested parties to enable them to perform additional analyses of operating results, to illustrate the results of operations giving effect to the non-GAAP adjustments shown in the
below reconciliations, and to provide an additional measure of
performance. Manufacturing Cash, Cash Equivalents, and Marketable
Securities: Manufacturing cash, cash equivalents, and marketable
securities represents the Company’s consolidated cash, cash
equivalents, and marketable securities excluding cash, cash equivalents, and
marketable securities of our financial services operations. We include
marketable securities with our cash and cash equivalents when assessing our liquidity position as our investments are highly liquid in nature. We have chosen to provide this supplemental information to investors, analysts and
other interested parties to enable them to perform additional analyses of our ability
to meet our operating requirements, capital expenditures, equity
investments, and financial obligations. Structural costs consists of Selling, general and administrative expenses and Engineering and product development costs.
|
 40 Earnings (Loss) Before Interest, Taxes, Depreciation, And Amortization ("EBITDA") Reconciliation (A) Manufacturing interest expense is the net interest expense primarily generated for borrowings that support the manufacturing and corporate operations, adjusted to eliminate intercompany interest expense with our Financial Services segment. The following table reconciles Manufacturing interest expense to the consolidated interest expense (in millions) Quarter Ended April 30, 2015 Quarter Ended April 30, 2014 Loss from continuing operations attributable to NIC, net of tax $(64) $(298) Plus: Depreciation and amortization expense 74 99 Manufacturing interest expense (A) 57 57 Less: Income tax benefit (expense) (18) (23) EBITDA $85 $(119) Interest expense 75 74 Less: Financial services interest expense 18 17 Manufacturing interest expense $57 $57 |
 41 Adjusted EBITDA Reconciliation * For more detail on the items noted, please below footnotes (A),(C),(D),(E) (in millions) Quarter Ended April 30, 2015 EBITDA (reconciled above) $85 Less significant items of: Adjustments to pre-existing warranties* 18 Asset impairment charges* 1 Other restructuring charges and strategic initiatives 2 Gain on settlement* (10) Brazil truck business actions* 6 Total adjustments 17 Adjusted EBITDA $102 Adjusted EBITDA margin 3.8% |
 42 Significant Items (A) Adjustments to pre-existing warranties reflect changes in our estimate of warranty costs for products sold in prior periods. Such
adjustments typically occur when claims experience deviates
from historic and expected trends. Our warranty liability is generally affected by component failure rates, repair costs, and the timing of failures. Future events and circumstances related to these factors could materially change our estimates and require adjustments to our liability. In addition, new product launches require a greater
use of judgment in developing estimates until historical experience
becomes available. (B) In the second quarter of 2015, the Truck segment
recognized charges of $12 million for the acceleration of depreciation of certain assets related to the foundry facilities. (C) In the second quarter of 2015, the Company concluded it had a triggering event related to certain operating leases, as a result, the Truck segment recorded $1 million of asset impairment charges (D) In the second quarter of 2015, the Global Operations segment recognized a $10 million gain resulting from a customer settlement, which includes an offsetting restructuring charge of $4 million. (E) In the second quarter of 2015 our Global Operations segment recorded $6 million in inventory charges to right size the Brazil Truck business. The above items did not have a material impact on taxes due to the valuation allowances on our U.S. deferred tax assets, which was established in
the fourth quarter of 2012. (in millions)
Quarter Ended
April 30, Expense (income): 2015 Adjustments to pre-existing warranties (A) $18 Accelerated depreciation (B) 12 Asset impairment charges (C) 1 Other restructuring charges and strategic initiatives 2 Gain on settlement (D) (10) Brazil truck business actions (E) 6 |
 43 Manufacturing Segment Cash and Cash Equivalents and Marketable Securities Reconciliation 2007 2008 2009 2010 2011 2012 2013 Oct. 31, Oct. 31, Oct. 31, Oct. 31, Oct. 31, Oct. 31, Oct. 31, (in millions) Manufacturing Operations: Cash and cash equivalents $716 $775 $1,152 $534 $488 $1,059 $727 Marketable securities 6 2 — 566 698 446 796 Manufacturing Cash and cash equivalents and Marketable securities $722 $777 $1,152 $1,100 $1,186 $1,505 $1,523 Financial Services Operations: Cash and cash equivalents $61 $86 $60 $51 $51 $28 $28 Marketable securities — — — 20 20 20 34 Financial Services Cash and cash equivalents and Marketable securities $61 $86 $60 $71 $71 $48 $62 Consolidated Balance Sheet Cash and cash equivalents $777 $861 $1,212 $585 $539 $1,087 $755 Marketable securities 6 2 — 586 718 466 830 Consolidated Cash and cash equivalents and Marketable securities $783 $863 $1,212 $1,171 $1,257 $1,553 $1,585 |
 44 Manufacturing Segment Cash and Cash Equivalents and Marketable Securities Reconciliation (cont’d) 2014 2015 (in millions) Jan. 31, Apr. 30, Jul. 31, Oct. 31, Jan. 31, Apr. 30, Manufacturing Operations: Cash and cash equivalents $503 $563 $517 $440 $583 $536 Marketable securities 596 497 581 578 150 248 Manufacturing Cash and cash equivalents and Marketable securities $1,099 $1,060 $1,098 $1,018 $733 $784 Financial Services Operations: Cash and cash equivalents $46 $31 $30 $57 $37 $47 Marketable securities 34 37 37 27 25 25 Financial Services Cash and cash equivalents and Marketable securities $80 $68 $67 $84 $62 $72 Consolidated Balance Sheet Cash and cash equivalents $549 $594 $547 $497 $620 $583 Marketable securities 630 534 618 605 175 273 Consolidated Cash and cash equivalents and Marketable securities $1,179 $1,128 $1,165 $1,102 $795 $856 |
Serious News for Serious Traders! Try StreetInsider.com Premium Free!
You May Also Be Interested In
- RROCKET Burns 50% of Its Supply to Fuel Growth and Investor Confidence
- Dimensional Fund Advisors Ltd. : Form 8.3 - BARRATT DEVELOPMENTS PLC - Ordinary Shares
- Man Group PLC : Form 8.3 - Barratt Developments plc
Create E-mail Alert Related Categories
SEC FilingsSign up for StreetInsider Free!
Receive full access to all new and archived articles, unlimited portfolio tracking, e-mail alerts, custom newswires and RSS feeds - and more!
