Form 8-K Manitex International, For: Mar 10
UNITED STATES
SECURITIES AND EXCHANGE COMMISSION
WASHINGTON, D.C. 20549
FORM 8-K
CURRENT REPORT
Pursuant to Section 13 or 15(d)
of the Securities Exchange Act of 1934
Date of report (Date of the earliest event reported) March 10, 2016
MANITEX INTERNATIONAL, INC.
(Exact Name of Registrant as Specified in Its Charter)
| Michigan | 001-32401 | 42-1628978 | ||
| (State or Other Jurisdiction of Incorporation) |
(Commission File Number) |
(IRS Employer Identification No.) | ||
| 9725 Industrial Drive, Bridgeview, Illinois | 60455 | |||
| (Address of Principal Executive Offices) | (Zip Code) | |||
(708) 430-7500
(Registrant’s Telephone Number, Including Area Code)
9725 Industrial Drive, Bridgeview, Illinois
(Former Name or Former Address, if Changed Since Last Report)
Check the appropriate box below if the Form 8-K filing is intended to simultaneously satisfy the filing obligation of the registrant under any of the following provisions:
| ¨ | Written communications pursuant to Rule 425 under the Securities Act (17 CFR 230.425) |
| ¨ | Soliciting material pursuant to Rule 14a-12 under the Exchange Act (17 CFR 240.14a-12) |
| ¨ | Pre-commencement communications pursuant to Rule 14d-2(b) under the Exchange Act (17 CFR 240.14d-2(b)) |
| ¨ | Pre-commencement communications pursuant to Rule 13e-4(c) under the Exchange Act (17 CFR 240.13e-4(c)) |
| Item 2.02 | Results of Operations and Financial Condition. |
On March 10, 2016, Manitex International, Inc. (the “Company”) issued a press release announcing its unaudited financial results for the fourth quarter and the year ended December 31, 2015 (the “Press Release”). The full text of the Press Release is being furnished as Exhibit 99.1 to this Current Report. The Company also posted presentation slides (Exhibit 99.2) that will be referenced during the conference call and webcast which will take place today March 10, 2016 at 4:30 pm eastern time to discuss the fourth quarter and full year 2015 results. Both Exhibits can be accessed from the Investor Relations section of the Company’s website at www.ManitexInternational.com.
The information in this Current Report (including Exhibit 99.1 and 99.2) is being furnished and shall not be deemed “filed” for the purposes of Section 18 of the Securities Exchange Act of 1934, as amended (the “Exchange Act”), or otherwise subject to the liabilities of that Section. The information in this Current Report shall not be incorporated by reference into any registration statement or other document pursuant to the Securities Act of 1933, as amended or the Exchange Act, except as shall be expressly set forth by specific reference in such filing.
The Company references certain non-GAAP financial measures. A reconciliation of these non-GAAP financial measures to the comparable GAAP financial measures is contained in the attached Press Release. Disclosures regarding definitions of these financial measures used by the Company and why the Company’s management believes these financial measures provide useful information to investors is also included in the Press Release.
| Item 9.01 | Financial Statements and Exhibits. |
(a) Financial Statements of Businesses Acquired.
Not applicable.
(b) Pro Forma Financial Information.
Not applicable.
(c) Shell Company Transactions.
Not applicable.
(d) Exhibits.
See the Exhibit Index set forth below for a list of exhibits included with this Current Report on Form 8-K.
SIGNATURE
Pursuant to the requirements of the Securities Exchange Act of 1934, the Company has duly caused this report to be signed on its behalf by the undersigned thereunder duly authorized.
| MANITEX INTERNATIONAL, INC. | ||
| By: | /s/ DAVID GRANSEE | |
| Name: | David Gransee | |
| Title: | VP and CFO | |
Date: March 10, 2016
EXHIBIT INDEX
| Exhibit Number |
Description | |
| 99.1 | Press release dated March 10, 2016 | |
| 99.2 | Webcast presentation slides dated March 10, 2016 | |
Exhibit 99.1
Manitex International, Inc. Reports Fourth Quarter and Full Year 2015 Results
PM and ASV Acquisitions Drive 56.5% Increase in Annual Net Revenues to $387 Million
Cash Generation Provides $45 Million in Net Debt Reduction
Bridgeview, IL, March 10, 2016 — Manitex International, Inc. (Nasdaq: MNTX), a leading international provider of cranes and specialized material and container handling equipment, today announced Fourth Quarter and Full Year 2015 results for continuing operations.
For the full year 2015, the Company reported a loss from continuing operations attributable to Manitex shareholders of ($4.0) million, or ($0.25) per share, on net sales of $386.7 million, compared to income from continuing operations of $8.1 million or $0.59 per share, on sales of $247.2 million for the full year 2014. Most of this loss occurred in the fourth quarter of 2015, in which the loss from continuing operations attributable to Manitex shareholders was ($3.9) million or ($0.24) per share, on net sales of $93.5 million. In the fourth quarter 2014, income from continuing operations attributable to Manitex shareholders was $0.7 million or $0.05 per share, on net sales of $62.3 million.
Chairman and Chief Executive Officer, David Langevin, commented, “As you all are aware, the heavy equipment industry in 2015 has experienced a severe drop off in sales particularly in the energy sector. We have explained previously that the effect of this decline is compounded by the resale, at low prices, of this multi-use equipment, just recently purchased by companies in the energy sector. Facing this reality, we made the conscious decision that our Company’s long term interests would be best served by improving our balance sheet by aggressively reducing debt, even at the expense of current earnings. Thus, during the year, and particularly in the fourth quarter, we took decisive steps to achieve this goal. We sold inventory at margins which, in normal times, would have been unacceptable, we divested one of our historically underperforming and non-strategic subsidiaries, we reduced workforce, and restructured operations and facilities. This resulted in a $45 million reduction in our total debt and the near elimination, at this point in time, of the $14 million term debt taken in January 2015 to acquire PM Group. In so doing, we incurred charges that resulted in a significant loss for the year while other factors such as currency translation, also impacted our results.
Mr. Langevin, continued, “We significantly reduced our debt in the fourth quarter by $20 million which resulted in a debt reduction of $45 million for the full year, which as noted above was our key priority for 2015. The debt pay down in 2015 was enabled by almost $26 million in EBITDA generation, working capital reductions, as well as from the sale of Load King trailers in December which was the first in a series of moves that we identified as part of our strategic plan. This plan calls for the divestiture of certain lower margin, non-crane product lines and other measures to improve our capital allocation and financial profile during 2016 and beyond.”
Full Year 2015 Highlights:
| • | Debt reduction of $44.6 million from year end 2014. |
| • | Net Revenues(1) Grew 56.5% to $387 million from $247 million |
| • | Adjusted EBITDA(1, 2) was $25.8 million, or 6.7% of sales compared to $22.0 million, or 8.9% of sales in 2014. |
| • | Cost reduction plan target of $4.0 million exceeded (achieved $5.0 million) through new sourcing and operating efficiency initiatives. |
| • | Completed acquisition of PM Group in January 2015. |
— more —
| • | Reduced margin on crane sales, restructuring charges, currency translation, and other costs significantly reduced net income and Adjusted EBITDA |
| • | Consolidated backlog was $82.5 million at December 31, 2015, compared to $98.2 million at December 31, 2014 (Subsequent to the year-end, backlog increased to $98.5 million as of January 31, 2016) |
Fourth Quarter Highlights:
| • | Reduced debt by $19.7 million in the quarter. |
| • | Net revenues increased 50.1% year-over-year to $93.5 million compared to $62.3 million. |
| • | Adjusted EBITDA (2) was $3.6 million or 3.8% of sales, compared to $5.7 million or 9.1% of sales in the prior year’s period. |
| • | Completed sale of Load King trailers for $6.5 million cash in December 2015 as a first step of strategic rationalization. |
| (1) | Net Sales and all other income statement items except as noted, exclude results of Load King trailers business unit, which was sold in December 2015, and is recorded as “Discontinued Operations”; all remaining units are aggregated as “Continuing Operations” |
| (2) | Adjusted EBITDA and adjusted net income are non-GAAP (generally accepted accounting principles in the United States of America) financial measures. These measures may be different from non-GAAP financial measures used by other companies. We encourage investors to review the section below entitled “Non-GAAP Financial Measures.” |
In 2015, we incurred the following after-tax expenses that we have used to calculate income from continuing operations as adjusted: PM and ASV acquisition transaction related, net of minority share effect, of $2.1 million (EPS effect $0.13); Inventory restructuring and other related restructuring expenses of $1.9 million (EPS effect $0.12); Foreign exchange and other costs of $0.6 million (EPS effect $0.04). Consequently, income from continuing operations as adjusted for the full year 2015 was $0.6 million or $0.04 per share, compared to $9.8 million or $0.71 per share in 2014.
In the fourth quarter 2015, we incurred the following after-tax expenses that we have used to calculate income from continuing operations as adjusted: Inventory restructuring and related restructuring expense of $1.5 million (EPS effect $0.09); Foreign exchange and other costs of $0.6 million (EPS effect $0.04). Consequently, loss from continuing operations, as adjusted, in the fourth quarter of 2015 was ($1.7) million or ($0.11) per share, compared to fourth quarter 2014 income from continuing operations as adjusted of $2.3 million, or $0.16 per share.
Mr. Langevin, continued, “Incurring losses and challenging operating conditions often result in difficult decisions and actions, but going forward we are a stronger Company that is much better positioned to deal with a depressed marketplace, and take advantage of what, over time, should be a rebounding demand and replacement cycle. Our steps will not only result in reduced interest charges, which could be in the range of 10 to 15 cents per share, depending on working capital levels, but will also provide a lower cost base production capability with greater efficiencies and better profit margins. This combined with the broadened product base provided by our most recent ASV and PM acquisitions, and our reduced exposure to the energy market, now only approximately 5% of total sales, gives us substantial optimism about our Company’s performance in 2016 and beyond.”
Mr. Langevin concluded, “So while 2015 was a challenging year for industrial equipment companies, we have come through periods of contraction before, and we believe that the actions we’ve taken, particularly with respect to our debt reduction and balance sheet strengthening have us positioned to emerge from this cyclical downturn as a company with higher sales, higher margins, and higher returns than ever. While we have been impacted from the collapse in energy pricing and the corresponding reduced demand for industrial equipment to service that sector, our future is not dependent on any recovery in the energy patch, rather it is going to be a function of growing our higher-margin businesses and proliferating our presence in the markets that are currently growing and available to us. Our focus for 2016 will be to continue to reduce our debt, optimize our cost structure and executing on our sales and margin targets for each of our core business units.”
Consolidated Results
| Three Months Ended December 31, |
Twelve Months Ended December 31, |
|||||||||||||||
| 2015 | 2014 | 2015 | 2014 | |||||||||||||
| Net Revenues |
$ | 93,491 | $ | 62,299 | $ | 386,737 | $ | 247,164 | ||||||||
| % Change vs 2014 |
50.1 | % | — | 56.5 | % | — | ||||||||||
| Operating Income as adjusted |
794 | 4,540 | 13,693 | 17,830 | ||||||||||||
| Operating Margin % |
0.8 | % | 7.3 | % | 3.5 | % | 7.2 | % | ||||||||
| Operating (Loss) Income as reported |
(1,070 | ) | 2,184 | 8,421 | 15,474 | |||||||||||
| Operating Margin % |
(1.1 | )% | 3.5 | % | 2.2 | % | 6.3 | % | ||||||||
Net sales for 2015 were $386.7 million, an increase of $139.5 million or 56.5% compared to 2014, and included a negative impact of $28.3 million from currency translation, the result of a stronger US dollar in 2015. Excluding sales of $202.9 million from the acquisition of PM Group, acquired in January 2015, and the full year effect of the ASV acquisition that occurred in December of 2014, sales would have reduced $63.4 million or 25.7%, the effect of reduced demand for crane product arising from the slowdown in energy extraction markets and the redeployment of surplus equipment into the general construction market. By segment, Lifting equipment revenues increased $32.7 million or 14.3%, Equipment Distribution decreased $7.9 million or 37.4% and the ASV segment contributed $116.9 million. The Lifting segment included the benefit of $93.0 million of sales from PM Group but was also adversely impacted by the previously mentioned currency translation impact of $28.3 million.
2015 operating income as adjusted for acquisition transaction and restructuring related costs was $13.7 million or 3.5% of sales compared to $17.8 million or 7.2% of sales in 2014. Adjusted gross profit margins remained relatively steady at 18.5% compared to 19.2% in 2014, with the adverse impacts of lower volume and a product mix of smaller cranes being partially offset by higher margin PM product sales and the benefit of cost reduction activities. Adjusting for the additional operating expenses of acquired businesses, operating expenses were reduced by $3.7 million or 12.7%.
Net sales for the three months ended December 31, 2015 were $93.5 million, an increase of $31.2 million or 50.1% compared to the fourth quarter of 2014, and included a negative impact of $6.9 million from currency translation effect. Excluding sales of $50.8 million from the acquisition of PM Group, acquired in January 2015, and the full year effect of the ASV acquisition that occurred in December of 2014, sales would have reduced $19.6 million or 32.7%. Lifting equipment revenues increased $11.8 million or 21.4%, Equipment Distribution decreased $3.9 million or 57.5% and the ASV segment increased $23.5 million. The Lifting segment included the benefit of $27.3 million of sales from PM Group but was also adversely impacted by the previously mentioned currency translation impact of $6.8 million.
For the three months ended December 31, 2015, operating income as adjusted was $0.8 million or 0.8% of sales, and compared to $4.5 million and 7.3% for the comparable period of 2014. Gross profit increased $4.0 million with contribution from the PM acquisition offsetting reduced gross margin from lower sales in the crane and equipment distribution operations. Adjusted gross profit percent was 17.4% from 19.8 % in the year ago period. Adjusted operating expenses, excluding the expenses relating to the acquired ASV and PM operations were flat year over year.
Lifting Equipment Segment
| Three Months Ended December 31, |
Twelve Months Ended December 31, |
|||||||||||||||
| 2015 | 2014 | 2015 | 2014 | |||||||||||||
| Net Revenues |
$ | 66,824 | $ | 55,053 | $ | 261,232 | $ | 228,518 | ||||||||
| % Change vs 2014 |
21.4 | % | 14.3 | % | ||||||||||||
| Operating Income as adjusted |
2,730 | 5,143 | 14,929 | 23,246 | ||||||||||||
| Operating Margin % |
4.1 | % | 9.3 | % | 5.7 | % | 10.2 | % | ||||||||
| Operating Income as reported |
881 | 5,075 | 11,770 | 23,178 | ||||||||||||
| Operating Margin % |
1.3 | % | 9.2 | % | 4.5 | % | 10.1 | % | ||||||||
Full Year 2015 Comments:
| • | 2015 revenues of $261.2 million were $32.7 million or 14.3% ahead of 2014. The impact of a stronger US dollar compared to 2014 reduced sales by $28.3 million. |
| • | 2015 revenues included sales of $93.0 million from PM group that was acquired in January of 2015, without which sales would have reduced year over year by $60.3 million or 26%, principally the result of the slowdown in straight mast crane sales associated with the energy sector and the redeployment of equipment into the general construction market. Sales of higher capacity cranes used in the energy sector were also adversely impacted by this trend. |
| • | Sales of PM knuckle boom cranes continued to show positive trends in many world regions, with growing acceptance of the product in North America, and stronger demand from the improving West and Eastern Europe and Far Eastern economies. PM sales and distribution offices are located in ten different countries worldwide, with new branches opened in the Middle East and Northern Europe during 2015. |
| • | Operating income as adjusted was $14.9 million or 5.7% of sales, compared to $23.2 million or 10.2% of sales. The reduced level of sales of straight mast cranes and an adverse mix from a higher proportion of lower capacity cranes had an adverse impact on operating income. This was partially offset by sales of knuckle boom cranes and the sale of specialized military material handling equipment under recently awarded five year contracts. |
Fourth Quarter Comments:
| • | Fourth quarter 2015 revenues were $66.8 million compared to $55.1 million in 2014. Sales of straight mast and industrial cranes were down over 35% in the period compared to 2014, from the lower demand in the market, combined with an adverse mix of lower tonnage cranes, but were offset by PM knuckle boom crane sales which was not acquired until 2015. |
| • | Operating income as adjusted for the fourth quarter 2015 was $2.7 million or 4.1% of sales, compared to $5.1 million or 9.3% of sales in the fourth quarter of 2014. The lower operating income was principally from lower gross profit due to significantly reduced straight mast crane volumes partially offset by PM Group acquired in 2015. |
ASV Segment
| Three Months Ended December 31, |
Twelve Months Ended December 31, |
|||||||||||||||
| 2015 | 2014 | 2015 | 2014 | |||||||||||||
| Net Revenues |
$ | 25,773 | $ | 2,264 | $ | 116,935 | $ | 2,264 | ||||||||
| % Change vs 2014 |
1,038.4 | % | 5,065.0 | % | ||||||||||||
| Operating Income as adjusted |
176 | 199 | 6,416 | 199 | ||||||||||||
| Operating Margin % |
0.7 | % | 8.8 | % | 5.5 | % | 8.8 | % | ||||||||
| Operating Income (Loss) as reported |
176 | (121 | ) | 5,496 | (121 | ) | ||||||||||
| Operating Margin % |
0.7 | % | -5.3 | % | 4.7 | % | -5.3 | % | ||||||||
ASV was acquired on December 19, 2014, therefore there is only 12 days of activity in 2014.
Full Year 2015 Highlights:
| • | 2015 revenues of $116.9 million compared to $2.3 million for the 12 day period from acquisition in 2014. |
| • | Sales into US general construction market were steady but characterized by an increasingly competitive pricing environment in the second half of the year. |
| • | Launched ASV brand and product in April 2015. ASV brand comprised 9% of machine sales for 2015 with dealer locations now approximately 100 in North America. (In 2015 ASV controlled 41% of revenue distribution excluding parts sales.) |
| • | Operating income as adjusted for acquisition transaction and restructuring related costs associated with the acquisition, was $6.4 million or 5.5% of sales. Gross profit margins were adversely impacted by competitive pricing. Operating expenses include costs related to implementation of Tier 4 Final engines across the product range that will be completed in 2016. |
Fourth Quarter Highlights:
| • | Fourth quarter 2015 revenues were $25.8 million compared to $2.3 million for the 12 day period from acquisition in 2014. |
| • | Machine sales for the fourth quarter 2015 were the second strongest quarter for the year, but were adversely impacted by a competitive pricing environment. Parts sales were steady in the quarter but OEM undercarriage sales were significantly down from previous quarters. |
| • | ASV branded equipment shipments increased 89% compared to the third quarter of 2015 and represented 20% of shipments in the quarter. |
| • | Operating income as adjusted for the fourth quarter 2015 was $0.2 million or 0.7% of sales, compared to $0.2 million or 8.8% of sales in the fourth quarter of 2014. The lower operating income was principally from lower gross profit due to significantly reduced OEM undercarriage sales and competitive pricing on machine sales. |
Equipment Distribution Segment
| Three Months Ended December 31, |
Twelve Months Ended December 31, |
|||||||||||||||
| 2015 | 2014 | 2015 | 2014 | |||||||||||||
| Net Revenues |
$ | 2,853 | $ | 6,706 | $ | 13,216 | $ | 21,104 | ||||||||
| % Change vs 2014 |
-57.5 | % | -37.4 | % | ||||||||||||
| Operating (Loss) Income as adjusted |
(146 | ) | 236 | (136 | ) | 374 | ||||||||||
| Operating Margin % |
-5.1 | % | 3.5 | % | -1.0 | % | 1.8 | % | ||||||||
| Operating (Loss) Income as reported |
(146 | ) | 236 | (136 | ) | 374 | ||||||||||
| Operating Margin % |
-5.1 | % | 3.5 | % | -1.0 | % | 1.8 | % | ||||||||
Full Year 2015 Highlights:
| • | 2015 revenues of $13.2 million compared to $21.1 million for 2014, a reduction of $7.9 million or 37.4%. |
| • | Lower revenues resulted from a slowdown in equipment sales of $7.7 million or 48% compared to 2014, with the shortfall particularly from rough terrain cranes and used equipment, partially offset by an increase in rental sales. |
| • | 2015 operating loss of $0.1 million compared to operating income of $0.4 million in 2014, principally from lower gross profit from the reduced new and used equipment sales. |
Fourth Quarter Highlights:
| • | Fourth quarter 2015 revenues of $2.9 million compared to $6.7 million in 2014, a reduction of $3.8 million or 57.5%. |
| • | Lower revenues resulted from reduced equipment sales of $3.2 million or 60% compared to 2014, with the shortfall particularly from rough terrain cranes and used equipment. The balance of the sales reduction was from lower parts, service and rental sales. |
| • | Operating loss of $0.1 million for the fourth quarter 2015 compared to operating income of $0.2 for 2014. Reduction of $0.3 million from reduced gross profit from lower sales and a lower proportion of parts service and rental revenues. |
Andrew Rooke, Manitex International President and Chief Operating Officer, commented, “Results for the year and the fourth quarter were significantly impacted by the reduced demand for our higher tonnage crane product that has been created by the energy sector slowdown and the redeployment of existing oil field equipment into other markets, and also by the negative impact of the stronger dollar on currency translation for both revenues and operating income. In fact, currency exchange rates accounted for $28.3 million in lower sales for the year. Our recent acquisitions provided welcome diversification and counter balancing and sales under our military contracts at Liftking ramped up during the fourth quarter and are expected to expand more consistently next year.
PM is securing orders on an international basis and is operating in a market of growing demand where we have not been competing until this year. ASV branded product is increasing its penetration into its new distribution network and will provide broader sales coverage in North America as we move forward and also provide margin support in an aggressive pricing environment. Cost control and debt reduction are our highest priorities as we rebalance after the recent acquisition activities. Our cost reduction initiative achieved $5.0 million in annual cost savings, exceeding our $4.0 million target despite lower volumes, and the actions put into place should deliver the $15 million savings over three year goal we established. We have reduced our debt by $45.0 million since the start of the year as adjusted for the acquisition of PM and remain committed to continue this in 2016.”
Conference Call:
Management will host a conference call at 4:30 PM Eastern Time today to discuss the results with the investment community. Anyone interested in participating in the call should dial 1-888-461-2024 if calling within the United States or 719-325-2376 if calling internationally. A replay will be available until March 17, 2015 which can be accessed by dialing 877-870-5176 if calling within the United States or 1-858-384-5517 if calling internationally. Please use passcode 8694772 to access the replay. The call will additionally be broadcast live and archived for 90 days over the internet with accompanying slides, accessible at the investor relations portion of the Company’s corporate website, www.manitexinternational.com/eventspresentations.aspx.
About Manitex International, Inc.
Manitex International, Inc. is a leading worldwide provider of highly engineered specialized equipment including boom truck, truck and knuckle boom cranes, container handling equipment and reach stackers, rough terrain forklifts, and other related equipment. Our products, which are manufactured in facilities located in the USA, Canada, and Italy, are targeted to selected niche markets where their unique designs and engineering excellence fill the needs of our customers and provide a competitive advantage. We have consistently added to our portfolio of branded products and equipment both through internal development and focused acquisitions to diversify and expand our sales and profit base while remaining committed to our niche market strategy. Our brands include Manitex, PM, O&S, CVS Ferrari, Badger, Liftking, Sabre, and Valla. ASV, our venture with Terex Corporation, manufactures and sells a line of high quality compact track and skid steer loaders.
Forward-Looking Statement
Safe Harbor Statement under the U.S. Private Securities Litigation Reform Act of 1995: This release contains statements that are forward-looking in nature which express the beliefs and expectations of management including statements regarding the Company’s expected results of operations or liquidity; statements concerning projections, predictions, expectations, estimates or forecasts as to our business, financial and operational results and future economic performance; and statements of management’s goals and objectives and other similar expressions concerning matters that are not historical facts. In some cases, you can identify forward-looking statements by terminology such as “anticipate,” “estimate,” “plan,” “project,” “continuing,” “ongoing,” “expect,” “we believe,” “we intend,” “may,” “will,” “should,” “could,” and similar expressions. Such statements are based on current plans, estimates and expectations and involve a number of known and unknown risks, uncertainties and other factors that could cause the Company’s future results, performance or achievements to differ significantly from the results, performance or achievements expressed or implied by such forward-looking statements. These factors and additional information are discussed in the Company’s filings with the Securities and Exchange Commission and statements in this release should be evaluated in light of these important factors. Although we believe that these statements are based upon reasonable assumptions, we cannot guarantee future results. Forward-looking statements speak only as of the date on which they are made, and the Company undertakes no obligation to update publicly or revise any forward-looking statement, whether as a result of new information, future developments or otherwise.
Company Contact
| Manitex International, Inc. | Darrow Associates Inc. | |
| David Langevin | Peter Seltzberg, Managing Director | |
| Chairman and Chief Executive Officer | Investor Relations | |
| (708) 237-2060 | (516) 510-8768 | |
| [email protected] | [email protected] |
Manitex International, Inc.
Consolidated Statements of Income (Loss)
| Three months ended December 31, | Year ended December 31, | |||||||||||||||
| 2015 | 2014 | 2015 | 2014 | |||||||||||||
| Unaudited | Unaudited | Unaudited | Unaudited | |||||||||||||
| Net revenues |
$ | 93,491 | $ | 62,299 | $ | 386,737 | $ | 247,164 | ||||||||
| Cost of sales |
78,292 | 50,016 | 317,231 | 199,715 | ||||||||||||
|
|
|
|
|
|
|
|
|
|||||||||
| Gross profit |
15,199 | 12,283 | 69,506 | 47,449 | ||||||||||||
| Operating expenses |
||||||||||||||||
| Research and development costs |
1,629 | 526 | 5,829 | 2,093 | ||||||||||||
| Selling, general and administrative expenses |
14,640 | 9,573 | 55,256 | 29,882 | ||||||||||||
|
|
|
|
|
|
|
|
|
|||||||||
| Total operating expenses |
16,269 | 10,099 | 61,085 | 31,975 | ||||||||||||
|
|
|
|
|
|
|
|
|
|||||||||
| Operating income |
(1,070 | ) | 2,184 | 8,421 | 15,474 | |||||||||||
| Other income (expense) |
||||||||||||||||
| Interest expense |
(3,589 | ) | (869 | ) | (12,984 | ) | (2,777 | ) | ||||||||
| Foreign currency transaction gain (loss) |
(554 | ) | (80 | ) | 30 | (107 | ) | |||||||||
| Other income (loss) |
89 | 31 | 23 | (36 | ) | |||||||||||
|
|
|
|
|
|
|
|
|
|||||||||
| Total other expense |
(4,054 | ) | (918 | ) | (12,931 | ) | (2,920 | ) | ||||||||
|
|
|
|
|
|
|
|
|
|||||||||
| (Loss) income before income taxes and loss in non-marketable equity interest from continuing operations |
(5,124 | ) | 1,266 | (4,510 | ) | 12,554 | ||||||||||
| Income tax (benefit) expense from continuing operations |
(901 | ) | 720 | (725 | ) | 4,452 | ||||||||||
| Loss in non-marketable equity interest, net of taxes |
(80 | ) | — | (199 | ) | — | ||||||||||
|
|
|
|
|
|
|
|
|
|||||||||
| Net (loss) income from continuing operations |
(4,303 | ) | 546 | (3,984 | ) | 8,102 | ||||||||||
| Discontinued operations: (Note 25) |
||||||||||||||||
| Loss from operations of discontinued operations (including loss on disposal of $2,142 in 2015) |
(2,443 | ) | (537 | ) | (2,083 | ) | (1,911 | ) | ||||||||
| Income tax benefit |
(804 | ) | (327 | ) | (743 | ) | (776 | ) | ||||||||
|
|
|
|
|
|
|
|
|
|||||||||
| Loss on discontinued operations |
(1,639 | ) | (210 | ) | (1,340 | ) | (1,135 | ) | ||||||||
| Net (loss) income |
(5,942 | ) | 336 | (5,324 | ) | 6,967 | ||||||||||
| Net (income) loss attributable to noncontrolling interest |
447 | 136 | (48 | ) | 136 | |||||||||||
|
|
|
|
|
|
|
|
|
|||||||||
| Net (loss) income attributable to shareholders of Manitex International, Inc. |
$ | (5,495 | ) | $ | 472 | $ | (5,372 | ) | $ | 7,103 | ||||||
|
|
|
|
|
|
|
|
|
|||||||||
| Earnings Per Share |
||||||||||||||||
| Basic |
||||||||||||||||
| (Loss) earnings from continuing operations attributable to shareholders’ of Manitex International, Inc. |
$ | (0.24 | ) | $ | 0.05 | $ | (0.25 | ) | $ | 0.59 | ||||||
| Loss from discontinued operations attributable to shareholders’s of Manitex International, Inc. |
$ | (0.10 | ) | $ | (0.02 | ) | $ | (0.08 | ) | $ | (0.08 | ) | ||||
| (Loss) earnings attributable to shareholders’ of Manitex International, Inc. |
$ | (0.34 | ) | $ | 0.03 | $ | (0.34 | ) | $ | 0.51 | ||||||
| Diluted |
||||||||||||||||
| (Loss) earnings from continuing operations attributable to shareholders’ of Manitex International, Inc. |
$ | (0.24 | ) | $ | 0.05 | $ | (0.25 | ) | $ | 0.59 | ||||||
| Loss from discontinued operations attributable to shareholders’s of Manitex International, Inc. |
$ | (0.10 | ) | $ | (0.01 | ) | $ | (0.08 | ) | $ | (0.08 | ) | ||||
| (Loss) earnings attributable to shareholders’ of Manitex International, Inc. |
$ | (0.34 | ) | $ | 0.03 | $ | (0.34 | ) | $ | 0.51 | ||||||
| Weighted average common shares outstanding |
||||||||||||||||
| Basic |
16,015,219 | 13,980,142 | 15,970,074 | 13,858,189 | ||||||||||||
| Diluted |
16,015,219 | 14,029,205 | 15,970,074 | 13,904,289 | ||||||||||||
MANITEX INTERNATIONAL, INC.
CONSOLIDATED BALANCE SHEETS
(In thousands, except share and per share data)
| As of December 31, | ||||||||
| 2015 | 2014 | |||||||
| Unaudited | Unaudited | |||||||
| ASSETS | ||||||||
| Current assets |
||||||||
| Cash |
$ | 8,578 | $ | 4,368 | ||||
| Trade receivables (net) |
63,388 | 58,433 | ||||||
| Accounts receivable from related party |
388 | 8,609 | ||||||
| Other receivables |
3,254 | 480 | ||||||
| Inventory (net) |
119,269 | 90,745 | ||||||
| Deferred tax asset |
2,951 | 1,325 | ||||||
| Prepaid expense and other |
4,872 | 1,691 | ||||||
| Current assets of discontinued operations |
— | 8,206 | ||||||
|
|
|
|
|
|||||
| Total current assets |
202,700 | 173,857 | ||||||
|
|
|
|
|
|||||
| Total fixed assets (net) |
41,985 | 25,788 | ||||||
| Intangible assets (net) |
70,629 | 51,251 | ||||||
| Goodwill |
80,089 | 52,666 | ||||||
| Other long-term assets |
5,503 | 4,166 | ||||||
| Non-marketable equity investment |
5,752 | 5,951 | ||||||
| Long-term assets of discontinued operations |
— | 3,477 | ||||||
|
|
|
|
|
|||||
| Total assets |
$ | 406,658 | $ | 317,156 | ||||
|
|
|
|
|
|||||
| LIABILITIES AND EQUITY | ||||||||
| Current liabilities |
||||||||
| Notes payable—short term |
$ | 30,323 | $ | 11,880 | ||||
| Revolving credit facilities |
1,795 | 2,798 | ||||||
| Current portion of capital lease obligations |
1,004 | 1,631 | ||||||
| Accounts payable |
62,137 | 34,113 | ||||||
| Accounts payable related parties |
1,611 | 503 | ||||||
| Income tax payable on conversion of ASV |
— | 16,231 | ||||||
| Accrued expenses |
21,053 | 15,973 | ||||||
| Other current liabilities |
2,113 | 2,407 | ||||||
| Current liabilities of discontinued operations |
— | 2,425 | ||||||
|
|
|
|
|
|||||
| Total current liabilities |
120,036 | 87,961 | ||||||
|
|
|
|
|
|||||
| Long-term liabilities |
||||||||
| Revolving term credit facilities |
46,097 | 46,457 | ||||||
| Notes payable |
69,676 | 38,423 | ||||||
| Capital lease obligations |
5,850 | 2,710 | ||||||
| Convertible note-related party (net) |
6,737 | 6,611 | ||||||
| Convertible note (net) |
14,386 | — | ||||||
| Deferred gain on sale of building |
1,288 | 1,268 | ||||||
| Deferred tax liability |
4,525 | 2,082 | ||||||
| Other long-term liabilities |
7,763 | 1,973 | ||||||
| Long-term liabilities of discontinued operations |
— | 1,665 | ||||||
|
|
|
|
|
|||||
| Total long-term liabilities |
156,322 | 101,189 | ||||||
|
|
|
|
|
|||||
| Total liabilities |
276,358 | 189,150 | ||||||
|
|
|
|
|
|||||
| Commitments and contingencies |
||||||||
| Equity |
||||||||
| Preferred Stock—Authorized 150,000 shares, no shares issued or outstanding at December 31, 2015 and December 31, 2014 |
— | — | ||||||
| Common Stock—no par value 25,000,000 shares authorized, 16,072,100 and 14,989,694 shares issued and outstanding at December 31, 2015 and December 31, 2014, respectively |
93,186 | 82,040 | ||||||
| Paid in capital |
2,630 | 1,789 | ||||||
| Retained earnings |
16,588 | 21,960 | ||||||
| Accumulated other comprehensive loss |
(5,392 | ) | (1,023 | ) | ||||
|
|
|
|
|
|||||
| Equity attributable to shareholders of Manitex International, Inc. |
107,012 | 104,766 | ||||||
| Equity attributable to noncontrolling interest |
23,288 | 23,240 | ||||||
|
|
|
|
|
|||||
| Total equity |
130,300 | 128,006 | ||||||
|
|
|
|
|
|||||
| Total liabilities and equity |
$ | 406,658 | $ | 317,156 | ||||
|
|
|
|
|
|||||
Manitex International, Inc.
Consolidated Statement of Cash Flows
| 2015 | 2014 | |||||||
| Unaudited | Unaudited | |||||||
| Cash flows from operating activities: |
||||||||
| Net (loss) income |
$ | (5,324 | ) | $ | 6,967 | |||
| Adjustments to reconcile net income to cash used for operating activities: |
||||||||
| Depreciation and amortization |
12,082 | 4,188 | ||||||
| Changes in allowances for doubtful accounts |
(167 | ) | 165 | |||||
| Acquisition expenses financed by seller |
— | 183 | ||||||
| (Gain) loss on disposal of assets |
(119 | ) | 3 | |||||
| Changes in inventory reserves |
1,069 | 156 | ||||||
| Deferred income taxes |
(2,074 | ) | (254 | ) | ||||
| Amortization of deferred financing cost |
1,204 | 259 | ||||||
| Amortization of debt discount |
743 | — | ||||||
| Change in value of interest rate swaps |
(706 | ) | — | |||||
| Loss in non-marketable equity interest |
199 | — | ||||||
| Share-based compensation |
1,481 | 1,104 | ||||||
| Deferred gain on sale and lease back |
301 | — | ||||||
| Reserves for uncertain tax provisions |
60 | (35 | ) | |||||
| Loss on sale of discontinued operations |
1,378 | — | ||||||
| Changes in operating assets and liabilities: |
||||||||
| (Increase) decrease in accounts receivable |
23,475 | (13,889 | ) | |||||
| (Increase) decrease in accounts receivable finance |
— | 315 | ||||||
| (Increase) decrease in inventory |
(10,286 | ) | (7,010 | ) | ||||
| (Increase) decrease in prepaid expenses |
(3,258 | ) | (16 | ) | ||||
| (Increase) decrease in other assets |
111 | (123 | ) | |||||
| Increase (decrease) in accounts payable |
6,717 | 2,676 | ||||||
| Increase (decrease) in accrued expense |
(2,458 | ) | 565 | |||||
| Increase (decrease) in income tax payable on ASV conversion |
(16,231 | ) | — | |||||
| Increase (decrease) in other current liabilities |
(1,472 | ) | 641 | |||||
| Increase (decrease) in other long-term liabilities |
2,524 | (30 | ) | |||||
| Discontinued operations - cash provided by (used) for operating activities |
(214 | ) | 2,632 | |||||
|
|
|
|
|
|||||
| Net cash provided by used for operating activities |
9,035 | (1,503 | ) | |||||
|
|
|
|
|
|||||
| Cash flows from investing activities: |
||||||||
| Acquisition of businesses, net of cash acquired |
(13,747 | ) | (24,998 | ) | ||||
| Proceeds from the sale of fixed assets |
518 | — | ||||||
| Purchase of property and equipment |
(2,369 | ) | (784 | ) | ||||
| Investment in intangibles other than goodwill |
(233 | ) | — | |||||
| Proceeds from the sale of discontinued operations |
6,525 | — | ||||||
| Discontinued operations - cash used for investing activities |
(96 | ) | (140 | ) | ||||
|
|
|
|
|
|||||
| Net cash used for investing activities |
(9,402 | ) | (25,922 | ) | ||||
|
|
|
|
|
|||||
| Cash flows from financing activities: |
||||||||
| New borrowings—term loan |
14,000 | — | ||||||
| Repayment of term loan |
(11,800 | ) | — | |||||
| Net proceeds from stock offering |
— | 12,500 | ||||||
| New borrowings—convertible notes |
15,000 | 7,500 | ||||||
| Borrowing on revolving term credit facilities |
443 | 5,563 | ||||||
| Net borrowings (repayments) on working capital facilities |
(7,731 | ) | 2,532 | |||||
| New borrowings—other |
7,289 | 677 | ||||||
| Bank fees and cost related to new financing |
(1,274 | ) | (519 | ) | ||||
| Note payments |
(8,466 | ) | (947 | ) | ||||
| Shares repurchased for income tax withholding on share-based compensation |
(75 | ) | (114 | ) | ||||
| Excess tax benefits related to vesting of restricted stock |
— | 22 | ||||||
| Proceeds from capital leases |
— | 942 | ||||||
| Payments on capital lease obligations |
(1,446 | ) | (1,397 | ) | ||||
| Discontinued operations - cash used for financing activities |
— | (113 | ) | |||||
|
|
|
|
|
|||||
| Net cash provided by financing activities |
5,940 | 26,646 | ||||||
|
|
|
|
|
|||||
| Net increase (decrease) in cash and cash equivalents |
5,573 | (779 | ) | |||||
| Effect of exchange rate changes on cash |
(1,363 | ) | (944 | ) | ||||
| Cash and cash equivalents at the beginning of the year |
4,368 | 6,091 | ||||||
|
|
|
|
|
|||||
| Cash and cash equivalents at end of period |
$ | 8,578 | $ | 4,368 | ||||
|
|
|
|
|
|||||
Supplemental Information
In an effort to provide investors with additional information regarding the Company’s results, Manitex International refers to various non-GAAP (U.S. generally accepted accounting principles) financial measures which management believes provides useful information to investors. These non-GAAP measures may not be comparable to similarly titled measures being disclosed by other companies. In addition, the Company believes that non-GAAP financial measures should be considered in addition to, and not in lieu of, GAAP financial measures. Manitex International believes that this information is useful to understanding its operating results and the ongoing performance of its underlying businesses. Management of Manitex International uses both GAAP and non–GAAP financial measures to establish internal budgets and targets and to evaluate the Company’s financial performance against such budgets and targets. The amounts described below are unaudited, are reported in thousands of U.S. dollars, and are as of, or for the three and twelve month periods ended December 31, 2015, unless otherwise indicated.
Non-GAAP Financial Measures
This press release includes the following non-GAAP financial measures: “Adjusted EBITDA” (GAAP Operating Income adjusted for acquisition transaction related expense, restructuring and related expense, and Foreign exchange and other, and depreciation and amortization) and Adjusted Net Income (net income attributable to Manitex shareholders adjusted for acquisition transaction related and restructuring and related expense, net of tax, and change in net income attributable to noncontrolling interest). These non-GAAP terms, as defined by the Company, may not be comparable to similarly titled measures used by other companies. Neither Adjusted Net Income nor Adjusted EBITDA are a measure of financial performance under generally accepted accounting principles. Items excluded from Adjusted EBITDA and Adjusted Net Income are significant components in understanding and assessing financial performance. Adjusted EBITDA and Adjusted Net Income should not be considered in isolation or as a substitute for net earnings, operating income and other consolidated earnings data prepared in accordance with GAAP or as a measure of our profitability. A reconciliation of Operating Income to Adjusted EBITDA and Adjusted Net Income is provided below.
The Company’s management believes that Adjusted EBITDA and Adjusted EBITDA as a percentage of sales and Adjusted Net Income represent key operating metrics for its business. GAAP Operating Income adjusted for acquisition transaction related expense, restructuring and related expense, Foreign exchange and other, and depreciation and amortization (Adjusted EBITDA), and Adjusted Net Income, GAAP net income adjusted for acquisition transaction and restructuring related expense are a key indicator used by management to evaluate operating performance. While Adjusted EBITDA and Adjusted Net Income are not intended to replace any presentation included in our consolidated financial statements under generally accepted accounting principles (GAAP) and should not be considered an alternative to operating performance or an alternative to cash flow as a measure of liquidity, we believe these measures are useful to investors in assessing our operating results, capital expenditure and working capital requirements and the ongoing performance of its underlying businesses. These calculations may differ in method of calculation from similarly titled measures used by other companies. A reconciliation of Adjusted EBITDA and Adjusted Net Income to GAAP financial measures for the three and twelve month periods ended December 31, 2015 and 2014 is included with this press release below and with the Company’s related Form 8-K.
Reconciliation of GAAP Operating Income to Adjusted EBITDA (in thousands)
| Three Months Ended | Twelve Months Ended | |||||||||||||||
| December 31, 2015 |
December 31, 2014 |
December 31, 2015 |
December 31, 2014 |
|||||||||||||
| Operating (loss) income |
($ | 1,070 | ) | $ | 2,184 | $ | 8,421 | $ | 15,474 | |||||||
| Acquisition transaction related, restructuring and related expense and foreign exchange and other adjustments |
1,864 | 2,356 | 5,272 | 2,356 | ||||||||||||
| Depreciation & Amortization |
2,777 | 1,140 | 12,082 | 4,188 | ||||||||||||
| Adjusted Earnings before interest, taxes, depreciation and amortization (Adjusted EBITDA) |
$ | 3,571 | $ | 5,680 | $ | 25,775 | $ | 22,018 | ||||||||
| Adjusted EBITDA % to sales |
3.8 | % | 9.1 | % | 6.7 | % | 8.9 | % | ||||||||
Reconciliation of GAAP Net (Loss) Income to Adjusted Net Income (in thousands)
| Three Months Ended | Twelve Months Ended | |||||||||||||||
| December 31, 2015 |
December 31, 2014 |
December 31, 2015 |
December 31, 2014 |
|||||||||||||
| Net (loss) income from continuing operations |
($ | 4,303 | ) | $ | 546 | ($ | 3,984 | ) | $ | 8,102 | ||||||
| Net (income) loss attributable to noncontrolling interest |
447 | 136 | (48 | ) | 136 | |||||||||||
| Net income (loss) from continuing operations attributable to Manitex shareholders |
($ | 3,856 | ) | $ | 682 | ($ | 4,032 | ) | $ | 8,238 | ||||||
| Pre – tax acquisition transaction related, restructuring and related and Foreign Exchange and other expense adjustments |
2,532 | 2,517 | 5,940 | 2,517 | ||||||||||||
| Tax effect based on effective tax rate |
390 | (773 | ) | (845 | ) | (773 | ) | |||||||||
| Change in net income attributable to noncontrolling interest |
— | (157 | ) | (451 | ) | (157 | ) | |||||||||
| Adjusted Net Income from continuing operations attributable to Manitex shareholders |
($ | 1,714 | ) | $ | 2,269 | $ | 612 | $ | 9,825 | |||||||
| Weighted average diluted shares outstanding |
16,015,219 | 14,029,205 | 15,970,074 | 13,904,289 | ||||||||||||
| Diluted earnings (loss) per share from continuing operations as reported |
($ | 0.24 | ) | $ | 0.05 | ($ | 0.25 | ) | $ | 0.59 | ||||||
| Total EPS Effect |
$ | 0.13 | $ | 0.11 | $ | 0.29 | $ | 0.11 | ||||||||
| Adjusted Diluted earnings per share from continuing operations as adjusted |
($ | 0.11 | ) | $ | 0.16 | $ | 0.04 | $ | 0.71 | |||||||
Acquisition transaction and restructuring related expense
After tax expense and per share amounts (Adjusted Net Income) are calculated using pre-tax amounts, applying a tax rate based on the effective tax rate to arrive at an after-tax amount. This number is divided by the weighted average diluted shares to provide the impact on earnings per share. The company assesses the impact of these items because when discussing earnings per share, the Company adjusts for items it believes are not reflective of operating activities in the periods.
| Three and Twelve Months Ended December 31, 2014 |
Pre-tax | After-tax | EPS | |||||||||
| Acquisition transaction related |
$ | 2,176 | $ | 1,508 | $ | 0.11 | ||||||
| Restructuring and related expense |
— | — | — | |||||||||
| Foreign exchange and other |
$ | 341 | $ | 236 | $ | 0.01 | ||||||
| Change in noncontrolling interest |
($ | 157 | ) | ($ | 157 | ) | ||||||
| Total |
$ | 2,360 | $ | 1,587 | $ | 0.11 | ||||||
| Three Months Ended December 31, 2015 |
Pre-tax | After-tax | EPS | |||||||||
| Acquisition transaction related |
$ | 15 | $ | 12 | — | |||||||
| Restructuring and related expense |
$ | 1,757 | $ | 1,487 | $ | 0.09 | ||||||
| Foreign exchange and other |
$ | 760 | $ | 643 | $ | 0.04 | ||||||
| Total |
$ | 2,532 | $ | 2,142 | $ | 0.13 | ||||||
| Twelve Months Ended December 31, 2015 |
Pre-tax | After-tax | EPS | |||||||||
| Acquisition transaction related |
$ | 2,986 | $ | 2,526 | $ | 0.16 | ||||||
| Restructuring and related expense |
$ | 2,194 | $ | 1,856 | $ | 0.12 | ||||||
| Foreign exchange and other |
$ | 760 | $ | 643 | $ | 0.04 | ||||||
| Change in noncontrolling interest |
$ | (451 | ) | $ | (451 | ) | $ | (0.03 | ) | |||
| Total |
$ | 5,489 | $ | 4,644 | $ | 0.29 | ||||||
Backlog
Backlog is defined as purchase orders that have been received by the Company. The disclosure of backlog aids in the analysis the Company’s customers’ demand for product, as well as the ability of the Company to meet that demand. Backlog is not necessarily indicative of sales to be recognized in a specified future period.
| December 31, 2015 |
December 31, 2014 |
September 30, 2015 |
||||||||||
| Backlog |
$ | 82,522 | $ | 98,158 | $ | 85,628 | ||||||
| 12/31/2015 Decrease v prior periods |
(15.9 | %) | (3.6 | %) | ||||||||
Current Ratio is calculated by dividing current assets by current liabilities.
| December 31, 2015 | December 31, 2014 | |||||||
| Current Assets |
$ | 202,700 | $ | 173,857 | ||||
| Current Liabilities |
120,036 | $ | 87,961 | |||||
| Current Ratio |
1.7 | 2.0 | ||||||
Days Sales Outstanding, (DSO), is calculated by taking the sum of net trade and related party receivables divided by annualized sales per day (sales for the quarter, multiplied by 4, and the sum divided by 365).
Days Payables Outstanding, (DPO), is calculated by taking the sum of net trade and related party payables divided by annualized cost of sales per day (cost of goods sold for the quarter, multiplied by 4, and the sum divided by 365).
Debt is calculated using the Condensed Consolidated Balance Sheet amounts for current and long term portion of long term debt, capital lease obligations, notes payable, convertible notes and revolving credit facilities. Debt to Adjusted EBITDA ratio is calculated by dividing total debt at the balance sheet date by trailing twelve month Adjusted EBITDA.
| December 31, 2015 | December 31, 2014 | |||||||
| Current portion of long term debt |
30,323 | 11,880 | ||||||
| Current portion of capital lease obligations |
1,004 | 1,631 | ||||||
| Revolving credit facilities |
1,795 | 2,798 | ||||||
| Revolving term credit facilities |
46,097 | 46,457 | ||||||
| Notes payable – long term |
68,676 | 38,423 | ||||||
| Capital lease obligations |
5,850 | 2,710 | ||||||
| Convertible Notes |
21,123 | 6,611 | ||||||
| Debt |
$ | 175,868 | $ | 110,510 | ||||
|
|
|
|
|
|||||
| Adjusted EBITDA |
$ | 25,775 | $ | 22,018 | ||||
| Debt to Adjusted EBITDA Ratio |
6.8 | 5.0 | ||||||
Interest Cover is calculated by dividing Adjusted EBITDA (GAAP Operating Income adjusted for acquisition transaction expense and restructuring related expense and other exceptional costs and depreciation and amortization) for the trailing twelve month period by interest expense as reported in the Consolidated Statement of Income for the same period.
| 12 Month Period January 1, 2015 to December 31, 2015 |
12 Month Period January 1, 2014 to December 31, 2014 |
|||||||
| Adjusted EBITDA |
$ | 25,775 | $ | 22,018 | ||||
| Interest Expense |
12,984 | 2,777 | ||||||
| Interest Cover Ratio |
2.0 | 7.9 | ||||||
Inventory turns are calculated by multiplying cost of goods sold for the referenced three month period by 4 and dividing that figure by inventory as at the referenced period.
Operating Working Capital is calculated using the Consolidated Balance Sheet amounts for Trade receivables (net of allowance) plus inventories, less Accounts payable. The Company considers excessive working capital as an inefficient use of resources, and seeks to minimize the level of investment without adversely impacting the ongoing operations of the business.
| December 31, 2015 |
December 31, 2014 |
|||||||
| Trade receivables (net) |
$ | 63,388 | $ | 58,433 | ||||
| Inventory (net) |
119,269 | 90,745 | ||||||
| Less: Accounts payable |
62,137 | 34,113 | ||||||
| Total Operating Working Capital |
$ | 120,520 | $ | 115,065 | ||||
| % of Trailing Three Month Annualized Net Sales |
32.2 | % | 46.2 | % | ||||
Trailing Three Month Annualized Net Sales is calculated using the net sales for quarter, multiplied by four.
| Three Months Ended | ||||||||||||
| December 31, 2015 |
December 31, 2014 |
September 30, 2015 |
||||||||||
| Net sales |
$ | 93,491 | $ | 62,299 | $ | 91,691 | ||||||
| Multiplied by 4 |
4 | 4 | 4 | |||||||||
| Trailing Three Month Annualized Net Sales |
$ | 373,964 | $ | 249,196 | $ | 366,764 | ||||||
Working capital is calculated as total current assets less total current liabilities
| December 31, 2015 | December 31, 2014 | |||||||
| Total Current Assets |
$ | 202,700 | $ | 173,857 | ||||
| Less: Total Current Liabilities |
120,036 | 87,961 | ||||||
| Working Capital |
$ | 82,664 | $ | 85,896 | ||||
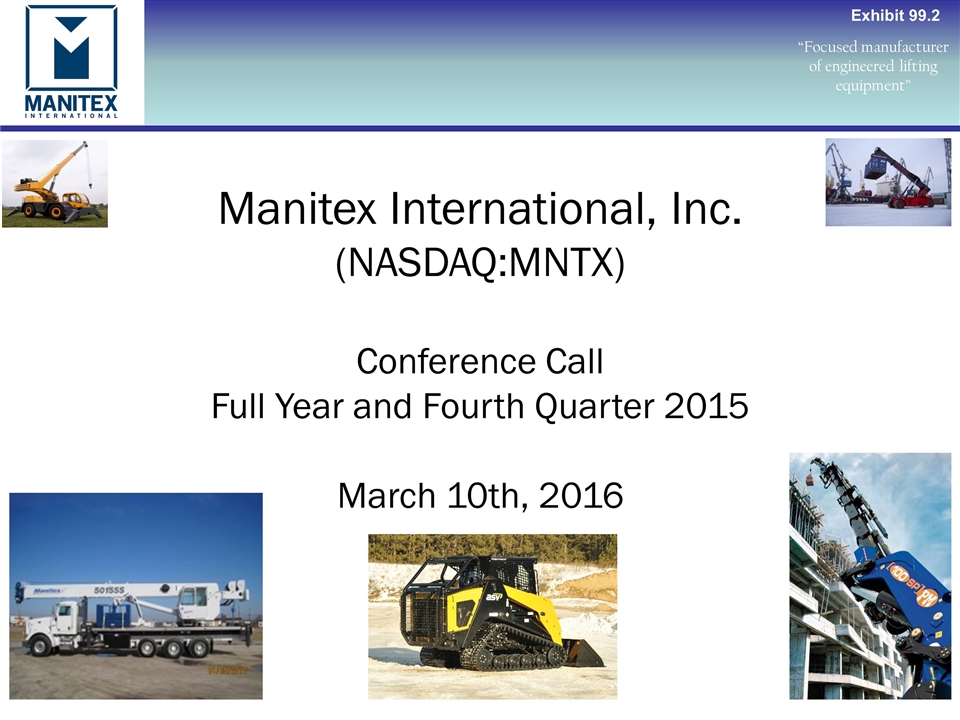
“Focused manufacturer of engineered lifting equipment” Manitex International, Inc. (NASDAQ: MNTX) Conference Call Full Year and Fourth Quarter 2015 March 10th, 2016 Exhibit 99.2
Forward Looking Statements & Non GAAP Measures “Focused manufacturer of engineered lifting equipment” Safe Harbor Statement under the U.S. Private Securities Litigation Reform Act of 1995: This presentation contains statements that are forward-looking in nature which express the beliefs and expectations of management including statements regarding the Company’s expected results of operations or liquidity; statements concerning projections, predictions, expectations, estimates or forecasts as to our business, financial and operational results and future economic performance; and statements of management’s goals and objectives and other similar expressions concerning matters that are not historical facts. In some cases, you can identify forward-looking statements by terminology such as “anticipate,” “estimate,” “plan,” “project,” “continuing,” “ongoing,” “expect,” “we believe,” “we intend,” “may,” “will,” “should,” “could,” and similar expressions. Such statements are based on current plans, estimates and expectations and involve a number of known and unknown risks, uncertainties and other factors that could cause the Company's future results, performance or achievements to differ significantly from the results, performance or achievements expressed or implied by such forward-looking statements. These factors and additional information are discussed in the Company's filings with the Securities and Exchange Commission and statements in this presentation should be evaluated in light of these important factors. Although we believe that these statements are based upon reasonable assumptions, we cannot guarantee future results. Forward-looking statements speak only as of the date on which they are made, and the Company undertakes no obligation to update publicly or revise any forward-looking statement, whether as a result of new information, future developments or otherwise. Non-GAAP Measures: Manitex International from time to time refers to various non-GAAP (generally accepted accounting principles) financial measures in this presentation. Manitex believes that this information is useful to understanding its operating results without the impact of special items. See Manitex’s Full Year and Fourth Quarter 2015 Earnings Release on the Investor Relations section of our website www.manitexinternational.com for a description and/or reconciliation of these measures.
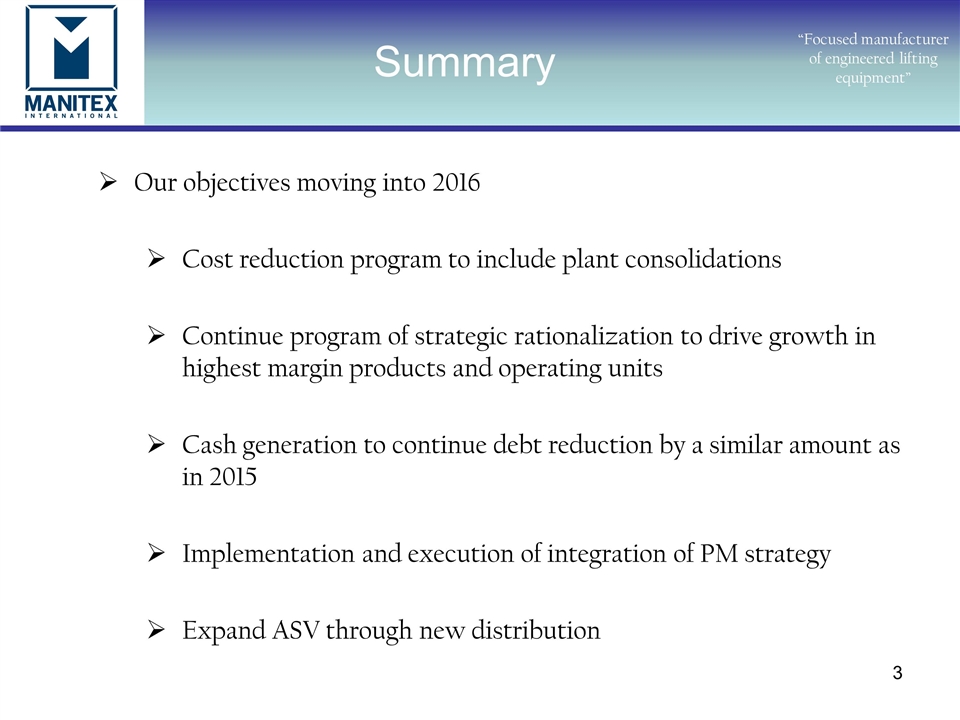
Summary “Focused manufacturer of engineered lifting equipment” Our objectives moving into 2016 Cost reduction program to include plant consolidations Continue program of strategic rationalization to drive growth in highest margin products and operating units Cash generation to continue debt reduction by a similar amount as in 2015 Implementation and execution of integration of PM strategy Expand ASV through new distribution
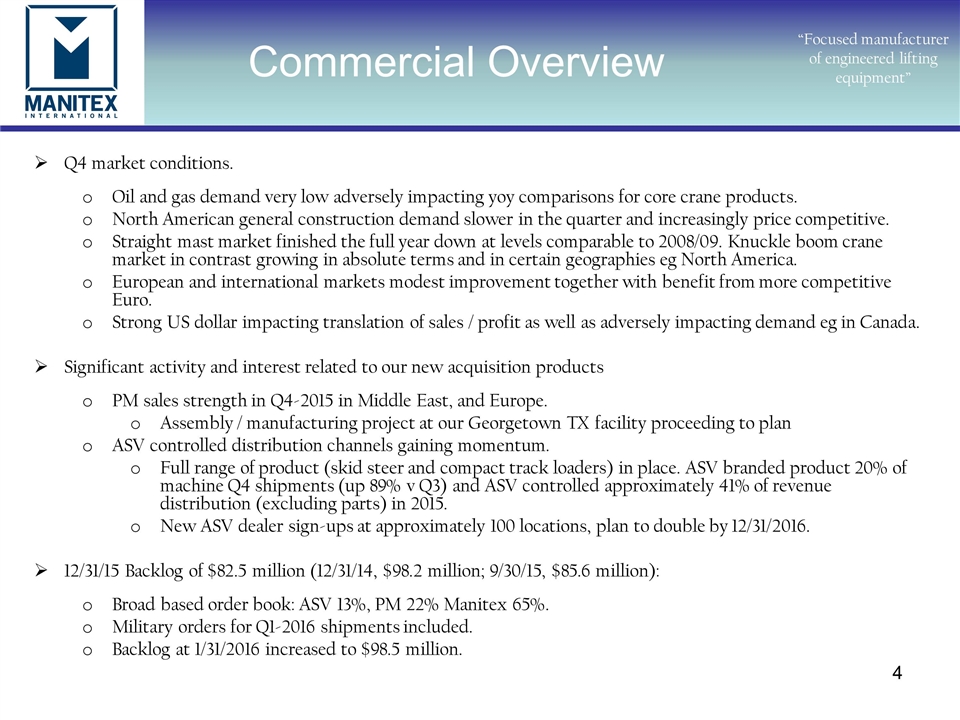
“Focused manufacturer of engineered lifting equipment” Commercial Overview Q4 market conditions. Oil and gas demand very low adversely impacting yoy comparisons for core crane products. North American general construction demand slower in the quarter and increasingly price competitive. Straight mast market finished the full year down at levels comparable to 2008/09. Knuckle boom crane market in contrast growing in absolute terms and in certain geographies eg North America. European and international markets modest improvement together with benefit from more competitive Euro. Strong US dollar impacting translation of sales / profit as well as adversely impacting demand eg in Canada. Significant activity and interest related to our new acquisition products PM sales strength in Q4-2015 in Middle East, and Europe. Assembly / manufacturing project at our Georgetown TX facility proceeding to plan ASV controlled distribution channels gaining momentum. Full range of product (skid steer and compact track loaders) in place. ASV branded product 20% of machine Q4 shipments (up 89% v Q3) and ASV controlled approximately 41% of revenue distribution (excluding parts) in 2015. New ASV dealer sign-ups at approximately 100 locations, plan to double by 12/31/2016. 12/31/15 Backlog of $82.5 million (12/31/14, $98.2 million; 9/30/15, $85.6 million): Broad based order book: ASV 13%, PM 22% Manitex 65%. Military orders for Q1-2016 shipments included. Backlog at 1/31/2016 increased to $98.5 million.
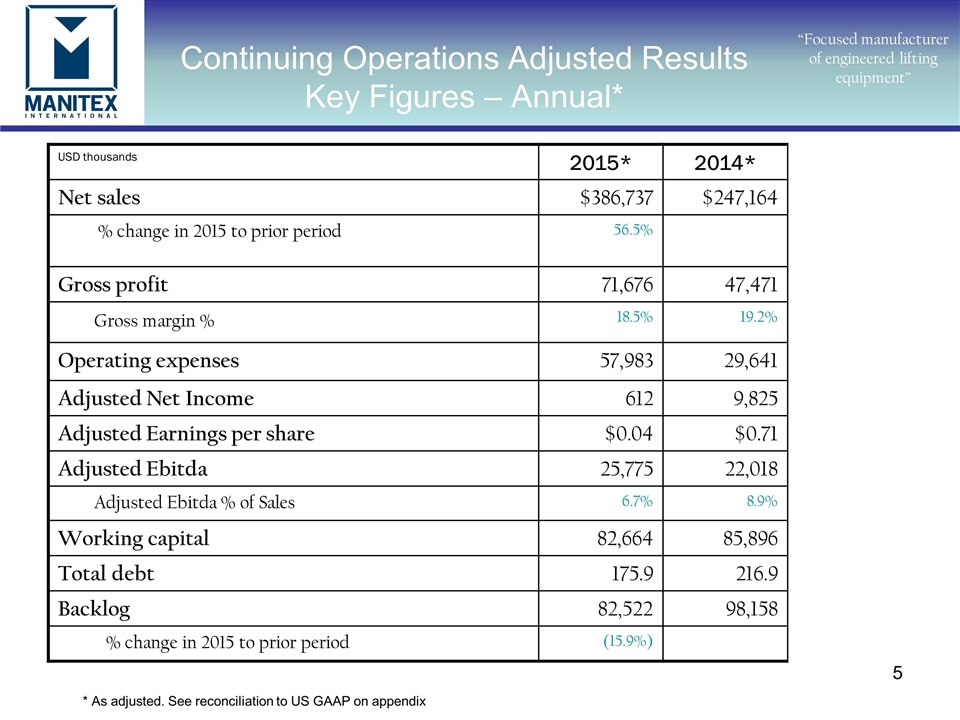
Continuing Operations Adjusted Results Key Figures – Annual* “Focused manufacturer of engineered lifting equipment” USD thousands 2015* 2014* Net sales $386,737 $247,164 % change in 2015 to prior period 56.5% Gross profit 71,676 47,471 Gross margin % 18.5% 19.2% Operating expenses 57,983 29,641 Adjusted Net Income 612 9,825 Adjusted Earnings per share $0.04 $0.71 Adjusted Ebitda 25,775 22,018 Adjusted Ebitda % of Sales 6.7% 8.9% Working capital 82,664 85,896 Total debt 175.9 216.9 Backlog 82,522 98,158 % change in 2015 to prior period (15.9%) * As adjusted. See reconciliation to US GAAP on appendix
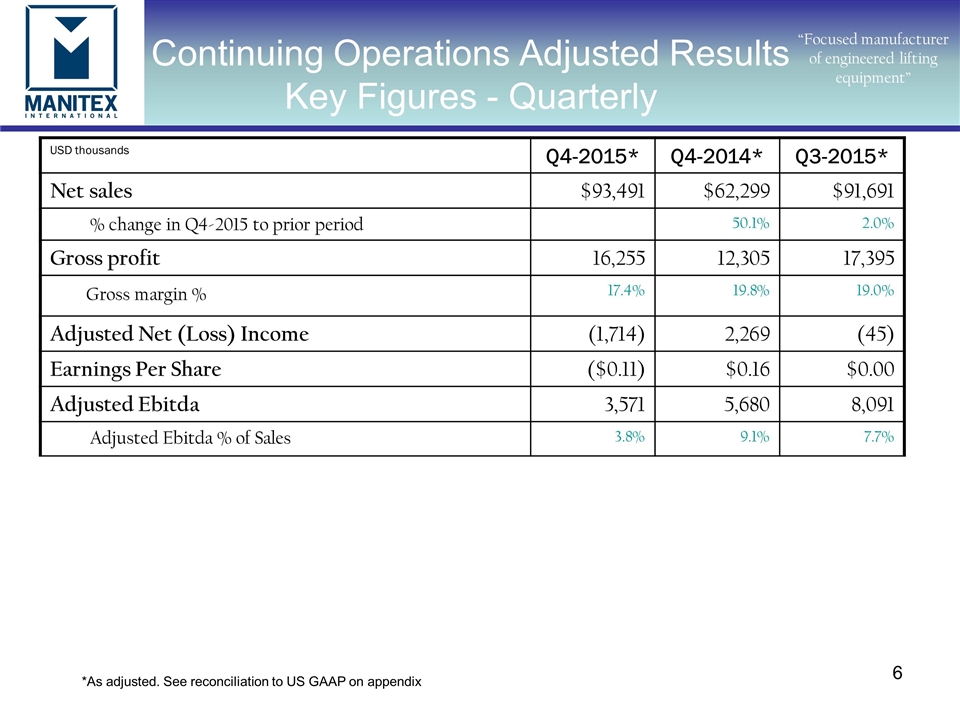
Continuing Operations Adjusted Results Key Figures - Quarterly “Focused manufacturer of engineered lifting equipment” USD thousands Q4-2015* Q4-2014* Q3-2015* Net sales $93,491 $62,299 $91,691 % change in Q4-2015 to prior period 50.1% 2.0% Gross profit 16,255 12,305 17,395 Gross margin % 17.4% 19.8% 19.0% Adjusted Net (Loss) Income (1,714) 2,269 (45) Earnings Per Share ($0.11) $0.16 $0.00 Adjusted Ebitda 3,571 5,680 8,091 Adjusted Ebitda % of Sales 3.8% 9.1% 7.7% *As adjusted. See reconciliation to US GAAP on appendix
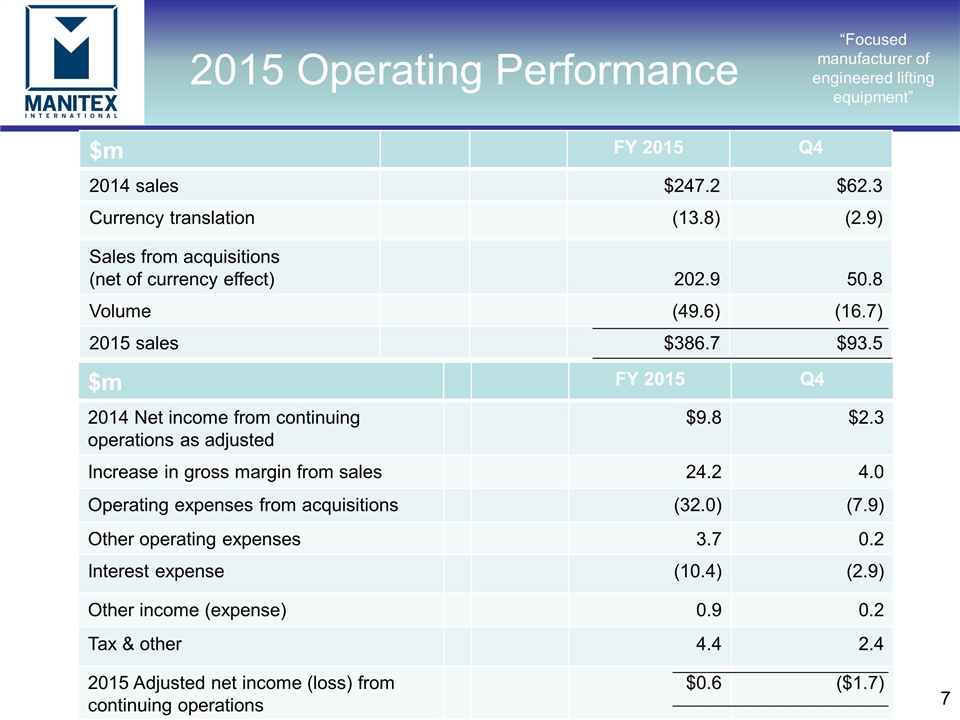
“Focused manufacturer of engineered lifting equipment” 2015 Operating Performance $m FY 2015 Q4 2014 sales $247.2 $62.3 Currency translation (13.8) (2.9) Sales from acquisitions (net of currency effect) 202.9 50.8 Volume (49.6) (16.7) 2015 sales $386.7 $93.5 $m FY 2015 Q4 2014 Net income from continuing operations as adjusted $9.8 $2.3 Increase in gross margin from sales 24.2 4.0 Operating expenses from acquisitions (32.0) (7.9) Other operating expenses 3.7 0.2 Interest expense (10.4) (2.9) Other income (expense) 0.9 0.2 Tax & other 4.4 2.4 2015 Adjusted net income (loss) from continuing operations $0.6 ($1.7)
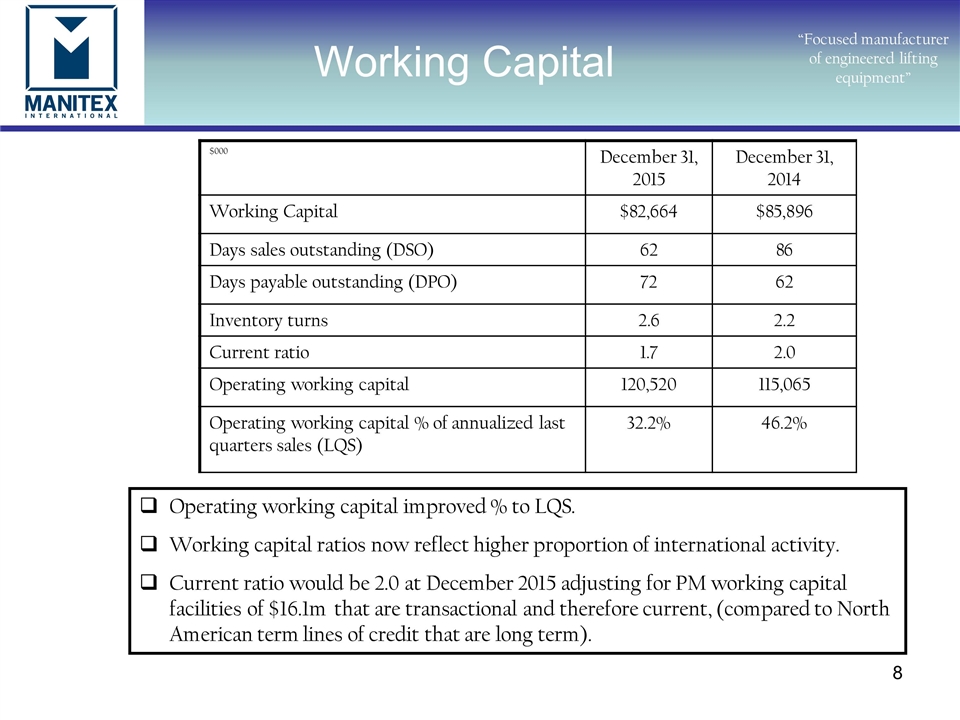
Working Capital “Focused manufacturer of engineered lifting equipment” $000 December 31, 2015 December 31, 2014 Working Capital $82,664 $85,896 Days sales outstanding (DSO) 62 86 Days payable outstanding (DPO) 72 62 Inventory turns 2.6 2.2 Current ratio 1.7 2.0 Operating working capital 120,520 115,065 Operating working capital % of annualized last quarters sales (LQS) 32.2% 46.2% Operating working capital improved % to LQS. Working capital ratios now reflect higher proportion of international activity. Current ratio would be 2.0 at December 2015 adjusting for PM working capital facilities of $16.1m that are transactional and therefore current, (compared to North American term lines of credit that are long term).
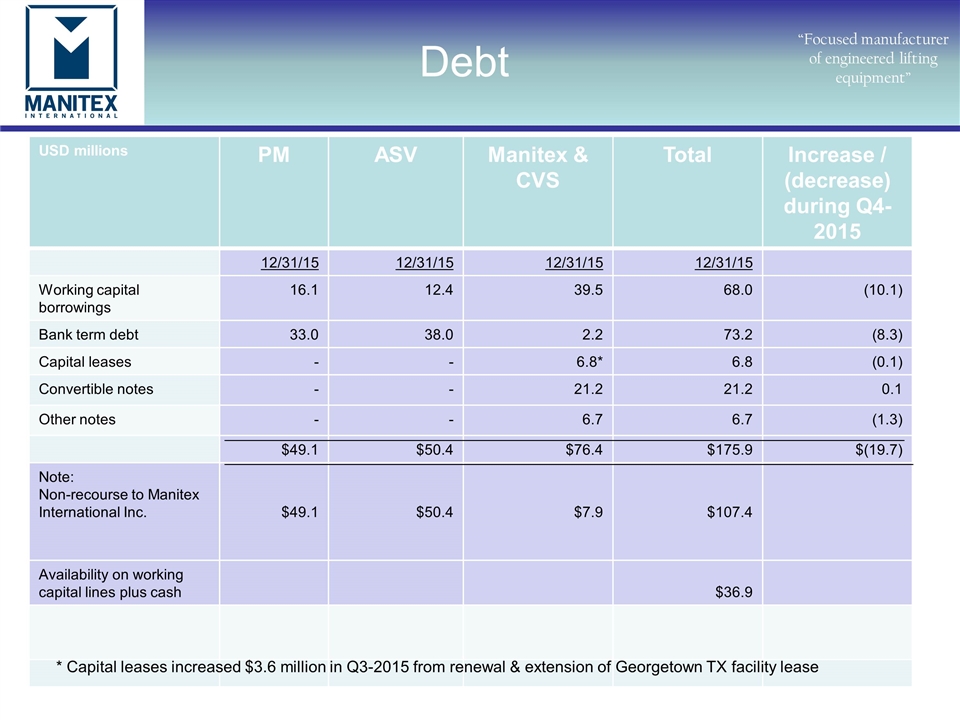
“Focused manufacturer of engineered lifting equipment” Debt USD millions PM ASV Manitex & CVS Total Increase / (decrease) during Q4-2015 12/31/15 12/31/15 12/31/15 12/31/15 Working capital borrowings 16.1 12.4 39.5 68.0 (10.1) Bank term debt 33.0 38.0 2.2 73.2 (8.3) Capital leases - - 6.8* 6.8 (0.1) Convertible notes - - 21.2 21.2 0.1 Other notes - - 6.7 6.7 (1.3) $49.1 $50.4 $76.4 $175.9 $(19.7) Note: Non-recourse to Manitex International Inc. $49.1 $50.4 $7.9 $107.4 Availability on working capital lines plus cash $36.9 * Capital leases increased $3.6 million in Q3-2015 from renewal & extension of Georgetown TX facility lease
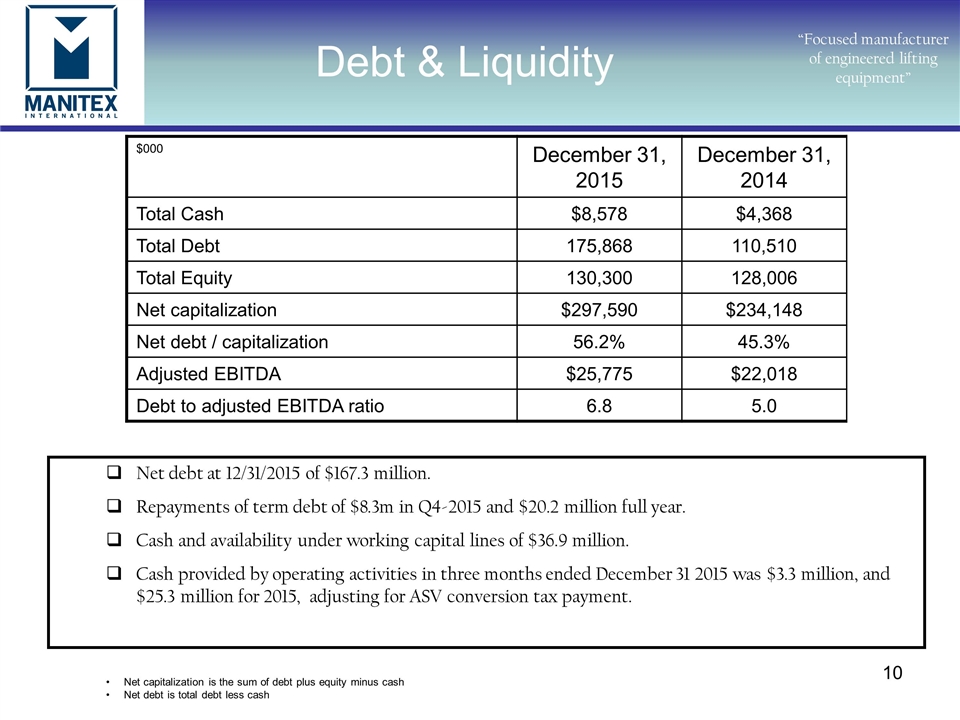
“Focused manufacturer of engineered lifting equipment” $000 December 31, 2015 December 31, 2014 Total Cash $8,578 $4,368 Total Debt 175,868 110,510 Total Equity 130,300 128,006 Net capitalization $297,590 $234,148 Net debt / capitalization 56.2% 45.3% Adjusted EBITDA $25,775 $22,018 Debt to adjusted EBITDA ratio 6.8 5.0 Net debt at 12/31/2015 of $167.3 million. Repayments of term debt of $8.3m in Q4-2015 and $20.2 million full year. Cash and availability under working capital lines of $36.9 million. Cash provided by operating activities in three months ended December 31 2015 was $3.3 million, and $25.3 million for 2015, adjusting for ASV conversion tax payment. Debt & Liquidity Net capitalization is the sum of debt plus equity minus cash Net debt is total debt less cash
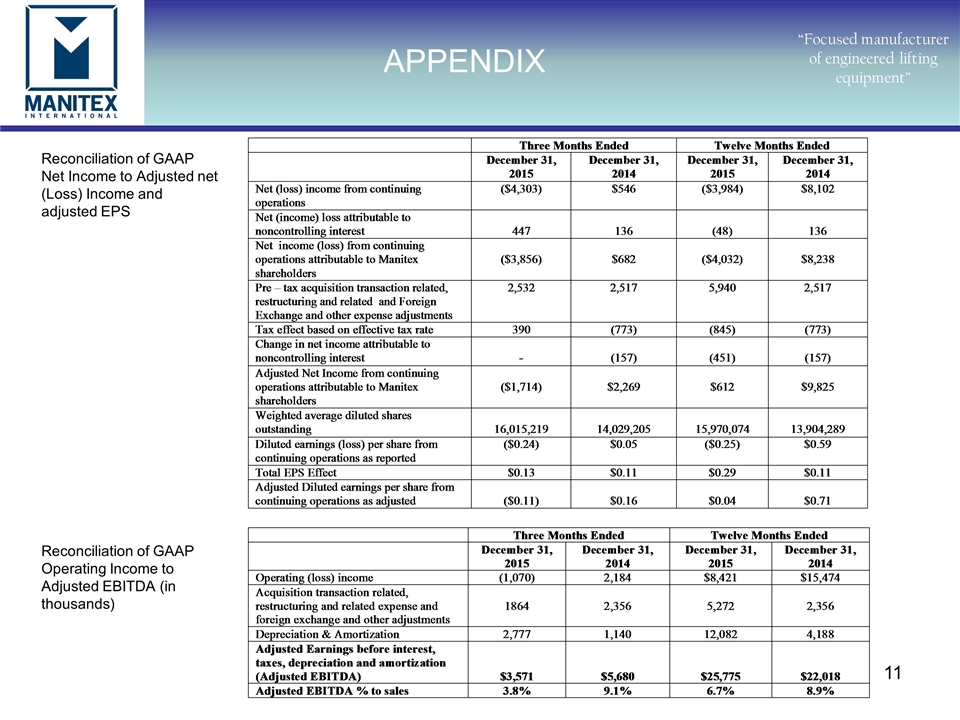
APPENDIX “Focused manufacturer of engineered lifting equipment” Reconciliation of GAAP Net Income to Adjusted net (Loss) Income and adjusted EPS Reconciliation of GAAP Operating Income to Adjusted EBITDA (in thousands)
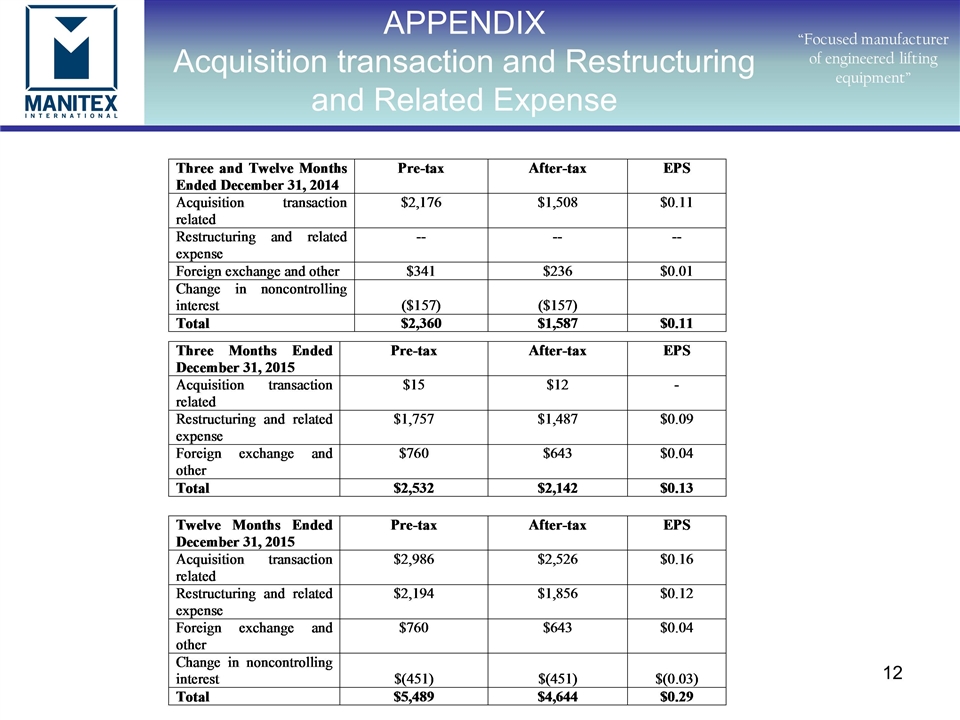
APPENDIX Acquisition transaction and Restructuring and Related Expense “Focused manufacturer of engineered lifting equipment”
Serious News for Serious Traders! Try StreetInsider.com Premium Free!
You May Also Be Interested In
- Manitex International Announces First Quarter 2024 Results Conference Call and Webcast Date
- Melco reaffirms commitment to sustainability in 2023 RISE to go Above & Beyond report
- Åsa Vilsson new CFO at Elanders
Create E-mail Alert Related Categories
SEC FilingsSign up for StreetInsider Free!
Receive full access to all new and archived articles, unlimited portfolio tracking, e-mail alerts, custom newswires and RSS feeds - and more!


 Tweet
Tweet Share
Share