

Form 8-K LINCOLN NATIONAL CORP For: Jun 09
 Tweet
Tweet Share
ShareUNITED STATES
SECURITIES AND EXCHANGE COMMISSION
Washington, D.C. 20549
FORM 8-K
CURRENT REPORT
Pursuant to Section 13 or 15(d) of
the Securities Exchange Act of 1934
|
June 9, 2016
|
Date of Report (Date of earliest event reported)
|
Lincoln National Corporation
|
(Exact name of registrant as specified in its charter)
|
Indiana
|
1-6028
|
35-1140070
|
|
(State or other jurisdiction
|
(Commission
|
(IRS Employer
|
|
of incorporation)
|
File Number)
|
Identification No.)
|
150 N. Radnor Chester Road, Radnor, PA 19087
(Address of principal executive offices)(Zip Code)
(484) 583-1400
(Registrant's telephone number, including area code)
Check the appropriate box below if the Form 8-K filing is intended to simultaneously satisfy the filing obligation of the registrant under any of the following provisions:
|
□
|
Written communications pursuant to Rule 425 under the Securities Act (17 CFR 230.425)
|
|
□
|
Soliciting material pursuant to Rule 14a-12 under the Exchange Act (17 CFR 240.14a-12)
|
|
□
|
Pre-commencement communications pursuant to Rule 14d-2(b) under the Exchange Act (17 CFR 240.14d-2(b))
|
|
□
|
Pre-commencement communications pursuant to Rule 13e-4(c) under the Exchange Act (17 CFR 240.13e-4(c))
|
Item 7.01. Regulation FD Disclosure.
On June 9, 2016, we posted slides to be used in connection with our 2016 Conference for Analysts, Investors and Bankers, a copy of which are attached as Exhibit 99.1 and are incorporated herein by reference.
The Conference for Analysts, Investors and Bankers is being held on Thursday, June 9, 2016, beginning at approximately 8:30 a.m. (EDT). Interested persons are invited to listen through the internet, either live or through on-demand replay. The replay of the conference will be available for approximately one year beginning at approximately 4:00 p.m. (EDT) June 9, 2016. Please visit www.lincolnfinancial.com/webcast at least fifteen minutes prior to the event to register, download and install any necessary streaming media software.
Forward Looking Statements — Cautionary Language
Certain statements made in this report and in other written or oral statements made by us or on our behalf are "forward-looking statements" within the meaning of the Private Securities Litigation Reform Act of 1995 ("PSLRA"). A forward-looking statement is a statement that is not a historical fact and, without limitation, includes any statement that may predict, forecast, indicate or imply future results, performance or achievements, and may contain words like: "believe," "anticipate," "expect," "estimate," "project," "will," "shall" and other words or phrases with similar meaning in connection with a discussion of future operating or financial performance. In particular, these include statements relating to future actions, trends in our businesses, prospective services or products, future performance or financial results and the outcome of contingencies, such as legal proceedings. We claim the protection afforded by the safe harbor for forward-looking statements provided by the PSLRA.
Forward-looking statements involve risks and uncertainties that may cause actual results to differ materially from the results contained in the forward-looking statements. Risks and uncertainties that may cause actual results to vary materially, some of which are described within the forward-looking statements, include, among others:
| · | Deterioration in general economic and business conditions that may affect account values, investment results, guaranteed benefit liabilities, premium levels, claims experience and the level of pension benefit costs, funding and investment results; |
| · | Adverse global capital and credit market conditions could affect our ability to raise capital, if necessary, and may cause us to realize impairments on investments and certain intangible assets, including goodwill and the valuation allowance against deferred tax assets, which may reduce future earnings and/or affect our financial condition and ability to raise additional capital or refinance existing debt as it matures; |
| · | Because of our holding company structure, the inability of our subsidiaries to pay dividends to the holding company in sufficient amounts could harm the holding company's ability to meet its obligations; |
| · | Legislative, regulatory or tax changes, both domestic and foreign, that affect: the cost of, or demand for, our subsidiaries' products, the required amount of reserves and/or surplus, our ability to conduct business and our captive reinsurance arrangements as well as restrictions on revenue sharing and 12b‑1 payments, the potential for U.S. federal tax reform and the impact of the Department of Labor's ("DOL") regulation defining fiduciary; |
| · | Actions taken by reinsurers to raise rates on in-force business; |
| · | Declines in or sustained low interest rates causing a reduction in investment income, the interest margins of our businesses, estimated gross profits and demand for our products; |
| · | Rapidly increasing interest rates causing contract holders to surrender life insurance and annuity policies, thereby causing realized investment losses, and reduced hedge performance related to variable annuities; |
| · | Uncertainty about the effect of rules and regulations to be promulgated under the Dodd-Frank Wall Street Reform and Consumer Protection Act on us and the economy and financial services sector in particular; |
| · | The initiation of legal or regulatory proceedings against us, and the outcome of any legal or regulatory proceedings, such as: adverse actions related to present or past business practices common in businesses in which we compete; adverse decisions in significant actions including, but not limited to, actions brought by federal and state authorities and class action cases; new decisions that result in changes in law; and unexpected trial court rulings; |
| · | A decline in the equity markets causing a reduction in the sales of our subsidiaries' products, a reduction of asset-based fees that our subsidiaries charge on various investment and insurance products, an acceleration of the net amortization of deferred acquisition costs ("DAC"), value of business acquired ("VOBA"), deferred sales inducements ("DSI") and deferred front-end loads ("DFEL") and an increase in liabilities related to guaranteed benefit features of our subsidiaries' variable annuity products; |
| · | Ineffectiveness of our risk management policies and procedures, including various hedging strategies used to offset the effect of changes in the value of liabilities due to changes in the level and volatility of the equity markets and interest rates; |
| · | A deviation in actual experience regarding future persistency, mortality, morbidity, interest rates or equity market returns from the assumptions used in pricing our subsidiaries' products, in establishing related insurance reserves and in the net amortization of DAC, VOBA, DSI and DFEL, which may reduce future earnings; |
| · | Changes in accounting principles generally accepted in the United States of America, including convergence with International Financial Reporting Standards, that may result in unanticipated changes to our net income; |
| · | Lowering of one or more of our debt ratings issued by nationally recognized statistical rating organizations and the adverse effect such action may have on our ability to raise capital and on our liquidity and financial condition; |
| · | Lowering of one or more of the insurer financial strength ratings of our insurance subsidiaries and the adverse effect such action may have on the premium writings, policy retention, profitability of our insurance subsidiaries and liquidity; |
| · | Significant credit, accounting, fraud, corporate governance or other issues that may adversely affect the value of certain investments in our portfolios, as well as counterparties to which we are exposed to credit risk, requiring that we realize losses on investments; |
| · | Inability to protect our intellectual property rights or claims of infringement of the intellectual property rights of others; |
| · | Interruption in telecommunication, information technology or other operational systems or failure to safeguard the confidentiality or privacy of sensitive data on such systems from cyberattacks or other breaches of our data security systems; |
| · | The effect of acquisitions and divestitures, restructurings, product withdrawals and other unusual items; |
| · | The adequacy and collectability of reinsurance that we have purchased; |
| · | Acts of terrorism, a pandemic, war or other man-made and natural catastrophes that may adversely affect our businesses and the cost and availability of reinsurance; |
| · | Competitive conditions, including pricing pressures, new product offerings and the emergence of new competitors, that may affect the level of premiums and fees that our subsidiaries can charge for their products; |
| · | The unknown effect on our subsidiaries' businesses resulting from changes in the demographics of their client base, as aging baby-boomers move from the asset-accumulation stage to the asset-distribution stage of life; and |
| · | Loss of key management, financial planners or wholesalers. |
The risks included here are not exhaustive. Our annual report on Form 10-K, quarterly reports on form 10-Q, current reports on Form 8-K and other documents filed with the Securities and Exchange Commission include additional factors that could affect our businesses and financial performance. Moreover, we operate in a rapidly changing and competitive environment. New risk factors emerge from time to time, and it is not possible for management to predict all such risk factors.
Further, it is not possible to assess the effect of all risk factors on our businesses or the extent to which any factor, or combination of factors, may cause actual results to differ materially from those contained in any forward-looking statements. Given these risks and uncertainties, investors should not place undue reliance on forward-looking statements as a prediction of actual results. In addition, we disclaim any obligation to update any forward-looking statements to reflect events or circumstances that occur after the date of this report.
The reporting of RBC measures is not intended for the purpose of ranking any insurance company or for use in connection with any marketing, advertising or promotional activities.
Item 9.01. Financial Statements and Exhibits.
(d) Exhibits.
|
Exhibit
Number |
Description
|
|
99.1
|
SIGNATURES
Pursuant to the requirements of the Securities Exchange Act of 1934, the registrant has duly caused this report to be signed on its behalf by the undersigned hereunto duly authorized.
|
LINCOLN NATIONAL CORPORATION
|
||
|
|
||
|
By
|
/s/ Randal J. Freitag
|
|
|
Name:
|
Randal J. Freitag
|
|
|
Title:
|
Executive Vice President and
|
|
|
Chief Financial Officer
|
||
Date: June 9, 2016
INDEX TO EXHIBITS
|
Exhibit
Number |
Description
|
|
99.1
|

Dennis Glass | President and Chief Executive Officer Strategic overview 2016 Conference for Analysts, Investors and Bankers
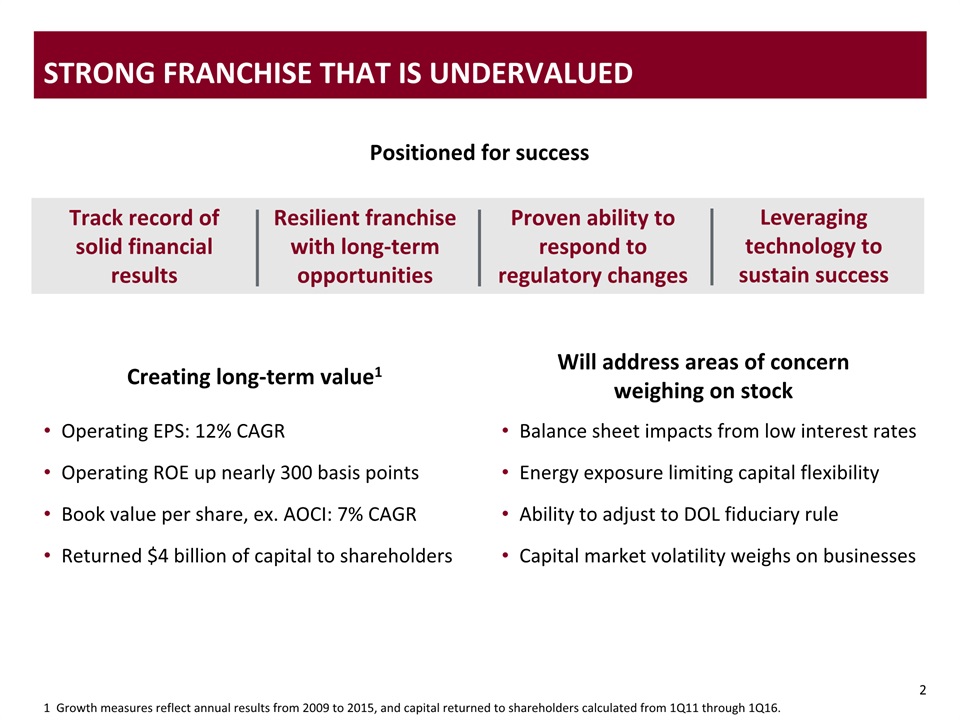
2 2 Strong franchise that is undervalued Operating EPS: 12% CAGR Operating ROE up nearly 300 basis pointsBook value per share, ex. AOCI: 7% CAGRReturned $4 billion of capital to shareholders Balance sheet impacts from low interest ratesEnergy exposure limiting capital flexibilityAbility to adjust to DOL fiduciary ruleCapital market volatility weighs on businesses Positioned for success Track record of solid financial results Resilient franchise with long-term opportunities Proven ability to respond to regulatory changes Leveraging technology to sustain success Creating long-term value1 Will address areas of concern weighing on stock 1 Growth measures reflect annual results from 2009 to 2015, and capital returned to shareholders calculated from 1Q11 through 1Q16.
2 2 Strong franchise that is undervalued Operating EPS: 12% CAGR Operating ROE up nearly 300 basis pointsBook value per share, ex. AOCI: 7% CAGRReturned $4 billion of capital to shareholders Balance sheet impacts from low interest ratesEnergy exposure limiting capital flexibilityAbility to adjust to DOL fiduciary ruleCapital market volatility weighs on businesses Positioned for success Track record of solid financial results Resilient franchise with long-term opportunities Proven ability to respond to regulatory changes Leveraging technology to sustain success Creating long-term value1 Will address areas of concern weighing on stock 1 Growth measures reflect annual results from 2009 to 2015, and capital returned to shareholders calculated from 1Q11 through 1Q16.

Will Fuller | President, Annuities, Lincoln Financial Distribution and Lincoln Financial Network Distribution 2016 Conference for Analysts, Investors and Bankers
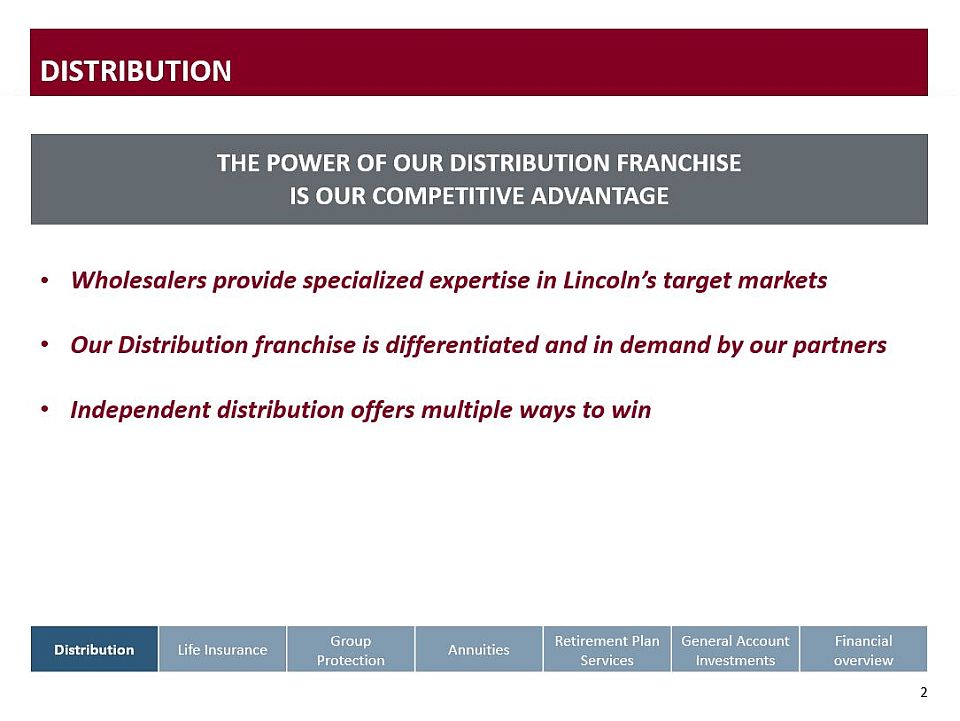
2 Distribution Wholesalers provide specialized expertise in Lincoln’s target marketsOur Distribution franchise is differentiated and in demand by our partnersIndependent distribution offers multiple ways to win Distribution Life Insurance Group Protection Annuities Retirement Plan Services General AccountInvestments Financial overview THE POWER OF OUR DISTRIBUTION FRANCHISE IS OUR COMPETITIVE ADVANTAGE

3 1 Source: U.S Census Bureau, Income and Poverty in the United States: 2014, September 2015; Joint Center for Housing Studies of Harvard University, Baseline Household Projection for the Next Decade and Beyond, March 27, 2014. 2 Source: McKinsey Life insurance Trends and Implications, 2016. Delivering expertise in our target markets Retirement saving Retirement income Healthcarecosts Estate planning 61% of income held by those age and younger1 54 80% of all wealth will be held by consumers near or in retirement2 Employee benefitsRetirement plansTerm insurance By 2025: Advisors are generalists serving a variety of consumer needs Over 800 wholesalers provide specialized expertise 620wholesalers Lincoln Financial Distributors Annuities Life insurance MoneyGuard® Small market RPS 160wholesalers Group Protection Variable annuitiesFixed annuitiesMoneyGuard®Universal life insurance Insurance Mid-large RPS 25wholesalers

Scalable national market presence Channelized distribution Specialized expertise Broad product portfolio ProductWithin partner firms Rank2Within industry RankWithin 4+ firms Variable annuity #3 < #1 Fixed annuity #9 < #4 Life insurance #3 < #1 MoneyGuard® #1 = #1 National footprint; large wholesale force provide coverage in local markets Wholesalers aligned with various industry business models Partnering with advisors to solve specific client needs Multiple solutions to serve wide variety of consumer needs Our wholesaler franchise is in Demand By our partners Majority of sales from partners offering 4+ Lincoln products1 ■ Sell 4+ Lincoln products■ Sell 1-3 Lincoln products 1 2015 Normalized Sales excluding Life Brokerage (Includes: Life, MoneyGuard®: paid annualized premiums; Annuity, small market RPS: at 5% of total).2 Source: VA - Morningstar YTD 4Q15 Asset Flows U.S. Variable Annuity Retail Policies Report; FA - LIMRA 4Q15 Individual Annuities Sales Report; Life insurance - 4Q15 Retail Individual Life Insurance Sales, Participant Report (excludes Whole Life); and MoneyGuard® - LIMRA 2014 US Individual Life Combination Product Sales. Our rank within those firms is greater than our rank within the industry 4 + + +

RETENTION We have a large active producer base With room to grow Add new producers in our core marketsExpansion to new markets of total sales from repeat producers 74% 1/4 selling multiple types of Lincoln products Demonstrated ability to pivot and add new producers Life non-guarantee pivot VA non-living benefit pivot 7,200Already selling pivot products 2,300Shift of GUL producer to pivot products 6,400New to Lincoln through pivot 3,400Already selling non-living benefit 5,400Shift of VA producer to non-living benefit 6,400New to Lincoln though non-living benefit + + + + CROSS SELL 90K 110K Active Lincoln producers Prospects with attributes like our best active producers Targeted producers Success driven by 15,900 producers1 Success driven by 15,200 producers1 1 Life producer counts from January 2012 to December 2013; VA producer counts from October 2013 to September 2015. Independent Distribution offers multiple ways to win 200K Driven by access to a broad and diverse producer universe 5
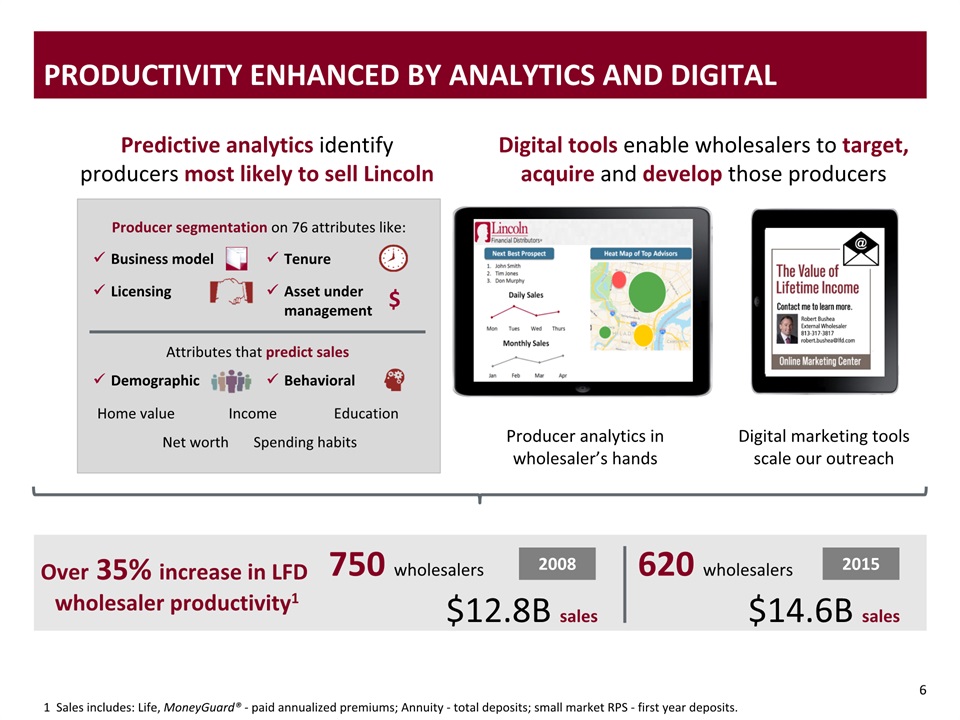
$ Producer segmentation on 76 attributes like: Predictive analytics identify producers most likely to sell Lincoln Digital tools enable wholesalers to target, acquire and develop those producers 750 wholesalers $12.8B sales 2008 2015 $14.6B sales Behavioral Demographic Tenure Licensing Asset under management Business model Productivity enhanced by Analytics and Digital Over 35% increase in LFD wholesaler productivity1 Attributes that predict sales Home value Net worth Income Spending habits Education 620 wholesalers Digital marketing tools scale our outreach Producer analytics in wholesaler’s hands 6 1 Sales includes: Life, MoneyGuard® - paid annualized premiums; Annuity - total deposits; small market RPS - first year deposits.

7 We are generally encouraged by constructive changes to the final rule Dedicating our full energy to DOL transition Department of Labor Fiduciary Standards Key highlights Commissions acceptable and may be in clients best interestCommissions and fees held to the same standardLifetime income and guarantees recognizedFIA and group variable annuities included in final ruleGrandfather provision through 4/10/2017 Full implementation by 1/1/2018 Distribution partners reactions Most intend to use BIC1May need to rationalize product menu and partnersPrivate right of action a concern LFN position Intend to use BICHold commissions and fees to same standardDistinguish lifetime income from traditional investments 1 Best interest contract exemption is abbreviated as BIC.
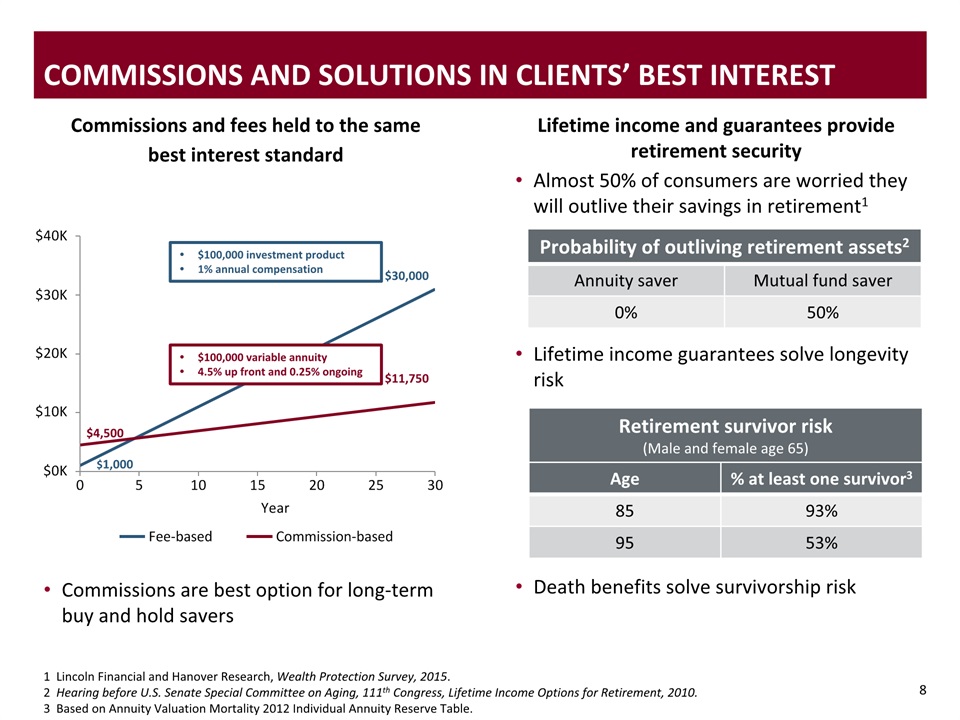
1 Lincoln Financial and Hanover Research, Wealth Protection Survey, 2015. 2 Hearing before U.S. Senate Special Committee on Aging, 111th Congress, Lifetime Income Options for Retirement, 2010. 3 Based on Annuity Valuation Mortality 2012 Individual Annuity Reserve Table. $4,500 $11,750 $30,000 $1,000 $100,000 variable annuity4.5% up front and 0.25% ongoing $100,000 investment product1% annual compensation Commissions and fees held to the same best interest standard Lifetime income and guarantees provide retirement security Almost 50% of consumers are worried they will outlive their savings in retirement1 Lifetime income guarantees solve longevity riskDeath benefits solve survivorship risk Commissions and Solutions in clients’ best interest Probability of outliving retirement assets2 Annuity saver Mutual fund saver 0% 50% Retirement survivor risk (Male and female age 65) Age % at least one survivor3 85 93% 95 53% 8 Commissions are best option for long-term buy and hold savers
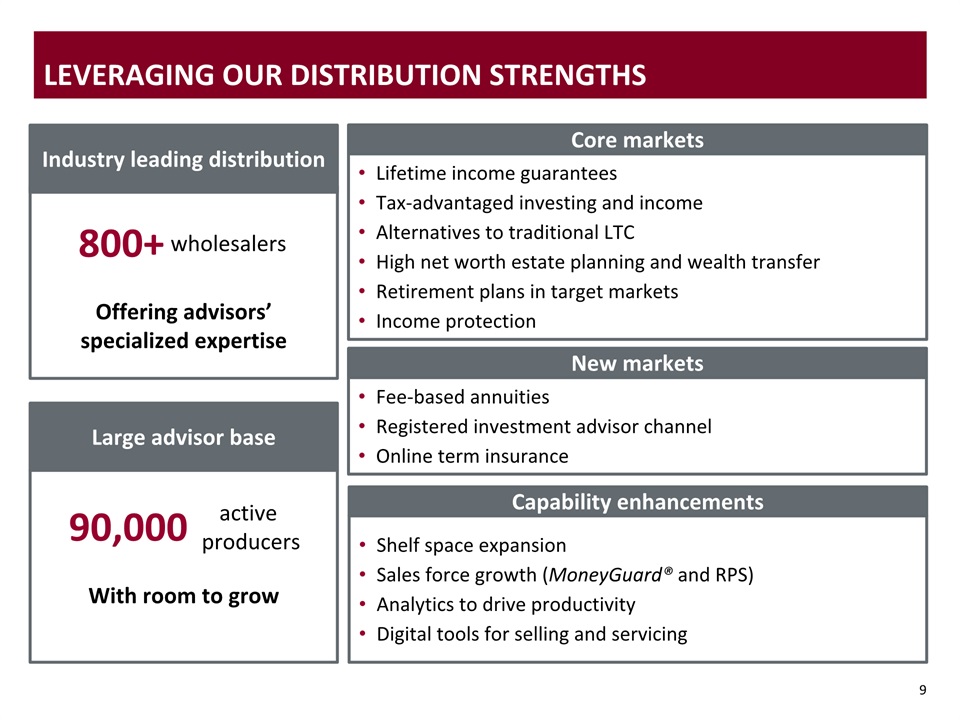
Shelf space expansionSales force growth (MoneyGuard® and RPS)Analytics to drive productivityDigital tools for selling and servicing Fee-based annuitiesRegistered investment advisor channelOnline term insurance Lifetime income guaranteesTax-advantaged investing and incomeAlternatives to traditional LTCHigh net worth estate planning and wealth transferRetirement plans in target marketsIncome protection 9 Leveraging our DISTRIBUTION strengths Industry leading distribution 800+ Offering advisors’ specialized expertise Large advisor base 90,000With room to grow active producers wholesalers Core markets New markets Capability enhancements

10 Our Distribution franchise is differentiated and in demand by our partners Wholesalers provide specialized expertise in Lincoln’s target markets Independent distribution offers multiple ways to win Distribution Distribution Life Insurance Group Protection Annuities Retirement Plan Services General AccountInvestments Financial overview

Mark Konen | President, Insurance and Retirement Solutions Life Insurance 2016 Conference for Analysts, Investors and Bankers
2 Life Insurance CONSISTENT MARKET LEADERSHIP THROUGH DISCIPLINED RISK MANAGEMENT AND SUSTAINABLE AND COMPELLING WEALTH PROTECTION SOLUTIONS Scale, diversification, and innovation distinguishes Lincoln in the marketplaceMortality provides reliable long-term earnings despite volatilityNew business and in-force actions will overcome headwinds Distribution Life Insurance Group Protection Annuities Retirement Plan Services General AccountInvestments Financial overview
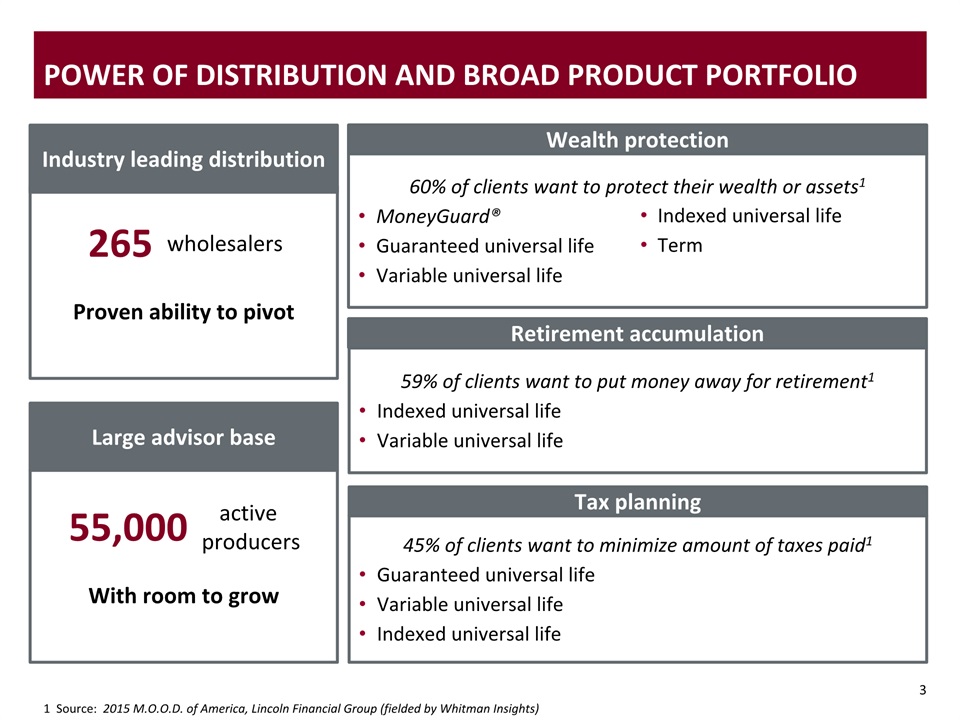
45% of clients want to minimize amount of taxes paid1Guaranteed universal lifeVariable universal lifeIndexed universal life 59% of clients want to put money away for retirement1Indexed universal lifeVariable universal life 60% of clients want to protect their wealth or assets1MoneyGuard®Guaranteed universal lifeVariable universal life 3 Power of Distribution and Broad product portfolio Industry leading distribution 265Proven ability to pivot Large advisor base 55,000With room to grow active producers wholesalers Wealth protection Retirement accumulation Tax planning Indexed universal lifeTerm 1 Source: 2015 M.O.O.D. of America, Lincoln Financial Group (fielded by Whitman Insights)

4 4 Positioned for Sustainable market leadership Meeting generational insurance needs through innovative products and streamlined processes Growing while expanding into Generation X and millennial markets Leading the industry in existing baby boomer and mature markets LincXpressSMStreamlined submission and delivery process paired with predictive analytics for portfolio of products TermAccel®Completely electronic process utilizes additional predictive analytics and automated underwriting Leading insurance modelData and technology leveraged to improve experience and risk assessment for high-touch business model Comprehensive portfolioScale and diversification allow us to remain competitive across markets and build strong distribution partnerships 117M Americans1 137M Americans1 1 Source: U.S. Census Bureau.

Only company to have all products represent between 10% and 30% of total sales 5 Product Rank VUL #1 Linked benefit #1 UL #9 Term #10 GUL #3 Executive benefits #3 Total life #3 Total life ex. whole life #1 1 Source: LIMRA U.S. Retail Individual Life Insurance Sales Participant Report - Fourth Quarter 2015 Year to Date and LIMRA 2015 U.S. Individual COLI BOLI Sales Participant Report. Superior product scale and diversification

6 franchise driving growth on our terms Emphasizing sales without long-term (LT) guarantees Key drivers support long-term growth 48% 2010 sales:$637M 2015 sales:$725M ■ With LT guarantee■ Without LT guarantee 48% 52% 67% 33% Sales+3% CAGR Account values +5% CAGR In-force face amount+3% CAGR
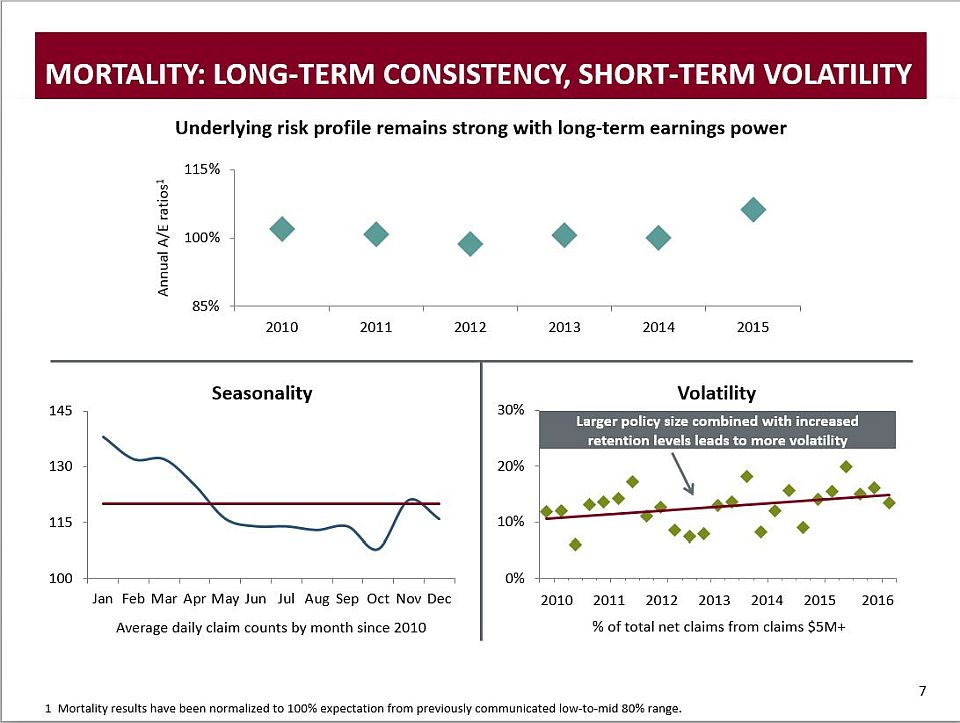
2010 2011 2012 2013 2014 2015 2016 7 Mortality: long-term consistency, Short-Term Volatility Underlying risk profile remains strong with long-term earnings power Average daily claim counts by month since 2010 Seasonality Volatility % of total net claims from claims $5M+ 1 Mortality results have been normalized to 100% expectation from previously communicated low-to-mid 80% range. Larger policy size combined with increased retention levels leads to more volatility

8 Product 2015 Sales mix Expected IRR Best estimate Scenarios Forward curve1 Mortality110% VUL 27% ● ● ● MoneyGuard® 26% ● ● ● UL 13% ● ● ● Term 12% ● ● ● GUL 11% ● ● ● Executive benefits 11% ● ● ● TOTAL 100% ● ● ● 8 Attractive new business Profitability & risk profile ● Above 12%● 10 -12%● Below 10% New business franchise provides diversified earnings power Main sensitivities to profitability results:Interest rates: forward curve = IRR > 12% Mortality: 10% unfavorable = IRR > 12%Both forward curve and 110% mortality = 10% IRR 1 Forward curve: 1Q16 average.

Inforce management Product diversification 9 2010 2011 2012 2013 2014 2015 Key economic headwind:interest rates PROACTIVE actions to address HEADWINDS Demonstrated ability to respond to market conditions while protecting and growing the franchise Crediting rates Other actions 1 Potential prospective re-pricing considerations for in-force business: investment income, mortality, reinsurance costs, policyholder persistency, expenses (including taxes), and other contractual considerations. Post-level term premium optimizationIn-force exchange optionsProactive retention actions Base spread 1.71% 1.71% 1.77% 1.62% 1.46% 1.40% 10-yearU.S. Treasury rates Disciplined expense managementIn-force repricing1 Other actions

10 Positioned For Earnings Growth ~$80M ~$(70)M ~$(5)M Restoring growth Earnings growth through new business franchise and in-force management 1 Life unlocking for 2012 is $47M and for 2015 is $(117)M. Capital redeployment impact of $(45)M. $482M

11 Life Insurance New business and in-force actions will overcome headwinds Scale, diversification, and innovation distinguishes Lincoln in the marketplace Mortality provides reliable long-term earnings despite volatility Distribution Life Insurance Group Protection Annuities Retirement Plan Services General AccountInvestments Financial overview

Mark Konen | President, Insurance and Retirement Solutions Group Protection 2016 Conference for Analysts, Investors and Bankers

2 Group Protection CONTINUING LOSS RATIO IMPROVEMENT AND ACCELERATING PREMIUM GROWTH WILL RESTORE PROFITABILITY TO OUR TARGET MARGIN RANGE OF 5-7% Embedding pricing and claims management discipline to sustain loss ratio improvementGrowing target markets by leveraging distribution and investing in capabilities and technologyIncreasing sales and improving renewal persistency will drive premium Distribution Life Insurance Group Protection Annuities Retirement Plan Services General AccountInvestments Financial overview
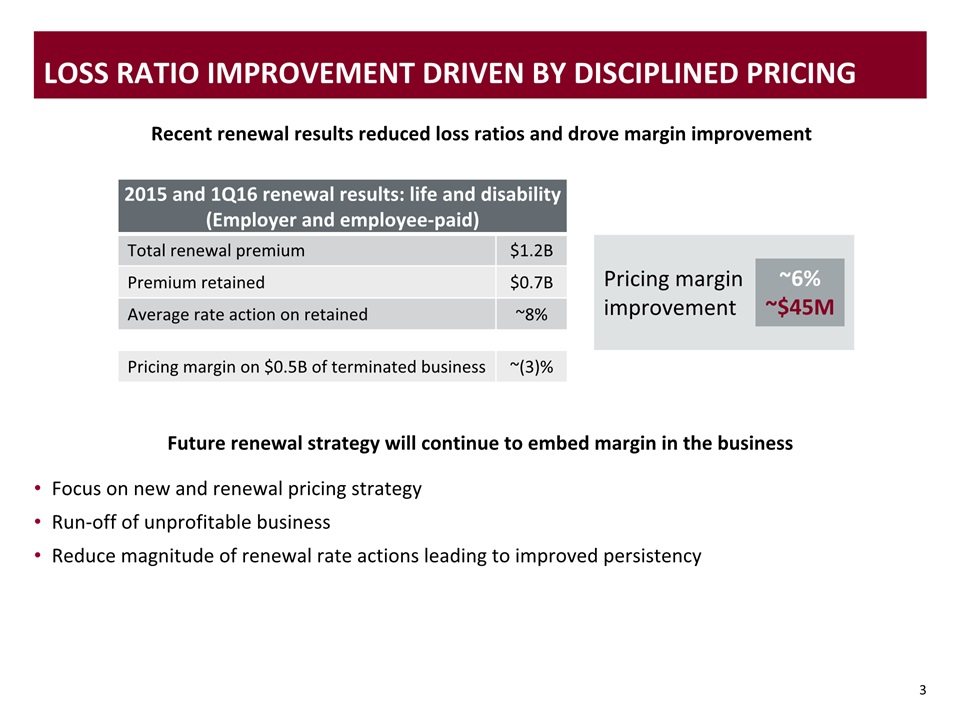
3 Loss Ratio improvement Driven by Disciplined Pricing Focus on new and renewal pricing strategyRun-off of unprofitable business Reduce magnitude of renewal rate actions leading to improved persistency Recent renewal results reduced loss ratios and drove margin improvement Future renewal strategy will continue to embed margin in the business 2015 and 1Q16 renewal results: life and disability(Employer and employee-paid) Total renewal premium $1.2B Premium retained $0.7B Average rate action on retained ~8% Pricing margin on $0.5B of terminated business ~(3)% Pricing margin improvement ~6%~$45M
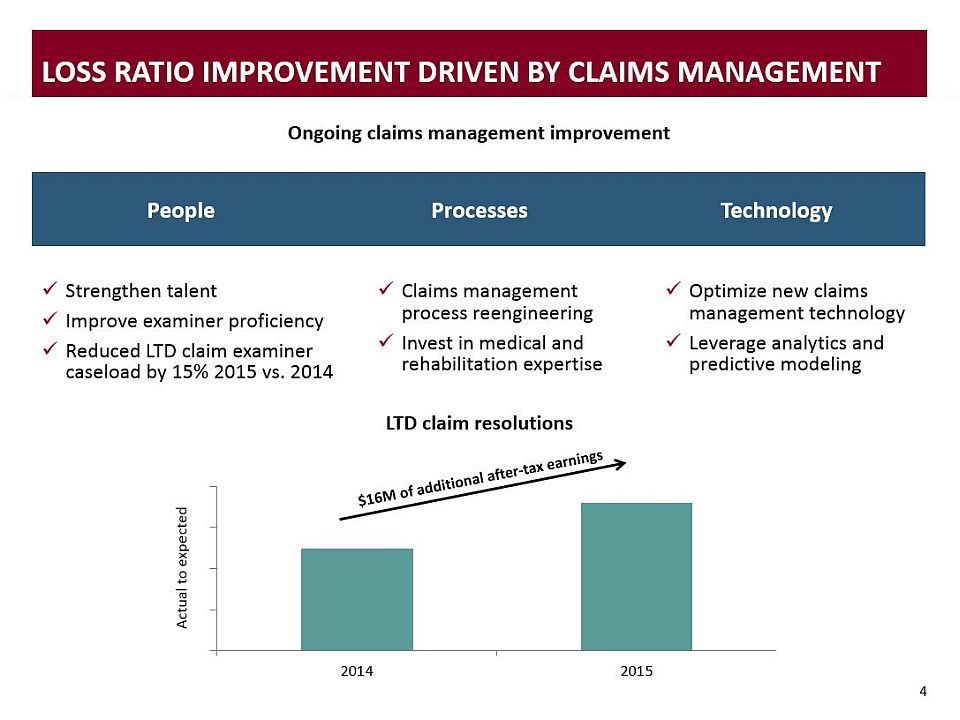
4 Loss Ratio improvement Driven by Claims Management Optimize new claims management technologyLeverage analytics and predictive modeling Strengthen talentImprove examiner proficiencyReduced LTD claim examiner caseload by 15% 2015 vs. 2014 Claims management process reengineeringInvest in medical and rehabilitation expertise Technology People Processes Ongoing claims management improvement LTD claim resolutions

5 RECENT record of Loss Ratio and Earnings Improvement Path to recovery continuesImproved loss ratio driven by pricing discipline and effective claims management Success led to significant earnings growth; progress towards target marginContinue to drive loss ratios to long-term levels in the low 70% range Significant growth in earnings Up 87% Improvement in loss ratio Down 300 bps
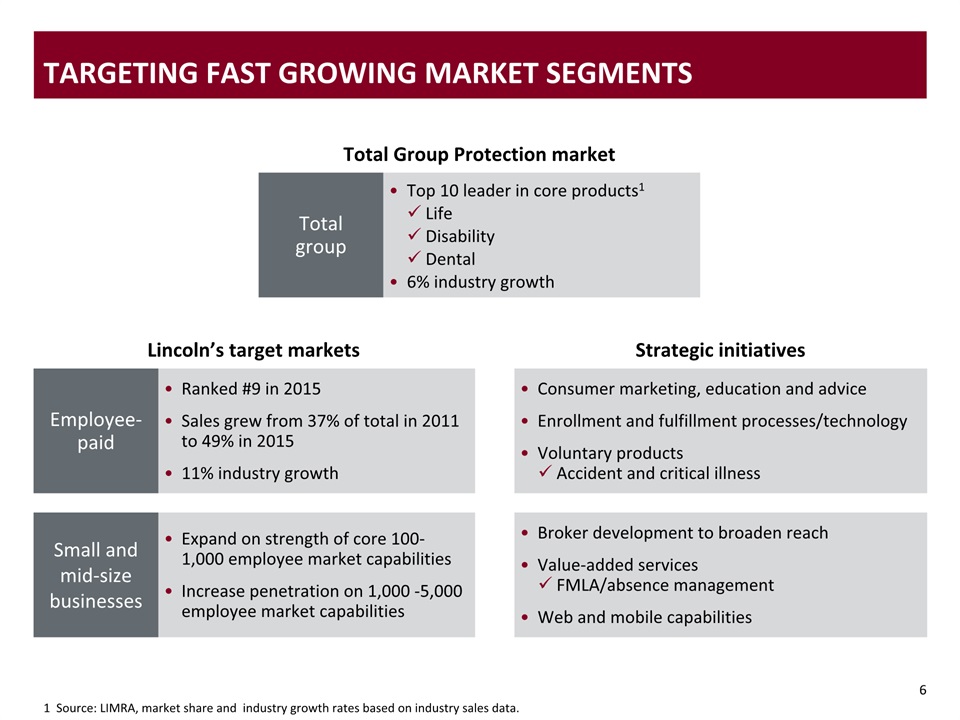
6 Targeting Fast Growing Market Segments 1 Source: LIMRA, market share and industry growth rates based on industry sales data. Ranked #9 in 2015Sales grew from 37% of total in 2011 to 49% in 201511% industry growth Expand on strength of core 100-1,000 employee market capabilitiesIncrease penetration on 1,000 -5,000 employee market capabilities Total Group Protection market Lincoln’s target markets Small and mid-size businesses Total group Top 10 leader in core products1LifeDisabilityDental6% industry growth Employee-paid Strategic initiatives Consumer marketing, education and adviceEnrollment and fulfillment processes/technologyVoluntary products Accident and critical illness Broker development to broaden reachValue-added services FMLA/absence managementWeb and mobile capabilities
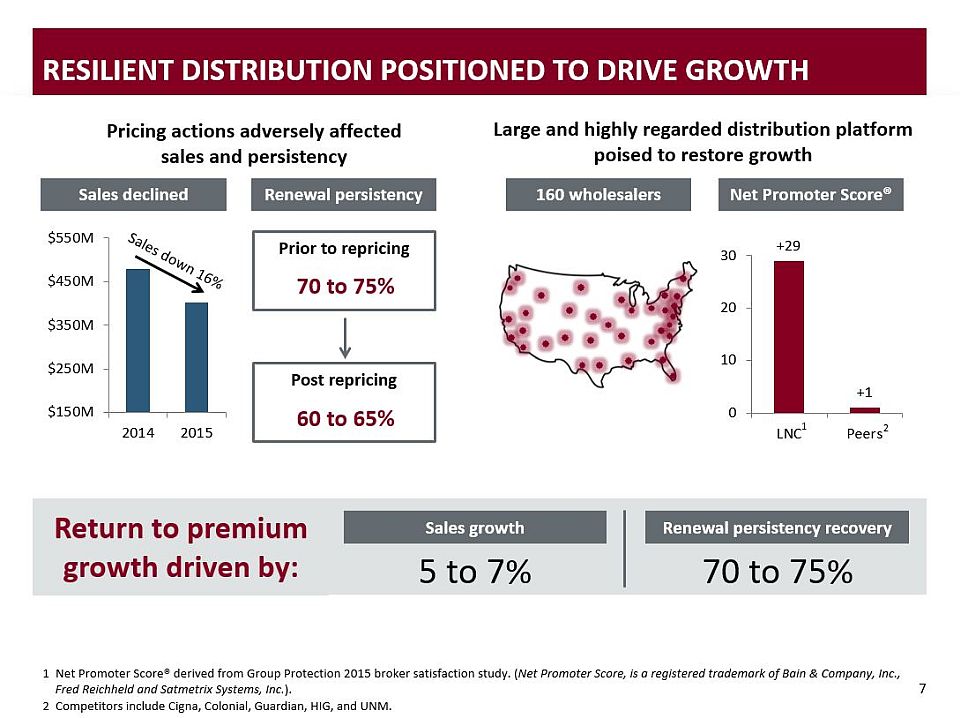
7 Resilient Distribution positioned to drive growth Consumer marketingData and analyticsEducation and adviceCustomer buying experience Service deliveryOnboarding process and data exchangeSelling and renewal processesValue added services – absence management 2 Pricing actions adversely affected sales and persistency Large and highly regarded distribution platformpoised to restore growth 1 5 to 7% Sales growth Renewal persistency recovery 70 to 75% Return to premium growth driven by: Sales declined Renewal persistency Prior to repricing 70 to 75% Post repricing 60 to 65% 160 wholesalers Net Promoter Score® 1 Net Promoter Score® derived from Group Protection 2015 broker satisfaction study. (Net Promoter Score, is a registered trademark of Bain & Company, Inc., Fred Reichheld and Satmetrix Systems, Inc.).2 Competitors include Cigna, Colonial, Guardian, HIG, and UNM.
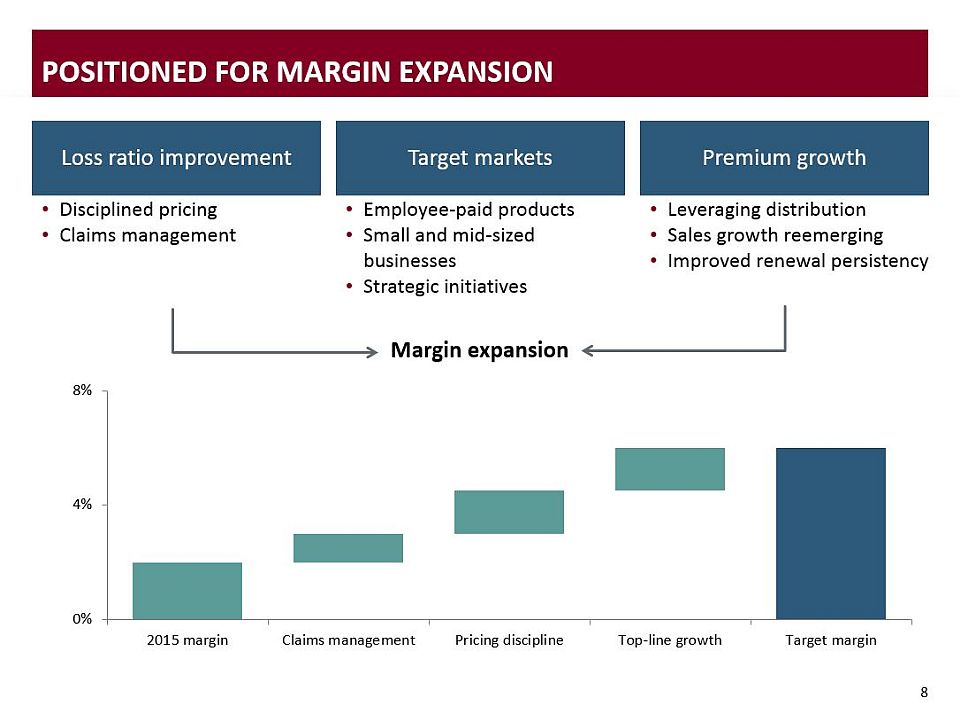
8 Positioned for Margin Expansion Loss ratio improvement Premium growth Target markets Disciplined pricingClaims management Employee-paid productsSmall and mid-sized businessesStrategic initiatives Leveraging distributionSales growth reemergingImproved renewal persistency Margin expansion
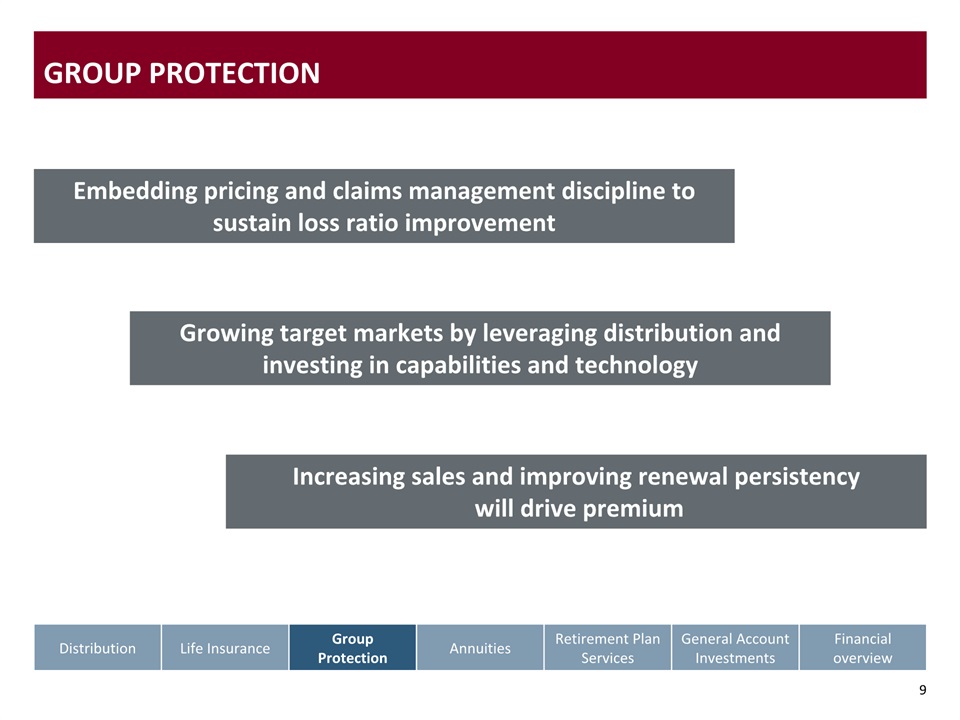
9 Group Protection Growing target markets by leveraging distribution and investing in capabilities and technology Embedding pricing and claims management discipline to sustain loss ratio improvement Increasing sales and improving renewal persistency will drive premium Distribution Life Insurance Group Protection Annuities Retirement Plan Services General AccountInvestments Financial overview

Will Fuller | President, Annuities, Lincoln Financial Distribution and Lincoln Financial Network Annuities 2016 Conference for Analysts, Investors and Bankers

2 annuities OUR BUSINESS MODEL DELIVERS CONSISTENT AND IMPRESSIVE RESULTS THROUGH A DISCIPLINED APPROACH TO THE ANNUITY BUSINESS Quality book of business resulting from our strategy of consistency and selling on our termsIndustry leading end-to-end risk management with proven resultsLeveraging our best-in-class distribution and diverse product portfolio to win Distribution Life Insurance Group Protection Annuities Retirement Plan Services General AccountInvestments Financial overview
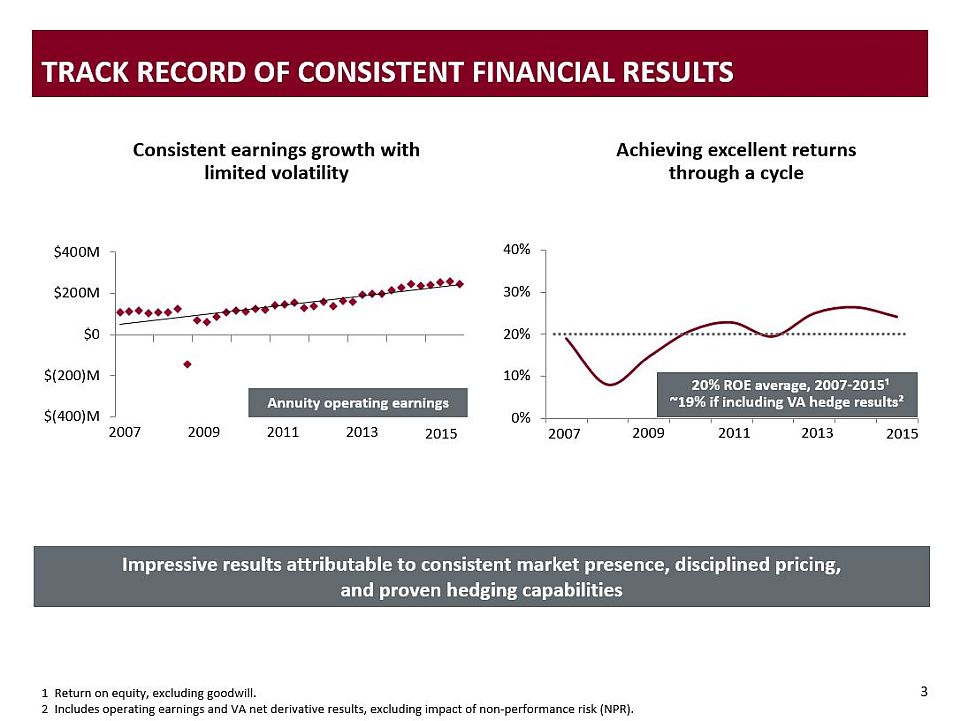
3 Track record of consistent financial results Consistent earnings growth with limited volatility Achieving excellent returns through a cycle 2007 2009 2011 2013 2015 2007 2009 2011 2013 2015 Annuity operating earnings 1 Return on equity, excluding goodwill.2 Includes operating earnings and VA net derivative results, excluding impact of non-performance risk (NPR). 20% ROE average, 2007-2015¹~19% if including VA hedge results² Impressive results attributable to consistent market presence, disciplined pricing, and proven hedging capabilities
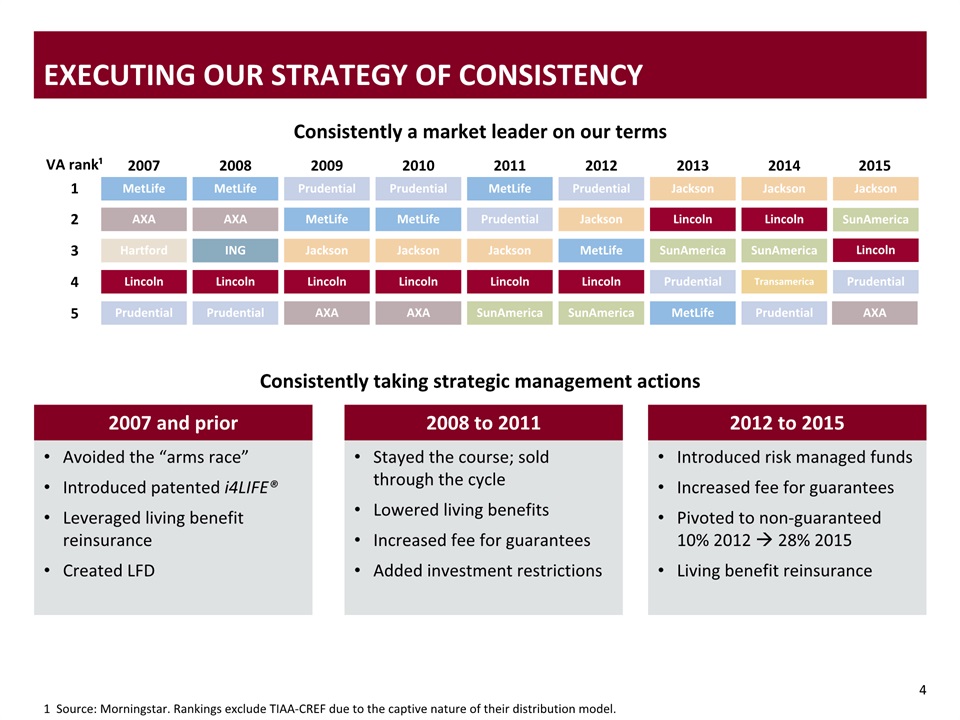
4 Executing our strategy of consistency Avoided the “arms race”Introduced patented i4LIFE®Leveraged living benefit reinsuranceCreated LFD 2007 and prior Stayed the course; sold through the cycleLowered living benefitsIncreased fee for guaranteesAdded investment restrictions 2008 to 2011 Introduced risk managed fundsIncreased fee for guaranteesPivoted to non-guaranteed 10% 2012 28% 2015Living benefit reinsurance 2012 to 2015 Consistently taking strategic management actions Consistently a market leader on our terms 1 4 5 3 2 Prudential Jackson MetLife Lincoln SunAmerica MetLife AXA ING Lincoln Prudential MetLife AXA Hartford Lincoln Prudential MetLife Prudential Jackson Lincoln SunAmerica Jackson Lincoln SunAmerica Transamerica Prudential Jackson Lincoln SunAmerica Prudential MetLife Prudential MetLife Jackson Lincoln AXA Prudential MetLife Jackson Lincoln AXA Jackson Lincoln SunAmerica Prudential AXA 2007 2008 2009 2010 2011 2012 2013 2014 2015 1 Source: Morningstar. Rankings exclude TIAA-CREF due to the captive nature of their distribution model. VA rank¹
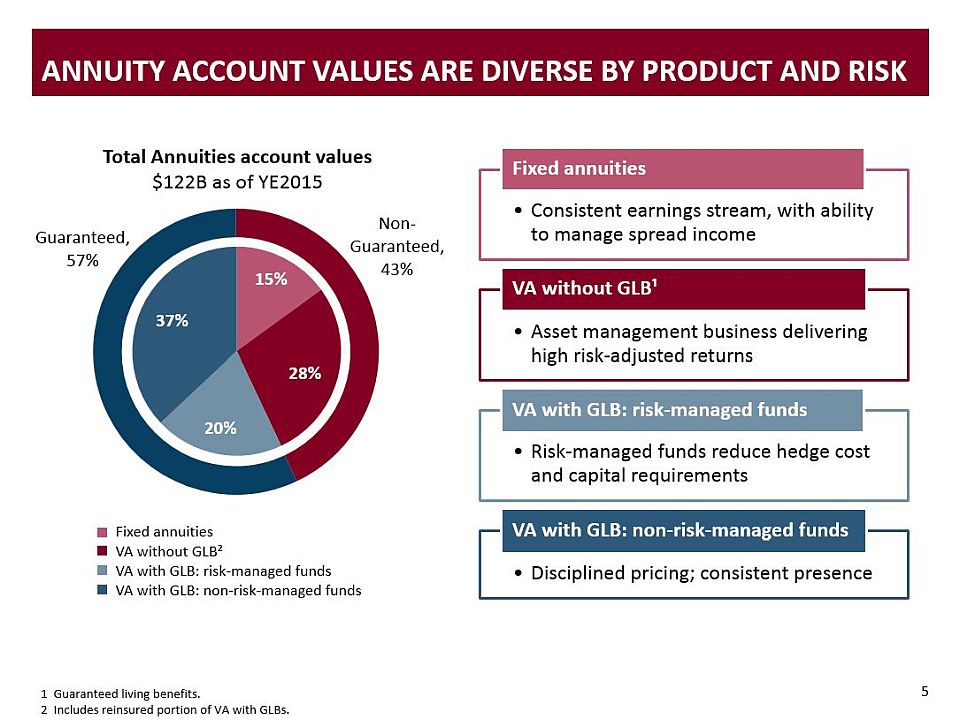
Total Annuities account values $122B as of YE2015 5 Annuity account values are diverse by product and risk Fixed annuities VA without GLB² VA with GLB: risk-managed fundsVA with GLB: non-risk-managed funds 1 Guaranteed living benefits.2 Includes reinsured portion of VA with GLBs.

Sorted by range of VA sales as % of beginning account value, 2008-20151 6 Consistency and discipline lead to a high quality book Tight range mitigates market timing risk Consistent relationships with distribution partnersDollar cost averaging across market cyclesDisciplined pricing and management actions limit our risk exposure GLB net amount at risk as % of AV2 We have a low risk VA book Lincoln 0.9% Peer average36.1% 1 Source: Morningstar. 2 Total Annuities account values and net amounts at risk as of 12/31/2015.3 Peers include AIG, AXA, Aegon, AMP, HIG, Jackson, MET, PRU and VOYA.
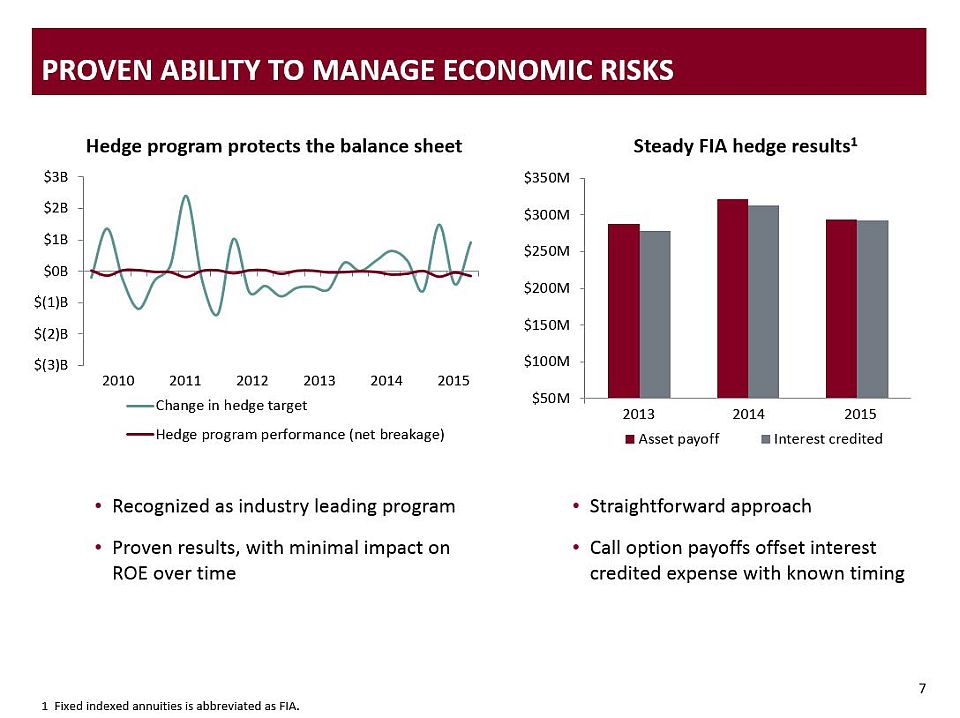
7 Proven ability to manage economic risks Hedge program protects the balance sheet Recognized as industry leading programProven results, with minimal impact on ROE over time Steady FIA hedge results1 2014 2013 2015 1 Fixed indexed annuities is abbreviated as FIA. Straightforward approachCall option payoffs offset interest credited expense with known timing 2010 2011 2012 2013 2014 2015

■ Actual ■ Expected 8 Industry leading assumption setting practices Long history of setting reasonable assumptionsRobust annual assumption reviewsEnhanced assumption analytics applied to entire in-force VA book in 2012Leverages Lincoln experience combined with third party expertise (Oliver Wyman, Towers Watson)Factor-based dynamic modeling with 1% lapse floor 1 Rate of full surrenders for VA living benefit policies from 2013-2015.2 Average percent of VA guarantee withdrawal benefit policyholders initiating income in each year from 2013-2015.3 Deaths per 1,000 policies for VA living benefit policies, from 2012-2014.4 Net income unlocking estimates based upon 3/31/2016 reserve and DAC models. Reflects sensitivities applied to the full variable annuity book.5 Not all policyholders utilize their guarantee withdrawal benefits. This sensitivity assumes all policyholders utilize guarantees by policy year 20. Utilization² Lapses¹ Mortality³ Scenario Unlocking⁴ 50% drop in lapse rates $(50)M Full utilization⁵ $(160)M 20% reduction in mortality $(90)M Assumptions in line with actual experience Severe sensitivities produce modest impacts
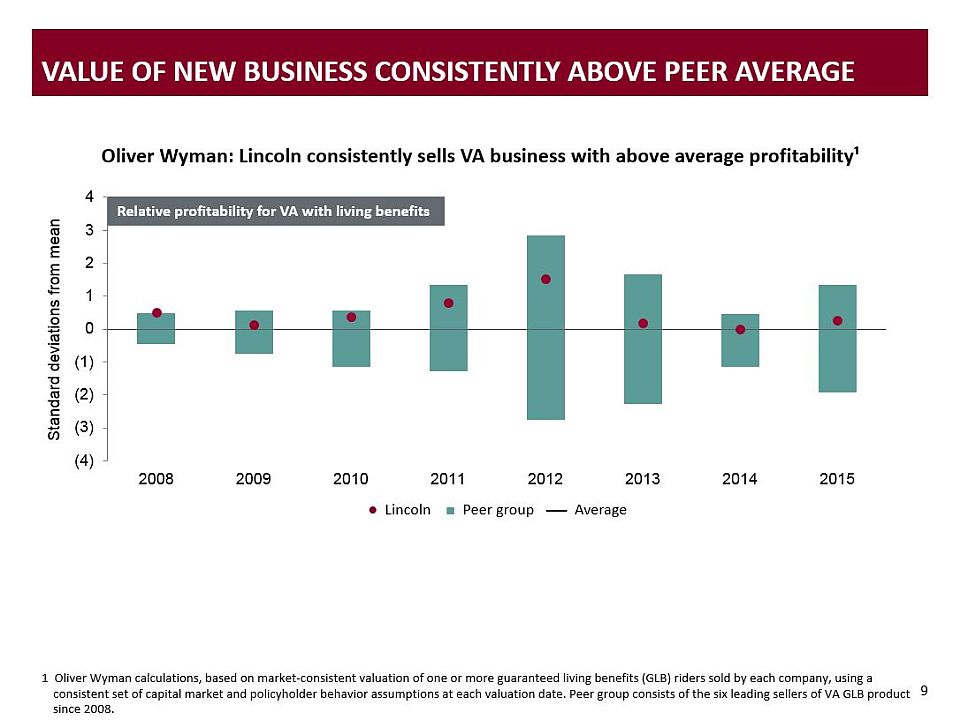
Value of new business consistently above peer average Oliver Wyman: Lincoln consistently sells VA business with above average profitability¹ Relative profitability for VA with living benefits 9 ● Lincoln ■ Peer group Average 1 Oliver Wyman calculations, based on market‐consistent valuation of one or more guaranteed living benefits (GLB) riders sold by each company, using a consistent set of capital market and policyholder behavior assumptions at each valuation date. Peer group consists of the six leading sellers of VA GLB product since 2008.

10 consumer needs and demographics support growth 1 Source: 2016 McKinsey & Company, Life Insurance Trends and Implications; ages 55+ included.2 Source: 2013 Gallup Organization Survey. Near-term headwinds Long-term fundamental tailwinds 2014 2015 S&P 500 30yr treasury Variable annuity sales pressured by combination of low rates and volatile equity markets Retirees underestimate life expectancy; longevity is risk to retirement security As near-term headwinds subside, increasing emphasis on retirement security and need for guaranteed lifetime income will drive future growth 80% of annuity owners purchase for guaranteed lifetime income² Retirees’ ownership of investable assets to grow to 80% by 2025¹ 2016 Low rates
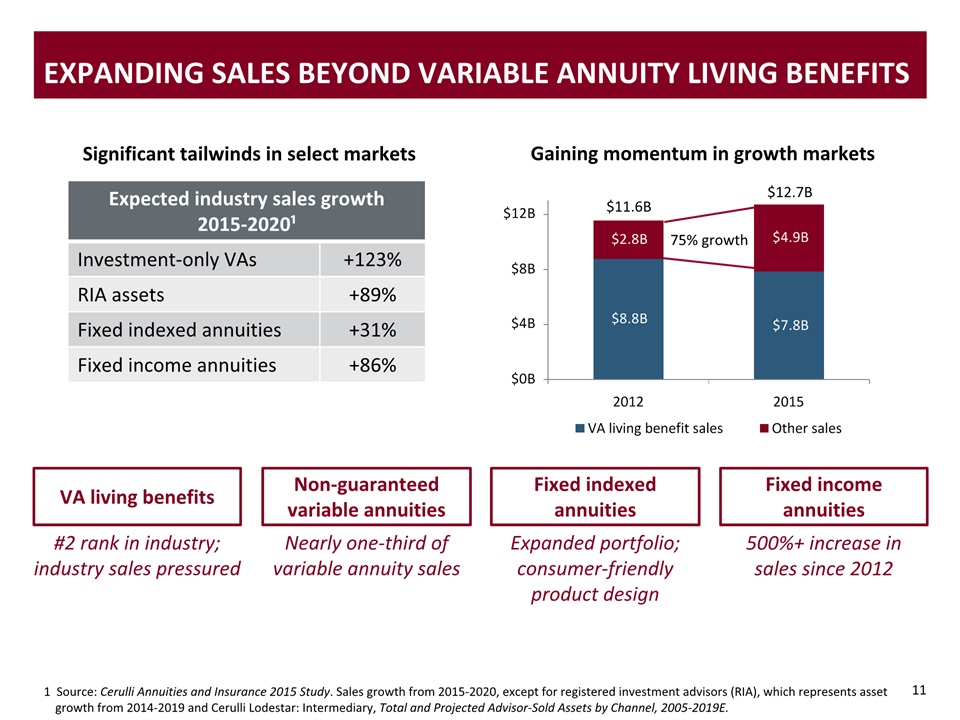
11 Expanding sales beyond variable annuity living benefits 11 Significant tailwinds in select markets 500%+ increase in sales since 2012 Fixed income annuities Fixed indexed annuities Expanded portfolio; consumer-friendly product design Non-guaranteed variable annuities Nearly one-third of variable annuity sales VA living benefits #2 rank in industry; industry sales pressured Total annuity sales Expected industry sales growth 2015-2020¹ Investment-only VAs +123% RIA assets +89% Fixed indexed annuities +31% Fixed income annuities +86% 1 Source: Cerulli Annuities and Insurance 2015 Study. Sales growth from 2015-2020, except for registered investment advisors (RIA), which represents asset growth from 2014-2019 and Cerulli Lodestar: Intermediary, Total and Projected Advisor-Sold Assets by Channel, 2005-2019E. Gaining momentum in growth markets 75% growth $11.6B $12.7B
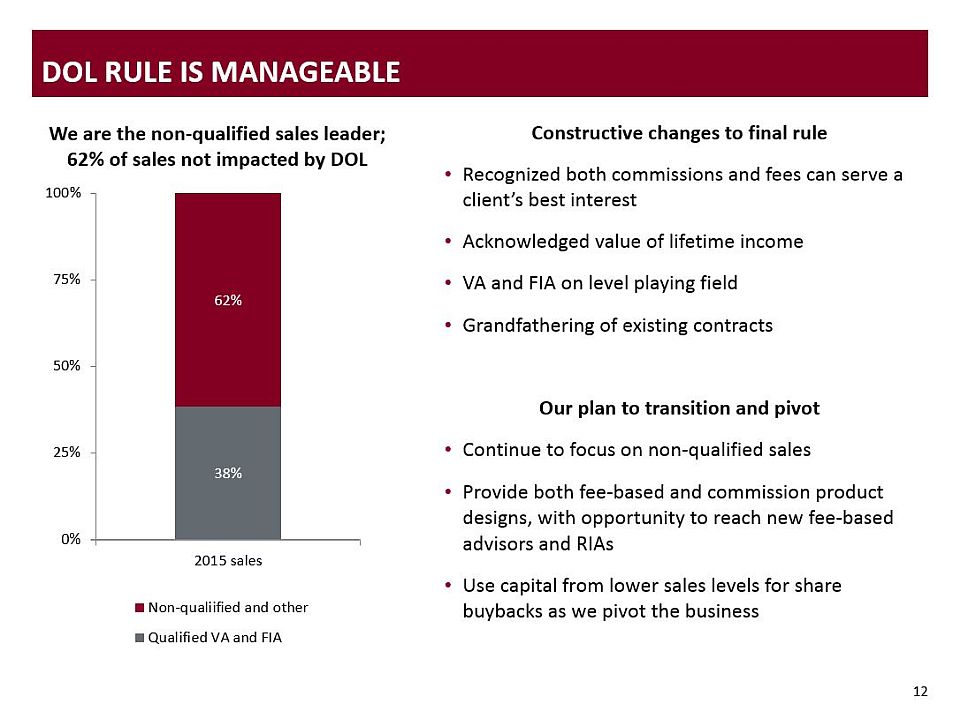
12 DOL rule is manageable Constructive changes to final ruleRecognized both commissions and fees can serve a client’s best interestAcknowledged value of lifetime incomeVA and FIA on level playing fieldGrandfathering of existing contractsOur plan to transition and pivotContinue to focus on non-qualified sales Provide both fee-based and commission product designs, with opportunity to reach new fee-based advisors and RIAsUse capital from lower sales levels for share buybacks as we pivot the business We are the non-qualified sales leader; 62% of sales not impacted by DOL

Investor Advantage® - successful investment oriented VAFee-based for American Legacy® & ChoicePlus VA & FIAExpanded FIA - shorter surrender periods and new indices Fixed indexed - consumer friendly indexed annuitySPIA -highest lifetime income opportunityDeferred income annuity - QLAC1 endorsement for IRA’s American Legacy® - low cost, only single manager VAChoicePlus - multiple investor manager VAi4LIFE® - patented income with tax advantage 13 Leveraging our strengths Industry leading distribution 300Proven ability to pivot Large advisor base 49,000+9% 2010-2015 active producers wholesalers Core VA Core FA New products Compelling solution for fee-based advisors and RIAPassive investment optionsInnovative lifetime income guarantees Upcoming product innovation 1 Qualified longevity annuity contract is abbreviated as QLAC.
14 annuities Industry leading end-to-end risk management with proven results Quality book of business resulting from our strategy of consistency and selling on our terms Leveraging our best-in-class distribution and diverse product portfolio to win Distribution Life Insurance Group Protection Annuities Retirement Plan Services General AccountInvestments Financial overview

Mark Konen | President, Insurance and Retirement Solutions Retirement Plan Services 2016 Conference for Analysts, Investors and Bankers

2 Retirement plan services OUR VALUE PROPOSITION IS RESONATING IN THE MARKETS WE TARGET AS EVIDENCED BY SUCCESS WE’RE SEEING IN SALES AND NET FLOWS Growing and gaining scale in target markets: government, healthcare and small marketOur differentiated customer experience attracts new business and grows our in-forceTaking profitable actions to reduce impacts of continued low interest rates Distribution Life Insurance Group Protection Annuities Retirement Plan Services General AccountInvestments Financial overview
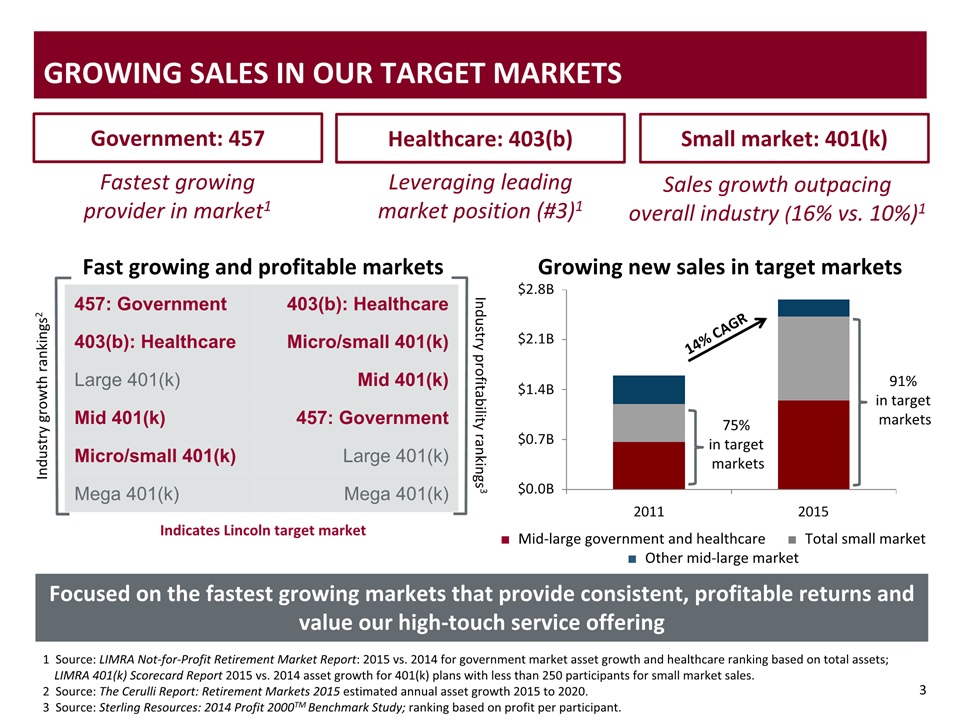
3 Government: 457 Healthcare: 403(b) Small market: 401(k) Focused on the fastest growing markets that provide consistent, profitable returns and value our high-touch service offering Fastest growing provider in market1 Leveraging leading market position (#3)1 Sales growth outpacing overall industry (16% vs. 10%)1 Growing Sales in our Target Markets 3 1 Source: LIMRA Not-for-Profit Retirement Market Report: 2015 vs. 2014 for government market asset growth and healthcare ranking based on total assets; LIMRA 401(k) Scorecard Report 2015 vs. 2014 asset growth for 401(k) plans with less than 250 participants for small market sales.2 Source: The Cerulli Report: Retirement Markets 2015 estimated annual asset growth 2015 to 2020. 3 Source: Sterling Resources: 2014 Profit 2000TM Benchmark Study; ranking based on profit per participant. Growing new sales in target markets ■ Mid-large government and healthcare ■ Total small market■ Other mid-large market 91% in target markets 75% in target markets 14% CAGR Industry growth rankings2 Industry profitability rankings3 Fast growing and profitable markets 457: Government 403(b): Healthcare 403(b): Healthcare Micro/small 401(k) Large 401(k) Mid 401(k) Mid 401(k) 457: Government Micro/small 401(k) Large 401(k) Mega 401(k) Mega 401(k) Indicates Lincoln target market

4 Impact of DOL Fiduciary Rule Manageable 1 Best interest contract exemption is abbreviated as BIC.

5 Actions to Grow Sales And Drive Positive Flows Shifting mix of business to drive more consistent positive flows Accelerating growth with targeted strategic actions Expansion Strategic partners Product development Customer experience Expanding and upgrading distribution force across all markets30% growth since 2011 Deepening strategic partnerships to support small market growth 53% of 2015 sales versus 25% in 2011 Launch of enhanced small market Lincoln DirectorSM product Owning and investing in the customer experience

Participants who meet 1-on-1 with our retirement consultants 30% 2X Larger increases in their contribution rate More likely to increase contributions Increases in the advisors and consultants doing repeat business 6 Driving Results Through our Customer Experience Participants Plan sponsors Intermediaries 1 Source: Sterling Resources 2014 Profit 2000TM; based on average lapse rates for 2011 to 2014. Lower termination rates compared to the marketplace1 In-person relationships Research and analytics Digital and mobile capabilities Engaging participants with: retirement consultants Gaining insight from: participant engagement study Driving activity through: an action oriented website Customer experience

7 Enhancing the digital experience Mobile optimized - consistent experience on any deviceStreamlined design and intuitive navigation“Retirement income” snapshot that includes an income estimate and planning tool“Click-to-contribute” functionality, which makes it easier for participants to take action Improving our customer experience by investing in our digital and mobile capabilities New website designed to improve engagement with participants – leading to new enrollments, higher contribution rates, and more deposits

8 Moderating expense growth Profitable actions to drive the bottom line Disciplined focus on modest expensegrowthShifting investment from infrastructure investments to growth-oriented areas like distribution and client facing teams Infrastructure investments Focused investments and expense efficiency In-force optimizationActively repricing clients focused on lowering guaranteed minimum interest rates (GMIR)Since 2013: 128 clients repriced $7M increase to annual earnings Growing low GMIR business % of mid-large and small market business at 1% GMIR
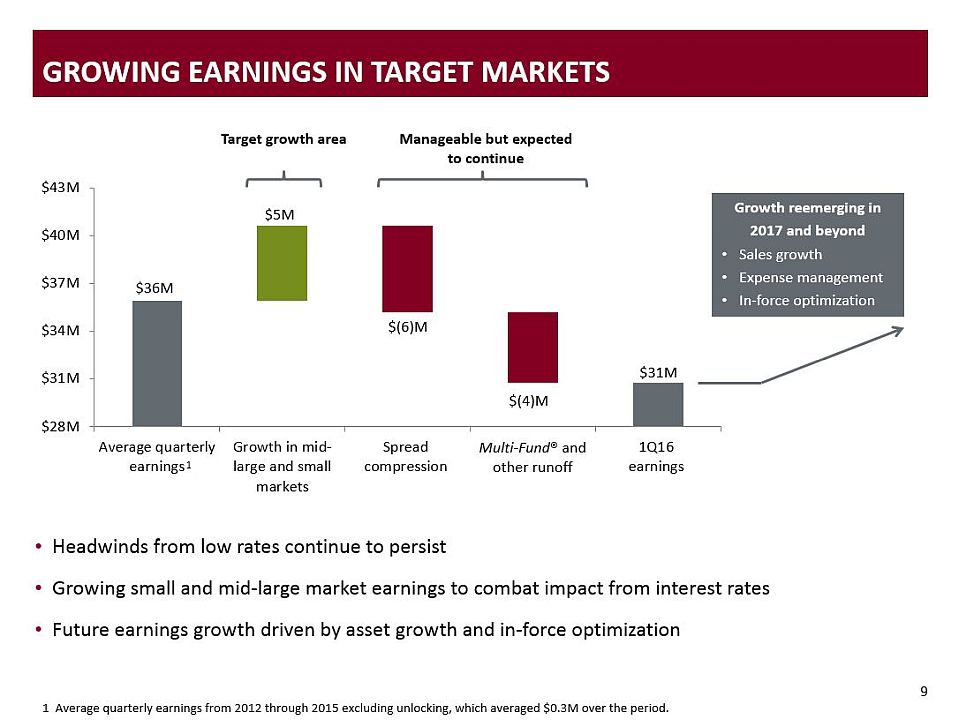
9 Growing Earnings in Target Markets Headwinds from low rates continue to persistGrowing small and mid-large market earnings to combat impact from interest rates Future earnings growth driven by asset growth and in-force optimization Multi-Fund® and other runoff 1 Average quarterly earnings from 2012 through 2015 excluding unlocking, which averaged $0.3M over the period. Target growth area Manageable but expected to continue Growth reemerging in2017 and beyondSales growthExpense managementIn-force optimization 1
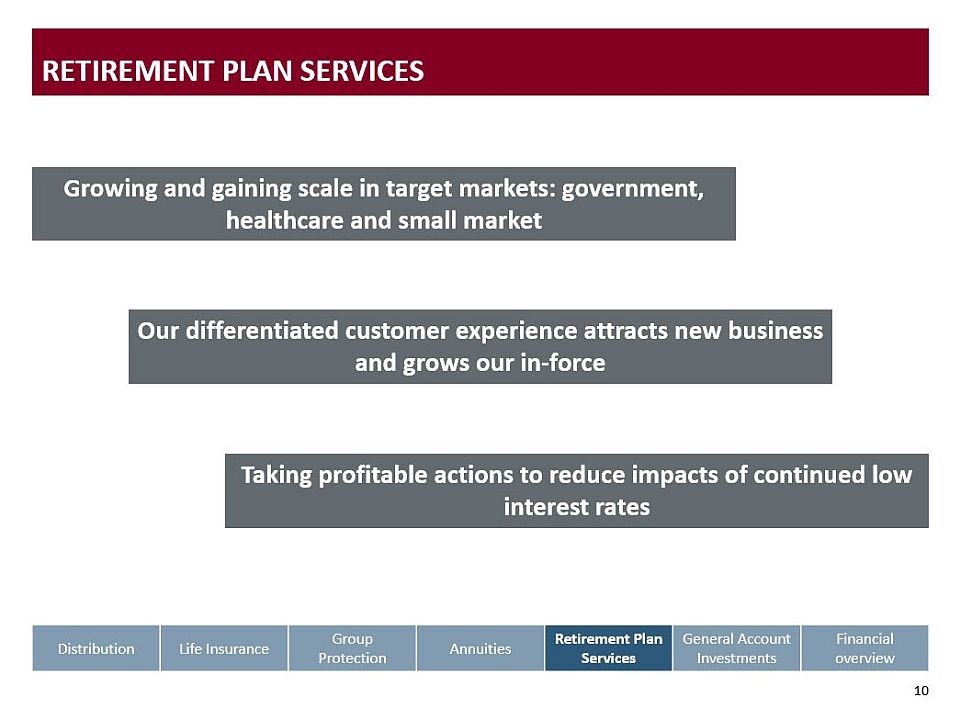
10 Retirement Plan Services Our differentiated customer experience attracts new business and grows our in-force Growing and gaining scale in target markets: government, healthcare and small market Taking profitable actions to reduce impacts of continued low interest rates Distribution Life Insurance Group Protection Annuities Retirement Plan Services General AccountInvestments Financial overview

©2016 Lincoln National Corporation June 9, 2016 Ellen Cooper | Executive Vice President and Chief Investment Officer General Account Investments 2016 CONFERENCE FOR ANALYSTS, INVESTORS AND BANKERS
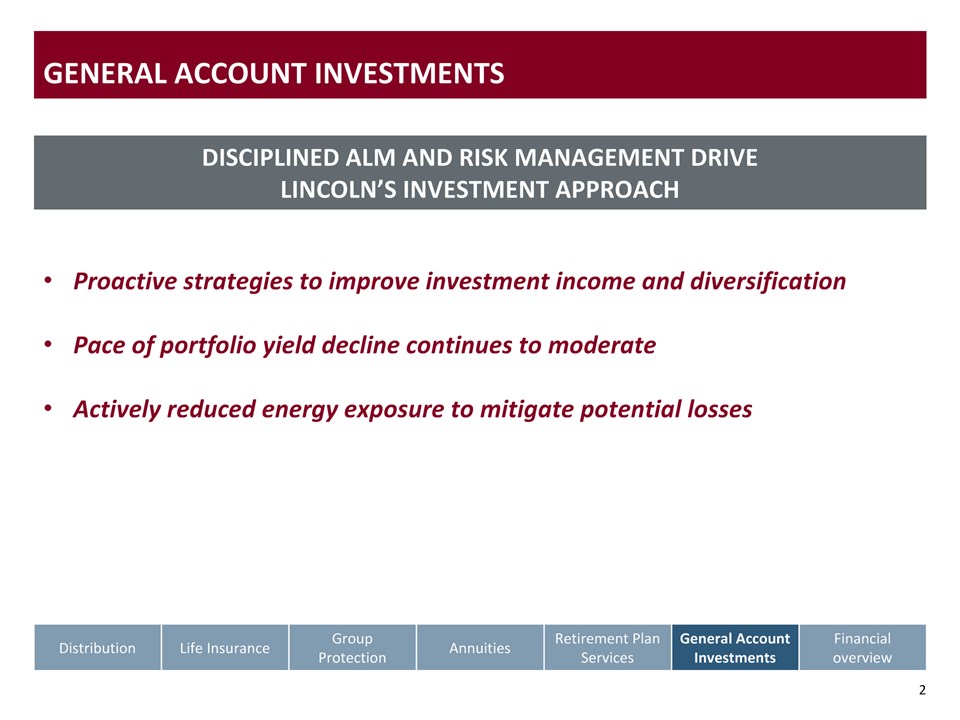
* GENERAL ACCOUNT INVESTMENTS DISCIPLINED ALM AND RISK MANAGEMENT DRIVELINCOLN’S INVESTMENT APPROACH Proactive strategies to improve investment income and diversificationPace of portfolio yield decline continues to moderateActively reduced energy exposure to mitigate potential losses Distribution Life Insurance Group Protection Annuities Retirement Plan Services General AccountInvestments Financial overview
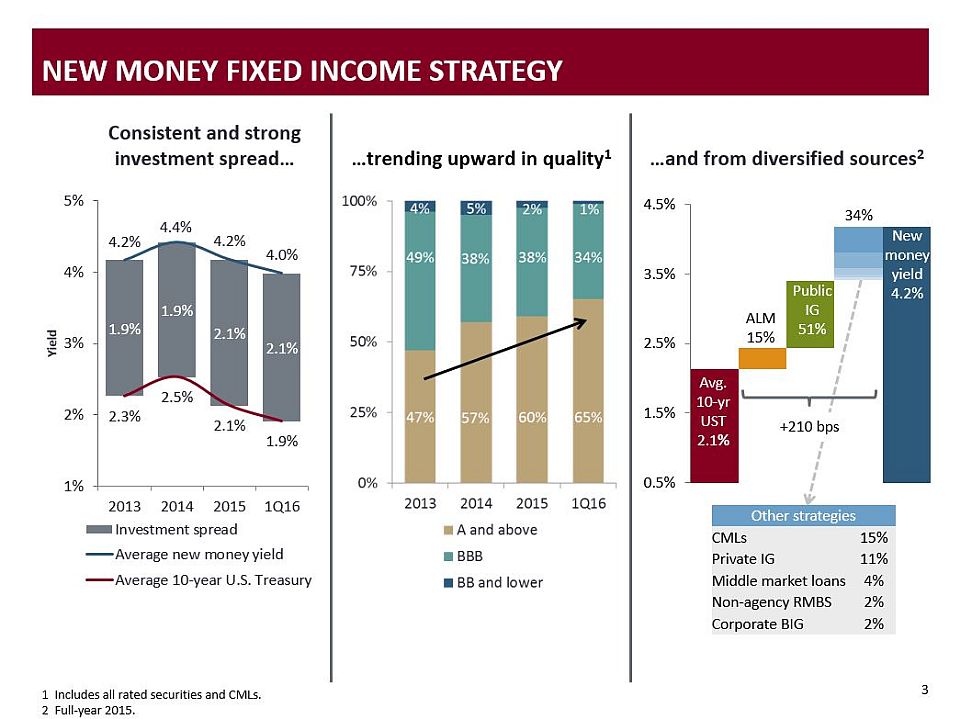
1 Includes all rated securities and CMLs.2 Full-year 2015. Newmoney yield4.2% ALM15% Avg.10-yrUST2.1% PublicIG51% 34% CMLsPrivate IGMid market loansNon-agency RMBSCorporate BIG +210 bps * NEW MONEY FIXED INCOME STRATEGY New money yields consistently 1.8-2.0% over the average 10 Yr. US Treasury and 1Q is even higherStrong new money spreads have helped offset the headwinds from the low rate environment Higher quality purchase mixIncrease in CML allocationHigh qualityImproved diversification Consistent and strong investment spread… …and from diversified sources2 …trending upward in quality1 CMLs (15%) Private IG (11%) Middle market loans (4%) Non-agency RMBS (2%) Corporate BIG (2%) Other strategies Other strategies CMLs 15% Private IG 11% Middle market loans 4% Non-agency RMBS 2% Corporate BIG 2%
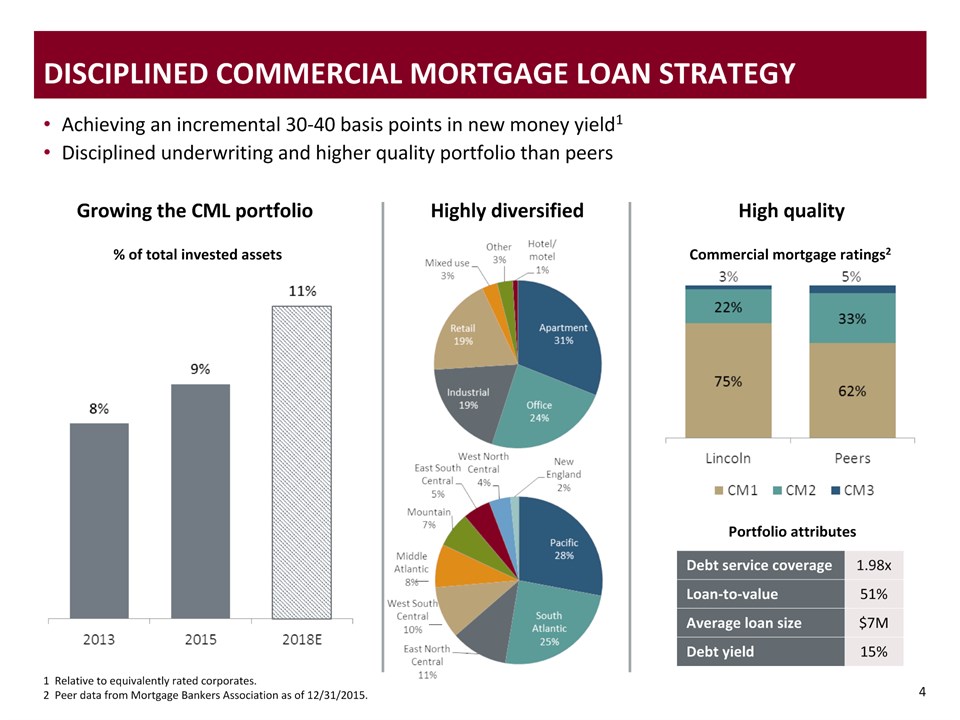
DISCIPLINED COMMERCIAL MORTGAGE LOAN STRATEGY Growing the CML portfolio * Debt service coverage 1.98x Loan-to-value 51% Average loan size $7M Debt yield 15% Highly diversified High quality Portfolio attributes Achieving an incremental 30-40 basis points in new money yield1Disciplined underwriting and higher quality portfolio than peers 1 Relative to equivalently rated corporates.2 Peer data from Mortgage Bankers Association as of 12/31/2015. Commercial mortgage ratings2 % of total invested assets

* GROWING THE ALTERNATIVES PORTFOLIO AND SHIFTING THE MIX Historical performance1 Shift the mix towards private equity 2015 2016E 2018E Hedge funds Private equity (% of alternatives portfolio) Achieved a 10% annualized return since 2012 1 Annualized quarterly data from 1Q12 through 1Q16. Income yield Volatility Private equity 12.6% 4.7% Hedge funds 4.4% 3.4% Alternatives portfolio 10.0% 3.6% Growing the alternatives portfolio from 1.3% to long-term target of 1.5% of total invested assets

WELL DIVERSIFIED AND HIGH QUALITY PORTFOLIO Average quality rating is A- Below investment grade assets: 5.6% of fixed income assets $98.1B total invested assetsNet unrealized gain of $5.5B on AFS assetsPortfolio is well diversified across sectors, issuers and asset classes * Asset class1 Credit quality1,2 Corporates Other asset classes 1 As of 3/31/2016.2 Includes AFS, trading, and credit linked notes; does not include CMLs. Mortgage loans 9% Municipals 4% Other structured 4% Cash and collateral 3% Agency RMBS 2% Quasi-sovereign 2% Alternatives 1% UST/agency 1% Other 1%
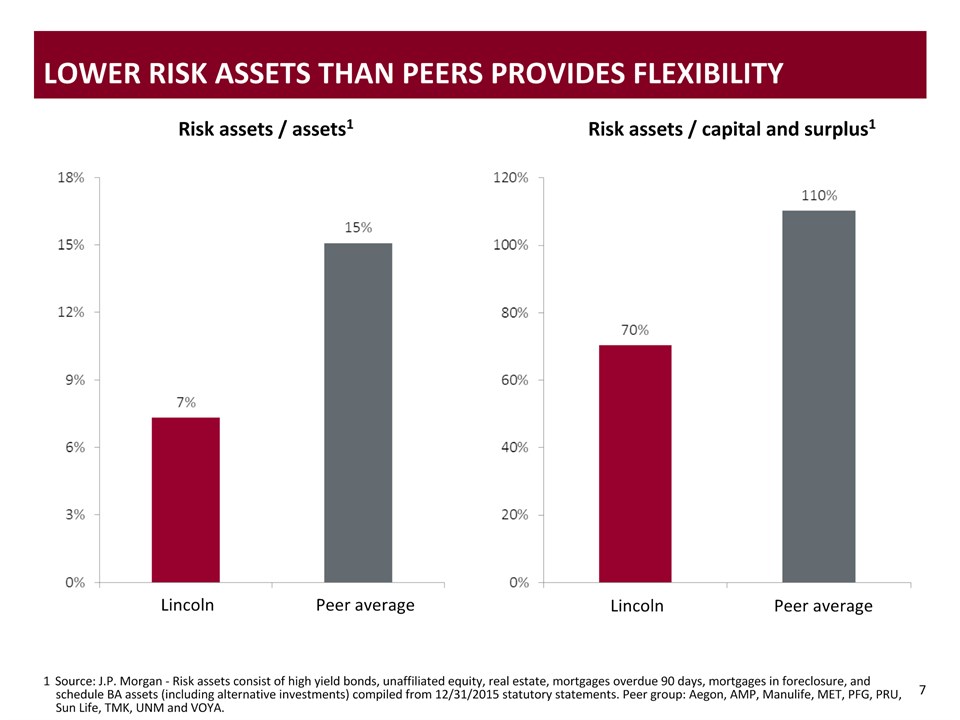
* LOWER RISK ASSETS THAN PEERS PROVIDES FLEXIBILITY 1 Source: J.P. Morgan - Risk assets consist of high yield bonds, unaffiliated equity, real estate, mortgages overdue 90 days, mortgages in foreclosure, and schedule BA assets (including alternative investments) compiled from 12/31/2015 statutory statements. Peer group: Aegon, AMP, Manulife, MET, PFG, PRU, Sun Life, TMK, UNM and VOYA. Risk assets / assets1 Risk assets / capital and surplus1 Lincoln Peer average Lincoln Peer average
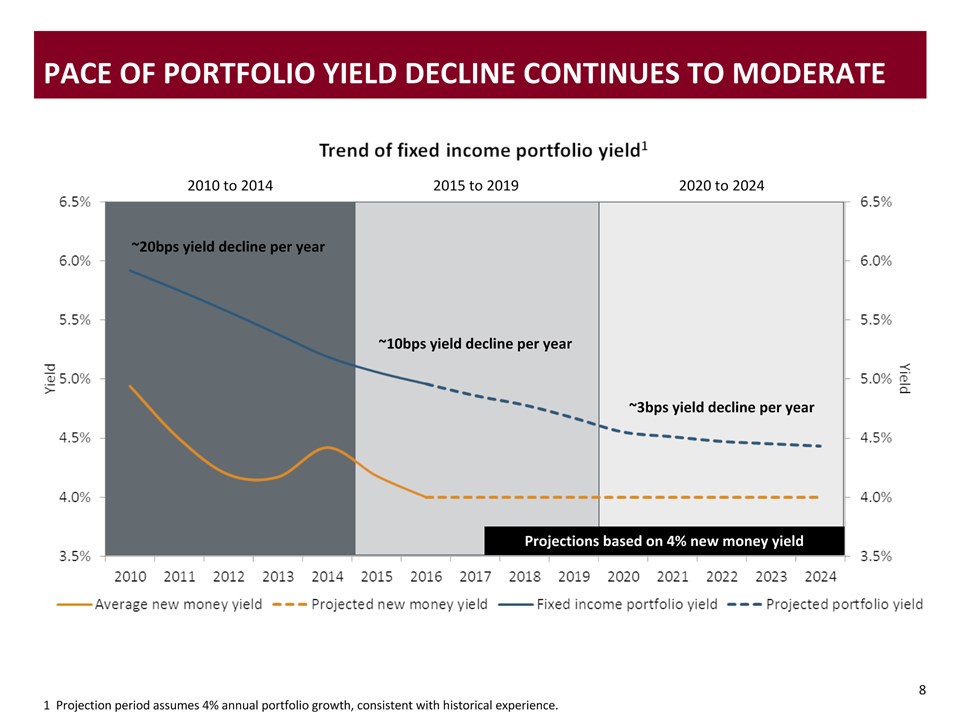
PACE OF PORTFOLIO YIELD DECLINE CONTINUES TO MODERATE Projections based on 4% new money yield * 1 Projection period assumes 4% annual portfolio growth, consistent with historical experience. 2010 to 2014 2015 to 2019 2020 to 2024 ~10bps yield decline per year ~3bps yield decline per year ~20bps yield decline per year

Sub-sectordiversification2 * Reduced fixed income energy exposure1 Credit quality2 1 As a percent of total invested assets.2 As of 3/31/2016. Proactively reduced our energy exposure primarily through sales~50% of securities sold are now rated below investment grade2 Energy portfolio remains diversified across sub-sectors 86% of energy exposure is investment grade 18% PROACTIVELY REDUCED ENERGY EXPOSURE

* Stress scenario assumptions Stress scenario projected losses1 Our sales targeted securities most likely to be at risk of a credit loss in a sustained period of low prices Name-by-name fundamental analysis to project losses in stress scenarios 1 Stress scenario projected losses are best estimates based on information available at the time of analysis. ■ Projected stress losses prior to de-risking■ Projected stress losses as of 4/30/16 Energy and metals and mining assumptions 4/30/16 price Stress scenario WTI oil ($/barrel) $46 $30 Iron ore ($/ton) $65 $30 Projection period - 4 years ENERGY AND METALS & MINING STRESS LOSSES ARE MANAGEABLE

* GENERAL ACCOUNT INVESTMENTS Pace of portfolio yield decline continues to moderate Proactive strategies to improve investment income and diversification Actively reduced energy exposure to mitigate potential losses Distribution Life Insurance Group Protection Annuities Retirement Plan Services General AccountInvestments Financial overview

Randy Freitag | Executive Vice President and Chief Financial Officer Financial overview 2016 Conference for Analysts, Investors and Bankers

2 Financial Overview Strong financial results and fundamentals not reflected in valuationGreater transparency on key focus areas of low rates and VAsConsistent capital generation and deployment with further flexibility Distribution LifeInsurance Group Protection Annuities Retirement Plan Services General AccountInvestments Financial overview STRONG, RESILIENT, REPEATABLE FINANCIAL RESULTS

3 3 Solid top and bottom line growth Operating EPS Strong EPS growth z Steady revenue growth with controlled expenses z 1 See Appendix for a reconciliation of non-GAAP measures to their most comparable GAAP measures. G&A as a percent of revenue represents general and administrative expenses, net of amounts capitalized, as a percent of operating revenue. Revenue growth and expense management driving earnings improvement1Operating revenues: 6% CAGRG&A as a % of revenue: down 110bpsOperating earnings: 9% CAGRCapital management enhancing EPS growth1 Reported operating EPS: 12% CAGROperating EPS, ex. notable items: 12% CAGROperating EPS, ex. notable items: $6.04 in 2015 Operating revenue G&A as a % of operating revenue 6% CAGR 110 bps 12% CAGR

4 4 Steady improvement in key stakeholder metrics valuation drivers Strong capital levels BVPS growth and ROE expansion Track record of improving valuation drivers1Book value per share (BVPS), ex. AOCI: 7% CAGROperating ROE: up 260bpsOperating ROE, ex. notable items: 12.2% in 2015 Peer analysis of ROE and BVPS regression implies undervalued by ~$12 per shareFurther fortified capital and liquidity positionsStatutory capital: $8.4B, 25% increaseRBC ratio: 487%, up 37 percentage pointsHolding company cash exceeds target of $500M 1 See Appendix for a reconciliation of non-GAAP measures to their most comparable GAAP measures. BVPS ex. AOCI ROE Statutory capital RBC ratio $1.7B capital increase 37 percentage point RBC increase 7% BVPS CAGR 260bps ROE increase
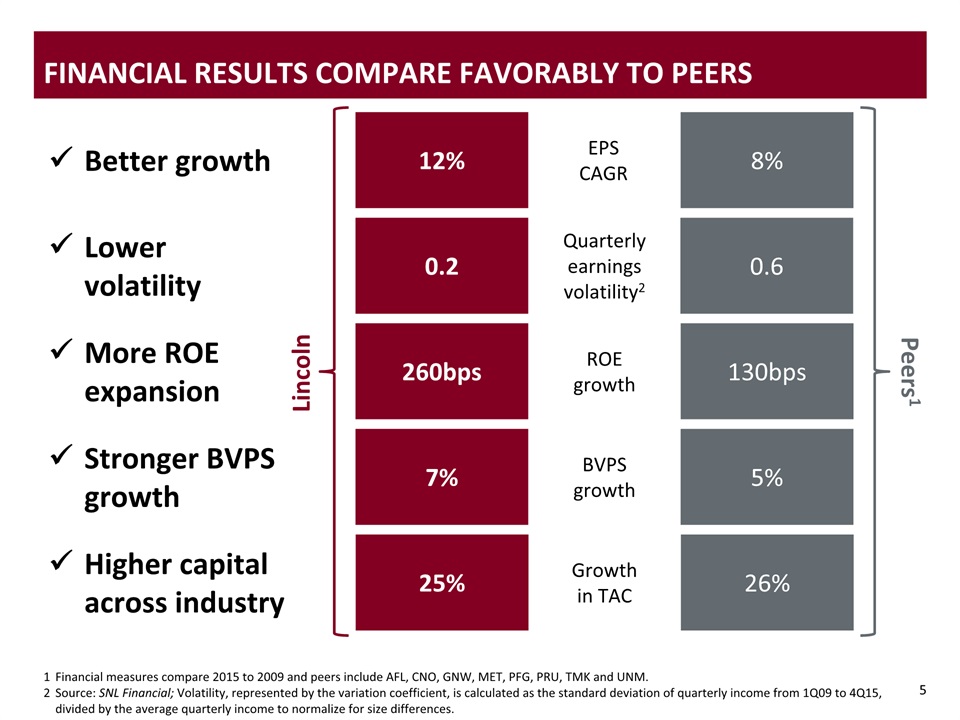
5 5 Financial results compare favorably to peers Financial measures compare 2015 to 2009 and peers include AFL, CNO, GNW, MET, PFG, PRU, TMK and UNM. Source: SNL Financial; Volatility, represented by the variation coefficient, is calculated as the standard deviation of quarterly income from 1Q09 to 4Q15, divided by the average quarterly income to normalize for size differences. Lower volatility Stronger BVPS growth More ROE expansion 0.2 7% 260bps 0.6 5% 130bps Lincoln Peers1 Better growth 12% 8% Higher capital across industry 25% 26% Quarterly earnings volatility2 BVPS growth ROE growth EPS CAGR Growth in TAC

6 Key drivers continue to support solid financial results Organic earnings Capital management Capital markets +2-4% +1-2% +4-5% (2-3)% +2-3% +0-1% Target~8-10% Capital market assumptions Equity markets6-8% total return Interest rates Remain at current levels Target annual EPS growth of 8 to 10%
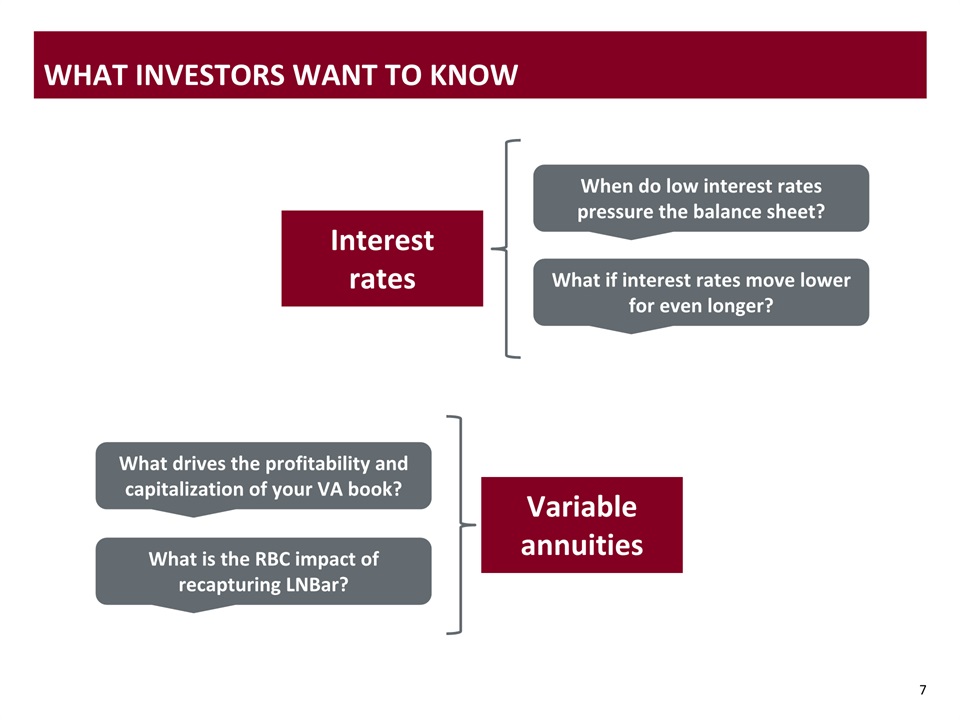
7 What investors want to know When do low interest rates pressure the balance sheet? What if interest rates move lower for even longer? What drives the profitability and capitalization of your VA book? What is the RBC impact of recapturing LNBar? Interest rates Variable annuities

Well positioned for low rate challenges 8 1 Spread compression is a percent of income from operations, excluding notable items. 1) New business returns 2) Spread compression1 3) Balance sheet 4-5% 2-3% Strength even in much lower interest rate scenarios Manageable EPS headwind and lower than prior years Repriced and repositioned products for low interest rates Currently earning 12-15% targeted returns across all segments 2013-2014 2015-2018E
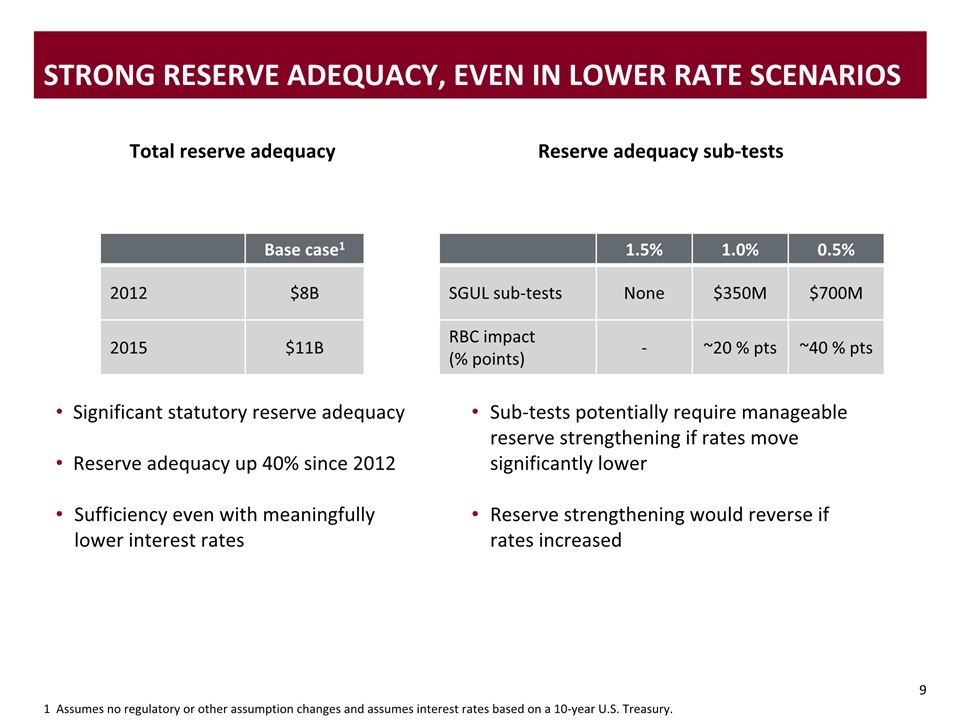
1 Assumes no regulatory or other assumption changes and assumes interest rates based on a 10-year U.S. Treasury. Strong Reserve Adequacy, even In lower rate scenarios Significant statutory reserve adequacyReserve adequacy up 40% since 2012Sufficiency even with meaningfully lower interest rates 9 Base case1 2012 $8B 2015 $11B 1.5% 1.0% 0.5% SGUL sub-tests None $350M $700M RBC impact (% points) - ~20 % pts ~40 % pts Sub-tests potentially require manageable reserve strengthening if rates move significantly lowerReserve strengthening would reverse if rates increased Total reserve adequacy Reserve adequacy sub-tests

10 Key components of a high quality annuity book More consistent level of sales Lower benefits Sorted by range of VA sales as % of beginning account value, 2008-20151 Robust hedge program 2010 2011 2012 2013 2014 2015 Implies NARlarger than LNC for products issued in 2008 4X 1 Source: Morningstar.2 Data provided by Oliver Wyman and represents the top variable annuity writers in each year. 2
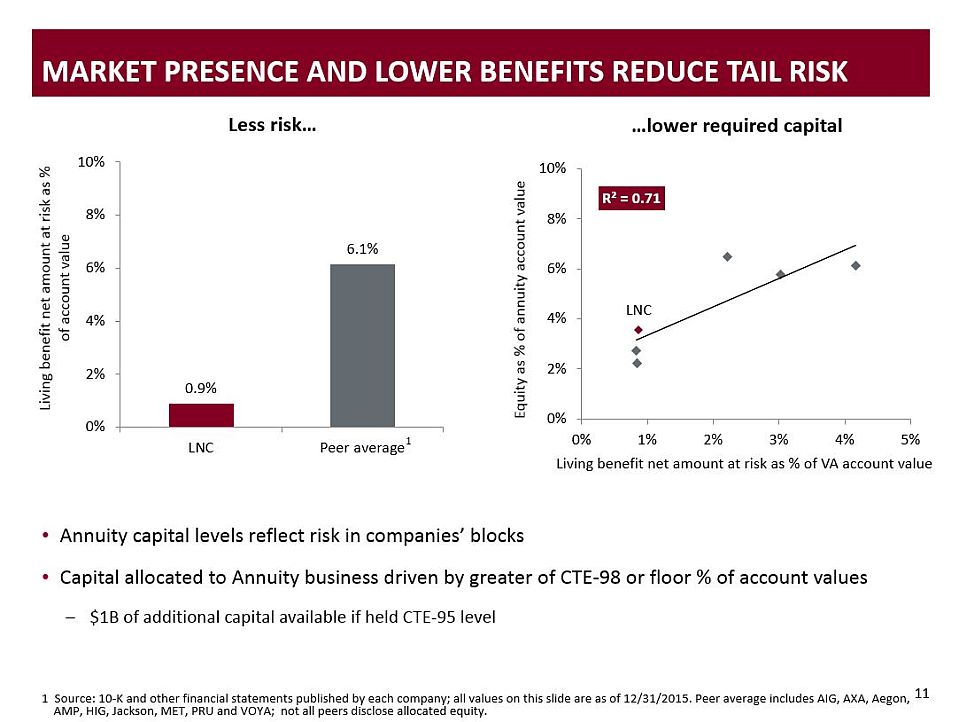
11 Market Presence and lower benefits reduce tail risk Less risk… 1 Source: 10-K and other financial statements published by each company; all values on this slide are as of 12/31/2015. Peer average includes AIG, AXA, Aegon, AMP, HIG, Jackson, MET, PRU and VOYA; not all peers disclose allocated equity. …lower required capital Annuity capital levels reflect risk in companies’ blocksCapital allocated to Annuity business driven by greater of CTE-98 or floor % of account values$1B of additional capital available if held CTE-95 level 1 Living benefit net amount at risk as % of VA account value
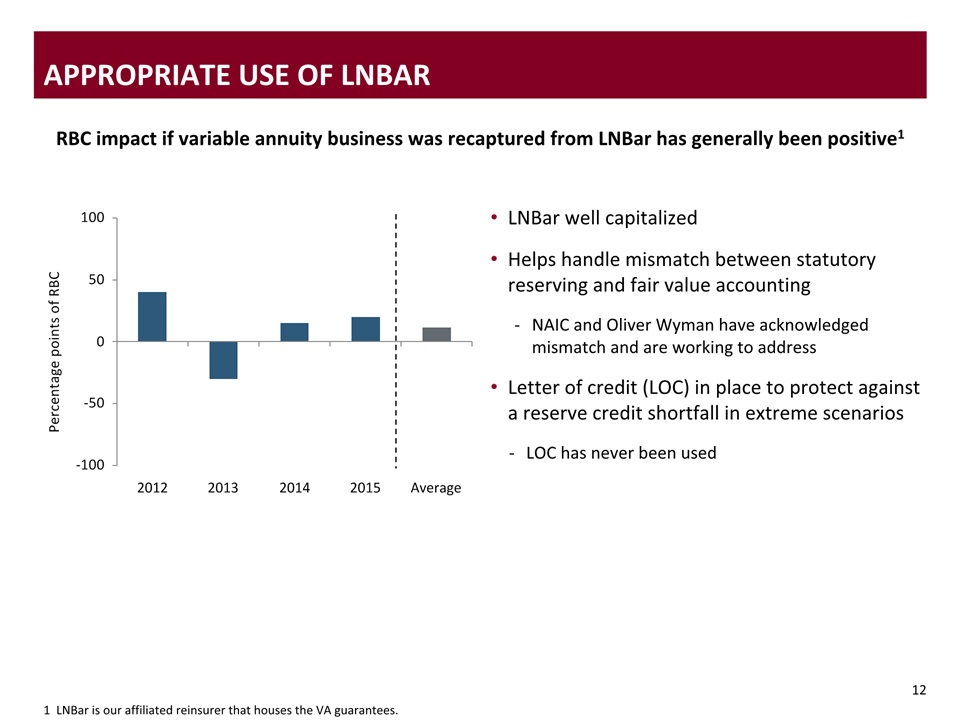
LNBar well capitalizedHelps handle mismatch between statutory reserving and fair value accountingNAIC and Oliver Wyman have acknowledged mismatch and are working to address Letter of credit (LOC) in place to protect against a reserve credit shortfall in extreme scenariosLOC has never been used 12 Appropriate use of LNBAR RBC impact if variable annuity business was recaptured from LNBar has generally been positive1 1 LNBar is our affiliated reinsurer that houses the VA guarantees.

Strong capital generation creates flexibilityCapital management funded by free cash flow2Strong and steady share repurchase activity$3.3B since 2011; $200M in 1Q16Significant increases in shareholder dividend400% increase in quarterly dividend since 2011Maintained strong RBC ratio during active capital management execution487% RBC ratio at year-end 2015Holding company cash continues to exceed minimum target of $500M Comfortable with leverage and capital structureLeverage ratio of 23% at end of 1Q16 13 Strong Capital generation and Flexibility Share repurchases Retained in life company Dividends Deleveraging 1 2016 results for capital retained in life company are estimated.2 Free cash flow is defined as the percent of operating earnings deployed through share repurchases and common stock dividends. $5.6B of capital generation(2011-1Q 2016)1

Free cash flow driving accretive capital deploymentFree cash flow relative to market cap continues to outpace peers8.1% compared to peers at 7.3%Capital management funded by free cash flowIncreased long-term target at year-endto 50-55%Expect to exceed long-term target in 2016Returning capital to shareholders remainsa priorityBuybacks likely to remain primary use of capital given current valuation 14 Robust Free cash flow Drives Capital Deployment Free cash flow as % of market cap iswell ahead of industry average1 Free cash flow target Timeframe Target Prior long-term target 45-50% Current long-term target 50-55% 2016 target Expect to exceed 50-55% 1 Source: Company filings and FactSet. -- Peer average

15 Financial Overview Greater transparency on key focus areas of low rates and VAs Strong financial results and fundamentals not reflected in valuation Consistent capital generation and deployment with further flexibility Distribution LifeInsurance Group Protection Annuities Retirement Plan Services General AccountInvestments Financial overview

Appendix 2016 Conference for Analysts, Investors and Bankers
2 2 Forward Looking Statements – Cautionary Language Certain statements made in this presentation and in other written or oral statements made by Lincoln or on Lincoln's behalf are "forward-looking statements" within the meaning of the Private Securities Litigation Reform Act of 1995 (PSLRA). A forward-looking statement is a statement that is not a historical fact and, without limitation, includes any statement that may predict, forecast, indicate or imply future results, performance or achievements, and may contain words like: "believe," "anticipate," "expect," "estimate," "project," "will," "shall" and other words or phrases with similar meaning in connection with a discussion of future operating or financial performance. In particular, these include statements relating to future actions, trends in Lincoln's businesses, prospective services or products, future performance or financial results, and the outcome of contingencies, such as legal proceedings. Lincoln claims the protection afforded by the safe harbor for forward-looking statements provided by the PSLRA. Forward-looking statements involve risks and uncertainties that may cause actual results to differ materially from the results contained in the forward-looking statements. Risks and uncertainties that may cause actual results to vary materially, some of which are described within the forward-looking statements include, among others:Deterioration in general economic and business conditions that may affect account values, investment results, guaranteed benefit liabilities, premium levels, claims experience and the level of pension benefit costs, funding and investment results; Adverse global capital and credit market conditions could affect our ability to raise capital, if necessary, and may cause us to realize impairments on investments and certain intangible assets, including goodwill and the valuation allowance against deferred tax assets, which may reduce future earnings and/or affect our financial condition and ability to raise additional capital or refinance existing debt as it matures;Because of our holding company structure, the inability of our subsidiaries to pay dividends to the holding company in sufficient amounts could harm the holding company’s ability to meet its obligations;Legislative, regulatory or tax changes, both domestic and foreign, that affect: the cost of, or demand for, our subsidiaries' products; the required amount of reserves and/or surplus; our ability to conduct business and our captive reinsurance arrangements as well as restrictions on revenue sharing and 12b-1 payments; and the potential for U.S. federal tax reform and the effect of the Department of Labor’s regulation defining fiduciary; Actions taken by reinsurers to raise rates on in-force business;Declines in or sustained low interest rates causing a reduction in investment income, the interest margins of our businesses, estimated gross profits and demand for our products;Rapidly increasing interest rates causing contract holders to surrender life insurance and annuity policies, thereby causing realized investment losses, and reduced hedge performance related to variable annuities;
3 3 Forward Looking Statements – Cautionary Language (cont.) Uncertainty about the effect of rules and regulations to be promulgated under the Dodd-Frank Wall Street Reform and Consumer Protection Act on us and the economy, and financial services sector in particular; The initiation of legal or regulatory proceedings against us, and the outcome of any legal or regulatory proceedings, such as: adverse actions related to present or past business practices common in businesses in which we compete; adverse decisions in significant actions including, but not limited to, actions brought by federal and state authorities and class action cases; new decisions that result in changes in law; and unexpected trial court rulings;A decline in the equity markets causing a reduction in the sales of our subsidiaries' products; a reduction of asset-based fees that our subsidiaries charge on various investment and insurance products; an acceleration of the net amortization of deferred acquisition costs, or "DAC;" value of business acquired, or "VOBA;" deferred sales inducements, or "DSI;" and deferred front end sales loads, or "DFEL;" and an increase in liabilities related to guaranteed benefit features of our subsidiaries' variable annuity products;Ineffectiveness of our risk management policies and procedures, including various hedging strategies used to offset the effect of changes in the value of liabilities due to changes in the level and volatility of the equity markets and interest rates; A deviation in actual experience regarding future persistency, mortality, morbidity, interest rates or equity market returns from the assumptions used in pricing our subsidiaries' products, in establishing related insurance reserves and in the net amortization of DAC, VOBA, DSI and DFEL, which may reduce future earnings; Changes in accounting principles generally accepted in the United States, or "GAAP," including convergence with International Financial Reporting Standards (IFRS), that may result in unanticipated changes to our net income;Lowering of one or more of our debt ratings issued by nationally recognized statistical rating organizations and the adverse effect such action may have on our ability to raise capital and on our liquidity and financial condition; Lowering of one or more of the insurer financial strength ratings of our insurance subsidiaries and the adverse effect such action may have on the premium writings, policy retention, profitability of our insurance subsidiaries and liquidity; Significant credit, accounting, fraud, corporate governance or other issues that may adversely affect the value of certain investments in our portfolios as well as counterparties to which we are exposed to credit risk requiring that we realize losses on investments; Inability to protect our intellectual property rights or claims of infringement of the intellectual property rights of others;Interruption in telecommunication, information technology or other operational systems, or failure to safeguard the confidentiality or privacy of sensitive data on such systems from cyberattacks or other breaches of our data security systems;

4 The effect of acquisitions and divestitures, restructurings, product withdrawals and other unusual items; The adequacy and collectability of reinsurance that we have purchased;Acts of terrorism, a pandemic, war or other man-made and natural catastrophes that may adversely affect our businesses and the cost and availability of reinsurance; Competitive conditions, including pricing pressures, new product offerings and the emergence of new competitors, that may affect the level of premiums and fees that our subsidiaries can charge for their products; The risks included here are not exhaustive. Our annual report on Form 10-K, quarterly reports on Form 10-Q, current reports on Form 8-K and other documents filed with the SEC include additional factors which could impact our business and financial performance. Moreover, we operate in a rapidly changing and competitive environment. New risk factors emerge from time to time, and it is not possible for management to predict all such risk factors.Further, it is not possible to assess the impact of all risk factors on our businesses or the extent to which any factor, or combination of factors, may cause actual results to differ materially from those contained in any forward-looking statements. Given these risks and uncertainties, investors should not place undue reliance on forward-looking statements as a prediction of actual results. In addition, Lincoln disclaims any obligation to update any forward-looking statements to reflect events or circumstances that occur after the date of this presentation.The reporting of RBC measures is not intended for the purpose of ranking any insurance company or for use in connection with any marketing, advertising or promotional activities. Forward Looking Statements – Cautionary Language (cont.)

5 Explanatory notes on use of non-gaap measures Management believes that income from operations, return on equity and operating revenues better explain the results of the company’s ongoing businesses in a manner that allows for a better understanding of the underlying trends in the company’s current business because the excluded items are unpredictable and not necessarily indicative of current operating fundamentals or future performance of the business segments, and, in most instances, decisions regarding these items do not necessarily relate to the operations of the individual segments. Management also believes that using book value excluding accumulated other comprehensive income (AOCI) enables investors to analyze the amount of our net worth that is primarily attributable to our business operations. Book value per share excluding AOCI is useful to investors because it eliminates the effect of items that can fluctuate significantly from period to period, primarily based on changes in interest rates. For the historical periods, reconciliations of non-GAAP measures used in this presentation to the most directly comparable GAAP measure may be included in this Appendix to the presentation materials and/or are included in the Statistical Reports for the corresponding periods contained in the Earning section of the Investor Relations page on our website: www.LincolnFinancial.com/investor.The non-GAAP measures do not replace the most directly comparable GAAP measures.The company uses its prevailing corporate federal income tax rate of 35% while taking into account any permanent differences for events recognized differently in its financial statements and federal income tax returns when reconciling non-GAAP measures to the most comparable GAAP measure.

6 Definitions of Non-GAAP Measures used in this presentation Income (loss) from operations, operating revenues and return on equity (including and excluding average goodwill within average equity), excluding AOCI, using annualized income (loss) from operations are financial measures we use to evaluate and assess our results. Management believes that these performance measures explain the results of the company's ongoing businesses in a manner that allows for a better understanding of the underlying trends in the company’s current business because the excluded items are unpredictable and not necessarily indicative of current operating fundamentals or future performance of the business segments, and, in most instances, decisions regarding these items do not necessarily relate to the operations of the individual segments.Income (loss) from operationsIncome (loss) from operations, operating revenues and return on equity (ROE), as used in the presentation, are non-GAAP financial measures and do not replace GAAP revenues, net income (loss) and ROE. We exclude the after-tax effects of the following items from GAAP net income (loss) to arrive at income (loss) from operations, which we also refer to as operating earnings: realized gains and losses associated with the following (“excluded realized gain (loss)”): sale or disposal of securities; impairments of securities; change in the fair value of derivative investments, embedded derivatives within certain reinsurance arrangements and our trading securities; change in the fair value of the derivatives we own to hedge our guaranteed death benefit (GDB) riders within our variable annuities, which is referred to as “GDB derivatives results”; change in the fair value of the embedded derivatives of our guaranteed living benefit (GLB) riders within our variable annuities accounted for under the Derivatives and Hedging and the Fair Value Measurements and Disclosures Topics of the Financial Accounting Standards Board (FASB) Accounting Standards Codification (ASC) (“embedded derivative reserves”), net of the change in the fair value of the derivatives we own to hedge the changes in the embedded derivative reserves, the net of which is referred to as “GLB net derivative results”; and changes in the fair value of the embedded derivative liabilities related to index call options we may purchase in the future to hedge contract holder index allocations applicable to future reset periods for our indexed annuity products accounted for under the Derivatives and Hedging and the Fair Value Measurements and Disclosures Topics of the FASB ASC (“indexed annuity forward-starting option”); change in reserves accounted for under the Financial Services - Insurance - Claim Costs and Liabilities for Future Policy Benefits Subtopic of the FASB ASC resulting from benefit ratio unlocking on our GDB and GLB riders (“benefit ratio unlocking”); income (loss) from the initial adoption of new accounting standards; income (loss) from reserve changes (net of related amortization) on business sold through reinsurance; gain (loss) on early extinguishment of debt; losses from the impairment of intangible assets; and income (loss) from discontinued operations.Operating revenuesOperating revenues represent GAAP revenues excluding the pre-tax effects of the following items, as applicable: excluded realized gain (loss); amortization of deferred front-end loads (DFEL) arising from changes in GDB and GLB benefit ratio unlocking; amortization of deferred gains arising from the reserve changes on business sold through reinsurance; and revenue adjustments from the initial adoption of new accounting standards.

7 Definitions of Non-GAAP Measures used in this presentation (cont.) Return on equity, excluding AOCI Return on equity measures how efficiently we generate profits from the resources provided by our net assets. Return on equity is calculated by dividing annualized income (loss) from operations by average equity, excluding accumulated other comprehensive income (loss) (AOCI). Management evaluates return on equity by both including and excluding average goodwill within average equity.Book value per share, excluding AOCIBook value per share excluding AOCI is calculated based upon a non-GAAP financial measure. It is calculated by dividing (a) stockholders’ equity excluding AOCI by (b) common shares outstanding. We provide book value per share excluding AOCI to enable investors to analyze the amount of our net worth that is primarily attributable to our business operations. Management believes book value per share excluding AOCI is useful to investors because it eliminates the effect of items that can fluctuate significantly from period to period, primarily based on changes in interest rates. Book value per share is the most directly comparable GAAP measure. A reconciliation of book value per share to book value per share excluding AOCI as of September 30, 2014 and 2013 is set forth below. Income (loss) from operations, excluding notable itemsIncome (loss) from operations, excluding notable items is a non-GAAP measure that excludes items which, in management’s view, do not reflect the Company’s normal, ongoing operations. The company highlights notable items included in income (loss) from operations so that investors better understand the fundamental trends in its results of operations and financial condition.

Corporate federal tax fateThe company uses its prevailing corporate federal income tax rate of 35% while taking into account any permanent differences for events recognized differently in its financial statements and federal income tax returns when reconciling non-GAAP measures to the most comparable GAAP measure.SalesSales as reported consist of the following:MoneyGuard®, our linked-benefit product – 15% of total expected premium deposits;Universal life (UL), indexed universal life (IUL), variable universal life (VUL) – first year commissionable premiums plus 5% of excess premiums received, including an adjustment for internal replacements of approximately 50% of commissionable premiums;Executive Benefits - single premium bank-owned UL and VUL, 15% of single premium deposits, and corporate owned UL and VUL, first year commissionable premiums plus 5% of excess premium received, including an adjustment for internal replacements of approximately 50% of commissionable premiums;Term – 100% of annualized first year premiums;Annuities – deposits from new and existing customers; andGroup Protection – annualized first year premiums from new policies. 8 Special notes
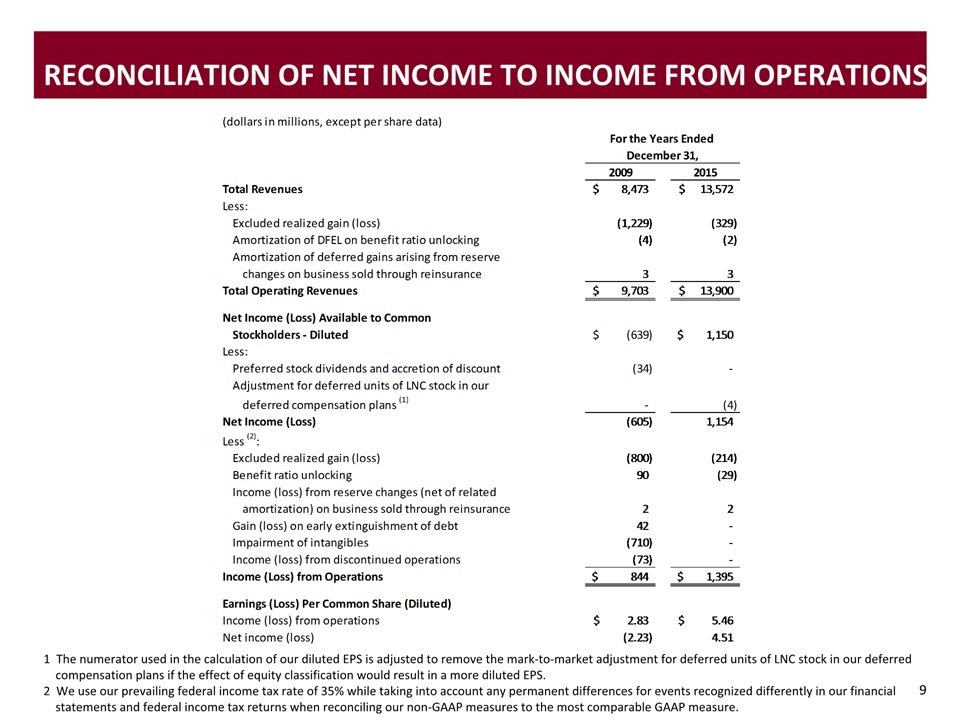
9 Reconciliation of net income to income from operations 1 The numerator used in the calculation of our diluted EPS is adjusted to remove the mark-to-market adjustment for deferred units of LNC stock in our deferred compensation plans if the effect of equity classification would result in a more diluted EPS.2 We use our prevailing federal income tax rate of 35% while taking into account any permanent differences for events recognized differently in our financial statements and federal income tax returns when reconciling our non-GAAP measures to the most comparable GAAP measure.
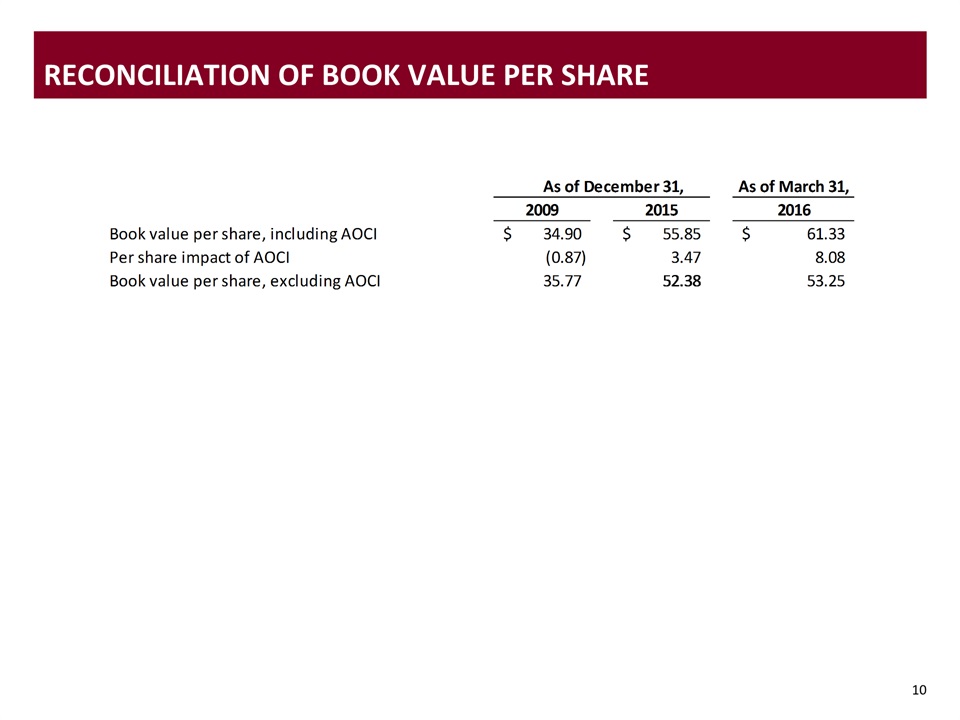
10 Reconciliation of Book Value per share

11 notable items reconciliation: income from operations and operating eps 1 The income used in the calculation of our diluted operating earnings per share is our operating income, reduced by preferred stock dividends and accretion of discount. Preferred stock dividends and accretion of discount totaled $34 million for the year ended December 31, 2009.

12 Reconciliation of return on average equity 1 Excludes AOCI.
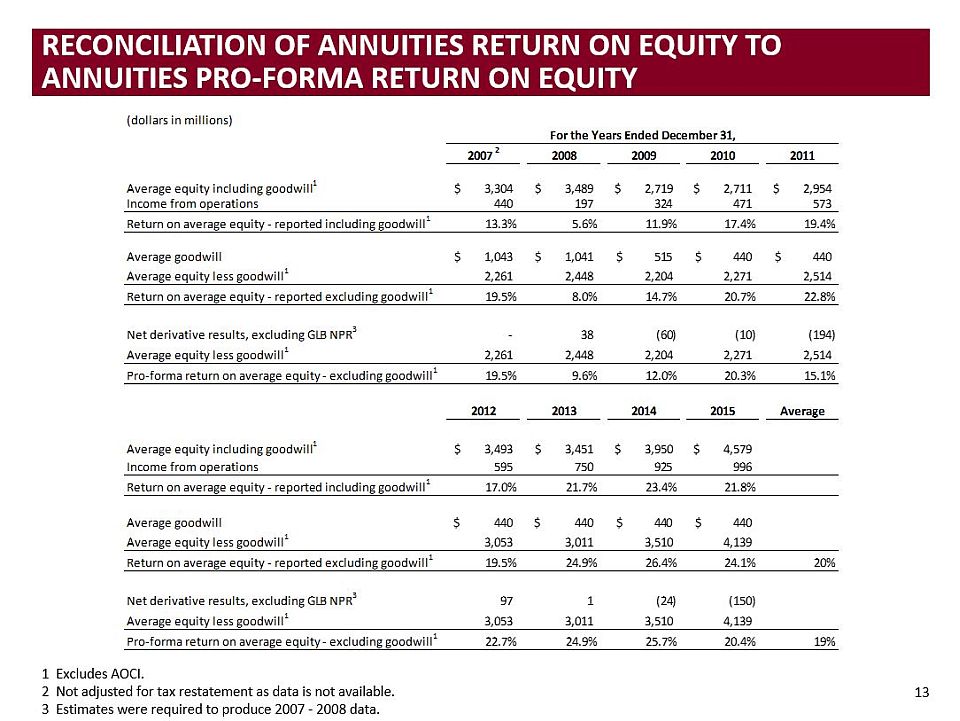
13 Reconciliation OF ANNUITIES RETURN ON EQUITY TO ANNUITIES PRO-FORMA RETURN ON EQUITY 1 Excludes AOCI. 2 Not adjusted for tax restatement as data is not available. 3 Estimates were required to produce 2007 - 2008 data.

Calculations of net amount at riskCalculations of net amount at risk, especially GLB, vary from company to company, as described in sources. Sources: GLB: Ameriprise, 2015 10-K; Lincoln, 2015 10-K and internal report for associated account values; Hartford, 4Q 2015 Financial Supplement; AIG, 2015 10-K; MetLife, 2015 10-K; Prudential, 2015 10-K; Jackson, 2015 Consolidated Financial Statements; AXA, 4Q 2015 Financial Supplement; VOYA, 4Q 2015 Financial Supplement; AEGON, 2015 Form 20-F 14 Annuities Disclosures
Serious News for Serious Traders! Try StreetInsider.com Premium Free!
You May Also Be Interested In
- Bragar Eagel & Squire, P.C. Reminds Investors That Class Action Lawsuits Have Been Filed Against GoodRx, Autodesk, Global Cord, and Lincoln and Encourages Investors to Contact the Firm
- Chipoys Announces Strategic Partnership with Racing Prodigy Thomas Annunziata
- Modern Health Announces Inaugural Virtual Event, Elevate Well-Being
Create E-mail Alert Related Categories
SEC FilingsSign up for StreetInsider Free!
Receive full access to all new and archived articles, unlimited portfolio tracking, e-mail alerts, custom newswires and RSS feeds - and more!
