

Form 8-K KAMAN Corp For: May 27
 Tweet
Tweet Share
ShareUNITED STATES
SECURITIES AND EXCHANGE COMMISSION
WASHINGTON, DC 20549
FORM 8-K
CURRENT REPORT PURSUANT
TO SECTION 13 OR 15(d) OF THE
SECURITIES EXCHANGE ACT OF 1934
Date of report (Date of earliest event reported): May 27, 2016
Kaman Corporation
(Exact Name of Registrant as Specified in Its Charter)
Connecticut
(State or Other Jurisdiction of Incorporation)
|
001-35419
|
06-0613548
|
|
|
(Commission File Number)
|
(IRS Employer Identification No.)
|
|
|
1332 Blue Hills Avenue, Bloomfield, Connecticut
|
06002
|
|
|
(Address of Principal Executive Offices)
|
(Zip Code)
|
(860) 243-7100
(Registrant's Telephone Number, Including Area Code)
Not Applicable
(Former Name or Former Address, if Changed Since Last Report)
Check the appropriate box below if the Form 8-K filing is intended to simultaneously satisfy the filing obligation of the registrant under any of the following provisions (see General Instruction A.2. below):
| ☐ | Written communications pursuant to Rule 425 under the Securities Act (17 CFR 230.425) |
| ☐ | Soliciting material pursuant to Rule 14a-12 under the Exchange Act (17 CFR 240.14a-12) |
| ☐ | Pre-commencement communications pursuant to Rule 14d-2(b) under the Exchange Act (17 CFR 240.14d-2(b)) |
| ☐ | Pre-commencement communications pursuant to Rule 13e-4(c) under the Exchange Act (17 CFR 240.13e-4(c)) |
1
Item 7.01 Regulation FD Disclosure.
From time to time, members of the Company's senior management present information about the Company to investors. A copy of an investor presentation dated May 31, 2016 is attached as Exhibit 99.1.
The information in this Item 7.01, including Exhibit 99.1, is being furnished and shall not be deemed to be "filed" for purposes of Section 18 of the Securities Exchange Act of 1934, as amended, or otherwise subject to the liabilities of that Section and shall not be deemed incorporated by reference into any registration statement or other document filed pursuant to the Securities Act of 1933, as amended, except as shall be expressly set forth by specific reference in such filing.
Item 9.01 Financial Statements and Exhibits
(d) Exhibits
The following documents are furnished as Exhibits pursuant to Item 7.01 hereof:
Exhibit 99.1 - Investor Presentation dated May 31, 2016.
2
SIGNATURES
Pursuant to the requirements of the Securities Exchange Act of 1934, the registrant has duly caused this report to be signed on its behalf by the undersigned hereunto duly authorized.
|
KAMAN CORPORATION
|
||
|
By:
|
/s/ Shawn G. Lisle
|
|
|
Shawn G. Lisle
|
||
|
Senior Vice President, General Counsel
|
||
|
and Assistant Secretary
|
||
Date: May 27, 2016
3
KAMAN CORPORATION AND SUBSIDIARIES
Index to Exhibits
|
Exhibit
|
Description
|
|
|
99.1
|
Investor Presentation dated May 31, 2016
|
Attached
|
4

Investor PresentationMay 31, 2016
Forward Looking Statements FORWARD-LOOKING STATEMENTSThis presentation contains "forward-looking statements" within the meaning of the safe harbor provisions of the U.S. Private Securities Litigation Reform Act of 1995. Forward-looking statements also may be included in other publicly available documents issued by the Company and in oral statements made by our officers and representatives from time to time. These forward-looking statements are intended to provide management's current expectations or plans for our future operating and financial performance, based on assumptions currently believed to be valid. They can be identified by the use of words such as "anticipate," "intend," "plan," "goal," "seek," "believe," "project," "estimate," "expect," "strategy," "future," "likely," "may," "should," "would," "could," "will" and other words of similar meaning in connection with a discussion of future operating or financial performance. Examples of forward looking statements include, among others, statements relating to future sales, earnings, cash flows, results of operations, uses of cash and other measures of financial performance.Because forward-looking statements relate to the future, they are subject to inherent risks, uncertainties and other factors that may cause the Company's actual results and financial condition to differ materially from those expressed or implied in the forward-looking statements. Such risks, uncertainties and other factors include, among others: (i) changes in domestic and foreign economic and competitive conditions in markets served by the Company, particularly the defense, commercial aviation and industrial production markets; (ii) changes in government and customer priorities and requirements (including cost-cutting initiatives, government and customer shut-downs, the potential deferral of awards, terminations or reductions of expenditures to respond to the priorities of Congress and the Administration, or budgetary cuts resulting from Congressional actions or automatic sequestration); (iii) changes in geopolitical conditions in countries where the Company does or intends to do business; (iv) the successful conclusion of competitions for government programs (including new, follow-on and successor programs) and thereafter successful contract negotiations with government authorities (both foreign and domestic) for the terms and conditions of the programs; (v) the existence of standard government contract provisions permitting renegotiation of terms and termination for the convenience of the government; (vi) the successful resolution of government inquiries or investigations relating to our businesses and programs; (vii) risks and uncertainties associated with the successful implementation and ramp up of significant new programs, including the ability to manufacture the products to the detailed specifications required and recover start-up costs and other investments in the programs; (viii) potential difficulties associated with variable acceptance test results, given sensitive production materials and extreme test parameters; (ix) the receipt and successful execution of production orders under the Company's existing U.S. government JPF contract, including the exercise of all contract options and receipt of orders from allied militaries, but excluding any next generation programmable fuze programs, as all have been assumed in connection with goodwill impairment evaluations; (x) the continued support of the existing K-MAX® helicopter fleet, including sale of existing K-MAX® spare parts inventory and the receipt of orders for new aircraft sufficient to recover our investment in the restart of the K-MAX® production line; (xi) the accuracy of current cost estimates associated with environmental remediation activities; (xii) the profitable integration of acquired businesses into the Company's operations; (xiii) the ability to implement our ERP systems in a cost-effective and efficient manner, limiting disruption to our business, and allowing us to capture their planned benefits while maintaining an adequate internal control environment; (xiv) changes in supplier sales or vendor incentive policies; (xv) the effects of price increases or decreases; (xvi) the effects of pension regulations, pension plan assumptions, pension plan asset performance, future contributions and the pension freeze; (xvii) future levels of indebtedness and capital expenditures; (xviii) the continued availability of raw materials and other commodities in adequate supplies and the effect of increased costs for such items; (xix) the effects of currency exchange rates and foreign competition on future operations; (xx) changes in laws and regulations, taxes, interest rates, inflation rates and general business conditions; (xxi) future repurchases and/or issuances of common stock; (xxii) the incurrence of unanticipated restructuring costs or the failure to realize anticipated savings or benefits from past or future expense reduction actions; and (xxiii) other risks and uncertainties set forth herein and in our 2015 Form 10-K.Any forward-looking information provided in this presentation should be considered with these factors in mind. We assume no obligation to update any forward-looking statements contained in this presentation.
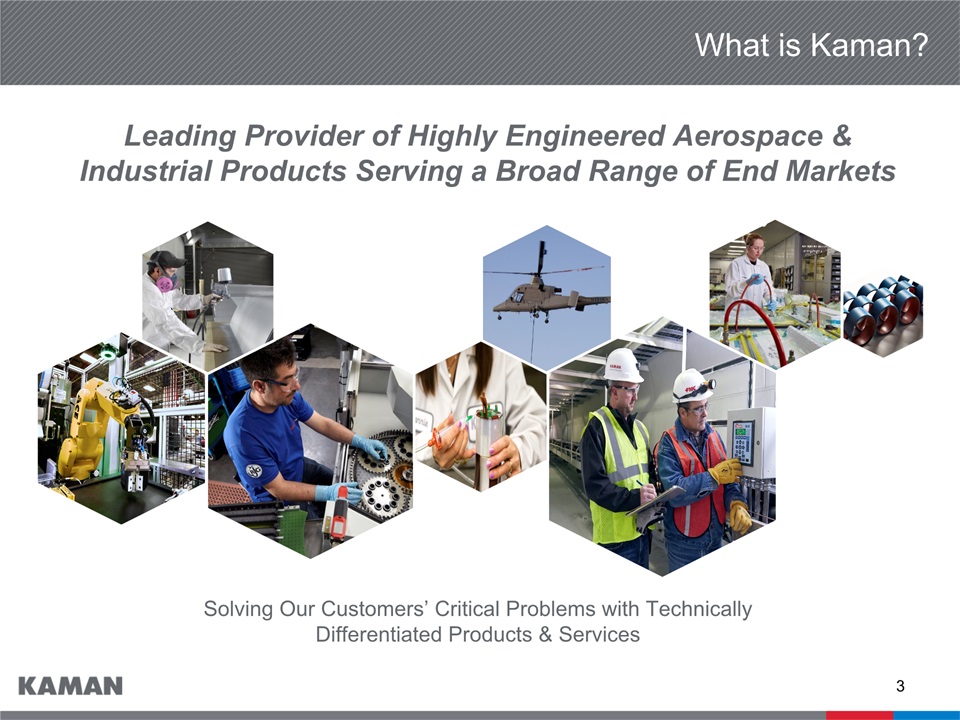
What is Kaman? Solving Our Customers’ Critical Problems with Technically Differentiated Products & Services Leading Provider of Highly Engineered Aerospace & Industrial Products Serving a Broad Range of End Markets
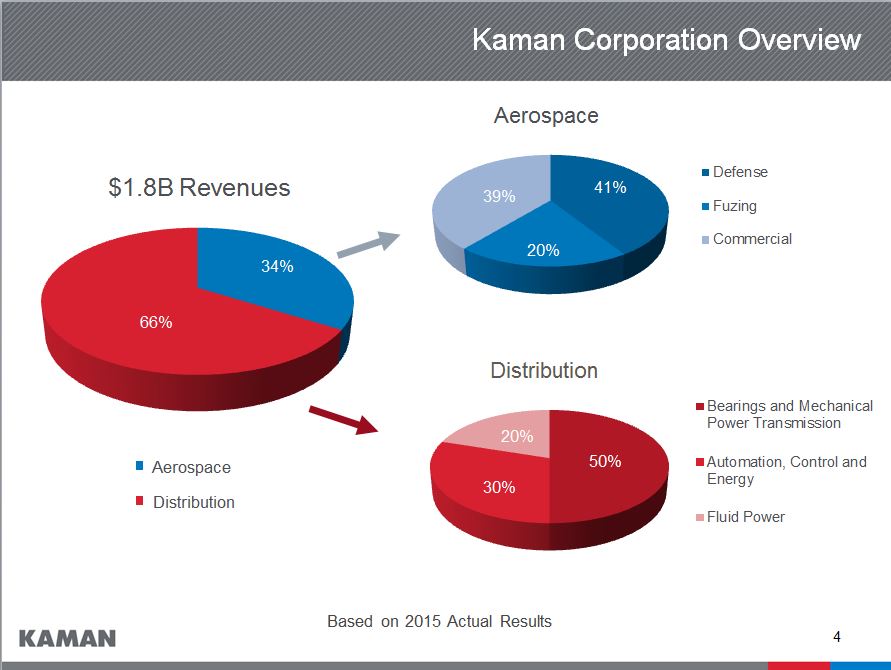
Distribution Kaman Corporation Overview Distribution Aerospace $1.8B Revenues Aerospace Based on 2015 Actual Results

Outstanding portfolio of engineered content/intellectual property (IP) across AerospaceDistribution aligned with best-in-class vendorsDiverse end market exposure provides consistent performance to fund growth Strategically Positioned Kaman Investment Highlights Improving Financials Reliable Business Strategies Focused on driving profitable top-line growth Deliver EBITDA growth through scale and operational executionGenerate strong consistent cash flow to fund long-term growth Disciplined acquisition growth to achieve scale and margin enhancementsContinuing focus on innovation to maintain differentiationRelentless effort to drive operational excellence and leanShared services allow for efficient allocation of resources
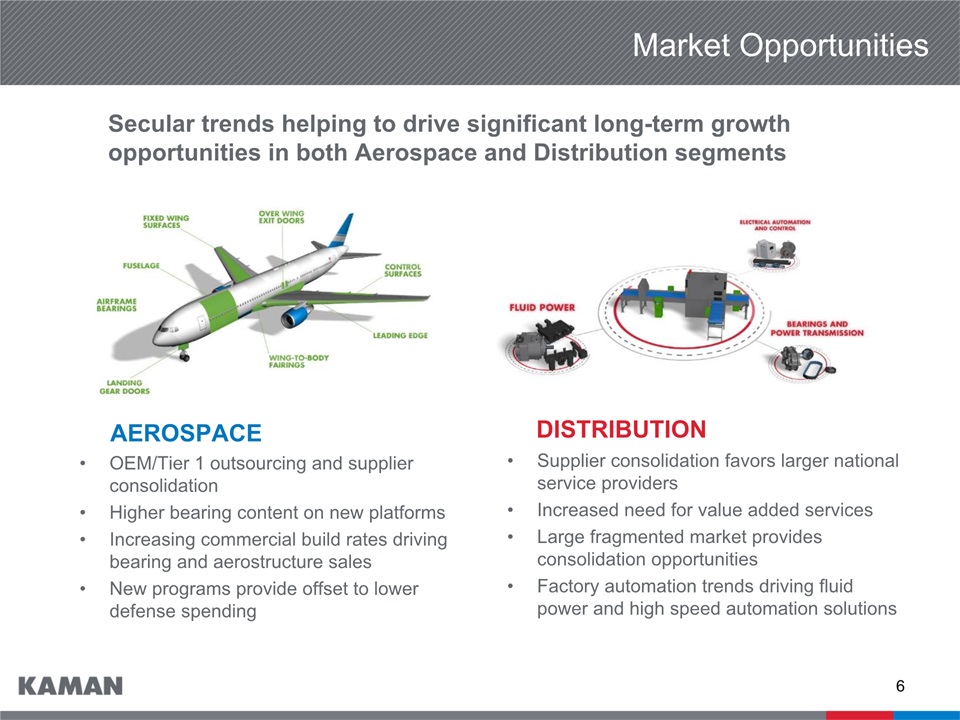
Market Opportunities Secular trends helping to drive significant long-term growth opportunities in both Aerospace and Distribution segments AEROSPACEOEM/Tier 1 outsourcing and supplier consolidationHigher bearing content on new platformsIncreasing commercial build rates driving bearing and aerostructure salesNew programs provide offset to lower defense spending DISTRIBUTIONSupplier consolidation favors larger national service providersIncreased need for value added servicesLarge fragmented market provides consolidation opportunitiesFactory automation trends driving fluid power and high speed automation solutions

Organic Growth Drivers Aerospace Distribution “One Kaman Approach”New product development efforts at Specialty BearingsContinued commercial aerospace cycle growth and demand for fuzing productsProgram renewals and extensionsExpanded geographic footprint Supplier consolidationFactory automation trendsDifferentiated product and servicesProduct platform cross-selling National account opportunities

Capital Deployment Framework Capital deployment is focused on growth investments & return of capital to shareholders Dividends & Share Repurchases Capital Expenditures Acquisitions Total $800 Million Period: Years 2010-2015 Increased dividend 12.5% in 2015 to an annualized rate of $0.72 per shareDividends paid without interruption for 46 years$100 million share repurchase authorization in place to offset dilution from employee stock plans$700 million credit facility provides significant committed capitalContinue to pursue acquisitions to accelerate growth

34% Aerospace

Aerospace Overview v AEROSYSTEMS SPECIALTY BEARINGS & ENGINEERED PRODUCTS FUZING & PRECISION PRODUCTS Engineering design and testingTooling design & manufactureAdvanced machining and composite aerostructure manufacturing Complex assemblyHelicopter MRO and support Self-lube airframe bearingsTraditional airframe bearingsMiniature ball bearingsFlexible drive systemsAftermarket engineered components Bomb and missile safe and arm fuzing devicesPrecision measuring systems Memory products Global commercial and defense OEM’sSuper Tier I’s to subcontract manufacturersAircraft operators and MRO Specialized aerospace distributorsIndustrial and medical manufacturers of high precision equipment U.S. and allied militariesWeapon system OEMs Consistent growth of bearing product line revenue from new program positions and higher build ratesExpanding engineered products portfolio into new end marketsAssembly and structures capabilities provide opportunities for additional subcontract programs Exclusivity and significant backlog provide a stable revenue base BusinessDynamic Customers Products

Aerospace Profile Sales by Product Line2015 Net Sales $598MOI% - GAAP 18.5%OI% - Adjusted 19.2%1 Financial Summary 2015 Technology Profile 1 See Non-GAAP reconciliation
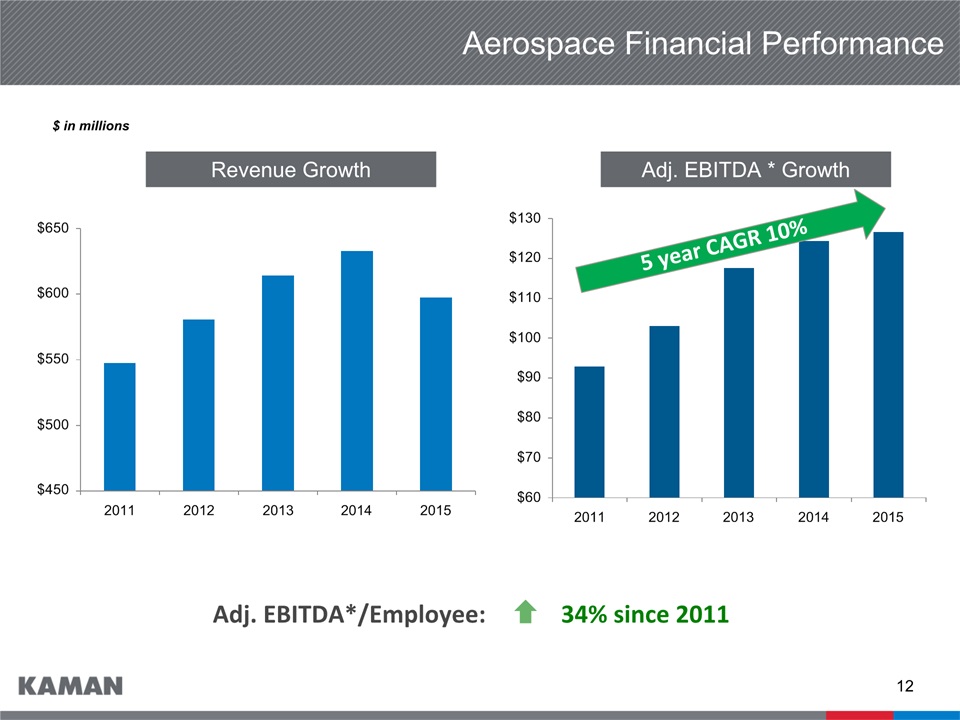
Aerospace Financial Performance Revenue Growth Adj. EBITDA * Growth Adj. EBITDA*/Employee: 34% since 2011 $ in millions 5 year CAGR 10%

Primary Aerospace Locations Diverse locations focused on core competencies

Aerospace Strategy
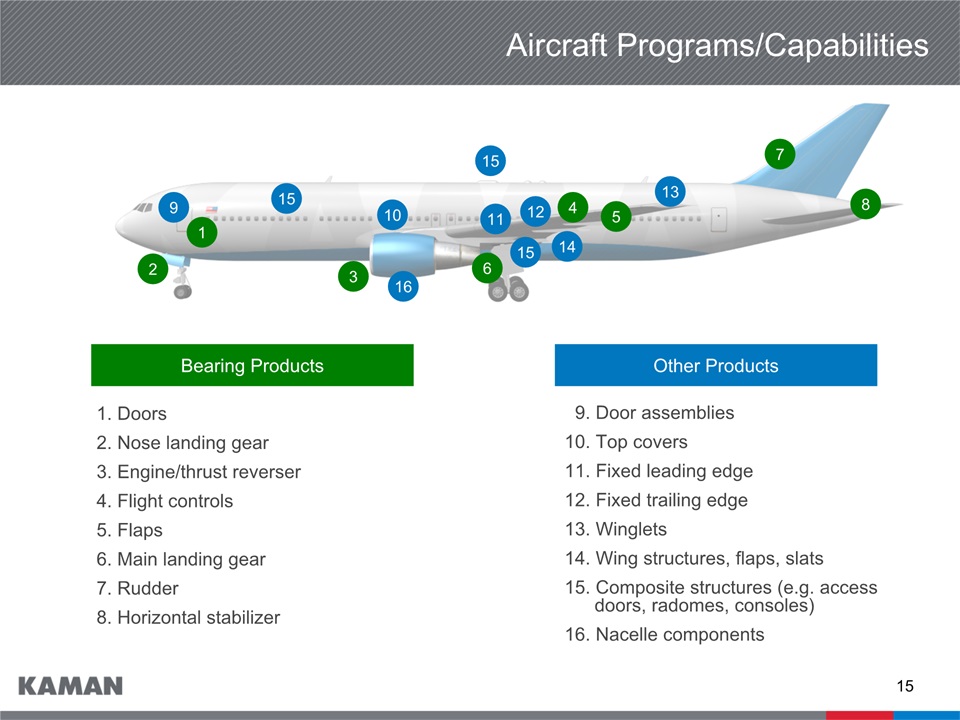
1 2 3 4 5 6 7 8 9 10 11 12 13 14 15 16 Aircraft Programs/Capabilities 1. Doors2. Nose landing gear3. Engine/thrust reverser4. Flight controls5. Flaps6. Main landing gear7. Rudder8. Horizontal stabilizer Bearing Products Other Products 9. Door assemblies10. Top covers11. Fixed leading edge12. Fixed trailing edge13. Winglets14. Wing structures, flaps, slats15. Composite structures (e.g. access doors, radomes, consoles)16. Nacelle components 15 15

1 4 1 2 3 5 4 4 4 4 Aircraft Programs/Capabilities 1. Flexible drive systems2. Flight control bearings3. Landing gear bearings Bearing Products Other Products 4. Manufacture and subassembly of major structures (e.g. cockpit) 5. Blade manufacture, repair andoverhaul6. Manufacture of composite structures (e.g. radomes) 6

Significant Platforms 737 777 787 K-MAX® A350 AH-1Z UH-60 SH-2 JPF A-10

Market Leading Self-Lube Airframe Bearing Product Lines ProprietaryTechnology Material Science Capability Application EngineeringExpertise Operational Excellence KAron® • KAflex® • Tufflex® New TechnologiesNew ProductsCustomizationR&D Capabilities Work ForceLean AutomationCustomer intimacy World Class Performance
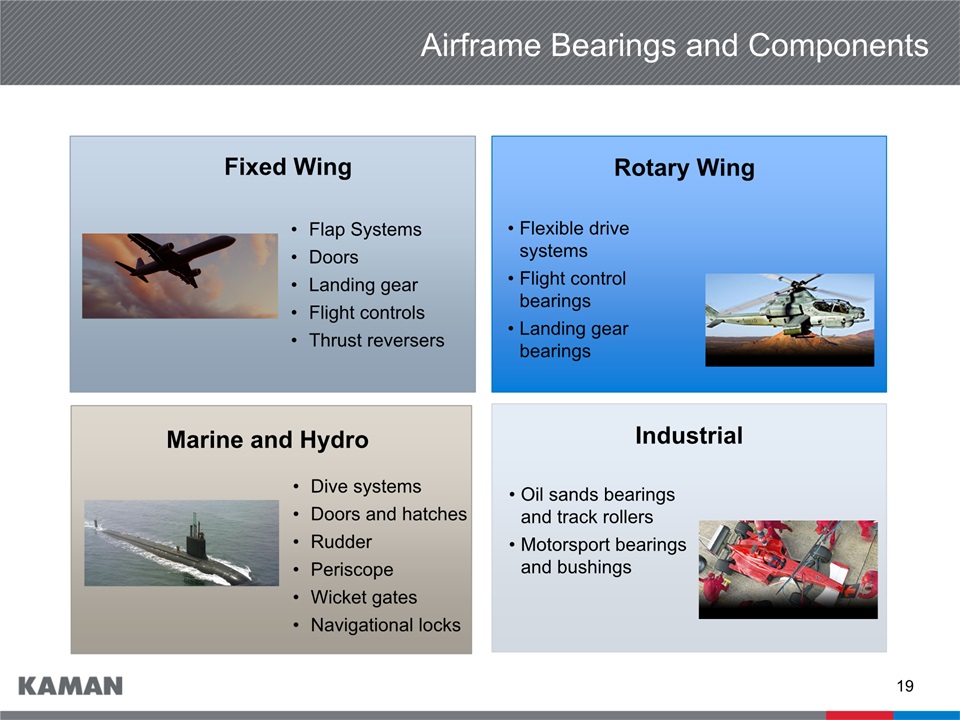
Airframe Bearings and Components Flap SystemsDoorsLanding gearFlight controlsThrust reversers Fixed Wing Industrial Rotary Wing Marine and Hydro Flexible drive systemsFlight control bearingsLanding gear bearings Dive systemsDoors and hatchesRudderPeriscopeWicket gatesNavigational locks Oil sands bearings and track rollersMotorsport bearings and bushings
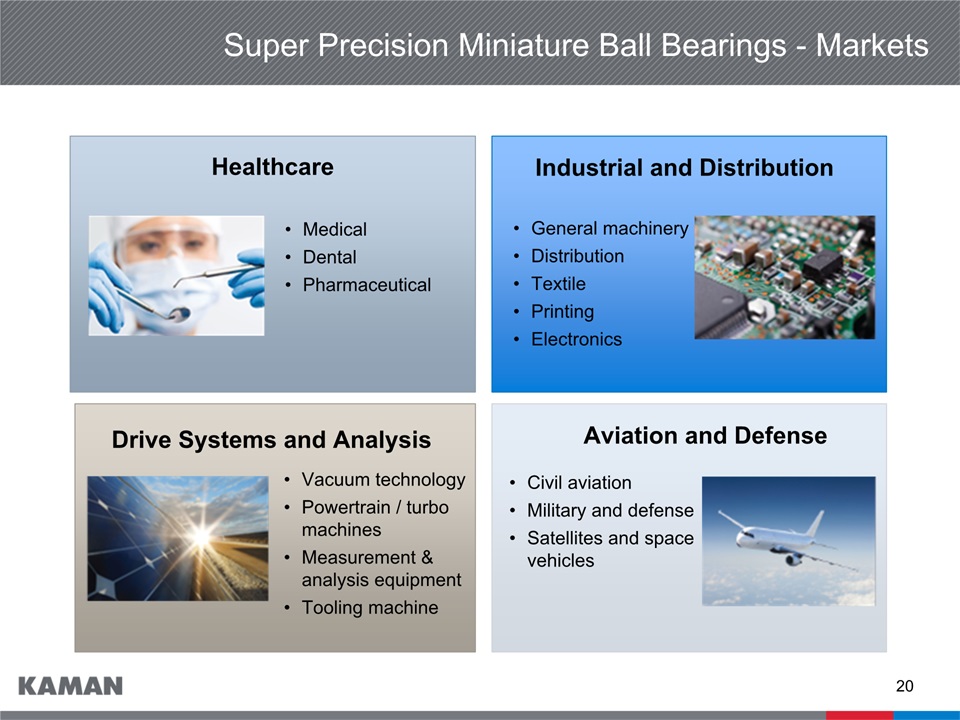
Super Precision Miniature Ball Bearings - Markets MedicalDentalPharmaceutical Healthcare Aviation and Defense Industrial and Distribution Drive Systems and Analysis General machinery Distribution TextilePrinting Electronics Vacuum technologyPowertrain / turbo machinesMeasurement & analysis equipmentTooling machine Civil aviationMilitary and defenseSatellites and space vehicles
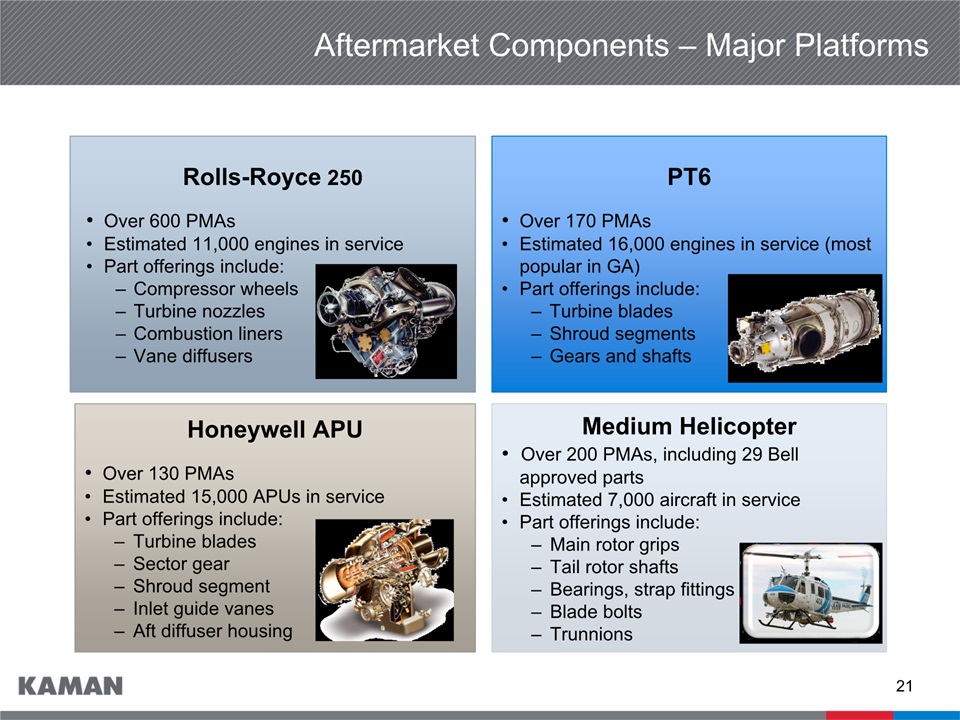
Aftermarket Components – Major Platforms Rolls-Royce 250• Over 600 PMAs• Estimated 11,000 engines in service• Part offerings include:– Compressor wheels– Turbine nozzles– Combustion liners– Vane diffusers PT6• Over 170 PMAs• Estimated 16,000 engines in service (most popular in GA)• Part offerings include:– Turbine blades– Shroud segments– Gears and shafts Honeywell APU• Over 130 PMAs• Estimated 15,000 APUs in service• Part offerings include:– Turbine blades– Sector gear– Shroud segment– Inlet guide vanes– Aft diffuser housing Medium Helicopter• Over 200 PMAs, including 29 Bell approved parts• Estimated 7,000 aircraft in service• Part offerings include: – Main rotor grips– Tail rotor shafts– Bearings, strap fittings– Blade bolts– Trunnions

Fuzing Products SLAM-ER HARPOON MAVERICK AMRAAM FMU-139 TOMAHAWK JPF STANDARD MISSILE SLAM-ER SLAM-ER AMRAAM TOMAHAWK STANDARD MISSILE AGM-65M AMRAAM On a Majority of U.S. Weapon Systems

U.S. Air Force (USAF) bomb fuzeUSAF inventory levels below desired quantity, and foreign orders provide additional opportunitiesStrong JPF demand has driven fuzing backlog over $300 million27 foreign customersSystem field reliability is greater than 99%Increasing capacity to meet customer demand Expectations are for deliveries of 30,000 to 34,000 fuzes in 2016 Bomb CompatibilityJDAMPaveway II and IIIGBU-10, 12, 16, 24, 27, 28, 31, 32, 38, 54BLU-109, 110, 111, 113, 117, 121, 122, 126MK82/BSU-49, MK83/BSU-85, MK84/BSU-50 JPF Program
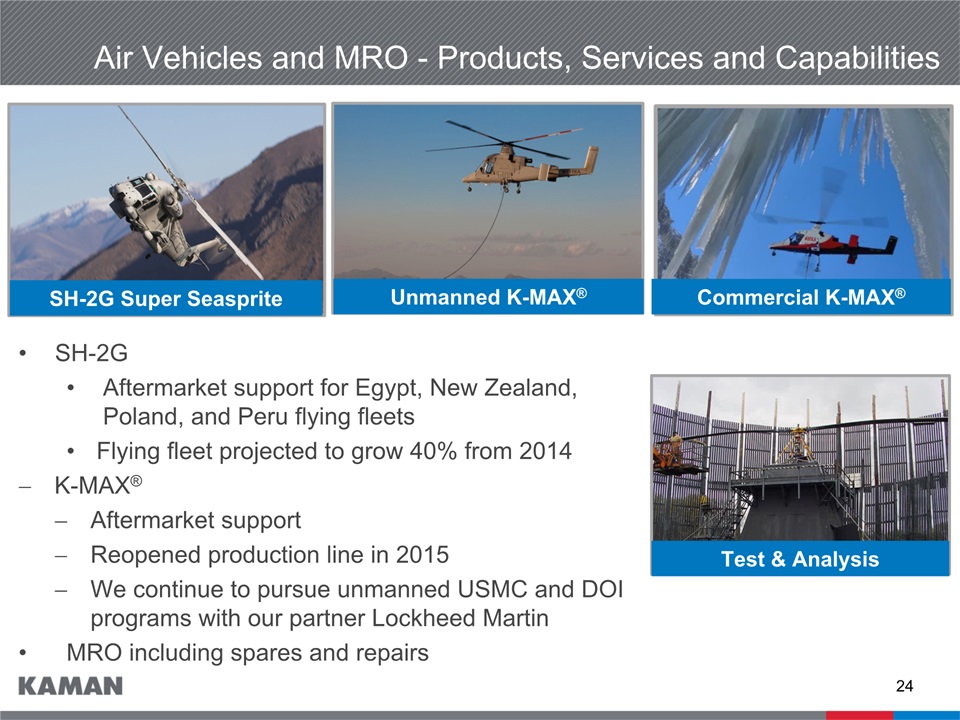
SH-2G Aftermarket support for Egypt, New Zealand, Poland, and Peru flying fleetsFlying fleet projected to grow 40% from 2014K-MAX® Aftermarket supportReopened production line in 2015We continue to pursue unmanned USMC and DOI programs with our partner Lockheed MartinMRO including spares and repairs Air Vehicles and MRO - Products, Services and Capabilities Unmanned K-MAX® Test & Analysis Commercial K-MAX® SH-2G Super Seasprite

Distribution
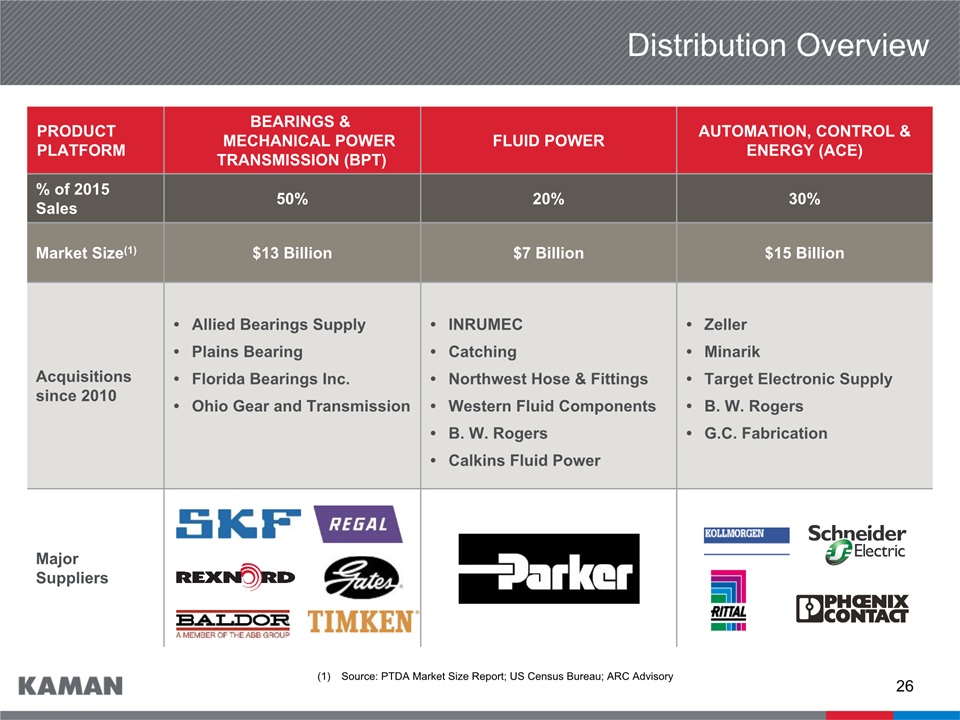
Distribution Overview PRODUCT PLATFORM Bearings & Mechanical PowerTransmission (BPT) FLUID POWER AUTOMATION, CONTROL & ENERGY (ACE) % of 2015 Sales 50% 20% 30% Market Size(1) $13 Billion $7 Billion $15 Billion Acquisitions since 2010 Allied Bearings SupplyPlains BearingFlorida Bearings Inc.Ohio Gear and Transmission INRUMECCatchingNorthwest Hose & FittingsWestern Fluid ComponentsB. W. RogersCalkins Fluid Power ZellerMinarikTarget Electronic SupplyB. W. RogersG.C. Fabrication Major Suppliers Source: PTDA Market Size Report; US Census Bureau; ARC Advisory
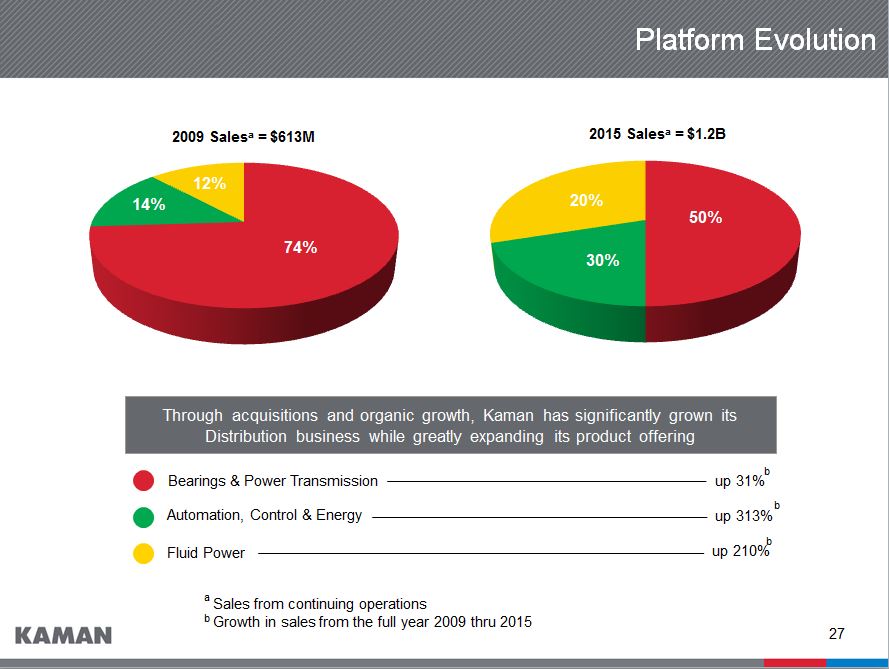
Platform Evolution Through acquisitions and organic growth, Kaman has significantly grown its Distribution business while greatly expanding its product offering Bearings & Power Transmission up 31% Automation, Control & Energy up 313% Fluid Power up 210% b b b Sales from continuing operationsGrowth in sales from the full year 2009 thru 2015 a b

Scale Distribution – Road to 7+% Operating Margin TODAY<5% FUTURE7+% Improved Operational Efficiencies Product Mix Strategic Pricing CATALYSTS

Business Strategies Pipeline for each product platformFormal integration processEnd market diversification Focused on outside sales forceTargeting strategic geographic marketsKaman training programs Adding more differentiated productsLarge national account pipeline Targeting new end markets Strategic pricingSupplier rebates Purchasing leverage Multi-phase rolloutIncludes CRM, WMS, FinancialsNetwork consolidation 1 2 3 5 4

Executing Strategy and Building Network

Acquisitions in all Product Platforms Distribution Group Sales

Adding Leading Brands in Multiple Technologies PLCs, HMIsSensors & SignalingMachine Safety HydraulicsPneumaticsFluid Connectors Motion ControlServos & SteppersLinear Motion BearingsPower TransmissionIndustrial Supplies Value- Added Technologies 2009 2015

Extensive Solution and Service Capabilities

Summary

Long-Term Financial Targets Kaman Corporation 3% – 6% organic sales growth3% – 10% including acquisitions Distribution 3% – 6% organic sales growth3% – 10% including acquisitions7+% operating margin Aerospace Corporate Expense ≤2.5% of sales by 2019 Free Cash Flow 80% – 100% of net income 3% – 6% organic sales growth3% – 10% including acquisitionsHigh-teens operating margin %

Aerospace– Leveraging unique set of proprietary products and capabilities– Strong platform positions across commercial & defense markets– Robust pipeline of future opportunitiesDistribution– Three product platform strategy expands growth opportunities– Increased scale provides improved operating leverageSuccessfully execute future acquisitionsLeverage experienced management and workforce across the companyStrong financial position provides significant capital deployment opportunities Positioned for Future Growth Executing strategies to deliver shareholder value over time

Financial Information and Non-GAAP Reconciliations
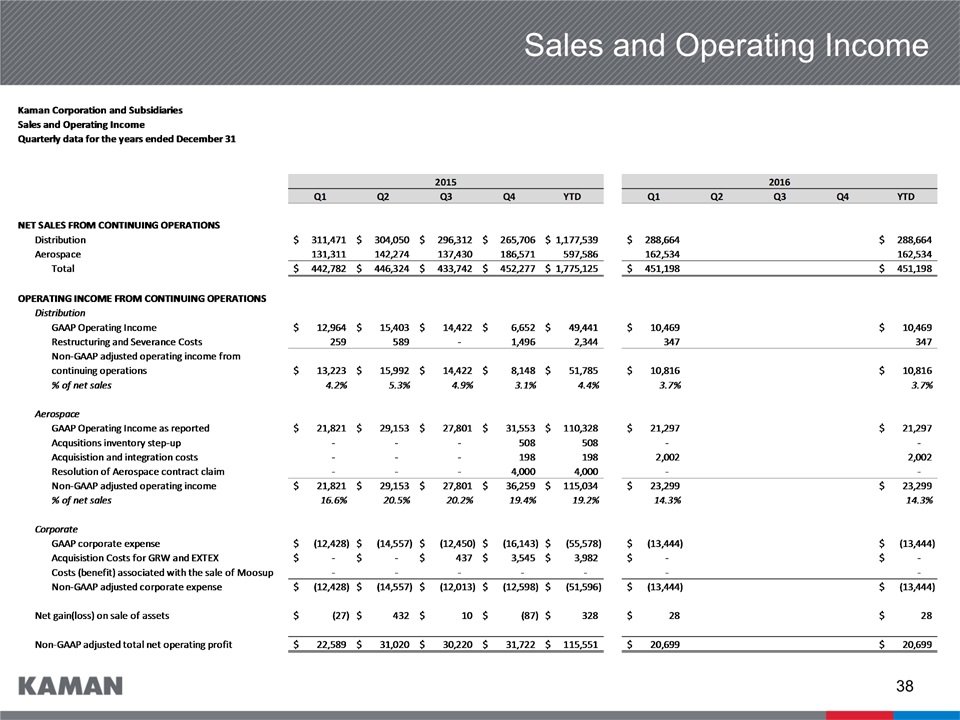
Sales and Operating Income
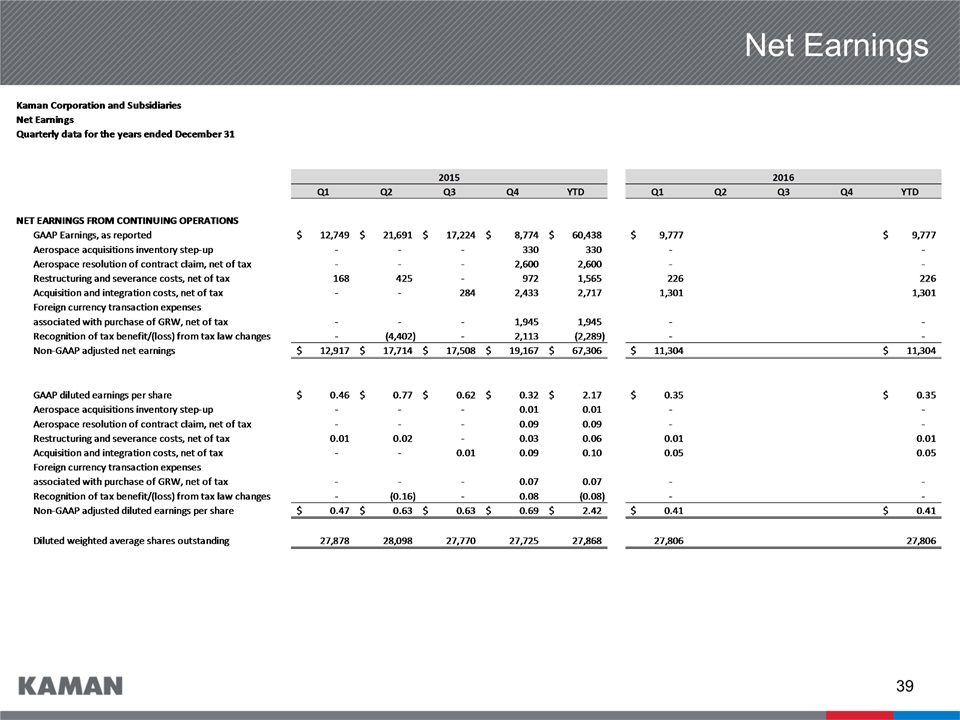
Net Earnings

Cash Flow, Balance Sheet, and Capital Factors
Serious News for Serious Traders! Try StreetInsider.com Premium Free!
You May Also Be Interested In
- Kaman (KAMN) Delivers New K-MAX to Black Tusk Helicopter
- Vantage Drilling International Ltd. Schedules First Quarter 2024 Earnings Release Date and Conference Call
- Green Energy Park Raises 30 million US Dollars in Initial Equity Funding to Accelerate the Energy Transition and to Build One of the Largest Renewable Hydrogen Production and Export Terminal Facilitie
Create E-mail Alert Related Categories
SEC FilingsSign up for StreetInsider Free!
Receive full access to all new and archived articles, unlimited portfolio tracking, e-mail alerts, custom newswires and RSS feeds - and more!
