Form 8-K FIRST FINANCIAL BANCORP For: Feb 06
UNITED STATES
SECURITIES AND EXCHANGE COMMISSION
Washington, D.C. 20549
FORM 8-K
CURRENT REPORT
Pursuant to Section 13 or 15(d) of the
Securities Exchange Act of 1934
Date of Report (Date of earliest event reported): February 6, 2017
FIRST FINANCIAL BANCORP.
(Exact name of registrant as specified in its charter)
Ohio | 31-1042001 | |
(State or other jurisdiction of incorporation or organization) | (I.R.S. employer identification number) | |
Commission file number: 001-34762
255 East Fifth Street, Suite 700, Cincinnati, Ohio 45202
(Address of principal executive offices and zip code)
Registrant's telephone number, including area code: (877) 322-9530
Check the appropriate box below if the Form 8-K filing is intended to simultaneously satisfy the filing obligation of the registrant under any of the following provisions (see General Instruction A.2. below):
[ ] Written communications pursuant to Rule 425 under the Securities Act (17 CFR 230.425)
[ ] Soliciting material pursuant to Rule 14a-12 under the Exchange Act (17 CFR 240.14a-12)
[ ] Pre-commencement communications pursuant to Rule 14d-2(b) under the Exchange Act (17 CFR 240.14d-2(b))
[ ] Pre-commencement communications pursuant to Rule 13e-4(c) under the Exchange Act (17 CFR 240.13e-4(c))
Form 8-K First Financial Bancorp.
Item 7.01 Regulation FD Disclosure.
The executive officers of First Financial Bancorp. intend to use the materials filed herewith, in whole or in part, in one or more meetings with investors and analysts. A copy of the investor presentation is attached hereto as Exhibit 99.1.
First Financial Bancorp. does not intend for this Item 7.01 or Exhibit 99.1 to be treated as “filed” for purposes of the Securities Exchange Act of 1934, as amended, or incorporated by reference into its filings under the Securities Act of 1933, as amended.
Item 9.01 Financial Statements and Exhibits.
The following exhibit shall not be deemed to be “filed” for purposes of the Securities Exchange Act of 1934, as amended.
(d) Exhibits:
99.1 First Financial Bancorp. Investor Presentation.
SIGNATURES
Pursuant to the requirements of the Securities Exchange Act of 1934, the registrant has duly caused this report to be signed on its behalf by the undersigned hereunto duly authorized.
FIRST FINANCIAL BANCORP.
/s/ John M. Gavigan | |
John M. Gavigan | |
Senior Vice President and Chief Financial Officer | |
Date: February 6, 2017
Form 8-K First Financial Bancorp.
Exhibit Index
Exhibit No. Description
99.1 First Financial Bancorp. Investor Presentation.

1
EXHIBIT 99.1

2
This investor presentation contains “forward-looking statements” within the meaning of the Private Securities Litigation
Reform Act of 1995. These statements are not based on historical or current facts, but rather on our current beliefs,
expectations, assumptions and projections about our business, the economy and other future conditions. Forward-looking
statements often include words such as ‘‘believes,’’ ‘‘anticipates,’’ “likely,” “expected,” ‘‘intends,’’ “could,” “should,” and other
similar references to future periods. Examples of forward-looking statements include, but are not limited to, statements we
make about (i) our future operating or financial performance, including revenues, income or loss and earnings or loss per
share, (ii) future common stock dividends, (iii) our capital structure, including future capital levels, (iv) our plans, objectives
and strategies, and (v) the assumptions that underlie our forward-looking statements.
As with any forecast or projection, forward-looking statements are subject to inherent uncertainties, risks and changes in
circumstances that may cause actual results to differ materially from those set forth in the forward-looking
statements. Important factors that could cause actual results to differ materially from those in our forward-looking
statements include the following, without limitation: (i) economic, market, liquidity, credit, interest rate, operational and
technological risks associated with the Company’s business; (ii) the effect of and changes in policies and laws or
regulatory agencies, including the Dodd-Frank Wall Street Reform and Consumer Protection Act and other legislation and
regulation relating to the banking industry; (iii) management’s ability to effectively execute its business plans; (iv) mergers
and acquisitions, including cost or difficulties related to the integration of acquired companies; (v) the Company’s ability to
comply with the terms of loss sharing agreements with the FDIC; (vi) the effect of changes in accounting policies and
practices; (vii) changes in consumer spending, borrowing and saving and changes in unemployment; (viii) changes in
customers’ performance and creditworthiness; and (ix) the costs and effects of litigation and of unexpected or adverse
outcomes in such litigation. Additional factors that may cause our actual results to differ materially from those described in
our forward-looking statements can be found in the Company’s Annual Report on Form 10-K for the year ended December
31, 2015, as well as its other filings with the SEC, which are available on the SEC website at www.sec.gov.
Forward-looking statements are meaningful only on the date when such statements are made. We undertake no
obligation to update any forward-looking statement to reflect events or circumstances that may arise after the date on
which a forward-looking statement is made.
Forward Looking Statement Disclosure
3
About First Financial Bancorp
Strategic Direction
Recent Financial Results
Presentation Contents
4
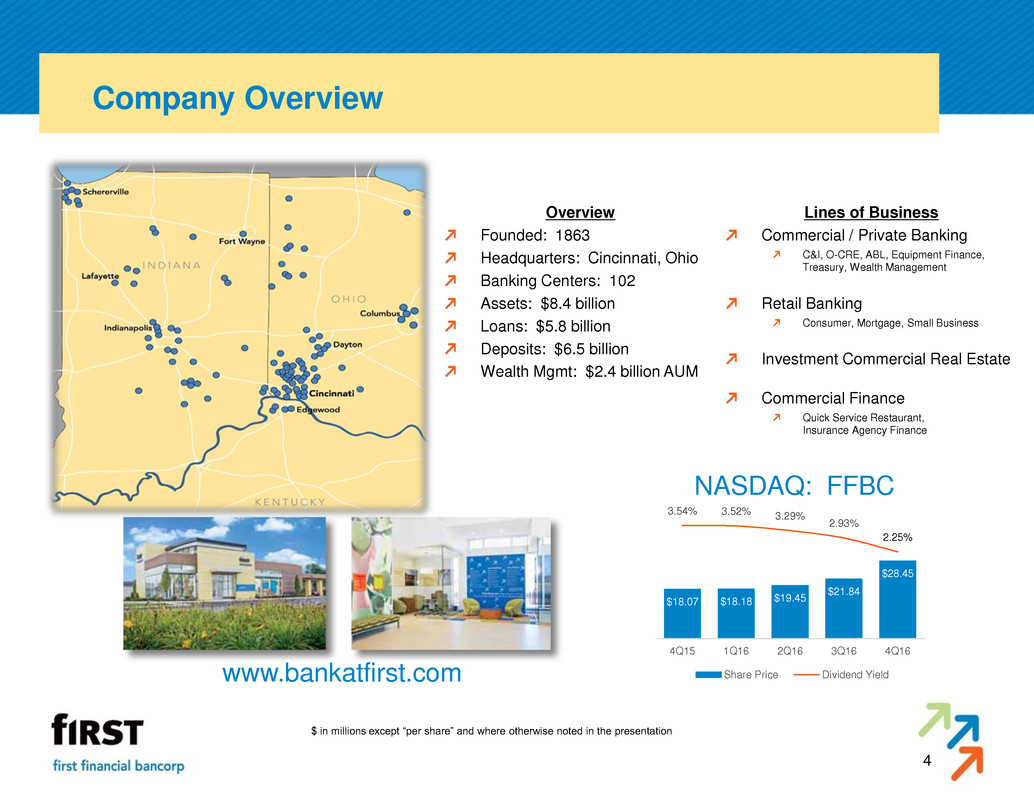
Company Overview
NASDAQ: FFBC
Overview
Founded: 1863
Headquarters: Cincinnati, Ohio
Banking Centers: 102
Assets: $8.4 billion
Loans: $5.8 billion
Deposits: $6.5 billion
Wealth Mgmt: $2.4 billion AUM
Lines of Business
Commercial / Private Banking
C&I, O-CRE, ABL, Equipment Finance,
Treasury, Wealth Management
Retail Banking
Consumer, Mortgage, Small Business
Investment Commercial Real Estate
Commercial Finance
Quick Service Restaurant,
Insurance Agency Finance
$ in millions except “per share” and where otherwise noted in the presentation
www.bankatfirst.com
$28.45
$21.84
$19.45 $18.18 $18.07
2.25%
2.93%
3.29% 3.52% 3.54%
4Q163Q162Q161Q164Q15
Share Price Dividend Yield

Central OH
Loans $1.0 billion
Loan Growth (Y-o-Y) 25.5%
Deposits $0.4 billion
Deposit Market Share #16 (0.7 %)
Banking Centers 6
Fortune 500 Companies 4
5
Our Markets
Indianapolis
Loans $0.4 billion
Loan Growth (Y-o-Y) 5.6%
Deposits $0.5 billion
Deposit Market Share #14 (1.2%)
Banking Centers 8
Fortune 500 Companies 3
Community Markets
Loans $1.2 billion
Loan Growth (Y-o-Y) 0.6%
Deposits $2.7 billion
Banking Centers 38
Greater Cincinnati
Loans $2.0 billion
Loan Growth (Y-o-Y) 7.9%
Deposits $2.5 billion
Deposit Market Share #6 (2.1%)
Banking Centers 50
Fortune 500 Companies 9

Proven Acquirer
Two FDIC-assisted acquisitions totaling $2.5 billion in assets & generating a $343 million pre-
tax bargain purchase gain (2009)
Two branch acquisitions of 38 offices in Indiana & Ohio (2011)
Three banks in Columbus, Ohio totaling $727 million in assets (2014)
Oak Street Funding, specialty lender focused on the insurance industry, $243 million in assets
(2015)
Effective Operator
105 consecutive quarters of profitability through 4Q 2016
Replaced the runoff of ~ $2 billion of high yield covered loans
Consolidated 78 banking centers in conjunction with efficiency efforts since 2009
Developed robust enterprise risk management & compliance programs, with board risk
committee since 2010
6
Through the Cycle

Product expansions (since 2009)
Specialty lending (~ $1.2 billion, across Franchise, Oak Street, ABL, and Equipment Finance)
Mobile banking & other technology enhancements for clients
Re-entry into mortgage business (2010)
2016 originations of $318 million
Wealth infrastructure improvements
Investment model
Real estate management, tax & insurance outsourcing
Significant technology & infrastructure investments
Continued expansion of risk management & compliance
7
Investments in our Business
Mortgage Origination Platform
Talent & Finance ERP Platform
Enterprise data management
Commercial & Consumer CRM

Proven & sustainable business model
Well managed through the cycle
Conservative operating philosophy
Consistent profitability – 105 consecutive quarters
Robust capital management
Prudent steward of shareholders’ capital
Strong asset quality
Well defined M&A strategy
Selective markets, products & asset diversification
Direct linkage between compensation and performance
Short/long term incentive plans, management stock ownership targets
8
Invest with First Financial

9
1 – includes dividend reinvestment
2 – peer group includes KBW regional bank index peers
Invest with First Financial
Total Shareholder Return1,2
172% 166%
117%
81%
62% 65%
157% 156%
50%
42%
117%
243%
197%
64%
51%
10 Year 7 Year 5 Year 3 Year FY 2016
FFBC KBW Peer Median KBW Peer Top Quartile

10
About First Financial Bancorp
Strategic Direction
Recent Financial Results

11
Operational Excellence
• Focus on cost, efficiency & volume
Client Intimacy
• Strong client focus
• Relationship driven
Product Leadership
• Develop new products, new markets &
new techniques
What does First Financial stand for?
Strategic Overview

Our strategy is to be the Premier Business Bank in the markets we
serve
“Bank the business, bank the owner & bank the employees.”
Rationale:
Our value proposition – relationship banking & sophisticated solutions – resonates with and
is desired by small / mid-size businesses
Alignment with our competitive advantage
By expanding relationships with our business clients, we can efficiently grow all areas of the
bank – Consumer, Wealth & Business Banking
12
Premier Business Bank Our Strategy

13
Connecting Strategy to Execution
13
14
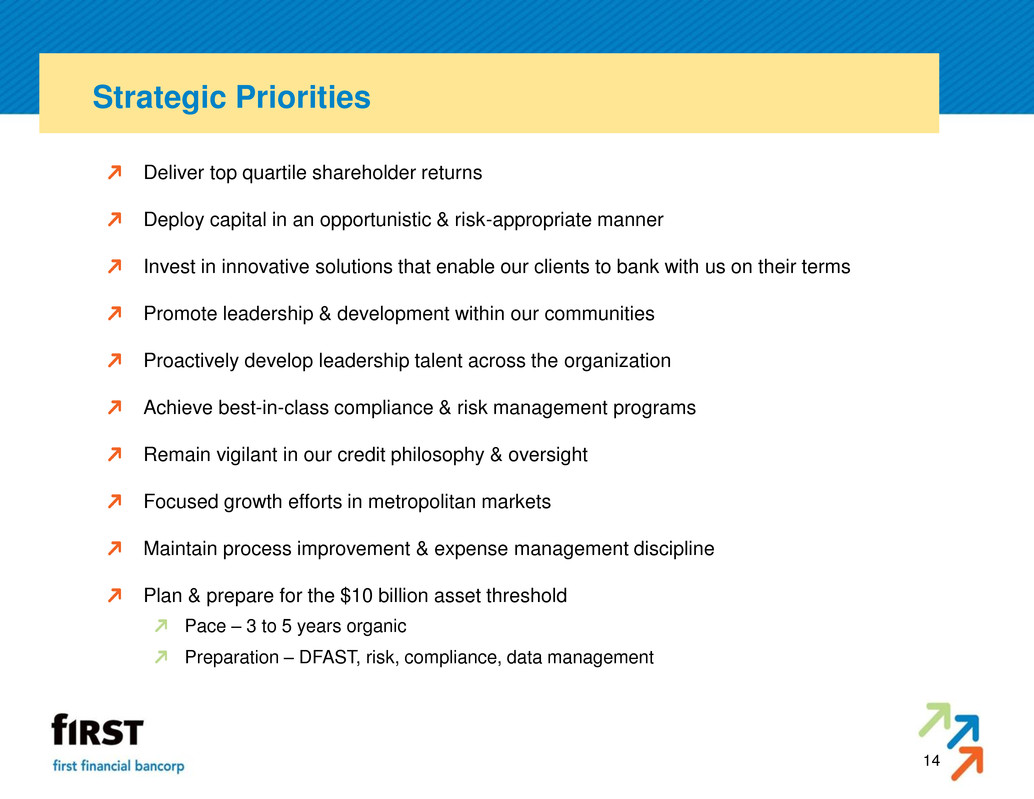
Strategic Priorities
Deliver top quartile shareholder returns
Deploy capital in an opportunistic & risk-appropriate manner
Invest in innovative solutions that enable our clients to bank with us on their terms
Promote leadership & development within our communities
Proactively develop leadership talent across the organization
Achieve best-in-class compliance & risk management programs
Remain vigilant in our credit philosophy & oversight
Focused growth efforts in metropolitan markets
Maintain process improvement & expense management discipline
Plan & prepare for the $10 billion asset threshold
Pace – 3 to 5 years organic
Preparation – DFAST, risk, compliance, data management

15
About First Financial Bancorp
Strategic Direction
Recent Financial Results

16
Full Year 2016 Highlights
Total assets increased $290.6 million, to $8.4 billion
EOP loans increased $368.7 million, or 6.8%.
EOP deposits increased $346.2 million, or 5.6%.
EOP investment securities decreased $113.8 million, or 5.9%.
Balance Sheet
Profitability
Asset Quality
Net Interest Income
&
Net Interest Margin
Noninterest Income
&
Noninterest Expense
Capital
Noninterest income = $69.6 million.
Noninterest expense = $201.4 million.
Efficiency ratio = 58.8%.
Effective tax rate of 32.3%.
Net interest income = $272.7 million, a $26.2 million increase.
Net interest margin increased by 2 bps to 3.62%; 3.68% on a fully tax equivalent basis.
Average earning assets increased 10%.
Net income = $88.5 million, or $1.43 per diluted share, a 17.9% increase.
Return on average assets = 1.07%.
Return on average shareholders’ equity = 10.48%.
Return on average tangible common equity = 13.96%.
Provision expense = $10.1 million. Net charge offs = $5.6 million. NCOs / Avg. Loans = 0.10%.
Nonperforming Loans / Total Loans = 0.83%. Nonperforming Assets / Total Assets = 0.64%.
ALLL / Nonaccrual Loans = 326.9%. ALLL / Total Loans = 1.01%.
Total capital ratio = 13.10%.
Tier 1 capital ratio = 10.46%.
Tangible common equity ratio = 7.96%.
Tangible book value per share = $10.56, a 9.0% increase.

17
4Q 2016 Highlights – 105th Consecutive Quarter of Profitability
Total assets increased $69.5 million, to $8.4 billion, or 3.3% annualized, compared to the linked quarter.
EOP loans declined $32.0 million, or 2.2% annualized, compared to the linked quarter.
EOP deposits increased $187.1 million, or 11.7% annualized, compared to the linked quarter.
EOP investment securities increased $54.1 million, or 12.3% annualized, compared to the linked quarter.
Balance Sheet
Profitability
Asset Quality
Net Interest Income
&
Net Interest Margin
Noninterest Income
&
Noninterest Expense
Capital
Noninterest income = $16.9 million.
Noninterest expense = $50.2 million.
Efficiency ratio = 57.6%.
Effective tax rate of 31.9%, including seasonal adjustments
Net interest income = $70.2 million, a $1.3 million increase compared to the linked quarter.
Net interest margin increased 5 bps to 3.66%; 3.71% on a fully tax equivalent basis.
Average earning assets grew 2.0% on an annualized basis.
Net income = $23.3 million or $0.38 per diluted share.
Return on average assets = 1.11%.
Return on average shareholders’ equity = 10.73%.
Return on average tangible common equity = 14.19%.
Provision expense = $2.8 million. Net charge offs = $2.4 million. NCOs / Avg. Loans = 0.17% annualized.
Nonperforming Loans / Total Loans = 0.83%. Nonperforming Assets / Total Assets = 0.64%.
ALLL / Nonaccrual Loans = 326.91%. ALLL / Total Loans = 1.01%.
Total capital ratio = 13.10%.
Tier 1 capital ratio = 10.46%.
Tangible common equity ratio = 7.96%.
Tangible book value per share = $10.56.

18
Strategy & Outlook
Focus remains on organic growth & executing our core strategy:
1. Growing loans at risk-appropriate returns
Strong organic growth opportunities resulting from the mix of markets, products & businesses
built over the last five years
Full year 2017 loan growth expected to be in the mid to high single digits on a percentage
basis
Stable net interest margin outlook in the near term
2. Growing core deposits to fund loan growth & generate fee income
Ever-present focus on growing low cost, core deposits
Continued proactive balance sheet management to support organic growth
3. Growing noninterest income to help build & diversify revenue
Strategies focused on product pricing, governance & client penetration
4. Maintaining our focus on efficiency & diligent expense management
Noninterest expense base expected to grow 2 - 3%
Full year 2017 effective tax rate of approximately 32 - 33%
5. Remaining vigilant in our credit oversight

19
Profitability
Net Income & EPS Return on Average Assets
Return on Tangible Common Equity
All dollars shown in millions
$23.3
$22.9 $22.6
$19.8 $19.8
$0.38 $0.37 $0.36
$0.32 $0.32
4Q163Q162Q161Q164Q15
Net Income EPS
$8,360 $8,322 $8,204 $8,119
$7,950
1.11% 1.09% 1.11%
0.98% 0.99%
4Q163Q162Q161Q164Q15
Average Assets ROAA
$653 $645
$626
$610 $606
14.19% 14.08% 14.49%
13.06% 12.98%
4Q163Q162Q161Q164Q15
Average Tangible Equity ROATCE

20
Adjusted Net Income
Reflects impact to net income from items that do not occur on a regular basis
Earnings Diluted EPS Earnings Diluted EPS
GAAP net income 23,294$ 0.38$ 22,850$ 0.37$
Less: noninterest income adjustments 1 - (398)
Plus: noninterest expense adjustments 2,3 86 411
Subtotal 23,380 22,863
Tax adjustments (31) (4)
Adjusted net income 23,349$ 0.38$ 22,859$ 0.37$
4Q 2016 3Q 2016
2
4Q 2016 noninterest expense includes $0.1 million in expenses related to the charter conversion
(Dollars in thousands)
1
3Q 2016 noninterest income includes $0.4 million in gains on sales of investment securities
3
3Q 2016 noninterest expense includes $0.8 million of severance expense, $0.2 million of gains related to branch consolidation activities and a $0.2 million legal recovery

21
Loan Portfolio
Loan Product Mix (EOP) Net Loan Change (Linked Quarter)
* Includes residential mortgage, home equity, installment, & credit card.
All dollars shown in millions
Highlights
33% 32% 33% 34% 33%
13% 14% 14% 14% 15%
29% 29% 28% 27% 27%
7% 7% 7%
6%
6%
18% 18% 19%
19%
20%
$5,757 $5,790 $5,701
$5,505
$5,389
4Q163Q162Q161Q164Q15
Commercial & Leasing Owner Occupied CRE Investor CRE
Construction Consumer Lending*
-$3.8
-$33.5
-$4.8
-$7.0
$23.8
-$6.8
Commercial & Leasing
Owner Occupied CRE
Owner Occupied Construction
Investor CRE
Investor Construction
Consumer Lending*
-$42.0
Total C&I
Portfolio remains well-balanced
4Q16 impacted by:
slower business activity
elevated prepayments
Continued focus on profitability and limiting
credit concentrations
Full year loan growth in line with target
Loan origination spreads improved throughout 2016

22
Loan Portfolio
Loan Portfolio By Geography 1
Average Loan Size & Rate 2
Nationwide Lending Platforms
1 Includes loans held for sale. Excludes purchase accounting loan marks.
2 Average loan balances in $000s, rate represents weighted average coupon & does not
include loan fees
3 Includes Oak Street, Franchise, shared national credits & other loans outside Ohio,
Indiana, & Kentucky.
$2,844
49%
$1,486
26%
$223
4%
$1,224
21%
Ohio
Indiana
Kentucky
National Business
$338
6%
$513
9%
$4,906
85%
Oak Street
Franchise
All Other Loans
3
$366 $398
$672
$899
$443
$113 $32
3.9% 4.0%
3.7%
5.3%
7.6%
4.0%
4.2%
C&I* OOCRE* ICRE* Franchise Oak Street Mortgage Home
Equity
Average Balance Weighted Average Rate
* Ex.Franchise & OSF

23
Loan Portfolio
C&I Loans By Industry 1 CRE Loans By Collateral 2
1 Industry types included in Other representing greater than 1% of total C&I loans include Agriculture, Public Administration, Retail Trade, Waste
Management, Other Services, Educational Services, Arts, Entertainment, & Recreation, and Transportation & Warehousing.
2 Collateral types included in Other representing greater than 1% of total CRE loans include Student Housing, Manufacturing Facility,
Nursing/Assisted Living, Strip Center, Recreation Facility, Church, Vacant Land Held for Development, and School/Education Related.
Accommodation
and Food Services
23%
Finance and
Insurance
21%
Manufacturing
14%
Wholesale
Trade
8%
Real Estate and
Rental and Leasing
6%
Professional,
Scientific, and
Technical Services
5%
Health Care and
Social Assistance
4%
Construction
3%
Other
16%
Retail
16%
Residential, Multi
Family 5+
14%
Office
12%
Restaurant
6%
Residential, 1-4
Family
6%
Industrial Facility
6%
Warehouse
5%
Hotel/Motel
5%
Medical Office
4%
Farmland
3%
All others
23%
24
Investment Portfolio
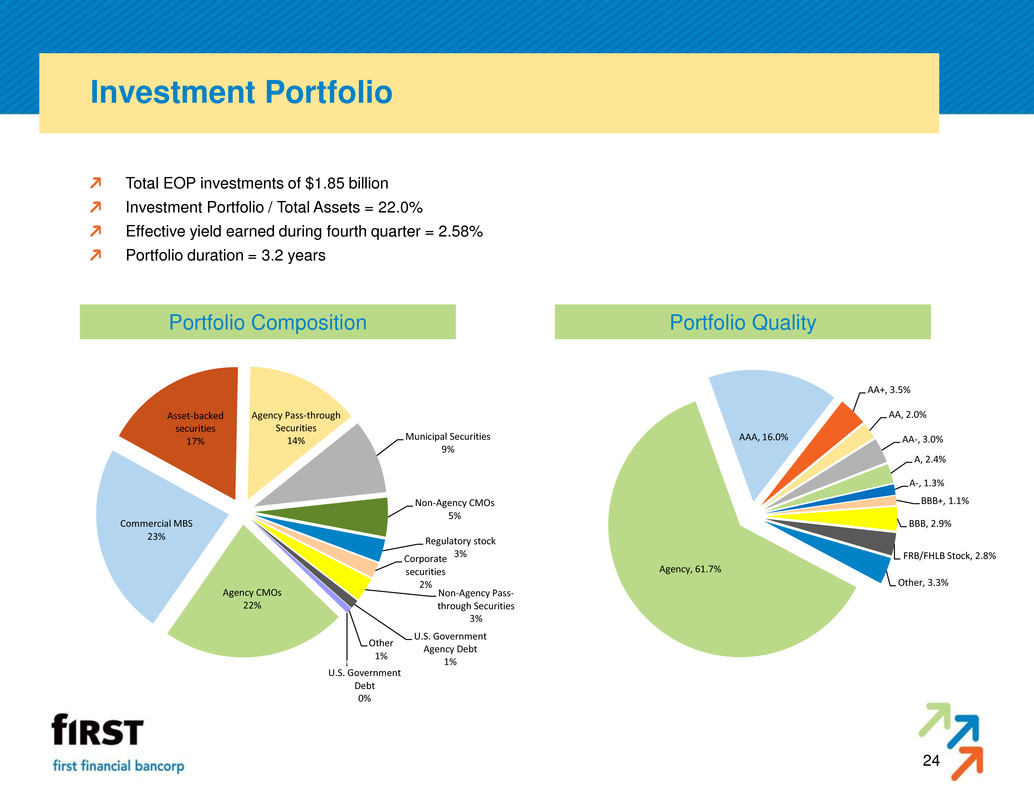
Total EOP investments of $1.85 billion
Investment Portfolio / Total Assets = 22.0%
Effective yield earned during fourth quarter = 2.58%
Portfolio duration = 3.2 years
Portfolio Composition Portfolio Quality
Agency CMOs
22%
Commercial MBS
23%
Asset-backed
securities
17%
Agency Pass-through
Securities
14% Municipal Securities
9%
Non-Agency CMOs
5%
Regulatory stock
3% Corporate
securities
2%
Non-Agency Pass-
through Securities
3%
U.S. Government
Agency Debt
1%
Other
1%
U.S. Government
Debt
0%
Agency, 61.7%
AAA, 16.0%
AA+, 3.5%
AA, 2.0%
AA-, 3.0%
A, 2.4%
A-, 1.3%
BBB+, 1.1%
BBB, 2.9%
FRB/FHLB Stock, 2.8%
Other, 3.3%

25
Asset Quality
Nonperforming Assets / Total Assets Classified Assets / Total Assets
Allowance / Total Loans Net Charge Offs & Provision Expense
All dollars shown in millions
$54.3 $58.0
$59.6 $64.1
$70.1
0.64%
0.69% 0.72%
0.78%
0.86%
4Q163Q162Q161Q164Q15
NPAs NPAs / Total Assets
$58.0 $57.6 $56.7 $53.7 $53.4
1.01% 1.00% 0.99% 0.98% 0.99%
4Q163Q162Q161Q164Q15
Allowance for Loan Losses ALLL / Total Loans
$125.2
$142.2 $143.3
$133.9 $132.4
1.48%
1.70% 1.72%
1.63% 1.63%
4Q163Q162Q161Q164Q15
Classified Assets Classified Assets / Total Assets
$2.4 $0.8 $1.1 $1.3 $1.8
$2.8
$1.7
$4.0
$1.7
$1.9
0.17%
0.05% 0.08%
0.10%
0.14%
4Q163Q162Q161Q164Q15
NCOs Provision Expense NCOs / Average Loans

26
Net Interest Income / Net Interest Margin
Gross loans include loans held for sale & FDIC indemnification asset
All dollars shown in millions
Average Deposits Net Interest Income
Average Securities Average Loans
$1,817 $1,811 $1,870
$1,939 $1,934
2.58%
2.50%
2.54% 2.59%
2.44%
4Q163Q162Q161Q164Q15
Average Investment Securities Investment Securities Yield
$5,794 $5,758
$5,584
$5,435
$5,267
4.57% 4.54% 4.55% 4.59%
4.62%
4Q163Q162Q161Q164Q15
Gross Loans Loan Yield
24% 23% 23% 23% 22%
23% 23% 24% 23% 23%
32% 33% 32% 32% 32%
21%
21% 21% 23% 23%
$6,557
$6,201 $6,309 $6,136 $6,247
0.37% 0.36% 0.35% 0.36%
0.33%
4Q163Q162Q161Q164Q15
Avg NIB Demand Avg IB Demand Avg Savings
Avg Time Cost of Deposits
$70.2 $68.8
$67.1 $66.6 $66.1
3.71% 3.66% 3.67% 3.68% 3.69%
4Q163Q162Q161Q164Q15
Net Interest Income Net Interest Margin (FTE)

27
Interest Rate Sensitivity
Loan Portfolio – Floating Loan Growth (1)
Sensitivity Trend (Up100, Up200) (3)
26% Y-o-Y growth in floating rate lending (1)
23% Y-o-Y growth in client derivatives (2)
% of loans repricing:
<=3 months 58%
Securities portfolio duration – 3.2 years
Non-maturity, interest bearing accounts
modeled to increase 68 bps in an “Up 100”
scenario
(1) As defined by EOP loans repricing in three months or less.
(2) As defined by client derivative notional balances.
(3) Immediate parallel shifts across a 12 month horizon
$0.001
$0.005
$0.018 $0.027 $0.020
$0.030
$0.038
$0.071
$0.100
$0.089
0.03% 0.16%
0.62% 0.89% 0.67%
1.03% 1.28%
2.42%
3.27% 2.96%
4Q15 1Q16 2Q16 3Q16 4Q16
Up100 Up200 Up100 Up200
EPS Impact Sensitivity
$2,676 $2,811
$3,179
$3,334 $3,368
49%
51%
56%
57%
58%
4Q15 1Q16 2Q16 3Q16 4Q16
Floating % of Gross Loans

28
Noninterest Income
Noninterest Income 4Q16 Highlights
* Includes net gain on sale of investment securities & other noninterest income.
All dollars shown in millions
Total other noninterest income was
unchanged from the linked quarter at
$16.9 million
Deposit service charge income was
unchanged from the linked quarter;
6.0% increase compared to fourth
quarter 2015
Client derivative income decreased
$0.7 million, or 61.5%
Gains from sales of mortgage loans
decreased $0.4 million, or 17.2%
Loss share related income increased
$0.9 million due to elevated
prepayment activity
30% 30% 22% 28% 30%
19% 19%
16% 22% 20%
19% 18%
15% 19% 19%
10% 12%
9%
8% 8%
3%
7% 9%
7% 6%
5%
6%
3% 4%
15% 15%
22%
14% 13%
$16.9 $16.9
$20.2
$15.5 $15.8
4Q163Q162Q161Q164Q15
Service Charges Wealth Mgmt
Bankcard Gains from sales of loans
Client derivatives Loss Share Income
Other *

29
Noninterest Expense
Noninterest Expense 4Q16 Highlights
Efficiency Ratio
All dollars shown in millions
Total noninterest expense declined $0.9 million,
or 1.8%, from the linked quarter
Salary & benefits expense declined $1.0
million, or 3.0%, from 3Q16, which included
$0.8 million of severance costs
OREO gains increased $0.8 million due to
favorable resolution of a single property
Professional services expense increased $0.3
million, or 18.6%, and includes $0.1 million of
charter conversion related costs
State intangible taxes declined $0.5 million, or
81.7% due to seasonal adjustments
Other noninterest expense increased $0.5
million, or 9.8%. 3Q16 included $0.4 million of
gains related to branch consolidation activities
$50.2
$51.1
$49.4
$50.7 $51.3
57.6%
59.6%
56.6%
61.8% 62.6%
4Q163Q162Q161Q164Q15
NIE Efficiency Ratio
62% 63% 60% 58% 58%
38% 37% 40% 42% 42%
$50.2 $51.1 $49.4 $50.7 $51.3
1,420 1,402 1,403 1,390 1,400
4Q163Q162Q161Q164Q15
Personnel Non-Personnel FTE

30
Capital
Tier 1 Common Equity
Tangible Book Value Total Capital
Tangible Common Equity
All capital numbers are considered preliminary
All dollars shown in millions
$654.6 $650.2
$635.5
$615.1
$597.5
$10.56 $10.50 $10.26 $9.94 $9.69
4Q163Q162Q161Q164Q15
Tangible Book Value Tangible Book Value per Share
$881.2 $865.2 $849.3 $831.9 $822.4
13.10% 12.82% 12.70% 12.84% 13.04%
12.50%
4Q163Q162Q161Q164Q15
Total Capital Total Capital Ratio Target
$703.9
$688.4
$673.3
$658.0
$648.7
10.46% 10.20% 10.07% 10.16% 10.28%
10.50%
4Q163Q162Q161Q164Q15
Tier 1 Common Equity Tier 1 Common Ratio Target
$654.6 $650.2
$635.5
$615.1
$597.5
7.96% 7.97% 7.85% 7.71% 7.53%
4Q163Q162Q161Q164Q15
Tangible Book Value Tangible Common Ratio
31
Appendix: Non-GAAP to GAAP Reconciliation
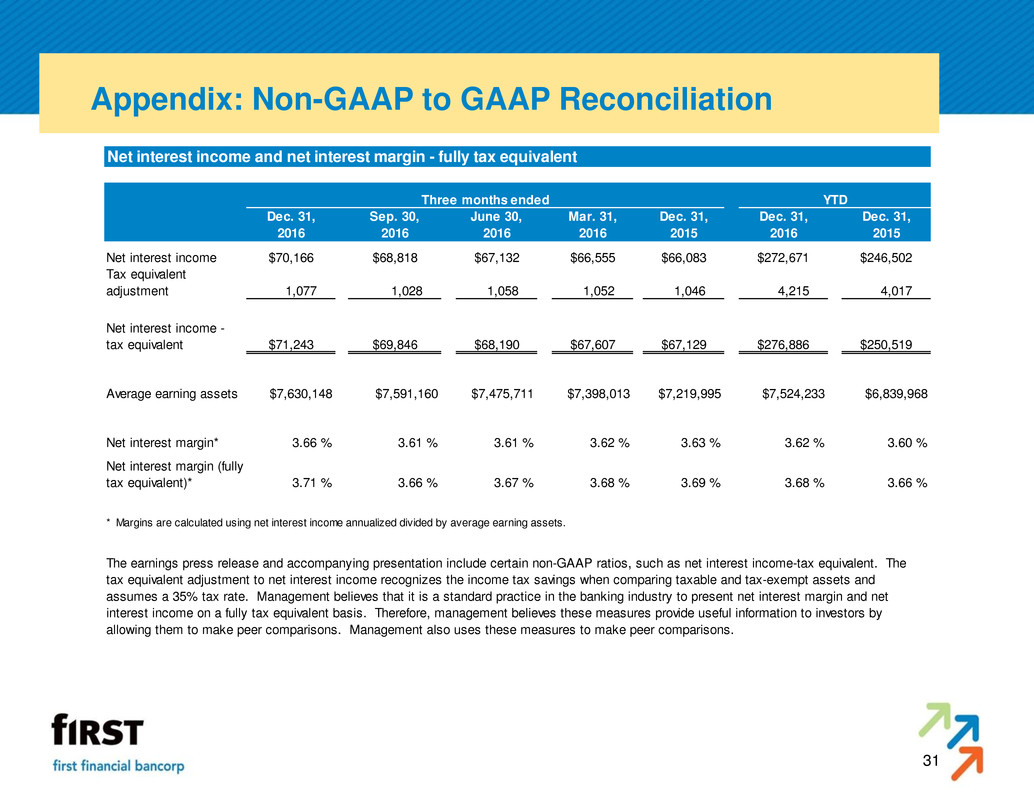
Net interest income and net interest margin - fully tax equivalent
Dec. 31, Sep. 30, June 30, Mar. 31, Dec. 31, Dec. 31, Dec. 31,
2016 2016 2016 2016 2015 2016 2015
Net interest income $70,166 $68,818 $67,132 $66,555 $66,083 $272,671 $246,502
Tax equivalent
adjustment 1,077 1,028 1,058 1,052 1,046 4,215 4,017
Net interest income -
tax equivalent $71,243 $69,846 $68,190 $67,607 $67,129 $276,886 $250,519
Average earning assets $7,630,148 $7,591,160 $7,475,711 $7,398,013 $7,219,995 $7,524,233 $6,839,968
Net interest margin* 3.66 % 3.61 % 3.61 % 3.62 % 3.63 % 3.62 % 3.60 %
Net interest margin (fully
tax equivalent)* 3.71 % 3.66 % 3.67 % 3.68 % 3.69 % 3.68 % 3.66 %
Three months ended YTD
* Margins are calculated using net interest income annualized divided by average earning assets.
The earnings press release and accompanying presentation include certain non-GAAP ratios, such as net interest income-tax equivalent. The
tax equivalent adjustment to net interest income recognizes the income tax savings when comparing taxable and tax-exempt assets and
assumes a 35% tax rate. Management believes that it is a standard practice in the banking industry to present net interest margin and net
interest income on a fully tax equivalent basis. Therefore, management believes these measures provide useful information to investors by
allowing them to make peer comparisons. Management also uses these measures to make peer comparisons.
32
Appendix: Non-GAAP to GAAP Reconciliation
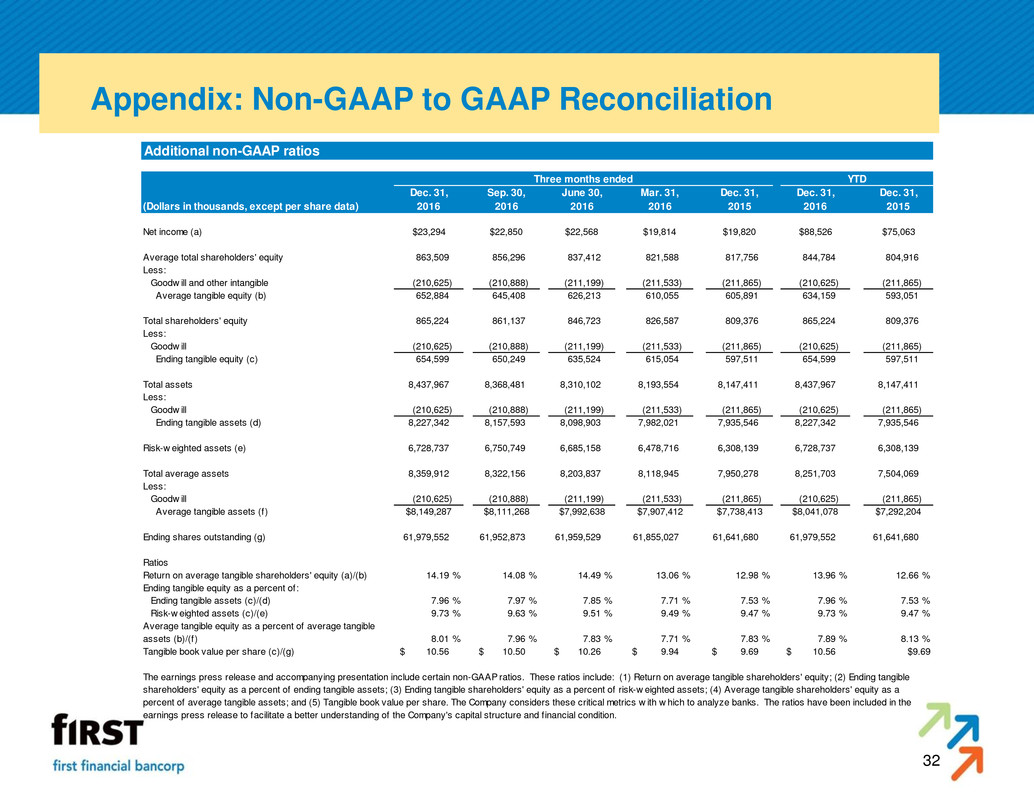
Additional non-GAAP ratios
Dec. 31, Sep. 30, June 30, Mar. 31, Dec. 31, Dec. 31, Dec. 31,
(Dollars in thousands, except per share data) 2016 2016 2016 2016 2015 2016 2015
Net income (a) $23,294 $22,850 $22,568 $19,814 $19,820 $88,526 $75,063
Average total shareholders' equity 863,509 856,296 837,412 821,588 817,756 844,784 804,916
Less:
Goodw ill and other intangible (210,625) (210,888) (211,199) (211,533) (211,865) (210,625) (211,865)
Average tangible equity (b) 652,884 645,408 626,213 610,055 605,891 634,159 593,051
Total shareholders' equity 865,224 861,137 846,723 826,587 809,376 865,224 809,376
Less:
Goodw ill (210,625) (210,888) (211,199) (211,533) (211,865) (210,625) (211,865)
Ending tangible equity (c) 654,599 650,249 635,524 615,054 597,511 654,599 597,511
Total assets 8,437,967 8,368,481 8,310,102 8,193,554 8,147,411 8,437,967 8,147,411
Less:
Goodw ill (210,625) (210,888) (211,199) (211,533) (211,865) (210,625) (211,865)
Ending tangible assets (d) 8,227,342 8,157,593 8,098,903 7,982,021 7,935,546 8,227,342 7,935,546
Risk-w eighted assets (e) 6,728,737 6,750,749 6,685,158 6,478,716 6,308,139 6,728,737 6,308,139
Total average assets 8,359,912 8,322,156 8,203,837 8,118,945 7,950,278 8,251,703 7,504,069
Less:
Goodw ill (210,625) (210,888) (211,199) (211,533) (211,865) (210,625) (211,865)
Average tangible assets (f) $8,149,287 $8,111,268 $7,992,638 $7,907,412 $7,738,413 $8,041,078 $7,292,204
Ending shares outstanding (g) 61,979,552 61,952,873 61,959,529 61,855,027 61,641,680 61,979,552 61,641,680
Ratios
Return on average tangible shareholders' equity (a)/(b) 14.19 % 14.08 % 14.49 % 13.06 % 12.98 % 13.96 % 12.66 %
Ending tangible equity as a percent of:
Ending tangible assets (c)/(d) 7.96 % 7.97 % 7.85 % 7.71 % 7.53 % 7.96 % 7.53 %
Risk-w eighted assets (c)/(e) 9.73 % 9.63 % 9.51 % 9.49 % 9.47 % 9.73 % 9.47 %
Average tangible equity as a percent of average tangible
assets (b)/(f) 8.01 % 7.96 % 7.83 % 7.71 % 7.83 % 7.89 % 8.13 %
Tangible book value per share (c)/(g) 10.56$ 10.50$ 10.26$ 9.94$ 9.69$ 10.56$ $9.69
Three months ended YTD
The earnings press release and accompanying presentation include certain non-GAAP ratios. These ratios include: (1) Return on average tangible shareholders' equity; (2) Ending tangible
shareholders' equity as a percent of ending tangible assets; (3) Ending tangible shareholders' equity as a percent of risk-w eighted assets; (4) Average tangible shareholders' equity as a
percent of average tangible assets; and (5) Tangible book value per share. The Company considers these critical metrics w ith w hich to analyze banks. The ratios have been included in the
earnings press release to facilitate a better understanding of the Company's capital structure and f inancial condition.

33
Serious News for Serious Traders! Try StreetInsider.com Premium Free!
You May Also Be Interested In
- First Financial Bancorp (FFBC) Reports In-Line Q1 EPS
- Robbins LLP Reminds LYFT Stockholders of Pending May 6, 2024 Lead Plaintiff Deadline
- ROSEN, A LEADING NATIONAL FIRM, Encourages Sharecare, Inc. Investors to Secure Counsel Before Important Deadline in Securities Class Action First Filed by the Firm – SHCR
Create E-mail Alert Related Categories
SEC FilingsSign up for StreetInsider Free!
Receive full access to all new and archived articles, unlimited portfolio tracking, e-mail alerts, custom newswires and RSS feeds - and more!


 Tweet
Tweet Share
Share