

Form 8-K DEVON ENERGY CORP/DE For: Feb 17
 Tweet
Tweet Share
Share
UNITED STATES
SECURITIES AND EXCHANGE COMMISSION
Washington, D.C. 20549
FORM 8-K
CURRENT REPORT
Pursuant to Section 13 or 15(d)
of the Securities Exchange Act of 1934
Date of Report (Date of earliest event reported): February 17, 2015
DEVON ENERGY CORPORATION
(Exact Name of Registrant as Specified in its Charter)
| DELAWARE | 001-32318 | 73-1567067 | ||
| (State or Other Jurisdiction of Incorporation or Organization |
(Commission File Number) |
(IRS Employer Identification Number) | ||
| 333 W. SHERIDAN AVE., OKLAHOMA CITY, OK |
73102 | |||
| (Address of Principal Executive Offices) |
(Zip Code) | |||
Registrant’s telephone number, including area code: (405) 235-3611
Check the appropriate box below if the Form 8-K filing is intended to simultaneously satisfy the filing obligation of the registrant under any of the following provisions:
| ¨ | Written communications pursuant to Rule 425 under the Securities Act (17 CFR 230.425) |
| ¨ | Soliciting material pursuant to Rule 14a-12 under the Exchange Act (17 CFR 240.14a-12) |
| ¨ | Pre-commencement communications pursuant to Rule 14d-2(b) under the Exchange Act (17 CFR 240.14d-2(b)) |
| ¨ | Pre-commencement communications pursuant to Rule 13e-4(c) under the Exchange Act (17 CFR 240.13e-4(c)) |
| Item 2.02 | Results of Operations and Financial Condition |
Devon Energy Corporation hereby furnishes the information set forth in its Operations Report that was published on its website on February 17, 2015, a copy of which is attached as Exhibit 99.1.
| Item 9.01 | Financial Statements and Exhibits |
(d) Exhibits
| 99.1 | Q4 2014 Operations Report published on devonenergy.com on February 17, 2014. |
Page 2 of 3
SIGNATURES
Pursuant to the requirements of the Securities Exchange Act of 1934, the registrant has duly caused this report to be signed on its behalf by the undersigned hereto duly authorized.
| DEVON ENERGY CORPORATION | ||
| By: | /s/ Thomas L. Mitchell | |
| Thomas L. Mitchell | ||
| Executive Vice President and | ||
| Chief Financial Officer | ||
Date: February 20, 2015
Page 3 of 3
| Exhibit 99.1
P
|
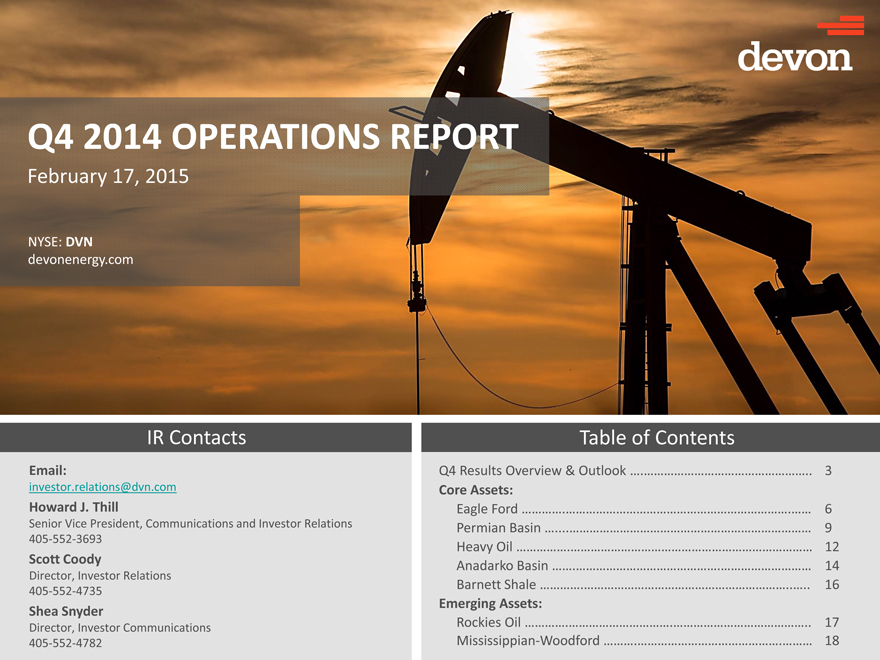
Q4 2014 OPERATIONS REPORT
February 17, 2015
NYSE: DVN devonenergy.com
IR Contacts
Email: [email protected]
Howard J. Thill
Senior Vice President, Communications and Investor Relations 405-552-3693
Scott Coody
Director, Investor Relations 405-552-4735
Shea Snyder
Director, Investor Communications 405-552-4782
Table of Contents
Q4 Results Overview & Outlook 3
Core Assets:
Eagle Ford 6
Permian Basin 9
Heavy Oil 12
Anadarko Basin 14
Barnett Shale 16
Emerging Assets:
Rockies Oil 17
Mississippian-Woodford 18
|
|
INVESTOR NOTICES
Forward-Looking Statements: Information provided in this report includes “forward-looking statements” as defined by the Securities and Exchange Commission. Forward-looking statements are often identified by use of the words “forecasts”, “projections”, “estimates”, “plans”, “expectations”, “targets”, “opportunities”, “potential”, “outlook”, and other similar terminology.” Such statements are subject to a variety of risk factors. A discussion of risk factors that could cause Devon’s actual results to differ materially from the forward-looking statements contained herein are outlined below.
The forward-looking statements provided in this report are based on management’s examination of historical operating trends, the information which was used to prepare reserve reports and other data in Devon’s possession or available from third parties. Devon cautions that its future oil, natural gas and NGL production, revenues and expenses are subject to all of the risks and uncertainties normally incident to the exploration for and development, production and sale of oil, gas and NGL. These risks include, but are not limited to, price volatility, inflation or lack of availability of goods and services, environmental risks, drilling risks, political changes, changes in laws or regulations, the uncertainty inherent in estimating future oil and gas production or reserves, and other risks identified in our Form 10-K and our other filings with the SEC.
Specific Assumptions and Risks Related to Price and Production Estimates: A significant and prolonged deterioration in market conditions and the other assumptions on which our estimates are based will impact many aspects of our business and our results. Substantially all of Devon’s revenues are attributable to sales, processing and transportation of three commodities: oil, natural gas and NGL. Prices for oil, natural gas and NGL are determined primarily by prevailing market conditions, which may be impacted by a variety of general and specific factors that are difficult to control or predict. Worldwide and regional economic conditions, weather and other local market conditions influence the supply of and demand for energy commodities. In particular, concerns about the level of global crude-oil and natural-gas inventories and the production trends of significant oil producers like OPEC, among other things, have led to a significant drop in prices. In addition to volatility from general market conditions, Devon’s oil, natural gas and NGL prices may vary considerably due to factors specific to Devon, such as pricing differentials among the various regional markets in which our products are sold, the value derivable from the quality of oil Devon produces (i.e., sweet crude versus heavy or sour crude),the Btu content of gas produced, the availability and capacity of transportation facilities we may utilize, and the costs and demand for the various products derived from oil, natural gas and NGL.
Estimates for Devon’s future production of oil, natural gas and NGL are based on the assumption that market demand and prices for oil, natural gas and NGL will be at levels that allow for profitable production of these products. As illustrated by recent market trends, there can be no assurance of such stability. Much of Devon’s production in Canada is subject to government royalties that fluctuate with prices, which, therefore, will affect reported production. Estimates for Devon’s future processing and transportation of oil, natural gas and NGL are based on the assumption that market demand and prices for oil, natural gas and NGL will be at levels that allow for profitable processing and transport of these products. As with our production estimates, there can be no assurance of such stability. The production, transportation, processing and marketing of oil, natural gas and NGL are complex processes which are subject to disruption due to transportation and processing availability, mechanical failure, human error, meteorological events including, but not limited to, tornadoes, extreme temperatures, and numerous other factors.
Assumptions and Risks Related to Capital Expenditures Estimates: Devon’s capital expenditures budget is based on an expected range of future oil, natural gas and NGL prices as well as the expected costs of the capital additions. Should actual prices received differ materially from Devon’s price expectations for its future production, some projects may be accelerated or deferred and, consequently, may increase or decrease capital expenditures. In addition, if the actual material or labor costs of the budgeted items vary significantly from the anticipated amounts, actual capital expenditures could vary materially from Devon’s estimates. Assumptions and Risks Related to Marketing and Midstream Estimates: Devon cautions that its future marketing and midstream revenues and expenses are subject to all of the risks and uncertainties normally incident to the marketing and midstream business. These risks include, but are not limited to, price volatility, environmental risks, mechanical failures, regulatory changes, the uncertainty inherent in estimating future processing volumes and pipeline throughput, cost of goods and services and other risks.
Q4 2014 OPERATIONS REPORT
2
|
|
Q4 RESULTS OVERVIEW & OUTLOOK
Repositioned Portfolio Continues to Exceed Production Expectations
Overall, total production in Q4 from Devon’s repositioned portfolio increased 20% year over year to 664,000 Boe per day. Superior execution across the portfolio drove top-line production to exceed the upper end of the company’s recently revised guidance range by 9,000 Boe per day.
Oil production from Devon’s retained assets averaged 239,000 barrels per day, exceeding the top end of its guidance range by 1,000 barrels per day. This is the highest average daily oil rate in company history and represents a growth rate of 48% compared to the fourth quarter of 2013 (chart below).
The most significant growth came from the company’s U.S. operations, where oil production increased 82% year over year. The substantial growth in U.S. oil production is attributable to Devon’s Eagle Ford and Delaware Basin operations.
Q4 Oil Production(1) Q4 Production Mix
(MBOD)
239
161
48% 43% 36%
Growth
21%
Q4 2013 Q4 2014
U.S. Canada Oil NGL Gas
(1) Excludes non-core divested assets.
With the strong growth in U.S. oil production, which is the company’s highest margin product, liquids volumes now account for 57% of Devon’s retained asset production mix (chart above), up from around 30% a few years ago.
TOTAL COMPANY Q4 STATS*
Q4 2014 Q4 2013
Production:
Oil (MBOD) 239 161
NGL (MBLD) 141 114
Gas (MMCFD) 1,707 1,667
MBOED 664 553
E&P Capital (in millions): $1,579
Operated Rigs (at 12/31/14): 43
* Excludes non-core divested assets.
Heavy Oil
Rockies Oil
Woodford Mississippian- Anadarko Basin Permian Basin Barnett Shale Eagle Ford Core Assets Emerging Assets
Q4 2014 OPERATIONS REPORT
3
|
|
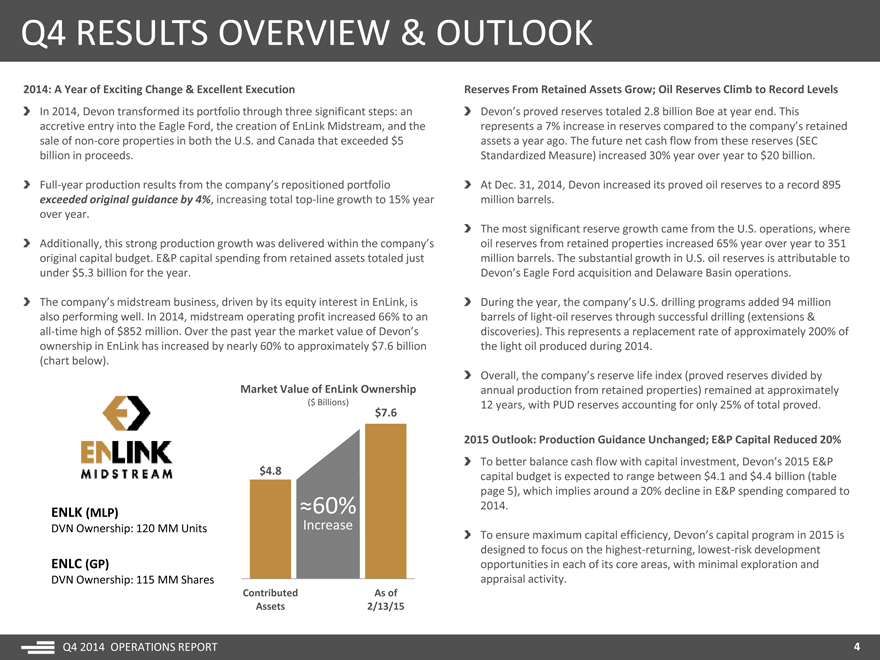
Q4 RESULTS OVERVIEW & OUTLOOK
2014: A Year of Exciting Change & Excellent Execution
In 2014, Devon transformed its portfolio through three significant steps: an accretive entry into the Eagle Ford, the creation of EnLink Midstream, and the sale of non-core properties in both the U.S. and Canada that exceeded $5 billion in proceeds.
Full-year production results from the company’s repositioned portfolio exceeded original guidance by 4%, increasing total top-line growth to 15% year over year.
Additionally, this strong production growth was delivered within the company’s original capital budget. E&P capital spending from retained assets totaled just under $5.3 billion for the year.
The company’s midstream business, driven by its equity interest in EnLink, is also performing well. In 2014, midstream operating profit increased 66% to an all-time high of $852 million. Over the past year the market value of Devon’s ownership in EnLink has increased by nearly 60% to approximately $7.6 billion (chart below).
Market Value of EnLink Ownership
($ Billions) $7.6
$4.8
ENLK (MLP) ?60%
DVN Ownership: 120 MM Units Increase
ENLC (GP)
DVN Ownership: 115 MM Shares
Contributed As of Assets 2/13/15
Reserves From Retained Assets Grow; Oil Reserves Climb to Record Levels
Devon’s proved reserves totaled 2.8 billion Boe at year end. This represents a 7% increase in reserves compared to the company’s retained assets a year ago. The future net cash flow from these reserves (SEC Standardized Measure) increased 30% year over year to $20 billion.
At Dec. 31, 2014, Devon increased its proved oil reserves to a record 895 million barrels.
The most significant reserve growth came from the U.S. operations, where oil reserves from retained properties increased 65% year over year to 351 million barrels. The substantial growth in U.S. oil reserves is attributable to Devon’s Eagle Ford acquisition and Delaware Basin operations.
During the year, the company’s U.S. drilling programs added 94 million barrels of light-oil reserves through successful drilling (extensions & discoveries). This represents a replacement rate of approximately 200% of the light oil produced during 2014.
Overall, the company’s reserve life index (proved reserves divided by annual production from retained properties) remained at approximately 12 years, with PUD reserves accounting for only 25% of total proved.
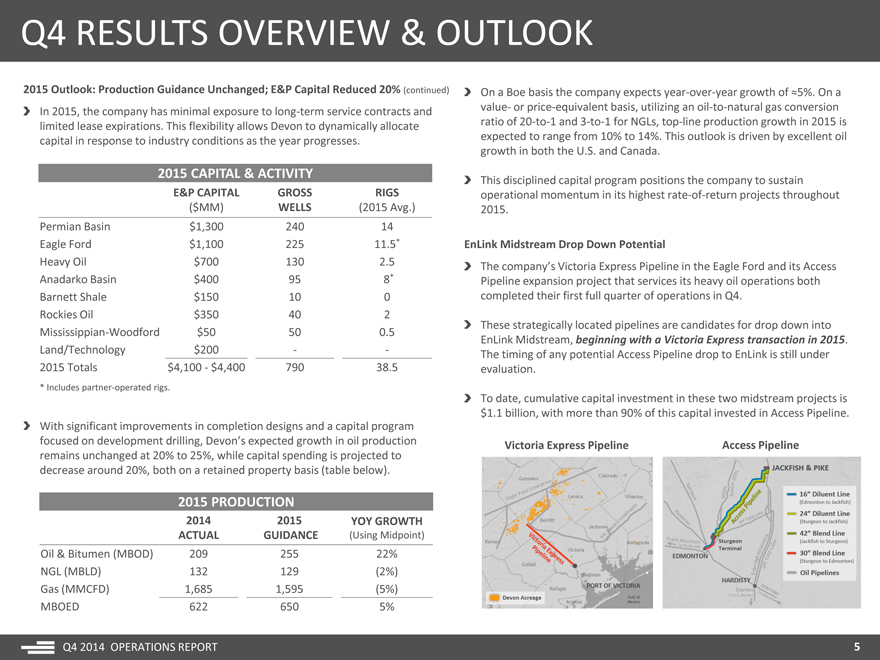
2015 Outlook: Production Guidance Unchanged; E&P Capital Reduced 20%
To better balance cash flow with capital investment, Devon’s 2015 E&P capital budget is expected to range between $4.1 and $4.4 billion (table page 5), which implies around a 20% decline in E&P spending compared to 2014.
To ensure maximum capital efficiency, Devon’s capital program in 2015 is designed to focus on the highest-returning, lowest-risk development opportunities in each of its core areas, with minimal exploration and appraisal activity.
Q4 2014 OPERATIONS REPORT
| 4 |
|
|
|
Q4 RESULTS OVERVIEW & OUTLOOK
2015 Outlook: Production Guidance Unchanged; E&P Capital Reduced 20% (continued)
In 2015, the company has minimal exposure to long-term service contracts and limited lease expirations. This flexibility allows Devon to dynamically allocate capital in response to industry conditions as the year progresses.
2015 CAPITAL & ACTIVITY
E&P CAPITAL GROSS RIGS
($MM) WELLS(2015 Avg.)
Permian Basin $1,300 240 14
Eagle Ford $1,100 225 11.5*
Heavy Oil $700 130 2.5
Anadarko Basin $400 95 8*
Barnett Shale $150 10 0
Rockies Oil $350 40 2
Mississippian-Woodford $50 50 0.5
Land/Technology $200 —
2015 Totals $4,100—$4,400 790 38.5
* Includes partner-operated rigs.
With significant improvements in completion designs and a capital program focused on development drilling, Devon’s expected growth in oil production remains unchanged at 20% to 25%, while capital spending is projected to decrease around 20%, both on a retained property basis (table below).
2015 PRODUCTION
2014 2015 YOY GROWTH
ACTUAL GUIDANCE (Using Midpoint)
Oil & Bitumen (MBOD) 209 255 22%
NGL (MBLD) 132 129 (2%)
Gas (MMCFD) 1,685 1,595 (5%)
MBOED 622 650 5%
Q4 2014 OPERATIONS REPORT
On a Boe basis the company expects year-over-year growth of ?5%. On a value- or price-equivalent basis, utilizing an oil-to-natural gas conversion ratio of 20-to-1 and 3-to-1 for NGLs, top-line production growth in 2015 is expected to range from 10% to 14%. This outlook is driven by excellent oil growth in both the U.S. and Canada.
This disciplined capital program positions the company to sustain operational momentum in its highest rate-of-return projects throughout 2015.
EnLink Midstream Drop Down Potential
The company’s Victoria Express Pipeline in the Eagle Ford and its Access Pipeline expansion project that services its heavy oil operations both completed their first full quarter of operations in Q4.
These strategically located pipelines are candidates for drop down into
EnLink Midstream, beginning with a Victoria Express transaction in 2015.
The timing of any potential Access Pipeline drop to EnLink is still under evaluation.
To date, cumulative capital investment in these two midstream projects is $1.1 billion, with more than 90% of this capital invested in Access Pipeline.
Victoria Express Pipeline Access Pipeline
5
|
|
EAGLE FORD
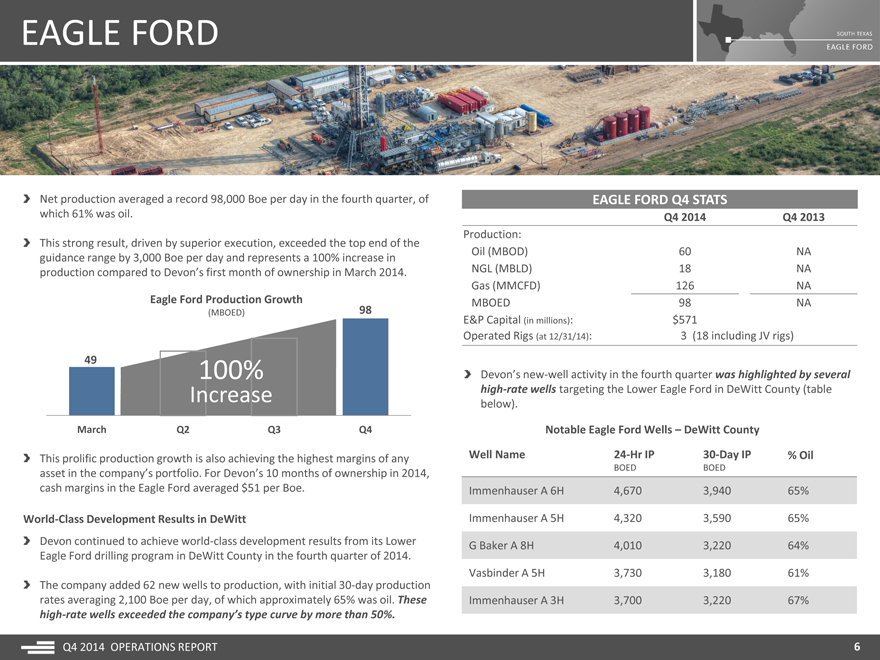
Net production averaged a record 98,000 Boe per day in the fourth quarter, of which 61% was oil.
This strong result, driven by superior execution, exceeded the top end of the guidance range by 3,000 Boe per day and represents a 100% increase in production compared to Devon’s first month of ownership in March 2014.
Eagle Ford Production Growth
(MBOED) 98
49 100%
Increase
March Q2 Q3 Q4
This prolific production growth is also achieving the highest margins of any asset in the company’s portfolio. For Devon’s 10 months of ownership in 2014, cash margins in the Eagle Ford averaged $51 per Boe.
World-Class Development Results in DeWitt
Devon continued to achieve world-class development results from its Lower Eagle Ford drilling program in DeWitt County in the fourth quarter of 2014.
The company added 62 new wells to production, with initial 30-day production rates averaging 2,100 Boe per day, of which approximately 65% was oil. These high-rate wells exceeded the company’s type curve by more than 50%.
EAGLE FORD Q4 STATS
Q4 2014 Q4 2013
Production:
Oil (MBOD) 60 NA
NGL (MBLD) 18 NA
Gas (MMCFD) 126 NA
MBOED 98 NA
E&P Capital (in millions): $571
Operated Rigs (at 12/31/14): 3 (18 including JV rigs)
Devon’s new-well activity in the fourth quarter was highlighted by several high-rate wells targeting the Lower Eagle Ford in DeWitt County (table below).
Notable Eagle Ford Wells – DeWitt County
Well Name 24-Hr IP 30-Day IP% Oil
BOED BOED
Immenhauser A 6H 4,670 3,940 65%
Immenhauser A 5H 4,320 3,590 65%
G Baker A 8H 4,010 3,220 64%
Vasbinder A 5H 3,730 3,180 61%
Immenhauser A 3H 3,700 3,220 67%
Q4 2014 OPERATIONS REPORT
6
|
|
EAGLE FORD
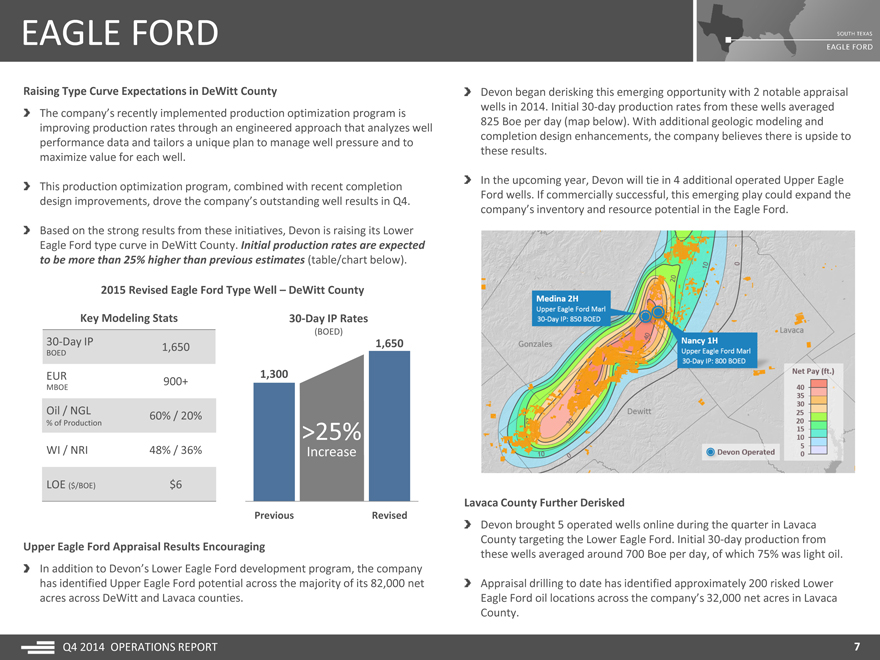
Raising Type Curve Expectations in DeWitt County
The company’s recently implemented production optimization program is improving production rates through an engineered approach that analyzes well performance data and tailors a unique plan to manage well pressure and to maximize value for each well.
This production optimization program, combined with recent completion design improvements, drove the company’s outstanding well results in Q4.
Based on the strong results from these initiatives, Devon is raising its Lower Eagle Ford type curve in DeWitt County. Initial production rates are expected to be more than 25% higher than previous estimates (table/chart below).
2015 Revised Eagle Ford Type Well – DeWitt County
Key Modeling Stats 30-Day IP Rates
(BOED)
30-Day IP 1,650 1,650
BOED
EUR 1,300
900+
MBOE
Oil / NGL 60% / 20%
% of Production >25%
WI / NRI 48% / 36% Increase
LOE ($/BOE) $6
Previous Revised
Upper Eagle Ford Appraisal Results Encouraging
In addition to Devon’s Lower Eagle Ford development program, the company has identified Upper Eagle Ford potential across the majority of its 82,000 net acres across DeWitt and Lavaca counties.
Devon began derisking this emerging opportunity with 2 notable appraisal wells in 2014. Initial 30-day production rates from these wells averaged 825 Boe per day (map below). With additional geologic modeling and completion design enhancements, the company believes there is upside to these results.
In the upcoming year, Devon will tie in 4 additional operated Upper Eagle Ford wells. If commercially successful, this emerging play could expand the company’s inventory and resource potential in the Eagle Ford.
Lavaca County Further Derisked
Devon brought 5 operated wells online during the quarter in Lavaca County targeting the Lower Eagle Ford. Initial 30-day production from these wells averaged around 700 Boe per day, of which 75% was light oil.
Appraisal drilling to date has identified approximately 200 risked Lower Eagle Ford oil locations across the company’s 32,000 net acres in Lavaca County.
Q4 2014 OPERATIONS REPORT
7
|
|
EAGLE FORD
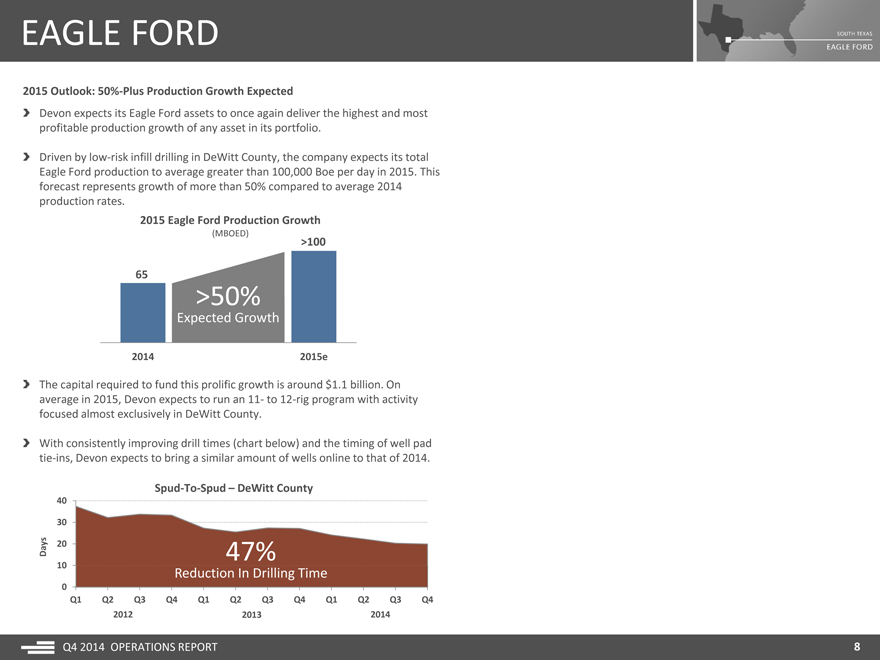
2015 Outlook: 50%-Plus Production Growth Expected
Devon expects its Eagle Ford assets to once again deliver the highest and most profitable production growth of any asset in its portfolio.
Driven by low-risk infill drilling in DeWitt County, the company expects its total Eagle Ford production to average greater than 100,000 Boe per day in 2015. This forecast represents growth of more than 50% compared to average 2014 production rates.
2015 Eagle Ford Production Growth
(MBOED)
>100
65
>50%
Expected Growth
2014 2015e
The capital required to fund this prolific growth is around $1.1 billion. On average in 2015, Devon expects to run an 11- to 12-rig program with activity focused almost exclusively in DeWitt County.
With consistently improving drill times (chart below) and the timing of well pad tie-ins, Devon expects to bring a similar amount of wells online to that of 2014.
Spud-To-Spud – DeWitt County
40 30
Days 20 47%
10 Reduction In Drilling Time
0
Q1 Q2 Q3 Q4 Q1 Q2 Q3 Q4 Q1 Q2 Q3 Q4 2012 2013 2014
Q4 2014 OPERATIONS REPORT
8
|
|
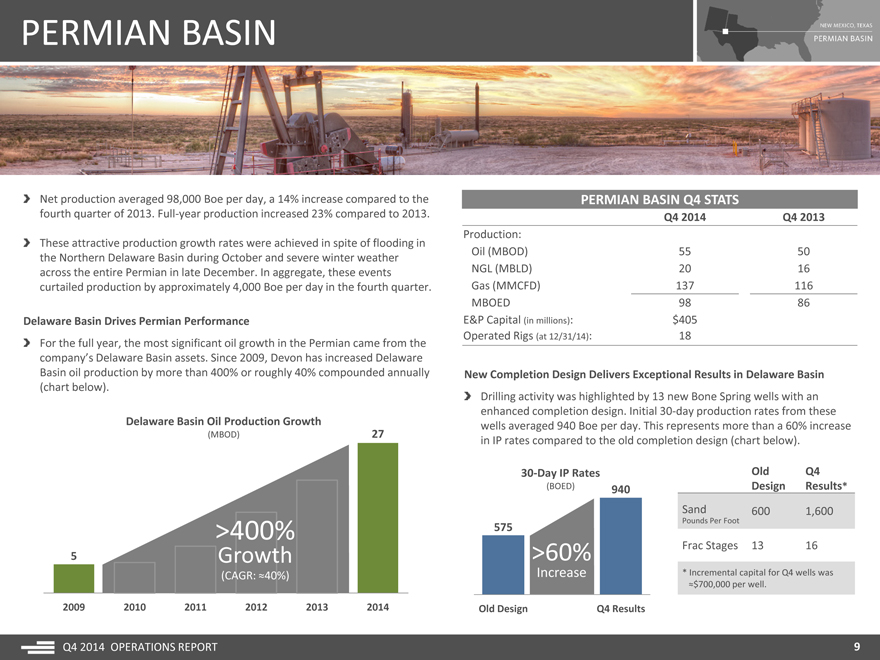
PERMIAN BASIN
Net production averaged 98,000 Boe per day, a 14% increase compared to the fourth quarter of 2013. Full-year production increased 23% compared to 2013.
These attractive production growth rates were achieved in spite of flooding in the Northern Delaware Basin during October and severe winter weather across the entire Permian in late December. In aggregate, these events curtailed production by approximately 4,000 Boe per day in the fourth quarter.
Delaware Basin Drives Permian Performance
For the full year, the most significant oil growth in the Permian came from the company’s Delaware Basin assets. Since 2009, Devon has increased Delaware Basin oil production by more than 400% or roughly 40% compounded annually (chart below).
Delaware Basin Oil Production Growth
(MBOD) 27
>400%
5 Growth
(CAGR: ?40%)
2009 2010 2011 2012 2013 2014
PERMIAN BASIN Q4 STATS
Q4 2014 Q4 2013
Production:
Oil (MBOD) 55 50 NGL (MBLD) 20 16 Gas (MMCFD) 137 116 MBOED 98 86 E&P Capital (in millions): $405 Operated Rigs (at 12/31/14): 18
New Completion Design Delivers Exceptional Results in Delaware Basin
Drilling activity was highlighted by 13 new Bone Spring wells with an enhanced completion design. Initial 30-day production rates from these wells averaged 940 Boe per day. This represents more than a 60% increase in IP rates compared to the old completion design (chart below).
30-Day IP Rates Old Q4 (BOED) 940 Design Results*
Sand 600 1,600
575 Pounds Per Foot
>60% Frac Stages 13 16
Increase * Incremental capital for Q4 wells was
?$700,000 per well.
Old Design Q4 Results
9
|
|
PERMIAN BASIN
New Completion Design Delivers Exceptional Results in Delaware Basin (continued)
The enhanced completion design on these 13 wells averaged 1,600 pounds of sand per lateral foot. This compares to the historical design of around 600 pounds per lateral foot (table page 9).
To date, the new completion design has been focused primarily on the 2nd Bone Spring interval in southern portions of Eddy and Lea counties. Early results indicate not only improved initial production rates but significantly higher EURs.
To further optimize well design, the company’s Permian technical teams are testing a number of well completion variables, including industry leading sand volumes as high as 3,000 pounds per lateral foot.
Devon will apply larger completions to its Bone Spring activity in the upcoming year. With continued success, this could lead to additional type curve improvements in 2015.
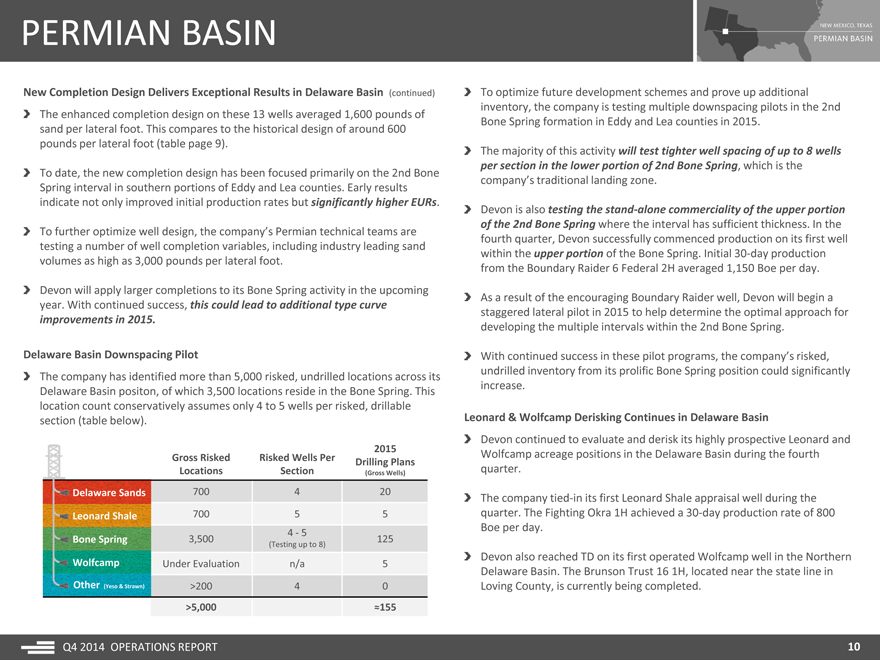
Delaware Basin Downspacing Pilot
The company has identified more than 5,000 risked, undrilled locations across its Delaware Basin positon, of which 3,500 locations reside in the Bone Spring. This location count conservatively assumes only 4 to 5 wells per risked, drillable section (table below).
2015
Gross Risked Risked Wells Per Drilling Plans
Locations Section (Gross Wells)
Delaware Sands 700 4 20
Leonard Shale 700 5 5
4—5
Bone Spring 3,500 125
(Testing up to 8)
Under Evaluation n/a 5
Other (Yeso & Strawn) >200 4 0
>5,000 ?155
To optimize future development schemes and prove up additional inventory, the company is testing multiple downspacing pilots in the 2nd Bone Spring formation in Eddy and Lea counties in 2015.
The majority of this activity will test tighter well spacing of up to 8 wells per section in the lower portion of 2nd Bone Spring, which is the company’s traditional landing zone.
Devon is also testing the stand-alone commerciality of the upper portion of the 2nd Bone Spring where the interval has sufficient thickness. In the fourth quarter, Devon successfully commenced production on its first well within the upper portion of the Bone Spring. Initial 30-day production from the Boundary Raider 6 Federal 2H averaged 1,150 Boe per day.
As a result of the encouraging Boundary Raider well, Devon will begin a staggered lateral pilot in 2015 to help determine the optimal approach for developing the multiple intervals within the 2nd Bone Spring.
With continued success in these pilot programs, the company’s risked, undrilled inventory from its prolific Bone Spring position could significantly increase.
Leonard & Wolfcamp Derisking Continues in Delaware Basin
Devon continued to evaluate and derisk its highly prospective Leonard and Wolfcamp acreage positions in the Delaware Basin during the fourth quarter.
The company tied-in its first Leonard Shale appraisal well during the quarter. The Fighting Okra 1H achieved a 30-day production rate of 800 Boe per day.
Devon also reached TD on its first operated Wolfcamp well in the Northern Delaware Basin. The Brunson Trust 16 1H, located near the state line in Loving County, is currently being completed.
Q4 2014 OPERATIONS REPORT
10
|
|
PERMIAN BASIN
Midland Basin Delivers Capital-Efficient Growth
Devon’s 2014 Midland Basin drilling program focused on developing 122,000 net acres inside its Southern Midland Wolfcamp joint venture area. Across this acreage, the company’s joint venture partner funds 70% of Devon’s capital requirements.
This capital-efficient drilling program increased overall net production in the Midland Basin to 52,000 Boe per day during the quarter. This represents an increase of 11% compared to the fourth quarter of 2013.
At Dec. 31, 2014, $50 million remained of the initial $1 billion of drilling carry.
The company expects to fully utilize its drilling carry in early 2015, at which time the company will reduce its operated rig count to zero in the Midland Basin.
In 2015, Devon’s Midland Basin activity will focus on maximizing base production through refrac programs, remediation work on existing producers and minimizing downtime, as well as the continued appraisal of Martin County.
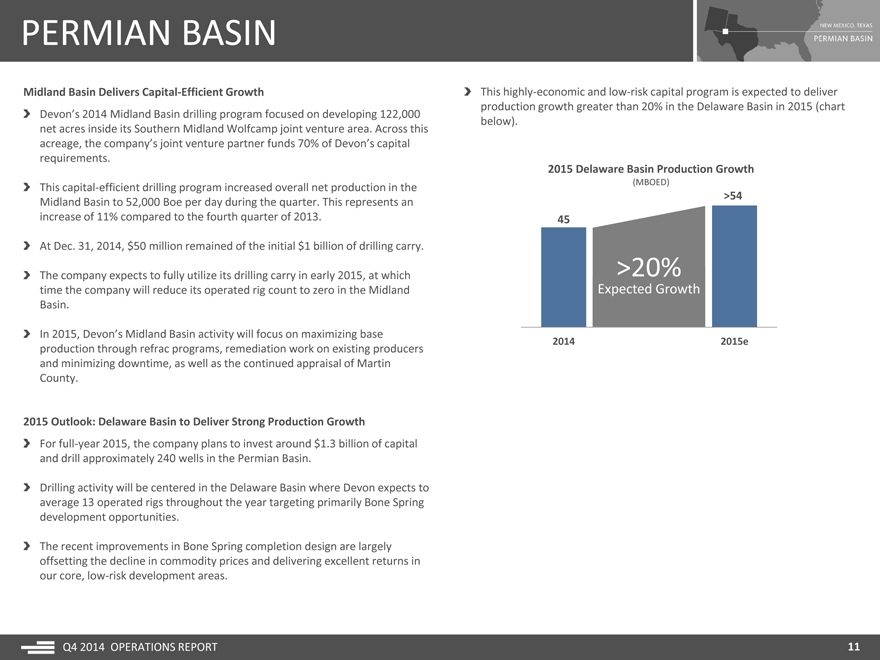
2015 Outlook: Delaware Basin to Deliver Strong Production Growth
For full-year 2015, the company plans to invest around $1.3 billion of capital and drill approximately 240 wells in the Permian Basin.
Drilling activity will be centered in the Delaware Basin where Devon expects to average 13 operated rigs throughout the year targeting primarily Bone Spring development opportunities.
The recent improvements in Bone Spring completion design are largely offsetting the decline in commodity prices and delivering excellent returns in our core, low-risk development areas.
This highly-economic and low-risk capital program is expected to deliver
production growth greater than 20% in the Delaware Basin in 2015 (chart
below).
2015 Delaware Basin Production Growth
(MBOED)
>54
45
>20%
Expected Growth
2014 2015e
Q4 2014 OPERATIONS REPORT
11
|
|
HEAVY OIL
Net oil production in Canada averaged 93,000 barrels per day, a 15% increase compared to the fourth quarter of 2013. This strong production result exceeded the top end of the company’s guidance range by 5,000 barrels per day.
The majority of this outperformance is due to better-than-expected performance at the Jackfish complex. Additionally, lower royalty rates due to oil pricing resulted in incremental production of 2,000 barrels per day at Jackfish in Q4.
Overall, gross production from the Jackfish complex averaged a record 74,000 barrels per day, a 27% increase compared to the fourth quarter of 2013. After accounting for royalties, net production averaged 67,000 barrels per day.
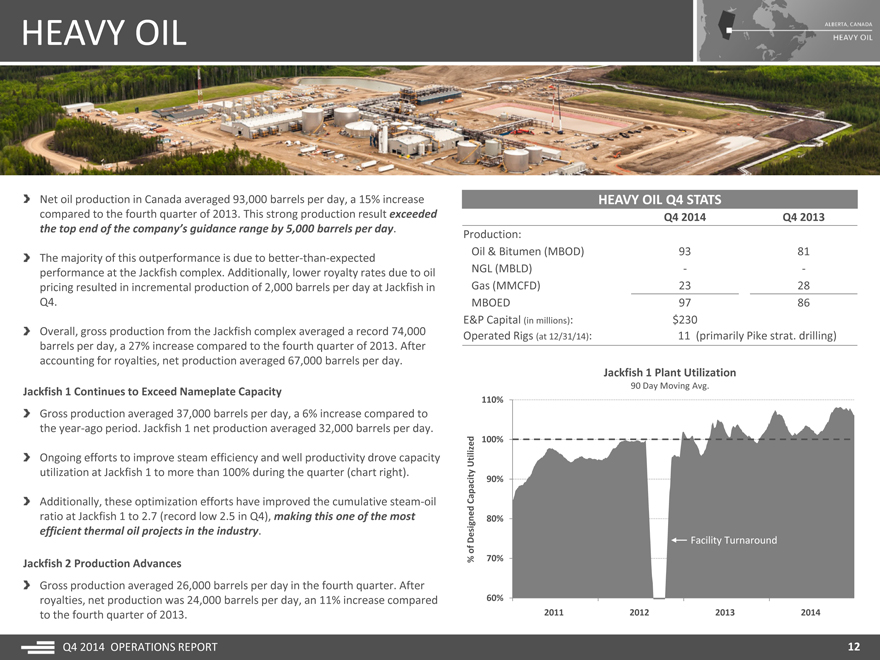
Jackfish 1 Continues to Exceed Nameplate Capacity
Gross production averaged 37,000 barrels per day, a 6% increase compared to the year-ago period. Jackfish 1 net production averaged 32,000 barrels per day.
Ongoing efforts to improve steam efficiency and well productivity drove capacity utilization at Jackfish 1 to more than 100% during the quarter (chart right).
Additionally, these optimization efforts have improved the cumulative steam-oil ratio at Jackfish 1 to 2.7 (record low 2.5 in Q4), making this one of the most efficient thermal oil projects in the industry.
Jackfish 2 Production Advances
Gross production averaged 26,000 barrels per day in the fourth quarter. After royalties, net production was 24,000 barrels per day, an 11% increase compared to the fourth quarter of 2013.
HEAVY OIL Q4 STATS
Q4 2014 Q4 2013
Production:
Oil & Bitumen (MBOD) 93 81
NGL (MBLD) — -
Gas (MMCFD) 23 28
MBOED 97 86
E&P Capital (in millions): $230
Operated Rigs (at 12/31/14): 11 (primarily Pike strat. drilling)
Jackfish 1 Plant Utilization
90 Day Moving Avg.
110%
Utilized 100%
Capacity 90%
80%
Designed Facility Turnaround
of
% 70%
60%
2011 2011 2012 2012 2013 2013 2014 2014
Q4 2014 OPERATIONS REPORT
12
|
|
HEAVY OIL
Jackfish 2 Production Advances (continued)
This strong production result was driven by improved performance from existing well pads.
The company plans to begin steaming a new well pad in the fourth quarter of 2015. The production contribution from this pad is expected to help Jackfish 2 achieve nameplate facility capacity in 2016.
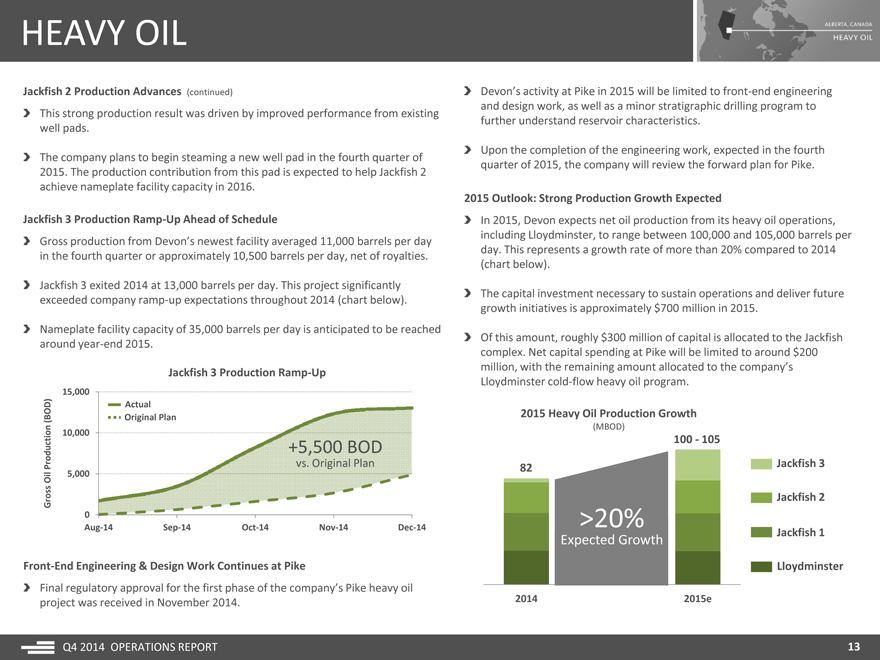
Jackfish 3 Production Ramp-Up Ahead of Schedule
Gross production from Devon’s newest facility averaged 11,000 barrels per day in the fourth quarter or approximately 10,500 barrels per day, net of royalties.
Jackfish 3 exited 2014 at 13,000 barrels per day. This project significantly exceeded company ramp-up expectations throughout 2014 (chart below).
Nameplate facility capacity of 35,000 barrels per day is anticipated to be reached around year-end 2015.
Jackfish 3 Production Ramp-Up
15,000
Actual
(BOD) Original Plan
10,000
+5,500 BOD
Production vs . Original Plan
Oil 5,000
Gross
0
Aug-14 Sep-14 Oct-14 Nov-14 Dec-14
Front-End Engineering & Design Work Continues at Pike
Final regulatory approval for the first phase of the company’s Pike heavy oil project was received in November 2014.
Devon’s activity at Pike in 2015 will be limited to front-end engineering and design work, as well as a minor stratigraphic drilling program to further understand reservoir characteristics.
Upon the completion of the engineering work, expected in the fourth quarter of 2015, the company will review the forward plan for Pike.
2015 Outlook: Strong Production Growth Expected
In 2015, Devon expects net oil production from its heavy oil operations, including Lloydminster, to range between 100,000 and 105,000 barrels per day. This represents a growth rate of more than 20% compared to 2014 (chart below).
The capital investment necessary to sustain operations and deliver future growth initiatives is approximately $700 million in 2015.
Of this amount, roughly $300 million of capital is allocated to the Jackfish complex. Net capital spending at Pike will be limited to around $200 million, with the remaining amount allocated to the company’s Lloydminster cold-flow heavy oil program.
2015 Heavy Oil Production Growth
(MBOD)
100—105
82 Jackfish 3
Jackfish 2
>20%
Expected Growth Jackfish 1
Lloydminster
2014 2015e
Q4 2014 OPERATIONS REPORT
13
|
|
ANADARKO BASIN
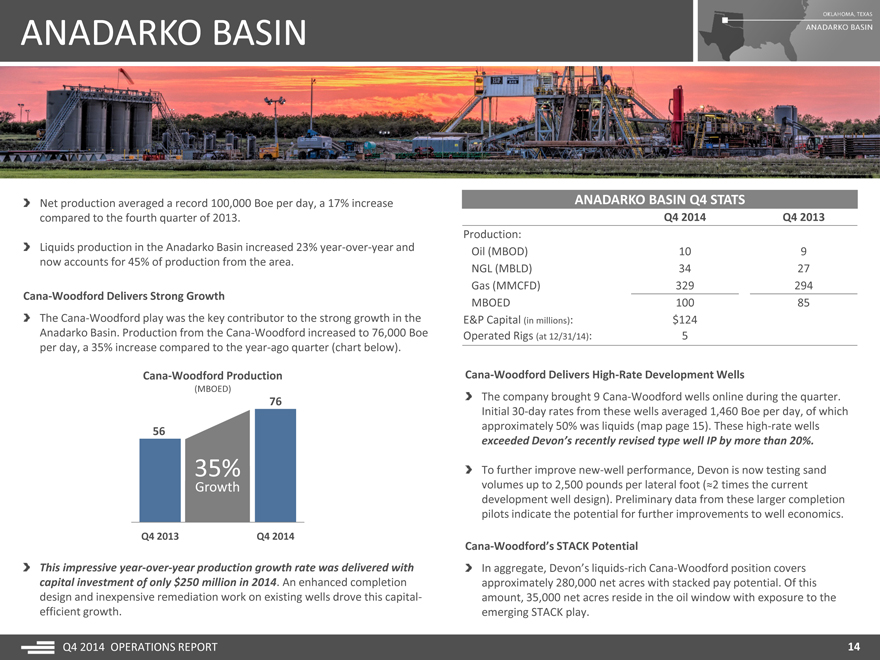
Net production averaged a record 100,000 Boe per day, a 17% increase compared to the fourth quarter of 2013.
Liquids production in the Anadarko Basin increased 23% year-over-year and now accounts for 45% of production from the area.
Cana-Woodford Delivers Strong Growth
The Cana-Woodford play was the key contributor to the strong growth in the Anadarko Basin. Production from the Cana-Woodford increased to 76,000 Boe per day, a 35% increase compared to the year-ago quarter (chart below).
Cana-Woodford Production
(MBOED)
76
56
35%
Growth
Q4 2013 Q4 2014
This impressive year-over-year production growth rate was delivered with capital investment of only $250 million in 2014. An enhanced completion design and inexpensive remediation work on existing wells drove this capital-efficient growth.
ANADARKO BASIN Q4 STATS
Q4 2014 Q4 2013
Production:
Oil (MBOD) 10 9
NGL (MBLD) 34 27
Gas (MMCFD) 329 294
MBOED 100 85
E&P Capital (in millions): $124
Operated Rigs (at 12/31/14): 5
Cana-Woodford Delivers High-Rate Development Wells
The company brought 9 Cana-Woodford wells online during the quarter. Initial 30-day rates from these wells averaged 1,460 Boe per day, of which approximately 50% was liquids (map page 15). These high-rate wells exceeded Devon’s recently revised type well IP by more than 20%.
To further improve new-well performance, Devon is now testing sand volumes up to 2,500 pounds per lateral foot (?2 times the current development well design). Preliminary data from these larger completion pilots indicate the potential for further improvements to well economics.
Cana-Woodford’s STACK Potential
In aggregate, Devon’s liquids-rich Cana-Woodford position covers approximately 280,000 net acres with stacked pay potential. Of this amount, 35,000 net acres reside in the oil window with exposure to the emerging STACK play.
Q4 2014 OPERATIONS REPORT
14
|
|
ANADARKO BASIN
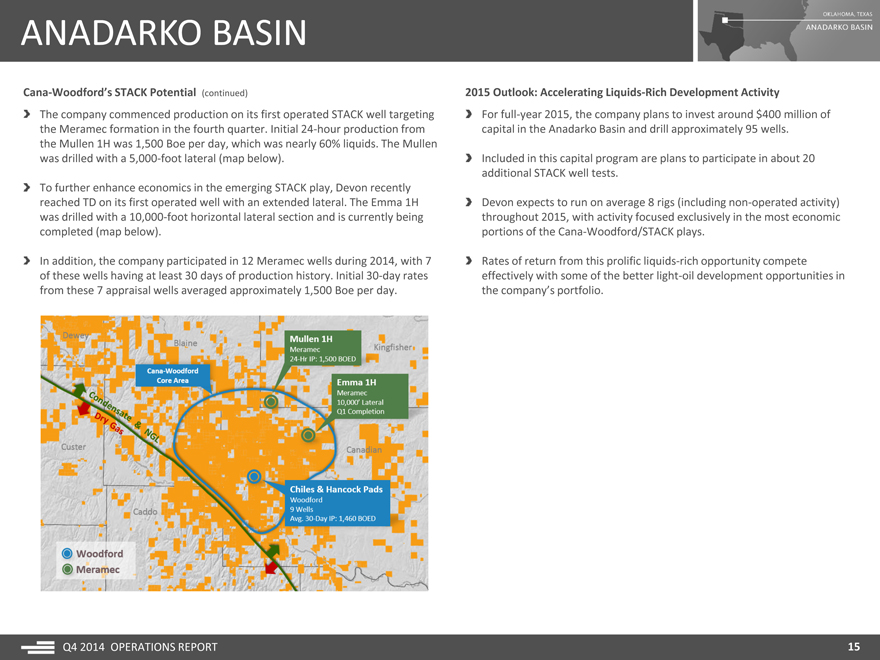
Cana-Woodford’s STACK Potential (continued)
The company commenced production on its first operated STACK well targeting the Meramec formation in the fourth quarter. Initial 24-hour production from the Mullen 1H was 1,500 Boe per day, which was nearly 60% liquids. The Mullen was drilled with a 5,000-foot lateral (map below).
To further enhance economics in the emerging STACK play, Devon recently reached TD on its first operated well with an extended lateral. The Emma 1H was drilled with a 10,000-foot horizontal lateral section and is currently being completed (map below).
In addition, the company participated in 12 Meramec wells during 2014, with 7 of these wells having at least 30 days of production history. Initial 30-day rates from these 7 appraisal wells averaged approximately 1,500 Boe per day.
2015 Outlook: Accelerating Liquids-Rich Development Activity
For full-year 2015, the company plans to invest around $400 million of capital in the Anadarko Basin and drill approximately 95 wells.
Included in this capital program are plans to participate in about 20 additional STACK well tests.
Devon expects to run on average 8 rigs (including non-operated activity) throughout 2015, with activity focused exclusively in the most economic portions of the Cana-Woodford/STACK plays.
Rates of return from this prolific liquids-rich opportunity compete effectively with some of the better light-oil development opportunities in the company’s portfolio.
Q4 2014 OPERATIONS REPORT
15
|
|
BARNETT SHALE
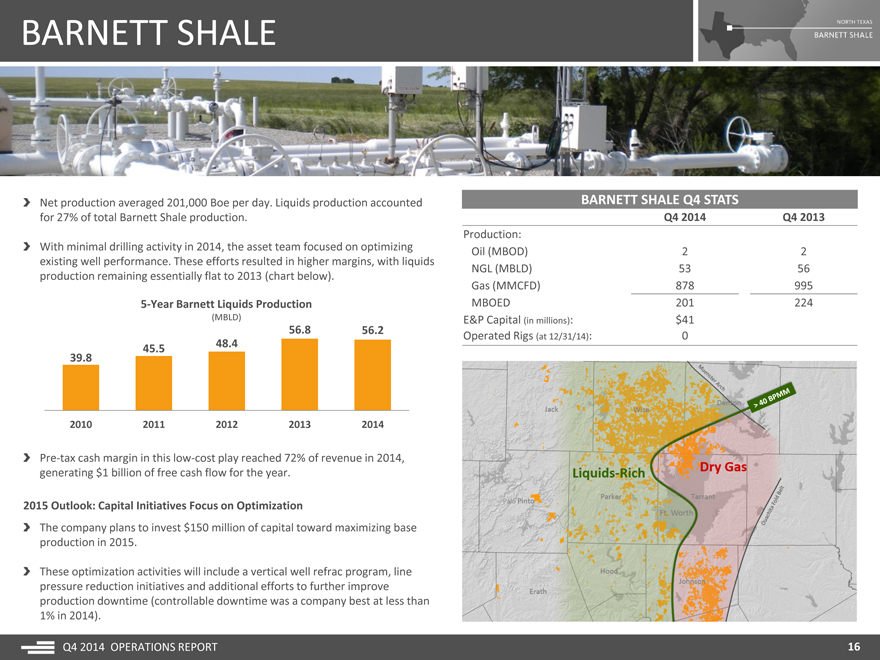
Net production averaged 201,000 Boe per day. Liquids production accounted for 27% of total Barnett Shale production.
With minimal drilling activity in 2014, the asset team focused on optimizing existing well performance. These efforts resulted in higher margins, with liquids production remaining essentially flat to 2013 (chart below).
5-Year Barnett Liquids Production
(MBLD)
56.8 56.2
45.5 48.4
39.8
2010 2011 2012 2013 2014
Pre-tax cash margin in this low-cost play reached 72% of revenue in 2014, generating $1 billion of free cash flow for the year.
2015 Outlook: Capital Initiatives Focus on Optimization
The company plans to invest $150 million of capital toward maximizing base production in 2015.
These optimization activities will include a vertical well refrac program, line pressure reduction initiatives and additional efforts to further improve production downtime (controllable downtime was a company best at less than 1% in 2014).
BARNETT SHALE Q4 STATS
Q4 2014 Q4 2013
Production:
Oil (MBOD) 2 2
NGL (MBLD) 53 56
Gas (MMCFD) 878 995
MBOED 201 224
E&P Capital (in millions): $41
Operated Rigs (at 12/31/14): 0
Q4 2014 OPERATIONS REPORT
16
|
|
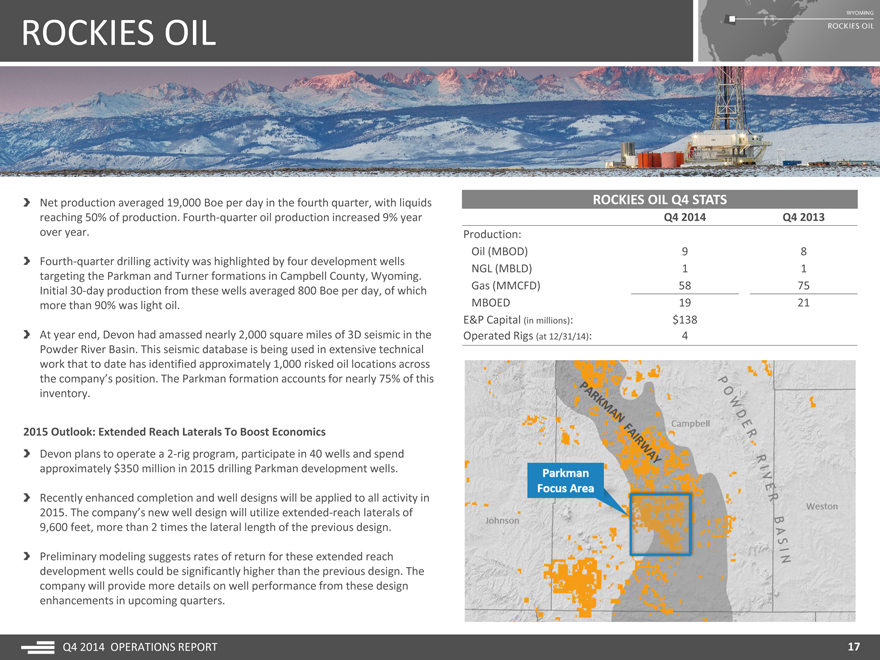
ROCKIES OIL
Net production averaged 19,000 Boe per day in the fourth quarter, with liquids reaching 50% of production. Fourth-quarter oil production increased 9% year over year.
Fourth-quarter drilling activity was highlighted by four development wells targeting the Parkman and Turner formations in Campbell County, Wyoming. Initial 30-day production from these wells averaged 800 Boe per day, of which more than 90% was light oil.
At year end, Devon had amassed nearly 2,000 square miles of 3D seismic in the Powder River Basin. This seismic database is being used in extensive technical work that to date has identified approximately 1,000 risked oil locations across the company’s position. The Parkman formation accounts for nearly 75% of this inventory.
2015 Outlook: Extended Reach Laterals To Boost Economics
Devon plans to operate a 2-rig program, participate in 40 wells and spend approximately $350 million in 2015 drilling Parkman development wells.
Recently enhanced completion and well designs will be applied to all activity in 2015. The company’s new well design will utilize extended-reach laterals of 9,600 feet, more than 2 times the lateral length of the previous design.
Preliminary modeling suggests rates of return for these extended reach development wells could be significantly higher than the previous design. The company will provide more details on well performance from these design enhancements in upcoming quarters.
ROCKIES OIL Q4 STATS
Q4 2014 Q4 2013
Production:
Oil (MBOD) 9 8
NGL (MBLD) 1 1
Gas (MMCFD) 58 75
MBOED 19 21
E&P Capital (in millions): $138
Operated Rigs (at 12/31/14): 4
Q4 2014 OPERATIONS REPORT
17
|
|
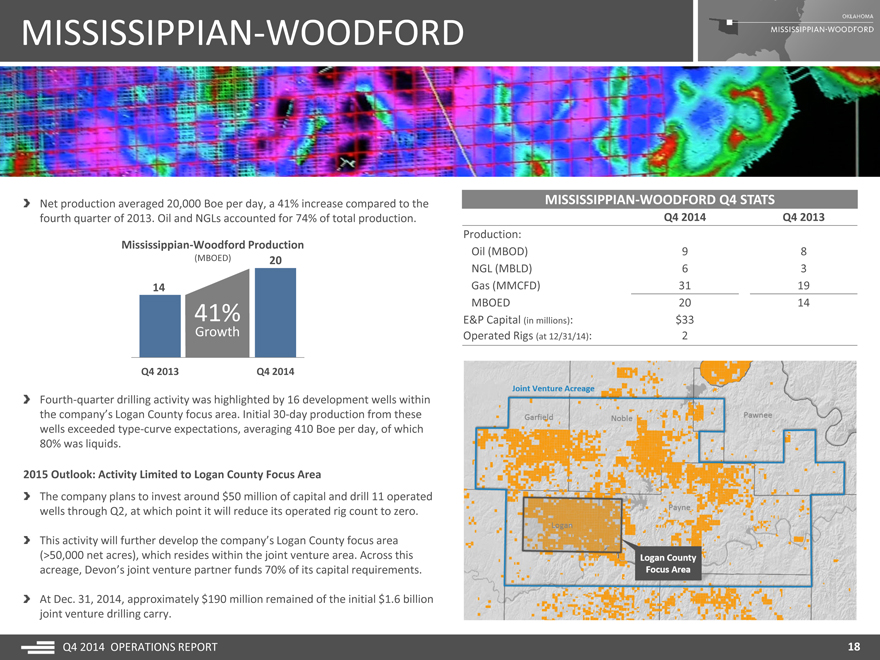
MISSISSIPPIAN-WOODFORD
Net production averaged 20,000 Boe per day, a 41% increase compared to the fourth quarter of 2013. Oil and NGLs accounted for 74% of total production.
Mississippian-Woodford Production
(MBOED) 20
14
41%
Growth
Q4 2013 Q4 2014
Fourth-quarter drilling activity was highlighted by 16 development wells within the company’s Logan County focus area. Initial 30-day production from these wells exceeded type-curve expectations, averaging 410 Boe per day, of which 80% was liquids.
2015 Outlook: Activity Limited to Logan County Focus Area
The company plans to invest around $50 million of capital and drill 11 operated wells through Q2, at which point it will reduce its operated rig count to zero.
This activity will further develop the company’s Logan County focus area (>50,000 net acres), which resides within the joint venture area. Across this acreage, Devon’s joint venture partner funds 70% of its capital requirements.
At Dec. 31, 2014, approximately $190 million remained of the initial $1.6 billion joint venture drilling carry.
MISSISSIPPIAN-WOODFORD Q4 STATS
Q4 2014 Q4 2013
Production:
Oil (MBOD) 9 8
NGL (MBLD) 6 3
Gas (MMCFD) 31 19
MBOED 20 14
E&P Capital (in millions): $33
Operated Rigs (at 12/31/14): 2
Q4 2014 OPERATIONS REPORT
18
Serious News for Serious Traders! Try StreetInsider.com Premium Free!
You May Also Be Interested In
- Devon Energy (DVN) PT Raised to $57 at RBC Capital
- STELLAREX, INC. AND MAX-PLANCK-INSTITUTE FOR PLASMA PHYSICS SIGN MOU TO COLLABORATE ON THE DEVELOPMENT OF FUSION ENERGY
- Emera Reports 2024 First Quarter Financial Results
Create E-mail Alert Related Categories
SEC FilingsSign up for StreetInsider Free!
Receive full access to all new and archived articles, unlimited portfolio tracking, e-mail alerts, custom newswires and RSS feeds - and more!
