

Form 8-K CMS ENERGY CORP For: Jun 09
 Tweet
Tweet Share
Share
UNITED STATES
SECURITIES AND EXCHANGE COMMISSION
Washington, D.C. 20549
FORM 8-K
CURRENT REPORT
PURSUANT TO SECTION 13 OR 15(d)
OF THE SECURITIES EXCHANGE ACT OF 1934
Date of Report (Date of earliest event reported) June 9, 2015
| Commission File Number |
Registrant; State of Incorporation; Address; and Telephone Number |
IRS Employer Identification No. | ||
| 1-9513 | CMS ENERGY CORPORATION (A Michigan Corporation) One Energy Plaza Jackson, Michigan 49201 (517) 788-0550 |
38-2726431 | ||
| 1-5611 | CONSUMERS ENERGY COMPANY (A Michigan Corporation) One Energy Plaza Jackson, Michigan 49201 (517) 788-0550 |
38-0442310 | ||
Check the appropriate box below if the Form 8-K filing is intended to simultaneously satisfy the filing obligation of the registrant under any of the following provisions:
| ¨ | Written communications pursuant to Rule 425 under the Securities Act (17 CFR 230.425) |
| ¨ | Soliciting material pursuant to Rule 14a-12 under the Exchange Act (17 CFR 240.14a-12) |
| ¨ | Pre-commencement communications pursuant to Rule 14d-2(b) under the Exchange Act (17 CFR 240.14d-2(b)) |
| ¨ | Pre-commencement communications pursuant to Rule 13e-4(c) under the Exchange Act (17 CFR 240.13e-4(c)) |
| Item 7.01. | Regulation FD Disclosure. |
On June 9-10, 2015, CMS Energy Corporation’s (“CMS Energy”) management will be meeting with investors. A copy of the CMS Energy handout to be used at these meetings is furnished as Exhibit 99.1 to this report.
In accordance with General Instruction B.2 of Form 8-K, the information in this Current Report on Form 8-K, including Exhibit 99.1, shall not be deemed “filed” for the purposes of Section 18 of the Securities Exchange Act of 1934, or otherwise subject to the liabilities of that section, nor shall it be deemed incorporated by reference in any filing under the Securities Act of 1933.
Investors and others should note that CMS Energy and Consumers Energy Company post important financial information using the investor relations section of the CMS Energy website, www.cmsenergy.com and Securities and Exchange Commission filings.
| Item 9.01. | Financial Statements and Exhibits. |
(d) Exhibits.
| 99.1 | CMS Energy handout dated June 9 & 10, 2015 | |
SIGNATURES
Pursuant to the requirements of the Securities Exchange Act of 1934, the Registrants have duly caused this report to be signed on their behalf by the undersigned hereunto duly authorized.
| CMS ENERGY CORPORATION | ||||||
| Dated: June 9, 2015 | By: | /s/ Thomas J. Webb | ||||
| Thomas J. Webb | ||||||
| Executive Vice President and Chief Financial Officer | ||||||
| CONSUMERS ENERGY COMPANY | ||||||
| Dated: June 9, 2015 | By: | /s/ Thomas J. Webb | ||||
| Thomas J. Webb | ||||||
| Executive Vice President and Chief Financial Officer | ||||||
Exhibit Index
| 99.1 | CMS Energy handout dated June 9 & 10, 2015 | |
Exhibit 99.1
|
|
Exhibit 99.1 Cms energy cms listed nyse Investor Meetings June 9 & 10, 2015 Ludington Pumped Storage Fourth largest in the world Ray Compressor Station #1 LDC in gas storage Cross Winds ® Energy Park #2 in renewable sales in the Great Lakes area
|
|
Cms energy This presentation is made as of the date hereof and contains “forward-looking statements” as defined in Rule 3b-6 of the Securities Exchange Act of 1934, Rule 175 of the Securities Act of 1933, and relevant legal decisions. The forward-looking statements are subject to risks and uncertainties. All forward-looking statements should be considered in the context of the risk and other factors detailed from time to time in CMS Energy’s and Consumers Energy’s Securities and Exchange Commission filings. Forward-looking statements should be read in conjunction with “FORWARD-LOOKING STATEMENTS AND INFORMATION” and “RISK FACTORS” sections of CMS Energy’s and Consumers Energy’s Form 10-K for the year ended December 31, 2014 and as updated in subsequent 10-Qs. CMS Energy’s and Consumers Energy’s “FORWARD-LOOKING STATEMENTS AND INFORMATION” and “RISK FACTORS” sections are incorporated herein by reference and discuss important factors that could cause CMS Energy’s and Consumers Energy’s results to differ materially from those anticipated in such statements. CMS Energy and Consumers Energy undertake no obligation to update any of the information presented herein to reflect facts, events or circumstances after the date hereof. The presentation also includes non-GAAP measures when describing CMS Energy’s results of operations and financial performance. A reconciliation of each of these measures to the most directly comparable GAAP measure is included in the appendix and posted on our website at www.cmsenergy.com. CMS Energy provides historical financial results on both a reported (Generally Accepted Accounting Principles) and adjusted (non-GAAP) basis and provides forward-looking guidance on an adjusted basis. Management views adjusted earnings as a key measure of the company’s present operating financial performance, unaffected by discontinued operations, asset sales, impairments, regulatory items from prior years, or other items. These items have the potential to impact, favorably or unfavorably, the company’s reported earnings in future periods. Investors and others should note that CMS Energy and Consumers Energy post important financial information using the investor relations section of the CMS Energy website, www.cmsenergy.com and Securities and Exchange Commission filings. 1
|
|
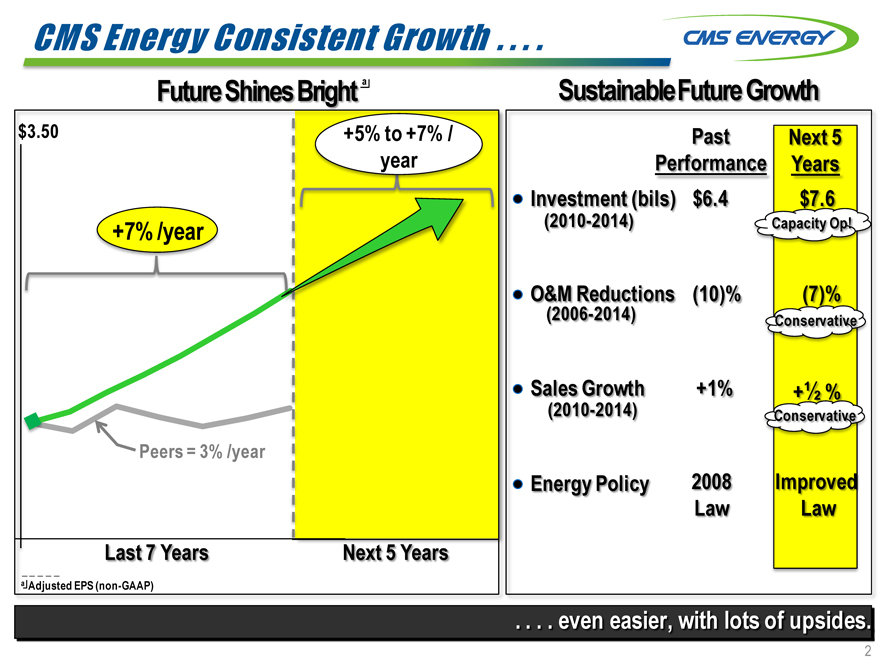
CMS Energy Consistent Growth . . . CMS Energy a Future Shines Bright Sustainable Future Growth $3.50 +5% to +7% / year +7% /year Peers = 3% /year Last 7 Years Next 5 Years a Adjusted EPS (non-GAAP) Past Next 5 Performance Years Investment (2010-2014) (bils) $6.4 $7.6 Capacity Op! O&M Reductions (2006-2014) (10)% (7)% Conservative Sales Growth (2010-2014) +1% + 1/2 % Conservative Energy Policy 2008 Improved Law Law . . . . even easier, with lots of upsides. 2
|
|
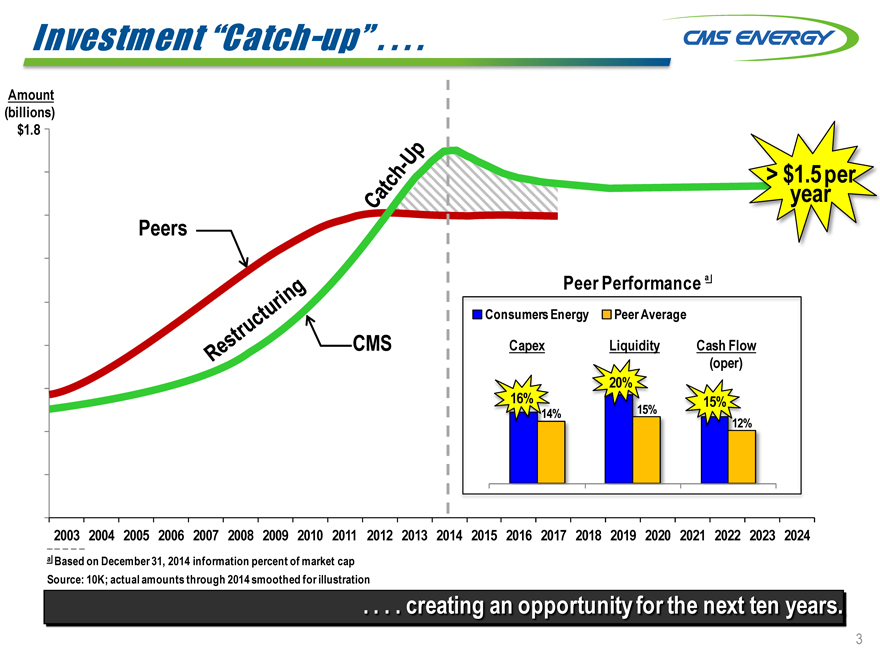
Investment “Catch-up” . . . . Amount (billions) $1.8 Cms energy Peers CMS Restructuring Catch-up > $1.5 per year Peer Performance a Consumers Energy Peer Average Capex Liquidity Cash Flow (oper) 16% 20% 15% 14% 15% 12% 2003 2004 2005 2006 2007 2008 2009 2010 2011 2012 2013 2014 2015 2016 2017 2018 2019 2020 2021 2022 2023 2024 a Based on December 31, 2014 information percent of market cap Source: 10K; actual amounts through 2014 smoothed for illustration . creating an opportunity for the next ten years. 3
|
|
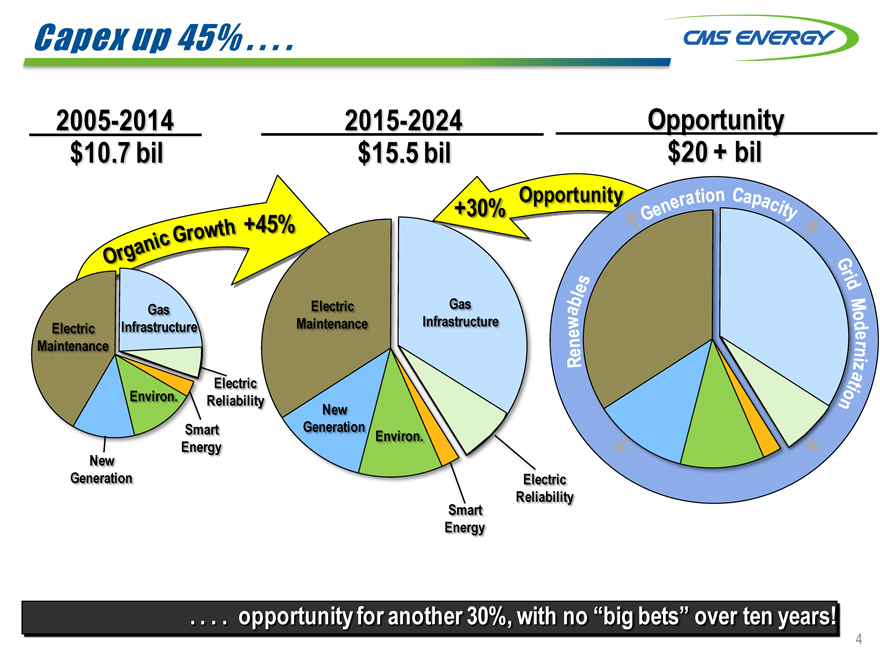
Capex up 45% . . . Cms energy 2005-2014 $10.7 bil Organic growth +45% Electric Maintenance Gas Infrastructure Environ. electric Reliability smart Energy New Generation 2015-2024 $15.5 bil Electric Maintenance Gas Infrastructure New Generation Environ. smart Energy electric Reliability Opportunity $20 + bil +30% Opportunity Generation capacity Renewable Grid modernization. opportunity for another 30%, with no “big bets” over ten years! 4
|
|
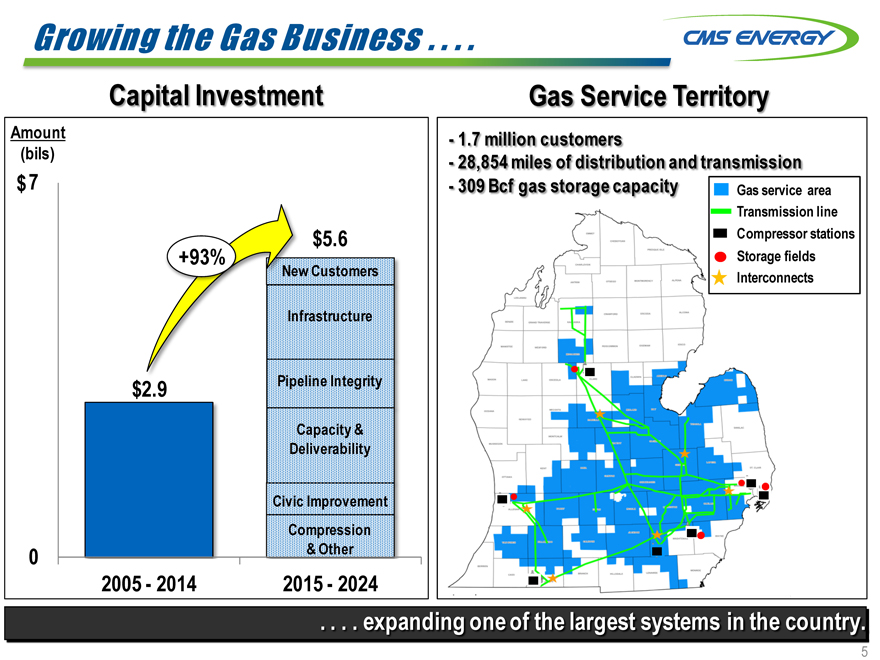
Growing the Gas Business Capital Investment Amount (bils) $ 7 +93% $5.6 $2.9 0 2005—2014 New Customers Infrastructure Pipeline Integrity Capacity & Deliverability Civic Improvement Compression & Other 2015—2024 Gas Service Territory —1.7 million customers —28,854 miles of distribution and transmission —309 Bcf gas storage capacity Gas service area Transmission line Compressor stations Storage fields Interconnects expanding one of the largest systems in the country. 5
|
|
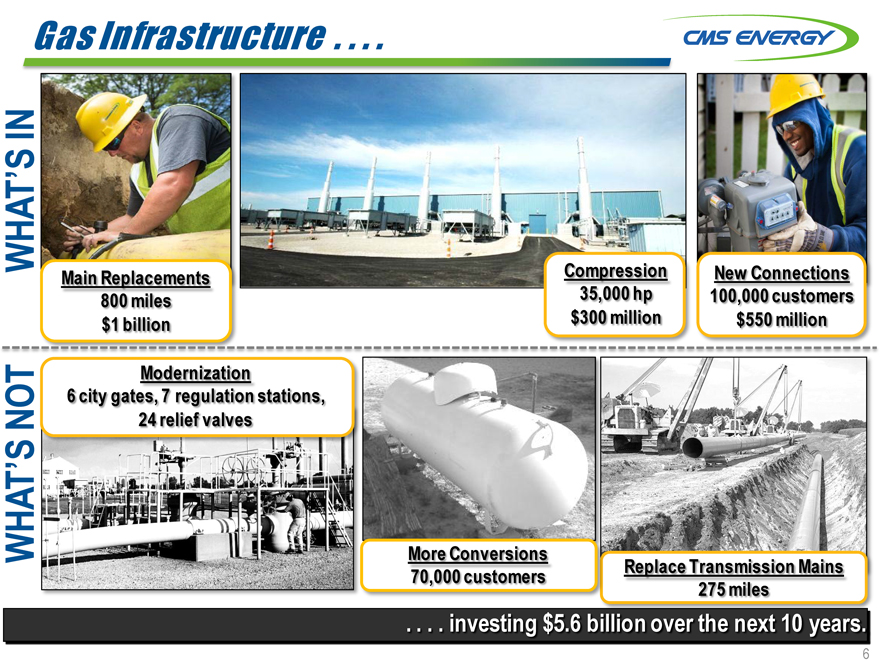
Gas Infrastructure . . . CMS ENERGY Main Replacements 800 miles $1 billion WHAT’S IN Compression 35,000 hp $300 million New Connections 100,000 customers $550 million WHAT’S NOT Modernization 6 city gates, 7 regulation stations, 24 relief valves More Conversions 70,000 customers Replace Transmission Mains 275 miles investing $5.6 billion over the next 10 years. 6
|
|
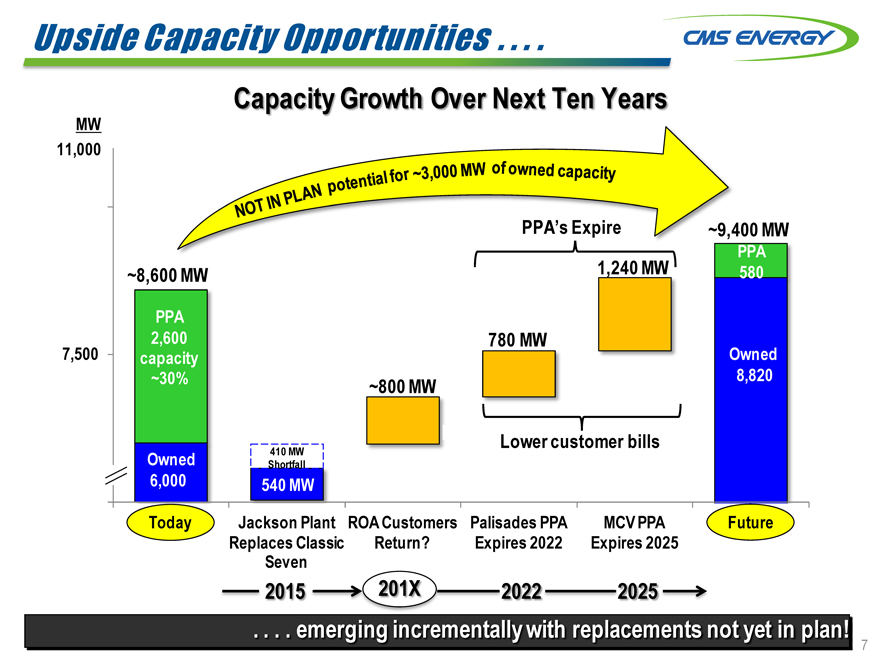
Upside Capacity Opportunities . . . . CMS ENERGY Capacity Growth Over Next Ten Years MW 11,000 NOT IN PLAN potential for ~3,000 mw of owned capacity ~8,600 MW 7,500 PPA 2,600 capacity ~30% Owned 6,000 Today 410 MW Shortfall 540 MW ~800 MW 780 MW Ppa’s expire 1,240 MW ~9,400 MW PPA 580 Owned 8,820 Jackson Plant Replaces Seven Classic ROA Customers Return? Palisades PPA Expires 2022 MCV PPA Expires 2025 Future 2015 201X 2022 2025 emerging incrementally with replacements not yet in plan! 7
|
|
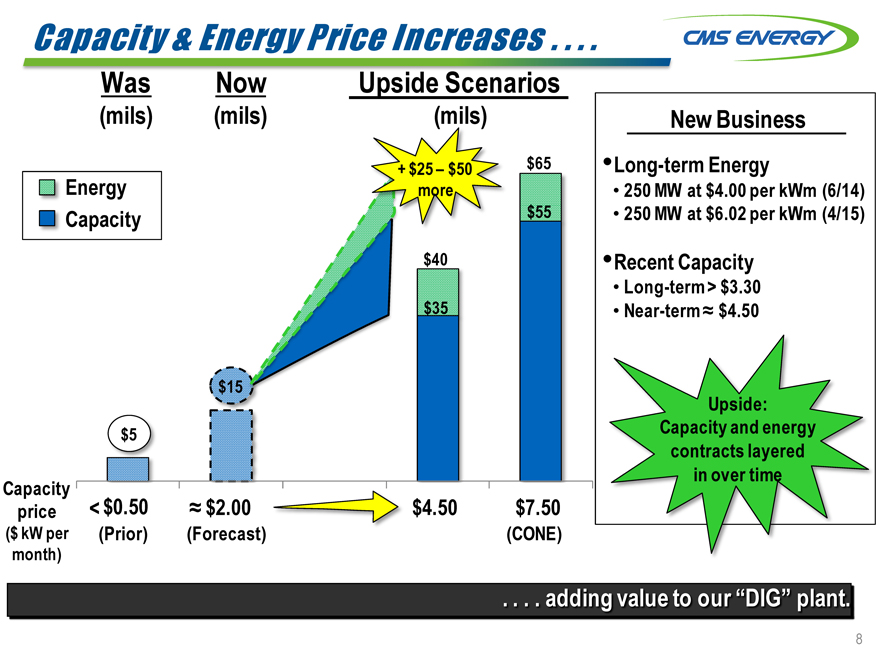
Capacity & Energy Price Increases . . . Cms energy Was (mils) Now (mils) Upside Scenarios (mils) Energy Capacity + $25 – $50 more $65 $55 $40 $35 $15 $5 Capacity price ($ kW per month) < $0.50 (Prior) ? $2.00 (Forecast) $4.50 $7.50 (CONE) New Business •Long-term Energy • 250 MW at $4.00 per kWm (6/14) • 250 MW at $6.02 per kWm (4/15) •Recent Capacity • Long-term > $3.30 • Near-term ? $4.50 Upside: Capacity and energy contracts layered in over time . adding value to our “DIG” plant. 8
|
|
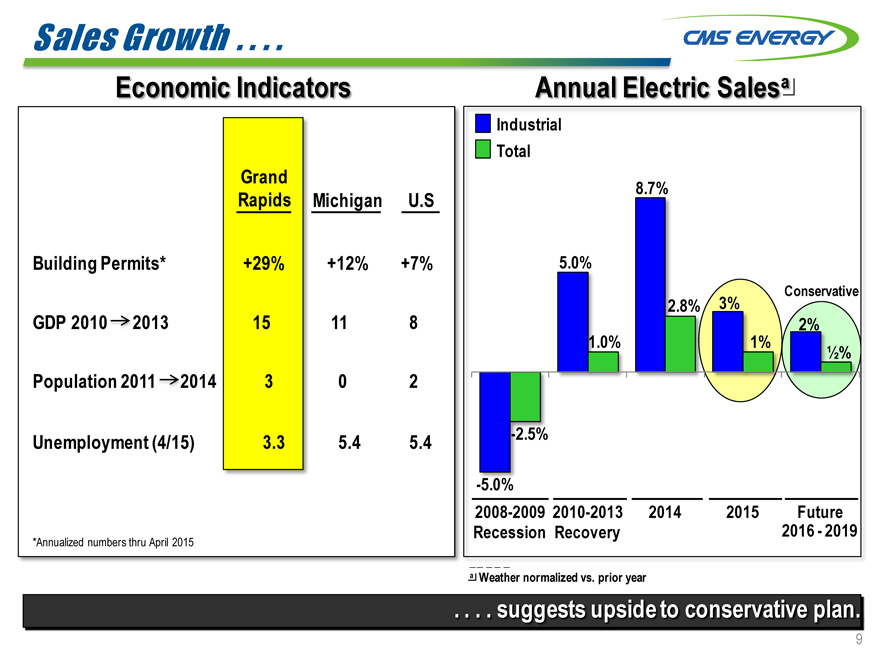
Sales Growth . . . Cms energy Economic Indicators Grand Rapids Michigan U.S Building Permits* +29% +12% +7% GDP 2010 2013 15 11 8 Population 2011 2014 3 0 2 Unemployment (4/15) 3.3 5.4 5.4 *Annualized numbers thru April 2015 Annual Electric Salesa Industrial Total 5.0% 1.0% 8.7% 2.8% 3% 1% Conservative 2% 1/2% -2.5% -5.0% 2008-2009 Recession 2010-2013 Recovery 2014 2015 Future 2016—2019 a Weather normalized vs. prior year . suggests upside to conservative plan. 9
|
|
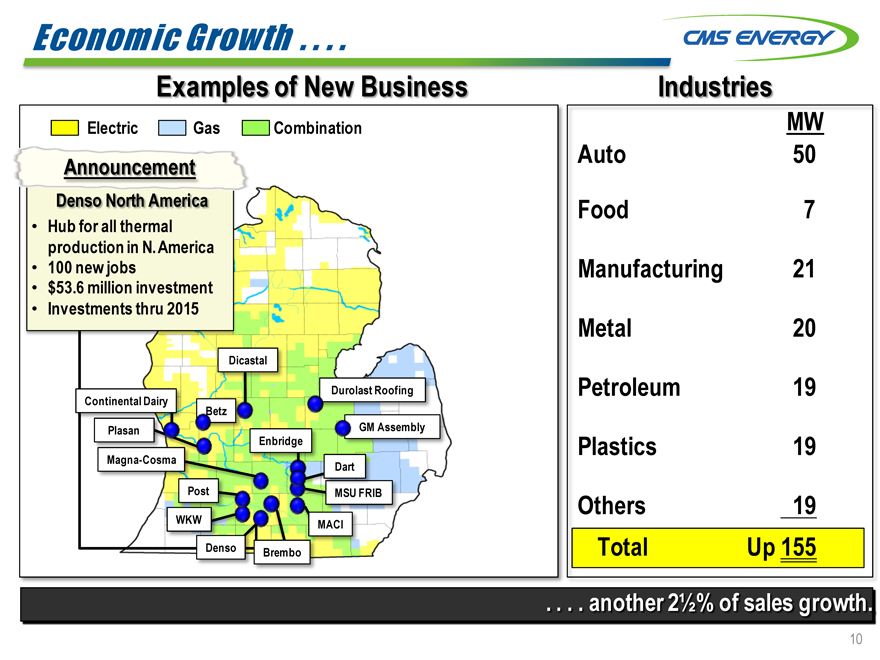
Economic Growth . . Cms energy Examples of New Business Electric Gas Combination Announcement Denso North America • Hub for all thermal production in N. America • 100 new jobs • $53.6 million investment • Investments thru 2015 Dicastal Durolast Roofing Continental Dairy Betz Plasan Magna-Cosma Enbridge GM Assembly Dart Post MSU FRIB WKW MACI Denso Brembo Industries MW Auto 50 Food 7 Manufacturing 21 Metal 20 Petroleum 19 Plastics 19 Other 19 Total up 155 . another 2 1/2% of sales growth. 10
|
|
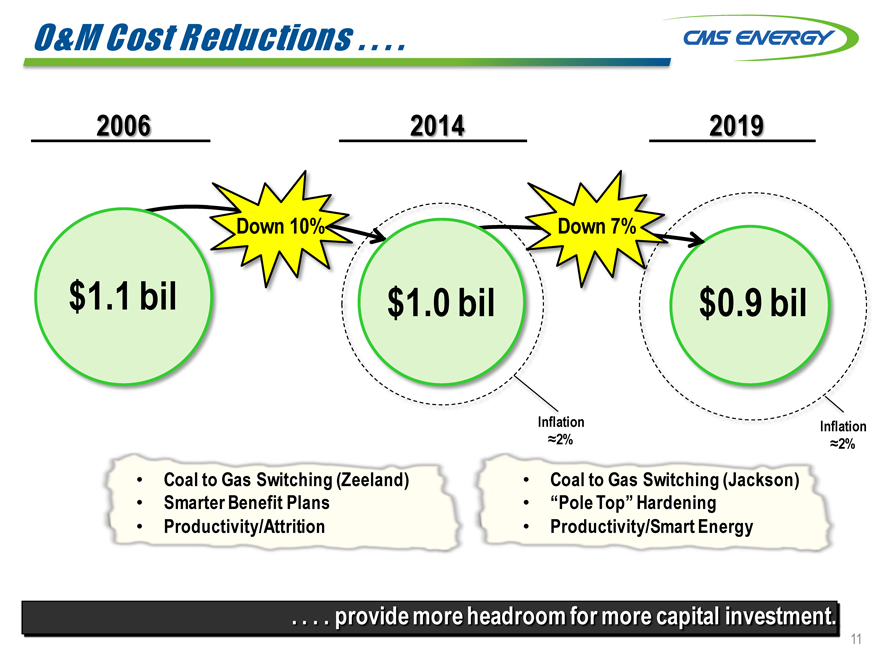
O&M Cost Reductions . . . . Cms energy 2006 2014 2019 $1.1 bil Down 10% $1.0 bil Down 7% $0.9 bil inflation ?2% Inflation ?2% Coal to Gas Switching (Zeeland) Smarter Benefit Plans Productivity/Attrition Coal to Gas Switching (Jackson) “Pole Top” Hardening Productivity/Smart Energy . provide more headroom for more capital investment. 11
|
|
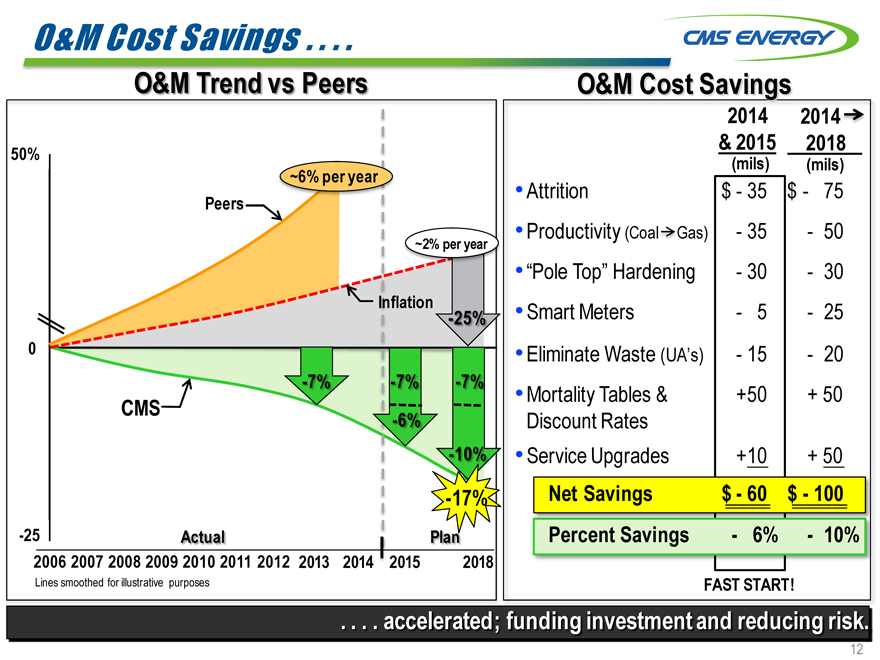
O&M Cost Savings . . . . Cms energy O&M Trend vs Peers 50% 0 -25 ~6% per year Peers ~2% per year Inflation -25% -7% -7% -7% CMS -6% -10% -17% Actual Plan 2006 2007 2008 2009 2010 2011 2012 2013 2014 2015 2018 Lines smoothed for illustrative purposes O&M Cost Savings 2014 2014 & 2015 2018 (mils) (mils) Attrition $—35 $— 75 Productivity (Coal Gas) —35 — 50 “Pole Top” Hardening —30 — 30 •Smart Meters — 5 — 25 Eliminate Waste (UA’s) —15 — 20 Mortality Tables & +50 + 50 Discount Rates •Service Upgrades +10 + 50 Net Savings $—60 $—100 Percent Savings — 6% — 10% FAST START! accelerated; funding investment and reducing risk. 12
|
|
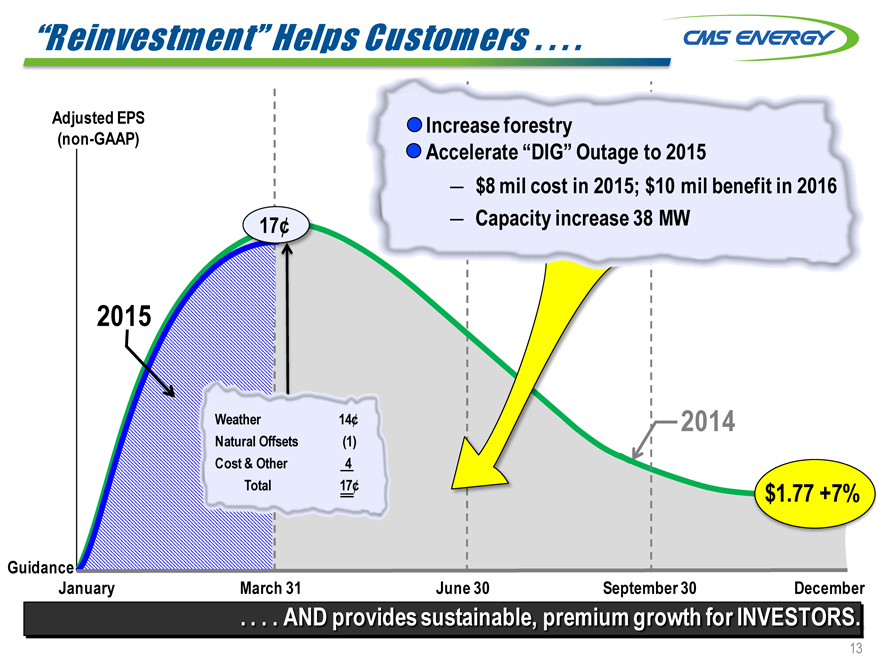
“Reinvestment” Helps Customers . . Cms energy Adjusted EPS (non-GAAP) Increase forestry Accelerate “DIG” Outage to 2015 — $8 mil cost in 2015; $10 mil benefit in 2016 — Capacity increase 38 MW 17¢ 2015 2014 $1.77 +7% Weather 14¢ Natural Offsets (1) Cost & Other 4 Total 17¢ Guidance January March 31 June 30 September 30 December . AND provides sustainable, premium growth for INVESTORS. 13
|
|
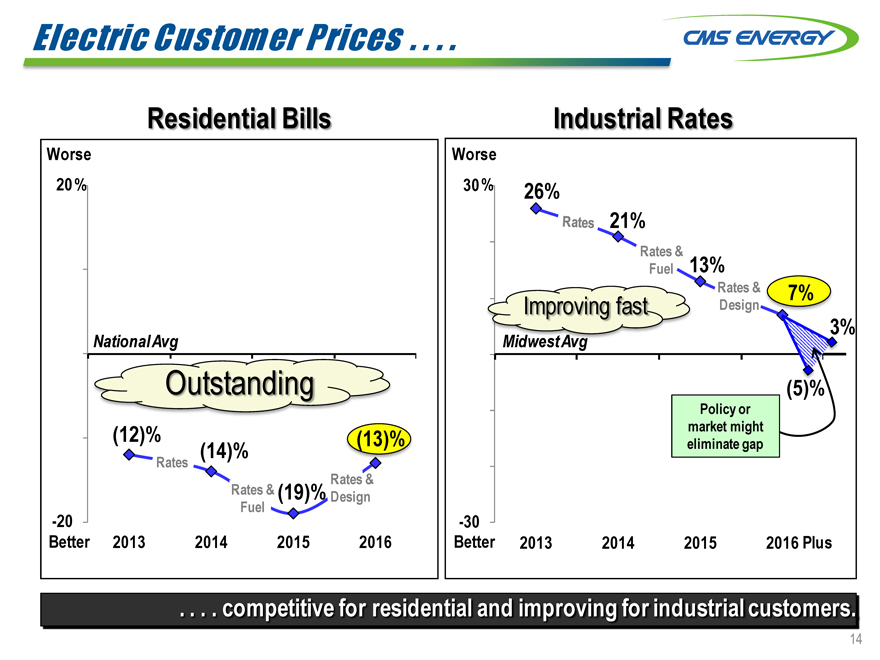
Electric Customer Prices Cms energy Residential Bills Worse 20 % National Avg Outstanding (12)% (14)% Rates (13)% Rates & Rates & (19)% Design Fuel -20 Better 2013 2014 2015 2016 Industrial Rates Worse 30 % 26% Rates 21% Rates & 13% Fuel Rates & 7% Improving fast Design 3% Midwest avg (5)% Policy or market might eliminate gap -30 Better 2013 2014 2015 2016 Plus . competitive for residential and improving for industrial customers. 14
|
|
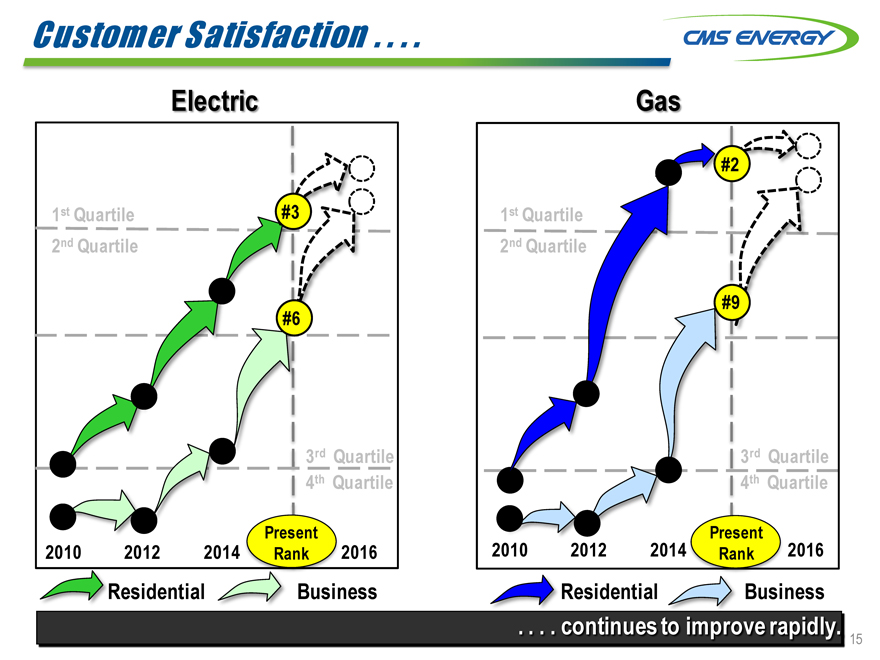
Customer Satisfaction . . Cms energy Electric 1st Quartile 2nd Quartile #3 #6 3rd Quartile 4th Quartile 2010 2012 2014 Present Rank 2016 Residential Business Gas 1st Quartile 2nd Quartile #2 #9 3rd Quartile 4th Quartile 2010 2012 2014 Present Rank 2016 Residential Business continues to improve rapidly. 15
|
|
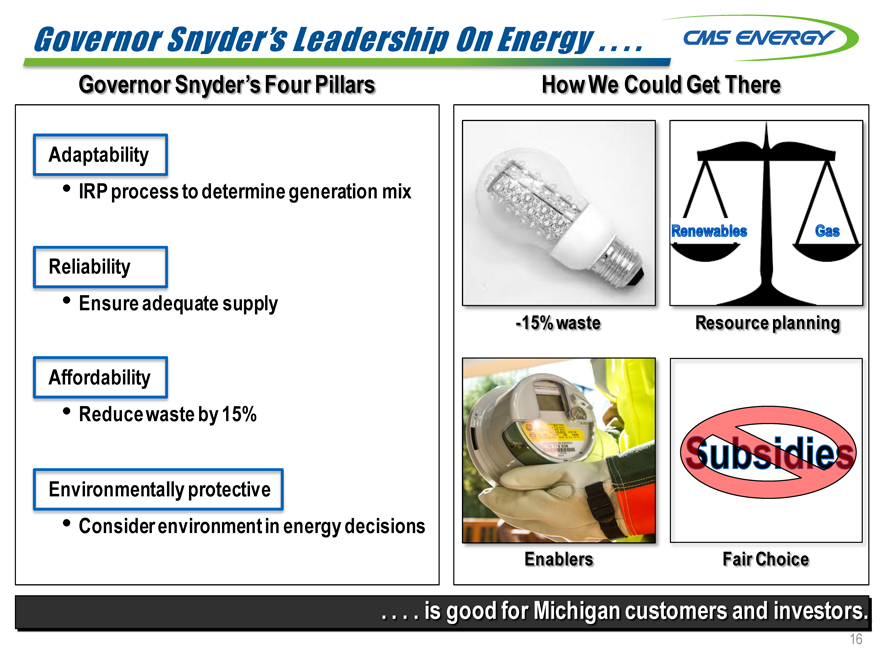
Governor Snyder’s Leadership On Energy . . . . CMS ENERGY Governor Snyder’s Four Pillars Adaptability • IRP process to determine generation mix Reliability • Ensure adequate supply Affordability • Reduce waste by 15% Environmentally protective • Consider environment in energy decisions How We Could Get There -15% waste RENEWABLES GAS Resource planning Enablers Fair Choice SUBSIDIES. . is good for Michigan customers and investors. 16
|
|
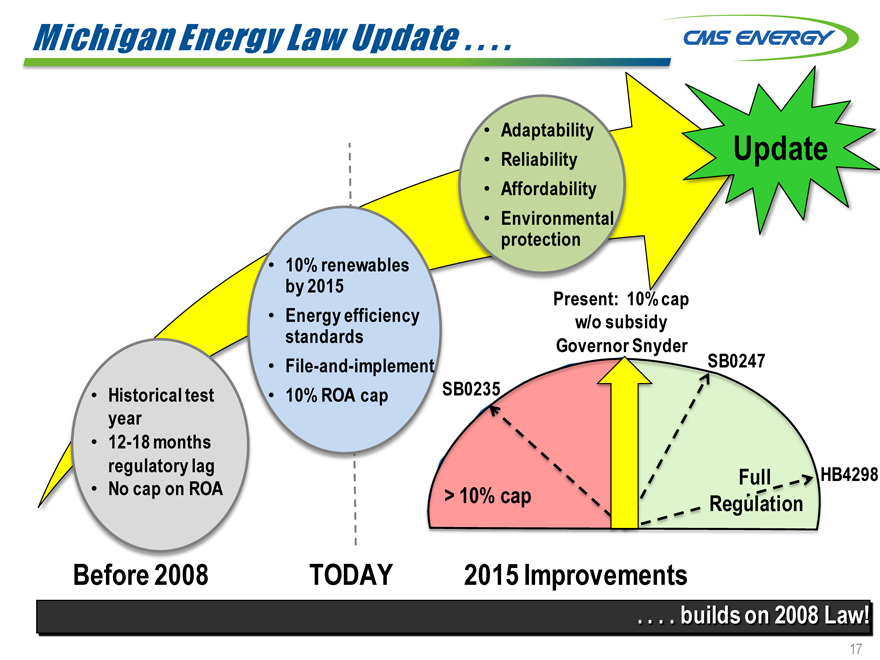
Michigan Energy Law Update . . . . CMS ENERGY Historical test year 12-18 months regulatory lag No cap on ROA • 10% by 2015 renewables Energy efficiency standards File-and-impleme 10% ROA cap Adaptability Reliability Affordability Environmental protection Update Present: 10% cap w/o subsidy Governor Snyder SB0247 SB0235 > 10% CAP Full Regulation HB4298 Before 2008 TODAY 2015 Improvements . builds on 2008 Law! 17
|
|
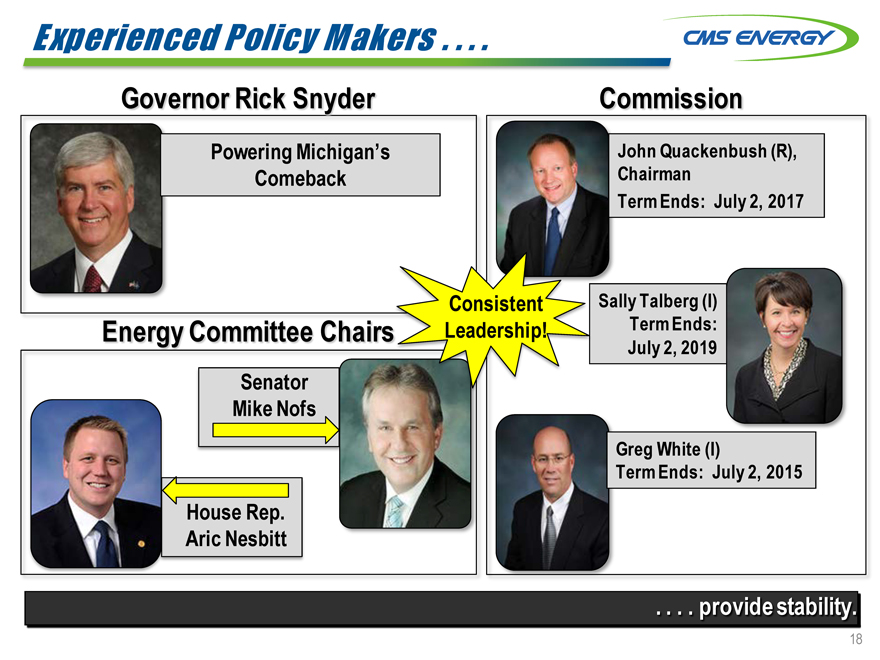
Experienced Policy Makers . . . . CMS ENERGY Governor Rick Snyder Powering Michigan’s Comeback Energy Committee Chairs CONSISTENT LEADERSHIP Senator Mike Nofs House Rep. Aric Nesbitt Commission John Quackenbush (R), Chairman Term Ends: July 2, 2017 Sally Talberg (I) Term Ends: July 2, 2019 Greg White (I) Term Ends: July 2, 2015 . . . provide stability. 18
|
|
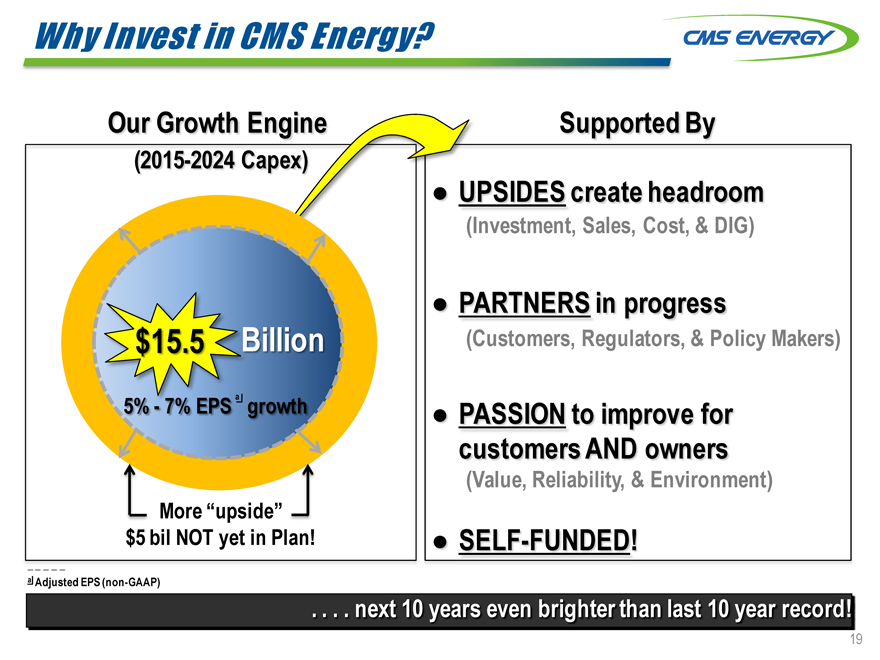
Why Invest in CMS Energy? Our Growth Engine (2015-2024 Capex) $15.5 Billion 5%—7% EPS a growth More “upside” $5 bil NOT yet in Plan! a Adjusted EPS (non-GAAP) Supported By UPSIDES create headroom (Investment, Sales, Cost, & DIG) PARTNERS in progress (Customers, Regulators, & Policy Makers) PASSION to improve for customers AND owners (Value, Reliability, & Environment) SELF-FUNDED! CMS ENERGY . . next 10 years even brighter than last 10 year record! 19
|
|
Appendix
|
|
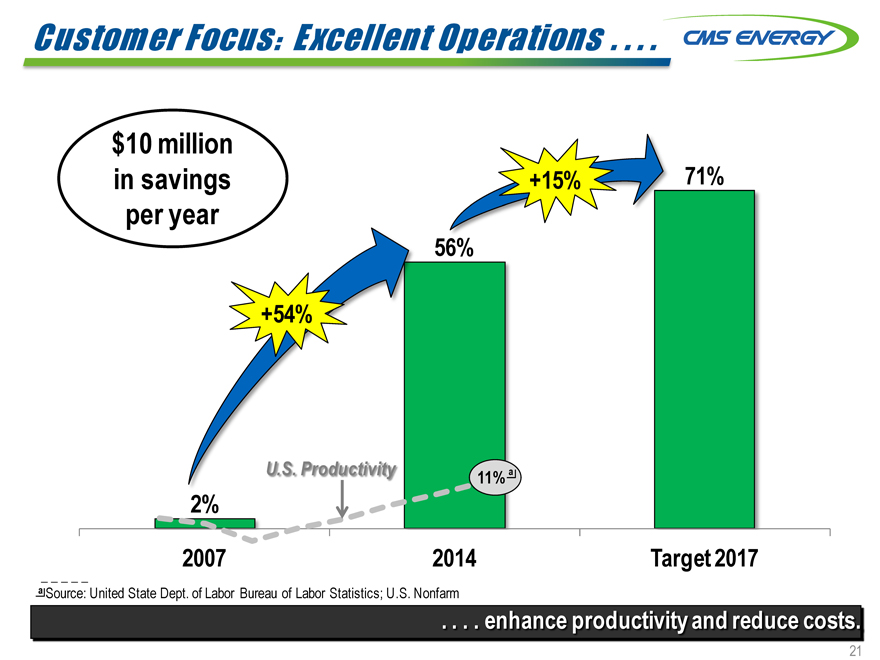
Customer Focus: Excellent Operations . . $10 million in savings per year +54% 56% +15% 71% 2% U.S. Productivity 11% a 2007 2014 Target 2017 a Source: United State Dept. of Labor Bureau of Labor Statistics; U.S. Nonfarm CMS ENERGY . enhance productivity and reduce costs. 21
|
|
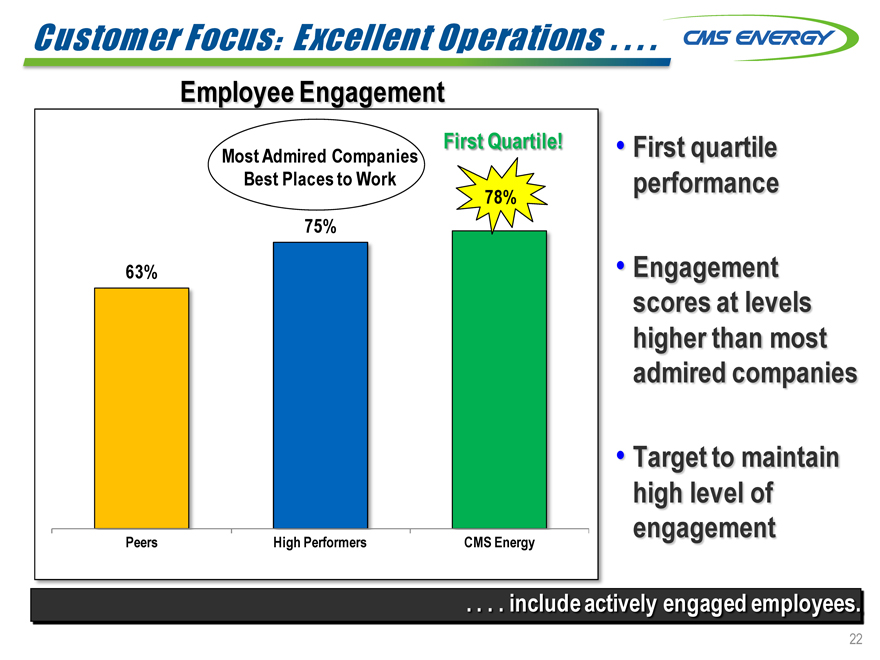
Customer Focus: Excellent Operations . . . . Employee Engagement Most Admired Companies Best Places to Work First Quartile! 63% 75% 78% Peers High Performers CMS Energy First quartile performance Engagement scores at levels higher than most admired companies Target to maintain high level of engagement CMS ENERGY . include actively engaged employees. 22
|
|
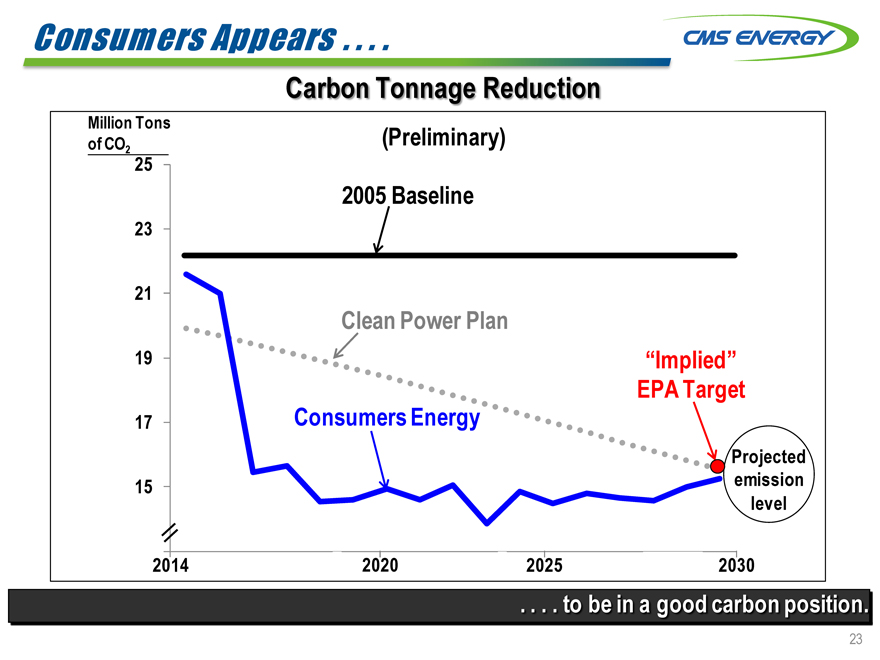
Consumers Appears . . . . Carbon Tonnage Reduction Million Tons of CO2 (Preliminary) 2005 Baseline Clean Power Plan Consumers Energy “Implied” EPA Target Projected emission level 25 23 21 19 17 15 2014 2020 2025 2029 2030 CMS ENERGY . to be in a good carbon position. 23
|
|
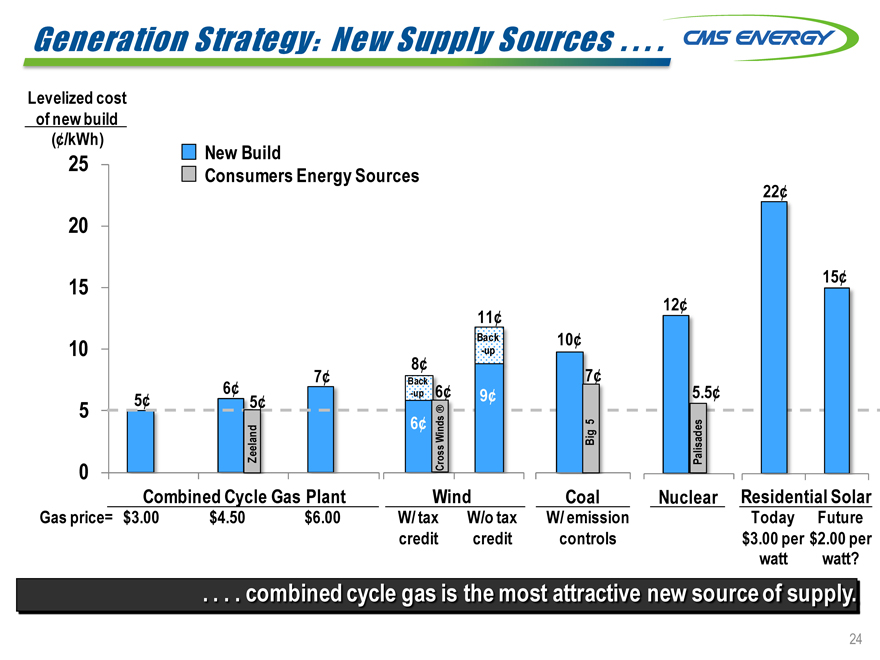
Generation Strategy: New Supply Sources . . . Levelized cost of new build (¢/kWh) New Build Consumers Energy Sources 25 20 15 10 5 0 7¢ 6¢ 5¢ 5¢ 8¢ 6¢ 11¢ 12¢ 10¢ 7¢ 5.5¢ 22¢ 15¢ Back -up Back -up ZEELAND Cross Winds ® BIG 5 Palisades 0 Combined Cycle Gas Plant Wind Coal Nuclear Residential Solar Gas price= $3.00 $4.50 $6.00 W/ tax W/o tax W/ emission Today Future credit credit controls $3.00 per $2.00 per watt watt? . . . . combined cycle gas is the most attractive new source of supply. 24
|
|
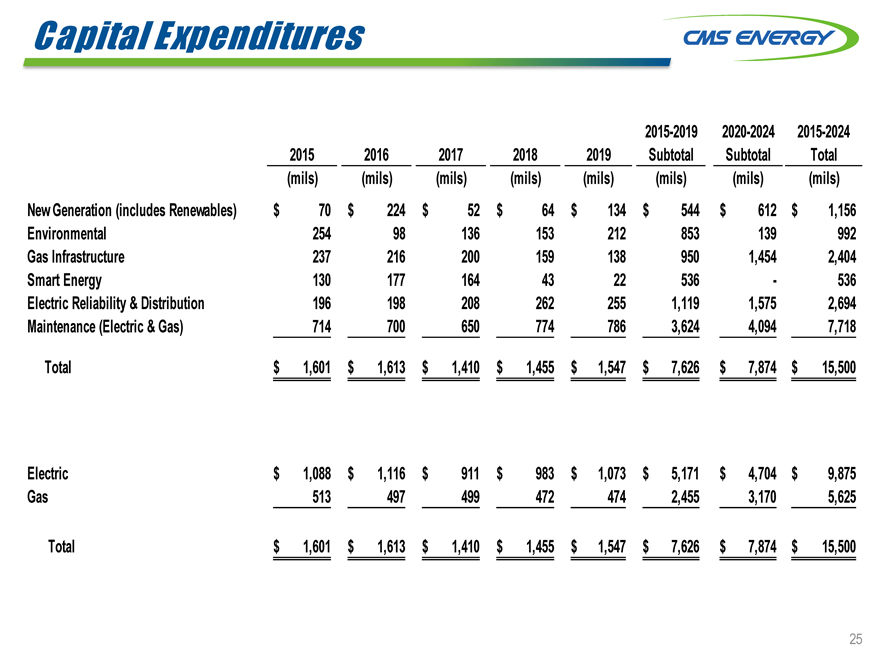
Capital Expenditures 2015-2019 2020-2024 2015-2024 2015 2016 2017 2018 2019 Subtotal Subtotal Total (mils) (mils) (mils) (mils) (mils) (mils) (mils) (mils) New Generation (includes Renewables) $ 70 $ 224 $ 52 $ 64 $ 134 $ 544 $ 612 $ 1,156 Environmental 254 98 136 153 212 853 139 992 Gas Infrastructure 237 216 200 159 138 950 1,454 2,404 Smart Energy 130 177 164 43 22 536 — 536 Electric Reliability & Distribution 196 198 208 262 255 1,119 1,575 2,694 Maintenance (Electric & Gas) 714 700 650 774 786 3,624 4,094 7,718 Total $ 1,601 $ 1,613 $ 1,410 $ 1,455 $ 1,547 $ 7,626 $ 7,874 $ 15,500 Electric $ 1,088 $ 1,116 $ 911 $ 983 $ 1,073 $ 5,171 $ 4,704 $ 9,875 Gas 513 497 499 472 474 2,455 3,170 5,625 Total $ 1,601 $ 1,613 $ 1,410 $ 1,455 $ 1,547 $ 7,626 $ 7,874 $ 15,500 CMS ENERGY 25
|
|
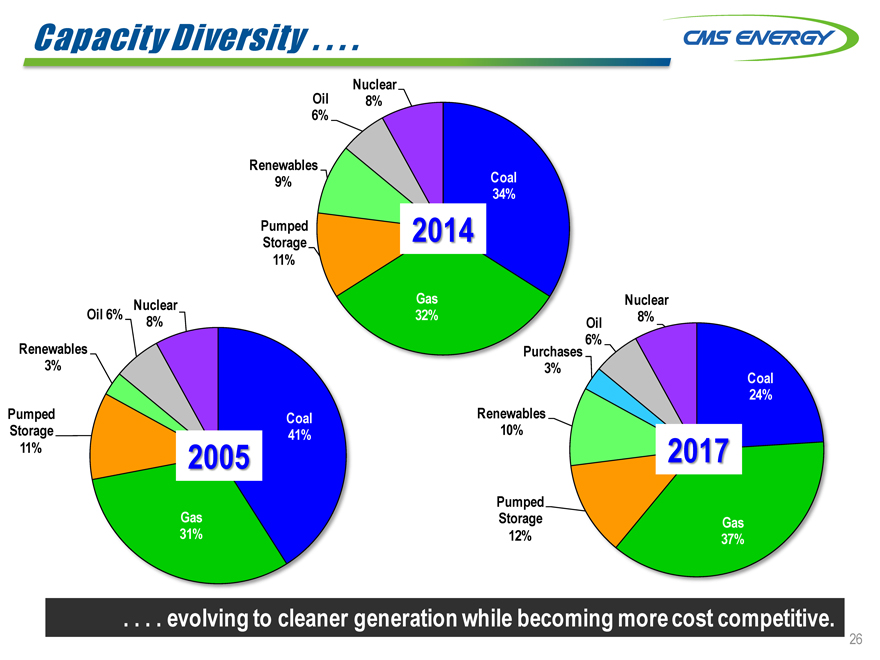
CMS ENERGY Capacity Diversity . . . . Nuclear 6% Oil 8% Renewables 9% Coal 34% Pumped Storage 2014 11% 32% Gas Nuclear 8% 6% Oil Purchases 3% Coal 24% Renewables 10% 2017 Pumped Storage Gas 12% 37% Nuclear Oil 6% 8% Renewables 3% Pumped Storage Coal 41% 11% 2005 31% Gas . evolving to cleaner generation while becoming more cost competitive. 26
|
|
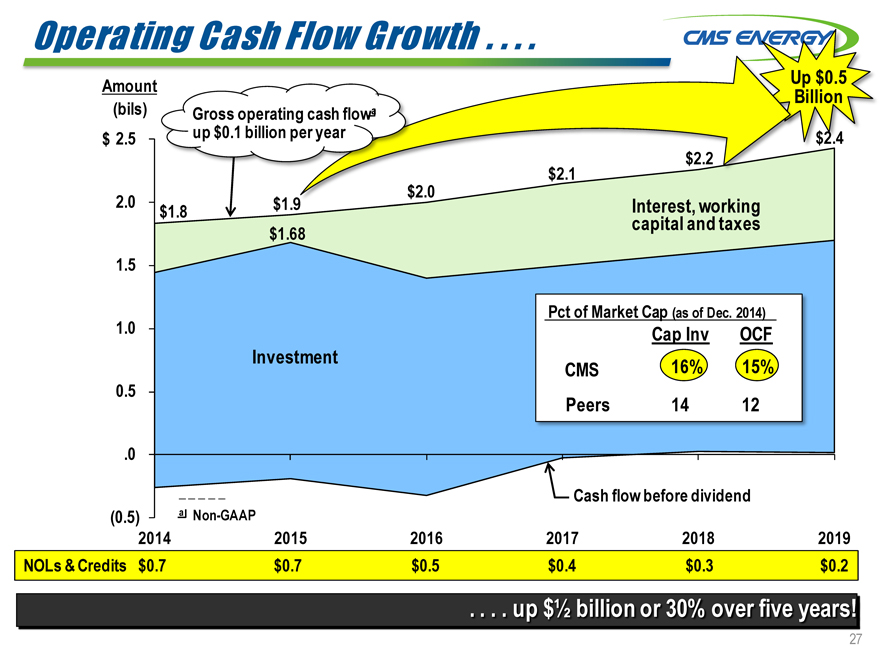
CMS ENERGY Operating Cash Flow Growth . . . Gross operating cash flowa up $0.1 billion per year Amount (bils) $ 2.5 2.0 1.5 1.0 0.5 .0 (0.5) $1.8 $1.9 $1.68 $2.0 $2.1 $2.2 $2.4 INTEREST WORKING capital and taxes Up $0.5 Billion Investment Pct of Market Cap (as of Dec. 2014) Cap Inv OCF CMS 13%16% 15% Peers 14 12 a Non-GAAP Cash flow before dividend 2014 2015 2016 2017 2018 2019 NOLs & Credits $0.7 $0.7 $0.5 $0.4 $0.3 $0.2 . . . . up $ 1/2 billion or 30% over five years! 27
|
|
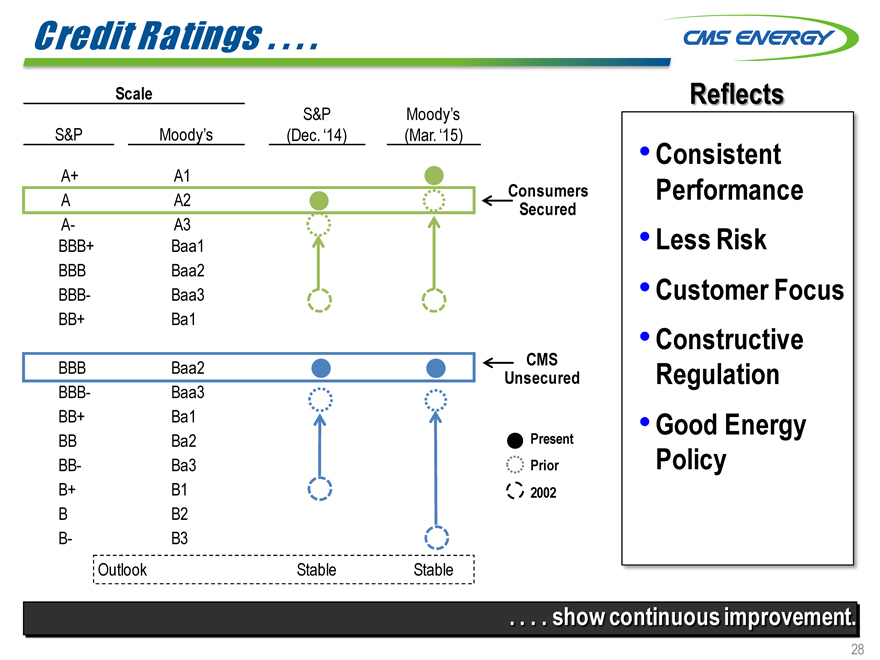
Credit Ratings . . . Scale S&P Moody’s S&P Moody’s (Dec. ‘14) (Mar. ‘15) A+ A1 A A2 A- A3 BBB+ Baa1 BBB Baa2 BBB- Baa3 BB+ Ba1 BBB Baa2 BBB- Baa3 BB+ Ba1 BB Ba2 BB- Ba3 B+ B1 B B2 B- B3 Outlook Stable Stable Consumers Secured CMS ENERGY CMS Unsecured Present Prior 2002 Reflects Consistent Performance Less Risk Customer Focus Constructive Regulation Good Energy Policy . show continuous improvement. 28
|
|
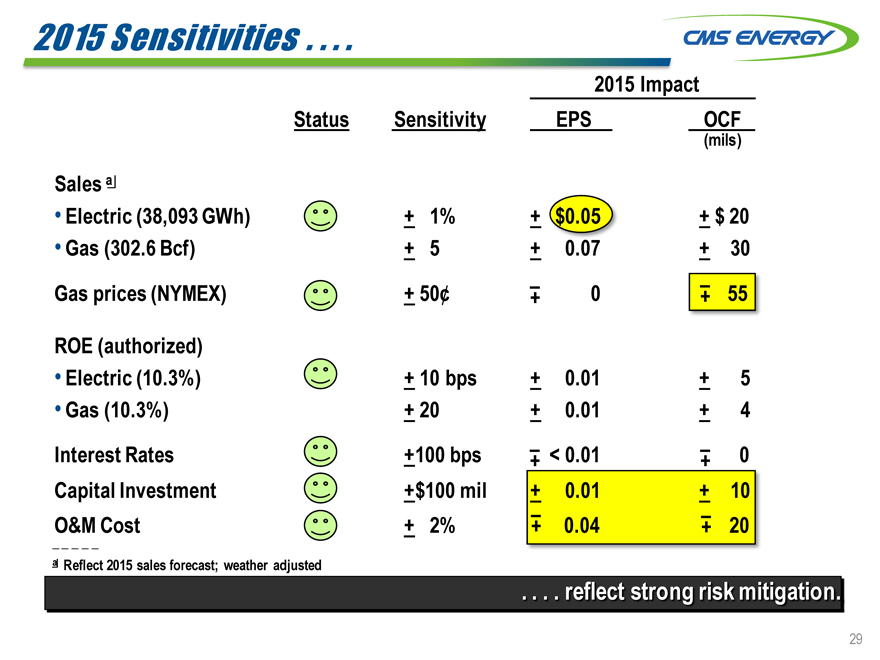
2015 Sensitivities . CMS ENERGY 2015 Impact Status Sensitivity EPS OCF (mils) Sales a • Electric (38,093 GWh) + 1% + $0.05 + $ 20 • Gas (302.6 Bcf) + 5 + 0.07 + 30 Gas prices (NYMEX) + 50¢ + – 0 + – 55 ROE (authorized) • Electric (10.3%) + 10 bps + 0.01 + 5 • Gas (10.3%) + 20 + 0.01 + 4 Interest Rates +100 bps + – < 0.01 + – 0 Capital Investment +$100 mil + 0.01 + 10 _ O&M Cost + 2% + – 0.04 + – 20 a Reflect 2015 sales forecast; weather adjusted . . reflect strong risk mitigation. 29
|
|
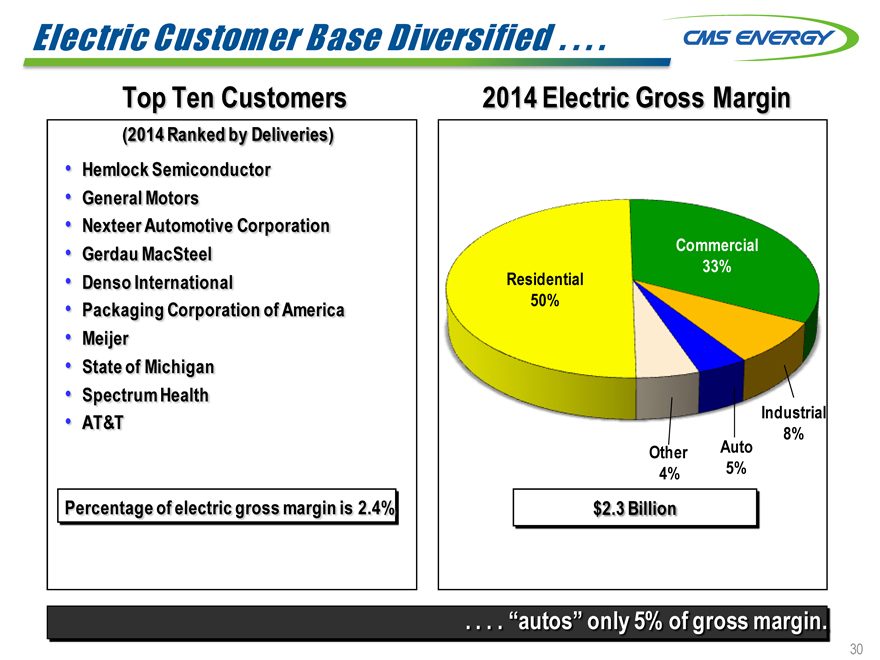
Electric Customer Base Diversified . Top Ten Customers (2014 Ranked by Deliveries) Hemlock Semiconductor General Motors Nexteer Automotive Corporation Gerdau MacSteel Denso International Packaging Corporation of America Meijer State of Michigan Spectrum Health AT&T Percentage of electric gross margin is 2.4% 2014 Electric Gross Margin Residential 50% Commercial 33% Other 4% Auto 5% Industrial 8% $2.3 BILLIION . “autos” only 5% of gross margin. 30 CMS ENERGY
|
|
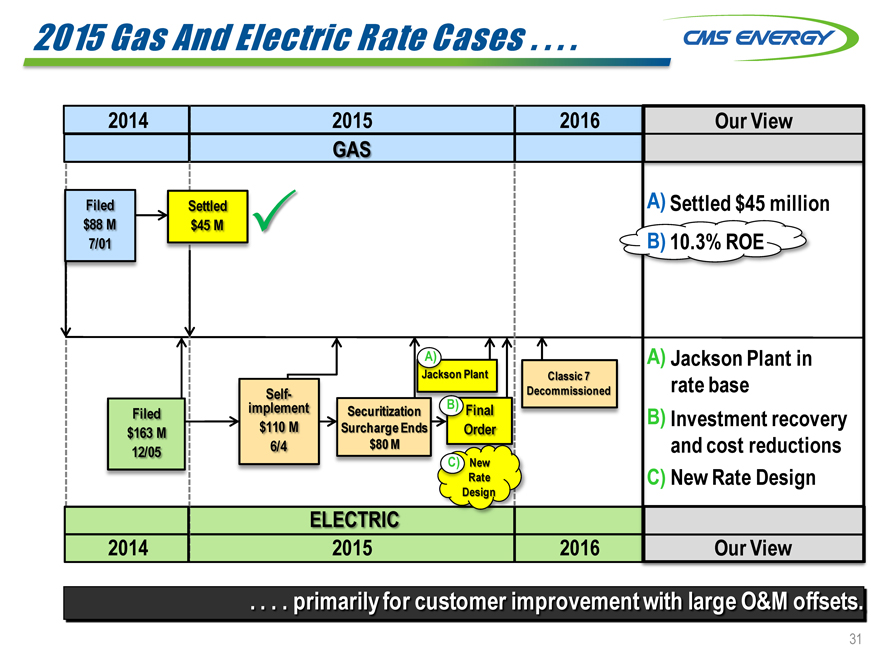
2015 Gas And Electric Rate Cases . . . CMS ENERGY 2014 2015 2016 Our View GAS Filed Se A) Settled $45 million $88 M $45 ? 7/01 B) 10.3% ROE A) A) Jackson Plant in on Plant Classic 7 rate base Self- Decommissioned Filed implement Securitization B) Final B) Investment recovery $163 M $110 M Surcharge Ends Order 12/05 6/4 $80 M and cost reductions C) New Rate C) New Rate Design Design ELECTRIC 2014 2015 2016 Our View . primarily for customer improvement with large O&M offsets. 31
|
|

GAAP Reconciliation
|
|
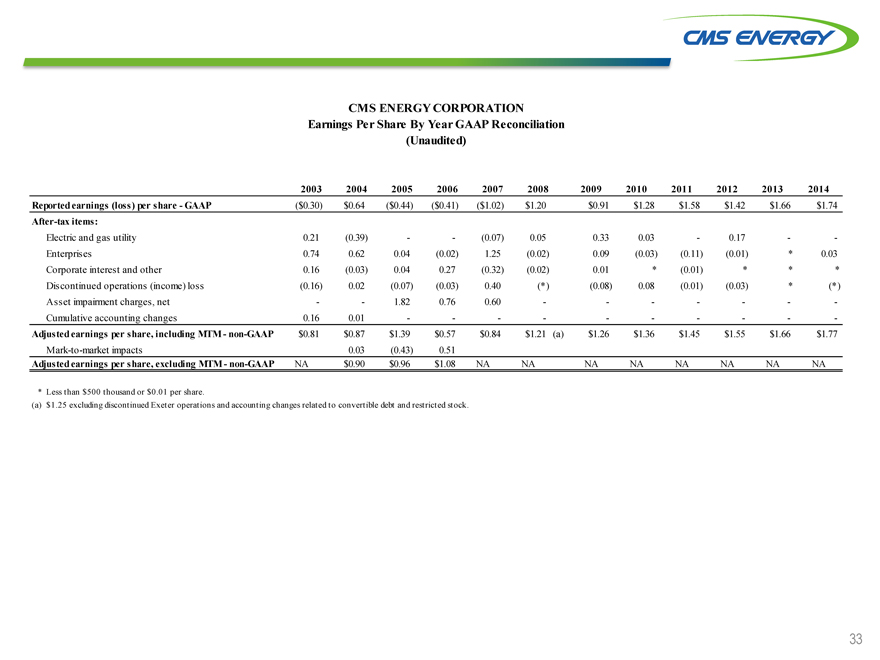
CMS ENERGY CORPORATION Earnings Per Share By Year GAAP Reconciliation (Unaudited) CMS ENERGY 2003 2004 2005 2006 2007 2008 2009 2010 2011 2012 2013 2014 Reported earnings (loss) per share—GAAP ($0.30) $0.64 ($0.44) ($0.41) ($1.02) $1.20 $0.91 $1.28 $1.58 $1.42 $1.66 $1.74 After-tax items: Electric and gas utility 0.21 (0.39) —— (0.07) 0.05 0.33 0.03 — 0.17 ——Enterprises 0.74 0.62 0.04 (0.02) 1.25 (0.02) 0.09 (0.03) (0.11) (0.01) * 0.03 Corporate interest and other 0.16 (0.03) 0.04 0.27 (0.32) (0.02) 0.01 * (0.01) * * * Discontinued operations (income) loss (0.16) 0.02 (0.07) (0.03) 0.40 (*) (0.08) 0.08 (0.01) (0.03) * (*) Asset impairment charges, net —— 1.82 0.76 0.60 ———————Cumulative accounting changes 0.16 0.01 ——————————Adjusted earnings per share, including MTM—non-GAAP $0.81 $0.87 $1.39 $0.57 $0.84 $1.21 (a) $1.26 $1.36 $1.45 $1.55 $1.66 $1.77 Mark-to-market impacts 0.03 (0.43) 0.51 Adjusted earnings per share, excluding MTM—non-GAAP NA $0.90 $0.96 $1.08 NA NA NA NA NA NA NA NA * Less than $500 thousand or $0.01 per share. (a) $1.25 excluding discontinued Exeter operations and accounting changes related to convertible debt and restricted stock. 33
|
|
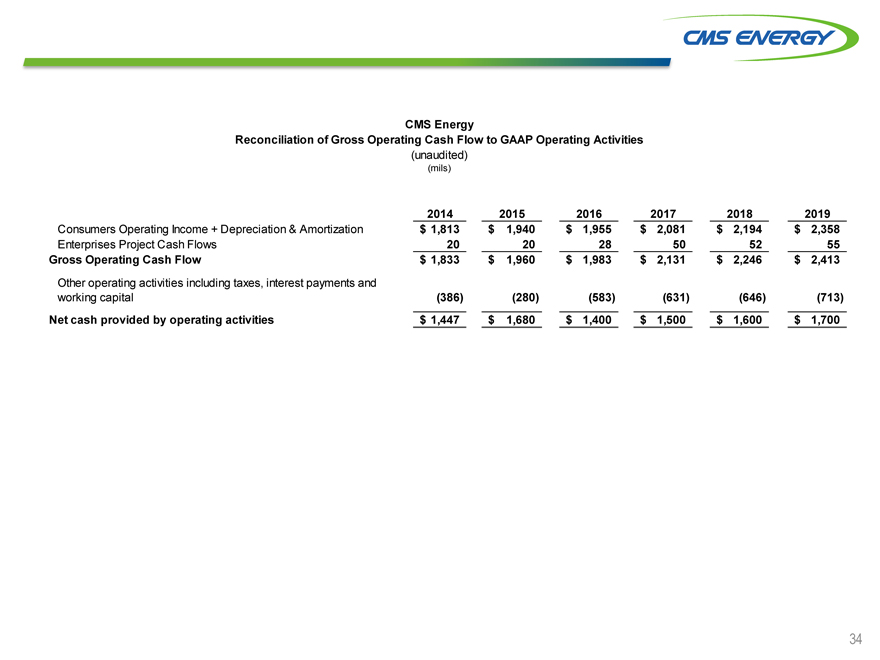
CMS Energy Reconciliation of Gross Operating Cash Flow to GAAP Operating Activities (unaudited) (mils) 2014 2015 2016 2017 2018 2019 Consumers Operating Income + Depreciation & Amortization $ 1,813 $ 1,940 $ 1,955 $ 2,081 $ 2,194 $ 2,358 Enterprises Project Cash Flows 20 20 28 50 52 55 Gross Operating Cash Flow $ 1,833 $ 1,960 $ 1,983 $ 2,131 $ 2,246 $ 2,413 Other operating activities including taxes, interest payments and working capital (386) (280) (583) (631) (646) (713) Net cash provided by operating activities $ 1,447 $ 1,680 $ 1,400 $ 1,500 $ 1,600 $ 1,700 34
|
|
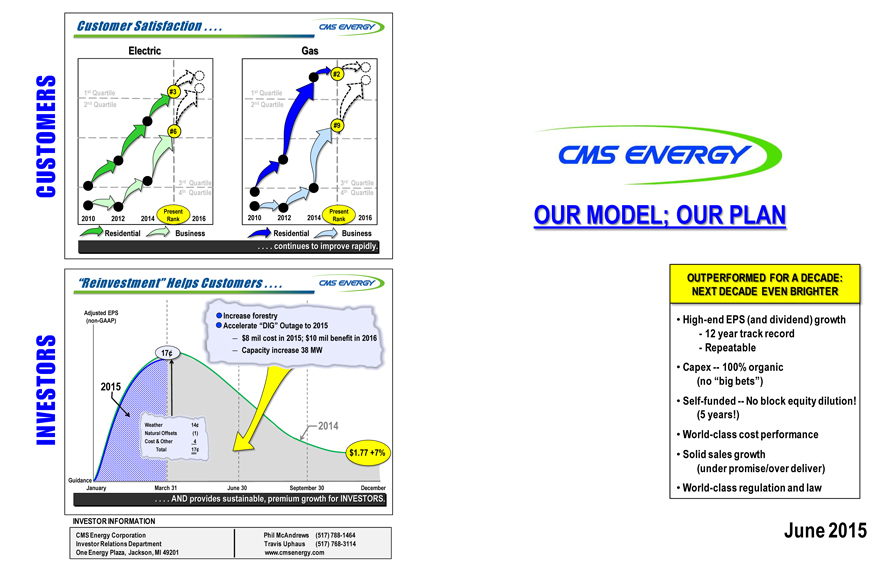
CMS ENERGY OUR MODEL; OUR PLAN OUTPERFORMED FOR A DECADE: NEXT DECADE EVEN BRIGHTER High-end EPS (and dividend) growth—12 year track record—Repeatable Capex — 100% organic (no “big bets”) Self-funded — No block equity dilution! (5 years!) World-class cost performance Solid sales growth (under promise/over deliver) World-class regulation and law June 2015 CUSTOMERS Customer Satisfaction . . . . Electric 1st Quartile 2nd Quartile #3 #6 3rd Quartile 4th Quartile Present 2010 2012 2014 Rank 2016 Residential Business Gas 1st Quartile 2nd Quartile #2 #9 3rd Quartile 4th Quartile Present 2010 2012 2014 Rank 2016 Residential Business “Reinvestment” Helps Customers . . . . INVESTORS Increase forestry Accelerate “DIG” Outage to 2015 — $8 mil cost in 2015; $10 mil benefit in 2016 — Capacity increase 38 MW Adjusted EPS (non-GAAP) 2015 17¢ Weather 14¢ Natural Offsets (1) Cost & Other 4 Total 17¢ 2014 $1.77 +7% Guidance January March 31 June 30 September 30 December . . . . AND provides sustainable, premium growth for INVESTORS. INVESTOR INFORMATION CMS Energy Corporation Phil McAndrews (517) 788-1464 Investor Relations Department Travis Uphaus (517) 768-3114 One Energy Plaza, Jackson, MI 49201 www.cmsenergy.com
|
|
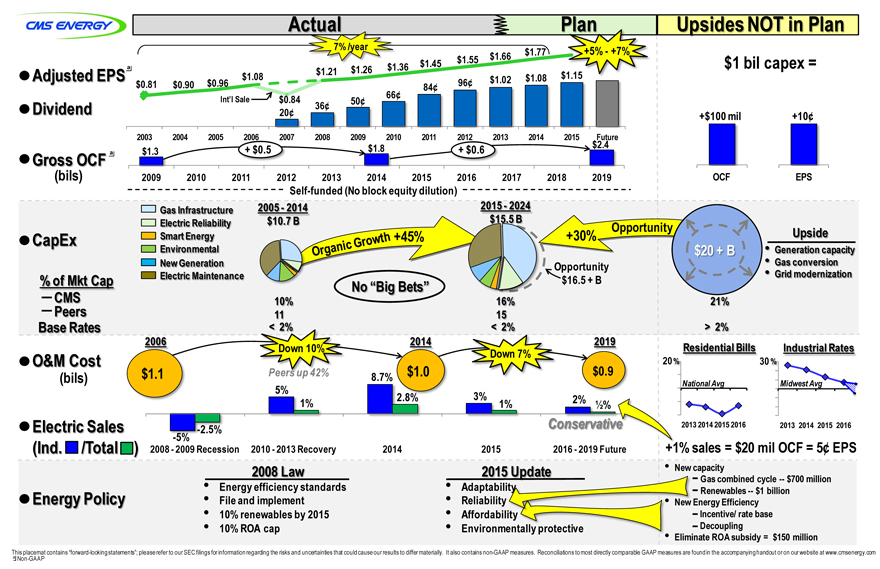
CMS ENERGY Actual Plan Upsides NOT in Plan a Adjusted EPS Dividend a Gross OCF (bils) CapEx % of Mkt Cap CMS Base Peers Rates O&M (bils) Cost Electric Sales (Ind. /Total Energy Policy $0.81 $0.90 $0.96 $1.08 $1.21 .36 $1.45 $1.26 $1.66 $1.77 $1.55 7% /year +5%—+7% Int’l Sale $0.84 20¢ 66¢ 36¢ 50¢ 96¢ $1.02 84¢ $1.08 $1.15 2003 2004 2005 2006 2007 2008 2009 2010 2011 2012 2013 2014 2015 Future + $0.5 $1.8 + $0.6 $2.4 $1.3 2009 2010 2011 2012 2013 2014 2015 2016 2017 2018 2019 Self-funded (No block equity dilution) Gas Infrastructure Electric Reliability Smart Energy Environmental New Generation Electric Maintenance 2005—2014 $10.7 B 2015—2024 $15.5 B ORGANIC GROWTH +45% +30% Opportunity 2006 $1.1 10% 11 < 2% Down 10% Peers up 42% 5% 1% No “Big Bets” 2014 8.7% $1.0 2.8% 16% 15 < 2% Down 7% 3% 1% Opportunity $16.5 + B 2019 $0.9 2% 1/2% Conservative 2016—2019 Future Conservative 2016—2019 Future 2008—2009 Recession 2010—2013 Recovery 2014 2015 2008 Law Energy efficiency standards File and implement 10% renewables by 2015 10% ROA cap 2015 Update Adaptabilit Reliability Affordabilit Environmen $1 bil capex = +$100 mil +10¢ OCF EPS $20 + B Upside Generation capacity Gas conversion Grid modernization 21% > 2% Residential Bills 20% National Avg Industrial Rates 30 % Midwest Avg 2013 2014 2015 2016 2013 2014 2015 2016 1% sales = $20 mil OCF = 5¢ EPS New capacity Gas combined cycle — $700 million Renewables — $1 billion Energy Efficiency • Incentive/ rate base • Decoupling Eliminate ROA subsidy = $150 million This placemat contains “forward-looking statements”; please refer to our SEC filings for information regarding the risks and uncertainties that could cause our results to differ materially. It also contains non-GAAP measures. Reconciliations to most directly comparable GAAP measures are found in the accompanying handout or on our website at www.cmsenergy.com a Non-GAAP
Serious News for Serious Traders! Try StreetInsider.com Premium Free!
You May Also Be Interested In
- CMS Energy (CMS) Misses Q1 EPS by 1c ; Offers Guidance
- Robbins LLP Reminds IRobot Corporation Shareholders of the Pending May 7, 2024 Lead Plaintiff Deadline
- Banco Itaú Chile Files Material Event Notice announcing Extraordinary General Shareholders’ Meeting Agreements
Create E-mail Alert Related Categories
SEC FilingsSign up for StreetInsider Free!
Receive full access to all new and archived articles, unlimited portfolio tracking, e-mail alerts, custom newswires and RSS feeds - and more!
