

Form 8-K CINCINNATI FINANCIAL For: Mar 08
 Tweet
Tweet Share
Share
UNITED STATES
SECURITIES AND EXCHANGE COMMISSION
Washington, D.C. 20549
FORM 8-K
CURRENT REPORT
Pursuant to Section 13 OR 15(d) of the Securities Exchange Act of 1934
Date of Report: March 8, 2016
(Date of earliest event reported)
CINCINNATI FINANCIAL CORPORATION
(Exact name of registrant as specified in its charter)
| Ohio | 0-4604 | 31-0746871 | ||
| (State or other jurisdiction | (Commission | (I.R.S. Employer | ||
| of incorporation) | File Number) | Identification No.) |
| 6200 S. Gilmore Road, Fairfield, Ohio | 45014-5141 | |
| (Address of principal executive offices) | (Zip Code) |
Registrant’s telephone number, including area code: (513) 870-2000
N/A
(Former name or former address, if changed since last report.)
Check the appropriate box below if the Form 8-K filing is intended to simultaneously satisfy the filing obligation of the registrant under any of the following provisions:
| ¨ | Written communications pursuant to Rule 425 under the Securities Act (17 CFR 230.425) |
| ¨ | Soliciting material pursuant to Rule 14a-12 under the Exchange Act (17 CFR 240.14a-12) |
| ¨ | Pre-commencement communications pursuant to Rule 14d-2(b) under the Exchange Act (17 CFR 240.14d-2(b)) |
| ¨ | Pre-commencement communications pursuant to Rule 13e-4(c) under the Exchange Act (17 CFR 240.13a-4(c)) |
Item 7.01 Regulation FD Disclosure
On March 8, 2016, Cincinnati Financial Corporation posted presentation slides in PDF format on cinfin.com/investors that will be used in investor presentations beginning March 9, 2016. Exhibit 99.1 is a copy of the slides. On March 8, 2016, Cincinnati Financial Corporation posted presentation slides in PDF format on cinfin.com/investors that will be used in a presentation and webcast at the 2016 RBC Capital Markets’ Financial Institutions Conference beginning March 9, 2016. Exhibit 99.2 is a copy of the slides. The slides are being furnished pursuant to Item 7.01, and the information contained therein shall not be deemed “filed” for the purposes of Section 18 of the Securities Exchange Act of 1934, as amended or otherwise subject to the liabilities of that section. This report should not be deemed an admission as to the materiality of any information contained in the investor presentation slides.
Item 9.01 Financial Statements and Exhibits
(c) Exhibits
Exhibit 99.1 – Investor presentation slides
Exhibit 99.2 – Investor presentation slides for the presentation and webcast at the 2016 RBC Capital Markets’ Financial Institutions Conference
Safe Harbor Statement
This is our “Safe Harbor” statement under the Private Securities Litigation Reform Act of 1995. Our business is subject to certain risks and uncertainties that may cause actual results to differ materially from those suggested by the forward-looking statements in this report. Some of those risks and uncertainties are discussed in our 2015 Annual Report on Form 10-K, Item 1A, Risk Factors, Page 26.
Factors that could cause or contribute to such differences include, but are not limited to:
| · | Unusually high levels of catastrophe losses due to risk concentrations, changes in weather patterns, environmental events, terrorism incidents or other causes |
| · | Increased frequency and/or severity of claims or development of claims that are unforeseen at the time of policy issuance |
| · | Inadequate estimates, assumptions or reliance on third-party data used for critical accounting estimates |
| · | Declines in overall stock market values negatively affecting the company’s equity portfolio and book value |
| · | Domestic and global events resulting in capital market or credit market uncertainty, followed by prolonged periods of economic instability or recession, that lead to: |
| o | Significant or prolonged decline in the fair value of a particular security or group of securities and impairment of the asset(s) |
| o | Significant decline in investment income due to reduced or eliminated dividend payouts from a particular security or group of securities |
| o | Significant rise in losses from surety and director and officer policies written for financial institutions or other insured entities |
| · | Prolonged low interest rate environment or other factors that limit the company’s ability to generate growth in investment income or interest rate fluctuations that result in declining values of fixed-maturity investments, including declines in accounts in which we hold bank-owned life insurance contract assets |
| · | Recession or other economic conditions resulting in lower demand for insurance products or increased payment delinquencies |
| · | Difficulties with technology or data security breaches, including cyberattacks, that could negatively affect our ability to conduct business and our relationships with agents, policyholders and others |
| · | Disruption of the insurance market caused by technology innovations such as driverless cars that could decrease consumer demand for insurance products |
| · | Delays, inadequate data developed internally or from third parties, or performance inadequacies from ongoing development and implementation of underwriting and pricing methods, including telematics and other usage-based insurance methods, or technology projects and enhancements expected to increase our pricing accuracy, underwriting profit and competitiveness |
| · | Increased competition that could result in a significant reduction in the company’s premium volume |
| · | Changing consumer insurance-buying habits and consolidation of independent insurance agencies that could alter our competitive advantages |
| · | Inability to obtain adequate ceded reinsurance on acceptable terms, amount of reinsurance coverage purchased, financial strength of reinsurers and the potential for nonpayment or delay in payment by reinsurers |
| · | Inability to defer policy acquisition costs for any business segment if pricing and loss trends would lead management to conclude that segment could not achieve sustainable profitability |
| · | Inability of our subsidiaries to pay dividends consistent with current or past levels |
| · | Events or conditions that could weaken or harm the company’s relationships with its independent agencies and hamper opportunities to add new agencies, resulting in limitations on the company’s opportunities for growth, such as: |
| o | Downgrades of the company’s financial strength ratings |
| o | Concerns that doing business with the company is too difficult |
| o | Perceptions that the company’s level of service, particularly claims service, is no longer a distinguishing characteristic in the marketplace |
| o | Inability or unwillingness to nimbly develop and introduce coverage product updates and innovations that our competitors offer and consumers expect to find in the marketplace |
| · | Actions of insurance departments, state attorneys general or other regulatory agencies, including a change to a federal system of regulation from a state-based system, that: |
| o | Impose new obligations on us that increase our expenses or change the assumptions underlying our critical accounting estimates |
| o | Place the insurance industry under greater regulatory scrutiny or result in new statutes, rules and regulations |
| o | Restrict our ability to exit or reduce writings of unprofitable coverages or lines of business |
| o | Add assessments for guaranty funds, other insurance-related assessments or mandatory reinsurance arrangements; or that impair our ability to recover such assessments through future surcharges or other rate changes |
| o | Increase our provision for federal income taxes due to changes in tax law |
| o | Increase our other expenses |
| o | Limit our ability to set fair, adequate and reasonable rates |
| o | Place us at a disadvantage in the marketplace |
| o | Restrict our ability to execute our business model, including the way we compensate agents |
| · | Adverse outcomes from litigation or administrative proceedings |
| · | Events or actions, including unauthorized intentional circumvention of controls, that reduce the company’s future ability to maintain effective internal control over financial reporting under the Sarbanes-Oxley Act of 2002 |
| · | Unforeseen departure of certain executive officers or other key employees due to retirement, health or other causes that could interrupt progress toward important strategic goals or diminish the effectiveness of certain longstanding relationships with insurance agents and others |
| · | Events, such as an epidemic, natural catastrophe or terrorism, that could hamper our ability to assemble our workforce at our headquarters location |
Further, the company’s insurance businesses are subject to the effects of changing social, global, economic and regulatory environments. Public and regulatory initiatives have included efforts to adversely influence and restrict premium rates, restrict the ability to cancel policies, impose underwriting standards and expand overall regulation. The company also is subject to public and regulatory initiatives that can affect the market value for its common stock, such as measures affecting corporate financial reporting and governance. The ultimate changes and eventual effects, if any, of these initiatives are uncertain.
Signature
Pursuant to the requirements of the Securities Exchange Act of 1934, the registrant has duly caused this report to be signed on its behalf by the undersigned hereunto duly authorized.
| CINCINNATI FINANCIAL CORPORATION | |
| Date: March 8, 2016 | /S/ Michael J. Sewell |
| Michael J. Sewell, CPA | |
| Chief Financial Officer, Senior Vice President and Treasurer |
Exhibit 99.1
Cincinnati Financial Corporation Investor Handout March 2016 Nasdaq: CINF This presentation contains forward-looking statements that involve risks and uncertainties. Please refer to our various filings with the U.S. Securities and Exchange Commission for factors that could cause results to materially differ from those discussed. The forward-looking information in this presentation has been publicly disclosed, most recently on February 26, 2016, and should be considered to be effective only as of that date. Its inclusion in this document is not intended to be an update or reaffirmation of the forward-looking information as of any later date. Reconciliations of non-GAAP measures are in our most recent quarterly earnings news release, which is available at cinfin.com/investors. Copyright © 2016 Cincinnati Financial Corporation. All rights reserved. Do not reproduce or post online, in whole or in part, without written permission. 1

Strategy Overview Competitive advantages: • Relationships leading to agents’ best accounts • Financial strength for stability and confidence • Local decision making and claims excellence Other distinguishing factors: • 55 years of shareholder dividend increases • Common stocks are approximately 30% of investments • 27 years of favorable reserve development Performance Targets & Trends 3.4% value creation ratio for full-year 2015 below target: 10% to 13% annual average for 2013 through 2017 – 5.5% negative effect from bond and stock portfolio valuation in 2015 – 10.1% five-year VCR average as of 12-31-15 Related performance drivers were on track for 2015: – 5% premium growth exceeding estimated industry average – 91.1% combined ratio, better than 95% to 100% long-term target – 10 consecutive quarters of investment income growth Ranked #1 or #2 in ~75% of agencies appointed 5+ years Improving through strategic profitability & growth initiatives Copyright © 2016 Cincinnati Financial Corporation. All rights reserved. Do not reproduce or post online, in whole or in part, without written permission. 2

Cincinnati Financial at a Glance Top 25 U.S. P/C insurer A.M. Best rating: A+ Superior $4.5 billion 2015 premiums: 67% Commercial 24% Personal 5% Life 4% Excess & surplus Competitive advantages: – Relationships leading to agents’ best accounts – Financial strength for stability and confidence – Local decision making and claims excellence 55 consecutive years of shareholder dividend increases – Only eight U.S. public companies can match this record – 31% increase in 2015 dividends paid (26% from special dividend) – Yield is attractive, 3.0% in early-March 2016 Fourth-Quarter 2015 Highlights EPS of 94 cents per share vs. $1.02 in 4Q14 – Operating earnings rose $34 million, or 23%, compared with fourth-quarter 2014 Investment income rose 7% – Dividend income was up 14%, interest income was up 4% Property casualty net written premiums grew 7% – Higher average renewal pricing: commercial lines, personal lines and excess and surplus lines each rose at a low-single-digit percentage rate Combined ratio of 87.0% improved 3.4 points – 2.1 point increase in ratio for natural catastrophe losses Copyright © 2016 Cincinnati Financial Corporation. All rights reserved. Do not reproduce or post online, in whole or in part, without written permission. 3
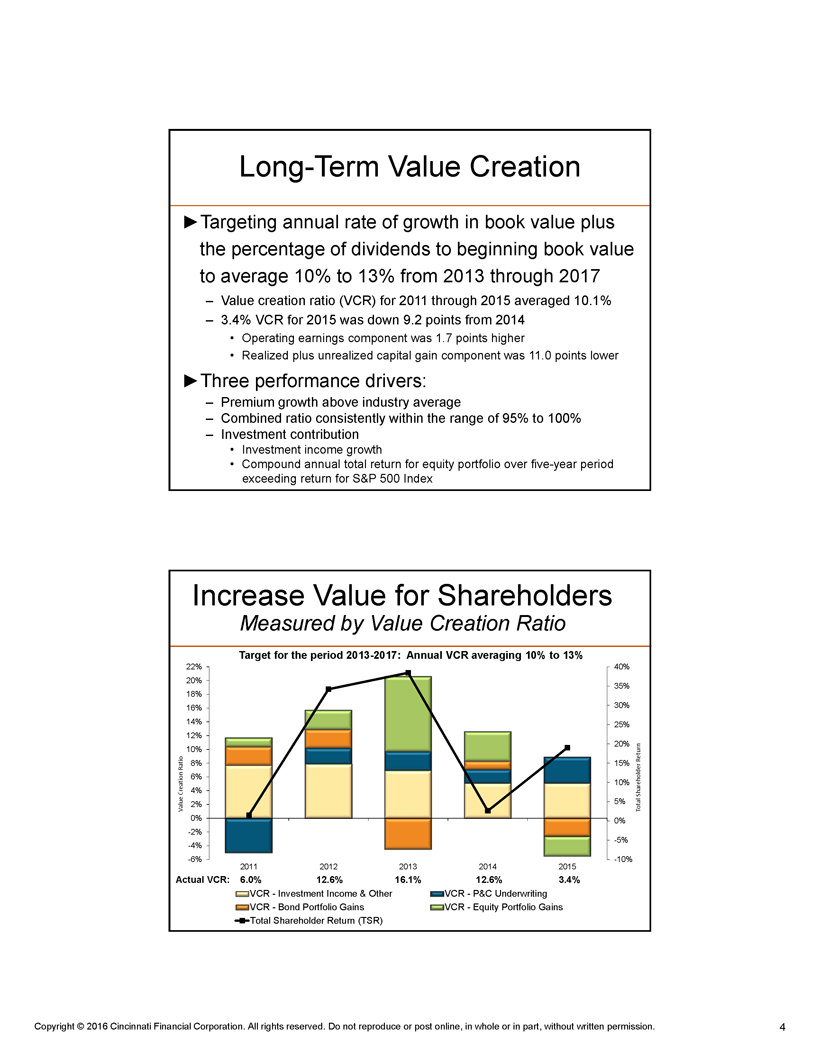
Long-Term Value Creation Targeting annual rate of growth in book value plus the percentage of dividends to beginning book value to average 10% to 13% from 2013 through 2017 – Value creation ratio (VCR) for 2011 through 2015 averaged 10.1% – 3.4% VCR for 2015 was down 9.2 points from 2014 • Operating earnings component was 1.7 points higher • Realized plus unrealized capital gain component was 11.0 points lower Three performance drivers: – Premium growth above industry average – Combined ratio consistently within the range of 95% to 100% – Investment contribution • Investment income growth • Compound annual total return for equity portfolio over five-year period exceeding return for S&P 500 Index Increase Value for Shareholders Measured by Value Creation Ratio Target for the period 2013-2017: Annual VCR averaging 10% to 13% 22% 40% 20% 35% 18% 16% 30% 14% 25% 12% 20% 10% 8% 15% 6%10% 4% 5% 2% Total Shareholder Return Value Creation Ratio 0% 0% -2% -5% -4% -6% -10% 2011 2012 2013 2014 2015 Actual VCR: 6.0% 12.6% 16.1% 12.6% 3.4% VCR - Investment Income & Other VCR - P&C Underwriting VCR - Bond Portfolio Gains VCR - Equity Portfolio Gains Total Shareholder Return (TSR) Copyright © 2016 Cincinnati Financial Corporation. All rights reserved. Do not reproduce or post online, in whole or in part, without written permission. 4

Outperforming the Industry Five-Year Average Combined Ratio 4 Points Better Statutory combined ratio Industry data excludes mortgage and financial guaranty 105% 100% 95% 90% 85% 80% 75% 70% 65% 2011 2012 2013 2014 2015 Cincinnati – excl. cat. losses Est. Industry (A.M. Best) – excl. cat. Losses Cincinnati – incl. cat. losses Est. Industry (A.M. Best) – incl. cat. Losses Cincinnati’s historical catastrophe loss annual averages as of 12-31-15: 5-year = 6.9%, 10-year = 5.9% Strategies for Long-Term Success Financial strength for consistent support to agencies – Diversified fixed-maturity portfolio, laddered maturity structure • No corporate exposure exceeded 0.6% of total bond portfolio at 12-31-15, no municipal exposure exceeded 0.3% – 31.2% of investment portfolio in common stocks to grow book value • No single security exceeded 3.3% of publicly traded common stock portfolio – Portfolio composition helps mitigate anticipated effects of inflation and a rise in interest rates – Low reliance on debt, with 11.3% debt-to-total-capital at 12-31-15 • Nonconvertible, noncallable debentures due in 2028 and 2034 – Capacity for growth with premiums-to-surplus at 1.0-to-1 Operating structure reflects agency-centered model – Field focus – staffed for local decision making, agency support – Superior claims service and broad insurance product offerings Profit improvement and premium growth initiatives Copyright © 2016 Cincinnati Financial Corporation. All rights reserved. Do not reproduce or post online, in whole or in part, without written permission. 5

Manage Insurance Profitability Ongoing underwriting expertise enhancement – Predictive modeling tools and analytics to improve property casualty pricing precision and segmentation on an individual policy basis – Data management for better underwriting and more granular pricing decisions – Staff specialization and augmentation aimed at lowering loss ratios Improving efficiencies and ease of use with technology – Streamlining processing for agencies and the company – Helps optimize personalized service Focus where needed, investments for the future – Addressing auto profitability with rate adequacy and risk selection initiatives – Strategic investments with modest short-term effects on expense ratios • Headquarters staff additions include high net worth and reinsurance assumed initiatives • 15% increase in field staff since the end of 2011, supporting healthy premium growth Drive Premium Growth New agency appointments bring potential for growth over time – 114 appointed in 2015, $4.2B aggregate premiums from all carriers Expanding marketing and service capabilities – Enhanced marketing, products and services for high net worth clients of our agencies; contributed 20% of full-year 2015 personal lines new business – Expanded use of assumed reinsurance to further deploy capital, diversify risk – Ongoing development of target market programs and cross-selling – Expansion of Cincinnati Customer Care Center for small commercial policies 5% growth in 2015 P&C net written premiums – Commercial lines up 4%, personal lines up 6%, E&S up 14% – Average price increases: commercial lines = low-single-digits, personal lines and E&S = mid-single-digits – Term life insurance earned premiums up 4% Copyright © 2016 Cincinnati Financial Corporation. All rights reserved. Do not reproduce or post online, in whole or in part, without written permission. 6

Select Group of Agencies in 39 States 1,526 agency relationships with 1,956 locations (as of December 31, 2015) Our Commercial Top Five = 39% Ohio, Illinois, Pennsylvania, Indiana, North Carolina Our Personal Top Five = 55% Ohio, Georgia, Indiana, Illinois, Michigan Market Share Top Five P&C Market Share: Ohio: 4.7% 1% and higher Indiana: 2.8% Less than 1% Kentucky: 2.4% Inactive states Montana: 2.1% Headquarters (no branches) Alabama: 2.1% Based on 2014 data excluding A&H Premium Growth Potential Steadily Increase Our Share Within Appointed Agencies Cincinnati share of $39 billion total* premiums (including approximately $3 billion E&S) produced by currently appointed agencies is approximately 11% Market share per agency reporting location by year appointed Based on 2014 standard market P&C agency written premiums 16.5% (Excludes excess and surplus lines) 8.4% 5.2% 0.8% 1 year or less 2-5 years 6-10 years 10 years or more New appointments also drive premium growth opportunity ─ Agency relationship net count increased by 29% since the end of 2009 ─ Agencies appointed during 2011-15 produce $14 billion total* of standard lines business * Estimated annual property casualty premiums written with all carriers represented by agencies appointed by Cincinnati Insurance Copyright © 2016 Cincinnati Financial Corporation. All rights reserved. Do not reproduce or post online, in whole or in part, without written permission. 7

APPENDIX Income, Dividend & Cash Flow Trends Reserve Adequacy & Prior Accident Year Development Pricing Precision & Premium Growth Trends Business Mix & Reinsurance Ceded Program Investment Portfolio Management & Performance Financial Strength Ratings & Valuation Comparison to Peers Income and Shareholder Dividends $4.00 $3.50 $3.00 $2.50 $2.00 $1.50 $1.00 $0.50 $0.00 2011 2012 2013 2014 2015 Operating Income Net Income Dividends declared Per share basis Copyright © 2016 Cincinnati Financial Corporation. All rights reserved. Do not reproduce or post online, in whole or in part, without written permission. 8

Cash Dividend Payout Ratio Strong Capital and Cash Flow Support Recent Payout Levels 120% 63% average for years 2006 through 2015 (net income basis) 100% 80% 60% 40% 20% 0% 2002 2003 2004 2005 2006 2007 2008 2009 2010 2011* 2012 2013 2014 2015 Dividend Payout Ratio – Net Income Dividend Payout Ratio – Operating Income * 2011 payout ratios (159% net income basis, 211% operating income basis) not fully shown on graph due to record-high catastrophe losses Dividend as a Percentage of Net Cash Flow From Operations 100% 90% 80% 70% 60% 50% 40% 30% 20% 10% 0% 2002 2003 2004 2005 2006 2007 2008 2009 2010 2011 2012 2013 2014 2015 Copyright © 2016 Cincinnati Financial Corporation. All rights reserved. Do not reproduce or post online, in whole or in part, without written permission. 9
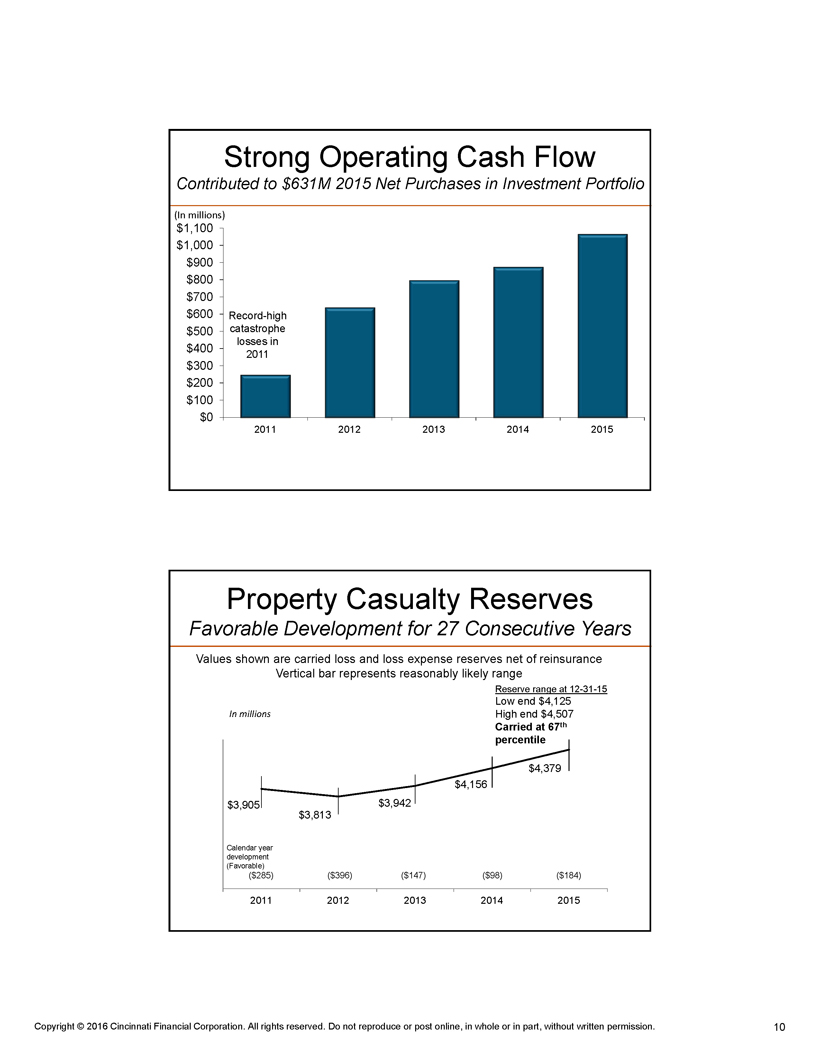
Strong Operating Cash Flow Contributed to $631M 2015 Net Purchases in Investment Portfolio (In millions) $1,100 $1,000 $900 $800 $700 $600 Record-high $500 catastrophe losses in $400 2011 $300 $200 $100 $0 2011 2012 2013 2014 2015 Property Casualty Reserves Favorable Development for 27 Consecutive Years Values shown are carried loss and loss expense reserves net of reinsurance Vertical bar represents reasonably likely range Reserve range at 12-31-15 In millions Low end $4,125 High end $4,507 Carried at 67th percentile $4,379 $4,156 $3,905 $3,942 $3,813 Calendar year development (Favorable) ($285) ($396) ($147) ($98) ($184) 2011 2012 2013 2014 2015 Copyright © 2016 Cincinnati Financial Corporation. All rights reserved. Do not reproduce or post online, in whole or in part, without written permission. 10
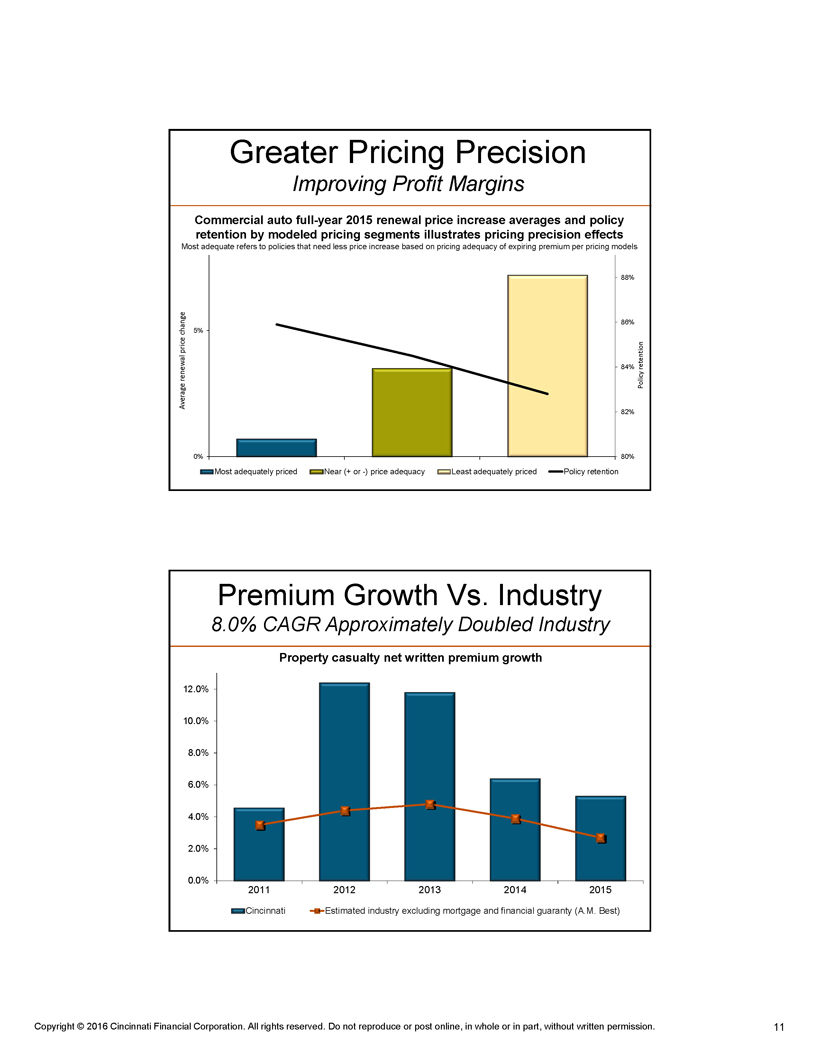
Greater Pricing Precision Improving Profit Margins Commercial auto full-year 2015 renewal price increase averages and policy retention by modeled pricing segments illustrates pricing precision effects Most adequate refers to policies that need less price increase based on pricing adequacy of expiring premium per pricing models 88% 86% 5% 84% Policy retention Average renewal price change 82% 0% 80% Most adequately priced Near (+ or -) price adequacy Least adequately priced Policy retention Premium Growth Vs. Industry 8.0% CAGR Approximately Doubled Industry Property casualty net written premium growth 12.0% 10.0% 8.0% 6.0% 4.0% 2.0% 0.0% 2011 2012 2013 2014 2015 Cincinnati Estimated industry excluding mortgage and financial guaranty (A.M. Best) Copyright © 2016 Cincinnati Financial Corporation. All rights reserved. Do not reproduce or post online, in whole or in part, without written permission. 11
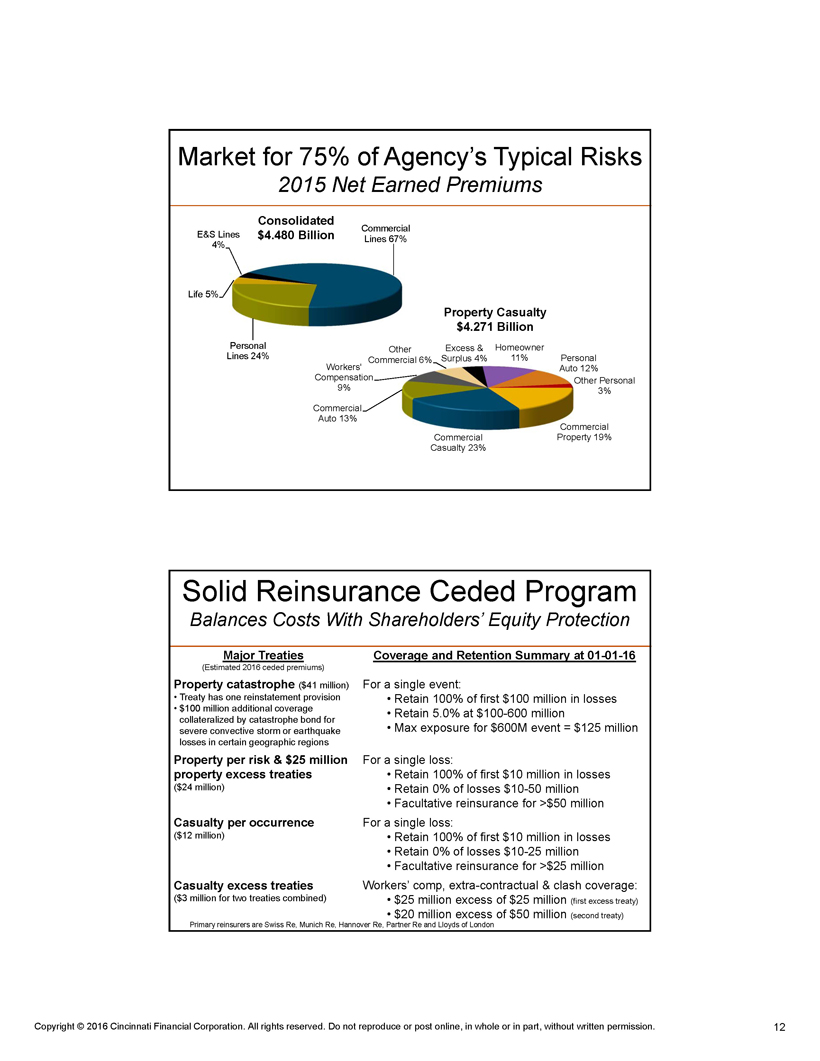
Market for 75% of Agency’s Typical Risks 2015 Net Earned Premiums Consolidated $4.480 Billion Commercial Lines 67% E&S Lines 4% Life 5% Property Casualty $4.271 Billion Personal Lines 24% Other Commercial 6% Excess & Surplus 4% Homeowner 11% Personal Auto 12% Workers' Compensation 9% Other Personal 3% Commercial Auto 13% Commercial Property 19% Commercial Casualty 23% Solid Reinsurance Ceded Program Balances Costs With Shareholders’ Equity Protection Major Treaties Coverage and Retention Summary at 01-01-16 (Estimated 2016 ceded premiums) Property catastrophe ($41 million) For a single event: • Treaty has one reinstatement provision • Retain 100% of first $100 million in losses • $100 million additional coverage collateralized by catastrophe bond for severe convective storm or earthquake losses in certain geographic regions • Retain 5.0% at $100-600 million • Max exposure for $600M event = $125 million Property per risk & $25 million property excess treaties ($24 million) For a single loss: • Retain 100% of first $10 million in losses • Retain 0% of losses $10-50 million • Facultative reinsurance for >$50 million Casualty per occurrence ($12 million) For a single loss: • Retain 100% of first $10 million in losses • Retain 0% of losses $10-25 million • Facultative reinsurance for >$25 million Casualty excess treaties ($3 million for two treaties combined) Workers’ comp, extra-contractual & clash coverage: • $25 million excess of $25 million (first excess treaty) • $20 million excess of $50 million (second treaty) Primary reinsurers are Swiss Re, Munich Re, Hannover Re, Partner Re and Lloyds of London Copyright © 2016 Cincinnati Financial Corporation. All rights reserved. Do not reproduce or post online, in whole or in part, without written permission. 12

Investment Income 4% Growth in 2015: Dividends up 9%, Interest up 3% (pretax) Pretax bond yield: 5.31% 5.15% 4.90% 4.76% 4.70% $575 $550 $525 $ 400 $425 $450 $475 $500 2011 2012 2013 2014 2015 (Bonds at amortized cost) Pretax book yield for bonds acquired in 2015: 4.00% Pretax book yield as of 12-31-15 for bonds maturing in 2016=4.37%, 2017=4.77%, 2018=5.78% Portion of bond portfolio maturing: 4.8% in 2016, 6.0% in 2017, 9.4% in 2018, 18.2% in 2019-20 Investment Portfolio Invest for Income and Appreciation $14.4 billion fair value at December 31, 2015 Taxable Fixed Maturities $6.353 Tax-Exempt Fixed Maturities $3.297 Common Equities $4.485 Preferred Equities $0.221 Investment leverage: 224% at December 31, 2015 Bond portfolio fair value exceeds insurance reserves liability by 32% (in billions) Copyright © 2016 Cincinnati Financial Corporation. All rights reserved. Do not reproduce or post online, in whole or in part, without written permission. 13

Diversified Equity Portfolio* Balances Income Stability & Capital Appreciation Potential December 31, 2015 Sector CFC S&P 500 Weightings Information technology 18.4% 20.7% Financial 15.4 16.5 Industrials 14.0 10.0 Healthcare 12.2 15.1 Consumer staples 11.0 10.1 Consumer discretionary 10.6 12.9 Energy 7.7 6.5 Materials 4.9 2.8 Utilities 3.8 3.0 Telecomm services 2.0 2.4 Portfolio Highlights at 12-31-15 • JP Morgan Chase - largest holding • 3.3% of publicly traded common stock portfolio • 1.0% of total investment portfolio • 9% increase in 2015 dividend income • 50 of 50 companies in core portfolio increased their annual regular dividend (over the past 12 months) • Unrealized gains totaled $1.8 billion (pretax) • Seven largest contributors represent 32%: ExxonMobil, Honeywell, P&G, BlackRock, Microsoft, Johnson and Johnson and JP Morgan Chase • Annual portfolio returns: (2015 & 2014) -3.6% & 12.3% (S&P 500: 1.4% & 13.7%) * Publicly traded common stock core portfolio, approximately 50 holdings (excludes energy MLP’s, one private equity) Bond Portfolio Risk Profile $9.650 Billion at December 31, 2015 Credit risk – A2/A average rating – 91.8% are rated investment grade, 4.1% are noninvestment grade, 4.1% are unrated – No European sovereign debt – Euro-based securities are 4% of bond portfolio (mostly corporate bonds) Interest rate risk – 4.7 years effective duration, 6.9 years weighted average maturity – Generally laddered maturity structure • 20% of year-end 2015 portfolio matures by the end of 2018, 38% by 2020, 76% by 2025 – With 31.2% of the investment portfolio invested in common stocks at 12-31-15, we estimated shareholders’ equity would decline 4.7% if interest rates were to rise by 100 basis points Bond portfolio is well-diversified – Largest issuer (corporate bond) = 0.6% of total bond portfolio – Municipal bond portfolio, well-diversified with more than 1,400 issues • $3.297 billion with an average rating of Aa2/AA by Moody’s and Standard & Poor’s Copyright © 2016 Cincinnati Financial Corporation. All rights reserved. Do not reproduce or post online, in whole or in part, without written permission. 14
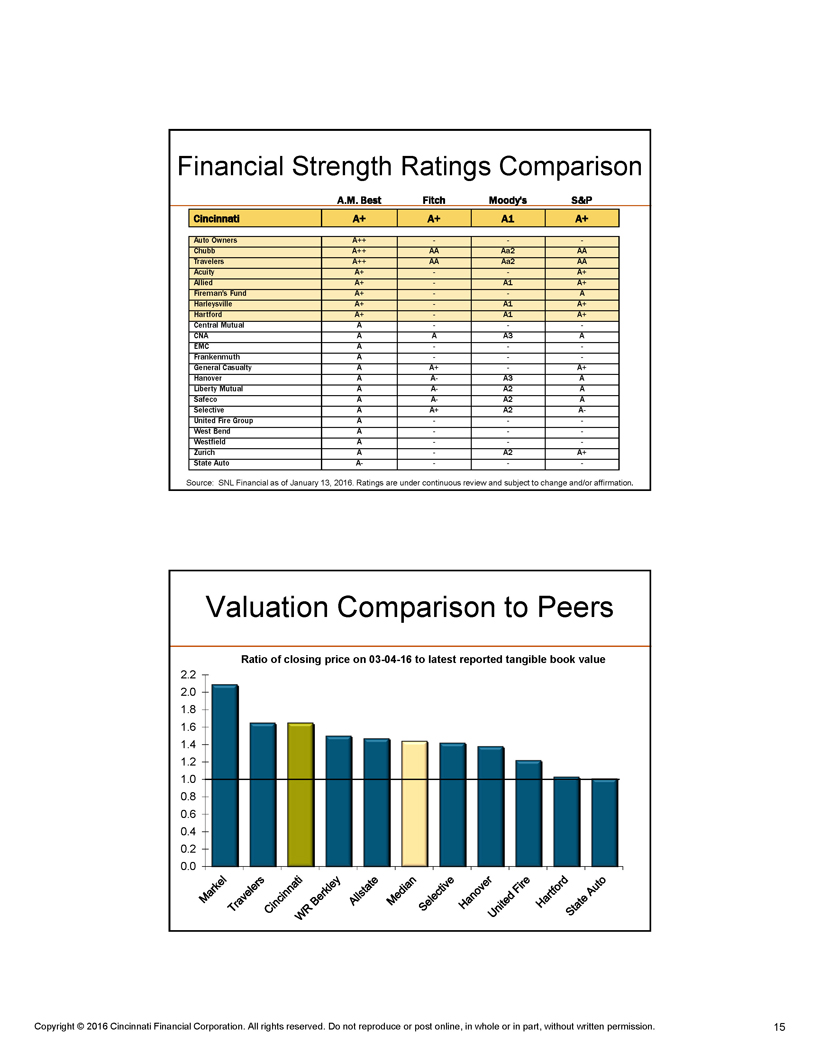
Financial Strength Ratings Comparison A.M. Best Fitch Moody's S&P Cincinnati A+ A+ A1 A+ Auto Owners A++ - - -Chubb A++ AA Aa2 AA Travelers A++ AA Aa2 AA Acuity A+ - - A+ Allied A+ - A1 A+ Fireman's Fund A+ - - A Harleysville A+ - A1 A+ Hartford A+ - A1 A+ Central Mutual A - - -CNA A A A3 A EMC A - - -Frankenmuth A - - -General Casualty A A+ - A+ Hanover A A- A3 A Liberty Mutual A A- A2 A Safeco A A- A2 A Selective A A+ A2 A-United Fire Group A - - -West Bend A - - -Westfield A - - -Zurich A - A2 A+ State Auto A- - - - Source: SNL Financial as of January 13, 2016. Ratings are under continuous review and subject to change and/or affirmation. Valuation Comparison to Peers Ratio of closing price on 03-04-16 to latest reported tangible book value 2.2 2.0 1.8 1.6 1.4 1.2 1.0 0.8 0.6 0.4 0.2 0.0 Markel Travelers Cincinnati WR Berkley Allstate Median Selective Hanover United Fire Hartford State Auto Copyright © 2016 Cincinnati Financial Corporation. All rights reserved. Do not reproduce or post online, in whole or in part, without written permission. 15
Exhibit 99.2
Michael J. Sewell, CPA Chief Financial Officer, Senior Vice President and Treasurer RBC Capital Markets Financial Services Conference March 9, 2016 Nasdaq: CINF • This presentation contains forward-looking statements that involve risks and uncertainties. Please refer to our various filings with the U.S. Securities and Exchange Commission for factors that could cause results to materially differ from those discussed. • The forward-looking information in this presentation has been publicly disclosed, most recently on February 26, 2016, and should be considered to be effective only as of that date. Its inclusion in this document is not intended to be an update or reaffirmation of the forward-looking information as of any later date. • Reconciliations of non-GAAP measures are in our most recent quarterly earnings news release, which is available on the Investors page of our website cinfin.com. Copyright © 2016 Cincinnati Financial Corporation. All rights reserved. Do not reproduce or post online, in whole or in part, without written permission. 1

Strategy Overview • Competitive advantages: • Relationships leading to agents’ best accounts • Financial strength for stability and confidence • Local decision making and claims excellence • Other distinguishing factors: • 55 years of shareholder dividend increases • Common stocks for nearly one-third of investments • 27 years of favorable reserve development Performance Targets & Trends • 3.4% value creation ratio for full-year 2015 below target: 10% to 13% annual average for 2013 through 2017 – 5.5% negative effect from bond and stock portfolio valuation in 2015 – 10.1% five-year VCR average as of 12-31-15 • Operating performance drivers were on track for 2015: – 5% premium growth, exceeding estimated industry average – 91.1% combined ratio, better than 95% to 100% long-term target – 10 consecutive quarters of investment income growth • Ranked #1 or #2 in ~75% of agencies appointed 5+ years • Improving through strategic profit and growth initiatives Copyright © 2016 Cincinnati Financial Corporation. All rights reserved. Do not reproduce or post online, in whole or in part, without written permission. 2

8.0% Five-Year CAGR Property Casualty Net Written Premiums for 2011-2015 Steadily Increase Share of Agency Business Market share per agency reporting location by year appointed 16.5% 8.4% 5.2% 0.8% 1 year or less 2-5 years 6-10 years 10 years or more Based on 2014 standard market P&C agency written premiums (Excludes excess and surplus lines) Invest for Income and Capital Appreciation Portfolio mix as of 09-30-15 Investment income growth 2.8% Common Stocks 33% Bonds 67% Common Stocks 17% Bonds 83% -1.5% Industry* Cincinnati Cincinnati Actual 2015 Industry** Projected 2016 *Industry portfolio mix = U.S. Property Casualty excluding Cincinnati and Berkshire Hathaway (Source: SNL, statutory accounting basis) **Industry = U.S. Property Casualty estimated by A.M. Best at 02-18-16; Cincinnati growth shown only for property casualty segments Copyright © 2016 Cincinnati Financial Corporation. All rights reserved. Do not reproduce or post online, in whole or in part, without written permission. 3
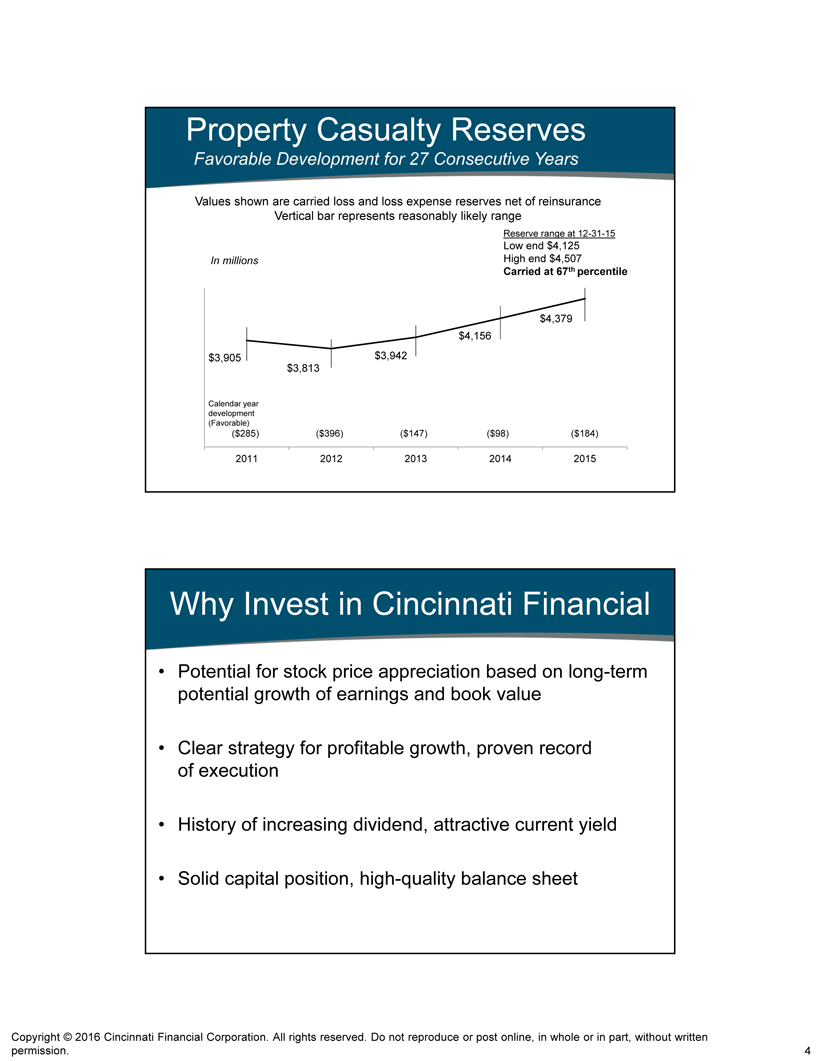
Property Casualty Reserves Favorable Development for 27 Consecutive Years Values shown are carried loss and loss expense reserves net of reinsurance Vertical bar represents reasonably likely range Reserve range at 12-31-15 Low end $4,125 In millions High end $4,507 Carried at 67th percentile $4,379 $4,156 $3,905 $3,942 $3,813 Calendar year development (Favorable) ($285) ($396) ($147) ($98) ($184) 2011 2012 2013 2014 2015 Why Invest in Cincinnati Financial • Potential for stock price appreciation based on long-term potential growth of earnings and book value • Clear strategy for profitable growth, proven record of execution • History of increasing dividend, attractive current yield • Solid capital position, high-quality balance sheet Copyright © 2016 Cincinnati Financial Corporation. All rights reserved. Do not reproduce or post online, in whole or in part, without written permission. 4
Serious News for Serious Traders! Try StreetInsider.com Premium Free!
You May Also Be Interested In
- Cincinnati Financial (CINF) Tops Q1 EPS by 8c
- Victory Sells Tahlo Lake Property in British Columbia
- ROSEN, A LEADING NATIONAL FIRM, Encourages Sharecare, Inc. Investors to Secure Counsel Before Important Deadline in Securities Class Action First Filed by the Firm – SHCR
Create E-mail Alert Related Categories
SEC FilingsSign up for StreetInsider Free!
Receive full access to all new and archived articles, unlimited portfolio tracking, e-mail alerts, custom newswires and RSS feeds - and more!
