

Form 8-K CATERPILLAR INC For: Oct 22
 Tweet
Tweet Share
Share
UNITED STATES
SECURITIES AND EXCHANGE COMMISSION
Washington, D.C. 20549
![]()
FORM 8-K
Current Report
Pursuant to Section 13 or 15(d) of the Securities Exchange Act of 1934
Date of Report (Date of earliest event reported): October 22, 2015
CATERPILLAR INC.
(Exact name of registrant as specified in its charter)
Delaware
(State or other jurisdiction of incorporation)
|
1-768 |
|
37-0602744 |
|
100 NE Adams Street, Peoria, Illinois |
|
61629 |
Registrant’s telephone number, including area code: (309) 675-1000
Former name or former address, if changed since last report: N/A
Check the appropriate box below if the Form 8-K filing is intended to simultaneously satisfy the filing obligation of the registrant under any of the following provisions:
o Written communications pursuant to Rule 425 under the Securities Act (17 CFR 230.425)
o Soliciting material pursuant to Rule 14a-12 under the Exchange Act (17 CFR 240.14a-12)
o Pre-commencement communications pursuant to Rule 14d-2(b) under the Exchange Act (17 CFR 240.14d-2(b))
o Pre-commencement communications pursuant to Rule 13e-4(c) under the Exchange Act (17 CFR 240.13e-4(c)
* * * * * * * * * * * * * * * * * * * * * * * * * * * * * * * * * * * * * * * * * * * * *
Item 2.02. Results of Operations and Financial Condition.
On October 22, 2015, Caterpillar Inc. (the “Company”) issued a press release regarding its results of operations and financial condition for the quarter ended September 30, 2015, and posted on its website a supplemental presentation, which contains certain additional historical and forward-looking information relating to the Company.
On October 22, 2015, the Company intends to host a live conference call to discuss the press release, the supplemental presentation, and other matters relating to the Company.
The press release is included as Exhibit 99.1 to this report and the supplemental presentation is included as Exhibit 99.2. The exhibits to this Current Report on Form 8-K are incorporated into this Item 2.02 by reference.
The information in this Current Report on Form 8-K, including Exhibits 99.1 and 99.2, is being furnished in accordance with the provisions of General Instruction B.2 of Form 8-K.
|
Item 9.01. |
Financial Statements and Exhibits. | ||
|
|
| ||
|
|
(d) |
Exhibits: | |
|
|
|
| |
|
|
|
The following are furnished as exhibits to this report: | |
|
|
|
| |
|
|
|
99.1 |
Caterpillar Inc. press release dated October 22, 2015 |
|
|
|
|
|
|
|
|
99.2 |
Caterpillar third quarter 2015 slide presentation |
* * * * * * * * * * * * * * * * * * * * * * * * * * * * * * * * * * * * * * * * * * * * *
SIGNATURES
Pursuant to the requirements of the Securities Exchange Act of 1934, the registrant has duly caused this report to be signed on its behalf by the undersigned hereunto duly authorized.
|
|
CATERPILLAR INC. | |
|
|
|
|
|
|
|
|
|
October 22, 2015 |
By: |
/s/James B. Buda |
|
|
|
James B. Buda |
|
|
|
Executive Vice President, Law and Public Policy |
EXHIBIT INDEX
|
Exhibit No. |
|
Description |
|
|
|
|
|
99.1 |
|
Caterpillar Inc. press release dated October 22, 2015 |
|
|
|
|
|
99.2 |
|
Caterpillar third quarter 2015 slide presentation |
Exhibit 99.1
Caterpillar Inc.
3Q 2015 Earnings Release
October 22, 2015
FOR IMMEDIATE RELEASE
Caterpillar Reports Third-Quarter 2015 Results
· Third-quarter profit per share was $0.62, or $0.75 excluding restructuring costs.
· Sales and revenues were $11.0 billion.
· 2015 Outlook — Expect sales and revenues of about $48 billion and profit per share of about $3.70, or $4.60 excluding restructuring costs.
· 2016 sales and revenues are expected to be about 5 percent lower than 2015.
· Restructuring costs for 2015 are now expected to be about $800 million as a result of significant restructuring actions announced on September 24.
· Company repurchased $1.5 billion of common stock in the third quarter.
PEORIA, Ill. — Caterpillar Inc. (NYSE: CAT) today announced profit per share of $0.62 for the third quarter of 2015, a decrease from $1.63 per share in the third quarter of 2014. Excluding restructuring costs, profit per share was $0.75, down from $1.72 per share in the third quarter of 2014. Third-quarter 2015 sales and revenues were $11.0 billion, down from $13.5 billion in the third quarter of 2014.
“The environment remains extremely challenging for most of the key industries we serve, with sales and revenues down 19 percent from the third quarter last year. Improving how we operate is our focus amidst the continued weakness in mining and oil and gas. We’re tackling costs, and our year-to-date decremental profit pull through has been better than our target. We’re also focusing on our global market position, and it continues to improve even in challenging end markets. Our product quality is in great shape, and our safety record is among the best of any industrial company today,” said Caterpillar Chairman and Chief Executive Officer Doug Oberhelman.
“Our strong balance sheet is important in these difficult times. Our ME&T debt-to-capital ratio is near the middle of our target range at 37.4 percent; we have about $6 billion of cash, and our captive finance company is healthy and strong. We’ve repurchased close to $2 billion of stock in 2015 and more than $8 billion over the past three years. In addition, the dividend, which is a priority for our use of cash, has increased 83 percent since 2009,” added Oberhelman.
The additional restructuring actions announced recently are substantial, but necessary to manage through this downturn and keep the company strong for the long term. The actions are expected to lower operating costs by about $1.5 billion annually once fully implemented, with about $750 million of that expected in 2016.
(more)
2015 Outlook
The 2015 outlook for sales and revenues is about $48 billion, and that is unchanged from the outlook that was included with the September 24 announcement of new restructuring actions.
The outlook for profit per share is about $3.70, or $4.60 excluding restructuring costs. The expectation for 2015 restructuring costs has increased significantly, from about $250 million to about $800 million, and is a result of the additional restructuring actions.
The previous outlook for profit per share was provided in late July along with second-quarter 2015 financial results. At that time, the outlook for profit per share was $4.70, or $5.00 excluding restructuring costs and was based on sales and revenues of about $49 billion.
Preliminary 2016 Sales and Revenues Outlook
Sales and revenues for 2016 are expected to be about 5 percent below 2015. We expect Construction Industries’ sales to be flat to down 5 percent with some improvement in developed countries offset by declining sales in developing countries. Energy & Transportation’s sales are expected to be down 5 to 10 percent as a result of continuing weakness in oil and gas coupled with a weaker order backlog than in 2015. Mining is expected to be down again, resulting in a decline in Resource Industries’ sales of about 10 percent.
The preliminary outlook reflects weak economic growth in the United States and Europe with U.S. construction activity impacted by low infrastructure investment and continued headwinds from oil and gas. It also reflects a slowing China, Brazil in recession and continuing weakness in commodity prices.
“Managing through cyclicality has been critical to Caterpillar’s success for the past 90 years; it’s nothing new for us or our customers. When world growth improves, the key industries we serve — construction, mining, energy and rail — will be needed to support that growth. We’re confident in the long-term success of the industries we’re in, and together with our customers, we’ll weather today’s challenging market conditions,” Oberhelman said.
“We can’t control the business cycle, but we continue to drive improvements in our business. We’re implementing Lean to drive improvements through our businesses and executing our Across the Table initiative with dealers to improve our market position, service performance and value to customers. We’re also investing in emerging technologies and data analytics tools to continue our role as an innovation leader for our customers. As we look ahead to what will likely be our fourth consecutive down year for sales, which has never happened in our 90-year history, we are restructuring to lower our cost structure. It’s painful and will affect thousands of people, but is essential for the long-term health of the company and should position us for better results when conditions improve,” added Oberhelman.
Notes:
· Glossary of terms is included on pages 17-18; first occurrence of terms shown in bold italics.
· Information on non-GAAP financial measures is included on page 19.
About Caterpillar:
For 90 years, Caterpillar Inc. has been making sustainable progress possible and driving positive change on every continent. Customers turn to Caterpillar to help them develop infrastructure, energy and natural resource assets. With 2014 sales and revenues of $55.184 billion, Caterpillar is the world’s leading manufacturer of construction and mining equipment, diesel and natural gas engines, industrial gas turbines and diesel-electric locomotives. The company principally operates through its three product segments - Construction Industries, Resource Industries and Energy & Transportation - and also provides financing and related services through its Financial Products segment. For more information, visit caterpillar.com. To connect with us on social media, visit caterpillar.com/social-media.
Caterpillar contact: Rachel Potts, 309-675-6892 (Office), 309-573-3444 (Mobile) or [email protected]
Forward-Looking Statements
Certain statements in this Release relate to future events and expectations and are forward-looking statements within the meaning of the Private Securities Litigation Reform Act of 1995. Words such as “believe,” “estimate,” “will be,” “will,” “would,” “expect,” “anticipate,” “plan,” “project,” “intend,” “could,” “should” or other similar words or expressions often identify forward-looking statements. All statements other than statements of historical fact are forward-looking statements, including, without limitation, statements regarding our outlook, projections, forecasts or trend descriptions. These statements do not guarantee future performance, and we do not undertake to update our forward-looking statements.
Caterpillar’s actual results may differ materially from those described or implied in our forward-looking statements based on a number of factors, including, but not limited to: (i) global and regional economic conditions and economic conditions in the industries we serve; (ii) government monetary or fiscal policies and infrastructure spending; (iii) commodity price changes, component price increases, fluctuations in demand for our products or significant shortages of component products; (iv) disruptions or volatility in global financial markets limiting our sources of liquidity or the liquidity of our customers, dealers and suppliers; (v) political and economic risks, commercial instability and events beyond our control in the countries in which we operate; (vi) failure to maintain our credit ratings and potential resulting increases to our cost of borrowing and adverse effects on our cost of funds, liquidity, competitive position and access to capital markets; (vii) our Financial Products segment’s risks associated with the financial services industry; (viii) changes in interest rates or market liquidity conditions; (ix) an increase in delinquencies, repossessions or net losses of Cat Financial’s customers; (x) new regulations or changes in financial services regulations; (xi) a failure to realize, or a delay in realizing, all of the anticipated benefits of our acquisitions, joint ventures or divestitures; (xii) international trade policies and their impact on demand for our products and our competitive position; (xiii) our ability to develop, produce and market quality products that meet our customers’ needs; (xiv) the impact of the highly competitive environment in which we operate on our sales and pricing; (xv) failure to realize all of the anticipated benefits from initiatives to increase our productivity, efficiency and cash flow and to reduce costs; (xvi) additional restructuring costs or a failure to realize anticipated savings or benefits from past or future cost reduction actions; (xvii) inventory management decisions and sourcing practices of our dealers and our OEM customers; (xviii) compliance with environmental laws and regulations; (xix) alleged or actual violations of trade or anti-corruption laws and regulations; (xx) additional tax expense or exposure; (xxi) currency fluctuations; (xxii) our or Cat Financial’s compliance with financial covenants; (xxiii) increased pension plan funding obligations; (xxiv) union disputes or other employee relations issues; (xxv) significant legal proceedings, claims, lawsuits or government investigations; (xxvi) changes in accounting standards; (xxvii) failure or breach of IT security; (xxviii) adverse effects of unexpected events including natural disasters; and (xxix) other factors described in more detail under “Item 1A. Risk Factors” in our Form 10-K filed with the SEC on February 17, 2015 for the year ended December 31, 2014.
Key Points
Third Quarter 2015
(Dollars in millions except per share data)
|
|
|
Third Quarter |
|
Third Quarter |
|
$ Change |
|
% Change |
| |||
|
Machinery, Energy & Transportation Sales |
|
$ |
10,285 |
|
$ |
12,758 |
|
$ |
(2,473 |
) |
(19 |
)% |
|
Financial Products Revenues |
|
677 |
|
791 |
|
(114 |
) |
(14 |
)% | |||
|
Total Sales and Revenues |
|
$ |
10,962 |
|
$ |
13,549 |
|
$ |
(2,587 |
) |
(19 |
)% |
|
|
|
|
|
|
|
|
|
|
| |||
|
Profit |
|
$ |
368 |
|
$ |
1,017 |
|
$ |
(649 |
) |
(64 |
)% |
|
Profit per common share - diluted |
|
$ |
0.62 |
|
$ |
1.63 |
|
$ |
(1.01 |
) |
(62 |
)% |
|
|
|
|
|
|
|
|
|
|
| |||
|
Profit per common share - diluted |
|
$ |
0.75 |
|
$ |
1.72 |
|
$ |
(0.97 |
) |
(56 |
)% |
Third-Quarter 2015 Highlights
· Third-quarter sales and revenues were $10.962 billion, down 19 percent from the third quarter of 2014.
· Restructuring costs were $101 million in the third quarter of 2015, with an after-tax impact of $0.13 per share.
· Profit per share was $0.62 in the third quarter of 2015, or $0.75 per share excluding restructuring costs. Profit in the third quarter of 2014 was $1.63 per share, or $1.72 per share excluding restructuring costs.
· ME&T operating cash flow was $766 million in the third quarter of 2015, compared with $1.442 billion in the third quarter of 2014.
· ME&T debt-to-capital ratio was 37.4 percent, the same as the end of 2014.
· The company repurchased $1.5 billion of Caterpillar common stock during the third quarter of 2015.
2015 Outlook
· The company expects 2015 sales and revenues to be about $48 billion, unchanged from the September 24 announcement.
· With sales and revenues at $48 billion, the revised profit outlook is about $3.70 per share, or $4.60 per share excluding restructuring costs.
· The company expects restructuring costs of about $800 million in 2015, an increase from the previous estimate of about $250 million.
· We expect ME&T capital expenditures in 2015 to be about the same as 2014 capital expenditures of $1.6 billion.
Preliminary 2016 Sales and Revenues Outlook
· The company expects 2016 sales and revenues to be down about 5 percent from the 2015 outlook.
CONSOLIDATED RESULTS
Consolidated Sales and Revenues

The chart above graphically illustrates reasons for the change in Consolidated Sales and Revenues between the third quarter of 2014 (at left) and the third quarter of 2015 (at right). Items favorably impacting sales and revenues appear as upward stair steps with the corresponding dollar amounts above each bar, while items negatively impacting sales and revenues appear as downward stair steps with dollar amounts reflected in parentheses above each bar. Caterpillar management utilizes these charts internally to visually communicate with the company’s Board of Directors and employees.
Sales and Revenues
Total sales and revenues were $10.962 billion in the third quarter of 2015, compared with $13.549 billion in the third quarter of 2014, a decline of $2.587 billion, or 19 percent. The decrease was primarily due to lower sales volume and the unfavorable impact of currency due to continued strengthening of the U.S. dollar against most currencies, with the largest impact from the euro. While sales for both new equipment and aftermarket parts declined in all segments, most of the decrease was for new equipment.
Sales declined in all regions. In North America, sales decreased 17 percent, primarily due to lower end-user demand across all the Energy & Transportation applications and for construction equipment. Asia/Pacific sales declined 25 percent, primarily due to lower end-user demand for mining equipment, products used in oil and gas applications and construction equipment. In addition, the impact of currency was unfavorable as sales, mostly in Australian dollars and Japanese yen, translated into fewer U.S. dollars. Sales decreased 31 percent in Latin America, primarily due to widespread economic weakness across the region, which had a negative impact on demand for construction equipment and spending. The most significant decrease was in Brazil. In EAME, sales declined 13 percent, mostly due to the unfavorable impact of currency, as sales in euros translated into fewer U.S. dollars, and lower end-user demand for products used in mining equipment and power generation applications.
Sales decreased in all segments. Energy & Transportation’s sales declined 25 percent as sales decreased across all of the applications and the impact of currency was unfavorable. Construction Industries’ sales decreased 15 percent, primarily due to lower end-user demand and the unfavorable impact of currency. Resource Industries’ sales declined 17 percent, mostly due to lower end-user demand. Financial Products’ segment revenues were down 12 percent, primarily due to lower average earning assets and lower average financing rates.
Consolidated Operating Profit
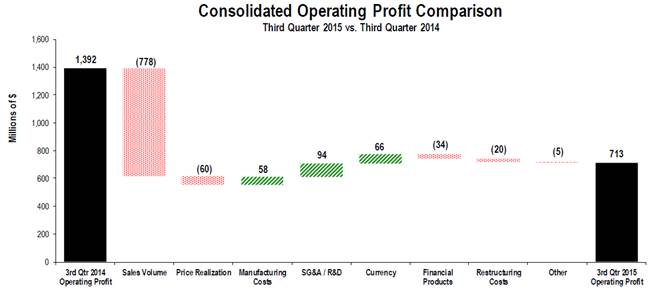
The chart above graphically illustrates reasons for the change in Consolidated Operating Profit between the third quarter of 2014 (at left) and the third quarter of 2015 (at right). Items favorably impacting operating profit appear as upward stair steps with the corresponding dollar amounts above each bar, while items negatively impacting operating profit appear as downward stair steps with dollar amounts reflected in parentheses above each bar. Caterpillar management utilizes these charts internally to visually communicate with the company’s Board of Directors and employees. The bar entitled Other includes consolidating adjustments and Machinery, Energy & Transportation other operating (income) expenses.
Operating profit for the third quarter of 2015 was $713 million, a decline of $679 million from the third quarter of 2014. The decrease in profit was primarily due to lower sales volume reflecting weak market conditions in most of the industries we serve.
The unfavorable price realization resulted from competitive market conditions and an unfavorable geographic mix of sales.
Although the stronger U.S. dollar had a negative impact to our sales, our sizable manufacturing presence outside of the United States resulted in a favorable impact to operating profit. The majority of the favorability for the quarter was due to the Japanese yen, as we are a net exporter from Japan.
Manufacturing costs were favorable due to lower incentive compensation expense and improved material costs, partially offset by the unfavorable impact of cost absorption and manufacturing inefficiencies driven by declining production volume. The unfavorable cost absorption resulted from a significant decrease in inventory in the third quarter of 2015, compared to an increase in the third quarter of 2014.
SG&A and R&D expenses were favorable due to lower incentive compensation expense, partially offset by new product introduction programs.
Restructuring costs of $101 million in the third quarter of 2015 were related to the Resource Industries’ segment and other restructuring programs across the company. In the third quarter of 2014, restructuring costs were $81 million.
Other Profit/Loss Items
· Other income/expense in the third quarter of 2015 was expense of $68 million, compared with income of $117 million in the third quarter of 2014. The unfavorable change of $185 million was primarily due to the net impact from currency translation and hedging gains and losses. The third quarter of 2015 included net losses related to currency translation and hedging, compared to net gains in the third quarter of 2014. Net losses in the third quarter of 2015 were primarily due to the Brazilian real and the Chinese yuan. Net gains in the third quarter of 2014 were primarily due to the euro.
· The provision for income taxes for the third quarter of 2015 reflects an estimated annual tax rate of 27 percent, compared with 29.5 percent for the third quarter of 2014 excluding the items discussed below. The decrease is mostly due to a more favorable expected geographic mix of profits from a tax perspective in 2015, including the impact of restructuring costs primarily at higher U.S. tax rates.
The provision for income taxes for the third quarter of 2015 also includes a $42 million net charge for prior year tax adjustments. This net charge was offset by a benefit of $38 million related to the decrease from the second-quarter estimated annual tax rate of 28.5 percent, primarily due to a more favorable expected geographic mix of profits from a tax perspective, including the impact of restructuring costs primarily at higher U.S. tax rates.
The provision for income taxes for the third quarter of 2014 included a benefit of $43 million to adjust the prior year’s U.S. taxes.
Global Workforce
Caterpillar worldwide, full-time employment was 108,922 at the end of the third quarter of 2015 compared with 114,352 at the end of the third quarter of 2014, a decrease of 5,430 full-time employees. The flexible workforce decreased by 2,658 for a total decrease in the global workforce of 8,088. The decrease was primarily the result of restructuring programs and lower production volumes.
|
|
|
September 30 |
| ||||
|
|
|
2015 |
|
2014 |
|
Increase / |
|
|
Full-time employment |
|
108,922 |
|
114,352 |
|
(5,430 |
) |
|
Flexible workforce |
|
13,957 |
|
16,615 |
|
(2,658 |
) |
|
Total |
|
122,879 |
|
130,967 |
|
(8,088 |
) |
|
|
|
|
|
|
|
|
|
|
Summary of change |
|
|
|
|
|
|
|
|
U.S. workforce |
|
|
|
|
|
(3,315 |
) |
|
Non-U.S. workforce |
|
|
|
|
|
(4,773 |
) |
|
Total |
|
|
|
|
|
(8,088 |
) |
SEGMENT RESULTS
Sales and Revenues by Geographic Region
|
|
|
|
|
% |
|
North |
|
% |
|
Latin |
|
% |
|
|
|
% |
|
Asia/ |
|
% |
| |||||
|
(Millions of dollars) |
|
Total |
|
Change |
|
America |
|
Change |
|
America |
|
Change |
|
EAME |
|
Change |
|
Pacific |
|
Change |
| |||||
|
Third Quarter 2015 |
|
|
|
|
|
|
|
|
|
|
|
|
|
|
|
|
|
|
|
|
| |||||
|
Construction Industries¹ |
|
$ |
3,792 |
|
(15 |
)% |
$ |
1,820 |
|
(5 |
)% |
$ |
340 |
|
(43 |
)% |
$ |
930 |
|
(7 |
)% |
$ |
702 |
|
(27 |
)% |
|
Resource Industries² |
|
1,796 |
|
(17 |
)% |
672 |
|
(11 |
)% |
311 |
|
(16 |
)% |
418 |
|
(16 |
)% |
395 |
|
(29 |
)% | |||||
|
Energy & Transportation³ |
|
4,213 |
|
(25 |
)% |
1,755 |
|
(31 |
)% |
368 |
|
(23 |
)% |
1,300 |
|
(18 |
)% |
790 |
|
(19 |
)% | |||||
|
All Other Segments4 |
|
506 |
|
(13 |
)% |
365 |
|
(3 |
)% |
26 |
|
(59 |
)% |
76 |
|
(7 |
)% |
39 |
|
(36 |
)% | |||||
|
Corporate Items and Eliminations |
|
(22 |
) |
|
|
(24 |
) |
|
|
1 |
|
|
|
— |
|
|
|
1 |
|
|
| |||||
|
Machinery, Energy & Transportation |
|
$ |
10,285 |
|
(19 |
)% |
$ |
4,588 |
|
(17 |
)% |
$ |
1,046 |
|
(31 |
)% |
$ |
2,724 |
|
(13 |
)% |
$ |
1,927 |
|
(25 |
)% |
|
|
|
|
|
|
|
|
|
|
|
|
|
|
|
|
|
|
|
|
|
|
| |||||
|
Financial Products Segment |
|
$ |
752 |
|
(12 |
)% |
$ |
453 |
|
2 |
% |
$ |
91 |
|
(30 |
)% |
$ |
101 |
|
(20 |
)% |
$ |
107 |
|
(28 |
)% |
|
Corporate Items and Eliminations |
|
(75 |
) |
|
|
(52 |
) |
|
|
(9 |
) |
|
|
(6 |
) |
|
|
(8 |
) |
|
| |||||
|
Financial Products Revenues |
|
$ |
677 |
|
(14 |
)% |
$ |
401 |
|
(4 |
)% |
$ |
82 |
|
(29 |
)% |
$ |
95 |
|
(21 |
)% |
$ |
99 |
|
(27 |
)% |
|
Consolidated Sales and Revenues |
|
$ |
10,962 |
|
(19 |
)% |
$ |
4,989 |
|
(16 |
)% |
$ |
1,128 |
|
(31 |
)% |
$ |
2,819 |
|
(13 |
)% |
$ |
2,026 |
|
(25 |
)% |
|
|
|
|
|
|
|
|
|
|
|
|
|
|
|
|
|
|
|
|
|
|
| |||||
|
Third Quarter 2014 |
|
|
|
|
|
|
|
|
|
|
|
|
|
|
|
|
|
|
|
|
| |||||
|
Construction Industries¹ |
|
$ |
4,471 |
|
|
|
$ |
1,913 |
|
|
|
$ |
599 |
|
|
|
$ |
997 |
|
|
|
$ |
962 |
|
|
|
|
Resource Industries² |
|
2,172 |
|
|
|
752 |
|
|
|
369 |
|
|
|
495 |
|
|
|
556 |
|
|
| |||||
|
Energy & Transportation³ |
|
5,585 |
|
|
|
2,541 |
|
|
|
481 |
|
|
|
1,582 |
|
|
|
981 |
|
|
| |||||
|
All Other Segments4 |
|
583 |
|
|
|
376 |
|
|
|
64 |
|
|
|
82 |
|
|
|
61 |
|
|
| |||||
|
Corporate Items and Eliminations |
|
(53 |
) |
|
|
(27 |
) |
|
|
— |
|
|
|
(26 |
) |
|
|
— |
|
|
| |||||
|
Machinery, Energy & Transportation |
|
$ |
12,758 |
|
|
|
$ |
5,555 |
|
|
|
$ |
1,513 |
|
|
|
$ |
3,130 |
|
|
|
$ |
2,560 |
|
|
|
|
|
|
|
|
|
|
|
|
|
|
|
|
|
|
|
|
|
|
|
|
|
| |||||
|
Financial Products Segment |
|
$ |
851 |
|
|
|
$ |
446 |
|
|
|
$ |
130 |
|
|
|
$ |
127 |
|
|
|
$ |
148 |
|
|
|
|
Corporate Items and Eliminations |
|
(60 |
) |
|
|
(28 |
) |
|
|
(14 |
) |
|
|
(6 |
) |
|
|
(12 |
) |
|
| |||||
|
Financial Products Revenues |
|
$ |
791 |
|
|
|
$ |
418 |
|
|
|
$ |
116 |
|
|
|
$ |
121 |
|
|
|
$ |
136 |
|
|
|
|
Consolidated Sales and Revenues |
|
$ |
13,549 |
|
|
|
$ |
5,973 |
|
|
|
$ |
1,629 |
|
|
|
$ |
3,251 |
|
|
|
$ |
2,696 |
|
|
|
1 Does not include inter-segment sales of $34 million and $67 million in third quarter 2015 and 2014, respectively.
2 Does not include inter-segment sales of $93 million and $105 million in third quarter 2015 and 2014, respectively.
3 Does not include inter-segment sales of $417 million and $570 million in third quarter 2015 and 2014, respectively.
4 Does not include inter-segment sales of $780 million and $875 million in third quarter 2015 and 2014, respectively.
Sales and Revenues by Segment
|
|
|
Third |
|
Sales |
|
Price |
|
|
|
|
|
Third |
|
$ |
|
% |
| |||||||
|
(Millions of dollars) |
|
Quarter 2014 |
|
Volume |
|
Realization |
|
Currency |
|
Other |
|
Quarter 2015 |
|
Change |
|
Change |
| |||||||
|
Construction Industries |
|
$ |
4,471 |
|
$ |
(414 |
) |
$ |
(44 |
) |
$ |
(221 |
) |
$ |
— |
|
$ |
3,792 |
|
$ |
(679 |
) |
(15 |
)% |
|
Resource Industries |
|
2,172 |
|
(311 |
) |
(18 |
) |
(47 |
) |
— |
|
1,796 |
|
(376 |
) |
(17 |
)% | |||||||
|
Energy & Transportation |
|
5,585 |
|
(1,193 |
) |
4 |
|
(183 |
) |
— |
|
4,213 |
|
(1,372 |
) |
(25 |
)% | |||||||
|
All Other Segments |
|
583 |
|
(59 |
) |
(3 |
) |
(15 |
) |
— |
|
506 |
|
(77 |
) |
(13 |
)% | |||||||
|
Corporate Items and Eliminations |
|
(53 |
) |
30 |
|
1 |
|
— |
|
— |
|
(22 |
) |
31 |
|
|
| |||||||
|
Machinery, Energy & Transportation |
|
$ |
12,758 |
|
$ |
(1,947 |
) |
$ |
(60 |
) |
$ |
(466 |
) |
$ |
— |
|
$ |
10,285 |
|
$ |
(2,473 |
) |
(19 |
)% |
|
|
|
|
|
|
|
|
|
|
|
|
|
|
|
|
|
|
| |||||||
|
Financial Products Segment |
|
851 |
|
— |
|
— |
|
— |
|
(99 |
) |
752 |
|
(99 |
) |
(12 |
)% | |||||||
|
Corporate Items and Eliminations |
|
(60 |
) |
— |
|
— |
|
— |
|
(15 |
) |
(75 |
) |
(15 |
) |
|
| |||||||
|
Financial Products Revenues |
|
$ |
791 |
|
$ |
— |
|
$ |
— |
|
$ |
— |
|
$ |
(114 |
) |
$ |
677 |
|
$ |
(114 |
) |
(14 |
)% |
|
Consolidated Sales and Revenues |
|
$ |
13,549 |
|
$ |
(1,947 |
) |
$ |
(60 |
) |
$ |
(466 |
) |
$ |
(114 |
) |
$ |
10,962 |
|
$ |
(2,587 |
) |
(19 |
)% |
Operating Profit / (Loss) by Segment
|
|
|
Third |
|
Third |
|
$ |
|
% |
| |||
|
(Millions of dollars) |
|
Quarter 2015 |
|
Quarter 2014 |
|
Change |
|
Change |
| |||
|
Construction Industries |
|
$ |
378 |
|
$ |
483 |
|
$ |
(105 |
) |
(22 |
)% |
|
Resource Industries |
|
(68 |
) |
122 |
|
(190 |
) |
(156 |
)% | |||
|
Energy & Transportation |
|
635 |
|
1,151 |
|
(516 |
) |
(45 |
)% | |||
|
All Other Segments |
|
196 |
|
228 |
|
(32 |
) |
(14 |
)% | |||
|
Corporate Items and Eliminations |
|
(551 |
) |
(740 |
) |
189 |
|
|
| |||
|
Machinery, Energy & Transportation |
|
$ |
590 |
|
$ |
1,244 |
|
$ |
(654 |
) |
(53 |
)% |
|
Financial Products Segment |
|
207 |
|
220 |
|
(13 |
) |
(6 |
)% | |||
|
Corporate Items and Eliminations |
|
(22 |
) |
(1 |
) |
(21 |
) |
|
| |||
|
Financial Products |
|
$ |
185 |
|
$ |
219 |
|
$ |
(34 |
) |
(16 |
)% |
|
Consolidating Adjustments |
|
(62 |
) |
(71 |
) |
9 |
|
|
| |||
|
|
|
|
|
|
|
|
|
|
| |||
|
Consolidated Operating Profit / (Loss) |
|
$ |
713 |
|
$ |
1,392 |
|
$ |
(679 |
) |
(49 |
)% |
CONSTRUCTION INDUSTRIES
(Millions of dollars)
Sales Comparison
|
|
|
Third |
|
Sales |
|
Price |
|
Currency |
|
Third |
|
$ |
|
% |
| ||||||
|
|
|
|
|
|
|
|
|
|
|
|
|
|
|
|
| ||||||
|
Sales Comparison1 |
|
$ |
4,471 |
|
$ |
(414 |
) |
$ |
(44 |
) |
$ |
(221 |
) |
$ |
3,792 |
|
$ |
(679 |
) |
(15 |
)% |
Sales by Geographic Region
|
|
|
Third |
|
Third |
|
$ |
|
% |
| |||
|
North America |
|
$ |
1,820 |
|
$ |
1,913 |
|
$ |
(93 |
) |
(5 |
)% |
|
Latin America |
|
340 |
|
599 |
|
(259 |
) |
(43 |
)% | |||
|
EAME |
|
930 |
|
997 |
|
(67 |
) |
(7 |
)% | |||
|
Asia/Pacific |
|
702 |
|
962 |
|
(260 |
) |
(27 |
)% | |||
|
Total1 |
|
$ |
3,792 |
|
$ |
4,471 |
|
$ |
(679 |
) |
(15 |
)% |
Operating Profit
|
|
|
Third |
|
Third |
|
$ |
|
% |
| |||
|
Operating Profit |
|
$ |
378 |
|
$ |
483 |
|
$ |
(105 |
) |
(22 |
)% |
1 Does not include inter-segment sales of $34 million and $67 million in third quarter 2015 and 2014, respectively.
Construction Industries’ sales were $3.792 billion in the third quarter of 2015, a decrease of $679 million, or 15 percent, from the third quarter of 2014. The decrease in sales was mostly due to lower volume and the unfavorable impact of currency. While sales declined for both new equipment and aftermarket parts, most of the decrease was for new equipment.
· Sales volume declined primarily due to lower deliveries to end users.
· The unfavorable impact of currency was largely due to the euro, Japanese yen and Brazilian real.
Sales decreased in all regions.
· In Asia/Pacific, the sales decline was primarily due to lower sales in China and Japan. In China, the lower sales resulted mostly from continued weak residential and non-residential construction activity. In Japan, the weaker yen contributed to the decline as sales in yen translated into fewer U.S. dollars.
· In Latin America, dealer deliveries were down in most countries in the region, primarily in Brazil, due to continued weak construction activity resulting from depressed economic conditions. In addition, sales declined slightly due to the unfavorable impact of currency from the Brazilian real.
· Sales declined slightly in North America as weakness in oil and gas-related construction was largely offset by stronger activity in residential and non-residential building construction.
· Sales declined in EAME due to the unfavorable impact of currency, as sales in euros translated into fewer U.S. dollars. Lower end-user demand, primarily in Russia as a recession and sanctions slowed construction activity, was more than offset by the favorable changes in dealer inventories, which were about flat in third quarter of 2015, compared to a decrease in the third quarter of 2014.
Construction Industries’ profit was $378 million in the third quarter of 2015, compared with $483 million in the third quarter of 2014. The decrease in profit was primarily due to lower sales volume and unfavorable price realization resulting from competitive market conditions and an unfavorable geographic mix of sales. The decline was
partially offset by favorable manufacturing costs and lower SG&A and R&D expenses. The reduction in manufacturing costs and SG&A and R&D expenses was primarily due to lower incentive compensation expense.
RESOURCE INDUSTRIES
(Millions of dollars)
Sales Comparison
|
|
|
Third |
|
Sales |
|
Price |
|
Currency |
|
Third |
|
$ |
|
% |
| ||||||
|
|
|
|
|
|
|
|
|
|
|
|
|
|
|
|
| ||||||
|
Sales Comparison1 |
|
$ |
2,172 |
|
$ |
(311 |
) |
$ |
(18 |
) |
$ |
(47 |
) |
$ |
1,796 |
|
$ |
(376 |
) |
(17 |
)% |
Sales by Geographic Region
|
|
|
Third |
|
Third |
|
$ |
|
% |
| |||
|
North America |
|
$ |
672 |
|
$ |
752 |
|
$ |
(80 |
) |
(11 |
)% |
|
Latin America |
|
311 |
|
369 |
|
(58 |
) |
(16 |
)% | |||
|
EAME |
|
418 |
|
495 |
|
(77 |
) |
(16 |
)% | |||
|
Asia/Pacific |
|
395 |
|
556 |
|
(161 |
) |
(29 |
)% | |||
|
Total1 |
|
$ |
1,796 |
|
$ |
2,172 |
|
$ |
(376 |
) |
(17 |
)% |
Operating Profit / (Loss)
|
|
|
Third |
|
Third |
|
$ |
|
% |
| |||
|
Operating Profit / (Loss) |
|
$ |
(68 |
) |
$ |
122 |
|
$ |
(190 |
) |
(156 |
)% |
1 Does not include inter-segment sales of $93 million and $105 million in third quarter 2015 and 2014, respectively.
Resource Industries’ sales were $1.796 billion in the third quarter of 2015, a decrease of $376 million, or 17 percent, from the third quarter of 2014. The decline was primarily due to lower sales volume and the unfavorable impact of currency. Sales were lower for both new equipment and aftermarket parts. We believe some mining companies are continuing to delay maintenance and rebuild activities.
The sales decrease was primarily due to lower end-user demand across all regions. In Asia/Pacific, the unfavorable impact of currency due to the Australian dollar also contributed to the decline. Commodity prices remained weak, and mining customers continued to focus on improving productivity in existing mines and reducing their total capital expenditures, as they have for the last several years. As a result, sales and new orders in Resource Industries are continuing to weaken.
Resource Industries incurred a loss of $68 million in the third quarter of 2015, compared with profit of $122 million in the third quarter of 2014. The unfavorable change was primarily the result of lower sales volume and higher spending for new product introductions, partially offset by favorable warranty, lower incentive compensation expense and improved material costs.
ENERGY & TRANSPORTATION
(Millions of dollars)
Sales Comparison
|
|
|
Third |
|
Sales |
|
Price |
|
Currency |
|
Third |
|
$ |
|
% |
| ||||||
|
|
|
|
|
|
|
|
|
|
|
|
|
|
|
|
| ||||||
|
Sales Comparison1 |
|
$ |
5,585 |
|
$ |
(1,193 |
) |
$ |
4 |
|
$ |
(183 |
) |
$ |
4,213 |
|
$ |
(1,372 |
) |
(25 |
)% |
Sales by Geographic Region
|
|
|
Third |
|
Third |
|
$ |
|
% |
| |||
|
North America |
|
$ |
1,755 |
|
$ |
2,541 |
|
$ |
(786 |
) |
(31 |
)% |
|
Latin America |
|
368 |
|
481 |
|
(113 |
) |
(23 |
)% | |||
|
EAME |
|
1,300 |
|
1,582 |
|
(282 |
) |
(18 |
)% | |||
|
Asia/Pacific |
|
790 |
|
981 |
|
(191 |
) |
(19 |
)% | |||
|
Total1 |
|
$ |
4,213 |
|
$ |
5,585 |
|
$ |
(1,372 |
) |
(25 |
)% |
Operating Profit
|
|
|
Third |
|
Third |
|
$ |
|
% |
| |||
|
Operating Profit |
|
$ |
635 |
|
$ |
1,151 |
|
$ |
(516 |
) |
(45 |
)% |
1 Does not include inter-segment sales of $417 million and $570 million in third quarter 2015 and 2014, respectively.
Energy & Transportation’s sales were $4.213 billion in the third quarter of 2015, a decrease of $1.372 billion, or 25 percent, from the third quarter of 2014. The decrease was primarily the result of lower sales volume and the unfavorable impact of currency, mostly from the euro. Sales decreased in all applications.
· Oil and Gas — Sales decreased in much of the world due to substantially lower oil prices. The decline was most pronounced in equipment used for well servicing and drilling, with the most significant impact in North America, our largest market for well servicing. Demand for reciprocating engines used in gas compression applications was also down, but not as sharply.
· Transportation — Sales decreased in North America and were about flat in all other geographic regions. In North America, sales weakened primarily due to the absence of a Tier IV locomotive offering.
· Power Generation — Sales decreased in EAME and North America and were about flat in Asia/Pacific and Latin America. In EAME, sales decreased primarily due to lower end-user demand and the negative impact of currency. In North America, sales decreased largely because of unfavorable changes in dealer inventories as dealers increased inventories in the third quarter of 2014 and decreased inventories in the third quarter of 2015.
· Industrial — Sales were lower in all regions. Lower sales in EAME were mostly the result of lower demand and the unfavorable impact of currency. In North America, Asia/Pacific and Latin America, the decline in sales was primarily due to lower end-user demand for most industrial applications.
Energy & Transportation’s profit was $635 million in the third quarter of 2015, compared with $1.151 billion in the third quarter of 2014. The decrease was due to lower sales volume. Lower incentive compensation expense was about offset by the unfavorable impact of cost absorption and variable manufacturing inefficiencies driven by declining production volume. The unfavorable cost absorption resulted from a decrease in inventory in the third quarter of 2015, compared to an increase in the third quarter of 2014.
FINANCIAL PRODUCTS SEGMENT
(Millions of dollars)
Revenues by Geographic Region
|
|
|
Third |
|
Third Quarter 2014 |
|
$ |
|
% |
| |||
|
North America |
|
$ |
453 |
|
$ |
446 |
|
$ |
7 |
|
2 |
% |
|
Latin America |
|
91 |
|
130 |
|
(39 |
) |
(30 |
)% | |||
|
EAME |
|
101 |
|
127 |
|
(26 |
) |
(20 |
)% | |||
|
Asia/Pacific |
|
107 |
|
148 |
|
(41 |
) |
(28 |
)% | |||
|
Total |
|
$ |
752 |
|
$ |
851 |
|
$ |
(99 |
) |
(12 |
)% |
Operating Profit
|
|
|
Third |
|
Third |
|
$ |
|
% |
| |||
|
Operating Profit |
|
$ |
207 |
|
$ |
220 |
|
$ |
(13 |
) |
(6 |
)% |
Financial Products’ revenues were $752 million in the third quarter of 2015, a decrease of $99 million, or 12 percent, from the third quarter of 2014. The decline was primarily due to lower average earning assets and lower average financing rates. Average earning assets were down in Asia/Pacific, Latin America and EAME, partially offset by higher average earning assets in North America. Average financing rates were lower across all geographic regions.
Financial Products’ profit was $207 million in the third quarter of 2015, compared with $220 million in the third quarter of 2014. The decrease was primarily due to a $26 million decrease in net yield on average earning assets and a $21 million unfavorable impact from lower average earning assets, partially offset by the absence of $32 million of unfavorable out-of-period adjustments in the third quarter of 2014 related to interest rate swap contracts and the provision for credit losses.
At the end of the third quarter of 2015, past dues at Cat Financial were 2.68 percent, compared with 2.81 percent at the end of the third quarter of 2014. Write-offs, net of recoveries, were $69 million for the third quarter of 2015, compared with $22 million for the third quarter of 2014. The increase in write-offs, net of recoveries, was primarily driven by the mining and marine portfolios.
As of September 30, 2015, Cat Financial’s allowance for credit losses totaled $348 million, or 1.26 percent of net finance receivables, compared with $405 million, or 1.37 percent of net finance receivables at September 30, 2014. The allowance for credit losses at year-end 2014 was $401 million, or 1.36 percent of net finance receivables.
Corporate Items and Eliminations
Expense for corporate items and eliminations was $573 million in the third quarter of 2015, a decrease of $168 million from the third quarter of 2014. Corporate items and eliminations include: corporate-level expenses; restructuring costs; timing differences, as some expenses are reported in segment profit on a cash basis; retirement benefit costs other than service cost; currency differences for ME&T, as segment profit is reported using annual fixed exchange rates; and inter-segment eliminations.
The decrease in expense from the third quarter of 2014 was primarily due to timing differences.
2015 Outlook
The 2015 outlook for sales and revenues is about $48 billion, and that is unchanged from the outlook that was included in the September 24 announcement of new restructuring actions. Sales in the first half of 2015 benefited from a strong order backlog for reciprocating engines for oil and gas applications that was in place when the year started. We expect the significant declines that occurred in the third quarter to continue into the fourth quarter. While we expect sales and revenues to be about $48 billion, that is rounded up to the nearest billion. With one quarter to go, it is likely that we will end the year within a percent or two of the “about $48 billion” outlook, with $48 billion the likely top end.
The outlook for profit per share is $3.70, or $4.60 excluding restructuring costs. The expectation for 2015 restructuring costs has increased significantly, from about $250 million to about $800 million, and is a result of the additional restructuring actions.
The previous outlook for profit per share was provided in late July along with second-quarter 2015 financial results. At that time, the outlook for profit per share was $4.70, or $5.00 excluding restructuring charges, and was based on sales and revenues of about $49 billion.
2016 Preliminary Sales and Revenues Outlook
We expect world economic growth to be up slightly next year, from 2.4 percent in 2015 to 2.8 percent in 2016. We expect the improvement to be led by the United States and Europe, partially offset by slower growth in China and Russia and continued recession in Brazil. As a result, we expect prices for key commodities in 2016 to be close to current levels. While we expect a small improvement in world economic growth, we do not expect it will be enough to improve the key industries we serve. We do not expect construction or commodity-related industries like oil and gas and mining to improve.
2016 sales and revenues are expected to be about 5 percent below 2015:
· We expect Construction Industries’ sales to be flat to down 5 percent, with some improvement in developed countries offset by declining sales in developing countries.
· Energy & Transportation’s sales are expected to be down 5 to 10 percent as a result of continuing weakness in oil and gas. Most of the decline is because sales in the first half of 2015 benefited from substantial order backlog that was in place when the year started. In 2016, we expect a full year of weakness in oil and gas.
· Continued weakness in mining is expected to result in a decline in Resource Industries’ sales of about 10 percent.
QUESTIONS AND ANSWERS
Q1: Your outlook for sales and revenues began the year at about $50 billion, you revised it in July to about $49 billion, and with your restructuring announcement on September 24 you lowered it to about $48 billion and held that level in this morning’s financial release. Can you provide any additional color on what you are expecting for sales and revenues in 2015?
A: Over the past two years — 2014 and 2015 — our January outlook for each year has been reasonably close to the mark. In 2014, we ended the year within 1 percent of our initial outlook, and we expect this year to be around 5 percent lower than our initial $50 billion outlook for sales and revenues. Considering the strengthening of the U.S. dollar early in the year and the translation impact that has had on our sales and revenues, our outlook excluding currency impacts is even closer to our original expectations. The second half of 2015 has been more negatively affected by declining oil and gas sales, and that is because the first half of the year was helped by a strong order backlog that was in place for reciprocating engines when 2015 started. As we look ahead to the fourth quarter, while we expect 2015 sales and revenues to be about $48 billion, that is rounded up to the nearest billion. With one quarter to go, it is likely that we will end the year within a percent or two of the “about $48 billion” outlook, with $48 billion the likely top end.
Q2: Can you update us on recent restructuring actions and your progress?
A: As discussed in our announcement last month, we are expecting approximately $1.5 billion of annual cost reduction from significant restructuring and cost reduction actions that will occur through 2018, with about $750 million expected in 2016. We are making progress and continue to expect that the reduction will largely be in place and effective in 2016 and occur across the company.
We have updated our 2015 outlook to include about $800 million of restructuring costs, an increase from our previous estimate of about $250 million. We announced on September 24 that we expect to reduce our salaried and management workforce, including agency, by 4,000-5,000 people by the end of 2016, with most occurring in 2015. Since then, we have offered a voluntary retirement enhancement program to qualifying U.S. employees and more than 2,000 participants are in the program. We have also offered several voluntary separation programs outside of the United States and expect further reductions in the fourth quarter of 2015 from our flexible workforce and involuntary employee separation programs.
Q3: How much of the 2016 sales and revenues decline is due to your oil and gas business? Is the Solar Turbines business affected? Is the turbine backlog adequate to cover your 2016 forecast?
A: Most of the decline in Energy & Transportation’s sales expected for 2016 is related to oil and gas. Sales in the first half of 2015 benefited from a strong order backlog that was in place when the year started. We expect the more significant declines that are occurring in the second half of 2015 to continue into 2016.
Sales in our turbine business are expected to decline in 2016. While sales related to oil projects are down, sales related to gas compression are expected to increase. Based on the current backlog and recent quotation activity, we expect total sales in our turbine business to be down less than 10 percent.
Q4: While you usually provide next year’s profit outlook in January, is there any context you can provide to help put 2016 profit in perspective?
A: We have more work to do to complete our profit plan for 2016. That said, there are three directional points related to 2016 profit that are noteworthy — two negative to profit versus 2015 and one that we expect to be positive. On the negative side, 2015 had a gain on the sale of our remaining ownership of our third-party logistics business that helped profit in 2015 by about $0.14 per share; that will not repeat in 2016. Second, the sales decline in 2016 (about 5 percent) is expected to be concentrated in relatively higher margin products, so the impact of sales mix is expected to be unfavorable about $500 million. On the positive side, we expect about $750 million of cost reduction from restructuring actions. We expect to provide an updated outlook for sales and revenues and a profit outlook for 2016 in more detail with our year-end financial release in January.
Q5: What is causing you to forecast reduced Resource Industries’ sales in 2016?
A: There are several reasons for the expected decline in sales. Miners are forecasting further reductions in their 2016 capital expenditure budgets as compared with 2015. Uncertainty around China’s level of economic growth in 2016 has impacted commodity prices, which are at or near cyclical lows. This continues to dampen demand for new equipment. In addition, we believe cash flow considerations are pushing some customers to continue to defer maintenance, impacting our sales of aftermarket parts.
Q6: Can you discuss changes in dealer inventories in the third quarter of 2015? What are your expectations for the full year of 2015?
A: Dealer machine and engine inventories decreased about $600 million in both the third quarter of 2015 and the third quarter of 2014.
In the first quarter of 2015, consistent with historic seasonal patterns, dealers added inventory. Since the end of the first quarter of 2015, dealers have reduced inventory and at the end of the third quarter, inventories were about flat with year-end 2014. Dealers usually reduce inventories in the fourth quarter of each year, and we expect that to happen in 2015. As a result, we expect dealer inventory at year-end 2015 to be lower than year-end 2014, consistent with the reduction in sales that occurred in 2015 and the outlook for 2016.
Q7: Can you comment on your expectations for Caterpillar inventory for the remainder of 2015?
A: As expected, our inventory decreased about $500 million in the third quarter, and we expect additional declines during the remainder of 2015 as a result of our continued focus on operational improvements and lower sales expectations for 2016.
Q8: Can you comment on your order backlog?
A: At the end of the third quarter of 2015, the order backlog was $13.7 billion. This represents about a $1.1 billion reduction from the end of the second quarter of 2015. The decline was about equally split between Energy & Transportation and Resource Industries.
Q9: Can you comment on expense related to your short-term incentive compensation plans?
A: Short-term incentive compensation expense is directly related to financial and operational performance measured against targets set annually. The third-quarter expense related to 2015 was about $120 million, and we expect the full year will be about $720 million. Short-term incentive compensation in the third quarter of 2014 was about $390 million, and full-year 2014 was about $1.3 billion.
Q10: Can you comment on your balance sheet and ME&T operating cash flow in the third quarter of 2015?
A: ME&T operating cash flow for the third quarter of 2015 was $766 million, compared with $1.442 billion in the third quarter of 2014. The decline was primarily due to lower profit. The ME&T debt-to-capital ratio was 37.4 percent, up from 35.8 percent at the end of the second quarter, at about the midpoint of our target range of 30 to 45 percent. The increase was mostly due to the repurchase of $1.5 billion of Caterpillar common stock in the third quarter of 2015. Our cash and liquidity positions also remain strong with an enterprise cash balance of $6.0 billion as of September 30. During the third quarter of 2015, capital expenditures totaled $0.3 billion; the quarterly dividend payment was $0.5 billion, and common stock repurchased was $1.5 billion. Year-to-date, total return of capital to stockholders through the repurchase of common stock and payment of dividends was $3.3 billion.
GLOSSARY OF TERMS
|
1. |
Across the Table — A joint initiative with Caterpillar and its dealers to identify, build and strengthen capabilities necessary to meet the diverse and changing needs of our customers. The focus is on leveraging demonstrated best practices to improve performance on delivering an exceptional customer experience. |
|
2. |
All Other Segments — Primarily includes activities such as: the remanufacturing of Cat® engines and components and remanufacturing services for other companies as well as the business strategy, product management, development, manufacturing, marketing and product support of undercarriage, specialty products, hardened bar stock components and ground engaging tools primarily for Cat products, paving products, forestry products and industrial and waste products; the product management, development, marketing, sales and product support of on-highway vocational trucks for North America; parts distribution; distribution services responsible for dealer development and administration including a wholly owned dealer in Japan, dealer portfolio management and ensuring the most efficient and effective distribution of machines, engines and parts. |
|
3. |
Consolidating Adjustments — Elimination of transactions between Machinery, Energy & Transportation and Financial Products. |
|
4. |
Construction Industries — A segment primarily responsible for supporting customers using machinery in infrastructure and building construction applications. Responsibilities include business strategy, product design, product management and development, manufacturing, marketing and sales and product support. The product portfolio includes backhoe loaders, small wheel loaders, small track-type tractors, skid steer loaders, multi-terrain loaders, mini excavators, compact wheel loaders, telehandlers, select work tools, small, medium and large track excavators, wheel excavators, medium wheel loaders, compact track loaders, medium track-type tractors, track-type loaders, motor graders, pipelayers and mid-tier soil compactors. In addition, Construction Industries has responsibility for an integrated manufacturing cost center. |
|
5. |
Currency — With respect to sales and revenues, currency represents the translation impact on sales resulting from changes in foreign currency exchange rates versus the U.S. dollar. With respect to operating profit, currency represents the net translation impact on sales and operating costs resulting from changes in foreign currency exchange rates versus the U.S. dollar. Currency includes the impact on sales and operating profit for the Machinery, Energy & Transportation lines of business only; currency impacts on Financial Products’ revenues and operating profit are included in the Financial Products’ portions of the respective analyses. With respect to other income/expense, currency represents the effects of forward and option contracts entered into by the company to reduce the risk of fluctuations in exchange rates (hedging) and the net effect of changes in foreign currency exchange rates on our foreign currency assets and liabilities for consolidated results (translation). |
|
6. |
Debt-to-Capital Ratio — A key measure of Machinery, Energy & Transportation’s financial strength used by both management and our credit rating agencies. The metric is defined as Machinery, Energy & Transportation’s short-term borrowings, long-term debt due within one year and long-term debt due after one year (debt) divided by the sum of Machinery, Energy & Transportation’s debt and stockholders’ equity. Debt also includes Machinery, Energy & Transportation’s borrowings from Financial Products. |
|
7. |
EAME — A geographic region including Europe, Africa, the Middle East and the Commonwealth of Independent States (CIS). |
|
8. |
Earning Assets — Assets consisting primarily of total finance receivables net of unearned income, plus equipment on operating leases, less accumulated depreciation at Cat Financial. |
|
9. |
Energy & Transportation — A segment primarily responsible for supporting customers using reciprocating engines, turbines, diesel-electric locomotives and related parts across industries serving power generation, industrial, oil and gas and transportation applications, including marine and rail-related businesses. Responsibilities include business strategy, product design, product management, development, manufacturing, marketing, sales and product support of turbines and turbine-related services, reciprocating engine powered generator sets, integrated systems used in the electric power generation industry, reciprocating engines and integrated systems and solutions for the marine and oil and gas industries; reciprocating engines supplied to the industrial industry as well as Cat machinery; the business strategy, product design, product management, development, manufacturing, remanufacturing, leasing and service of diesel-electric locomotives and components and other rail-related products and services. |
|
10. |
Financial Products Segment — Provides financing to customers and dealers for the purchase and lease of Cat and other equipment, as well as some financing for Caterpillar sales to dealers. Financing plans include |
|
|
operating and finance leases, installment sale contracts, working capital loans and wholesale financing plans. The segment also provides various forms of insurance to customers and dealers to help support the purchase and lease of our equipment. Financial Products Segment profit is determined on a pretax basis and includes other income/expense items. |
|
11. |
Latin America — A geographic region including Central and South American countries and Mexico. |
|
12. |
Lean — A holistic management system that uses a sequential cadence of principles to drive the highest quality and lowest total cost to achieve customer requirements. |
|
13. |
Machinery, Energy & Transportation (ME&T) — Represents the aggregate total of Construction Industries, Resource Industries, Energy & Transportation and All Other Segments and related corporate items and eliminations. |
|
14. |
Machinery, Energy & Transportation Other Operating (Income) Expenses — Comprised primarily of gains/losses on disposal of long-lived assets, gains/losses on divestitures, long-lived asset impairment charges and legal settlements. Restructuring costs, which are classified as other operating expenses on the Results of Operations, are presented separately on the Operating Profit Comparison. |
|
15. |
Manufacturing Costs — Manufacturing costs exclude the impacts of currency and represent the volume-adjusted change for variable costs and the absolute dollar change for period manufacturing costs. Variable manufacturing costs are defined as having a direct relationship with the volume of production. This includes material costs, direct labor and other costs that vary directly with production volume such as freight, power to operate machines and supplies that are consumed in the manufacturing process. Period manufacturing costs support production but are defined as generally not having a direct relationship to short-term changes in volume. Examples include machinery and equipment repair, depreciation on manufacturing assets, facility support, procurement, factory scheduling, manufacturing planning and operations management. |
|
16. |
Price Realization — The impact of net price changes excluding currency and new product introductions. Price realization includes geographic mix of sales, which is the impact of changes in the relative weighting of sales prices between geographic regions. |
|
17. |
Resource Industries — A segment primarily responsible for supporting customers using machinery in mining and quarrying applications. Responsibilities include business strategy, product design, product management and development, manufacturing, marketing and sales and product support. The product portfolio includes large track-type tractors, large mining trucks, hard rock vehicles, longwall miners, electric rope shovels, draglines, hydraulic shovels, drills, highwall miners, large wheel loaders, off-highway trucks, articulated trucks, wheel tractor scrapers, wheel dozers, select work tools, machinery components and electronics and control systems. Resource Industries also manages areas that provide services to other parts of the company, including integrated manufacturing and research and development. In addition, segment profit includes the impact from divestiture of portions of the Bucyrus distribution business. |
|
18. |
Restructuring Costs — Primarily costs for employee separation costs and long-lived asset impairments. Beginning in the third quarter of 2015, restructuring costs also include other exit-related costs associated with the consolidation of manufacturing facilities as we expect these costs to be significant as we implement the restructuring plan that was announced on September 24. Other exit-related costs are primarily for contract terminations, equipment relocation and accelerated depreciation. |
|
19. |
Sales Volume — With respect to sales and revenues, sales volume represents the impact of changes in the quantities sold for Machinery, Energy & Transportation as well as the incremental revenue impact of new product introductions, including emissions-related product updates. With respect to operating profit, sales volume represents the impact of changes in the quantities sold for Machinery, Energy & Transportation combined with product mix as well as the net operating profit impact of new product introductions, including emissions-related product updates. Product mix represents the net operating profit impact of changes in the relative weighting of Machinery, Energy & Transportation sales with respect to total sales. |
NON-GAAP FINANCIAL MEASURES
The following definition is provided for “non-GAAP financial measures” in connection with Regulation G issued by the Securities and Exchange Commission. This non-GAAP financial measure has no standardized meaning prescribed by U.S. GAAP and therefore is unlikely to be comparable to the calculation of similar measures for other companies. Management does not intend this item to be considered in isolation or substituted for the related GAAP measure.
Profit Per Share Excluding Restructuring Costs
We anticipate incurring significant restructuring costs in 2015. We believe it is important to separately quantify the profit per share impact of restructuring costs in order for our third-quarter 2015 results and the 2015 outlook to be meaningful to our readers. We have also provided third-quarter 2014 profit per share excluding restructuring costs comparable to the 2015 presentation. Reconciliation of profit per share excluding restructuring costs to the most directly comparable GAAP measure, profit per share, is as follows:
|
|
|
Third Quarter |
|
2015 Outlook |
| ||||||||
|
|
|
2014 |
|
2015 |
|
Previous1 |
|
Current2 |
| ||||
|
Profit per share |
|
$ |
1.63 |
|
$ |
0.62 |
|
$ |
4.70 |
|
$ |
3.70 |
|
|
Per share restructuring costs |
|
$ |
0.09 |
|
$ |
0.13 |
|
$ |
0.30 |
|
$ |
0.90 |
|
|
Profit per share excluding restructuring costs |
|
$ |
1.72 |
|
$ |
0.75 |
|
$ |
5.00 |
|
$ |
4.60 |
|
1 2015 Outlook as of July 23, 2015. Sales and Revenues Outlook of about $49 billion.
2 2015 Outlook as of October 22, 2015. Sales and Revenues Outlook of about $48 billion.
Machinery, Energy & Transportation
Caterpillar defines Machinery, Energy & Transportation as it is presented in the supplemental data as Caterpillar Inc. and its subsidiaries with Financial Products accounted for on the equity basis. Machinery, Energy & Transportation information relates to the design, manufacture and marketing of our products. Financial Products’ information relates to the financing to customers and dealers for the purchase and lease of Caterpillar and other equipment. The nature of these businesses is different, especially with regard to the financial position and cash flow items. Caterpillar management utilizes this presentation internally to highlight these differences. We also believe this presentation will assist readers in understanding our business. Pages 20-28 reconcile Machinery, Energy & Transportation with Financial Products on the equity basis to Caterpillar Inc. consolidated financial information.
Caterpillar’s latest financial results and outlook are also available via:
Telephone:
800-228-7717 (Inside the United States and Canada)
858-764-9492 (Outside the United States and Canada)
Internet:
http://www.caterpillar.com/en/investors.html
http://www.caterpillar.com/en/investors/quarterly-results.html (live broadcast/replays of quarterly conference call)
Caterpillar contact: Rachel Potts, 309-675-6892 (Office), 309-573-3444 (Mobile) or [email protected]
Caterpillar Inc.
Condensed Consolidated Statement of Results of Operations
(Unaudited)
(Dollars in millions except per share data)
|
|
|
Three Months Ended |
|
Nine Months Ended |
| ||||||||
|
|
|
September 30, |
|
September 30, |
| ||||||||
|
|
|
2015 |
|
2014 |
|
2015 |
|
2014 |
| ||||
|
Sales and revenues: |
|
|
|
|
|
|
|
|
| ||||
|
Sales of Machinery, Energy & Transportation |
|
$ |
10,285 |
|
$ |
12,758 |
|
$ |
33,829 |
|
$ |
38,642 |
|
|
Revenues of Financial Products |
|
677 |
|
791 |
|
2,152 |
|
2,298 |
| ||||
|
Total sales and revenues |
|
10,962 |
|
13,549 |
|
35,981 |
|
40,940 |
| ||||
|
|
|
|
|
|
|
|
|
|
| ||||
|
Operating costs: |
|
|
|
|
|
|
|
|
| ||||
|
Cost of goods sold |
|
7,954 |
|
9,634 |
|
25,559 |
|
29,268 |
| ||||
|
Selling, general and administrative expenses |
|
1,225 |
|
1,446 |
|
3,932 |
|
4,175 |
| ||||
|
Research and development expenses |
|
534 |
|
533 |
|
1,612 |
|
1,557 |
| ||||
|
Interest expense of Financial Products |
|
142 |
|
157 |
|
440 |
|
470 |
| ||||
|
Other operating (income) expenses |
|
394 |
|
387 |
|
1,068 |
|
1,205 |
| ||||
|
Total operating costs |
|
10,249 |
|
12,157 |
|
32,611 |
|
36,675 |
| ||||
|
|
|
|
|
|
|
|
|
|
| ||||
|
Operating profit |
|
713 |
|
1,392 |
|
3,370 |
|
4,265 |
| ||||
|
|
|
|
|
|
|
|
|
|
| ||||
|
Interest expense excluding Financial Products |
|
127 |
|
128 |
|
381 |
|
358 |
| ||||
|
Other income (expense) |
|
(68 |
) |
117 |
|
76 |
|
236 |
| ||||
|
|
|
|
|
|
|
|
|
|
| ||||
|
Consolidated profit before taxes |
|
518 |
|
1,381 |
|
3,065 |
|
4,143 |
| ||||
|
|
|
|
|
|
|
|
|
|
| ||||
|
Provision (benefit) for income taxes |
|
144 |
|
364 |
|
870 |
|
1,201 |
| ||||
|
Profit of consolidated companies |
|
374 |
|
1,017 |
|
2,195 |
|
2,942 |
| ||||
|
|
|
|
|
|
|
|
|
|
| ||||
|
Equity in profit (loss) of unconsolidated affiliated companies |
|
(3 |
) |
4 |
|
1 |
|
6 |
| ||||
|
|
|
|
|
|
|
|
|
|
| ||||
|
Profit of consolidated and affiliated companies |
|
371 |
|
1,021 |
|
2,196 |
|
2,948 |
| ||||
|
|
|
|
|
|
|
|
|
|
| ||||
|
Less: Profit (loss) attributable to noncontrolling interests |
|
3 |
|
4 |
|
7 |
|
10 |
| ||||
|
|
|
|
|
|
|
|
|
|
| ||||
|
Profit 1 |
|
$ |
368 |
|
$ |
1,017 |
|
$ |
2,189 |
|
$ |
2,938 |
|
|
|
|
|
|
|
|
|
|
|
| ||||
|
Profit per common share |
|
$ |
0.63 |
|
$ |
1.66 |
|
$ |
3.66 |
|
$ |
4.73 |
|
|
|
|
|
|
|
|
|
|
|
| ||||
|
Profit per common share — diluted 2 |
|
$ |
0.62 |
|
$ |
1.63 |
|
$ |
3.62 |
|
$ |
4.64 |
|
|
|
|
|
|
|
|
|
|
|
| ||||
|
Weighted-average common shares outstanding (millions) |
|
|
|
|
|
|
|
|
| ||||
|
- Basic |
|
588.4 |
|
611.5 |
|
597.9 |
|
620.6 |
| ||||
|
- Diluted 2 |
|
594.8 |
|
622.8 |
|
605.3 |
|
632.7 |
| ||||
|
|
|
|
|
|
|
|
|
|
| ||||
|
Cash dividends declared per common share |
|
$ |
— |
|
$ |
— |
|
$ |
1.47 |
|
$ |
1.30 |
|
1 Profit attributable to common stockholders.
2 Diluted by assumed exercise of stock-based compensation awards using the treasury stock method.
Caterpillar Inc.
Condensed Consolidated Statement of Financial Position
(Unaudited)
(Millions of dollars)
|
|
|
September 30, |
|
December 31, |
| ||
|
|
|
2015 |
|
2014 |
| ||
|
Assets |
|
|
|
|
| ||
|
Current assets: |
|
|
|
|
| ||
|
Cash and short-term investments |
|
$ |
6,046 |
|
$ |
7,341 |
|
|
Receivables - trade and other |
|
6,783 |
|
7,737 |
| ||
|
Receivables - finance |
|
8,862 |
|
9,027 |
| ||
|
Deferred and refundable income taxes |
|
1,446 |
|
1,739 |
| ||
|
Prepaid expenses and other current assets |
|
993 |
|
818 |
| ||
|
Inventories |
|
11,150 |
|
12,205 |
| ||
|
Total current assets |
|
35,280 |
|
38,867 |
| ||
|
|
|
|
|
|
| ||
|
Property, plant and equipment — net |
|
15,955 |
|
16,577 |
| ||
|
Long-term receivables - trade and other |
|
1,266 |
|
1,364 |
| ||
|
Long-term receivables - finance |
|
13,551 |
|
14,644 |
| ||
|
Investments in unconsolidated affiliated companies |
|
231 |
|
257 |
| ||
|
Noncurrent deferred and refundable income taxes |
|
1,559 |
|
1,404 |
| ||
|
Intangible assets |
|
2,841 |
|
3,076 |
| ||
|
Goodwill |
|
6,546 |
|
6,694 |
| ||
|
Other assets |
|
1,740 |
|
1,798 |
| ||
|
Total assets |
|
$ |
78,969 |
|
$ |
84,681 |
|
|
|
|
|
|
|
| ||
|
Liabilities |
|
|
|
|
| ||
|
Current liabilities: |
|
|
|
|
| ||
|
Short-term borrowings: |
|
|
|
|
| ||
|
— Machinery, Energy & Transportation |
|
$ |
12 |
|
$ |
9 |
|
|
— Financial Products |
|
6,068 |
|
4,699 |
| ||
|
Accounts payable |
|
5,206 |
|
6,515 |
| ||
|
Accrued expenses |
|
3,306 |
|
3,548 |
| ||
|
Accrued wages, salaries and employee benefits |
|
1,678 |
|
2,438 |
| ||
|
Customer advances |
|
1,610 |
|
1,697 |
| ||
|
Dividends payable |
|
— |
|
424 |
| ||
|
Other current liabilities |
|
1,698 |
|
1,754 |
| ||
|
Long-term debt due within one year: |
|
|
|
|
| ||
|
— Machinery, Energy & Transportation |
|
516 |
|
510 |
| ||
|
— Financial Products |
|
5,739 |
|
6,283 |
| ||
|
Total current liabilities |
|
25,833 |
|
27,877 |
| ||
|
|
|
|
|
|
| ||
|
Long-term debt due after one year: |
|
|
|
|
| ||
|
— Machinery, Energy & Transportation |
|
8,997 |
|
9,493 |
| ||
|
— Financial Products |
|
16,211 |
|
18,291 |
| ||
|
Liability for postemployment benefits |
|
8,638 |
|
8,963 |
| ||
|
Other liabilities |
|
3,322 |
|
3,231 |
| ||
|
Total liabilities |
|
63,001 |
|
67,855 |
| ||
|
|
|
|
|
|
| ||
|
Stockholders’ equity |
|
|
|
|
| ||
|
Common stock |
|
5,190 |
|
5,016 |
| ||
|
Treasury stock |
|
(17,642 |
) |
(15,726 |
) | ||
|
Profit employed in the business |
|
35,191 |
|
33,887 |
| ||
|
Accumulated other comprehensive income (loss) |
|
(6,843 |
) |
(6,431 |
) | ||
|
Noncontrolling interests |
|
72 |
|
80 |
| ||
|
Total stockholders’ equity |
|
15,968 |
|
16,826 |
| ||
|
Total liabilities and stockholders’ equity |
|
$ |
78,969 |
|
$ |
84,681 |
|
Caterpillar Inc.
Condensed Consolidated Statement of Cash Flow
(Unaudited)
(Millions of dollars)
|
|
|
Nine Months Ended |
| ||||
|
|
|
September 30, |
| ||||
|
|
|
2015 |
|
2014 |
| ||
|
Cash flow from operating activities: |
|
|
|
|
| ||
|
Profit of consolidated and affiliated companies |
|
$ |
2,196 |
|
$ |
2,948 |
|
|
Adjustments for non-cash items: |
|
|
|
|
| ||
|
Depreciation and amortization |
|
2,272 |
|
2,368 |
| ||
|
Other |
|
354 |
|
327 |
| ||
|
Changes in assets and liabilities, net of acquisitions and divestitures: |
|
|
|
|
| ||
|
Receivables — trade and other |
|
614 |
|
393 |
| ||
|
Inventories |
|
840 |
|
(859 |
) | ||
|
Accounts payable |
|
(893 |
) |
518 |
| ||
|
Accrued expenses |
|
(25 |
) |
(44 |
) | ||
|
Accrued wages, salaries and employee benefits |
|
(704 |
) |
648 |
| ||
|
Customer advances |
|
(36 |
) |
(132 |
) | ||
|
Other assets — net |
|
(108 |
) |
(104 |
) | ||
|
Other liabilities — net |
|
354 |
|
123 |
| ||
|
Net cash provided by (used for) operating activities |
|
4,864 |
|
6,186 |
| ||
|
Cash flow from investing activities: |
|
|
|
|
| ||
|
Capital expenditures — excluding equipment leased to others |
|
(946 |
) |
(1,072 |
) | ||
|
Expenditures for equipment leased to others |
|
(1,251 |
) |
(1,310 |
) | ||
|
Proceeds from disposals of leased assets and property, plant and equipment |
|
473 |
|
681 |
| ||
|
Additions to finance receivables |
|
(7,099 |
) |
(8,464 |
) | ||
|
Collections of finance receivables |
|
6,849 |
|
7,264 |
| ||
|
Proceeds from sale of finance receivables |
|
101 |
|
154 |
| ||
|
Investments and acquisitions (net of cash acquired) |
|
(140 |
) |
(18 |
) | ||
|
Proceeds from sale of businesses and investments (net of cash sold) |
|
174 |
|
196 |
| ||
|
Proceeds from sale of securities |
|
238 |
|
347 |
| ||
|
Investments in securities |
|
(296 |
) |
(769 |
) | ||
|
Other — net |
|
(76 |
) |
(12 |
) | ||
|
Net cash provided by (used for) investing activities |
|
(1,973 |
) |
(3,003 |
) | ||
|
Cash flow from financing activities: |
|
|
|
|
| ||
|
Dividends paid |
|
(1,309 |
) |
(1,197 |
) | ||
|
Distribution to noncontrolling interests |
|
(7 |
) |
(7 |
) | ||
|
Contribution from noncontrolling interests |
|
— |
|
2 |
| ||
|
Common stock issued, including treasury shares reissued |
|
34 |
|
218 |
| ||
|
Treasury shares purchased |
|
(2,025 |
) |
(4,238 |
) | ||
|
Excess tax benefit from stock-based compensation |
|
20 |
|
162 |
| ||
|
Proceeds from debt issued (original maturities greater than three months) |
|
4,082 |
|
9,103 |
| ||
|
Payments on debt (original maturities greater than three months) |
|
(6,772 |
) |
(7,893 |
) | ||
|
Short-term borrowings - net (original maturities three months or less) |
|
1,922 |
|
791 |
| ||
|
Net cash provided by (used for) financing activities |
|
(4,055 |
) |
(3,059 |
) | ||
|
Effect of exchange rate changes on cash |
|
(131 |
) |
(123 |
) | ||
|
Increase (decrease) in cash and short-term investments |
|
(1,295 |
) |
1 |
| ||
|
Cash and short-term investments at beginning of period |
|
7,341 |
|
6,081 |
| ||
|
Cash and short-term investments at end of period |
|
$ |
6,046 |
|
$ |
6,082 |
|
All short-term investments, which consist primarily of highly liquid investments with original maturities of three months or less, are considered to be cash equivalents.
Caterpillar Inc.
Supplemental Data for Results of Operations
For the Three Months Ended September 30, 2015
(Unaudited)
(Millions of dollars)
|
|
|
|
|
Supplemental Consolidating Data |
| ||||||||
|
|
|
|
|
Machinery, |
|
|
|
|
| ||||
|
|
|
Consolidated |
|
Energy & |
|
Financial |
|
Consolidating |
| ||||
|
Sales and revenues: |
|
|
|
|
|
|
|
|
| ||||
|
Sales of Machinery, Energy & Transportation |
|
$ |
10,285 |
|
$ |
10,285 |
|
$ |
— |
|
$ |
— |
|
|
Revenues of Financial Products |
|
677 |
|
— |
|
772 |
|
(95 |
)2 | ||||
|
Total sales and revenues |
|
10,962 |
|
10,285 |
|
772 |
|
(95 |
) | ||||
|
|
|
|
|
|
|
|
|
|
| ||||
|
Operating costs: |
|
|
|
|
|
|
|
|
| ||||
|
Cost of goods sold |
|
7,954 |
|
7,953 |
|
— |
|
1 |
3 | ||||
|
Selling, general and administrative expenses |
|
1,225 |
|
1,111 |
|
139 |
|
(25 |
)3 | ||||
|
Research and development expenses |
|
534 |
|
534 |
|
— |
|
— |
| ||||
|
Interest expense of Financial Products |
|
142 |
|
— |
|
144 |
|
(2 |
)4 | ||||
|
Other operating (income) expenses |
|
394 |
|
97 |
|
304 |
|
(7 |
)3 | ||||
|
Total operating costs |
|
10,249 |
|
9,695 |
|
587 |
|
(33 |
) | ||||
|
|
|
|
|
|
|
|
|
|
| ||||
|
Operating profit |
|
713 |
|
590 |
|
185 |
|
(62 |
) | ||||
|
|
|
|
|
|
|
|
|
|
| ||||
|
Interest expense excluding Financial Products |
|
127 |
|
138 |
|
— |
|
(11 |
)4 | ||||
|
Other income (expense) |
|
(68 |
) |
(140 |
) |
21 |
|
51 |
5 | ||||
|
|
|
|
|
|
|
|
|
|
| ||||
|
Consolidated profit before taxes |
|
518 |
|
312 |
|
206 |
|
— |
| ||||
|
|
|
|
|
|
|
|
|
|
| ||||
|
Provision (benefit) for income taxes |
|
144 |
|
82 |
|
62 |
|
— |
| ||||
|
Profit of consolidated companies |
|
374 |
|
230 |
|
144 |
|
— |
| ||||
|
|
|
|
|
|
|
|
|
|
| ||||
|
Equity in profit (loss) of unconsolidated affiliated companies |
|
(3 |
) |
(3 |
) |
— |
|
— |
| ||||
|
Equity in profit of Financial Products’ subsidiaries |
|
— |
|
144 |
|
— |
|
(144 |
)6 | ||||
|
|
|
|
|
|
|
|
|
|
| ||||
|
Profit of consolidated and affiliated companies |
|
371 |
|
371 |
|
144 |
|
(144 |
) | ||||
|
|
|
|
|
|
|
|
|
|
| ||||
|
Less: Profit (loss) attributable to noncontrolling interests |
|
3 |
|
3 |
|
— |
|
— |
| ||||
|
|
|
|
|
|
|
|
|
|
| ||||
|
Profit 7 |
|
$ |
368 |
|
$ |
368 |
|
$ |
144 |
|
$ |
(144 |
) |
1 Represents Caterpillar Inc. and its subsidiaries with Financial Products accounted for on the equity basis.
2 Elimination of Financial Products’ revenues earned from Machinery, Energy & Transportation.
3 Elimination of net expenses recorded by Machinery, Energy & Transportation paid to Financial Products.
4 Elimination of interest expense recorded between Financial Products and Machinery, Energy & Transportation.
5 Elimination of discount recorded by Machinery, Energy & Transportation on receivables sold to Financial Products and of interest earned between Machinery, Energy & Transportation and Financial Products.
6 Elimination of Financial Products’ profit due to equity method of accounting.
7 Profit attributable to common stockholders.
Caterpillar Inc.
Supplemental Data for Results of Operations
For the Three Months Ended September 30, 2014
(Unaudited)
(Millions of dollars)
|
|
|
|
|
Supplemental Consolidating Data |
| ||||||||
|
|
|
|
|
Machinery, |
|
|
|
|
| ||||
|
|
|
Consolidated |
|
Energy & |
|
Financial |
|
Consolidating |
| ||||
|
Sales and revenues: |
|
|
|
|
|
|
|
|
| ||||
|
Sales of Machinery, Energy & Transportation |
|
$ |
12,758 |
|
$ |
12,758 |
|
$ |
— |
|
$ |
— |
|
|
Revenues of Financial Products |
|
791 |
|
— |
|
875 |
|
(84 |
)2 | ||||
|
Total sales and revenues |
|
13,549 |
|
12,758 |
|
875 |
|
(84 |
) | ||||
|
|
|
|
|
|
|
|
|
|
| ||||
|
Operating costs: |
|
|
|
|
|
|
|
|
| ||||
|
Cost of goods sold |
|
9,634 |
|
9,634 |
|
— |
|
— |
| ||||
|
Selling, general and administrative expenses |
|
1,446 |
|
1,278 |
|
172 |
|
(4 |
)3 | ||||
|
Research and development expenses |
|
533 |
|
533 |
|
— |
|
— |
| ||||
|
Interest expense of Financial Products |
|
157 |
|
— |
|
158 |
|
(1 |
)4 | ||||
|
Other operating (income) expenses |
|
387 |
|
69 |
|
326 |
|
(8 |
)3 | ||||
|
Total operating costs |
|
12,157 |
|
11,514 |
|
656 |
|
(13 |
) | ||||
|
|
|
|
|
|
|
|
|
|
| ||||
|
Operating profit |
|
1,392 |
|
1,244 |
|
219 |
|
(71 |
) | ||||
|
|
|
|
|
|
|
|
|
|
| ||||
|
Interest expense excluding Financial Products |
|
128 |
|
139 |
|
— |
|
(11 |
)4 | ||||
|
Other income (expense) |
|
117 |
|
53 |
|
4 |
|
60 |
5 | ||||
|
|
|
|
|
|
|
|
|
|
| ||||
|
Consolidated profit before taxes |
|
1,381 |
|
1,158 |
|
223 |
|
— |
| ||||
|
|
|
|
|
|
|
|
|
|
| ||||
|
Provision (benefit) for income taxes |
|
364 |
|
304 |
|
60 |
|
— |
| ||||
|
Profit of consolidated companies |
|
1,017 |
|
854 |
|
163 |
|
— |
| ||||
|
|
|
|
|
|
|
|
|
|
| ||||
|
Equity in profit (loss) of unconsolidated affiliated companies |
|
4 |
|
4 |
|
— |
|
— |
| ||||
|
Equity in profit of Financial Products’ subsidiaries |
|
— |
|
161 |
|
— |
|
(161 |
)6 | ||||
|
|
|
|
|
|
|
|
|
|
| ||||
|
Profit of consolidated and affiliated companies |
|
1,021 |
|
1,019 |
|
163 |
|
(161 |
) | ||||
|
|
|
|
|
|
|
|
|
|
| ||||
|
Less: Profit (loss) attributable to noncontrolling interests |
|
4 |
|
2 |
|
2 |
|
— |
| ||||
|
|
|
|
|
|
|
|
|
|
| ||||
|
Profit 7 |
|
$ |
1,017 |
|
$ |
1,017 |
|
$ |
161 |
|
$ |
(161 |
) |
1 Represents Caterpillar Inc. and its subsidiaries with Financial Products accounted for on the equity basis.
2 Elimination of Financial Products’ revenues earned from Machinery, Energy & Transportation.
3 Elimination of net expenses recorded by Machinery, Energy & Transportation paid to Financial Products.
4 Elimination of interest expense recorded between Financial Products and Machinery, Energy & Transportation.
5 Elimination of discount recorded by Machinery, Energy & Transportation on receivables sold to Financial Products and of interest earned between Machinery, Energy & Transportation and Financial Products.
6 Elimination of Financial Products’ profit due to equity method of accounting.
7 Profit attributable to common stockholders.
Caterpillar Inc.
Supplemental Data for Results of Operations
For the Nine Months Ended September 30, 2015
(Unaudited)
(Millions of dollars)
|
|
|
|
|
Supplemental Consolidating Data |
| ||||||||
|
|
|
|
|
Machinery, |
|
|
|
|
| ||||
|
|
|
Consolidated |
|
Energy & |
|
Financial |
|
Consolidating |
| ||||
|
Sales and revenues: |
|
|
|
|
|
|
|
|
| ||||
|
Sales of Machinery, Energy & Transportation |
|
$ |
33,829 |
|
$ |
33,829 |
|
$ |
— |
|
$ |
— |
|
|
Revenues of Financial Products |
|
2,152 |
|
— |
|
2,390 |
|
(238 |
)2 | ||||
|
Total sales and revenues |
|
35,981 |
|
33,829 |
|
2,390 |
|
(238 |
) | ||||
|
|
|
|
|
|
|
|
|
|
| ||||
|
Operating costs: |
|
|
|
|
|
|
|
|
| ||||
|
Cost of goods sold |
|
25,559 |
|
25,559 |
|
— |
|
— |
| ||||
|
Selling, general and administrative expenses |
|
3,932 |
|
3,505 |
|
444 |
|
(17 |
)3 | ||||
|
Research and development expenses |
|
1,612 |
|
1,612 |
|
— |
|
— |
| ||||
|
Interest expense of Financial Products |
|
440 |
|
— |
|
445 |
|
(5 |
)4 | ||||
|
Other operating (income) expenses |
|
1,068 |
|
185 |
|
903 |
|
(20 |
)3 | ||||
|
Total operating costs |
|
32,611 |
|
30,861 |
|
1,792 |
|
(42 |
) | ||||
|
|
|
|
|
|
|
|
|
|
| ||||
|
Operating profit |
|
3,370 |
|
2,968 |
|
598 |
|
(196 |
) | ||||
|
|
|
|
|
|
|
|
|
|
| ||||
|
Interest expense excluding Financial Products |
|
381 |
|
413 |
|
— |
|
(32 |
)4 | ||||
|
Other income (expense) |
|
76 |
|
(110 |
) |
22 |
|
164 |
5 | ||||
|
|
|
|
|
|
|
|
|
|
| ||||
|
Consolidated profit before taxes |
|
3,065 |
|
2,445 |
|
620 |
|
— |
| ||||
|
|
|
|
|
|
|
|
|
|
| ||||
|
Provision (benefit) for income taxes |
|
870 |
|
681 |
|
189 |
|
— |
| ||||
|
Profit of consolidated companies |
|
2,195 |
|
1,764 |
|
431 |
|
— |
| ||||
|
|
|
|
|
|
|
|
|
|
| ||||
|
Equity in profit (loss) of unconsolidated affiliated companies |
|
1 |
|
1 |
|
— |
|
— |
| ||||
|
Equity in profit of Financial Products’ subsidiaries |
|
— |
|
429 |
|
— |
|
(429 |
)6 | ||||
|
|
|
|
|
|
|
|
|
|
| ||||
|
Profit of consolidated and affiliated companies |
|
2,196 |
|
2,194 |
|
431 |
|
(429 |
) | ||||
|
|
|
|
|
|
|
|
|
|
| ||||
|
Less: Profit (loss) attributable to noncontrolling interests |
|
7 |
|
5 |
|
2 |
|
— |
| ||||
|
|
|
|
|
|
|
|
|
|
| ||||
|
Profit 7 |
|
$ |
2,189 |
|
$ |
2,189 |
|
$ |
429 |
|
$ |
(429 |
) |
1 Represents Caterpillar Inc. and its subsidiaries with Financial Products accounted for on the equity basis.
2 Elimination of Financial Products’ revenues earned from Machinery, Energy & Transportation.
3 Elimination of net expenses recorded by Machinery, Energy & Transportation paid to Financial Products.
4 Elimination of interest expense recorded between Financial Products and Machinery, Energy & Transportation.
5 Elimination of discount recorded by Machinery, Energy & Transportation on receivables sold to Financial Products and of interest earned between Machinery, Energy & Transportation and Financial Products.
6 Elimination of Financial Products’ profit due to equity method of accounting.
7 Profit attributable to common stockholders.
Caterpillar Inc.
Supplemental Data for Results of Operations
For the Nine Months Ended September 30, 2014
(Unaudited)
(Millions of dollars)
|
|
|
|
|
Supplemental Consolidating Data |
| ||||||||
|
|
|
|
|
Machinery, |
|
|
|
|
| ||||
|
|
|
Consolidated |
|
Energy & |
|
Financial |
|
Consolidating |
| ||||
|
Sales and revenues: |
|
|
|
|
|
|
|
|
| ||||
|
Sales of Machinery, Energy & Transportation |
|
$ |
38,642 |
|
$ |
38,642 |
|
$ |
— |
|
$ |
— |
|
|
Revenues of Financial Products |
|
2,298 |
|
— |
|
2,557 |
|
(259 |
)2 | ||||
|
Total sales and revenues |
|
40,940 |
|
38,642 |
|
2,557 |
|
(259 |
) | ||||
|
|
|
|
|
|
|
|
|
|
| ||||
|
Operating costs: |
|
|
|
|
|
|
|
|
| ||||
|
Cost of goods sold |
|
29,268 |
|
29,268 |
|
— |
|
— |
| ||||
|
Selling, general and administrative expenses |
|
4,175 |
|
3,717 |
|
477 |
|
(19 |
)3 | ||||
|
Research and development expenses |
|
1,557 |
|
1,557 |
|
— |
|
— |
| ||||
|
Interest expense of Financial Products |
|
470 |
|
— |
|
475 |
|
(5 |
)4 | ||||
|
Other operating (income) expenses |
|
1,205 |
|
300 |
|
929 |
|
(24 |
)3 | ||||
|
Total operating costs |
|
36,675 |
|
34,842 |
|
1,881 |
|
(48 |
) | ||||
|
|
|
|
|
|
|
|
|
|
| ||||
|
Operating profit |
|
4,265 |
|
3,800 |
|
676 |
|
(211 |
) | ||||
|
|
|
|
|
|
|
|
|
|
| ||||
|
Interest expense excluding Financial Products |
|
358 |
|
390 |
|
— |
|
(32 |
)4 | ||||
|
Other income (expense) |
|
236 |
|
30 |
|
27 |
|
179 |
5 | ||||
|
|
|
|
|
|
|
|
|
|
| ||||
|
Consolidated profit before taxes |
|
4,143 |
|
3,440 |
|
703 |
|
— |
| ||||
|
|
|
|
|
|
|
|
|
|
| ||||
|
Provision (benefit) for income taxes |
|
1,201 |
|
1,003 |
|
198 |
|
— |
| ||||
|
Profit of consolidated companies |
|
2,942 |
|
2,437 |
|
505 |
|
— |
| ||||
|
|
|
|
|
|
|
|
|
|
| ||||
|
Equity in profit (loss) of unconsolidated affiliated companies |
|
6 |
|
6 |
|
— |
|
— |
| ||||
|
Equity in profit of Financial Products’ subsidiaries |
|
— |
|
498 |
|
— |
|
(498 |
)6 | ||||
|
|
|
|
|
|
|
|
|
|
| ||||
|
Profit of consolidated and affiliated companies |
|
2,948 |
|
2,941 |
|
505 |
|
(498 |
) | ||||
|
|
|
|
|
|
|
|
|
|
| ||||
|
Less: Profit (loss) attributable to noncontrolling interests |
|
10 |
|
3 |
|
7 |
|
— |
| ||||
|
|
|
|
|
|
|
|
|
|
| ||||
|
Profit 7 |
|
$ |
2,938 |
|
$ |
2,938 |
|
$ |
498 |
|
$ |
(498 |
) |
1 Represents Caterpillar Inc. and its subsidiaries with Financial Products accounted for on the equity basis.
2 Elimination of Financial Products’ revenues earned from Machinery, Energy & Transportation.
3 Elimination of net expenses recorded by Machinery, Energy & Transportation paid to Financial Products.
4 Elimination of interest expense recorded between Financial Products and Machinery, Energy & Transportation.
5 Elimination of discount recorded by Machinery, Energy & Transportation on receivables sold to Financial Products and of interest earned between Machinery, Energy & Transportation and Financial Products.
6 Elimination of Financial Products’ profit due to equity method of accounting.
7 Profit attributable to common stockholders.
Caterpillar Inc.
Supplemental Data for Cash Flow
For the Nine Months Ended September 30, 2015
(Unaudited)
(Millions of dollars)
|
|
|
|
|
Supplemental Consolidating Data |
|
|
| ||||||||
|
|
|
|
|
Machinery, |
|
|
|
|
|
|
| ||||
|
|
|
Consolidated |
|
Energy & |
|
Financial |
|
Consolidating |
|
|
| ||||
|
Cash flow from operating activities: |
|
|
|
|
|
|
|
|
|
|
| ||||
|
Profit of consolidated and affiliated companies |
|
$ |
2,196 |
|
$ |
2,194 |
|
$ |
431 |
|
$ |
(429 |
) |
2 |
|
|
Adjustments for non-cash items: |
|
|
|
|
|
|
|
|
|
|
| ||||
|
Depreciation and amortization |
|
2,272 |
|
1,608 |
|
664 |
|
— |
|
|
| ||||
|
Undistributed profit of Financial Products |
|
— |
|
(179 |
) |
— |
|
179 |
|
3 |
| ||||
|
Other |
|
354 |
|
252 |
|
(92 |
) |
194 |
|
4 |
| ||||
|
Changes in assets and liabilities, net of acquisitions and divestitures: |
|
|
|
|
|
|
|
|
|
|
| ||||
|
Receivables - trade and other |
|
614 |
|
342 |
|
(65 |
) |
337 |
|
4,5 |
| ||||
|
Inventories |
|
840 |
|
845 |
|
— |
|
(5 |
) |
4 |
| ||||
|
Accounts payable |
|
(893 |
) |
(988 |
) |
56 |
|
39 |
|
4 |
| ||||
|
Accrued expenses |
|
(25 |
) |
(41 |
) |
3 |
|
13 |
|
4 |
| ||||
|
Accrued wages, salaries and employee benefits |
|
(704 |
) |
(695 |
) |
(9 |
) |
— |
|
|
| ||||
|
Customer advances |
|
(36 |
) |
(36 |
) |
— |
|
— |
|
|
| ||||
|
Other assets - net |
|
(108 |
) |
(203 |
) |
58 |
|
37 |
|
4 |
| ||||
|
Other liabilities - net |
|
354 |
|
347 |
|
57 |
|
(50 |
) |
4 |
| ||||
|
Net cash provided by (used for) operating activities |
|
4,864 |
|
3,446 |
|
1,103 |
|
315 |
|
|
| ||||
|
Cash flow from investing activities: |
|
|
|
|
|
|
|
|
|
|
| ||||
|
Capital expenditures - excluding equipment leased to others |
|
(946 |
) |
(938 |
) |
(9 |
) |
1 |
|
4 |
| ||||
|
Expenditures for equipment leased to others |
|
(1,251 |
) |
(157 |
) |
(1,116 |
) |
22 |
|
4 |
| ||||
|
Proceeds from disposals of leased assets and property, plant and equipment |
|
473 |
|
51 |
|
429 |
|
(7 |
) |
4 |
| ||||
|
Additions to finance receivables |
|
(7,099 |
) |
— |
|
(9,434 |
) |
2,335 |
|
5,8 |
| ||||
|
Collections of finance receivables |
|
6,849 |
|
— |
|
9,001 |
|
(2,152 |
) |
5 |
| ||||
|
Net intercompany purchased receivables |
|
— |
|
— |
|
758 |
|
(758 |
) |
5 |
| ||||
|
Proceeds from sale of finance receivables |
|
101 |
|
— |
|
101 |
|
— |
|
|
| ||||
|
Net intercompany borrowings |
|
— |
|
(21 |
) |
1 |
|
20 |
|
6 |
| ||||
|
Investments and acquisitions (net of cash acquired) |
|
(140 |
) |
(140 |
) |
— |
|
— |
|
|
| ||||
|
Proceeds from sale of businesses and investments (net of cash sold) |
|
174 |
|
180 |
|
— |
|
(6 |
) |
8 |
| ||||
|
Proceeds from sale of securities |
|
238 |
|
16 |
|
222 |
|
— |
|
|
| ||||
|
Investments in securities |
|
(296 |
) |
(20 |
) |
(276 |
) |
— |
|
|
| ||||
|
Other - net |
|
(76 |
) |
(34 |
) |
(42 |
) |
— |
|
|
| ||||
|
Net cash provided by (used for) investing activities |
|
(1,973 |
) |
(1,063 |
) |
(365 |
) |
(545 |
) |
|
| ||||
|
Cash flow from financing activities: |
|
|
|
|
|
|
|
|
|
|
| ||||
|
Dividends paid |
|
(1,309 |
) |
(1,309 |
) |
(250 |
) |
250 |
|
7 |
| ||||
|
Distribution to noncontrolling interests |
|
(7 |
) |
(7 |
) |
— |
|
— |
|
|
| ||||
|
Common stock issued, including treasury shares reissued |
|
34 |
|
34 |
|
— |
|
— |
|
|
| ||||
|
Treasury shares purchased |
|
(2,025 |
) |
(2,025 |
) |
— |
|
— |
|
|
| ||||
|
Excess tax benefit from stock-based compensation |
|
20 |
|
20 |
|
— |
|
— |
|
|
| ||||
|
Net intercompany borrowings |
|
— |
|
(1 |
) |
21 |
|
(20 |
) |
6 |
| ||||
|
Proceeds from debt issued (original maturities greater than three months) |
|
4,082 |
|
3 |
|
4,079 |
|
— |
|
|
| ||||
|
Payments on debt (original maturities greater than three months) |
|
(6,772 |
) |
(513 |
) |
(6,259 |
) |
— |
|
|
| ||||
|
Short-term borrowings - net (original maturities three months or less) |
|
1,922 |
|
5 |
|
1,917 |
|
— |
|
|
| ||||
|
Net cash provided by (used for) financing activities |
|
(4,055 |
) |
(3,793 |
) |
(492 |
) |
230 |
|
|
| ||||
|
Effect of exchange rate changes on cash |
|
(131 |
) |
(99 |
) |
(32 |
) |
— |
|
|
| ||||
|
Increase (decrease) in cash and short-term investments |
|
(1,295 |
) |
(1,509 |
) |
214 |
|
— |
|
|
| ||||
|
Cash and short-term investments at beginning of period |
|
7,341 |
|
6,317 |
|
1,024 |
|
— |
|
|
| ||||
|
Cash and short-term investments at end of period |
|
$ |
6,046 |
|
$ |
4,808 |
|
$ |
1,238 |
|
$ |
— |
|
|
|
1 Represents Caterpillar Inc. and its subsidiaries with Financial Products accounted for on the equity basis.
2 Elimination of Financial Products’ profit after tax due to equity method of accounting.
3 Elimination of non-cash adjustment for the undistributed earnings from Financial Products.
4 Elimination of non-cash adjustments and changes in assets and liabilities related to consolidated reporting.
5 Reclassification of Financial Products’ cash flow activity from investing to operating for receivables that arose from the sale of inventory.
6 Elimination of net proceeds and payments to/from Machinery, Energy & Transportation and Financial Products.
7 Elimination of dividend from Financial Products to Machinery, Energy & Transportation.
8 Elimination of proceeds received from Financial Products related to Machinery, Energy & Transportation’s sale of businesses and investments.
Caterpillar Inc.
Supplemental Data for Cash Flow
For the Nine Months Ended September 30, 2014
(Unaudited)
(Millions of dollars)
|
|
|
|
|
Supplemental Consolidating Data |
|
|
| ||||||||
|
|
|
|
|
Machinery, |
|
|
|
|
|
|
| ||||
|
|
|
Consolidated |
|
Energy & |
|
Financial |
|
Consolidating |
|
|
| ||||
|
Cash flow from operating activities: |
|
|
|
|
|
|
|
|
|
|
| ||||
|
Profit of consolidated and affiliated companies |
|
$ |
2,948 |
|
$ |
2,941 |
|
$ |
505 |
|
$ |
(498 |
) |
2 |
|
|
Adjustments for non-cash items: |
|
|
|
|
|
|
|
|
|
|
| ||||
|
Depreciation and amortization |
|
2,368 |
|
1,685 |
|
683 |
|
— |
|
|
| ||||
|
Undistributed profit of Financial Products |
|
— |
|
(233 |
) |
— |
|
233 |
|
3 |
| ||||
|
Other |
|
327 |
|
240 |
|
(94 |
) |
181 |
|
4 |
| ||||
|
Changes in assets and liabilities, net of acquisitions and divestitures: |
|
|
|
|
|
|
|
|
|
|
| ||||
|
Receivables - trade and other |
|
393 |
|
672 |
|
27 |
|
(306 |
) |
4,5 |
| ||||
|
Inventories |
|
(859 |
) |
(849 |
) |
— |
|
(10 |
) |
4 |
| ||||
|
Accounts payable |
|
518 |
|
508 |
|
(51 |
) |
61 |
|
4 |
| ||||
|
Accrued expenses |
|
(44 |
) |
18 |
|
(62 |
) |
— |
|
|
| ||||
|
Accrued wages, salaries and employee benefits |
|
648 |
|
646 |
|
2 |
|
— |
|
|
| ||||
|
Customer advances |
|
(132 |
) |
(132 |
) |
— |
|
— |
|
|
| ||||
|
Other assets - net |
|
(104 |
) |
(94 |
) |
(21 |
) |
11 |
|
4 |
| ||||
|
Other liabilities - net |
|
123 |
|
(18 |
) |
152 |
|
(11 |
) |
4 |
| ||||
|
Net cash provided by (used for) operating activities |
|
6,186 |
|
5,384 |
|
1,141 |
|
(339 |
) |
|
| ||||
|
Cash flow from investing activities: |
|
|
|
|
|
|
|
|
|
|
| ||||
|
Capital expenditures - excluding equipment leased to others |
|
(1,072 |
) |
(1,063 |
) |
(9 |
) |
— |
|
|
| ||||
|
Expenditures for equipment leased to others |
|
(1,310 |
) |
(70 |
) |
(1,286 |
) |
46 |
|
4 |
| ||||
|
Proceeds from disposals of leased assets and property, plant and equipment |
|
681 |
|
61 |
|
626 |
|
(6 |
) |
4 |
| ||||
|
Additions to finance receivables |
|
(8,464 |
) |
— |
|
(10,777 |
) |
2,313 |
|
5,8 |
| ||||
|
Collections of finance receivables |
|
7,264 |
|
— |
|
9,280 |
|
(2,016 |
) |
5 |
| ||||
|
Net intercompany purchased receivables |
|
— |
|
— |
|
246 |
|
(246 |
) |
5 |
| ||||
|
Proceeds from sale of finance receivables |
|
154 |
|
— |
|
157 |
|
(3 |
) |
5 |
| ||||
|
Net intercompany borrowings |
|
— |
|
— |
|
1 |
|
(1 |
) |
6 |
| ||||
|
Investments and acquisitions (net of cash acquired) |
|
(18 |
) |
(18 |
) |
— |
|
— |
|
|
| ||||
|
Proceeds from sale of businesses and investments (net of cash sold) |
|
196 |
|
210 |
|
— |
|
(14 |
) |
8 |
| ||||
|
Proceeds from sale of securities |
|
347 |
|
21 |
|
326 |
|
— |
|
|
| ||||
|
Investments in securities |
|
(769 |
) |
(418 |
) |
(351 |
) |
— |
|
|
| ||||
|
Other - net |
|
(12 |
) |
8 |
|
(20 |
) |
— |
|
|
| ||||
|
Net cash provided by (used for) investing activities |
|
(3,003 |
) |
(1,269 |
) |
(1,807 |
) |
73 |
|
|
| ||||
|
Cash flow from financing activities: |
|
|
|
|
|
|
|
|
|
|
| ||||
|
Dividends paid |
|
(1,197 |
) |
(1,197 |
) |
(265 |
) |
265 |
|
7 |
| ||||
|
Distribution to noncontrolling interests |
|
(7 |
) |
(7 |
) |
— |
|
— |
|
|
| ||||
|
Contribution from noncontrolling interests |
|
2 |
|
2 |
|
— |
|
— |
|
|
| ||||
|
Common stock issued, including treasury shares reissued |
|
218 |
|
218 |
|
— |
|
— |
|
|
| ||||
|
Treasury shares purchased |
|
(4,238 |
) |
(4,238 |
) |
— |
|
— |
|
|
| ||||
|
Excess tax benefit from stock-based compensation |
|
162 |
|
162 |
|
— |
|
— |
|
|
| ||||
|
Net intercompany borrowings |
|
— |
|
(1 |
) |
— |
|
1 |
|
6 |
| ||||
|
Proceeds from debt issued (original maturities greater than three months) |
|
9,103 |
|
1,991 |
|
7,112 |
|
— |
|
|
| ||||
|
Payments on debt (original maturities greater than three months) |
|
(7,893 |
) |
(779 |
) |
(7,114 |
) |
— |
|
|
| ||||
|
Short-term borrowings - net (original maturities three months or less) |
|
791 |
|
— |
|
791 |
|
— |
|
|
| ||||
|
Net cash provided by (used for) financing activities |
|
(3,059 |
) |
(3,849 |
) |
524 |
|
266 |
|
|
| ||||
|
Effect of exchange rate changes on cash |
|
(123 |
) |
(58 |
) |
(65 |
) |
— |
|
|
| ||||
|
Increase (decrease) in cash and short-term investments |
|
1 |
|
208 |
|
(207 |
) |
— |
|
|
| ||||
|
Cash and short-term investments at beginning of period |
|
6,081 |
|
4,597 |
|
1,484 |
|
— |
|
|
| ||||
|
Cash and short-term investments at end of period |
|
$ |
6,082 |
|
$ |
4,805 |
|
$ |
1,277 |
|
$ |
— |
|
|
|
1 Represents Caterpillar Inc. and its subsidiaries with Financial Products accounted for on the equity basis.
2 Elimination of Financial Products’ profit after tax due to equity method of accounting.
3 Elimination of non-cash adjustments for the undistributed earnings from Financial Products.
4 Elimination of non-cash adjustments and changes in assets and liabilities related to consolidated reporting.
5 Reclassification of Financial Products’ cash flow activity from investing to operating for receivables that arose from the sale of inventory.
6 Elimination of net proceeds and payments to/from Machinery, Energy & Transportation and Financial Products.
7 Elimination of dividend from Financial Products to Machinery, Energy & Transportation.
8 Elimination of proceeds received from Financial Products related to Machinery, Energy & Transportation’s sale of portions of the Bucyrus distribution business to Cat dealers.
#
Third-Quarter Financial Release – Discussion Material 22 October 2015 Exhibit 99.2

Certain statements in this presentation relate to future events and expectations and are forward-looking statements within the meaning of the Private Securities Litigation Reform Act of 1995. Words such as “believe,” “estimate,” “will be,” “will,” “would,” “expect,” “anticipate,” “plan,” “project,” “intend,” “could,” “should” or other similar words or expressions often identify forward-looking statements. All statements other than statements of historical fact are forward-looking statements, including, without limitation, statements regarding our outlook, projections, forecasts or trend descriptions. These statements do not guarantee future performance, and we do not undertake to update our forward-looking statements. Caterpillar’s actual results may differ materially from those described or implied in our forward-looking statements based on a number of factors, including, but not limited to: (i) global and regional economic conditions and economic conditions in the industries we serve; (ii) government monetary or fiscal policies and infrastructure spending; (iii) commodity price changes, component price increases, fluctuations in demand for our products or significant shortages of component products; (iv) disruptions or volatility in global financial markets limiting our sources of liquidity or the liquidity of our customers, dealers and suppliers; (v) political and economic risks, commercial instability and events beyond our control in the countries in which we operate; (vi) failure to maintain our credit ratings and potential resulting increases to our cost of borrowing and adverse effects on our cost of funds, liquidity, competitive position and access to capital markets; (vii) our Financial Products segment’s risks associated with the financial services industry; (viii) changes in interest rates or market liquidity conditions; (ix) an increase in delinquencies, repossessions or net losses of Cat Financial’s customers; (x) new regulations or changes in financial services regulations; (xi) a failure to realize, or a delay in realizing, all of the anticipated benefits of our acquisitions, joint ventures or divestitures; (xii) international trade policies and their impact on demand for our products and our competitive position; (xiii) our ability to develop, produce and market quality products that meet our customers’ needs; (xiv) the impact of the highly competitive environment in which we operate on our sales and pricing; (xv) failure to realize all of the anticipated benefits from initiatives to increase our productivity, efficiency and cash flow and to reduce costs; (xvi) additional restructuring costs or a failure to realize anticipated savings or benefits from past or future cost reduction actions; (xvii) inventory management decisions and sourcing practices of our dealers and our OEM customers; (xviii) compliance with environmental laws and regulations; (xix) alleged or actual violations of trade or anti-corruption laws and regulations; (xx) additional tax expense or exposure; (xxi) currency fluctuations; (xxii) our or Cat Financial’s compliance with financial covenants; (xxiii) increased pension plan funding obligations; (xxiv) union disputes or other employee relations issues; (xxv) significant legal proceedings, claims, lawsuits or government investigations; (xxvi) changes in accounting standards; (xxvii) failure or breach of IT security; (xxviii) adverse effects of unexpected events including natural disasters; and (xxix) other factors described in more detail under “Item 1A. Risk Factors” in our Form 10-K filed with the SEC on February 17, 2015 for the year ended December 31, 2014. As referenced in this presentation, our 2015 third quarter financial results contain a reconciliation of Non-GAAP financial information which can be found at the end of this presentation and on our website at www.caterpillar.com/earnings.
Discussion Third-Quarter Results / Outlook – Mike DeWalt Business Review – Doug Oberhelman Segments / Key Industries Actions / Progress
Third-Quarter 2015 Financial Results Lower sales in all regions and for each segment Most significant decline in Energy & Transportation Price realization negative $60 million Lower sales volume was the primary reason for the decline in profit Significant unexpected items in the third quarter of 2015 Adjustment to incentive compensation expense as a result of lowering the 2015 outlook reduced Q3 2015 operating costs by about $70 million, or about $0.09 per share. Currency translation losses on non US$ assets and liabilities and hedging losses combined were about $135 million, or about $0.17 per share in the quarter. Included in the Other Income and Expense line of the P&L, below Operating Profit. Sales and Revenues Profit 3rd Quarter 3rd Quarter 2014 2015 Change Sales and Revenues $ 13.5 Billion $ 11.0 Billion $ (2.5) Billion Profit Per Share $ 1.63 $ 0.62 $ (1.01) Profit Per Share $ 1.72 $ 0.75 $ (0.97) Excluding Restructuring Costs
2015 Outlook Today’s Outlook Update Sales and Revenues Top end about $48 Billion Profit Per Share About $3.70 Profit Per Share About $4.60 Excluding Restructuring Outlook from Second-Quarter Financial Release in July Sales and Revenues About $49 Billion Profit Per Share About $4.70 Profit Per Share About $5.00 Excluding Restructuring In our September 24 release on restructuring, we updated the 2015 outlook for Sales and Revenues to about $48 billion. Updated profit outlook reflects: Lower sales and revenues than expected in July. About $0.17 per share of currency translation and hedging losses from the third quarter. Additional cost reduction and lower incentive compensation. Significantly higher restructuring costs.
Preliminary Outlook for 2016 Sales & Revenues Expect 2016 to be down about 5% from 2015 4th consecutive down year Resource Industries expected to be down about 10% in 2016 but from a very low base. Construction Industries flat to down 5% from 2015. Energy & Transportation down 5% to 10% ... mostly oil & gas, much of that a result of a higher backlog at the start of 2015.
Sales & Revenues Trend – 2012 Peak to 2016 Estimate Down about $20 billion from the peak about 31%. Nearly 2/3 of the decline is from Resource Industries and mostly related to mining. About 10% of the decline is related to currency impacts from a stronger U.S. dollar. Difficult operating environment driven largely by declines in Resource Industries – our most profitable segment in 2012. $- $10 $20 $30 $40 $50 $60 $70 2012 2013 2014 2015 2016 $Billions
Business Review – Key Industries Resource Industries (Mining) Slower growth in developing countries – China in particular – due to weakened commodity prices. Customers have sufficient supply of equipment and have dramatically lowered CAPEX. Order rates for our mining products have declined since 2012. Our sales of mining equipment are far below reasonable replacement levels and below the levels of the financial crisis in 2009. Cyclical, but an attractive business over the long term – substantial aftermarket, fits our business model, declining ore grades mean more material moved over the long term, essential to global growth. We have the broadest product line in the business. Order activity is not signaling improvement ... but, we have seen increasing machine utilization for trucks over the past 3 months.
Business Review – Key Industries Energy & Transportation (Oil & Gas) Oil oversupply from production resurgence in the United States. Worldwide demand growing, but supply continues to outpace demand. Decline in oil prices and investment is impacting Caterpillar most in well servicing and drilling. Substantial order backlog at the end of 2014 supported first-half 2015 sales. That’s behind us now, and second-half sales are lower. 2016 is expected to be more like the second half of 2015. Some decline expected in 2016 for turbines, but not as substantial as the impact on reciprocating engines used in drilling and well servicing – less than 10%. Caterpillar sales related to natural gas aren’t down as much as oil. Gas compression in our turbine business expected to remain strong in 2016 with a supportive backlog. Great long-term business, but cyclical. Substantial aftermarket with critical service requirements fits the Caterpillar business model. Urbanization and a growing middle class in the developing world will continue to increase global energy demand.
Business Review – Key Industries Energy & Transportation (Rail) We have been focused on growth and have built a substantial rail business over the past 10 years. We acquired Progress Rail and EMD as the cornerstones of our rail business. We’ve grown the business organically and through acquisition of smaller rail-related companies. We’ve improved and invested in the business lowered costs and improved quality. 2015 locomotive sales are lower following the 2014 peak. Our Tier IV locomotive is on track for mid-2016 availability, and we have orders. We think rail is a great long-term business. High barriers to entry, long-life products with significant aftermarket and support required. Rail is a cost effective efficient way to move freight, and we believe it has good long-term growth potential and opportunity for us to grow internationally.
Business Review – Key Industries Construction Industries North America – improvement in residential and non-residential construction this year but mostly offset by impact of oil-related construction decline. Latin America – region is weak in general, and our 2015 equipment sales in Brazil are ~60% below 2014. We expect Brazil to remain in recession in 2016. Europe/Africa/Middle East – Europe stable to positive, but CIS is very weak, and the Middle East is suffering from political unrest and low oil prices. Asia/Pacific – the region is weak generally, particularly in China where the industry is near 10 year lows ... and below replacement demand levels. Long term, we think construction has substantial room to grow across the globe – it’s regional but cyclical. All regions of the world are below prior peaks some, substantially. Substantial infrastructure needs virtually everywhere ... including the United States. Better infrastructure is necessary for global growth over the long term.
Operational Progress A tough business climate in our key industries but We’ve improved our machine market position every year since 2010. We’re managing costs to minimize the impact of lower volume. Our decremental operating profit pull through has been in our targeted range as sales have declined from the 2012 peak. Product quality has improved since 2010, and we’ve been on a 13-year safety improvement journey we are an industry leader in safety. Our balance sheet is strong ... ME&T debt-to-capital ratio is currently 37.4%, and we have $6 billion in cash. At the end of 2008, debt-to-capital was 57.5%, and we had less than $3 billion of cash.
A tough business climate in our key industries but ME&T operating cash flow has been strong 3 of our 4 best years in history have been since 2010. Since 2009, we’ve increased the quarterly dividend 83% and repurchased more than $8 billion of stock. The dividend is a priority for Caterpillar ... We’ve paid a quarterly dividend every quarter since 1933 and have increased the annual dividend every year for over 20 years. We did not reduce the dividend during the 2008 / 2009 financial crisis. Our captive finance company has a great business model and is healthy and strong. Key metrics are in line with long-term averages despite weakness in end markets over the past few years. Operational Progress
Taking Action We have and will continue to take action Given current industry weakness, we have sufficient and in some cases too much capacity. That said, our factories are modern, working on Lean and are well positioned to handle more volume with cyclical recovery when it comes. We expect CAPEX this year and in 2016 to be less than half of what it was in 2012. We have already implemented substantial restructuring – 10% of our total production square footage has been consolidated or closed. From the peak in 2012 our total workforce has declined more than 35,000. These actions have generated substantial cost reduction.
Taking Action We have … and will continue to take action Because of the extended downturn in sales … we announced substantial additional restructuring on September 24. We expect about $1.5 billion of annual cost reduction by 2018 with about $750 million of that expected in 2016. Reduction of 4,000-5,000 of our non-production workforce before the end of 2016 with most of that in the fourth quarter of 2015. Workforce reduction of about 10,000 by the end of 2018. About 20 additional facilities consolidated or closed by 2018.

Taking Action for the Future – Lean Journey We are taking action focused on the long term Cost Gross Margin as a Percent of Sales Safety Recordable Injury Frequency Down $4.5 billion from peak, flat turns Built In Quality Defects per Machine Historical Best Great Tier IV Performance Caterpillar Inventory Dollars Improvement despite lower sales in mining and higher depreciation Historical best Industry leader 2010 2015 YTD 23.8% 24.4% 2010 2011 2012 2013 2014 2015 Sep 2010 2011 2012 2013 2014 2015 2010 2011 2012 2013 2014 2015 YTD

Taking Action for the Future We are taking action focused on the long term We’re executing Across the Table with our dealers ... to drive better performance between Caterpillar and our dealers ... better market position, service performance and value to our customers. We’re investing in technology and data analytics both internally and with external partners. It’s a priority even as we reduce costs across the company ... it’s critical for the future.
Non-GAAP Financial Measures We anticipate incurring significant restructuring costs in 2015. We believe it is important to separately quantify the profit per share impact of restructuring costs in order for our third-quarter 2015 results and the 2015 outlook to be meaningful to our readers. We have also provided third-quarter 2014 profit per share excluding restructuring costs comparable to the 2015 presentation. Reconciliation of profit per share excluding restructuring costs to the most directly comparable GAAP measure, profit per share, is as follows: . . 2014 . 2015 Previous 1 . Current 2 Profit per share .. . 1.63 $ 0.62 $ 4.70 $ 3.70 $ Per share restructuring costs . 0.09 $ 0.13 $ 0.30 $ 0.90 $ Profit per share excluding restructuring costs . . 1.72 $ 0.75 $ 5.00 $ 4.60 $ 1 2015 Outlook as of July 23, 2015. Sales and Revenues Outlook of about $49 billion. 2 2015 Outlook as of October 22, 2015. Sales and Revenues Outlook of about $48 billion. 2015 Outlook Third Quarter
Serious News for Serious Traders! Try StreetInsider.com Premium Free!
You May Also Be Interested In
- Stifel Downgrades Caterpillar (CAT) to Hold
- Caterpillar (CAT) Tops Q1 EPS by 46c, Misses on Revenue
- Future Works Announces Official Launch: Unlocking Leaps in Innovation with Bespoke AI Solutions
Create E-mail Alert Related Categories
SEC FilingsSign up for StreetInsider Free!
Receive full access to all new and archived articles, unlimited portfolio tracking, e-mail alerts, custom newswires and RSS feeds - and more!
