Form 8-K C H ROBINSON WORLDWIDE For: Oct 25
UNITED STATES
SECURITIES AND EXCHANGE COMMISSION
WASHINGTON, D.C. 20549
FORM 8-K
CURRENT REPORT
PURSUANT TO SECTION 13 OR 15(d)
OF THE SECURITIES EXCHANGE ACT OF 1934
Date of Report: October 25, 2016
(Date of earliest event reported)
C.H. ROBINSON WORLDWIDE, INC.
(Exact name of registrant as specified in its charter)
Commission File Number: 000-23189
| Delaware | 41-1883630 | |
| (State or other jurisdiction of incorporation) |
(IRS Employer Identification No.) |
14701 Charlson Road, Eden Prairie, MN 55347
(Address of principal executive offices, including zip code)
(952) 937-8500
(Registrant’s telephone number, including area code)
Not Applicable
(Former name or former address, if changed since last report)
Check the appropriate box below if the Form 8-K filing is intended to simultaneously satisfy the filing obligation of the registrant under any of the following provisions:
| ☐ | Written communications pursuant to Rule 425 under the Securities Act (17 CFR 230.425) |
| ☐ | Soliciting material pursuant to Rule 14a-12 under the Exchange Act (17 CFR 240.14a-12) |
| ☐ | Pre-commencement communications pursuant to Rule 14d-2(b) under the Exchange Act (17 CFR 240.14d-2(b)) |
| ☐ | Pre-commencement communications pursuant to Rule 13e-4(c) under the Exchange Act (17 CFR 240.13e-4(c)) |
| Item 2.02. | Results of Operations and Financial Condition. |
The following information is being “furnished” in accordance with General Instruction B.2 of Form 8-K and shall not be deemed “filed” for purposes of Section 18 of the Securities Exchange Act of 1934, as amended (the “Exchange Act”), or otherwise subject to the liabilities of that section, nor shall it be deemed to be incorporated by reference in any filing under the Securities Act of 1933, as amended, or the Exchange Act, except as expressly set forth by specific reference in such filing.
Furnished herewith as Exhibits 99.1 and 99.2, respectively, and incorporated by reference herein are the text of C.H. Robinson Worldwide, Inc.’s announcement regarding its financial results for the quarter ended September 30, 2016 and its earnings conference call slides.
| Item 9.01 | Financial Statements and Exhibits. |
| (d) | Exhibits. |
| 99.1 | Press Release dated October 25, 2016 of C.H. Robinson Worldwide, Inc. | |
| 99.2 | Earnings conference call slides dated October 26, 2016. | |
SIGNATURE
Pursuant to the requirements of the Securities Exchange Act of 1934, the registrant has duly caused this report to be signed on its behalf by the undersigned hereunto duly authorized.
| C.H. ROBINSON WORLDWIDE, INC. | ||
| By: | /s/ Ben G. Campbell | |
| Ben G. Campbell Chief Legal Officer and Secretary | ||
Date: October 25, 2016
EXHIBIT INDEX
| 99.1 | Press Release dated October 25, 2016 of C.H. Robinson Worldwide, Inc. | |
| 99.2 | Earnings conference call slides dated October 26, 2016. | |
Exhibit 99.1
C.H. Robinson Worldwide, Inc.
14701 Charlson Road
Eden Prairie, Minnesota 55347
Andrew Clarke, Chief Financial Officer (952) 683-3474
Tim Gagnon, Director, Investor Relations (952) 683-5007
FOR IMMEDIATE RELEASE
C.H. ROBINSON REPORTS THIRD QUARTER RESULTS
MINNEAPOLIS, October 25, 2016 – C.H. Robinson Worldwide, Inc. (“C.H. Robinson”) (NASDAQ: CHRW), today reported financial results for the quarter ended September 30, 2016. Summarized financial results are as follows (dollars in thousands, except per share data):
| Three months ended September 30, | Nine months ended September 30, | |||||||||||||||||||||||
| 2016 | 2015 | % change |
2016 | 2015 | % change |
|||||||||||||||||||
| Total revenues |
$ | 3,355,754 | $ | 3,419,253 | -1.9 | % | $ | 9,729,438 | $ | 10,265,231 | -5.2 | % | ||||||||||||
| Net revenues: |
||||||||||||||||||||||||
| Transportation |
||||||||||||||||||||||||
| Truckload |
$ | 309,027 | $ | 344,715 | -10.4 | % | $ | 960,451 | $ | 977,641 | -1.8 | % | ||||||||||||
| LTL |
96,447 | 94,190 | 2.4 | % | 287,518 | 271,084 | 6.1 | % | ||||||||||||||||
| Intermodal |
7,676 | 10,168 | -24.5 | % | 25,961 | 32,219 | -19.4 | % | ||||||||||||||||
| Ocean |
56,506 | 58,322 | -3.1 | % | 175,243 | 167,578 | 4.6 | % | ||||||||||||||||
| Air |
19,897 | 20,248 | -1.7 | % | 58,424 | 60,483 | -3.4 | % | ||||||||||||||||
| Customs |
12,320 | 12,012 | 2.6 | % | 34,649 | 33,248 | 4.2 | % | ||||||||||||||||
| Other logistics services |
26,771 | 20,436 | 31.0 | % | 76,965 | 61,331 | 25.5 | % | ||||||||||||||||
|
|
|
|
|
|
|
|
|
|||||||||||||||||
| Total transportation |
528,644 | 560,091 | -5.6 | % | 1,619,211 | 1,603,584 | 1.0 | % | ||||||||||||||||
| Sourcing |
29,818 | 28,484 | 4.7 | % | 96,801 | 94,119 | 2.8 | % | ||||||||||||||||
|
|
|
|
|
|
|
|
|
|||||||||||||||||
| Total net revenues |
558,462 | 588,575 | -5.1 | % | 1,716,012 | 1,697,703 | 1.1 | % | ||||||||||||||||
| Operating expenses |
347,195 | 355,864 | -2.4 | % | 1,072,046 | 1,053,972 | 1.7 | % | ||||||||||||||||
|
|
|
|
|
|
|
|
|
|||||||||||||||||
| Operating income |
211,267 | 232,711 | -9.2 | % | 643,966 | 643,731 | 0.0 | % | ||||||||||||||||
| Net income |
$ | 129,028 | $ | 139,432 | -7.5 | % | $ | 391,081 | $ | 383,116 | 2.1 | % | ||||||||||||
|
|
|
|
|
|
|
|
|
|||||||||||||||||
| Diluted EPS |
$ | 0.90 | $ | 0.96 | -6.2 | % | $ | 2.73 | $ | 2.63 | 3.8 | % | ||||||||||||
“We expected a challenging pricing environment in 2016 as shippers focus on reducing their transportation costs. Despite the decrease in some of our key financial metrics in the third quarter, we feel confident that we are making good progress on our long-term plans,” said John Wiehoff, CEO and Chairman. “We are adapting to the market conditions by achieving profitable volume growth and continuing to focus on improving our customers’ supply chain outcomes.”
Our truckload net revenues decreased 10.4 percent in the third quarter of 2016 compared to the third quarter of 2015. Our total truckload volumes increased approximately 7.5 percent in the third quarter of 2016 compared to the third quarter of 2015. North American truckload volumes also increased approximately 7.5 percent over the same period. Our truckload net revenue margin decreased in the third quarter of 2016 compared to the third quarter of 2015, due primarily to lower customer pricing. In North America, excluding the estimated impacts of the change in fuel prices, our average truckload rate per mile charged to our customers decreased approximately 5.5 percent in the third quarter of 2016 compared to the third quarter of 2015. In North America, our truckload transportation costs decreased approximately 3.5 percent, excluding the estimated impacts of the change in fuel prices.
(more)
C.H. Robinson Worldwide, Inc.
October 25, 2016
Page 2
Our less than truckload (“LTL”) net revenues increased 2.4 percent in the third quarter of 2016 compared to the third quarter of 2015. LTL volumes increased approximately 4.5 percent in the third quarter of 2016 compared to the third quarter of 2015. Net revenue margin decreased slightly in the third quarter of 2016 compared to the third quarter of 2015.
Our intermodal net revenues decreased 24.5 percent in the third quarter of 2016 compared to the third quarter of 2015. This was primarily due to net revenue margin declines. During the third quarter of 2016, intermodal opportunities were negatively impacted by the alternative lower cost truck market.
Our ocean transportation net revenues decreased 3.1 percent in the third quarter of 2016 compared to the third quarter of 2015. The decrease in net revenues was primarily due to higher cost of capacity and pressured margins on fixed price business, resulting primarily from the Hanjin Shipping Co. bankruptcy.
Our air transportation net revenues decreased 1.7 percent in the third quarter of 2016 compared to the third quarter of 2015. The decrease was due to decreased net revenue margin, offset partially by increased volumes.
Our customs net revenues increased 2.6 percent in the third quarter of 2016 compared to the third quarter of 2015. The increase was primarily due to increased transaction volumes.
Our other logistics services net revenues, which includes managed services, warehousing, and small parcel, increased 31.0 percent in the third quarter of 2016 compared to the third quarter of 2015 primarily from growth in managed services.
Sourcing net revenues increased 4.7 percent in the third quarter of 2016 compared to the third quarter of 2015. This increase was primarily due to a case volume increase across a variety of commodities and services, partially offset by a decrease in net revenue per case.
For the third quarter, operating expenses decreased 2.4 percent to $347.2 million in 2016 from $355.9 million in 2015. Operating expenses as a percentage of net revenues increased to 62.2 percent in the third quarter of 2016 from 60.5 percent in the third quarter of 2015.
For the third quarter, personnel expenses decreased 2.7 percent to $256.9 million in 2016 from $264.1 million in 2015. For the third quarter, our average headcount grew 4.5 percent compared to the third quarter of 2015. The decrease in personnel expense was due to decreased expenses related to incentive plans that are designed to keep expenses variable with changes in net revenues and profitability, partially offset by the increase in average headcount.
For the third quarter, other selling, general, and administrative expenses decreased 1.6 percent to $90.3 million in 2016 from $91.8 million in 2015. This was primarily due to a decrease in claims and the allowance for doubtful accounts, partially offset by increases in other areas.
As previously announced, we acquired APC Logistics, a provider of freight forwarding and customs brokerage services in Australia and New Zealand. The acquisition was completed at the close of business on September 30, 2016. The $229 million acquisition expands our global presence and brings additional capabilities and expertise to our portfolio. APC Logistics employs approximately 300 people and has seven offices in Australia and two offices in New Zealand.
(more)
C.H. Robinson Worldwide, Inc.
October 25, 2016
Page 3
About C.H. Robinson
At C.H. Robinson, we believe in accelerating global trade to seamlessly deliver the products and goods that drive the world’s economy. Using the strengths of our knowledgeable people, proven processes and global technology, we help our customers work smarter, not harder. As one of the world’s largest third-party logistics providers (3PL), we provide a broad portfolio of logistics services, fresh produce sourcing and Managed Services for more than 110,000 customers and 68,000 contract carriers through our integrated network of offices and more than 14,000 employees. In addition, the company, our Foundation and our employees contribute millions of dollars annually to a variety of organizations. Headquartered in Eden Prairie, Minnesota, C.H. Robinson (CHRW) has been publicly traded on the NASDAQ since 1997. For more information, visit http://www.chrobinson.com or view our company video at https://www.chrobinson.com/en/us/About-Us/.
Except for the historical information contained herein, the matters set forth in this release are forward-looking statements that represent our expectations, beliefs, intentions or strategies concerning future events. These forward-looking statements are subject to certain risks and uncertainties that could cause actual results to differ materially from our historical experience or our present expectations, including, but not limited to such factors as changes in economic conditions, including uncertain consumer demand; changes in market demand and pressures on the pricing for our services; competition and growth rates within the third party logistics industry; freight levels and increasing costs and availability of truck capacity or alternative means of transporting freight, and changes in relationships with existing truck, rail, ocean and air carriers; changes in our customer base due to possible consolidation among our customers; our ability to integrate the operations of acquired companies with our historic operations successfully; risks associated with litigation and insurance coverage; risks associated with operations outside of the U.S.; risks associated with the potential impacts of changes in government regulations; risks associated with the produce industry, including food safety and contamination issues; fuel prices and availability; the impact of war on the economy; and other risks and uncertainties detailed in our Annual and Quarterly Reports.
Any forward-looking statement speaks only as of the date on which such statement is made, and we undertake no obligation to update such statement to reflect events or circumstances arising after such date. All remarks made during our financial results conference call will be current at the time of the call and we undertake no obligation to update the replay.
Conference Call Information:
C.H. Robinson Worldwide Third Quarter 2016 Earnings Conference Call
Wednesday, October 26, 2016 8:30 a.m. Eastern Time
The call will be limited to 60 minutes, including questions and answers. We invite call participants to submit questions in advance of the conference call and we will respond to as many of the questions as we can in the time allowed. To submit your question(s) in advance of the call, please email [email protected].
Presentation slides and a simultaneous live audio webcast of the conference call may be accessed through the Investor Relations link on C.H. Robinson’s website at www.chrobinson.com.
To participate in the conference call by telephone, please call ten minutes early by dialing: 877-269-7756
International callers dial +1-201-689-7817
Callers should reference the conference ID, which is 13646518
Webcast replay available through Investor Relations link at www.chrobinson.com
Telephone audio replay available until 11:30 a.m. Eastern Time on November 2, 2016: 877-660-6853;
passcode: 13646518#
International callers dial +1-201-612-7415
(more)
C.H. Robinson Worldwide, Inc.
October 25, 2016
Page 4
CONDENSED CONSOLIDATED STATEMENTS OF INCOME
(unaudited, in thousands, except per share data)
| Three months ended September 30, |
Nine months ended September 30, |
|||||||||||||||
| 2016 | 2015 | 2016 | 2015 | |||||||||||||
| Revenues: |
||||||||||||||||
| Transportation |
$ | 2,998,583 | $ | 3,044,500 | $ | 8,593,767 | $ | 9,122,479 | ||||||||
| Sourcing |
357,171 | 374,753 | 1,135,671 | 1,142,752 | ||||||||||||
|
|
|
|
|
|
|
|
|
|||||||||
| Total revenues |
3,355,754 | 3,419,253 | 9,729,438 | 10,265,231 | ||||||||||||
|
|
|
|
|
|
|
|
|
|||||||||
| Costs and expenses: |
||||||||||||||||
| Purchased transportation and related services |
2,469,939 | 2,484,409 | 6,974,556 | 7,518,895 | ||||||||||||
| Purchased products sourced for resale |
327,353 | 346,269 | 1,038,870 | 1,048,633 | ||||||||||||
| Personnel expenses |
256,883 | 264,077 | 804,631 | 783,220 | ||||||||||||
| Other selling, general, and administrative expenses |
90,312 | 91,787 | 267,415 | 270,752 | ||||||||||||
|
|
|
|
|
|
|
|
|
|||||||||
| Total costs and expenses |
3,144,487 | 3,186,542 | 9,085,472 | 9,621,500 | ||||||||||||
|
|
|
|
|
|
|
|
|
|||||||||
| Income from operations |
211,267 | 232,711 | 643,966 | 643,731 | ||||||||||||
|
|
|
|
|
|
|
|
|
|||||||||
| Interest and other expense |
(7,426 | ) | (6,559 | ) | (22,463 | ) | (22,058 | ) | ||||||||
|
|
|
|
|
|
|
|
|
|||||||||
| Income before provision for income taxes |
203,841 | 226,152 | 621,503 | 621,673 | ||||||||||||
| Provisions for income taxes |
74,813 | 86,720 | 230,422 | 238,557 | ||||||||||||
|
|
|
|
|
|
|
|
|
|||||||||
| Net income |
$ | 129,028 | $ | 139,432 | $ | 391,081 | $ | 383,116 | ||||||||
|
|
|
|
|
|
|
|
|
|||||||||
| Net income per share (basic) |
$ | 0.90 | $ | 0.96 | $ | 2.73 | $ | 2.63 | ||||||||
| Net income per share (diluted) |
$ | 0.90 | $ | 0.96 | $ | 2.73 | $ | 2.63 | ||||||||
| Weighted average shares outstanding (basic) |
142,611 | 144,578 | 143,040 | 145,423 | ||||||||||||
| Weighted average shares outstanding (diluted) |
142,883 | 144,782 | 143,245 | 145,601 | ||||||||||||
(more)
C.H. Robinson Worldwide, Inc.
October 25, 2016
Page 5
CONDENSED CONSOLIDATED BALANCE SHEETS
(unaudited, in thousands)
| September 30, 2016 |
December 31, 2015 |
|||||||
| Assets |
||||||||
| Current assets: |
||||||||
| Cash and cash equivalents |
$ | 224,449 | $ | 168,229 | ||||
| Receivables, net |
1,682,686 | 1,505,620 | ||||||
| Other current assets |
60,414 | 56,849 | ||||||
|
|
|
|
|
|||||
| Total current assets |
1,967,549 | 1,730,698 | ||||||
| Property and equipment, net |
226,470 | 190,874 | ||||||
| Intangible and other assets |
1,470,043 | 1,262,786 | ||||||
|
|
|
|
|
|||||
| Total assets |
$ | 3,664,062 | $ | 3,184,358 | ||||
|
|
|
|
|
|||||
| Liabilities and stockholders’ investment |
||||||||
| Current liabilities: |
||||||||
| Accounts payable and outstanding checks |
$ | 897,694 | $ | 783,883 | ||||
| Accrued compensation |
95,572 | 146,666 | ||||||
| Accrued income taxes |
10,753 | 12,573 | ||||||
| Other accrued expenses |
70,779 | 55,475 | ||||||
| Current portion of debt |
725,000 | 450,000 | ||||||
|
|
|
|
|
|||||
| Total current liabilities |
1,799,798 | 1,448,597 | ||||||
| Noncurrent income taxes payable |
18,843 | 19,634 | ||||||
| Deferred tax liabilities |
75,531 | 65,460 | ||||||
| Long-term debt |
500,000 | 500,000 | ||||||
| Other long term liabilities |
223 | 217 | ||||||
|
|
|
|
|
|||||
| Total liabilities |
2,394,395 | 2,033,908 | ||||||
| Total stockholders’ investment |
1,269,667 | 1,150,450 | ||||||
|
|
|
|
|
|||||
| Total liabilities and stockholders’ investment |
$ | 3,664,062 | $ | 3,184,358 | ||||
|
|
|
|
|
|||||
(more)
C.H. Robinson Worldwide, Inc.
October 25, 2016
Page 6
CONDENSED CONSOLIDATED STATEMENTS OF CASH FLOWS
(unaudited, in thousands, except operational data)
| Nine months ended September 30, |
||||||||
| 2016 | 2015 | |||||||
| Operating activities: |
||||||||
| Net income |
$ | 391,081 | $ | 383,116 | ||||
| Stock-based compensation |
30,626 | 43,512 | ||||||
| Depreciation and amortization |
52,716 | 49,513 | ||||||
| Provision for doubtful accounts |
2,738 | 11,975 | ||||||
| Deferred income taxes |
21,832 | (8,356 | ) | |||||
| Other |
566 | 459 | ||||||
| Changes in operating elements, net of acquisitions: |
||||||||
| Receivables |
(137,813 | ) | (39,051 | ) | ||||
| Prepaid expenses and other |
(12,148 | ) | (6,347 | ) | ||||
| Other non-current assets |
(2,793 | ) | 124 | |||||
| Accounts payable and outstanding checks |
93,510 | 23,037 | ||||||
| Accrued compensation and profit-sharing contribution |
(50,105 | ) | (3,585 | ) | ||||
| Accrued income taxes |
(3,159 | ) | 17,774 | |||||
| Other accrued liabilities |
(10,223 | ) | (7,728 | ) | ||||
|
|
|
|
|
|||||
| Net cash provided by operating activities |
376,828 | 464,443 | ||||||
| Investing activities: |
||||||||
| Purchases of property and equipment |
(56,125 | ) | (19,317 | ) | ||||
| Purchases and development of software |
(14,986 | ) | (13,494 | ) | ||||
| Restricted cash |
— | 359,388 | ||||||
| Acquisitions, net of cash |
(220,203 | ) | (367,108 | ) | ||||
| Other |
(735 | ) | 535 | |||||
|
|
|
|
|
|||||
| Net cash used for investing activities |
(292,049 | ) | (39,996 | ) | ||||
| Financing activities: |
||||||||
| Borrowings on line of credit |
4,415,000 | 5,508,000 | ||||||
| Repayments on line of credit |
(4,140,000 | ) | (5,583,000 | ) | ||||
| Net repurchases of common stock |
(129,302 | ) | (159,059 | ) | ||||
| Excess tax benefit on stock-based compensation |
17,207 | 7,298 | ||||||
| Cash dividends |
(191,129 | ) | (171,448 | ) | ||||
|
|
|
|
|
|||||
| Net cash used for financing activities |
(28,224 | ) | (398,209 | ) | ||||
| Effect of exchange rates on cash |
(335 | ) | (12,091 | ) | ||||
|
|
|
|
|
|||||
| Net change in cash and cash equivalents |
56,220 | 14,147 | ||||||
| Cash and cash equivalents, beginning of period |
168,229 | 128,940 | ||||||
|
|
|
|
|
|||||
| Cash and cash equivalents, end of period |
$ | 224,449 | $ | 143,087 | ||||
|
|
|
|
|
|||||
| As of September 30, | ||||||||
| 2016 | 2015 | |||||||
| Operational Data: |
||||||||
| Employees (1) |
14,023 | 13,156 | ||||||
(1) Includes 313 APC Logistics employees added on September 30, 2016
###

Earnings Conference Call – Third Quarter 2016 October 26, 2016 John Wiehoff, Chairman & CEO Andrew Clarke, CFO Tim Gagnon, Director, Investor Relations Exhibit 99.2
Safe Harbor Statement Except for the historical information contained herein, the matters set forth in this presentation and the accompanying earnings release are forward-looking statements that represent our expectations, beliefs, intentions or strategies concerning future events. These forward-looking statements are subject to certain risks and uncertainties that could cause actual results to differ materially from our historical experience or our present expectations, including, but not limited to such factors as changes in economic conditions, including uncertain consumer demand; changes in market demand and pressures on the pricing for our services; competition and growth rates within the third party logistics industry; freight levels and increasing costs and availability of truck capacity or alternative means of transporting freight, and changes in relationships with existing truck, rail, ocean and air carriers; changes in our customer base due to possible consolidation among our customers; our ability to integrate the operations of acquired companies with our historic operations successfully; risks associated with litigation and insurance coverage; risks associated with operations outside of the U.S.; risks associated with the potential impacts of changes in government regulations; risks associated with the produce industry, including food safety and contamination issues; fuel prices and availability; changes to our share repurchase activity; the impact of war on the economy; and other risks and uncertainties detailed in our Annual and Quarterly Reports. 2
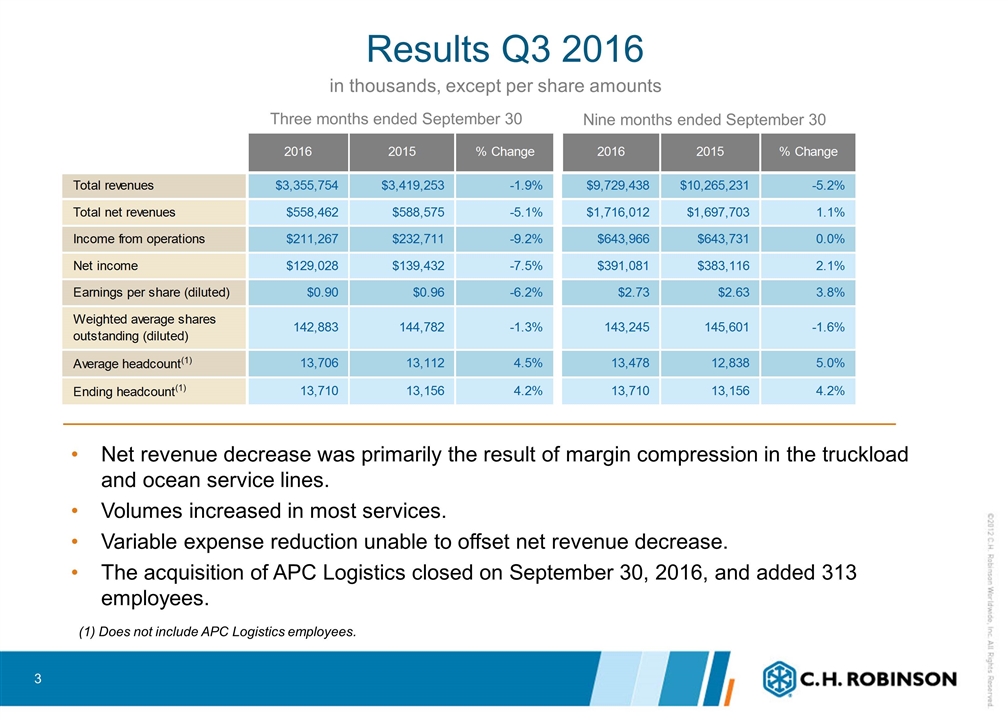
Results Q3 2016 Three months ended September 30 in thousands, except per share amounts Nine months ended September 30 Net revenue decrease was primarily the result of margin compression in the truckload and ocean service lines. Volumes increased in most services. Variable expense reduction unable to offset net revenue decrease. The acquisition of APC Logistics closed on September 30, 2016, and added 313 employees. 3 (1) Does not include APC Logistics employees.
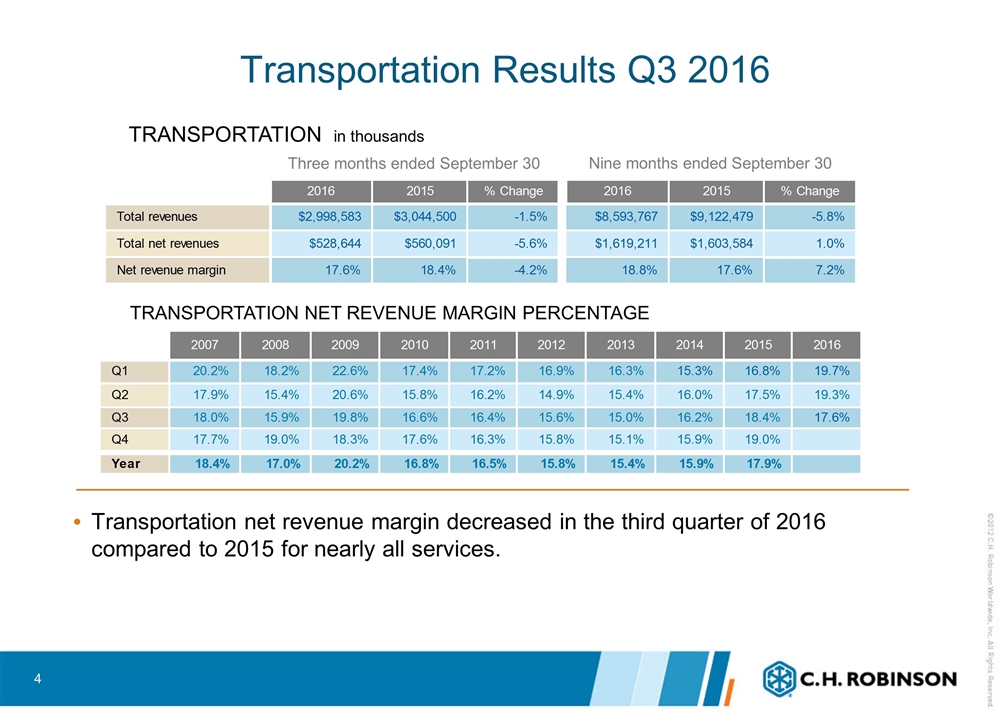
Transportation Results Q3 2016 Three months ended September 30 TRANSPORTATION in thousands TRANSPORTATION NET REVENUE MARGIN PERCENTAGE Nine months ended September 30 Transportation net revenue margin decreased in the third quarter of 2016 compared to 2015 for nearly all services. 4
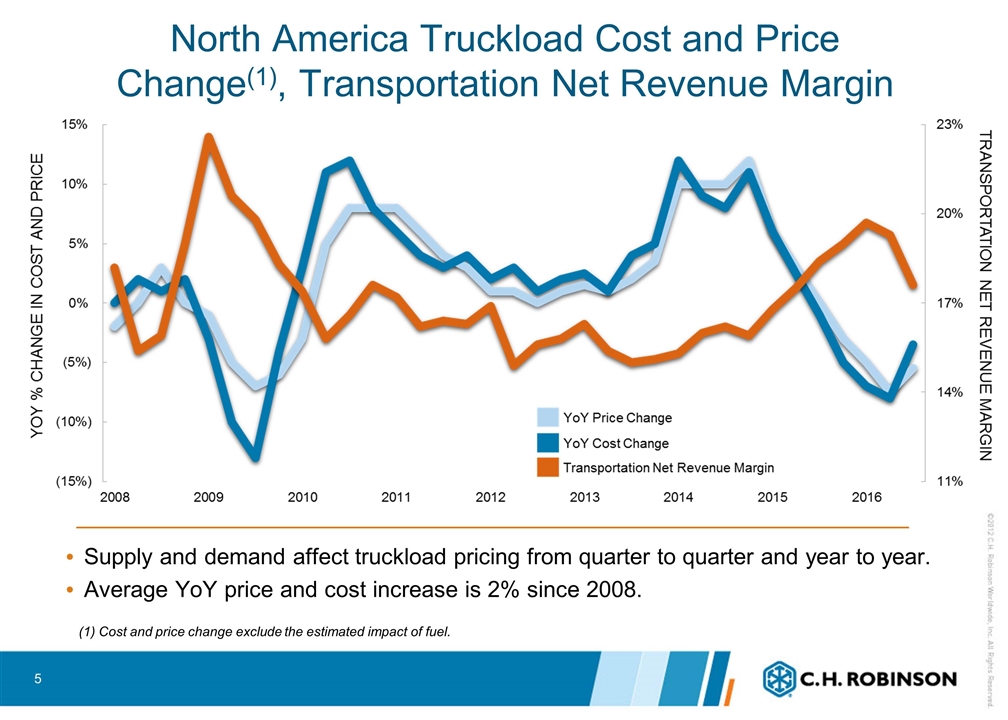
North America Truckload Cost and Price Change(1), Transportation Net Revenue Margin Supply and demand affect truckload pricing from quarter to quarter and year to year. Average YoY price and cost increase is 2% since 2008. (1) Cost and price change exclude the estimated impact of fuel. 5
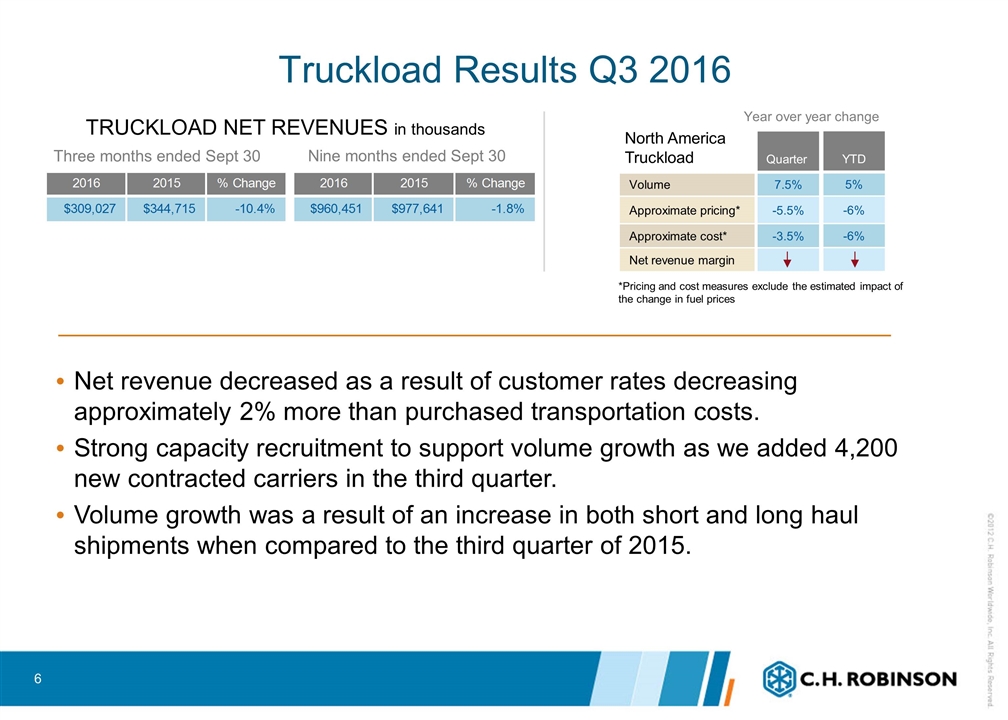
Truckload Results Q3 2016 Three months ended Sept 30 TRUCKLOAD NET REVENUES in thousands Net revenue decreased as a result of customer rates decreasing approximately 2% more than purchased transportation costs. Strong capacity recruitment to support volume growth as we added 4,200 new contracted carriers in the third quarter. Volume growth was a result of an increase in both short and long haul shipments when compared to the third quarter of 2015. Nine months ended Sept 30 Year over year change *Pricing and cost measures exclude the estimated impact of the change in fuel prices Quarter Volume 7.5% Approximate pricing* -5.5% Approximate cost* -3.5% Net revenue margin YTD 5% -6% -6% North America Truckload 6
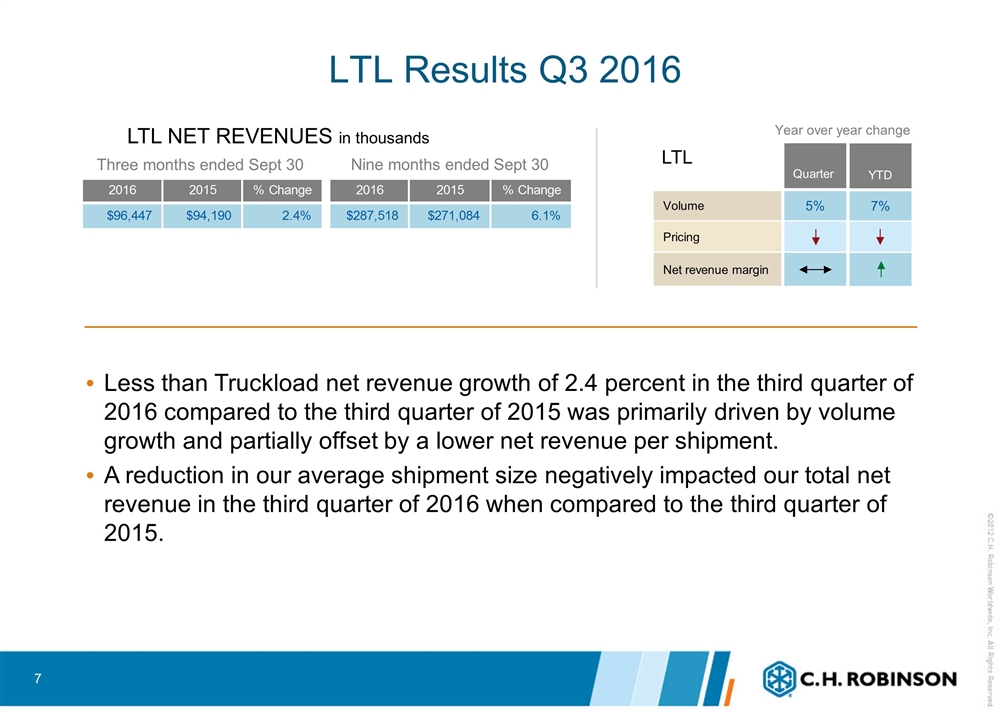
LTL Results Q3 2016 Three months ended Sept 30 LTL NET REVENUES in thousands LTL Year over year change Quarter Volume 5% Pricing Net revenue margin Nine months ended Sept 30 YTD 7% Less than Truckload net revenue growth of 2.4 percent in the third quarter of 2016 compared to the third quarter of 2015 was primarily driven by volume growth and partially offset by a lower net revenue per shipment. A reduction in our average shipment size negatively impacted our total net revenue in the third quarter of 2016 when compared to the third quarter of 2015. 7
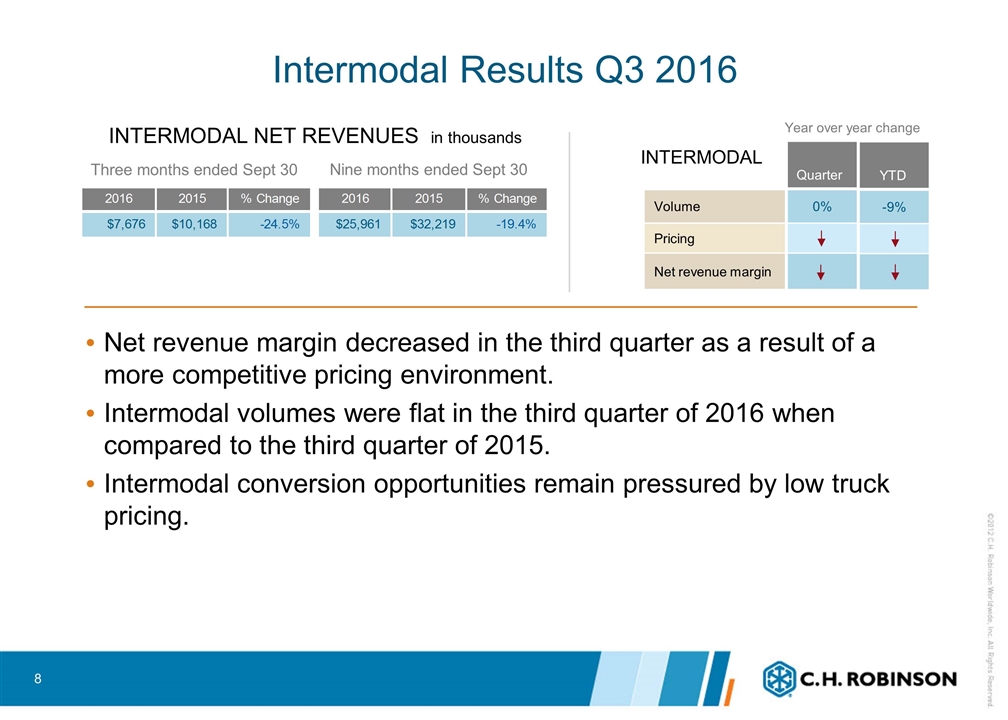
Intermodal Results Q3 2016 Three months ended Sept 30 INTERMODAL NET REVENUES in thousands Year over year change INTERMODAL Quarter Volume 0% Pricing Net revenue margin Nine months ended Sept 30 YTD -9% Net revenue margin decreased in the third quarter as a result of a more competitive pricing environment. Intermodal volumes were flat in the third quarter of 2016 when compared to the third quarter of 2015. Intermodal conversion opportunities remain pressured by low truck pricing. 8
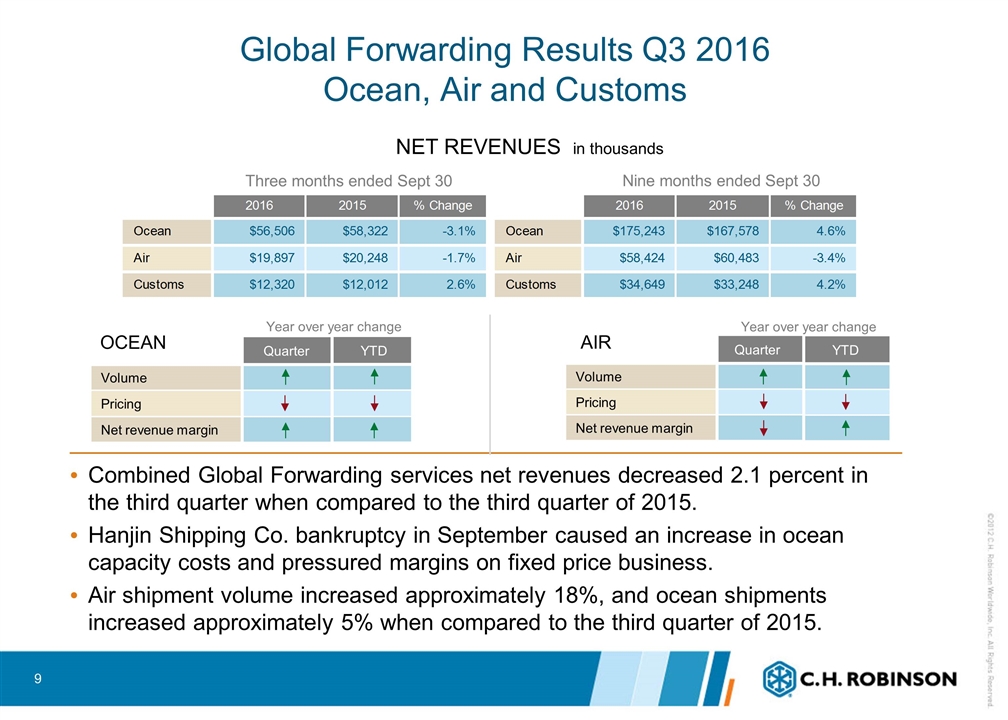
Global Forwarding Results Q3 2016 Ocean, Air and Customs Three months ended Sept 30 NET REVENUES in thousands Quarter Volume Pricing Net revenue margin OCEAN Quarter Volume Pricing Net revenue margin AIR Year over year change Year over year change Nine months ended Sept 30 YTD YTD Combined Global Forwarding services net revenues decreased 2.1 percent in the third quarter when compared to the third quarter of 2015. Hanjin Shipping Co. bankruptcy in September caused an increase in ocean capacity costs and pressured margins on fixed price business. Air shipment volume increased approximately 18%, and ocean shipments increased approximately 5% when compared to the third quarter of 2015. 9
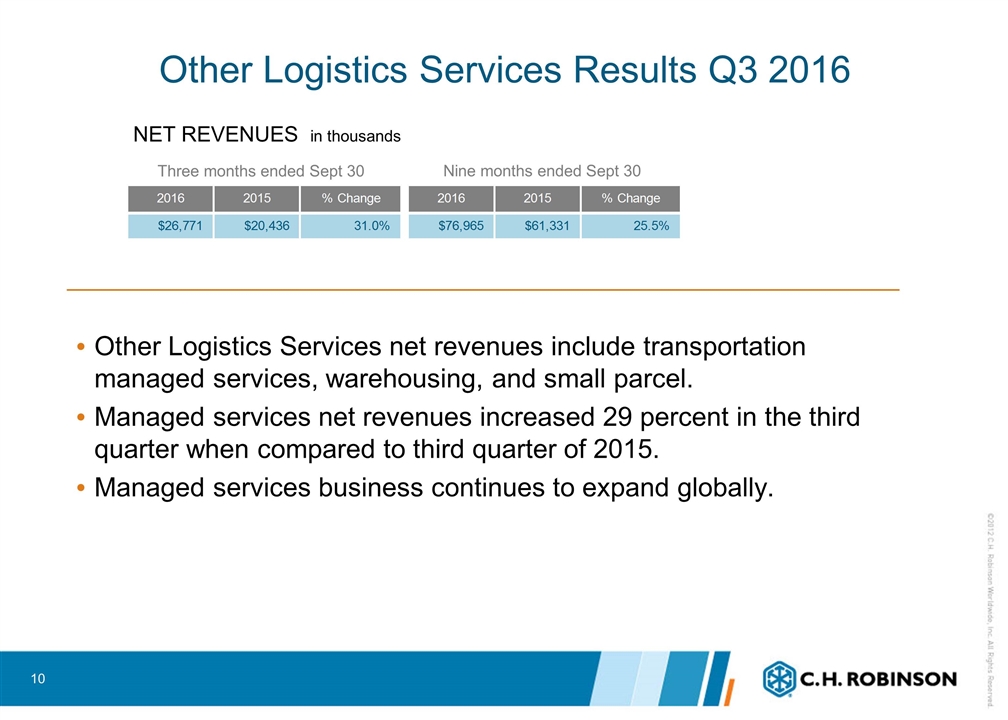
Other Logistics Services Results Q3 2016 Three months ended Sept 30 NET REVENUES in thousands Nine months ended Sept 30 Other Logistics Services net revenues include transportation managed services, warehousing, and small parcel. Managed services net revenues increased 29 percent in the third quarter when compared to third quarter of 2015. Managed services business continues to expand globally. 10
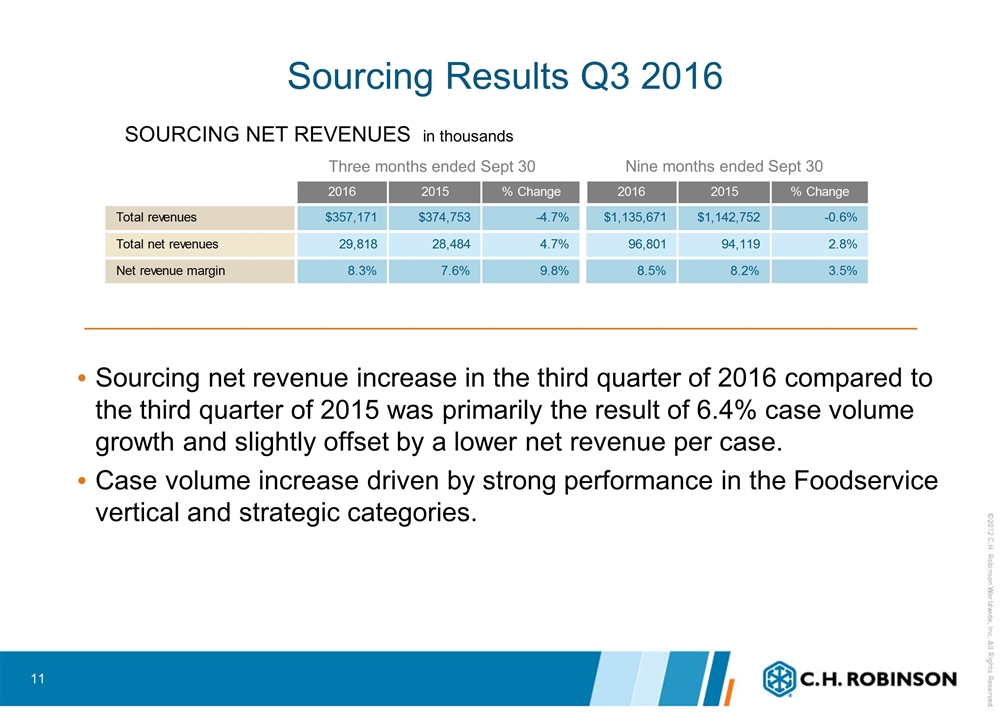
Sourcing Results Q3 2016 Three months ended Sept 30 SOURCING NET REVENUES in thousands Nine months ended Sept 30 Sourcing net revenue increase in the third quarter of 2016 compared to the third quarter of 2015 was primarily the result of 6.4% case volume growth and slightly offset by a lower net revenue per case. Case volume increase driven by strong performance in the Foodservice vertical and strategic categories. 11
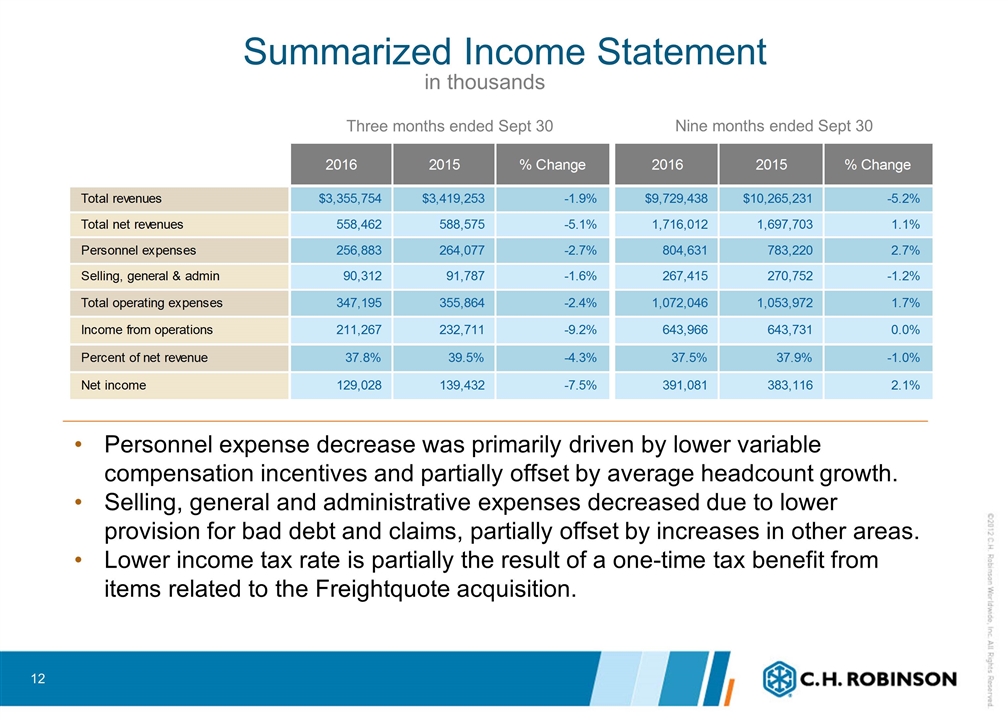
in thousands Summarized Income Statement Three months ended Sept 30 Nine months ended Sept 30 Personnel expense decrease was primarily driven by lower variable compensation incentives and partially offset by average headcount growth. Selling, general and administrative expenses decreased due to lower provision for bad debt and claims, partially offset by increases in other areas. Lower income tax rate is partially the result of a one-time tax benefit from items related to the Freightquote acquisition. 12
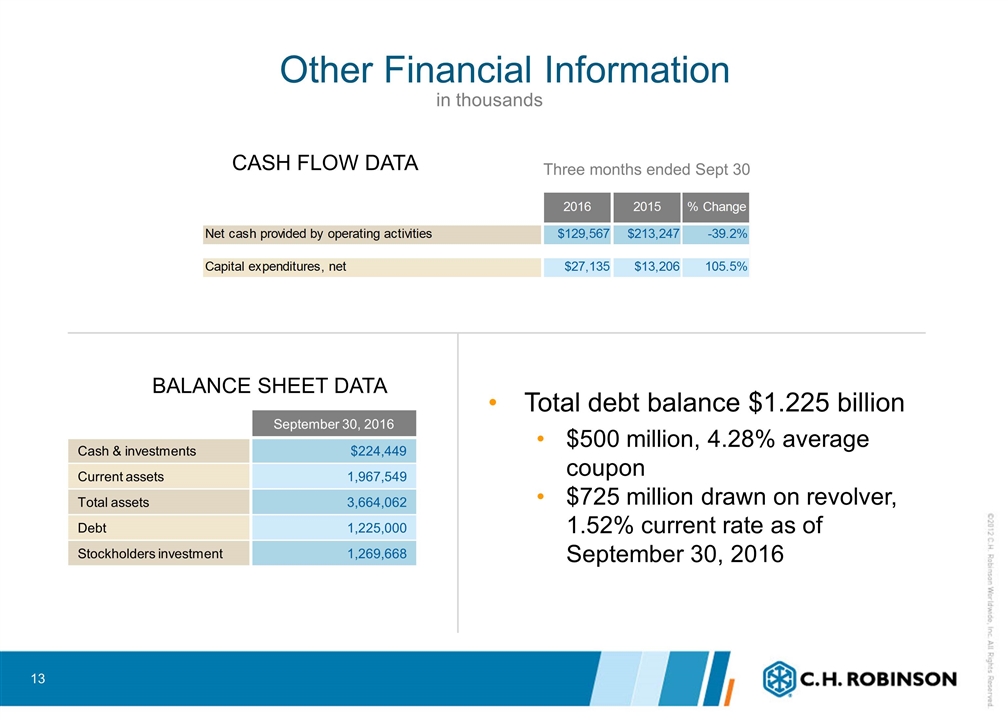
September 30, 2016 Cash & investments $224,449 Current assets 1,967,549 Total assets 3,664,062 Debt 1,225,000 Stockholders investment 1,269,668 CASH FLOW DATA BALANCE SHEET DATA Other Financial Information in thousands Total debt balance $1.225 billion $500 million, 4.28% average coupon $725 million drawn on revolver, 1.52% current rate as of September 30, 2016 13 Three months ended Sept 30
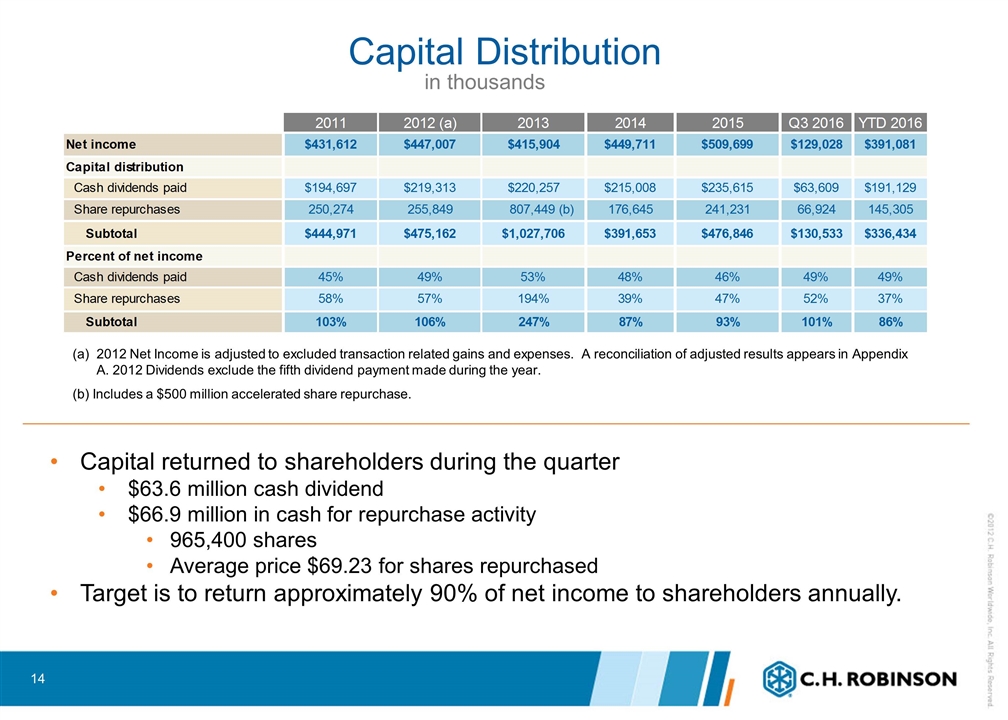
in thousands Capital Distribution Capital returned to shareholders during the quarter $63.6 million cash dividend $66.9 million in cash for repurchase activity 965,400 shares Average price $69.23 for shares repurchased Target is to return approximately 90% of net income to shareholders annually. 2012 Net Income is adjusted to excluded transaction related gains and expenses. A reconciliation of adjusted results appears in Appendix A. 2012 Dividends exclude the fifth dividend payment made during the year. (b) Includes a $500 million accelerated share repurchase. 14
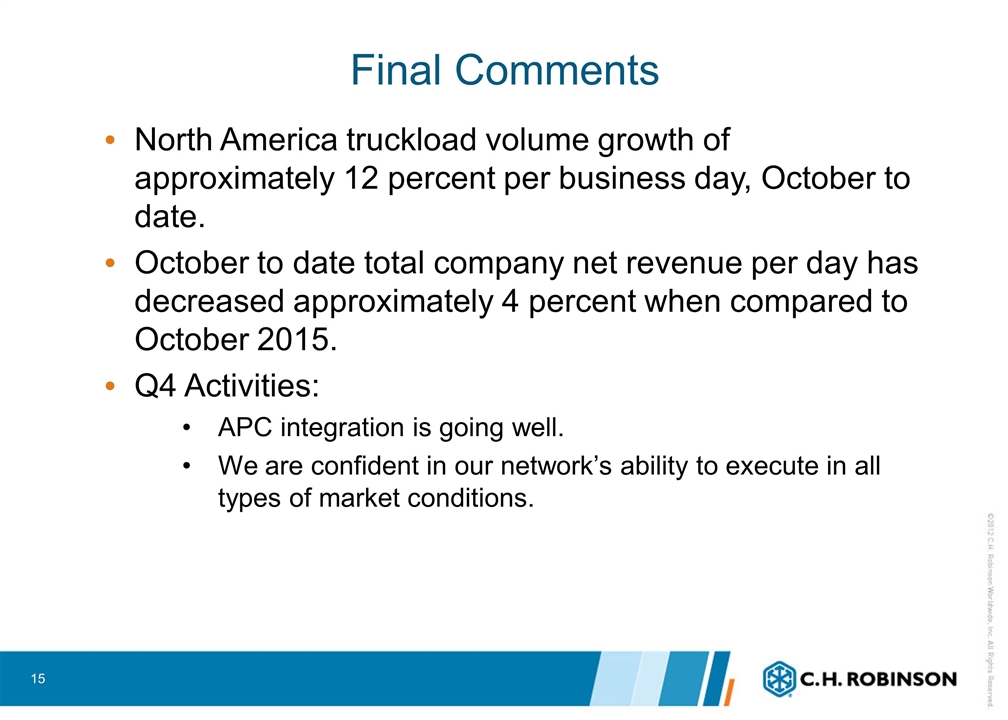
Final Comments North America truckload volume growth of approximately 12 percent per business day, October to date. October to date total company net revenue per day has decreased approximately 4 percent when compared to October 2015. Q4 Activities: APC integration is going well. We are confident in our network’s ability to execute in all types of market conditions. 15
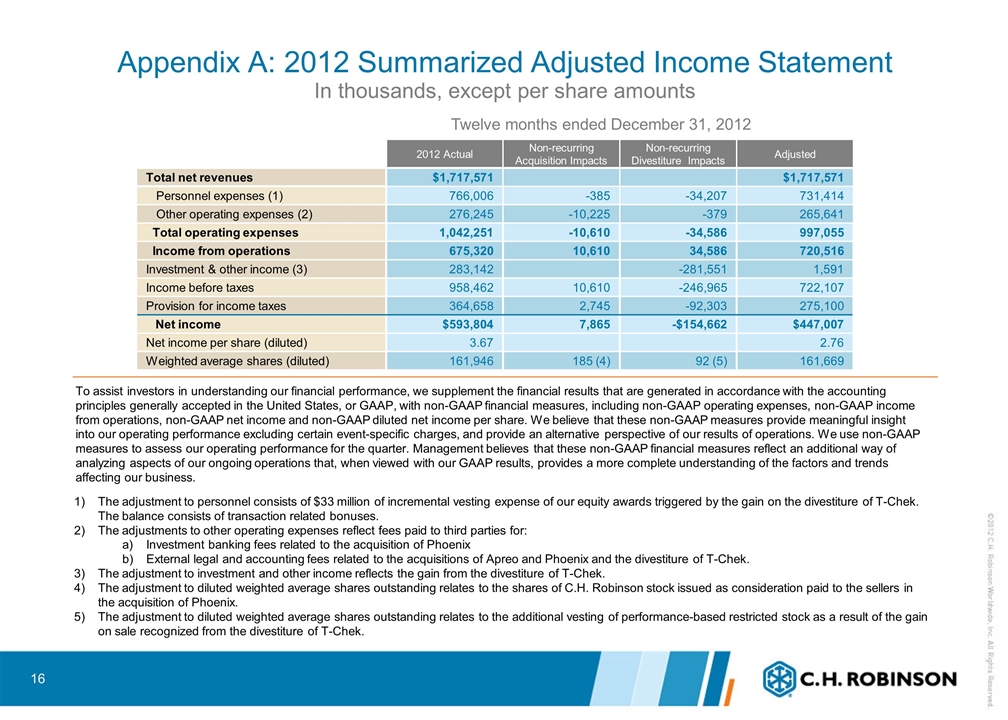
Appendix A: 2012 Summarized Adjusted Income Statement In thousands, except per share amounts Twelve months ended December 31, 2012 The adjustment to personnel consists of $33 million of incremental vesting expense of our equity awards triggered by the gain on the divestiture of T-Chek. The balance consists of transaction related bonuses. The adjustments to other operating expenses reflect fees paid to third parties for: Investment banking fees related to the acquisition of Phoenix External legal and accounting fees related to the acquisitions of Apreo and Phoenix and the divestiture of T-Chek. The adjustment to investment and other income reflects the gain from the divestiture of T-Chek. The adjustment to diluted weighted average shares outstanding relates to the shares of C.H. Robinson stock issued as consideration paid to the sellers in the acquisition of Phoenix. The adjustment to diluted weighted average shares outstanding relates to the additional vesting of performance-based restricted stock as a result of the gain on sale recognized from the divestiture of T-Chek. 2012 Actual Non-recurring Acquisition Impacts Non-recurring Divestiture Impacts Adjusted Total net revenues $1,717,571 $1,717,571 Personnel expenses (1) 766,006 -385 -34,207 731,414 Other operating expenses (2) 276,245 -10,225 -379 265,641 Total operating expenses 1,042,251 -10,610 -34,586 997,055 Income from operations 675,320 10,610 34,586 720,516 Investment & other income (3) 283,142 -281,551 1,591 Income before taxes 958,462 10,610 -246,965 722,107 Provision for income taxes 364,658 2,745 -92,303 275,100 Net income $593,804 7,865 -$154,662 $447,007 Net income per share (diluted) 3.67 2.76 Weighted average shares (diluted) 161,946 185 (4) 92 (5) 161,669 To assist investors in understanding our financial performance, we supplement the financial results that are generated in accordance with the accounting principles generally accepted in the United States, or GAAP, with non-GAAP financial measures, including non-GAAP operating expenses, non-GAAP income from operations, non-GAAP net income and non-GAAP diluted net income per share. We believe that these non-GAAP measures provide meaningful insight into our operating performance excluding certain event-specific charges, and provide an alternative perspective of our results of operations. We use non-GAAP measures to assess our operating performance for the quarter. Management believes that these non-GAAP financial measures reflect an additional way of analyzing aspects of our ongoing operations that, when viewed with our GAAP results, provides a more complete understanding of the factors and trends affecting our business. 16

Serious News for Serious Traders! Try StreetInsider.com Premium Free!
You May Also Be Interested In
- Bionxt Solutions Announces Odf Cladribine Update and Financing
- ROSEN, A LEADING AND TOP RANKED LAW FIRM, Encourages Lifecore Biomedical Inc. f/k/a Landec Corporation Investors to Inquire About Securities Class Action Investigation – LFCR, LNDC
- Robbins LLP Reminds IRobot Corporation Shareholders of the Pending May 7, 2024 Lead Plaintiff Deadline
Create E-mail Alert Related Categories
SEC FilingsSign up for StreetInsider Free!
Receive full access to all new and archived articles, unlimited portfolio tracking, e-mail alerts, custom newswires and RSS feeds - and more!


 Tweet
Tweet Share
Share