

Form 8-K Blackstone Group L.P. For: Oct 27
 Tweet
Tweet Share
Share
UNITED STATES
SECURITIES AND EXCHANGE COMMISSION
WASHINGTON, D.C. 20549
FORM 8-K
CURRENT REPORT
Pursuant to Section 13 or 15(d)
of the Securities Exchange Act of 1934
Date of Report (Date of earliest event reported): October 27, 2016
The Blackstone Group L.P.
(Exact name of Registrant as specified in its charter)
| Delaware | 001-33551 | 20-8875684 | ||
| (State or other jurisdiction of incorporation) |
(Commission File Number) |
(I.R.S. Employer Identification No.) | ||
| 345 Park Avenue New York, New York |
10154 | |||
| (Address of principal executive offices) | (Zip Code) | |||
(212) 583-5000
(Registrant’s telephone number, including area code)
NOT APPLICABLE
(Former name or former address, if changed since last report)
Check the appropriate box below if the Form 8-K filing is intended to simultaneously satisfy the filing obligation of the registrant under any of the following provisions (see General Instruction A.2. below):
| ¨ | Written communications pursuant to Rule 425 under the Securities Act (17 CFR 230.425) |
| ¨ | Soliciting material pursuant to Rule 14a-12 under the Exchange Act (17 CFR 240.14a-12) |
| ¨ | Pre-commencement communications pursuant to Rule 14d-2(b) under the Exchange Act (17 CFR 240.14d-2(b)) |
| ¨ | Pre-commencement communications pursuant to Rule 13e-4(c) under the Exchange Act (17 CFR 240.13e-4(c)) |
Item 2.02 Results of Operations.
On October 27, 2016, The Blackstone Group L.P. issued a press release announcing financial results for its third quarter ended September 30, 2016.
The press release is attached hereto as Exhibit 99.1. All information in the press release is furnished but not filed.
Item 9.01 Financial Statements and Exhibits.
(d) Exhibits.
| Exhibit |
Description | |
| 99.1 | Press release of The Blackstone Group L.P. dated October 27, 2016. | |
SIGNATURE
Pursuant to the requirements of the Securities Exchange Act of 1934, the registrant has duly caused this report to be signed on its behalf by the undersigned hereunto duly authorized.
Date: October 27, 2016
| The Blackstone Group L.P. | ||
| By: Blackstone Group Management L.L.C., | ||
| its General Partner | ||
| By: | /s/ Michael S. Chae | |
| Name: | Michael S. Chae | |
| Title: | Chief Financial Officer | |
Exhibit 99.1

Blackstone Reports Third Quarter Results
New York, October 27, 2016: Blackstone (NYSE: BX) today reported its third quarter 2016 results.
Stephen A. Schwarzman, Chairman and Chief Executive Officer, said, “Blackstone continued to perform well in this year’s third quarter, with every business achieving sequential and year-over-year growth in both revenues and earnings, and assets under management reaching a record $361 billion. In a period of very low growth and interest rates around the world, we strive to provide good investment returns to institutions and individuals alike. And we achieved that goal.”
Blackstone’s press release of its third quarter 2016 results can also be viewed at www.blackstone.com.
Distribution
Blackstone has declared a quarterly distribution of $0.41 per common unit to record holders of common units at the close of business on November 7, 2016. This distribution will be paid on November 14, 2016.
Quarterly Investor Call Details
Blackstone will host a conference call on October 27, 2016 at 11:00 a.m. ET to discuss third quarter 2016 results. The conference call can be accessed via the Shareholders section of Blackstone’s website at www.blackstone.com or by dialing +1 (877) 391-6747 (U.S. domestic) or +1 (617) 597-9291 (international), pass code 149 943 55#. For those unable to listen to the live broadcast, a replay will be available on www.blackstone.com or by dialing +1 (888) 286-8010 (U.S. domestic) or +1 (617) 801-6888 (international), pass code 581 320 61#.
About Blackstone
Blackstone is one of the world’s leading investment firms. We seek to create positive economic impact and long-term value for our investors, the companies we invest in, and the communities in which we work. We do this by using extraordinary people and flexible capital to help companies solve problems. Our asset management businesses, with over $360 billion in assets under management, include investment vehicles focused on private equity, real estate, public debt and equity, non-investment grade credit, real assets and secondary funds, all on a global basis. Further information is available at www.blackstone.com. Follow Blackstone on Twitter @Blackstone.
The Blackstone Group L.P.
345 Park Avenue
New York, New York 10154
T 212 583 5000
Forward-Looking Statements
This release may contain forward-looking statements within the meaning of Section 27A of the Securities Act of 1933 and Section 21E of the Securities Exchange Act of 1934 which reflect Blackstone’s current views with respect to, among other things, Blackstone’s operations and financial performance. You can identify these forward-looking statements by the use of words such as “outlook,” “indicator,” “believes,” “expects,” “potential,” “continues,” “may,” “will,” “should,” “seeks,” “approximately,” “predicts,” “intends,” “plans,” “estimates,” “anticipates” or the negative version of these words or other comparable words. Such forward-looking statements are subject to various risks and uncertainties. Accordingly, there are or will be important factors that could cause actual outcomes or results to differ materially from those indicated in these statements. Blackstone believes these factors include but are not limited to those described under the section entitled “Risk Factors” in its Annual Report on Form 10-K for the fiscal year ended December 31, 2015, as such factors may be updated from time to time in its periodic filings with the Securities and Exchange Commission, which are accessible on the SEC’s website at www.sec.gov. These factors should not be construed as exhaustive and should be read in conjunction with the other cautionary statements that are included in this release and in the filings. Blackstone undertakes no obligation to publicly update or review any forward-looking statement, whether as a result of new information, future developments or otherwise.
This release does not constitute an offer of any Blackstone Fund.
Investor and Media Relations Contacts
| Joan Solotar Blackstone Tel: +1 (212) 583-5068 |
Weston Tucker Blackstone Tel: +1 (212) 583-5231 |
Christine Anderson Blackstone Tel: +1 (212) 583-5182 |
2
 Blackstone’s Third Quarter 2016 Earnings October 27, 2016 |
 Blackstone 1 Third Quarter 2016 GAAP Results GAAP Net Income was $692 million for the quarter, and $1.5 billion year-to-date. GAAP Net Income Attributable to The Blackstone Group L.P. was $313 million for the quarter and $671 million year-to-date. n/m = not meaningful. % Change % Change (Dollars in Thousands, Except per Unit Data) (Unaudited) 3Q'15 3Q'16 vs. 3Q'15 3Q'15 YTD 3Q'16 YTD vs. 3Q'15 YTD Revenues Management and Advisory Fees, Net 703,596 $ 596,154 $
(15)% 1,894,496 $ 1,812,883 $ (4)% Performance Fees Realized Carried Interest 435,189 503,990 16% 2,580,266 1,058,633 (59)% Realized Incentive Fees 33,455 30,295 (9)% 110,775 88,155 (20)% Unrealized Carried Interest (1,055,920) 106,202 n/m (1,124,010) 242,080 n/m Unrealized Incentive Fees (50,832) 30,545 n/m 36,274 45,900 27% Total Performance Fees (638,108) 671,032 n/m 1,603,305 1,434,768 (11)% Investment Income (Loss) Realized 99,952 119,351 19% 445,705 172,387 (61)% Unrealized (179,298) 23,752 n/m (262,024) 67,347 n/m Total Investment Income (Loss) (79,346) 143,103 n/m 183,681 239,734 31% Interest and Dividend Revenue 26,244 21,819 (17)% 70,129 67,180 (4)% Other (813) (423) (48)% (2,478) 1,900 n/m Total Revenues 11,573 1,431,685 n/m 3,749,133 3,556,465 (5)% Expenses Compensation and Benefits Compensation 393,655 329,634 (16)% 1,426,233 1,031,061 (28)% Performance Fee Compensation Realized Carried Interest 97,798 168,427 72% 628,079 314,511 (50)% Realized Incentive Fees 15,062 15,436 2% 49,126 44,810 (9)% Unrealized Carried Interest (228,697) 70,044 n/m (204,876) 175,247 n/m Unrealized Incentive Fees (14,641) 13,508 n/m 16,450 19,645 19% Total Compensation and Benefits 263,177 597,049 127% 1,915,012 1,585,274 (17)% General, Administrative and Other 158,664 124,322 (22)% 436,496 378,355 (13)% Interest Expense 36,860 37,278 1% 105,644 111,512 6% Fund Expenses 18,296 15,128 (17)% 76,845 28,949 (62)% Total Expenses 476,997 773,777 62% 2,533,997 2,104,090 (17)% Other Income (Loss) Net Gains (Losses) from Fund Investment Activities (16,867) 61,395 n/m 158,703 111,240 (30)% Income (Loss) Before Provision for Taxes (482,291) $ 719,303 $ n/m 1,373,839 $ 1,563,615 $ 14% Provision for Taxes 1,573 27,714 n/m 144,168 84,275 (42)% Net Income (Loss) (483,864) $ 691,589 $ n/m 1,229,671 $ 1,479,340 $ 20% Net Income (Loss) Attributable to Redeemable Non-Controlling Interests in Consolidated Entities
(12,520) 10,764 n/m 8,787 2,314 (74)% Net Income Attributable to Non-Controlling Interests in Consolidated Entities
30,671 82,653 169% 179,183 187,468 5% Net Income (Loss) Attributable to Non-Controlling Interests in Blackstone Holdings
(247,318) 285,267 n/m 532,782 618,274 16% Net Income (Loss) Attributable to The Blackstone Group L.P. ("BX")
(254,697) $ 312,905 $ n/m 508,919 $ 671,284 $ 32% Net Income (Loss) per Common Unit, Basic (0.40) $ 0.48 $
n/m 0.81 $
1.04 $
28% Net Income (Loss) per Common Unit, Diluted (0.40) $ 0.47 $
n/m 0.80 $
1.01 $
26% |
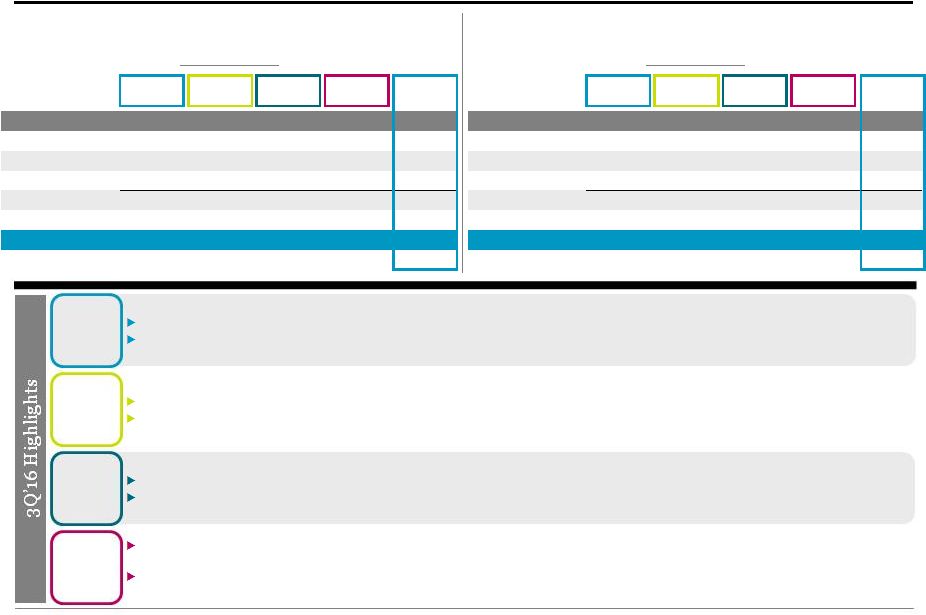
 Blackstone 2 Third Quarter 2016 Segment Highlights Economic Net Income (“ENI”) was $687 million ($0.57/unit) in the quarter, an increase of $0.92/unit year-over-year, on $1.4 billion of Total Segment Revenues. • ENI was $1.6 billion ($1.32/unit) year-to-date on $3.5 billion of Total Segment Revenues. Distributable Earnings (“DE”) was $593 million ($0.48/unit) in the quarter, on $534 million of Realized Performance Fees. • DE was $1.5 billion ($1.23/unit) year-to-date on $1.1 billion of Realized Performance Fees. Fee Related Earnings (“FRE”) was $229 million in the third quarter, on $601 million of Fee Revenues. • FRE was $675 million year-to-date, up 8% year-over-year, on $1.8 billion of Fee Revenues, despite the spin-off of Blackstone’s Advisory businesses completed in October 2015. Total Assets Under Management (“AUM”) reached a record $361.0 billion through a combination of strong fundraising and organic expansion. • Gross inflows were $14.7 billion in the quarter, bringing the last twelve months (“LTM”) inflows to $68.5 billion. • Total AUM increased 8% year-over-year and Fee-Earning AUM was up 11% to $267.8 billion. Capital deployed of $4.3 billion in the quarter and $15.0 billion year-to-date was achieved by leveraging Blackstone’s diverse platform to find opportunities globally. Blackstone declared a third quarter distribution of $0.41 per common unit payable on November 14, 2016. |
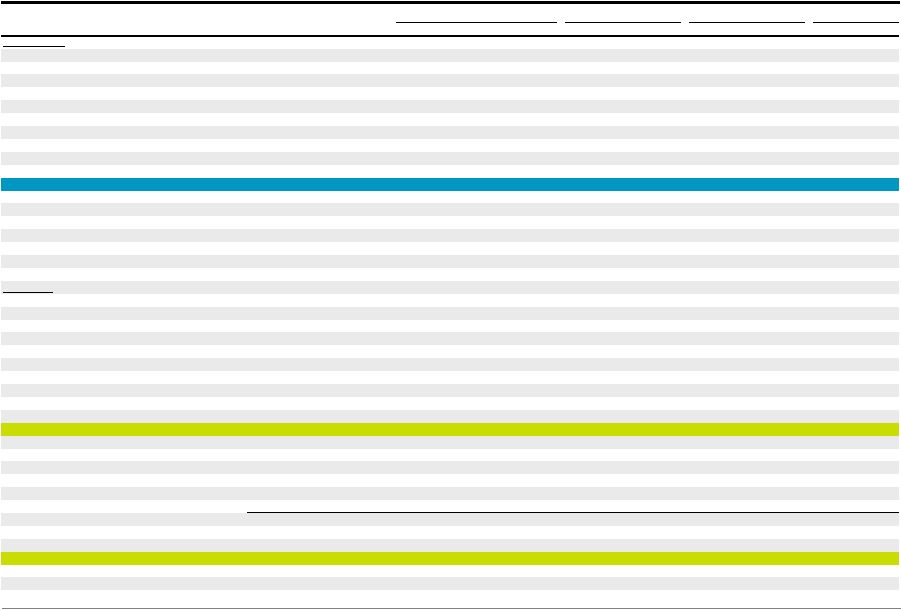
 Blackstone 3 Third Quarter 2016 Segment Earnings The changes in carrying value, fund returns and composite returns presented throughout this presentation represent those of the
applicable Blackstone Funds and not those of The Blackstone Group
L.P. % Change
% Change (Dollars in Thousands, Except per Unit Data) 3Q'15 3Q'16 vs. 3Q'15 3Q'15 YTD 3Q'16 YTD vs. 3Q'15 YTD Fee Revenues 707,826 $ 601,255 $ (15)% 1,913,474 $ 1,828,974 $ (4)% Performance Fees (639,349) 672,646 n/m 1,604,051 1,436,083 (10)% Investment Income (Loss) (136,131) 87,887 n/m 64,284 121,008 88% Interest Income and Dividend Revenue 35,459 33,081 (7)% 96,936 103,395 7% Total Revenues (32,195) 1,394,869 n/m 3,678,745 3,489,460 (5)% Total Expenses 356,661 686,900 93% 1,906,791 1,853,036 (3)% Taxes 27,070 20,985 (22)% 57,376 59,013 3% Economic Net Income (Loss) (“ENI”) (415,926) $ 686,984 $ n/m 1,714,578 $ 1,577,411 $ (8)% ENI per Unit (0.35) $
0.57 $
n/m 1.45 $
1.32 $
(9)% Fee Related Earnings (“FRE”) 265,667 $ 229,035 $ (14)% 624,732 $ 674,627 $ 8% Distributable Earnings (“DE”) 691,534 $ 593,028 $ (14)% 2,965,661 $ 1,484,454 $ (50)% DE per Common Unit 0.58 $
0.48 $
(17)% 2.51 $
1.23 $
(51)% Total AUM 333,925,521 $ 361,040,173 $ 8% 333,925,521 $ 361,040,173 $ 8% Fee-Earning AUM 240,939,356 $ 267,757,727 $ 11% 240,939,356 $ 267,757,727 $ 11% |
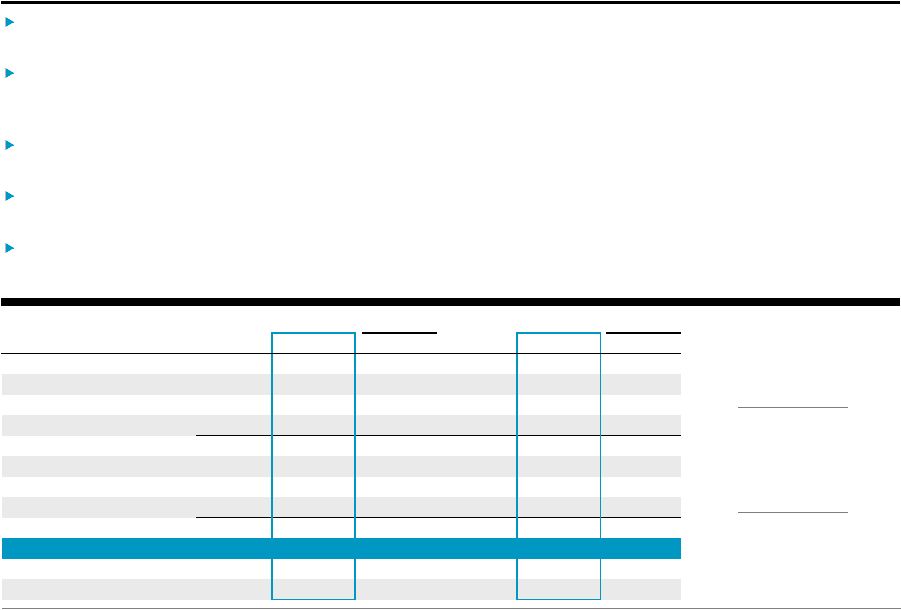
 Blackstone 4 Private Equity 3.0% 3Q’16 Increase in Corporate Private Equity Carrying Value $4.5 billion 3Q’16 Realizations $99.7 billion Total AUM up 9% YoY Corporate Private Equity carrying value increased 3.0% in the quarter due to appreciation in the private investment portfolio. Realizations of $4.5 billion in the quarter were driven mainly by public and strategic sales across the segment, bringing year-to-date realizations to $10.4 billion. Invested or committed $2.9 billion during the quarter and $6.9 billion year-to-date across the segment. Inflows of $3.4 billion in the quarter included closings for the seventh secondary fund, the Tactical Opportunities platform, and the first core private equity fund, bringing LTM inflows to $18.9 billion. Total AUM increased 9% year-over-year to $99.7 billion, driven by fundraising across all strategies within the segment, which more than offset significant realization activity. Fee-Earning AUM increased 37% year-over-year due to the commencement of investment periods of various flagship funds across the segment. % Change % Change (Dollars in Thousands) 3Q'15 3Q'16 vs. 3Q'15 3Q'15 YTD 3Q'16 YTD vs. 3Q'15 YTD Fee Revenues 128,567 $ 132,094 $ 3% 361,370 $ 404,993 $ 12% Performance Fees (594,831) 170,995 n/m 595,971 417,255 (30)% Investment Income (Loss) (63,772) 24,353 n/m 40,488 44,596 10% Interest Income and Dividend Revenue 8,119 9,160 13% 23,406 28,525 22% Total Revenues (521,917) 336,602 n/m 1,021,235 895,369 (12)% Compensation 70,419 73,889 5% 209,597 237,303 13% Performance Fee Compensation (125,145) 83,041 n/m 173,385 158,160 (9)% Other Operating Expenses 43,812 47,534 8% 145,258 143,968 (1)% Total Expenses (10,914) 204,464 n/m 528,240 539,431 2% Economic Income (Loss) (511,003) $ 132,138 $ n/m 492,995 $ 355,938 $ (28)% Total AUM 91,490,669 $ 99,722,322 $ 9% 91,490,669 $ 99,722,322 $ 9% Fee-Earning AUM 50,560,404 $ 69,347,910 $ 37% 50,560,404 $ 69,347,910 $ 37% |
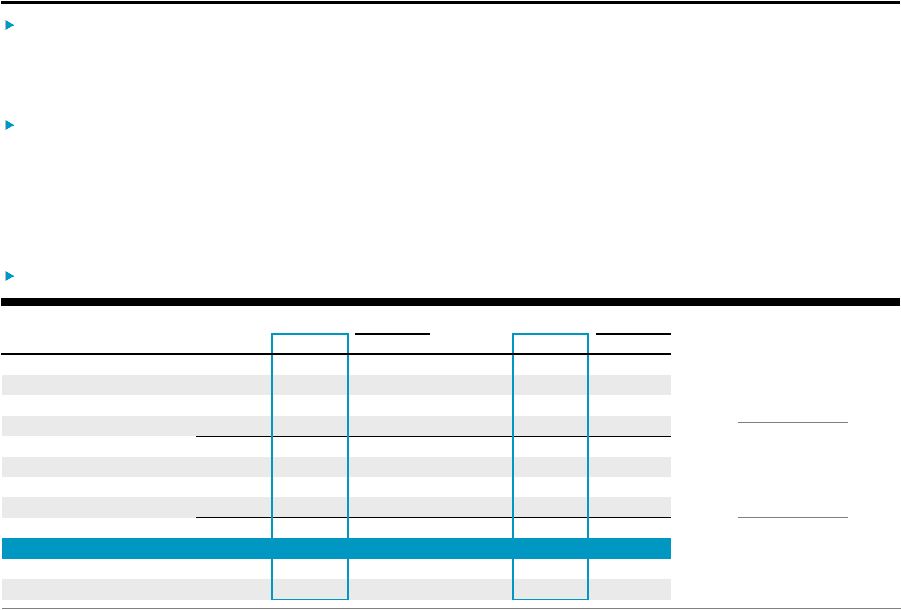
 Blackstone 5 Real Estate 3.7% 3Q’16 Increase in Opportunistic Funds’ Carrying Value $101.9 billion Total AUM up 9% YoY Opportunistic funds’ carrying value up 3.7% during the quarter due to gains across private and public investment values; core+ funds’ carrying value up 2.9% during the quarter. Realizations of $7.2 billion in the quarter were the second highest for the real estate business since inception, driven by the sale of the remaining public stake in Brixmor, the sale of the China retail platform, and the sale of most of Strategic Hotels. Invested or committed $4.1 billion in the quarter, including the closing of Blanchardstown, a 1.2 million square foot retail complex in Dublin, Ireland, and $1.1 billion of executed contracts for U.S. core+ investments. Inflows of $3.2 billion in the quarter across the platform included a closing for the fifth European opportunistic fund as well as $1.9 billion of recycled capital from returns of capital for funds in their investment period. Total AUM up 9% year-over-year to $101.9 billion and Fee-Earning AUM up 1% year-over-year to $65.8 billion. • Increase driven by core+ and BREDS with Total AUM up more than 50% year-over-year in these businesses. $7.2 billion 3Q’16 Realizations % Change % Change (Dollars in Thousands) 3Q'15 3Q'16 vs. 3Q'15 3Q'15 YTD 3Q'16 YTD vs. 3Q'15 YTD Fee Revenues 186,015 $ 210,429 $ 13% 502,638 $ 663,754 $ 32% Performance Fees 46,860 366,833 683% 864,412 763,320 (12)% Investment Income (Loss) (55,561) 39,979 n/m 31,034 61,844 99% Interest Income and Dividend Revenue 11,057 12,460 13% 31,313 38,732 24% Total Revenues 188,371 629,701 234% 1,429,397 1,527,650 7% Compensation 99,255 99,886 1% 263,573 303,352 15% Performance Fee Compensation 36,581 116,440 218% 254,434 270,050 6% Other Operating Expenses 42,050 47,908 14% 125,539 148,206 18% Total Expenses 177,886 264,234 49% 643,546 721,608 12% Economic Income 10,485 $ 365,467 $ n/m 785,851 $ 806,042 $ 3% Total AUM 93,187,556 $ 101,876,562 $ 9% 93,187,556 $ 101,876,562 $ 9% Fee-Earning AUM 64,858,622 $ 65,785,083 $ 1% 64,858,622 $ 65,785,083 $ 1% |
 Blackstone 6 Hedge Fund Solutions 2.9% 3Q’16 BPS Composite Gross Return The BPS Composite gross return is based on the BAAM Principal Solutions (“BPS”) Composite, which does not include BAAM's
individual investor solutions (liquid alternatives), long-biased commodities, ventures (seeding and minority interests), strategic opportunities (co-invests), Senfina (direct trading) and advisory (non-discretionary) platforms, except for investments by BPS funds directly into those platforms.
BAAM-managed funds in liquidation are also excluded. The
funds/accounts that comprise the BPS Composite are not managed within a single
fund or account and are managed with different mandates. There is
no guarantee that BAAM would have made the same mix of investments in a stand-alone fund/account. The BPS Composite is not an investible product and, as such, the performance of the Composite does not represent the
performance of an actual fund or account. On a net of fees basis, the BPS Composite was 2.8% for 3Q’16 and 4.0% since 1Q’16. The BPS Composite gross return was 2.9% in the third quarter, and 4.3% for the last six months, after challenging first quarter market conditions. Inflows of $2.4 billion during the quarter, $7.6 billion year-to-date and $10.0 billion LTM were driven by customized and commingled strategies and individual investor solutions. • October 1 subscriptions of $909 million are not yet included in AUM. Total AUM reached $70.1 billion during the quarter, driven by continued platform diversification and growth in customized strategies and individual investor solutions. • Total AUM for BAAM’s individual investor solutions platform was $7.2 billion, up 27% from $5.8 billion year-over-year. $2.4 billion 3Q’16 Inflows $70.1 billion Total AUM up 2% YoY % Change % Change (Dollars in Thousands) 3Q'15 3Q'16 vs. 3Q'15 3Q'15 YTD 3Q'16 YTD vs. 3Q'15 YTD Fee Revenues 133,238 $ 130,161 $ (2)% 392,080 $ 390,717 $ (0)% Performance Fees (32,322) 16,526 n/m 66,405 17,893 (73)% Investment Income (Loss) (6,879) 11,008 n/m (12,496) 2,814 n/m Interest Income and Dividend Revenue 4,136 4,692 13% 12,055 15,193 26% Total Revenues 98,173 162,387 65% 458,044 426,617 (7)% Compensation 44,408 47,206 6% 146,353 145,811 (0)% Performance Fee Compensation (10,488) 7,494 n/m 25,185 10,205 (59)% Other Operating Expenses 24,147 27,432 14% 65,852 80,796 23% Total Expenses 58,067 82,132 41% 237,390 236,812 (0)% Economic Income 40,106 $ 80,255 $ 100% 220,654 $ 189,805 $ (14)% Total AUM 68,405,948 $ 70,113,508 $ 2% 68,405,948 $ 70,113,508 $ 2% Fee-Earning AUM 65,182,338 $ 66,434,971 $ 2% 65,182,338 $ 66,434,971 $ 2% |
 Blackstone 7 Credit Performing Credit Strategies include mezzanine lending funds, Business Development Companies (“BDCs”) and other performing
credit strategy funds. Distressed Strategies include hedge fund strategies, rescue lending funds and distressed energy strategies. The composite gross returns represent a weighted-average composite of the fee-earning funds exceeding
$100 million of fair value at each respective quarter end for each
strategy. Composite gross returns exclude the Blackstone Funds
that were contributed to GSO as part of Blackstone’s
acquisition of GSO in March 2008. Performing Credit
Strategies’ net returns were 4.6% for 3Q'16 and Distressed
Strategies’ net returns were 4.8% for 3Q'16. The breakdown of
Total AUM for 3Q’16
is as follows: Distressed Strategies $22.7 billion (32% Incentive Fee, 68%
Carried Interest), Performing Credit Strategies $34.5 billion (52% Incentive Fee, 48% Carried Interest), and Long Only $32.1 billion. The breakdown of Fee-Earning AUM for 3Q’16 is as follows: Distressed Strategies $12.7 billion (51% Incentive Fee, 49% Carried Interest), Performing Credit Strategies $22.0 billion
(81% Incentive Fee, 19% Carried Interest), and Long Only $31.5 billion. $5.7 billion 3Q’16 Inflows $89.3 billion Total AUM up 10% YoY 3Q’16 Composite Gross Returns Performing Credit 6.2% Distressed 6.4% Strong performance across strategies, resulting in gross returns of 6.2% in Performing Credit and 6.4% in Distressed Strategies. • Performance was driven by continued appreciation of energy investments, as well as distressed debt positions across funds. Total AUM reached a record $89.3 billion in the quarter driven by capital raised across strategies. • Additional closings of $3.2 billion for the new mezzanine fund brought the total capital raised to $6.5 billion, with expectations of reaching the hard cap in the fourth quarter, making this the segment’s largest fundraise for a direct lending drawdown fund. • Raised $509 million for the new European CLO and $907 million in separately managed accounts and commingled funds, primarily in leveraged loan strategies. Invested $605 million during the quarter, with an additional $1.3 billion committed not yet deployed year-to-date. % Change % Change (Dollars in Thousands) 3Q'15 3Q'16 vs. 3Q'15 3Q'15 YTD 3Q'16 YTD vs. 3Q'15 YTD Fee Revenues 116,489 $ 128,571 $ 10% 360,957 $ 369,510 $ 2% Performance Fees (59,056) 118,292 n/m 77,263 237,615 208% Investment Income (Loss) (8,442) 12,547 n/m 6,165 11,754 91% Interest Income and Dividend Revenue 6,053 6,769 12% 17,642 20,945 19% Total Revenues 55,044 266,179 384% 462,027 639,824 38% Compensation 51,324 47,614 (7)% 148,325 155,687 5% Performance Fee Compensation (31,427) 60,440 n/m 35,774 115,798 224% Other Operating Expenses 24,898 28,016 13% 70,273 83,700 19% Total Expenses 44,795 136,070 204% 254,372 355,185 40% Economic Income 10,249 $ 130,109 $ n/m 207,655 $ 284,639 $ 37% Total AUM 80,841,348 $ 89,327,781 $ 10% 80,841,348 $ 89,327,781 $ 10% Fee-Earning AUM 60,337,992 $ 66,189,763 $ 10% 60,337,992 $ 66,189,763 $ 10% |
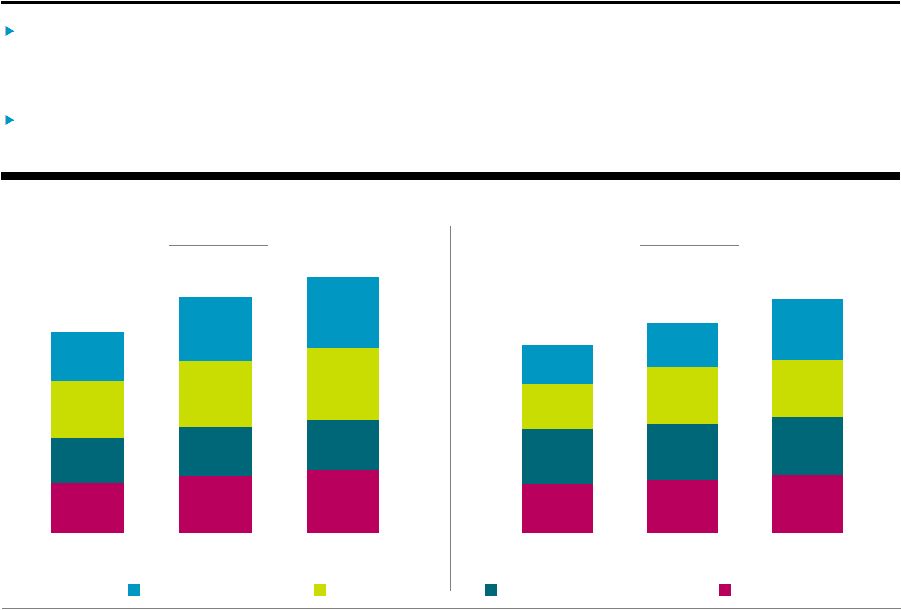 Blackstone 8 $70.2 $80.8 $89.3 $64.2 $68.4 $70.1 $80.2 $93.2 $101.9 $69.9 $91.5 $99.7 3Q'14 3Q'15 3Q'16 Fee-Earning AUM by Segment (Dollars in Billions) Total AUM by Segment (Dollars in Billions) $284.4 Private Equity Real Estate Hedge Fund Solutions Credit Assets Under Management $56.7 $60.3 $66.2 $62.0 $65.2 $66.4 $52.3 $64.9 $65.8 $43.8 $50.6 $69.3 3Q'14 3Q'15 3Q'16 $333.9 $361.0 $214.8 $240.9 $267.8 Total AUM increased 8% year-over-year to $361.0 billion driven by $68.5 billion of gross inflows.
• Each segment experienced growth despite $53.6 billion of capital returned to investors during the LTM.
Fee-Earning AUM of $267.8 billion was up 11%
year-over-year as $61.3 billion of gross inflows significantly outpaced $36.6 billion of realizations and outflows. |
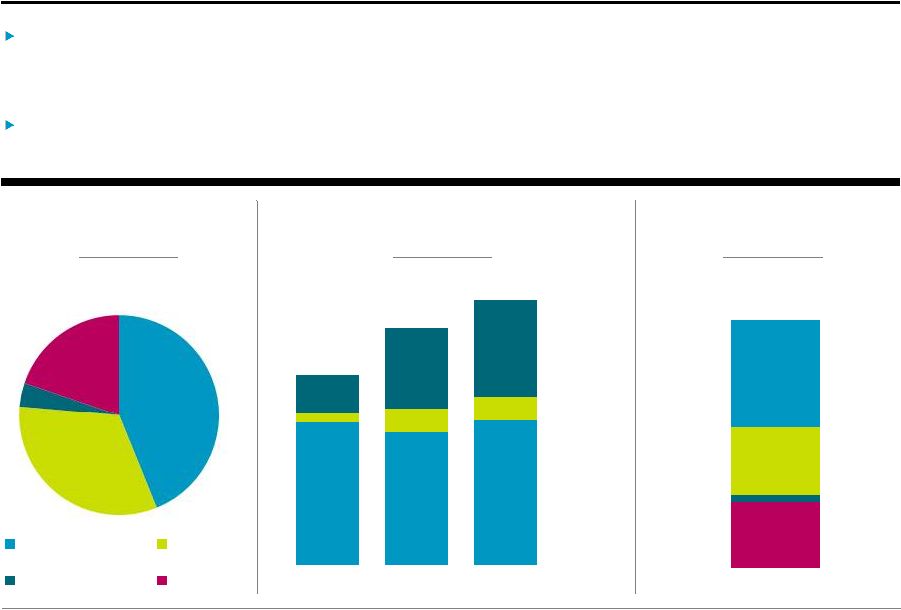 Blackstone 9 $17.3 $18.1 $28.1 $148.8 $138.6 $150.8 $9.8 $23.4 $23.7 $39.4 $85.1 $101.5 3Q'14 3Q'15 3Q'16 Additional Capital Detail Undrawn capital (“Total Dry Powder”) was $102.2 billion, up 20% year-over-year, driven by recent fundraises for the latest global private equity fund and the latest European opportunistic real estate fund. • 75% of Total Dry Powder was raised in 2015 and 2016 year-to-date. Performance Fee Eligible AUM reached $275.9 billion at quarter end, up 12% year-over-year, despite significant realizations in the Real Estate and Private Equity segments. Uninvested Not Currently Earning Performance Fees Currently Earning Performance Fees Private Equity Real Estate Hedge Fund Solutions Credit $102 billion 3Q’16 Total Dry Powder $276 billion Performance Fee Eligible AUM $65 billion Not Currently Earning Management Fees $247.1 $275.9 $197.9 Credit Hedge Fund Solutions Real Estate Private Equity $65.2 $44.8 $33.2 $4.0 $20.2 |
 Blackstone 10 3Q'14 3Q'15 3Q'16 At September 30, 2016, Blackstone had $3.9 billion in total cash, cash equivalents, and corporate treasury investments and $9.4
billion
of
cash
and
net
investments,
or
$7.
90
per
unit. Blackstone has no net debt, a $1.5 billion undrawn credit revolver and maintained A+/A+ ratings. • On October 5, 2016, Blackstone issued €600 million of 10-year notes at a 1% coupon, which are not included in the September 30, 2016 balances. Deconsolidated Balance Sheet Highlights Balance Sheet Highlights are preliminary, and exclude the consolidated Blackstone Funds. Investments include Blackstone investments in
Private Equity, Real Estate, Hedge Fund Solutions, and Credit,
which were $783 million, $992 million, $129 million, and $274 million, respectively, as of September 30, 2016, $849 million, $1.0 billion, $128 million, and $223 million, respectively, as of September 30, 2015 and $1.1 billion, $1.4 billion, $122 million, and $275 million, respectively, as of
September 30, 2014. Total Net Value per unit amounts are
calculated using period end DE Units Outstanding (see page 31, Unit Rollforward). A+/A+ Rated by S&P and Fitch $1.5 billion Undrawn Credit Revolver with August 2021 Maturity $3.9 billion Total Cash and Corporate Treasury $7.90 $8.28 $8.72 Cash and Net Investments (Per Unit) (Dollars in Millions) 3Q’16 Cash and Cash Equivalents $ 1,782 Corporate Treasury Investments 2,117 GP/Fund Investments 2,178 Net Accrued Performance Fees 3,335 Cash and Net Investments $ 9,412 Outstanding Bonds (at par) $ 2,822 |
 Blackstone 11 $861 $1,287 $916 $327 $1,242 $290 3Q'14 LTM 3Q'15 LTM 3Q'16 LTM $2,730 $2,316 $2,017 $1,294 $1,075 $1,144 3Q'14 3Q'15 3Q'16 Performance Fees Net Realized Performance Fees (Dollars in Millions) $2,715 $1,293 $1,542 Net Accrued Performance Fees (Dollars in Millions) $3,585 $3,335 $4,334 Private Equity Real Estate Credit Hedge Fund Solutions $3.3 billion Net Accrued Performance Fees 45% Net Accrued Performance Fees Related to Publics/Pending Exits $1.3 billion 3Q’16 LTM Net Realized Performance Fees Net Accrued Performance Fees per unit is calculated using period end DE Units Outstanding (see page 31, Unit Rollforward).
Net
Accrued
Performance
Fees
were
$3.3
billion
($2.80/unit)
despite
realizing
Net
Performance
Fees
of
$1.3
billion
over
the
last
twelve
months. |
 Appendix |
 Blackstone 13 Total Segments (Dollars in Thousands) 3Q'15 4Q'15 1Q'16 2Q'16 3Q'16 3Q'15 YTD 3Q'16 YTD Revenues Management and Advisory Fees, Net Base Management Fees 564,287 $
599,407 $
586,703 $
593,996 $
593,509 $
1,597,176 $ 1,774,208 $ Advisory Fees 146,153 742 481 1,277 1,106 307,389 2,864 Transaction and Other Fees, Net 32,403 72,481 46,118 32,343 27,915 81,204 106,376 Management Fee Offsets (34,176) (22,939) (20,101) (15,396) (20,850) (70,555) (56,347) Total Management and Advisory Fees, Net 708,667 649,691 613,201 612,220 601,680 1,915,214 1,827,101 Performance Fees Realized Carried Interest 435,189 625,610 230,909 323,734 504,022 2,580,266 1,058,665 Realized Incentive Fees 34,785 82,472 28,450 29,363 30,295 112,274 88,108 Unrealized Carried Interest (1,055,977) (471,222) 47,606 88,268 106,157 (1,124,074) 242,031 Unrealized Incentive Fees (53,346) (42,834) 7,100 8,007 32,172 35,585 47,279 Total Performance Fees (639,349) 194,026 314,065 449,372 672,646 1,604,051 1,436,083 Investment Income (Loss) Realized 87,526 86,993 (10,101) 53,670 60,634 331,815 104,203 Unrealized (223,657) (98,428) (16,549) 6,101 27,253 (267,531) 16,805 Total Investment Income (Loss) (136,131) (11,435) (26,650) 59,771 87,887 64,284 121,008 Interest Income and Dividend Revenue 35,459 34,665 35,081 35,233 33,081 96,936 103,395 Other (841) 10,240 (6,248) 8,546 (425) (1,740) 1,873 Total Revenues (32,195) 877,187 929,449 1,165,142 1,394,869 3,678,745 3,489,460 Expenses Compensation 329,575 240,454 287,403 286,155 268,595 948,765 842,153 Performance Fee Compensation Realized Carried Interest 97,799 165,721 58,503 87,581 168,427 628,079 314,511 Realized Incentive Fees 15,061 36,821 14,123 15,251 15,436 49,125 44,810 Unrealized Carried Interest (228,697) (107,820) 30,001 75,202 70,044 (204,876) 175,247 Unrealized Incentive Fees (14,642) (18,940) 3,448 2,689 13,508 16,450 19,645 Total Compensation and Benefits 199,096 316,236 393,478 466,878 536,010 1,437,543 1,396,366 Other Operating Expenses 157,565 155,109 148,526 157,254 150,890 469,248 456,670 Total Expenses 356,661 471,345 542,004 624,132 686,900 1,906,791 1,853,036 Economic Income (Loss) (388,856) $ 405,842 $
387,445 $
541,010 $
707,969 $
1,771,954 $ 1,636,424 $ Economic Net Income (Loss) (415,926) $ 435,691 $
370,651 $
519,776 $
686,984 $
1,714,578 $ 1,577,411 $ Fee Related Earnings 265,667 $
310,879 $
219,456 $
226,136 $
229,035 $
624,732 $
674,627 $
Distributable Earnings
691,534 $
878,027 $
387,967 $
503,459 $
593,028 $
2,965,661 $ 1,484,454 $ Total Assets Under Management 333,925,521 $ 336,384,575 $ 343,705,462 $ 356,281,669 $ 361,040,173 $ 333,925,521 $ 361,040,173 $ Fee-Earning Assets Under Management 240,939,356 $ 246,146,372 $ 244,452,764 $ 266,006,713 $ 267,757,727 $ 240,939,356 $ 267,757,727 $ Weighted Average Fee-Earning AUM 239,786,680 $ 242,942,380 $ 244,891,488 $ 259,476,010 $ 268,503,412 $ 238,291,612 $ 260,761,661 $ LP Capital Invested 6,145,446 $ 14,779,702 $ 6,515,571 $ 3,795,171 $ 4,127,005 $ 15,725,344 $ 14,437,747 $ Total Capital Invested 6,507,371 $ 15,747,511 $ 6,693,375 $ 4,049,774 $ 4,301,164 $ 16,607,799 $ 15,044,313 $ |
 Blackstone 14 Private Equity (Dollars in Thousands) 3Q'15 4Q'15 1Q'16 2Q'16 3Q'16 3Q'15 YTD 3Q'16 YTD Revenues Management Fees, Net Base Management Fees 128,452 $
143,887 $
130,648 $
131,477 $
131,708 $
358,753 $
393,833 $
Advisory Fees 2,547 742 481 1,277 1,106 9,819 2,864 Transaction and Other Fees, Net 9,359 18,382 8,439 9,812 11,786 17,876 30,037 Management Fee Offsets (12,262) (10,521) (6,848) (4,195) (12,917) (26,239) (23,960) Total Management and Advisory Fees, Net 128,096 152,490 132,720 138,371 131,683 360,209 402,774 Performance Fees Realized Carried Interest 214,532 330,902 30,282 57,056 26,398 1,144,085 113,736 Unrealized Carried Interest (809,363) (169,841) 73,875 85,047 144,597 (548,114) 303,519 Total Performance Fees (594,831) 161,061 104,157 142,103 170,995 595,971 417,255 Investment Income (Loss) Realized 46,917 47,658 (15,357) 22,926 15,469 141,991 23,038 Unrealized (110,689) (14,835) 15,440 (2,766) 8,884 (101,503) 21,558 Total Investment Income (Loss) (63,772) 32,823 83 20,160 24,353 40,488 44,596 Interest Income and Dividend Revenue 8,119 9,812 9,849 9,516 9,160 23,406 28,525 Other 471 4,693 (1,587) 3,395 411 1,161 2,219 Total Revenues (521,917) 360,879 245,222 313,545 336,602 1,021,235 895,369 Expenses Compensation 70,419 70,651 80,274 83,140 73,889 209,597 237,303 Performance Fee Compensation Realized Carried Interest 16,303 94,635 15,427 30,946 13,741 162,287 60,114 Unrealized Carried Interest (141,448) (21,270) 9,296 19,450 69,300 11,098 98,046 Total Compensation and Benefits (54,726) 144,016 104,997 133,536 156,930 382,982 395,463 Other Operating Expenses 43,812 53,900 48,063 48,371 47,534 145,258 143,968 Total Expenses (10,914) 197,916 153,060 181,907 204,464 528,240 539,431 Economic Income (Loss) (511,003) $ 162,963 $
92,162 $
131,638 $
132,138 $
492,995 $
355,938 $
Total Assets Under Management
91,490,669 $ 94,280,074 $ 95,466,227 $ 99,685,655 $ 99,722,322 $ 91,490,669 $ 99,722,322 $ Fee-Earning Assets Under Management 50,560,404 $ 51,451,196 $ 50,228,312 $ 69,467,174 $ 69,347,910 $ 50,560,404 $ 69,347,910 $ Weighted Average Fee-Earning AUM 50,268,174 $ 51,185,170 $ 51,240,819 $ 63,083,579 $ 69,546,251 $ 50,307,467 $ 67,760,989 $ LP Capital Invested 1,535,702 $ 4,508,023 $ 1,865,698 $ 1,538,436 $ 1,683,747 $ 5,711,155 $ 5,087,881 $ Total Capital Invested 1,677,876 $ 5,270,078 $ 1,974,391 $ 1,637,601 $ 1,804,304 $ 6,145,393 $ 5,416,296 $ |
 Blackstone 15 Real Estate (Dollars in Thousands) 3Q'15 4Q'15 1Q'16 2Q'16 3Q'16 3Q'15 YTD 3Q'16 YTD Revenues Management Fees, Net Base Management Fees 175,710 $
199,774 $
199,907 $
201,004 $
197,629 $
468,801 $
598,540 $
Transaction and Other Fees, Net
21,390 52,461 35,794 21,112 14,190 58,116 71,096 Management Fee Offsets
(10,147) (6,399) (3,595) (1,219) (842) (20,441)
(5,656)
Total Management Fees,
Net 186,953
245,836
232,106
220,897
210,977
506,476
663,980
Performance Fees
Realized Carried Interest
169,051 290,450 200,627 266,382 461,980 1,344,283 928,989 Realized Incentive Fees
3,879 11,331 4,069 6,099 3,857 5,822 14,025 Unrealized Carried Interest
(128,854) (182,061) (11,522) (84,875) (113,449) (498,481) (209,846) Unrealized Incentive Fees
2,784 8,014 9,765 5,942 14,445 12,788 30,152 Total Performance Fees
46,860 127,734 202,939 193,548 366,833 864,412 763,320 Investment Income (Loss)
Realized 39,821 38,985 12,975 19,929 46,704 196,597 79,608 Unrealized (95,382) (66,326) (2,137) (8,902) (6,725) (165,563) (17,764) Total Investment Income (Loss)
(55,561) (27,341) 10,838 11,027 39,979 31,034 61,844 Interest Income and Dividend Revenue
11,057 12,677 13,188 13,084 12,460 31,313 38,732 Other (938) 2,416
(1,909)
2,231
(548)
(3,838) (226) Total Revenues
188,371 361,322 457,162 440,787 629,701 1,429,397 1,527,650 Expenses Compensation 99,255 94,808 100,578 102,888 99,886 263,573 303,352 Performance Fee Compensation
Realized Carried Interest
52,546 68,827 43,076 56,441 147,419 415,210 246,936 Realized Incentive Fees
1,838 5,813 2,133 3,300 1,764 2,865 7,197 Unrealized Carried Interest
(23,018) (24,686) 27,703 14,257 (38,972) (171,661) 2,988 Unrealized Incentive Fees
5,215 797 4,158
2,542
6,229
8,020
12,929
Total Compensation and
Benefits 135,836
145,559
177,648
179,428
216,326
518,007
573,402
Other Operating Expenses
42,050 53,636 48,097 52,201 47,908 125,539 148,206 Total Expenses 177,886 199,195 225,745 231,629 264,234 643,546 721,608 Economic Income
10,485 $
162,127 $
231,417 $
209,158 $
365,467 $
785,851 $
806,042 $
Total Assets Under Management
93,187,556 $ 93,917,824 $ 101,107,528 $ 103,197,060 $ 101,876,562 $ 93,187,556 $ 101,876,562 $ Fee-Earning Assets Under Management 64,858,622 $ 67,345,357 $ 67,298,439 $ 66,744,550 $ 65,785,083 $ 64,858,622 $ 65,785,083 $ Weighted Average Fee-Earning AUM 63,492,663 $ 65,356,567 $ 66,943,268 $ 67,215,301 $ 66,708,328 $ 62,809,264 $ 67,150,535 $ LP Capital Invested 4,118,952 $ 7,733,638 $ 3,747,181 $ 1,524,415 $ 1,719,764 $ 8,525,724 $ 6,991,360 $ Total Capital Invested 4,326,151 $ 7,835,881 $ 3,820,460 $ 1,557,192 $ 1,749,778 $ 8,767,591 $ 7,127,430 $ |
 Blackstone 16 Hedge Fund Solutions (Dollars in Thousands) 3Q'15 4Q'15 1Q'16 2Q'16 3Q'16 3Q'15 YTD 3Q'16 YTD Revenues Management Fees, Net Base Management Fees 133,592 $
129,941 $
130,158 $
130,123 $
130,305 $
394,445 $
390,586 $
Transaction and Other Fees, Net
219 73
543 (5)
116 244
654 Management Fee Offsets
(507) 1,566
-
- -
(1,395) - Total Management Fees, Net
133,304 131,580 130,701 130,118 130,421 393,294 391,240 Performance Fees
Realized Incentive Fees
2,783 37,983 2,684 (251) 4,572
30,214
7,005
Unrealized Carried
Interest (5,394)
(599)
32 801
(84) 2,620
749
Unrealized Incentive Fees
(29,711) (41,655) (2,935) 1,036 12,038 33,571 10,139 Total Performance Fees
(32,322) (4,271) (219) 1,586
16,526
66,405
17,893
Investment Income
(Loss) Realized
(468) (141)
(4,745) (515) (1,211)
(12,600)
(6,471)
Unrealized
(6,411) (1,539) (12,291) 9,357 12,219 104 9,285
Total Investment Income
(Loss) (6,879)
(1,680)
(17,036)
8,842
11,008
(12,496)
2,814
Interest Income and
Dividend Revenue 4,136
5,219
5,296
5,205
4,692
12,055
15,193
Other
(66) 1,414
(1,388)
1,125
(260)
(1,214) (523) Total Revenues
98,173 132,262 117,354 146,876 162,387 458,044 426,617 Expenses Compensation 44,408 33,131 54,169 44,436 47,206 146,353 145,811 Performance Fee Compensation
Realized Incentive Fees
(436) 15,410
1,863
1,325
2,902
11,745
6,090
Unrealized Carried
Interest (3,041)
(213)
- 238
35 1,036
273
Unrealized Incentive Fees
(7,011) (15,316) (1,195) 480 4,557
12,404
3,842
Total Compensation and
Benefits 33,920
33,012
54,837
46,479
54,700
171,538
156,016
Other Operating Expenses
24,147 24,220 26,146 27,218 27,432 65,852 80,796 Total Expenses 58,067 57,232 80,983 73,697 82,132 237,390 236,812 Economic Income
40,106 $
75,030 $
36,371 $
73,179 $
80,255 $
220,654 $
189,805 $
Total Assets Under Management
68,405,948 $ 69,105,425 $ 68,475,416 $ 68,649,878 $ 70,113,508 $ 68,405,948 $ 70,113,508 $ Fee-Earning Assets Under Management 65,182,338 $ 65,665,439 $ 64,831,253 $ 64,973,999 $ 66,434,971 $ 65,182,338 $ 66,434,971 $ Weighted Average Fee-Earning AUM 65,782,066 $ 65,802,335 $ 65,123,126 $ 65,520,626 $ 66,600,260 $ 64,902,211 $ 66,216,755 $ LP Capital Invested 66,427 $
41,332 $
315,757 $
32,804 $
135,105 $
201,909 $
483,666 $
Total Capital Invested
71,132 $
39,877 $
329,793 $
32,809 $
141,699 $
212,491 $
504,301 $ |
 Blackstone 17 Credit (Dollars in Thousands) 3Q'15 4Q'15 1Q'16 2Q'16 3Q'16 3Q'15 YTD 3Q'16 YTD Revenues Management Fees, Net Base Management Fees 126,533 $
125,805 $
125,990 $
131,392 $
133,867 $
375,177 $
391,249 $
Transaction and Other Fees, Net
1,289 1,565 1,342 1,424 1,823 4,806 4,589 Management Fee Offsets
(11,260) (7,585) (9,658) (9,982) (7,091) (22,480) (26,731) Total Management Fees, Net
116,562 119,785 117,674 122,834 128,599 357,503 369,107 Performance Fees
Realized Carried Interest
51,606 4,258 - 296
15,644 91,898 15,940 Realized Incentive Fees
28,123 33,158 21,697 23,515 21,866 76,238 67,078 Unrealized Carried Interest
(112,366) (118,721) (14,779) 87,295 75,093 (80,099) 147,609 Unrealized Incentive Fees
(26,419) (9,193) 270 1,029
5,689
(10,774)
6,988
Total Performance
Fees (59,056)
(90,498)
7,188
112,135
118,292
77,263
237,615
Investment Income (Loss)
Realized 1,735 491 (2,974)
11,330
(328)
6,695 8,028 Unrealized (10,177) (15,728) (17,561) 8,412 12,875 (530) 3,726
Total Investment Income
(Loss) (8,442)
(15,237)
(20,535)
19,742
12,547
6,165
11,754
Interest Income and Dividend
Revenue 6,053
6,957
6,748
7,428
6,769
17,642
20,945
Other
(73) 1,717
(1,364)
1,795
(28)
3,454 403 Total Revenues
55,044 22,724 109,711 263,934 266,179 462,027 639,824 Expenses Compensation 51,324 41,864 52,382 55,691 47,614 148,325 155,687 Performance Fee Compensation
Realized Carried Interest
28,950 2,259 - 194
7,267 50,582 7,461 Realized Incentive Fees
13,659 15,598 10,127 10,626 10,770 34,515 31,523 Unrealized Carried Interest
(61,190) (61,651) (6,998) 41,257 39,681 (45,349) 73,940 Unrealized Incentive Fees
(12,846) (4,421) 485 (333)
2,722 (3,974) 2,874 Total Compensation and Benefits
19,897 (6,351) 55,996 107,435 108,054 184,099 271,485 Other Operating Expenses
24,898 23,353 26,220 29,464 28,016 70,273 83,700 Total Expenses 44,795 17,002 82,216 136,899 136,070 254,372 355,185 Economic Income
10,249 $
5,722 $
27,495 $
127,035 $
130,109 $
207,655 $
284,639 $
Total Assets Under Management
80,841,348 $ 79,081,252 $ 78,656,291 $ 84,749,076 $ 89,327,781 $ 80,841,348 $ 89,327,781 $ Fee-Earning Assets Under Management 60,337,992 $ 61,684,380 $ 62,094,760 $ 64,820,990 $ 66,189,763 $ 60,337,992 $ 66,189,763 $ Weighted Average Fee-Earning AUM 60,243,777 $ 60,598,308 $ 61,584,275 $ 63,656,504 $ 65,648,573 $ 60,272,670 $ 63,633,382 $ LP Capital Invested 424,365 $
2,496,709 $ 586,935 $
699,516 $
588,389 $
1,286,556 $ 1,874,840 $ Total Capital Invested 432,212 $
2,601,675 $ 568,731 $
822,172 $
605,383 $
1,482,324 $ 1,996,286 $ |
 Blackstone 18 Financial Advisory Note: On October 1,
2015, Blackstone spun-off its Financial Advisory businesses, which did not include Blackstone’s capital markets services business. The results of Blackstone’s
capital markets services business have been reclassified from the Financial
Advisory segment to the Private Equity segment. All prior periods have been recast to reflect this reclassification. (Dollars in Thousands) 3Q'15 4Q'15 1Q'16 2Q'16 3Q'16 3Q'15 YTD 3Q'16 YTD Revenues Advisory Fees 143,606 $
- $
-
$
- $
-
$
297,570 $
- $
Transaction and Other Fees, Net
146 -
- -
- 162
- Total Advisory and Transaction Fees
143,752 - -
- -
297,732 - Investment Income (Loss)
Realized (479) -
- -
- (868)
- Unrealized
(998) -
- -
- (39)
- Total Investment Income (Loss)
(1,477) - -
- -
(907) -
Interest Income and Dividend Revenue 6,094 - -
- -
12,520 - Other
(235) -
- -
- (1,303)
-
Total Revenues 148,134 - -
- -
308,042 - Expenses
Compensation 64,169 - -
- -
180,917 - Total Compensation and Benefits
64,169 - -
- -
180,917 - Other Operating Expenses
22,658 - -
- -
62,326 - Total Expenses
86,827 - -
- -
243,243 - Economic Income
61,307 $
- $
-
$
- $
-
$
64,799 $
- $
|
 Blackstone 19 Unitholder Distribution A detailed description of Blackstone’s distribution policy and the definition of Distributable Earnings can be found on page 32, Definitions and Distribution Policy. DE before Certain Payables represents Distributable Earnings before the deduction for the Payable Under Tax Receivable Agreement and tax expense (benefit) of wholly owned subsidiaries. Per
Unit calculations are based on end of period Total Common Units Outstanding (page 31, Unit Rollforward); actual distributions are paid to unitholders as of the applicable record date. Retained capital is withheld
pro-rata from common and Blackstone Holdings Partnership unitholders. Common unitholders’ share was $45.5 million for 3Q’16 and $116.4 million for 3Q’16 YTD. Generated $0.48 of Distributable Earnings per common unit during the quarter, up 14% from the prior quarter, bringing the year-to-date amount to $1.23 per common unit. Declared a quarterly distribution of $0.41 per common unit to record holders as of November 7, 2016; payable on November 14, 2016. % Change % Change (Dollars in Thousands, Except per Unit Data) 3Q'15 4Q'15 1Q'16 2Q'16 3Q'16 vs. 3Q'15 3Q'15 YTD 3Q'16 YTD vs. 3Q'15 YTD Distributable Earnings (“DE”) 691,534 $ 878,027 $ 387,967 $ 503,459 $ 593,028 $ (14)% 2,965,661 $ 1,484,454 $ (50)% Add: Other Payables Attributable to Common Unitholders - 26,918 - 10,438 30,576 n/m 7,288 41,014 463% DE before Certain Payables 691,534 904,945 387,967 513,897 623,604 (10)% 2,972,949 1,525,468 (49)% Percent to Common Unitholders 54% 54% 54% 54% 54% 53% 54% DE before Certain Payables Attributable
to Common Unitholders
370,902 487,075 210,286 279,357 339,837 (8)% 1,588,630 829,480 (48)% Less: Other Payables Attributable to Common Unitholders - (26,918) - (10,438) (30,576) n/m (7,288) (41,014) 463% DE Attributable to Common Unitholders 370,902 460,157 210,286 268,919 309,261 (17)% 1,581,342 788,466 (50)% DE per Common Unit 0.58 $ 0.72 $ 0.33 $ 0.42 $ 0.48 $
(17)% 2.51 $ 1.23 $ (51)% Less: Retained Capital per Common Unit (0.09) $ (0.11) $ (0.05) $ (0.06) $ (0.07) $ (22)% (0.39) $ (0.18) $ (54)% Actual Distribution per Common Unit 0.49 $ 0.61 $ 0.28 $ 0.36 $ 0.41 $
(16)% 2.12 $ 1.05 $ (50)% Record Date Nov 7, 2016 Payable Date Nov 14, 2016 |
 Blackstone 20 3Q’16 Total AUM Rollforward (Dollars in Millions) 3Q’16 LTM Total AUM Rollforward (Dollars in Millions) Inflows include contributions, capital raised, other increases in available capital, purchases and acquisitions. Outflows represent
redemptions, client withdrawals and other decreases in available
capital. Realizations represent realizations from the disposition of assets. Market Activity represents gains (losses) on portfolio investments and impact of foreign exchange rate fluctuations. Total Assets Under Management Private Equity Real Estate Hedge Fund Solutions Credit Private Real Hedge Fund Equity Estate Solutions 2Q'16 99,686 $ 103,197 $ 68,650 $ 84,749 $ 356,282 $ Inflows 3,361 3,233 2,425 5,714 14,733 Outflows (270) (22) (2,058) (1,128) (3,478) Realizations (4,469) (7,346) (20) (1,717) (13,551) Net Inflows (Outflows) (1,378) (4,135) 348 2,869 (2,297) Market Activity 1,415 2,815 1,116 1,710 7,055 3Q'16 99,722 $ 101,877 $ 70,114 $ 89,328 $ 361,040 $ QoQ Increase (Decrease) 0% (1)% 2% 5% 1% Credit Total Private Real Hedge Fund Equity Estate Solutions 3Q'15 91,491 $ 93,188 $ 68,406 $ 80,841 $ 333,926 $ Inflows 18,859 21,343 9,984 18,330 68,515 Outflows (1,303) (509) (8,223) (5,189) (15,225) Realizations (13,840) (18,277) (354) (5,925) (38,396) Net Inflows 3,716 2,556 1,407 7,216 14,895 Market Activity 4,516 6,133 300 1,271 12,219 3Q'16 99,722 $ 101,877 $ 70,114 $ 89,328 $ 361,040 $ YoY Increase 9% 9% 2% 10% 8% Credit Total Inflows: Strategic Partners ($2.1 billion); Tactical Opportunities ($812 million); Core
Private Equity ($257 million). Realizations: BCP VI ($1.4
billion); BCP V ($1.2 billion); BCP
co-investment ($599 million); Tactical Opportunities ($578
million); Strategic Partners ($442 million).
Market Activity:
BCP VI
($850 million); Tactical Opportunities ($445 million).
Inflows: Recycled capital from BREP VIII ($1.4 billion) and BREP Asia ($573 million); fifth European opportunistic fund ($429 million); third
mezzanine debt fund ($277 million); U.S.
core+ funds ($224 million). Realizations: BREP VIII ($1.6
billion); BREP VII ($1.5 billion); BREP
co-investment ($1.2 billion); BREP
VI ($979 million); BREP
Asia
($842
million).
Market Activity:
Carrying value increases of 3.7% and 2.9% within the
opportunistic and core+ funds, respectively. Inflows:
Individual investor and specialized solutions ($1.1 billion); customized solutions ($692 million); commingled products ($490 million). Outflows: Individual investor and specialized solutions ($1.1 billion); customized solutions ($827
million); commingled products ($77 million).
Market Activity:
BAAM’s Principal Solutions Composite up 2.9% gross (2.8%
net) during the quarter. Inflows: Mezzanine strategies ($3.4 billion); Long Only ($957 million); one new CLO ($509 million); BDCs ($377 million); hedge fund strategies ($320 million). Outflows: BDCs ($454 million); hedge fund strategies ($426 million); Long Only ($168 million). |
 Blackstone 21 Inflows include contributions, capital raised, other increases in available capital, purchases and acquisitions. Outflows represent
redemptions, client withdrawals and other decreases in available
capital. Realizations represent realizations from the disposition of assets. Market Activity represents gains (losses) on portfolio investments and impact of foreign exchange rate fluctuations. 3Q’16 Fee-Earning AUM Rollforward (Dollars in Millions) 3Q’16 LTM Fee-Earning AUM Rollforward (Dollars in Millions) Private Equity Real Estate Hedge Fund Solutions Credit Inflows: BREDS drawdown funds ($460 million); BPP ($386 million); BREDS liquid funds ($149 million). Realizations: BREP opportunistic ($1.1 billion); BREP co-investment ($637 million); BREDS ($560 million); BPP ($124 million). Inflows: Individual investor and specialized solutions ($1.1 billion); customized solutions
($692 million); commingled products ($490 million).
Outflows:
Individual investor and specialized solutions ($1.1 billion);
customized solutions ($827 million); commingled
products ($77 million). Inflows: Long Only ($957 million); one new CLO ($505 million); mezzanine strategies ($447 million); hedge fund strategies ($439 million);
BDCs
($377 million).
Realizations: Capital returned to
investors for CLOs outside investment periods ($914 million); dividends from BDCs
($238 million);
mezzanine strategies ($180 million).
Inflows: Strategic Partners ($2.1
billion); Tactical Opportunities ($390 million). Realizations: BCP V ($881 million); BCP VI ($753 million); Strategic Partners ($482 million); Tactical Opportunities ($379 million).
Fee-Earning Assets Under Management
Private Real Hedge Fund Equity Estate Solutions 2Q'16 69,467 $ 66,745 $ 64,974 $ 64,821 $ 266,007 $ Inflows 2,536 1,036 2,454 2,870 8,895 Outflows (209) (8) (2,058) (1,086) (3,361) Realizations (2,620) (2,385) (17) (1,567) (6,589) Net Inflows (Outflows) (293) (1,358) 378 217 (1,055) Market Activity 174 398 1,083 1,152 2,806 3Q'16 69,348 $ 65,785 $ 66,435 $ 66,190 $ 267,758 $ QoQ Increase (Decrease) (0)% (1)% 2% 2% 1% Credit Total Private Real Hedge Fund Equity Estate Solutions 3Q'15 50,560 $ 64,859 $ 65,182 $ 60,338 $ 240,939 $ Inflows 29,185 8,295 9,364 14,438 61,282 Outflows (3,175) (182) (8,109) (4,361) (15,828) Realizations (7,355) (7,992) (331) (5,112) (20,790) Net Inflows 18,655 120 924 4,965 24,664 Market Activity 133 806 329 887 2,154 3Q'16 69,348 $ 65,785 $ 66,435 $ 66,190 $ 267,758 $ YoY Increase 37% 1% 2% 10% 11% Credit Total |
 Blackstone 22 Net Accrued Performance Fees Net Accrued Performance Fees are presented net of performance fee compensation and do not include clawback amounts, if any, which are
disclosed in the 10-K/Q. Net Realized Performance Fees are
included in DE. Net Realized Performance Fees represents Performance Fees realized, but not yet distributed as of the reporting date and included in the Net Accrued Performance Fee balance. When these fees are received, the receivable is reduced without further impacting DE. Per Unit calculations are
based on end of period DE Units Outstanding (see
page 31, Unit Rollforward). $3.3 billion Net Accrued Performance Fees at 3Q’16 $2.80 per unit Net Accrued Performance Fees at 3Q’16 (Dollars in Millions, Except per Unit Data) 2Q'16 3Q'16 3Q'16 Per Unit QoQ Change Private Equity BCP IV Carried Interest 143 $
158
$
0.13
$
15
$
BCP V
Carried Interest 373
306 0.26 (67) BCP VI Carried Interest 385 484 0.41 99 BEP I Carried Interest 61 70 0.06 9 Tactical Opportunities Carried Interest 59 79 0.07 20 BTAS Carried Interest 7 10 0.01 3 Strategic Partners Carried Interest 35 35 0.03 - Other Carried Interest 1 2 - 1 Total Private Equity 1,064 $
1,144 $
0.96 $
80 $
Real Estate
BREP IV Carried Interest
9 8 0.01 (1) BREP V Carried Interest 390 331 0.28 (59) BREP VI Carried Interest 612 488 0.41 (124) BREP VII Carried Interest 584 551 0.46 (33) BREP VIII Carried Interest 84 132 0.11 48 BREP Europe III Carried Interest 156 152 0.13 (4) BREP Europe IV Carried Interest 124 150 0.13 26 BREP Asia Carried Interest 82 102 0.09 20 BPP Carried Interest 44 52 0.04 8 BPP Incentive Fees 21 28 0.02 7 BREDS Carried Interest 14 14 0.01 - BREDS Incentive Fees 3 2 - (1) Asia Platform Incentive Fees 7 7 0.01 - Total Real Estate 2,130 $
2,017 $
1.69 $
(113) $
Hedge Fund Solutions
Incentive Fees
6 15 0.01 9 Total Hedge Fund Solutions 6 $
15
$
0.01 $
9 $
Credit
Carried Interest
102 139 0.12 37 Incentive Fees 19 20 0.02 1 Total Credit 121 $
159
$
0.13
$
38
$
Total
Blackstone Carried Interest
3,265 3,263 2.74 (2) Incentive Fees 56 72 0.06 16 Net Accrued Performance Fees 3,321 $
3,335 $
2.80 $
14 $
Memo: Net Realized Performance Fees
121 $
85 $
0.07
$
(36)
$
|
 Blackstone 23 Investment Records as of September 30, 2016 Continued... (a) Committed Available Unrealized Investments Realized Investments Total Investments Net IRRs (d) (Dollars in Thousands, Except Where Noted) Capital Capital (b) Value MOIC (c) % Public Value MOIC (c) Value MOIC (c) Realized Total Private Equity BCP I (Oct 1987 / Oct 1993) 859,081 $ - $
- $
n/a - 1,741,738 $ 2.6x 1,741,738 $ 2.6x 19% 19% BCP II (Oct 1993 / Aug 1997) 1,361,100 - - n/a - 3,256,819 2.5x 3,256,819 2.5x 32% 32% BCP III (Aug 1997 / Nov 2002) 3,967,422 - - n/a - 9,184,688 2.3x 9,184,688 2.3x 14% 14% BCOM (Jun 2000 / Jun 2006) 2,137,330 24,575 21,359 1.7x - 2,949,591 1.4x 2,970,950 1.4x 6% 6% BCP IV (Nov 2002 / Dec 2005) 6,773,182 217,886 2,125,204 1.4x 29% 19,095,827 3.2x 21,221,031 2.8x 43% 36% BCP V (Dec 2005 / Jan 2011) 21,017,728 1,253,958 6,849,581 1.7x 75% 30,692,791 1.9x 37,542,372 1.9x 9% 8% BCP VI (Jan 2011 / May 2016) 15,187,689 1,908,754 15,469,123 1.3x 23% 3,517,318 1.8x 18,986,441 1.4x 37% 11% BEP I (Aug 2011 / Feb 2015) 2,436,822 162,546 2,786,424 1.4x 27% 679,656 1.8x 3,466,080 1.5x 44% 14% BEP II (Feb 2015 / Feb 2021) 4,951,351 4,309,235 445,946 1.1x - - n/a 445,946 1.1x n/a n/m BCP VII (May 2016 / May 2022) 18,898,630 18,772,247 51,636 1.6x - - n/a 51,636 1.6x n/a n/m Total Corporate Private Equity 77,590,335 $ 26,649,201 $ 27,749,273 $ 1.4x 36% 71,118,428 $ 2.2x 98,867,701 $ 1.9x 18% 15% Tactical Opportunities 13,179,861 6,368,316 7,412,876 1.2x 5% 1,898,361 1.5x 9,311,237 1.2x 29% 11% Tactical Opportunities Co-Investment and Other 1,986,509 702,324 1,442,741 1.2x - 276,909 1.4x 1,719,650 1.2x n/a 15% Strategic Partners I-V and Co-Investment (e) 12,143,182 2,070,134 3,491,609 n/m - 13,620,041 n/m 17,111,650 1.5x n/a 13% Strategic Partners VI LBO, RE and SMA (e) 7,402,171 2,440,032 3,839,293 n/m - 781,874 n/m 4,621,167 1.3x n/a 30% Strategic Partners VII (e) 7,147,505 6,887,623 159,764 n/m - - n/a 159,764 1.1x n/a n/m BCEP (f) 3,424,750 3,424,750 - n/a - - n/a - n/a n/a n/a Other Funds and Co-Investment (g) 1,506,482 468,858 53,053 0.6x 60% 577,706 1.0x 630,759 0.9x n/a n/m Real Estate Dollar Pre-BREP 140,714 $ - $
- $
n/a - 345,190 $ 2.5x 345,190 $ 2.5x 33% 33% BREP I (Sep 1994 / Oct 1996) 380,708 - - n/a - 1,327,708 2.8x 1,327,708 2.8x 40% 40% BREP II (Oct 1996 / Mar 1999) 1,198,339 - - n/a - 2,531,614 2.1x 2,531,614 2.1x 19% 19% BREP III (Apr 1999 / Apr 2003) 1,522,708 - - n/a - 3,330,406 2.4x 3,330,406 2.4x 21% 21% BREP IV (Apr 2003 / Dec 2005) 2,198,694 - 477,090 0.5x 17% 4,058,230 2.2x 4,535,320 1.7x 35% 12% BREP V (Dec 2005 / Feb 2007) 5,539,418 - 3,055,644 2.2x 27% 9,960,604 2.3x 13,016,248 2.3x 12% 11% BREP VI (Feb 2007 / Aug 2011) 11,060,444 554,547 6,191,837 2.2x 66% 19,656,554 2.4x 25,848,391 2.4x 15% 13% BREP VII (Aug 2011 / Apr 2015) 13,491,677 2,427,496 14,835,954 1.6x - 10,271,033 1.9x 25,106,987 1.7x 29% 20% BREP VIII (Apr 2015 / Oct 2020) 16,148,771 11,221,733 6,150,674 1.2x 1% 1,629,609 1.2x 7,780,283 1.2x 19% 20% Total Global BREP 51,681,473 $ 14,203,776 $ 30,711,199 $ 1.6x 17% 53,110,948 $ 2.2x 83,822,147 $ 1.9x 20% 16% Euro BREP Int'l (Jan 2001 / Sep 2005) 824,172 € - € - € n/a - 1,365,751 € 2.1x 1,365,751 € 2.1x 23% 23% BREP Int'l II (Sep 2005 / Jun 2008) 1,629,748 - 527,954 1.1x 67% 1,716,152 1.8x 2,244,106 1.6x 8% 5% BREP Europe III (Jun 2008 / Sep 2013) 3,205,140 467,500 2,947,028 1.8x - 2,719,888 2.1x 5,666,916 1.9x 23% 16% BREP Europe IV (Sep 2013 / Mar 2019) 6,704,537 1,725,273 7,005,289 1.3x 2% 654,145 1.4x 7,659,434 1.3x 26% 13% BREP Europe V (TBD) 6,241,060 6,265,288 - n/a - - n/a - n/a n/a n/a Total Euro BREP 18,604,657 € 8,458,061 € 10,480,271 € 1.4x 5% 6,455,936 € 1.9x 16,936,207 € 1.6x 16% 12% BREP Co-Investment (h) 6,819,065 $ 146,573 $ 3,968,497 $ 1.7x 37% 8,973,242 $ 2.0x 12,941,739 $ 1.9x 17% 15% BREP Asia (Jun 2013 / Dec 2017) 5,082,579 3,219,810 2,755,119 1.5x 2% 1,261,164 1.5x 4,016,283 1.5x 16% 17% Total BREP 86,565,707 $ 27,055,872 $ 50,490,157 $ 1.5x 14% 71,952,026 $ 2.1x 122,442,183 $ 1.8x 19% 16% BPP (i) 12,143,289 $ 3,465,213 $ 10,493,724 $ 1.2x - 107,286 $ 1.9x 10,601,010 $ 1.2x 36% 14% BREDS (j) 11,271,187 $ 6,860,509 $ 2,271,859 $ 1.2x - 6,259,037 $ 1.3x 8,530,896 $ 1.3x 12% 11% |
 Blackstone 24 Investment Records as of September 30, 2016 (a) – Continued The returns presented herein represent those of the applicable Blackstone Funds and not those of The Blackstone Group L.P.
n/m Not meaningful. n/a Not applicable. (a) Preliminary. (b) Available Capital represents total investable capital commitments, including side-by-side, adjusted for certain expenses and
expired or recallable capital and may include leverage, less
invested capital. This amount is not reduced by outstanding commitments to investments. (c) Multiple of Invested Capital (“MOIC”) represents carrying value, before management fees, expenses and Carried Interest, divided
by invested capital. (d)
Net Internal Rate of Return (“IRR”) represents the annualized
inception to September 30, 2016 IRR on total invested capital based on realized proceeds and unrealized value, as applicable, after management fees, expenses and Carried Interest.
(e) Realizations are treated as return of capital until fully recovered and therefore unrealized and realized MOICs are not meaningful. (f) BCEP, or Blackstone Core Equity Partners, is a core private equity fund which invests with a more modest risk profile and longer hold
period. (g)
Returns for Other Funds and Co-Investment are not meaningful as these funds
have limited transaction activity. (h)
BREP Co-Investment represents co-investment capital raised for various
BREP investments. The Net IRR reflected is calculated by aggregating each co- investment’s realized proceeds and unrealized value, as applicable, after management fees, expenses and Carried
Interest. (i)
BPP represents the core+ real estate funds which invest with a more modest risk
profile and lower leverage. (j)
Excludes Capital Trust drawdown funds.
(k) BSCH, or Blackstone Strategic Capital Holdings, is a permanent capital vehicle focused on acquiring strategic minority positions in alternative asset managers. (l) Funds presented represent the flagship credit drawdown funds only. The Total Credit Net IRR is the combined IRR of the six credit
drawdown funds presented.
Committed Available Unrealized Investments Realized Investments Total Investments Net IRRs (d) (Dollars in Thousands, Except Where Noted) Capital Capital (b) Value MOIC (c) % Public Value MOIC (c) Value MOIC (c) Realized Total Hedge Fund Solutions BSCH (Dec 2013 / Jun 2020) (k) 3,300,600 $ 2,630,702 $ 677,190 $ 1.0x - 82,913 $
n/a 760,103 $ 1.2x n/a 3% BSCH Co-Investment 75,500 31,237 44,495 1.0x - 1,427 n/a 45,922 1.0x n/a 1% Total Hedge Fund Solutions 3,376,100 $ 2,661,939 $ 721,685 $ 1.0x - 84,340 $
n/a 806,025 $ 1.2x n/a 3% Credit (l) Mezzanine I (Jul 2007 / Oct 2011) 2,000,000 $ 99,280 $
231,180 $ 1.6x - 4,613,434 $ 1.6x 4,844,614 $ 1.6x n/a 17% Mezzanine II (Nov 2011 / Nov 2016) 4,120,000 1,441,986 3,305,746 1.1x - 2,167,785 1.5x 5,473,531 1.2x n/a 14% Mezzanine III (Sep 2016 / Sep 2021) 6,482,653 6,385,903 96,857 1.0x - - n/a
96,857 1.0x n/a n/m Rescue Lending I (Sep 2009 / May 2013) 3,253,143 399,836 1,405,895 1.2x - 4,499,705 1.5x 5,905,600 1.4x n/a 11% Rescue Lending II (Jun 2013 / Jun 2018) 5,125,000 2,531,694 3,134,660 1.2x - 271,552 1.2x 3,406,212 1.2x n/a 16% Energy Select Opportunities (Nov 2015 / Nov 2018) 2,856,866 2,576,358 384,627 1.2x - 131,268 1.4x 515,895 1.3x n/a n/m Euro European Senior Debt Fund (Feb 2015 / Feb 2018) 1,964,689 € 3,258,998 € 646,742 € 1.0x - 142,288 € 1.2x 789,030 € 1.0x n/a n/m Total Credit 26,104,072 $ 17,097,521 $ 9,285,223 $ 1.1x - 11,841,214 $ 1.5x 21,126,437 $ 1.3x n/a 14% |
 Blackstone 25 Reconciliation of GAAP to Non-GAAP Measures Notes on page 26. (Dollars in Thousands) 3Q'15 4Q'15 1Q'16 (m) 2Q'16 3Q'16 3Q'15 YTD 3Q'16 YTD Net Income (Loss) Attributable to The Blackstone Group L.P. (254,697) $ 200,870 $ 159,753 $ 198,626 $ 312,905 $ 508,919 $ 671,284 $ Net Income (Loss) Attributable to Non-Controlling Interests in Blackstone Holdings
(247,318) 150,734 131,202 201,805 285,267 532,782 618,274 Net Income Attributable to Non-Controlling Interests in Consolidated Entities
30,671 40,717 40,086 64,729 82,653 179,183 187,468 Net Income (Loss) Attributable to Redeemable Non-Controlling Interests in Consolidated Entities (12,520) 2,358 (6,401) (2,049) 10,764 8,787 2,314 Net Income (Loss) (483,864) $ 394,679 $ 324,640 $ 463,111 $ 691,589 $ 1,229,671 $ 1,479,340 $ Provision for Taxes 1,573 46,230 9,146 47,415 27,714 144,168 84,275 Income (Loss) Before Provision for Taxes (482,291) $ 440,909 $ 333,786 $ 510,526 $ 719,303 $ 1,373,839 $ 1,563,615 $ Transaction-Related Charges (a) 80,962 (15,279) 64,136 69,956 60,029 504,842 194,121 Amortization of Intangibles (b) 30,624 23,287 23,208 23,208 22,054 81,243 68,470 (Income) Associated with Non-Controlling Interests of Consolidated Entities
(c) (18,151) (43,075) (33,685) (62,680) (93,417) (187,970) (189,782) Economic Income (Loss) (388,856) $ 405,842 $ 387,445 $ 541,010 $ 707,969 $ 1,771,954 $ 1,636,424 $ Taxes (d) (27,070) 29,849 (16,794) (21,234) (20,985) (57,376) (59,013) Economic Net Income (Loss) (415,926) $ 435,691 $ 370,651 $ 519,776 $ 686,984 $ 1,714,578 $ 1,577,411 $ Taxes (d) 27,070 (29,849) 16,794 21,234 20,985 57,376 59,013 Performance Fee Adjustment (e) 639,349 (194,026) (314,065) (449,372) (672,646) (1,604,051) (1,436,083) Investment (Income) Loss Adjustment (f) 136,131 11,435 26,650 (59,771) (87,887) (64,284) (121,008) Net Interest Loss (g) 9,522 11,846 13,351 13,546 14,184 32,335 41,081 Performance Fee Compensation and Benefits Adjustment (h) (130,479) 75,782 106,075 180,723 267,415 488,778 554,213 Fee Related Earnings 265,667 $ 310,879 $ 219,456 $ 226,136 $ 229,035 $ 624,732 $ 674,627 $ Net Realized Performance Fees (i) 357,114 505,540 186,733 250,265 350,454 2,015,336 787,452 Realized Investment Income (Loss) (j) 87,526 86,993 (10,101) 53,670 60,634 331,815 104,203 Net Interest (Loss) (g) (9,522) (11,846) (13,351) (13,546) (14,184) (32,335) (41,081) Taxes and Related Payables Including Payable Under Tax Receivable Agreement
(k) (27,070) (25,819) (16,794) (31,588) (51,089) (64,651) (99,471) Equity-Based Compensation (l) 17,819 12,280 22,024 18,522 18,178 90,764 58,724 Distributable Earnings 691,534 $ 878,027 $ 387,967 $ 503,459 $ 593,028 $ 2,965,661 $ 1,484,454 $ Interest Expense 44,981 46,511 48,432 48,779 47,265 129,271 144,476 Taxes and Related Payables Including Payable Under Tax Receivable Agreement
(k) 27,070 25,819 16,794 31,588 51,089 64,651 99,471 Depreciation and Amortization 6,719 6,852 6,292 6,331 7,338 20,361 19,961 Adjusted EBITDA 770,304 $ 957,209 $ 459,485 $ 590,157 $ 698,720 $ 3,179,944 $ 1,748,362 $ |
 Blackstone 26 Reconciliation of GAAP to Non-GAAP Measures – Notes Note: See page 32, Definitions and Distribution Policy. (a) This adjustment adds back to Income (Loss) Before Provision (Benefit) for Taxes amounts for Transaction-Related Charges which
include principally equity-based compensation charges
associated with Blackstone’s initial public offering and long-term retention programs outside of annual deferred compensation and other corporate actions.
(b) This adjustment adds back to Income (Loss) Before Provision (Benefit) for Taxes amounts for the Amortization of Intangibles which
are associated with Blackstone’s initial public offering and
other corporate actions. (c)
This adjustment adds back to Income (Loss) Before Provision (Benefit) for Taxes
the amount of (Income) Loss Associated with Non- Controlling
Interests of Consolidated Entities and includes the amount of Management Fee Revenues associated with Consolidated CLO Entities. (d) Taxes represent the total GAAP tax provision adjusted to include only the current tax provision (benefit) calculated on Income (Loss)
Before Provision for Taxes.
(e) This adjustment removes from EI the total segment amount of Performance Fees.
(f) This adjustment removes from EI the total segment amount of Investment Income (Loss).
(g) This adjustment represents Interest Income and Dividend Revenue less Interest Expense.
(h) This adjustment removes from expenses the compensation and benefit amounts related to Blackstone’s profit sharing plans related
to Performance Fees.
(i) Represents the adjustment for realized Performance Fees net of corresponding actual amounts due under Blackstone’s profit
sharing plans related thereto. Equals the sum of Net Realized
Incentive Fees and Net Realized Carried Interest. (j)
Represents the adjustment for Blackstone’s Realized Investment Income
(Loss). (k)
Taxes and Related Payables Including Payable Under Tax Receivable Agreement
represent the total GAAP tax provision adjusted to include only
the current tax provision (benefit) calculated on Income (Loss)
Before Provision for Taxes and the Payable Under Tax Receivable
Agreement. (l)
Represents equity-based award expense included in EI, which excludes all
transaction-related equity-based charges.
(m) Blackstone adopted new GAAP stock compensation guidance in 2Q’16 as of January 1, 2016. Adoption changed Provision for Taxes,
Net Income, Net Income Attributable to The Blackstone Group L.P.
and the number of GAAP Weighted-Average Units
Outstanding - Diluted in 1Q’16. Such amounts have been recast in this presentation from the amounts originally reported in
1Q’16. |
 Blackstone 27 Reconciliation of GAAP to Total Segment Measures Notes on page 28. Continued... (Dollars in Thousands) 1Q'15 2Q'15 3Q'15 4Q'15 1Q'16 2Q'16 3Q'16 3Q'15 YTD 3Q'16 YTD Fee Revenues GAAP Management and Advisory Fees, Net 616,768 $ 574,132 $ 703,596 $ 648,009 $ 608,906 $ 607,823 $ 596,154 $ 1,894,496 $ 1,812,883 $ Other (5,641) 3,976 (813) 10,260 (5,612) 7,935 (423) (2,478) 1,900 GAAP 611,127 $ 578,108 $ 702,783 $ 658,269 $ 603,294 $ 615,758 $ 595,731 $ 1,892,018 $ 1,814,783 $ Elimination Adjustment (a) 3,764 12,649 5,043 1,662 3,659 5,008 5,524 21,456 14,191 Segment Management and Advisory Fees, Net 619,763 586,784 708,667 649,691 613,201 612,220 601,680 1,915,214 1,827,101 Other (4,872) 3,973 (841) 10,240 (6,248) 8,546 (425) (1,740) 1,873 Total Segment 614,891 $ 590,757 $ 707,826 $ 659,931 $ 606,953 $ 620,766 $ 601,255 $ 1,913,474 $ 1,828,974 $ Performance Fees GAAP 1,673,108 568,305 (638,108) 193,361 314,493 449,243 671,032 1,603,305 1,434,768 Elimination Adjustment (a) 628 1,359 (1,241) 665 (428) 129 1,614 746 1,315 Total Segment 1,673,736 $ 569,664 $ (639,349) $ 194,026 $ 314,065 $ 449,372 $ 672,646 $ 1,604,051 $ 1,436,083 $ Investment Income (Loss) GAAP 206,203 56,824 (79,346) 20,961 (8,508) 105,139 143,103 183,681 239,734 Consolidation and Elimination Adjustment (b) (16,562) (46,050) (56,785) (32,396) (18,142) (45,368) (55,216) (119,397) (118,726) Total Segment 189,641 $ 10,774 $ (136,131) $ (11,435) $ (26,650) $ 59,771 $ 87,887 $ 64,284 $ 121,008 $ Interest and Dividend Revenue GAAP 21,920 21,965 26,244 24,828 23,075 22,286 21,819 70,129 67,180 Elimination Adjustment (c) 8,531 9,061 9,215 9,837 12,006 12,947 11,262 26,807 36,215 Total Segment 30,451 $ 31,026 $ 35,459 $ 34,665 $ 35,081 $ 35,233 $ 33,081 $ 96,936 $ 103,395 $ Total Revenues GAAP 2,512,358 1,225,202 11,573 897,419 932,354 1,192,426 1,431,685 3,749,133 3,556,465 Consolidation and Elimination Adjustment (d) (3,639) (22,981) (43,768) (20,232) (2,905) (27,284) (36,816) (70,388) (67,005) Total Segment 2,508,719 $ 1,202,221 $ (32,195) $ 877,187 $ 929,449 $ 1,165,142 $ 1,394,869 $ 3,678,745 $ 3,489,460 $ Compensation GAAP 559,559 473,019 393,655 299,958 346,003 355,424 329,634 1,426,233 1,031,061 Consolidation Adjustment (e) (229,721) (183,667) (64,080) (59,504) (58,600) (69,269) (61,039) (477,468) (188,908) Total Segment 329,838 $ 289,352 $ 329,575 $ 240,454 $ 287,403 $ 286,155 $ 268,595 $ 948,765 $ 842,153 $ |
 Blackstone 28 Reconciliation of GAAP to Total Segment Measures – Continued This analysis reconciles the summarized components of Total Segments (pages 3-7) to their respective Total Segment amounts (page 13)
and to their equivalent GAAP measures
as reported on the Consolidated Statements of Operations (page 1). (a) Represents the add back of the management and performance fees earned from consolidated Blackstone Funds which have been eliminated in
consolidation. (b)
Represents the add back of investment income, including general partner income,
earned from consolidated Blackstone Funds which have been eliminated in consolidation and the inclusion of investment income on non-consolidated Blackstone Funds which in GAAP is recorded as Other Income (Loss) - Net Gains (Losses) from Fund Investment Activities. (c) Represents the elimination of inter-segment interest income and the related expense.
(d) Represents the total consolidation and elimination adjustments for Total Revenues and Total Expenses, respectively.
(e) Represents transaction-based equity compensation that is not recorded in the segments.
(f) Represents the add back for the amortization of transaction based intangibles, which is not recorded in the segments, and the elimination
of inter-segment interest expense.
(g) Represents the reversal of Fund Expenses which are attributable to consolidated Blackstone Funds and not a component of the
segments. (h)
Represents the inclusion of Other Income (Loss) which is a consolidation amount
not recorded in the segments. (i)
Represents the total consolidation and elimination adjustment between GAAP and
Total Segments. (Dollars in Thousands)
1Q'15 2Q'15 3Q'15 4Q'15 1Q'16 2Q'16 3Q'16 3Q'15 YTD 3Q'16 YTD Other Operating Expenses GAAP General, Administrative and Other 130,973 146,859 158,664 139,607 123,045 130,988 124,322 436,496 378,355 Interest Expense 31,370 37,414 36,860 38,878 37,356 36,878 37,278 105,644 111,512 GAAP 162,343 $ 184,273 $ 195,524 $ 178,485 $ 160,401 $ 167,866 $ 161,600 $ 542,140 $ 489,867 $ Consolidation and Elimination Adjustment (f) (19,061) (15,872) (37,959) (23,376) (11,875) (10,612) (10,710) (72,892) (33,197) Total Segment 143,282 $ 168,401 $ 157,565 $ 155,109 $ 148,526 $ 157,254 $ 150,890 $ 469,248 $ 456,670 $ Total Expenses GAAP 1,142,568 914,432 476,997 556,878 617,710 712,603 773,777 2,533,997 2,104,090 Less: GAAP Fund Expenses (g) (16,850) (41,699) (18,296) (2,654) (5,229) (8,592) (15,128) (76,845) (28,949) Consolidation and Elimination Adjustment (d) (248,782) (199,539) (102,040) (82,879) (70,477) (79,879) (71,749) (550,361) (222,105) Total Segment 876,936 $ 673,194 $ 356,661 $ 471,345 $ 542,004 $ 624,132 $ 686,900 $ 1,906,791 $ 1,853,036 $ GAAP Income (Loss) Before Provision for Taxes to Total Segment Economic Income (Loss)
GAAP Revenues Less Expenses 1,369,790 310,770 (465,424) 340,541 314,644 479,823 657,908 1,215,136 1,452,375 Other Income (Losses) (h) 93,555 82,015 (16,867) 100,368 19,142 30,703 61,395 158,703 111,240 Income (Loss) Before Provision for Taxes 1,463,345 392,785 (482,291) 440,909 333,786 510,526 719,303 1,373,839 1,563,615 Consolidation and Elimination Adjustment (i) 168,438 136,242 93,435 (35,067) 53,659 30,484 (11,334) 398,115 72,809 Total Segment 1,631,783 $ 529,027 $ (388,856) $ 405,842 $ 387,445 $ 541,010 $ 707,969 $ 1,771,954 $ 1,636,424 $ |
 Blackstone 29 Walkdown of Financial Metrics See page 30, Walkdown of Financial Metrics – Calculation of Certain Non-GAAP Financial Metrics for the calculation of the amounts presented herein that are not the respective
captions on page
13, Total Segments. 3Q’16
Fee Related Earnings per Unit is based on end of period DE Units Outstanding;
3Q’16 DE per Unit is based on DE attributable to Common Unit
Holders (see page 19, Unitholder Distribution) and end of period
Total Common Units Outstanding; and 3Q’16 ENI per Unit is
based on Weighted-Average ENI Adjusted Units. 3Q’16 YTD per Unit represents the sum of the last three quarters. See page 31, Unit Rollforward. (Dollars in Thousands, Except per Unit Data) 3Q'16 3Q'16 YTD Results Per Unit Results Per Unit Base Management Fees 593,509 $ 1,774,208 $ Advisory Fees 1,106 2,864 Transaction and Other Fees, Net 27,915 106,376 Management Fee Offsets (20,850) (56,347) Other Revenue (425) 1,873 Compensation (268,595) (842,153) Non-Interest Operating Expenses (103,625) (312,194) Fee Related Earnings 229,035 $ 0.19 $
674,627 $ 0.56 $
Net Realized Incentive Fees
14,859 43,298 Net Realized Carried Interest 335,595 744,154 Realized Investment Income 60,634 104,203 Net Interest (Loss) (14,184) (41,081) Taxes and Related Payables (51,089) (99,471) Equity-Based Compensation 18,178 58,724 Distributable Earnings 593,028 $ 0.48 $
1,484,454 $ 1.23 $
Net Unrealized Incentive Fees
18,664 27,634 Net Unrealized Carried Interest 36,113 66,784 Unrealized Investment Income 27,253 16,805 Add Back: Related Payables 30,104 40,458 Less: Equity-Based Compensation (18,178) (58,724) Economic Net Income 686,984 $ 0.57 $
1,577,411 $ 1.32 $ |
 Blackstone 30 Walkdown of Financial Metrics – Calculation of Certain Non-GAAP Financial Metrics Unless otherwise noted, all amounts are the respective captions from the Total Segment information.
(a) Represents equity-based award expense included in Economic Income, which excludes all transaction-related equity-based
charges. (b)
See page 25, Reconciliation of GAAP to Non-GAAP Measures for this
adjustment. (c)
Represents tax-related payables including the Payable Under Tax Receivable
Agreement, which is a component of Taxes and Related Payables.
(Dollars in Thousands)
3Q'16 YTD'16 Other Operating Expenses 150,890 $ 456,670 $ Less: Interest Expense (47,265) (144,476) Non-Interest Operating Expenses 103,625 $ 312,194 $ Realized Incentive Fees 30,295 88,108 Less: Realized Incentive Fee Compensation (15,436) (44,810) Net Realized Incentive Fees 14,859 $ 43,298 $ Realized Carried Interest 504,022 1,058,665 Less: Realized Carried Interest Compensation (168,427) (314,511) Net Realized Carried Interest 335,595 $ 744,154 $ Interest Income and Dividend Revenue 33,081 103,395 Less: Interest Expense (47,265) (144,476) Net Interest (Loss) (14,184) $ (41,081) $ Equity-Based Compensation (a) 18,178 $ 58,724 $ Taxes and Related Payables (b) (51,089) $ (99,471) $ Unrealized Incentive Fees 32,172 47,279 Less: Unrealized Incentive Fee Compensation (13,508) (19,645) Net Unrealized Incentive Fees 18,664 $ 27,634 $ Unrealized Carried Interest 106,157 242,031 Less: Unrealized Carried Interest Compensation (70,044) (175,247) Net Unrealized Carried Interest 36,113 $ 66,784 $ Related Payables (c) 30,104 $ 40,458 $ |
 Blackstone 31 Unit Rollforward (a) See page 26 note (m) for information on the 1Q’16 GAAP Weighted-Average Units Outstanding - Diluted. 3Q'15 4Q'15 1Q'16 (a) 2Q'16 3Q'16 Total GAAP Weighted-Average Common Units Outstanding - Basic 638,832,799 641,134,086 644,897,849 646,933,698 650,917,510 Adjustments: Weighted-Average Unvested Deferred Restricted Common Units - 1,794,046 1,332,772 1,309,402 1,495,331 Weighted-Average Blackstone Holdings Partnership Units - 547,495,655 - 546,235,112 543,392,474 Total GAAP Weighted-Average Units Outstanding - Diluted 638,832,799 1,190,423,787 646,230,621 1,194,478,212 1,195,805,315 Adjustments: Weighted-Average Unvested Deferred Restricted Common Units 1,913,028 - - - - Weighted-Average Blackstone Holdings Partnership Units 550,983,910 - 548,042,780 - - Weighted-Average Economic Net Income Adjusted Units 1,191,729,737 1,190,423,787 1,194,273,401 1,194,478,212 1,195,805,315 Economic Net Income Adjusted Units, End of Period 1,191,328,573 1,190,361,741 1,194,083,538 1,194,567,513 1,195,797,124 Total Common Units Outstanding 635,440,608 637,410,828 643,789,108 645,810,990 649,587,761 Adjustments: Blackstone Holdings Partnership Units 549,317,005 546,844,892 543,969,293 542,206,078 542,410,515 Distributable Earnings Units Outstanding 1,184,757,613 1,184,255,720 1,187,758,401 1,188,017,068 1,191,998,276 Common Unitholders receive tax benefits from deductions taken by Blackstone’s corporate tax paying subsidiaries and bear
responsibility for the deduction from Distributable Earnings of the Payable Under Tax Receivable Agreement and certain other tax-related payables. Distributable Earnings Units Outstanding excludes
units which are not entitled to distributions. |
 Blackstone 32 Definitions and Distribution Policy Blackstone discloses the following financial measures that are calculated and presented on the basis of methodologies other than in
accordance with generally accepted accounting principles in the
United States of America (“non-GAAP”) in this presentation: • Blackstone uses Economic Income, or “EI”, as a key measure of value creation, a benchmark of its performance and in making
resource deployment and compensation decisions across its four
segments. EI represents segment net income before taxes excluding transaction-related charges. Transaction-related charges arise from Blackstone’s initial public offering (“IPO”) and long-term retention programs outside of annual
deferred compensation and other corporate actions, including
acquisitions. Transaction-related charges include equity-based compensation charges, the amortization of intangible assets and contingent consideration associated with acquisitions. EI presents revenues and expenses on a basis that deconsolidates the investment funds
Blackstone manages. • Economic Net Income, or “ENI”, represents EI adjusted to include current period taxes. Taxes represent the total GAAP tax
provision adjusted to include only the current tax provision
(benefit) calculated on Income (Loss) Before Provision for Taxes. • Blackstone uses Fee Related Earnings, or “FRE”, which is derived from EI, as a measure to highlight earnings from operations
excluding: (a) the income related to performance fees and related
performance fee compensation, (b) income earned from Blackstone’s investments in the Blackstone Funds and (c) net interest income (loss). Blackstone uses FRE as a measure to assess whether recurring revenue from its businesses is sufficient to
adequately cover all of its operating expenses and generate
profits. FRE equals contractual fee revenues less (a) compensation expenses (which includes amortization of non-IPO and non-acquisition-related equity-based awards, but excludes amortization of IPO and acquisition-related equity-based
awards, Carried Interest and incentive fee compensation), and (b)
non-interest operating expenses. • Distributable Earnings, or “DE”, which is derived from Blackstone’s segment reported results, is a supplemental measure to
assess performance and amounts available for distributions to
Blackstone unitholders, including Blackstone personnel and others who are limited partners of the Blackstone Holdings partnerships. DE is intended to show the amount of net realized earnings without the effects of the consolidation of the Blackstone
Funds. DE, which is a component of ENI, is the sum across all
segments of: (a) Total Management and Advisory Fees, (b) Interest and Dividend Revenue, (c) Other Revenue, (d) Realized Performance Fees, and (e) Realized Investment Income (Loss); less (a) Compensation, excluding the expense of equity-based
awards, (b) Realized Performance Fee Compensation, (c) Other
Operating Expenses, and (d) Taxes and Related Payables Under the Tax Receivable Agreement. DE is reconciled to Blackstone’s Consolidated Statement of Operations.
•
Blackstone uses Adjusted Earnings Before Interest, Taxes and Depreciation and
Amortization, or “Adjusted EBITDA”, as a supplemental non-GAAP measure derived from segment reported results and may be used to assess its ability to service its borrowings. Adjusted EBITDA represents DE plus
the addition of (a) Interest Expense, (b) Taxes and Related
Payables Including Payable Under Tax Receivable Agreement, and (c) Depreciation and Amortization. Distribution Policy. Blackstone’s intention is to distribute quarterly to common unitholders approximately 85% of The Blackstone
Group L.P.’s share of Distributable Earnings, subject to
adjustment by amounts determined by Blackstone’s general partner to be necessary or appropriate to provide for the conduct of its business, to make appropriate investments in its business and funds, to comply with applicable law, any of its debt instruments or
other agreements, or to provide for future cash requirements such
as tax-related payments, clawback obligations and distributions to unitholders for any ensuing quarter. The amount to be distributed could also be adjusted upward in any one quarter. All of the foregoing is subject to the qualification that the
declaration and payment of any distributions are at the sole
discretion of Blackstone’s general partner and may change its distribution policy at any time, including, without limitation, to eliminate such distributions entirely. |
 Blackstone 33 Forward-Looking Statements This presentation may contain forward-looking statements within the meaning of Section 27A of the Securities Act of 1933 and
Section 21E of the Securities Exchange Act of 1934 which reflect
Blackstone’s current views with respect to, among other things,
Blackstone’s operations and financial performance. You can identify these
forward-looking statements by the use of words such as
“outlook,” “indicator,” “believes,”
“expects,” “potential,” “continues,” “may,” “will,” “should,” “seeks,” “approximately,” “predicts,”
“intends,” “plans,” “estimates,”
“anticipates” or the negative version of these words or other comparable words. Such forward-looking statements are subject to various risks and uncertainties. Accordingly, there are or will be important factors that could cause actual
outcomes
or results to differ materially from those indicated in these statements. Blackstone believes these factors include but are not limited to those described under the section entitled “Risk Factors” in its Annual Report on Form 10-K for the fiscal
year ended December 31, 2015, as such factors may be updated from
time to time in its periodic filings with the Securities and Exchange Commission, which are accessible on the SEC’s website at www.sec.gov. These factors should not be construed as exhaustive
and should be read in conjunction with the other cautionary
statements that are included in this presentation and in the filings. Blackstone undertakes no obligation to publicly update or review any forward-looking statement, whether as a result of new information, future
developments or otherwise.
This presentation does not constitute an offer of any Blackstone
Fund. |
Serious News for Serious Traders! Try StreetInsider.com Premium Free!
You May Also Be Interested In
- Blackstone (BX) To Buy Franchiser Tropical Smoothie Cafe - WSJ
- Blackstone to Acquire Tropical Smoothie Cafe to Propel Leading Franchisor’s Continued Expansion
- KKR & Co. (KKR) to Acquire $1.64B Student Housing Portfolio from BREIT (BX)
Create E-mail Alert Related Categories
SEC FilingsSign up for StreetInsider Free!
Receive full access to all new and archived articles, unlimited portfolio tracking, e-mail alerts, custom newswires and RSS feeds - and more!
