

Form 8-K BioMed Realty Trust Inc For: Oct 29
 Tweet
Tweet Share
ShareUNITED STATES
SECURITIES AND EXCHANGE COMMISSION
WASHINGTON, D.C. 20549
�
�
FORM 8-K
CURRENT REPORT
Pursuant to Section�13 or 15(d) of the
Securities Exchange Act of 1934
Date of Report (Date of earliest event reported): October�29, 2014
BioMed Realty Trust, Inc.
(Exact name of registrant as specified in its charter)
�
| Maryland | � | 1-32261 | � | 20-1142292 |
| (State or Other Jurisdiction of Incorporation) |
� | (Commission File No.) |
� | (I.R.S. Employer Identification No.) |
17190 Bernardo Center Drive
San Diego, California 92128
(Address of principal executive offices, including zip code)
�
�
Registrant�s telephone number, including area code: (858)�485-9840
�
�
Check the appropriate box below if the Form 8-K filing is intended to simultaneously satisfy the filing obligation of the registrant under any of the following provisions (see General Instruction A.2. below):
�
| � | � | Written communications pursuant to Rule 425 under the Securities Act (17 CFR 230.425) |
�
| � | � | Soliciting material pursuant to Rule 14a-12 under the Exchange Act (17 CFR 240.14a-12) |
�
| � | � | Pre-commencement communications pursuant to Rule 14d-2(b) under the Exchange Act (17 CFR 240.14d-2(b)) |
�
| � | � | Pre-commencement communications pursuant to Rule 13e-4(c) under the Exchange Act (17 CFR 240.13e-4(c)) |
Item�2.02 Results of Operations and Financial Condition.
On October�29, 2014, BioMed Realty Trust, Inc. issued a press release regarding its financial results for the third quarter ended September�30, 2014 which referred to certain supplemental information that is available on BioMed Realty�s website at www.biomedrealty.com. Copies of the press release and supplemental information are attached hereto as Exhibits 99.1 and 99.2, respectively, and are incorporated by reference herein.
The information contained in this Current Report, including the exhibits referenced herein, is being furnished and shall not be deemed �filed� for purposes of Section�18 of the Securities Exchange Act of 1934, as amended, or otherwise subject to the liabilities of that section. Such information shall not be incorporated by reference into any filing of BioMed Realty, whether made before or after the date hereof, regardless of any general incorporation language in such filing.
Item�9.01 Financial Statements and Exhibits.
�
| (d) | The following exhibits are furnished herewith: |
�
| Exhibit |
�� | Description of Exhibit |
| 99.1 | �� | Press release issued by BioMed Realty Trust, Inc. on October 29, 2014. |
| 99.2 | �� | BioMed Realty Trust, Inc. Supplemental Operating and Financial Data for the quarter ended September 30, 2014. |
SIGNATURES
Pursuant to the requirements of the Securities Exchange Act of 1934, the registrant has duly caused this report to be signed on its behalf by the undersigned hereunto duly authorized.
�
| Date: October�30, 2014 |
� | BIOMED REALTY TRUST, INC. | ||
| � | By: | � | /s/ Greg N. Lubushkin | |
| � | Name: Greg N. Lubushkin Title: ��Chief Financial Officer | |||
Exhibit 99.1
[BioMed Realty Trust, Inc. Logo]
�
| CONTACT: | � | Rick Howe |
| � | Senior Director, Corporate Communications | |
| � | 858.207.5859 | |
| � | [email protected] |
BIOMED REALTY TRUST REPORTS THIRD QUARTER 2014 FINANCIAL RESULTS
Positive Net Absorption Exceeds 219,000 SF; 2014 FFO Guidance Increased
SAN DIEGO, Calif. � October�29,�2014 � BioMed Realty Trust, Inc. (NYSE: BMR), the leading real estate company focusing on life sciences, today announced financial results for the third quarter ended September�30, 2014.
Third Quarter 2014 Highlights
Financial and Operating Performance
�
| � | � | � | Executed 47 leasing transactions during the quarter representing approximately 657,700 square feet, contributing to: |
�
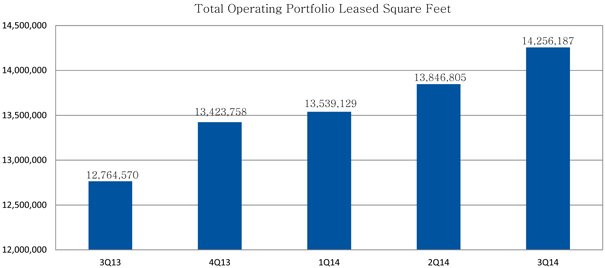
| � | � | � | Positive net absorption for the third quarter of approximately 219,700 square feet; and |
�
| � | � | � | An increase in the operating portfolio leased percentage on a weighted-average basis to 92.6% at quarter end; |
�
| � | � | � | Increased same property net operating income on a cash basis by 7.2% year-over-year; |
�
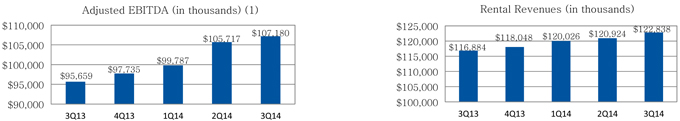
| � | � | � | Generated total revenues of approximately $168.9 million and set a new company record for rental revenues of $122.8�million; and |
�
| � | � | � | Generated funds from operations (FFO) and core funds from operations (CFFO) of $0.40 per diluted share and adjusted funds from operations (AFFO) of $0.35 per diluted share, and reported net income available to common stockholders for the quarter of approximately $16.0�million, or $0.08 per diluted share. |
New Investments
�
| � | � | � | Completed development delivery of the 3737 Market Street building on the Science Center campus in Philadelphia, Pennsylvania, which was 82.4% leased at quarter end. |
Financing Activity
�
| � | � | � | Issued 4,955,377 shares of common stock in exchange for approximately $84.3 million of exchangeable senior notes at the request of holders exercising their exchange rights. |
Commenting on BioMed Realty�s third quarter results, Chairman and Chief Executive Officer Alan D. Gold said, �We are pleased to see that our strategy of creating value with connection points for leading life science companies and research institutions continues to drive strong results. We saw robust leasing in the third quarter led by leases with two global biopharmaceutical leaders in our two largest markets � Baxter in Cambridge and Bristol-Myers Squibb in the Bay Area. These important transactions validate our proven business model of creating exceptional research environments in the right markets for the life science industry to create scientific breakthroughs that are changing the world.�
Portfolio Update
During the quarter, the company executed 47 leasing transactions representing approximately 657,700 square feet, contributing to an operating portfolio leased percentage on a weighted-average basis of 92.6% and a development portfolio pre-leased percentage of 83.8% at quarter end. Third quarter leasing was comprised of:
�
| � | � | � | 33 new leases totaling approximately 380,400 square feet, highlighted by: |
�
| � | � | � | A new lease with Baxter Healthcare Corporation for approximately 206,100 square feet at the 650 East Kendall Street property in Cambridge, Massachusetts, which the company owns through its joint venture with Prudential Real Estate Investors (PREI). Concurrently, the company executed a lease termination with AVEO Pharmaceuticals, Inc. in the building in exchange for a termination fee of $15.6 million.�As a result of these transactions, 650 East Kendall is now 100% leased; |
�
| � | � | � | A new lease with Bristol-Myers Squibb Company totaling approximately 61,000 square feet at the company�s Woodside Technology Park campus in Redwood City, California; and |
�
| � | � | � | A new lease with GlycoMimetics, Inc. for approximately 33,800 square feet at the company�s 9708-9714 Medical Center Drive property in Rockville, Maryland. |
�
| � | � | � | 14 lease renewals and extensions totaling approximately 277,300 square feet, highlighted by: |
�
| � | � | � | A lease extension with Bristol-Myers Squibb for approximately 133,100 square feet at the Woodside Technology Park campus; |
�
| � | � | � | A lease extension with PPD Global Limited for approximately 64,600 square feet at the company�s Granta Park campus in Cambridge, United Kingdom; and |
�
| � | � | � | A lease extension with Ardelyx, Inc. for approximately 27,600 square feet at the company�s Ardenwood Boulevard property in Fremont, California. |
At September�30,�2014, the company�s total portfolio comprised approximately 17.2�million rentable square feet, with land supporting an estimated additional 7.4�million square feet of development potential. Third quarter same property net operating income on a cash basis increased 7.2% year-over-year, primarily as a result of sustained leasing success and contractual rent escalations.
During the quarter, the company entered into a lease termination with a tenant for 180,000 square feet at its 50 Hampshire building in Cambridge, Massachusetts. The original lease was originally scheduled to expire in January 2020. Under the terms of the agreement, the tenant agreed to pay a termination fee of $8.5 million which, net of related GAAP adjustments, will result in $7.5 million being recognized as other revenue ratably through March 2015, when the tenant is expected to vacate the space.
During the quarter, the company completed construction of an approximately 334,000 square foot laboratory and office building at 3737 Market Street in Philadelphia, Pennsylvania. The eleven-story building is 82.4% leased to tenants that include Penn Medicine University City; Spark Therapeutics, Inc., a gene therapy company originating out of The Children�s Hospital of Philadelphia; Good Shepherd Penn Partners, which operates the Penn Institute for Rehabilitation Medicine; and The Rose Group, owner of the Corner Bakery Caf�.
�Our team�s unmatched ability to successfully acquire, develop, redevelop, lease, finance and operate life science real estate continues to translate into superior operating and financial results in 2014,� said Kent Griffin, President of BioMed Realty. �Leasing volume of almost two million square feet, acquisitions which have added over one million rentable square feet which are 99% leased, and on-time, on-budget development deliveries such as the 3737 Market Street project in Philadelphia supply the year-to-date headlines. Supporting all of this growth is our exceptionally strong capital position, liquidity and credit profile which drive down our cost of capital. In doing so, we more effectively serve our tenants, maximize the operating cash flow from our property portfolio and capitalize on future opportunities to generate value for shareholders.�
Third Quarter 2014 Financial Results
Rental revenues for the third quarter were approximately $122.8 million, compared to approximately $116.9 million for the same period in 2013, an increase of 5.0% and the highest in the company�s history. Total revenues for the third quarter were approximately $168.9 million, compared to approximately $159.2 million for the same period in 2013, an increase of 6.1%.
CFFO for the third quarter was $0.40 per diluted share and FFO, calculated in accordance with standards established by NAREIT, was also $0.40 per diluted share for the quarter. AFFO for the quarter was $0.35 per diluted share. The company reported net income available to common stockholders for the quarter of approximately $16.0 million, or $0.08 per diluted share. Results of operations were favorably impacted by the following items, which increased FFO in aggregate by approximately $9.7 million, or $0.05 per diluted share:
�
| � | � | � | Lease termination fees totaling $3.3 million were recorded as other revenue during the third quarter, primarily associated with the previously announced lease termination at 50 Hampshire. |
| � | � | � | In connection with the lease termination at 650 East Kendall Street, AVEO Pharmaceuticals committed to pay the company a termination fee of approximately $15.6 million. The company holds a 20% interest in the PREI joint venture that owns the 650 East Kendall property and in the third quarter the joint venture recognized approximately $10.0 million of the total $15.6 million termination fee as additional revenue. The balance will be recognized as additional revenue over the remaining term of the lease through September 2015. The financial results of the joint venture are not consolidated in the company�s financial statements. Accordingly, the company recognized approximately $2.0 million in termination fee income through equity in income of unconsolidated subsidiaries in the third quarter. |
�
| � | � | � | Gains on securities investments of approximately $2.4 million. |
�
| � | � | � | Deferred rent receipts of approximately $2.0 million, which have been recorded as rental and tenant recovery revenues during the third quarter. |
Financing Activity
During the third quarter of 2014, certain holders of the company�s exchangeable senior notes exercised their exchange rights, pursuant to which the company issued 4,955,377 shares of common stock in exchange for approximately $84.3 million principal amount of notes.
Also during the third quarter, the company amended the terms of the loan secured by its PREI joint venture�s 650 East Kendall Street property, extending the loan�s maturity date to August�13, 2015 and reducing the applicable credit spread to 205 basis points, with an option to further extend the maturity date to August�13, 2016.
Earnings Guidance
The company�s updated 2014 guidance for net income per diluted share, FFO per diluted share and CFFO per diluted share are set forth and reconciled below. Projected net income per diluted share and FFO per diluted share (and CFFO per diluted share) are based upon estimated, weighted-average diluted common shares outstanding of approximately 198.6�million and 208.7�million, respectively.
�
| � | �� | 2014 | � | |
| Projected net income per diluted share available to common stockholders |
�� | $ | 0.31 | �� |
| Add: |
�� | |||
| Real estate depreciation and amortization |
�� | � | 1.28 | �� |
| Noncontrolling interests in operating partnership |
�� | � | 0.01 | �� |
| Less: |
�� | |||
| Net effect of assumed conversion of exchangeable senior notes due 2030 |
�� | � | (0.03 | )� |
| Projected FFO per diluted share |
�� | $ | 1.57 | �� |
| Add: Acquisition costs |
�� | � | 0.01 | �� |
| Projected CFFO per diluted share |
�� | $ | 1.58 | �� |
The company�s 2014 FFO and CFFO estimates reflect the company�s year-to-date operating results and include other revenue and income items aggregating $0.18 per diluted share. These items primarily include lease termination fees, construction loan income and net investment gains. Excluding the impact of these items, projected CFFO per diluted share for 2014 would be $1.40 per diluted share.
Full-year 2014 guidance implies fourth quarter estimates of FFO and CFFO of $0.37 per diluted share which includes the effects of the 50 Hampshire and AVEO Pharmaceuticals lease terminations and which have the net effect of increasing the company�s 2014 fourth quarter estimates of FFO and CFFO by approximately $0.01 per diluted share. No additional other income items are contemplated in the company�s fourth quarter estimates of FFO and CFFO.
The company�s initial 2015 guidance for net income per diluted share and FFO (and CFFO) per diluted share are set forth and reconciled below. Projected net income per diluted share and FFO (and CFFO) per diluted share are based upon estimated, weighted-average diluted common shares outstanding of approximately 207.7�million and 209.2�million, respectively.
�
| � | �� | 2015 |
| � | �� | (Low�-�High) |
| Projected net income per diluted share available to common stockholders |
�� | $0.21�-�$0.31 |
| Add: |
�� | |
| Real estate depreciation and amortization |
�� | 1.23 |
| Noncontrolling interests in operating partnership |
�� | 0.01 |
| Projected FFO and CFFO per diluted share |
�� | $1.45�-�$1.55 |
Key assumptions underlying the company�s projections of 2015 net income per diluted share and FFO (and CFFO) per diluted share are as follows (dollars in thousands):
�
| � | �� | Full-year 2015 |
| Rental revenues |
�� | $490,000�to�$530,000 |
| Termination income (50 Hampshire termination revenue and pro rata share of AVEO termination revenue) |
�� | $3,600 |
| Interest expense |
�� | $90,000 to $100,000 |
| Capitalized interest |
�� | $18,000 to $22,000 |
| General�& administrative expense |
�� | $50,000 to $52,000 |
| Operating margins |
�� | 64% to 68% |
| Tenant recoveries |
�� | 74% to 77% |
| Leasing | �� | � |
| Gross leasing |
�� | 1,500,000�sq�ft�to�1,800,000�sq�ft |
| Net absorption |
�� | 250,000 sq ft to 400,000 sq ft |
| Consolidated operating portfolio leased percentage at December�31, 2015 |
�� | |
| Weighted-average |
�� | +/- 94% |
| Square feet |
�� | 92% to 93% |
�
| Capital | �� | Remaining�investments |
| Active development |
�� | $277,800 |
| Active redevelopment |
�� | $4,700 |
| Leasing (estimated spend through 2015) |
�� | |
| Signed leases |
�� | $80,000 |
| Projected leasing |
�� | $60,000�to�$80,000 |
The company expects that holders will exchange all of the company�s remaining exchangeable senior notes due 2030 into common stock in January 2015.
The foregoing estimates do not include the effect of any other revenue or income (or losses) that might arise from lease terminations or investments in securities other than the impact of the previously announced 50 Hampshire lease terminations and the AVEO Pharmaceuticals lease termination at 650 East Kendall, which have the net effect of increasing the 2015 FFO and CFFO estimate by $0.02 per diluted share.
The company continues to target new investment opportunities, including acquisitions and new development projects; however, the company�s 2014 FFO and CFFO and 2015 FFO and CFFO estimates do not reflect the impact of any future new investments (acquisitions or development), or related financing activity, as the impact of such investments may vary significantly based on the nature of these investments, timing and other factors.
The foregoing estimates are forward-looking and reflect management�s view of current and future market conditions, including certain assumptions with respect to leasing activity, rental rates, occupancy levels, interest rates, financings, acquisitions, development and redevelopment and the amount and timing of acquisitions, development and redevelopment activities. The company�s actual results may differ materially from these estimates.
Supplemental Information
Supplemental operating and financial data are available in the Investor Relations section of the company�s website at www.biomedrealty.com.
Teleconference and Webcast
BioMed Realty will conduct a conference call and webcast at 9:00 a.m. Pacific Time (12:00 p.m. Eastern Time) on Thursday, October�30, 2014 to discuss the company�s financial results and operations for the quarter. The call will be open to all interested investors either through a live audio web cast at the Investor Relations section of the company�s web site at www.biomedrealty.com, which will include an online slide presentation to accompany the call, or live by calling (800)�708-4539 (domestic) or (847)�619-6396 (international) with call ID number 38313570. The complete webcast will be archived for 30 days on both web sites. A telephone playback of the conference call will also be available from 11:30 a.m. Pacific Time on Thursday, October�30, 2014 until midnight Pacific Time on Wednesday, November�5, 2014 by calling (888)�843-7419 (domestic) or (630)�652-3042 (international) and using access code 38313570#.
About BioMed Realty Trust
BioMed Realty, with its trusted expertise and valuable relationships, delivers optimal real estate solutions for biotechnology and pharmaceutical companies, scientific research institutions, government agencies and other entities involved in the life science industry. BioMed Realty owns or has interests in properties comprising approximately 17.2�million rentable square feet.�Additional information is available at www.biomedrealty.com. Follow us on Twitter @biomedrealty.
This press release contains forward-looking statements within the meaning of the Private Securities Litigation Reform Act of 1995 based on current expectations, forecasts and assumptions that involve risks and uncertainties that could cause actual outcomes and results to differ materially. These risks and uncertainties include, without limitation: general risks affecting the real estate industry (including, without limitation, the inability to enter into or renew leases, dependence on tenants� financial condition, and competition from other developers, owners and operators of real estate); adverse economic or real estate developments in the life science industry or the company�s target markets; risks associated with the availability and terms of financing, the use of debt to fund acquisitions, developments and other investments, and the ability to refinance indebtedness as it comes due; failure to maintain the company�s investment grade credit ratings with the ratings agencies; failure to manage effectively the company�s growth and expansion into new markets, or to complete or integrate acquisitions and developments successfully; reductions in asset valuations and related impairment charges; risks and uncertainties affecting property development and construction; risks associated with tax credits, grants and other subsidies to fund development activities; risks associated with downturns in foreign, domestic and local economies, changes in interest rates and foreign currency exchange rates, and volatility in the securities markets; ownership of properties outside of the United States that subject the company to different and potentially greater risks than those associated with the company�s domestic operations; risks associated with the company�s investments in loans, including borrower defaults and potential principal losses; potential liability for uninsured losses and environmental contamination; risks associated with security breaches and other disruptions to the company�s information technology networks and related systems; risks associated with the company�s potential failure to qualify as a REIT under the Internal Revenue Code of 1986, as amended, and possible adverse changes in tax and environmental laws; and risks associated with the company�s dependence on key personnel whose continued service is not guaranteed. For a further list and description of such risks and uncertainties, see the reports filed by the company with the Securities and Exchange Commission, including the company�s most recent annual report on Form 10-K and quarterly reports on Form 10-Q. The company disclaims any intention or obligation to update or revise any forward-looking statements, whether as a result of new information, future events or otherwise.
#��#��#
(Financial Tables Follow)
BIOMED REALTY TRUST, INC.
CONSOLIDATED BALANCE SHEETS
(In thousands, except share data)
�
| � | �� | September�30, 2014 |
� | � | December�31, 2013 |
� | ||
| � | �� | (Unaudited) | � | � | � | � | ||
| ASSETS | �� | � | ||||||
| Investments in real estate, net |
�� | $ | 5,535,115 | �� | � | $ | 5,217,902 | �� |
| Investments in unconsolidated partnerships |
�� | � | 36,275 | �� | � | � | 32,137 | �� |
| Cash and cash equivalents |
�� | � | 33,864 | �� | � | � | 34,706 | �� |
| Accounts receivable, net |
�� | � | 18,843 | �� | � | � | 8,421 | �� |
| Accrued straight-line rents, net |
�� | � | 183,904 | �� | � | � | 173,779 | �� |
| Deferred leasing costs, net |
�� | � | 224,824 | �� | � | � | 198,067 | �� |
| Other assets |
�� | � | 205,487 | �� | � | � | 307,589 | �� |
| �� | � |
� |
� | � | � |
� |
� | |
| Total assets |
�� | $ | 6,238,312 | �� | � | $ | 5,972,601 | �� |
| �� | � |
� |
� | � | � |
� |
� | |
| LIABILITIES AND EQUITY | �� | � | ||||||
| Mortgage notes payable, net |
�� | $ | 478,543 | �� | � | $ | 709,324 | �� |
| Exchangeable senior notes |
�� | � | 95,678 | �� | � | � | 180,000 | �� |
| Unsecured senior notes, net |
�� | � | 1,293,572 | �� | � | � | 895,083 | �� |
| Unsecured senior term loan |
�� | � | 755,876 | �� | � | � | 758,786 | �� |
| Unsecured line of credit |
�� | � | 229,000 | �� | � | � | 128,000 | �� |
| Accounts payable, accrued expenses and other liabilities |
�� | � | 375,933 | �� | � | � | 314,383 | �� |
| �� | � |
� |
� | � | � |
� |
� | |
| Total liabilities |
�� | � | 3,228,602 | �� | � | � | 2,985,576 | �� |
| Equity: |
�� | � | ||||||
| Stockholders� equity: |
�� | � | ||||||
| Common stock, $.01 par value, 250,000,000 shares authorized, 197,455,157 shares and 192,115,002 shares issued and outstanding at September�30, 2014 and December�31, 2013, respectively |
�� | � | 1,975 | �� | � | � | 1,921 | �� |
| Additional paid-in capital |
�� | � | 3,643,957 | �� | � | � | 3,554,558 | �� |
| Accumulated other comprehensive loss, net |
�� | � | (20,915 | )� | � | � | (32,923 | )� |
| Dividends in excess of earnings |
�� | � | (675,763 | )� | � | � | (583,569 | )� |
| �� | � |
� |
� | � | � |
� |
� | |
| Total stockholders� equity |
�� | � | 2,949,254 | �� | � | � | 2,939,987 | �� |
| Noncontrolling interests |
�� | � | 60,456 | �� | � | � | 47,038 | �� |
| �� | � |
� |
� | � | � |
� |
� | |
| Total equity |
�� | � | 3,009,710 | �� | � | � | 2,987,025 | �� |
| �� | � |
� |
� | � | � |
� |
� | |
| Total liabilities and equity |
�� | $ | 6,238,312 | �� | � | $ | 5,972,601 | �� |
| �� | � |
� |
� | � | � |
� |
� | |
BIOMED REALTY TRUST, INC.
CONSOLIDATED STATEMENTS OF OPERATIONS
(In thousands, except share data)
(Unaudited)
�
| � | �� | For the Three Months Ended September�30, |
� | � | For the Nine Months Ended September�30, |
� | ||||||||||
| � | �� | 2014 | � | � | 2013 | � | � | 2014 | � | � | 2013 | � | ||||
| Revenues: |
�� | � | � | � | ||||||||||||
| Rental |
�� | $ | 122,838 | �� | � | $ | 116,884 | �� | � | $ | 363,788 | �� | � | $ | 327,932 | �� |
| Tenant recoveries |
�� | � | 42,626 | �� | � | � | 38,907 | �� | � | � | 121,641 | �� | � | � | 104,037 | �� |
| Other revenue |
�� | � | 3,452 | �� | � | � | 3,441 | �� | � | � | 23,524 | �� | � | � | 47,352 | �� |
| �� | � |
� |
� | � | � |
� |
� | � | � |
� |
� | � | � |
� |
� | |
| Total revenues |
�� | � | 168,916 | �� | � | � | 159,232 | �� | � | � | 508,953 | �� | � | � | 479,321 | �� |
| �� | � |
� |
� | � | � |
� |
� | � | � |
� |
� | � | � |
� |
� | |
| Expenses: |
�� | � | � | � | ||||||||||||
| Rental operations |
�� | � | 54,899 | �� | � | � | 51,688 | �� | � | � | 161,058 | �� | � | � | 134,182 | �� |
| Depreciation and amortization |
�� | � | 64,452 | �� | � | � | 61,898 | �� | � | � | 189,597 | �� | � | � | 186,219 | �� |
| General and administrative |
�� | � | 12,768 | �� | � | � | 11,934 | �� | � | � | 37,153 | �� | � | � | 32,358 | �� |
| Acquisition-related expenses |
�� | � | 487 | �� | � | � | 907 | �� | � | � | 2,871 | �� | � | � | 5,263 | �� |
| �� | � |
� |
� | � | � |
� |
� | � | � |
� |
� | � | � |
� |
� | |
| Total expenses |
�� | � | 132,606 | �� | � | � | 126,427 | �� | � | � | 390,679 | �� | � | � | 358,022 | �� |
| �� | � |
� |
� | � | � |
� |
� | � | � |
� |
� | � | � |
� |
� | |
| Income from operations |
�� | � | 36,310 | �� | � | � | 32,805 | �� | � | � | 118,274 | �� | � | � | 121,299 | �� |
| Equity in net income / (loss) of unconsolidated partnerships |
�� | � | 733 | �� | � | � | (112 | )� | � | � | 585 | �� | � | � | (697 | )� |
| Interest expense, net |
�� | � | (22,215 | )� | � | � | (27,870 | )� | � | � | (73,356 | )� | � | � | (79,890 | )� |
| Other income / (expense) |
�� | � | 2,148 | �� | � | � | (687 | )� | � | � | 11,338 | �� | � | � | (4,079 | )� |
| �� | � |
� |
� | � | � |
� |
� | � | � |
� |
� | � | � |
� |
� | |
| Net income |
�� | � | 16,976 | �� | � | � | 4,136 | �� | � | � | 56,841 | �� | � | � | 36,633 | �� |
| Net (income) / loss attributable to noncontrolling interests |
�� | � | (1,016 | )� | � | � | 111 | �� | � | � | (3,412 | )� | � | � | (268 | )� |
| �� | � |
� |
� | � | � |
� |
� | � | � |
� |
� | � | � |
� |
� | |
| Net income attributable to the company |
�� | � | 15,960 | �� | � | � | 4,247 | �� | � | � | 53,429 | �� | � | � | 36,365 | �� |
| Preferred stock dividends |
�� | � | ��� | �� | � | � | ��� | �� | � | � | ��� | �� | � | � | (2,393 | )� |
| Cost on redemption of preferred stock |
�� | � | ��� | �� | � | � | ��� | �� | � | � | ��� | �� | � | � | (6,531 | )� |
| �� | � |
� |
� | � | � |
� |
� | � | � |
� |
� | � | � |
� |
� | |
| Net income available to common stockholders |
�� | $ | 15,960 | �� | � | $ | 4,247 | �� | � | $ | 53,429 | �� | � | $ | 27,441 | �� |
| �� | � |
� |
� | � | � |
� |
� | � | � |
� |
� | � | � |
� |
� | |
| Income from continuing operations per share available to common stockholders: |
�� | � | � | � | ||||||||||||
| Basic and diluted earnings per share |
�� | $ | 0.08 | �� | � | $ | 0.02 | �� | � | $ | 0.27 | �� | � | $ | 0.15 | �� |
| �� | � |
� |
� | � | � |
� |
� | � | � |
� |
� | � | � |
� |
� | |
| Weighted-average common shares outstanding: |
�� | � | � | � | ||||||||||||
| Basic |
�� | � | 194,022,619 | �� | � | � | 190,646,722 | �� | � | � | 191,988,661 | �� | � | � | 179,138,169 | �� |
| �� | � |
� |
� | � | � |
� |
� | � | � |
� |
� | � | � |
� |
� | |
| Diluted |
�� | � | 199,574,893 | �� | � | � | 196,131,643 | �� | � | � | 197,651,357 | �� | � | � | 183,121,240 | �� |
| �� | � |
� |
� | � | � |
� |
� | � | � |
� |
� | � | � |
� |
� | |
BIOMED REALTY TRUST, INC.
CONSOLIDATED FUNDS FROM OPERATIONS
(In thousands, except share data)
(Unaudited)
Our FFO and CFFO available to common shares and partnership and LTIP units and a reconciliation to net income for the three and nine months ended September�30,�2014 and 2013 was as follows:
�
| � | �� | Three Months Ended September�30, |
� | � | Nine Months
Ended September�30, |
� | ||||||||||
| � | �� | 2014 | � | � | 2013 | � | � | 2014 | � | � | 2013 | � | ||||
| Net income available to the common stockholders |
�� | $ | 15,960 | �� | � | $ | 4,247 | �� | � | $ | 53,429 | �� | � | $ | 27,441 | �� |
| Adjustments: |
�� | � | � | � | ||||||||||||
| Gain on sale of assets |
�� | � | ��� | �� | � | � | (230 | )� | � | � | ��� | �� | � | � | (230 | )� |
| Noncontrolling interests in operating partnership |
�� | � | 429 | �� | � | � | 118 | �� | � | � | 1,463 | �� | � | � | 534 | �� |
| Depreciation and amortization � unconsolidated partnerships |
�� | � | 2,312 | �� | � | � | 380 | �� | � | � | 3,088 | �� | � | � | 1,116 | �� |
| Depreciation and amortization � consolidated entities |
�� | � | 64,452 | �� | � | � | 61,898 | �� | � | � | 189,597 | �� | � | � | 186,219 | �� |
| Depreciation and amortization � allocable to noncontrolling interest of consolidated joint ventures |
�� | � | (699 | )� | � | � | (515 | )� | � | � | (1,739 | )� | � | � | (709 | )� |
| �� | � |
� |
� | � | � |
� |
� | � | � |
� |
� | � | � |
� |
� | |
| FFO available to common shares and units � basic |
�� | $ | 82,454 | �� | � | $ | 65,898 | �� | � | $ | 245,838 | �� | � | $ | 214,371 | �� |
| Interest expense on exchangeable senior notes |
�� | � | 1,241 | �� | � | � | 1,688 | �� | � | � | 4,616 | �� | � | � | 5,063 | �� |
| �� | � |
� |
� | � | � |
� |
� | � | � |
� |
� | � | � |
� |
� | |
| FFO available to common shares and units � diluted |
�� | $ | 83,695 | �� | � | $ | 67,586 | �� | � | $ | 250,454 | �� | � | $ | 219,434 | �� |
| Acquisition-related expenses |
�� | � | 487 | �� | � | � | 907 | �� | � | � | 2,871 | �� | � | � | 5,263 | �� |
| �� | � |
� |
� | � | � |
� |
� | � | � |
� |
� | � | � |
� |
� | |
| CFFO � diluted |
�� | $ | 84,182 | �� | � | $ | 68,493 | �� | � | $ | 253,325 | �� | � | $ | 224,697 | �� |
| �� | � |
� |
� | � | � |
� |
� | � | � |
� |
� | � | � |
� |
� | |
| FFO per share � diluted |
�� | $ | 0.40 | �� | � | $ | 0.33 | �� | � | $ | 1.20 | �� | � | $ | 1.13 | �� |
| �� | � |
� |
� | � | � |
� |
� | � | � |
� |
� | � | � |
� |
� | |
| CFFO per share � diluted |
�� | $ | 0.40 | �� | � | $ | 0.33 | �� | � | $ | 1.21 | �� | � | $ | 1.15 | �� |
| �� | � |
� |
� | � | � |
� |
� | � | � |
� |
� | � | � |
� |
� | |
| Weighted-average common shares and units outstanding � diluted�(1) |
�� | � | 208,649,141 | �� | � | � | 207,952,002 | �� | � | � | 208,723,924 | �� | � | � | 194,899,709 | �� |
| �� | � |
� |
� | � | � |
� |
� | � | � |
� |
� | � | � |
� |
� | |
Our AFFO available to common shares and partnership and LTIP units and a reconciliation of CFFO to AFFO for the three and nine months ended September�30,�2014 and 2013 was as follows:
�
| � | �� | Three�Months�Ended September�30, |
� | � | Nine�Months�
Ended September�30, |
� | ||||||||||
| � | �� | 2014 | � | � | 2013 | � | � | 2014 | � | � | 2013 | � | ||||
| CFFO � diluted |
�� | $ | 84,182 | �� | � | $ | 68,493 | �� | � | $ | 253,326 | �� | � | $ | 224,697 | �� |
| Adjustments: |
�� | � | � | � | ||||||||||||
| Recurring capital expenditures and second generation tenant improvements |
�� | � | (17,007 | )� | � | � | (9,857 | )� | � | � | (46,291 | )� | � | � | (32,251 | )� |
| Leasing commissions |
�� | � | (1,741 | )� | � | � | (1,703 | )� | � | � | (5,580 | )� | � | � | (5,268 | )� |
| Non-cash revenue adjustments |
�� | � | (702 | )� | � | � | (3,661 | )� | � | � | (5,453 | )� | � | � | (1,239 | )� |
| Non-cash adjustment for securities |
�� | � | ��� | �� | � | � | ��� | �� | � | � | 50 | �� | � | � | 2,825 | �� |
| Non-cash debt adjustments |
�� | � | 3,236 | �� | � | � | 3,305 | �� | � | � | 9,737 | �� | � | � | 9,463 | �� |
| Non-cash equity compensation |
�� | � | 3,658 | �� | � | � | 3,489 | �� | � | � | 11,137 | �� | � | � | 9,567 | �� |
| Cost on redemption of preferred stock |
�� | � | ��� | �� | � | � | ��� | �� | � | � | ��� | �� | � | � | 6,531 | �� |
| Depreciation included in general and administrative expenses |
�� | � | 848 | �� | � | � | 629 | �� | � | � | 2,345 | �� | � | � | 1,675 | �� |
| Share of non-cash unconsolidated partnership adjustments |
�� | � | 218 | �� | � | � | 24 | �� | � | � | 254 | �� | � | � | 95 | �� |
| �� | � |
� |
� | � | � |
� |
� | � | � |
� |
� | � | � |
� |
� | |
| AFFO available to common shares and units |
�� | $ | 72,692 | �� | � | $ | 60,719 | �� | � | $ | 219,524 | �� | � | $ | 216,095 | �� |
| �� | � |
� |
� | � | � |
� |
� | � | � |
� |
� | � | � |
� |
� | |
| AFFO per share � diluted |
�� | $ | 0.35 | �� | � | $ | 0.29 | �� | � | $ | 1.05 | �� | � | $ | 1.13 | �� |
| �� | � |
� |
� | � | � |
� |
� | � | � |
� |
� | � | � |
� |
� | |
| Weighted-average common shares and units outstanding � diluted�(1) |
�� | � | 208,649,141 | �� | � | � | 207,952,002 | �� | � | � | 208,723,924 | �� | � | � | 194,899,709 | �� |
| �� | � |
� |
� | � | � |
� |
� | � | � |
� |
� | � | � |
� |
� | |
�
| (1) | The three and nine months ended September�30,�2014 include 7,589,600 and 9,571,008 shares of potentially issuable common stock, respectively, pursuant to the exchange feature of the exchangeable senior notes due 2030 based on the �if converted� method. The three and nine months ended September�30, 2013 include 10,405,224 shares of common stock potentially issuable pursuant to the exchange feature of the exchangeable senior notes due 2030 based on the �if converted� method. The three months ended September�30,�2014 and 2013 include 1,484,648 and 1,415,135 shares of unvested restricted stock, respectively, which are considered anti-dilutive for purposes of calculating diluted earnings per share. The nine months ended September�30, 2014 and 2013 include 1,501,559 and 1,373,245 shares of unvested restricted stock, respectively, which are considered anti-dilutive for purposes of calculating diluted earnings per share. |
We present funds from operations, or FFO, core funds from operations, or CFFO, and adjusted funds from operations, or AFFO, available to common shares and partnership and LTIP units because we consider them important supplemental measures of our operating performance and believe they are frequently used by securities analysts, investors and other interested parties in the evaluation of REITs, many of which present FFO, CFFO and AFFO when reporting their results.
FFO is intended to exclude GAAP historical cost depreciation and amortization of real estate and related assets, which assumes that the value of real estate assets diminishes ratably over time. Historically, however, real estate values have risen or fallen with market conditions. Because FFO excludes depreciation and amortization unique to real estate, gains and losses from property dispositions and extraordinary items, it provides a performance measure that, when compared year over year, reflects the impact to operations from trends in occupancy rates, rental rates, operating costs, development activities and interest costs, providing perspective not immediately apparent from net income. We compute FFO in accordance with standards established by the Board of Governors of the National Association of Real Estate Investment Trusts, or NAREIT. As defined by NAREIT, FFO represents net income (computed in accordance with GAAP), excluding gains (or losses) from sales of property, impairment charges on depreciable real estate, real estate related depreciation and amortization (excluding amortization of loan origination costs) and after adjustments for unconsolidated partnerships and joint ventures.
We calculate CFFO by adding acquisition-related expenses to FFO. We calculate AFFO by adding to CFFO: (a)�non-cash revenues and expenses, (b)�recurring capital expenditures and second generation tenant improvements, and (c)�leasing commissions.
Our computation of FFO, CFFO and AFFO may differ from the methodology for calculating FFO, CFFO and AFFO utilized by other equity REITs and, accordingly, may not be comparable to such other REITs. Further, FFO, CFFO and AFFO do not represent cash flow available for management�s discretionary use because of needed capital replacement or expansion, debt service obligations, or other commitments and uncertainties. FFO, CFFO and AFFO should not be considered as an alternative to net income (loss) (computed in accordance with GAAP) as an indicator of our financial performance or to cash flow from operating activities (computed in accordance with GAAP) as an indicator of our liquidity, nor is it indicative of funds available to fund our cash needs, including our ability to pay dividends or make distributions. FFO, CFFO and AFFO should be considered only as supplements to net income computed in accordance with GAAP as measures of our operations.
Exhibit 99.2
�

SUPPLEMENTAL OPERATING AND FINANCIAL DATA
SEPTEMBER 30, 2014
�
| BioMed Realty Trust, Inc. | � | Corporate Communications Contact | �� | www.biomedrealty.com |
| 17190 Bernardo Center Drive | � | Rick Howe | �� | (858) 485-9840 phone |
| San Diego, CA 92128 | � | Senior�Director,�Corporate�Communications | �� | (858) 485-9843 fax |
| � | [email protected] | �� |

�
TABLE OF CONTENTS
SEPTEMBER 30, 2014
�
�
| � | �� | Page |
� | �� | � | �� | Page |
� | ||
| Third Quarter Highlights |
�� | � | 3 | �� | �� | Common Stock Data | �� | � | 20 | �� |
| Investor Information |
�� | � | 4 | �� | �� | Market Summary | �� | � | 21 | �� |
| Equity Research Coverage |
�� | � | 5 | �� | �� | Property Listing - Consolidated Portfolio | �� | � | 22-24 | �� |
| Financial and Operating Highlights |
�� | � | 6 | �� | �� | Development, Redevelopment and Development Potential |
�� | |||
| Capitalization Summary |
�� | � | 7 | �� | �� | �� | � | 25 | �� | |
| Portfolio Summary |
�� | � | 8 | �� | �� | Capital Expenditures | �� | � | 26 | �� |
| Consolidated Balance Sheets |
�� | � | 9 | �� | �� | Property Listing - Unconsolidated Partnerships | �� | � | 27 | �� |
| Consolidated Statements of Operations |
�� | � | 10 | �� | �� | Lease Expirations | �� | � | 28 | �� |
| Balance Sheet / Operations Statement Detail |
�� | � | 11 | �� | �� | Expirations by Market | �� | � | 29 | �� |
| FFO, CFFO and AFFO |
�� | � | 12 | �� | �� | 10 Largest Tenants | �� | � | 30 | �� |
| FFO, CFFO and AFFO per Share |
�� | � | 13 | �� | �� | Same Property Analysis | �� | � | 31 | �� |
| Reconciliation of EBITDA and Adjusted EBITDA |
�� | � | 14 | �� | �� | Future Lease Commencements | �� | � | 32 | �� |
| Reconciliation of Net Operating Income |
�� | � | 15 | �� | �� | Acquisitions | �� | � | 33 | �� |
| Interest Expense |
�� | � | 16 | �� | �� | Leasing Activity |
�� | � | 34 | �� |
| Coverage Ratios |
�� | � | 17 | �� | �� | Tenant Improvements, Leasing Commissions and Tenant Concessions |
�� | |||
| Debt Summary |
�� | � | 18 | �� | �� | �� | � | 35 | �� | |
| Debt Maturities |
�� | � | 19 | �� | �� | Non-GAAP Financial Measure Definitions | �� | � | 36 | �� |
| �� | �� | Definitions | �� | � | 37 | �� | ||||
This Supplemental Operating and Financial Data package contains forward-looking statements within the meaning of the Private Securities Litigation Reform Act of 1995 based on current expectations, forecasts and assumptions that involve risks and uncertainties that could cause actual outcomes and results to differ materially. These risks and uncertainties include, without limitation: general risks affecting the real estate industry (including, without limitation, the inability to enter into or renew leases, dependence on tenants� financial condition, and competition from other developers, owners and operators of real estate); adverse economic or real estate developments in the life science industry or the company�s target markets; risks associated with the availability and terms of financing, the use of debt to fund acquisitions, developments and other investments, and the ability to refinance indebtedness as it comes due; failure to maintain the company�s investment grade credit ratings with the ratings agencies; failure to manage effectively the company�s growth and expansion into new markets, or to complete or integrate acquisitions and developments successfully; reductions in asset valuations and related impairment charges; risks and uncertainties affecting property development and construction; risks associated with tax credits, grants and other subsidies to fund development activities; risks associated with downturns in foreign, domestic and local economies, changes in interest rates and foreign currency exchange rates, and volatility in the securities markets; ownership of properties outside of the United States that subject the company to different and potentially greater risks than those associated with the company�s domestic operations; risks associated with the company�s investments in loans, including borrower defaults and potential principal losses; potential liability for uninsured losses and environmental contamination; risks associated with security breaches and other disruptions to the company�s information technology networks and related systems; risks associated with the company�s potential failure to qualify as a REIT under the Internal Revenue Code of 1986, as amended, and possible adverse changes in tax and environmental laws; and risks associated with the company�s dependence on key personnel whose continued service is not guaranteed. For a further list and description of such risks and uncertainties, see the reports filed by the company with the Securities and Exchange Commission, including the company�s most recent annual report on Form 10-K and quarterly reports on Form 10-Q. The company disclaims any intention or obligation to update or revise any forward-looking statements, whether as a result of new information, future events or otherwise.
All amounts shown in this report are unaudited.
This Supplemental Operating and Financial Data package is not an offer to sell or solicitation to buy securities of BioMed Realty Trust, Inc. Any offers to sell or solicitations to buy securities of BioMed Realty Trust, Inc. shall be made only by means of a prospectus approved for that purpose.
�
�
THIRD QUARTER HIGHLIGHTS
SEPTEMBER 30, 2014
�
Financial and Operating Performance
�
| � | � | � | Executed 47 leasing transactions during the quarter representing approximately 657,700 square feet, contributing to: |
�
| � | � | � | Positive net absorption for the third quarter of approximately 219,700 square feet; and |
�
| � | � | � | An increase in the operating portfolio leased percentage on a weighted-average basis to 92.6% at quarter end; |
�
| � | � | � | Increased same property net operating income on a cash basis by 7.2% year-over-year; |
�
| � | � | � | Generated total revenues of approximately $168.9 million and set a new company record for rental revenues of $122.8 million; and |
�
| � | � | � | Generated funds from operations (FFO) and core funds from operations (CFFO) of $0.40 per diluted share and adjusted funds from operations (AFFO) of $0.35 per diluted share, and reported net income available to common stockholders for the quarter of approximately $16.0 million, or $0.08 per diluted share. |
New Investments
�
| � | � | � | Completed development delivery of the 3737 Market Street building on the Science Center campus in Philadelphia, Pennsylvania, which was 82.4% leased at quarter end. |
Financing Activity
�
| � | � | � | Issued 4,955,377 shares of common stock in exchange for approximately $84.3 million of exchangeable senior notes at the request of holders exercising their exchange rights. |
About BioMed Realty Trust
�
BioMed Realty, with its trusted expertise and valuable relationships, delivers optimal real estate solutions for biotechnology and pharmaceutical companies, scientific research institutions, government agencies and other entities involved in the life science industry. BioMed Realty owns or has interests in properties comprising approximately 17.2�million rentable square feet.�Additional information is available at www.biomedrealty.com. Follow us on Twitter @biomedrealty.
�
�
INVESTOR INFORMATION
SEPTEMBER 30, 2014
�
�
| Company Information | ||||||
| Corporate Headquarters | �� | Trading Symbol | �� | Transfer Agent | �� | Stock Exchange Listing |
| 17190 Bernardo Center Drive | �� | BMR | �� | Computershare Shareowner Services LLC | �� | New York Stock Exchange |
| San Diego, CA 92128 | �� | �� | 250 Royall Street | �� | ||
| (858) 485-9840 | �� | �� | Canton, MA 02021 | �� | ||
| (858) 485-9843 (fax) | �� | �� | (877) 296-3711 | �� | ||
| Please�visit�our�corporate�website�at: | �� | www.biomedrealty.com | �� | �� | ||
| Board of Directors |
�� | Senior Management |
�� | � |
�� | � |
| Alan D. Gold | �� | Alan D. Gold | �� | Karen A. Sztraicher | �� | James R. Berens |
| Chairman | �� | Chairman and | �� | Executive Vice President, | �� | President |
| Daniel M. Bradbury | �� | ��Chief Executive Officer | �� | ��Asset Management | �� | ��Wexford�Science�&�Technology |
| William R. Brody, M.D., Ph.D. | �� | R. Kent Griffin, Jr. | �� | Jonathan P. Klassen | �� | Sandy N. Weeks, Esq. |
| Gary A. Kreitzer | �� | President and | �� | Senior Vice President, | �� | Senior Vice President and |
| Theodore D. Roth | �� | ��Chief Operating Officer | �� | ��General Counsel and Secretary | �� | ��General Counsel |
| Janice. L. Sears | �� | Gary A. Kreitzer | �� | John P. Bonanno | �� | ��Wexford Science & Technology |
| M. Faye Wilson | �� | ��Executive�Vice�President,�Director | �� | Senior Vice President, | �� | Daniel C. Cramer |
| �� | Matthew G. McDevitt | �� | ��Leasing & Development | �� | Senior�Vice�President,�Development | |
| �� | Executive Vice President, ��Real Estate |
�� | �� | ��Wexford Science & Technology | ||
| �� | Greg N. Lubushkin | �� | �� | |||
| �� | ��Chief Financial Officer | �� | �� | |||
| Tentative Schedule for Quarterly Results | ||||||
| Fourth Quarter 2014 | �� | February 4, 2015 | �� | �� | ||
| First Quarter 2015 | �� | April 29, 2015 | �� | �� | ||
| Second Quarter 2015 | �� | July 29, 2015 | �� | �� | ||
| Third Quarter 2015 | �� | October 28, 2015 | �� | �� | ||
�
�
EQUITY RESEARCH COVERAGE
SEPTEMBER 30, 2014
�
�
| Cantor Fitzgerald | � | David Toti Evan Smith |
� | (212) 915-1219 (212) 915-1220 |
� | |
| Cowen and Company | � | James Sullivan Tom Catherwood |
� | (646)562-1380 (646)562-1382 |
� | |
| Green Street Advisors | � | Michael Knott Kevin Tyler |
� | (949)640-8780 |
� | |
| Jefferies�& Co. | � | Omotayo Okusanya |
� | (212)336-7076 |
� | |
| KeyBanc Capital Markets | � | Jordan Sadler Craig Mailman |
� | (917)368-2280 (917)368-2316 |
� | |
| Mizuho Securities | � | Richard Anderson |
� | (212)205-8445 |
� | |
| MLV�& Co. | � | Paul Morgan Joe Ng |
� | (415)325-4187 (646)412-7736 |
� | |
| Morgan Stanley | � | Vance Edelson Vikram Malhotra |
� | (212)761-0078 (212)761-7064 |
� | |
| Raymond James | � | Paul D. Puryear William A. Crow |
� | (727)567-2253 (727)567-2594 |
� | |
| Robert W. Baird�& Co. | � | David B. Rodgers Mathew R. Spencer |
� | (216)737-7341 (414)298-5053 |
� | |
| Stifel, Nicolaus�& Company, Inc. | � | Daniel Bernstein Chad Vanacore |
� | (443)224-1351 (518)587-2581 |
� | |
| UBS Securities | � | Ross T. Nussbaum Nick Yulico |
� | (212)713-2484 (212)713-3402 |
� | |
| Wells Fargo Securities | � | Brendan Maiorana Young Ku |
� | (443)263-6516 (443)263-6564 |
� | |
�
�
FINANCIAL AND OPERATING HIGHLIGHTS
SEPTEMBER 30, 2014
�
(In thousands, except per share and ratio amounts)
�
| � | � | Three Months Ended | � | |||||||||||||||||
| Selected Operating Data |
� | 9/30/14 | � | � | 6/30/14 | � | � | 3/31/14 | � | � | 12/31/13 | � | � | 9/30/13 | � | |||||
| Rental revenues |
� | $ | 122,838 | �� | � | $ | 120,924 | �� | � | $ | 120,026 | �� | � | $ | 118,048 | �� | � | $ | 116,884 | �� |
| Total revenues |
� | � | 168,916 | �� | � | � | 171,161 | �� | � | � | 168,876 | �� | � | � | 157,993 | �� | � | � | 159,232 | �� |
| EBITDA (1) |
� | � | 105,677 | �� | � | � | 104,445 | �� | � | � | 109,893 | �� | � | � | 97,419 | �� | � | � | 95,093 | �� |
| Adjusted EBITDA (1) |
� | � | 107,180 | �� | � | � | 105,717 | �� | � | � | 99,787 | �� | � | � | 97,735 | �� | � | � | 95,659 | �� |
| Net operating income - cash basis (2) |
� | � | 109,857 | �� | � | � | 105,743 | �� | � | � | 103,843 | �� | � | � | 103,382 | �� | � | � | 100,465 | �� |
| General and administrative expense |
� | � | 12,768 | �� | � | � | 12,443 | �� | � | � | 11,942 | �� | � | � | 11,817 | �� | � | � | 11,934 | �� |
| Acquisition-related expenses |
� | � | 487 | �� | � | � | 1,134 | �� | � | � | 1,250 | �� | � | � | 19 | �� | � | � | 907 | �� |
| Capitalized interest |
� | � | 6,120 | �� | � | � | 5,423 | �� | � | � | 4,192 | �� | � | � | 4,207 | �� | � | � | 3,984 | �� |
| Interest expense, net |
� | � | 22,215 | �� | � | � | 23,131 | �� | � | � | 28,010 | �� | � | � | 27,837 | �� | � | � | 27,870 | �� |
| Operating margin (3) |
� | � | 66.8 | %� | � | � | 66.7 | %� | � | � | 66.9 | %� | � | � | 67.9 | %� | � | � | 66.8 | %� |
| General and administrative expense / Total revenues |
� | � | 7.6 | %� | � | � | 7.3 | %� | � | � | 7.1 | %� | � | � | 7.5 | %� | � | � | 7.5 | %� |
| Change in same property net operating income - cash basis (4) |
� | � | 7.2 | %� | � | � | 6.7 | %� | � | � | 6.8 | %� | � | � | 6.6 | %� | � | � | 5.7 | %� |
| Net income available to common stockholders |
� | � | 15,960 | �� | � | � | 18,636 | �� | � | � | 18,833 | �� | � | � | 10,279 | �� | � | � | 4,247 | �� |
| Net income per share - diluted |
� | $ | 0.08 | �� | � | $ | 0.10 | �� | � | $ | 0.10 | �� | � | $ | 0.05 | �� | � | $ | 0.02 | �� |
| FFO - diluted (5) |
� | � | 83,695 | �� | � | � | 83,378 | �� | � | � | 83,383 | �� | � | � | 70,997 | �� | � | � | 67,586 | �� |
| FFO per share - diluted (5) |
� | $ | 0.40 | �� | � | $ | 0.40 | �� | � | $ | 0.40 | �� | � | $ | 0.34 | �� | � | $ | 0.33 | �� |
| CFFO - diluted (5) |
� | � | 84,182 | �� | � | � | 84,512 | �� | � | � | 84,633 | �� | � | � | 71,016 | �� | � | � | 68,493 | �� |
| CFFO per share - diluted (5) |
� | $ | 0.40 | �� | � | $ | 0.40 | �� | � | $ | 0.41 | �� | � | $ | 0.34 | �� | � | $ | 0.33 | �� |
| AFFO - diluted (5) |
� | � | 72,692 | �� | � | � | 67,322 | �� | � | � | 79,511 | �� | � | � | 65,395 | �� | � | � | 60,719 | �� |
| AFFO per share - diluted (5) |
� | $ | 0.35 | �� | � | $ | 0.32 | �� | � | $ | 0.38 | �� | � | $ | 0.31 | �� | � | $ | 0.29 | �� |
| Dividend per share - common stock |
� | $ | 0.250 | �� | � | $ | 0.250 | �� | � | $ | 0.250 | �� | � | $ | 0.250 | �� | � | $ | 0.235 | �� |
| CFFO payout ratio (6) |
� | � | 62.5 | %� | � | � | 62.5 | %� | � | � | 61.0 | %� | � | � | 73.5 | %� | � | � | 71.2 | %� |
| AFFO payout ratio (6) |
� | � | 71.4 | %� | � | � | 78.1 | %� | � | � | 65.8 | %� | � | � | 80.6 | %� | � | � | 81.0 | %� |
�
�
| (1) | For definitions and discussion of EBITDA and Adjusted EBITDA, see page 36. For a quantitative reconciliation of the differences between EBITDA, Adjusted EBITDA and net income available to common stockholders, see page 14. |
| (2) | For definitions and discussion of net operating income - cash basis, see page 15. |
| (3) | See page 15 for detail. |
| (4) | Compared to the same period in the prior year. See page 31 for detail. |
| (5) | For definitions and discussion of FFO, CFFO and AFFO, see page 36. For a quantitative reconciliation of the differences between FFO, CFFO, AFFO and net income available to common stockholders, see pages 12 and 13. |
| (6) | See page 13 for detail of the CFFO and AFFO payout ratios. |
�
�
CAPITALIZATION SUMMARY
SEPTEMBER 30, 2014
�
(In thousands, except per share and ratio amounts)
�
| Capitalization |
� | � | � | 9/30/14 | � | � | 6/30/14 | � | � | 3/31/14 | � | � | 12/31/13 | � | � | 9/30/13 | � | |||||
| Total common shares outstanding |
� | � | � | 197,455 | �� | � | � | 192,526 | �� | � | � | 192,503 | �� | � | � | 192,115 | �� | � | � | 192,107 | �� | |
| Total units outstanding (1) |
� | � | � | 5,405 | �� | � | � | 5,405 | �� | � | � | 5,405 | �� | � | � | 5,416 | �� | � | � | 5,416 | �� | |
| � | � | � |
� |
� | � | � |
� |
� | � | � |
� |
� | � | � |
� |
� | � | � |
� |
� | ||
| Total common shares and units outstanding |
� | � | � | 202,860 | �� | � | � | 197,931 | �� | � | � | 197,908 | �� | � | � | 197,531 | �� | � | � | 197,523 | �� | |
| Common share price at quarter end |
� | � | $ | 20.20 | �� | � | $ | 21.83 | �� | � | $ | 20.49 | �� | � | $ | 18.12 | �� | � | $ | 18.59 | �� | |
| � | � | � |
� |
� | � | � |
� |
� | � | � |
� |
� | � | � |
� |
� | � | � |
� |
� | ||
| Equity value at quarter end |
� | � | $ | 4,097,785 | �� | � | $ | 4,320,839 | �� | � | $ | 4,055,134 | �� | � | $ | 3,579,261 | �� | � | $ | 3,671,947 | �� | |
| Consolidated debt |
� | � | � | 2,845,685 | �� | � | � | 2,841,063 | �� | � | � | 2,761,337 | �� | � | � | 2,664,834 | �� | � | � | 2,560,173 | �� | |
| � | � | � |
� |
� | � | � |
� |
� | � | � |
� |
� | � | � |
� |
� | � | � |
� |
� | ||
| Total capitalization |
� | � | $ | 6,943,470 | �� | � | $ | 7,161,902 | �� | � | $ | 6,816,471 | �� | � | $ | 6,244,095 | �� | � | $ | 6,232,120 | �� | |
| � | � | � |
� |
� | � | � |
� |
� | � | � |
� |
� | � | � |
� |
� | � | � |
� |
� | ||
| Debt / Total assets |
� | � | � | 45.6 | %� | � | � | 46.1 | %� | � | � | 45.5 | %� | � | � | 44.6 | %� | � | � | 43.4 | %� | |
| Debt / Total gross assets |
� | � | � | 39.7 | %� | � | � | 40.3 | %� | � | � | 40.0 | %� | � | � | 39.4 | %� | � | � | 38.6 | %� | |
| Debt / Total capitalization |
� | � | � | 41.0 | %� | � | � | 39.7 | %� | � | � | 40.5 | %� | � | � | 42.7 | %� | � | � | 41.1 | %� | |
| Coverage Ratios (2) |
� | � | � | � | � | � | ||||||||||||||||
| Net Debt / Adjusted EBITDA (3) |
� | � | � | 6.6 | �� | � | � | 6.6 | �� | � | � | 6.8 | �� | � | � | 6.7 | �� | � | � | 6.6 | �� | |
| Interest coverage |
� | � | � | 5.5 | �� | � | � | 5.2 | �� | � | � | 3.9 | �� | � | � | 3.9 | �� | � | � | 3.8 | �� | |
| Fixed charge coverage |
� | � | � | 5.0 | �� | � | � | 4.7 | �� | � | � | 3.6 | �� | � | � | 3.5 | �� | � | � | 3.5 | �� | |
| Total Consolidated Debt |
� | � | � | � | � | � | ||||||||||||||||
| Secured debt / Total gross assets |
� | � | � | 6.7 | %� | � | � | 6.5 | %� | � | � | 10.2 | %� | � | � | 10.5 | %� | � | � | 10.8 | %� | |
| Floating rate debt / Total debt |
� | � | � | 36.8 | %� | � | � | 33.6 | %� | � | � | 35.7 | %� | � | � | 33.3 | %� | � | � | 30.4 | %� | |
| Adjusted floating rate debt / Total debt�(4) |
� | � | � | 17.0 | %� | � | � | 13.5 | %� | � | � | 15.2 | %� | � | � | 12.1 | %� | � | � | 8.5 | %� | |
| Unencumbered real estate / Total real estate |
� | � | � | 86.1 | %� | � | � | 86.3 | %� | � | � | 76.9 | %� | � | � | 76.7 | %� | � | � | 73.9 | %� | |
| Unencumbered CABR / Total CABR�(5) |
� | � | � | 83.4 | %� | � | � | 83.2 | %� | � | � | 77.3 | %� | � | � | 76.9 | %� | � | � | 75.8 | %� | |
| Unsecured line of credit capacity |
� | � | $ | 671,000 | �� | � | $ | 745,000 | �� | � | $ | 674,000 | �� | � | $ | 772,000 | �� | � | $ | 880,000 | �� | |
| Bond Covenants (6) | � | Requirements | � | � | � | � | � | � | � | � | � | � | � | � | � | � | � | |||||
| Total outstanding debt / Total assets |
� | Must�be���60% | � | � | 40.7 | %� | � | � | 41.5 | %� | � | � | 40.8 | %� | � | � | 40.4 | %� | � | � | 39.6 | %� |
| Secured debt / Total assets |
� | Must�be���40% | � | � | 6.8 | %� | � | � | 6.6 | %� | � | � | 10.4 | %� | � | � | 10.7 | %� | � | � | 11.1 | %� |
| Consolidated income available for debt service / Annual debt service charge |
� | Must�be���1.5X | � | � | 4.3 | �� | � | � | 4.0 | �� | � | � | 3.6 | �� | � | � | 3.6 | �� | � | � | 3.6 | �� |
| Unencumbered assets / Unsecured debt - Notes due 2020 |
� | Must�be���150% | � | � | 246 | %� | � | � | 240 | %� | � | � | 249 | %� | � | � | 253 | %� | � | � | 265 | %� |
| Unencumbered assets / Unsecured debt - Notes due 2016, 2019 and 2022 |
� | Must�be���150% | � | � | 244 | %� | � | � | 239 | %� | � | � | 247 | %� | � | � | 252 | %� | � | � | 263 | %� |
�
| (1) | Includes both operating partnership (OP) and long term incentive plan (LTIP) units outstanding. |
| (2) | For discussion of coverage ratios, see page 36. See page 17 for the calculation of interest and fixed charge coverage ratios. See page 14 for calculation of Adjusted EBITDA. |
| (3) | Net Debt is calculated as debt less (cash and cash equivalents and restricted cash). |
| (4) | Includes effect of interest rate swaps on the Company�s unsecured senior term loan facilities. See page 18 for more information. |
| (5) | For current annualized base rent (CABR) by market, see page 21. |
| (6) | For discussion on bond covenants, see page 37. |
�
�
PORTFOLIO SUMMARY
SEPTEMBER 30, 2014
�
�
| � | �� | Gross Book�Value |
� | �� | Buildings | � | �� | Rentable Square�Feet |
� | �� | Weighted- Average Leased�%�(1) |
� | ||||
| � | �� | (In�thousands) | � | �� | � | � | �� | � | � | �� | � | � | ||||
| Operating portfolio |
�� | $ | 5,774,159 | �� | �� | � | 174 | �� | �� | � | 15,738,610 | �� | �� | � | 92.6 | %� |
| Development (2) |
�� | � | 277,949 | �� | �� | � | 6 | �� | �� | � | 1,034,398 | �� | �� | � | 83.8 | %� |
| Redevelopment (2) |
�� | � | 14,984 | �� | �� | � | 1 | �� | �� | � | 41,257 | �� | �� | � | 86.5 | %� |
| Unconsolidated partnership portfolio (3) |
�� | � | 36,275 | �� | �� | � | 3 | �� | �� | � | 355,080 | �� | �� | � | 99.9 | %� |
| Pre-Development (2) |
�� | � | 119,604 | �� | �� | � | ��� | � | �� | � | 1,124,000 | �� | �� | � | ��� | �� |
| Development potential (2) |
�� | � | 287,035 | �� | �� | � | ��� | �� | �� | � | 6,254,000 | �� | �� | � | ��� | �� |
| �� | � |
� |
� | �� | � |
� |
� | �� | � |
� |
� | �� | ||||
| Total portfolio |
�� | $ | 6,510,006 | �� | �� | � | 184 | �� | �� | � | 24,547,345 | �� | �� | |||
| �� | � |
� |
� | �� | � |
� |
� | �� | � |
� |
� | �� | ||||
�
�
| (1) | Calculated based on gross book value for each asset multiplied by the percentage leased. |
| (2) | See page 25 for detail and page 37 for definitions of terms. |
| (3) | See page 27 for detail of the unconsolidated partnership portfolio. |
�
�
CONSOLIDATED BALANCE SHEETS
SEPTEMBER 30, 2014
�
(In thousands)
�
| � | �� | 9/30/14 | � | � | 6/30/14 | � | � | 3/31/14 | � | � | 12/31/13 | � | � | 9/30/13 | � | |||||
| Assets | �� | � | � | � | � | |||||||||||||||
| Investments in real estate, net |
�� | $ | 5,535,115 | �� | � | $ | 5,474,648 | �� | � | $ | 5,235,036 | �� | � | $ | 5,217,902 | �� | � | $ | 5,172,102 | �� |
| Investments in unconsolidated partnerships |
�� | � | 36,275 | �� | � | � | 32,440 | �� | � | � | 31,461 | �� | � | � | 32,137 | �� | � | � | 31,978 | �� |
| Cash and cash equivalents |
�� | � | 33,864 | �� | � | � | 39,004 | �� | � | � | 59,121 | �� | � | � | 34,706 | �� | � | � | 29,230 | �� |
| Accounts receivable, net |
�� | � | 18,843 | �� | � | � | 9,686 | �� | � | � | 10,719 | �� | � | � | 8,421 | �� | � | � | 10,580 | �� |
| Accrued straight-line rents, net |
�� | � | 183,904 | �� | � | � | 181,705 | �� | � | � | 178,114 | �� | � | � | 173,779 | �� | � | � | 169,272 | �� |
| Deferred leasing costs, net |
�� | � | 224,824 | �� | � | � | 236,848 | �� | � | � | 189,527 | �� | � | � | 198,067 | �� | � | � | 202,393 | �� |
| Other assets |
�� | � | 205,487 | �� | � | � | 185,406 | �� | � | � | 371,453 | �� | � | � | 307,589 | �� | � | � | 278,600 | �� |
| �� | � |
� |
� | � | � |
� |
� | � | � |
� |
� | � | � |
� |
� | � | � |
� |
� | |
| Total assets |
�� | $ | 6,238,312 | �� | � | $ | 6,159,737 | �� | � | $ | 6,075,431 | �� | � | $ | 5,972,601 | �� | � | $ | 5,894,155 | �� |
| �� | � |
� |
� | � | � |
� |
� | � | � |
� |
� | � | � |
� |
� | � | � |
� |
� | |
| ����Liabilities and Equity | �� | � | � | � | � | |||||||||||||||
| Liabilities: |
�� | � | � | � | � | |||||||||||||||
| Mortgage notes payable, net |
�� | $ | 478,543 | �� | � | $ | 456,034 | �� | � | $ | 706,013 | �� | � | $ | 709,324 | �� | � | $ | 716,733 | �� |
| Exchangeable senior notes, net |
�� | � | 95,678 | �� | � | � | 180,000 | �� | � | � | 180,000 | �� | � | � | 180,000 | �� | � | � | 180,000 | �� |
| Unsecured senior notes, net |
�� | � | 1,293,572 | �� | � | � | 1,293,246 | �� | � | � | 895,312 | �� | � | � | 895,083 | �� | � | � | 894,850 | �� |
| Unsecured senior term loans |
�� | � | 755,876 | �� | � | � | 764,106 | �� | � | � | 760,066 | �� | � | � | 758,786 | �� | � | � | 755,226 | �� |
| Unsecured line of credit |
�� | � | 229,000 | �� | � | � | 155,000 | �� | � | � | 226,000 | �� | � | � | 128,000 | �� | � | � | 20,000 | �� |
| Accounts payable, accrued expenses, and other liabilities |
�� | � | 375,933 | �� | � | � | 358,958 | �� | � | � | 333,157 | �� | � | � | 314,383 | �� | � | � | 311,287 | �� |
| �� | � |
� |
� | � | � |
� |
� | � | � |
� |
� | � | � |
� |
� | � | � |
� |
� | |
| Total liabilities |
�� | � | 3,228,602 | �� | � | � | 3,207,344 | �� | � | � | 3,100,548 | �� | � | � | 2,985,576 | �� | � | � | 2,878,096 | �� |
| Equity: |
�� | � | � | � | � | |||||||||||||||
| Stockholders� equity: |
�� | � | � | � | � | |||||||||||||||
| Common stock |
�� | � | 1,975 | �� | � | � | 1,925 | �� | � | � | 1,925 | �� | � | � | 1,921 | �� | � | � | 1,921 | �� |
| Additional paid-in capital |
�� | � | 3,643,957 | �� | � | � | 3,557,886 | �� | � | � | 3,554,504 | �� | � | � | 3,554,558 | �� | � | � | 3,552,595 | �� |
| Accumulated other comprehensive loss, net |
�� | � | (20,915 | )� | � | � | (24,088 | )� | � | � | (19,973 | )� | � | � | (32,923 | )� | � | � | (38,618 | )� |
| Dividends in excess of earnings |
�� | � | (675,763 | )� | � | � | (642,360 | )� | � | � | (612,864 | )� | � | � | (583,569 | )� | � | � | (545,819 | )� |
| �� | � |
� |
� | � | � |
� |
� | � | � |
� |
� | � | � |
� |
� | � | � |
� |
� | |
| Total stockholders� equity |
�� | � | 2,949,254 | �� | � | � | 2,893,363 | �� | � | � | 2,923,592 | �� | � | � | 2,939,987 | �� | � | � | 2,970,079 | �� |
| Noncontrolling interests |
�� | � | 60,456 | �� | � | � | 59,030 | �� | � | � | 51,291 | �� | � | � | 47,038 | �� | � | � | 45,980 | �� |
| �� | � |
� |
� | � | � |
� |
� | � | � |
� |
� | � | � |
� |
� | � | � |
� |
� | |
| Total equity |
�� | � | 3,009,710 | �� | � | � | 2,952,393 | �� | � | � | 2,974,883 | �� | � | � | 2,987,025 | �� | � | � | 3,016,059 | �� |
| �� | � |
� |
� | � | � |
� |
� | � | � |
� |
� | � | � |
� |
� | � | � |
� |
� | |
| Total liabilities and equity |
�� | $ | 6,238,312 | �� | � | $ | 6,159,737 | �� | � | $ | 6,075,431 | �� | � | $ | 5,972,601 | �� | � | $ | 5,894,155 | �� |
| �� | � |
� |
� | � | � |
� |
� | � | � |
� |
� | � | � |
� |
� | � | � |
� |
� | |
�
�
CONSOLIDATED STATEMENTS OF OPERATIONS
SEPTEMBER 30, 2014
�
(In thousands, except share and per share data)
�
| � | �� | Three Months Ended | � | |||||||||||||||||
| � | �� | 9/30/14 | � | � | 6/30/14 | � | � | 3/31/14 | � | � | 12/31/13 | � | � | 9/30/13 | � | |||||
| Revenues: |
�� | � | � | � | � | |||||||||||||||
| Rental |
�� | $ | 122,838 | �� | � | $ | 120,924 | �� | � | $ | 120,026 | �� | � | $ | 118,048 | �� | � | $ | 116,884 | �� |
| Tenant recoveries |
�� | � | 42,626 | �� | � | � | 40,280 | �� | � | � | 38,735 | �� | � | � | 37,597 | �� | � | � | 38,907 | �� |
| Other revenue |
�� | � | 3,452 | �� | � | � | 9,957 | �� | � | � | 10,115 | �� | � | � | 2,348 | �� | � | � | 3,441 | �� |
| �� | � |
� |
� | � | � |
� |
� | � | � |
� |
� | � | � |
� |
� | � | � |
� |
� | |
| Total revenues |
�� | � | 168,916 | �� | � | � | 171,161 | �� | � | � | 168,876 | �� | � | � | 157,993 | �� | � | � | 159,232 | �� |
| �� | � |
� |
� | � | � |
� |
� | � | � |
� |
� | � | � |
� |
� | � | � |
� |
� | |
| Expenses: |
�� | � | � | � | � | |||||||||||||||
| Rental operations |
�� | � | 54,899 | �� | � | � | 53,636 | �� | � | � | 52,523 | �� | � | � | 49,891 | �� | � | � | 51,688 | �� |
| Depreciation and amortization |
�� | � | 64,452 | �� | � | � | 62,736 | �� | � | � | 62,409 | �� | � | � | 58,781 | �� | � | � | 61,898 | �� |
| General and administrative |
�� | � | 12,768 | �� | � | � | 12,443 | �� | � | � | 11,942 | �� | � | � | 11,817 | �� | � | � | 11,934 | �� |
| Acquisition-related expenses |
�� | � | 487 | �� | � | � | 1,134 | �� | � | � | 1,250 | �� | � | � | 19 | �� | � | � | 907 | �� |
| �� | � |
� |
� | � | � |
� |
� | � | � |
� |
� | � | � |
� |
� | � | � |
� |
� | |
| Total expenses |
�� | � | 132,606 | �� | � | � | 129,949 | �� | � | � | 128,124 | �� | � | � | 120,508 | �� | � | � | 126,427 | �� |
| �� | � |
� |
� | � | � |
� |
� | � | � |
� |
� | � | � |
� |
� | � | � |
� |
� | |
| Income from operations |
�� | � | 36,310 | �� | � | � | 41,212 | �� | � | � | 40,752 | �� | � | � | 37,485 | �� | � | � | 32,805 | �� |
| Equity in net income/(loss) of unconsolidated partnerships |
�� | � | 733 | �� | � | � | (10 | )� | � | � | (138 | )� | � | � | (208 | )� | � | � | (112 | )� |
| Interest expense, net |
�� | � | (22,215 | )� | � | � | (23,131 | )� | � | � | (28,010 | )� | � | � | (27,837 | )� | � | � | (27,870 | )� |
| Other income/(expense) |
�� | � | 2,148 | �� | � | � | 1,027 | �� | � | � | 8,163 | �� | � | � | 1,136 | �� | � | � | (687 | )� |
| �� | � |
� |
� | � | � |
� |
� | � | � |
� |
� | � | � |
� |
� | � | � |
� |
� | |
| Net income |
�� | � | 16,976 | �� | � | � | 19,098 | �� | � | � | 20,767 | �� | � | � | 10,576 | �� | � | � | 4,136 | �� |
| Net (income)/loss attributable to noncontrolling interests |
�� | � | (1,016 | )� | � | � | (462 | )� | � | � | (1,934 | )� | � | � | (297 | )� | � | � | 111 | �� |
| �� | � |
� |
� | � | � |
� |
� | � | � |
� |
� | � | � |
� |
� | � | � |
� |
� | |
| Net income available to common stockholders |
�� | $ | 15,960 | �� | � | $ | 18,636 | �� | � | $ | 18,833 | �� | � | $ | 10,279 | �� | � | $ | 4,247 | �� |
| �� | � |
� |
� | � | � |
� |
� | � | � |
� |
� | � | � |
� |
� | � | � |
� |
� | |
| Income from continuing operations per share available to common stockholders: |
�� | � | � | � | � | |||||||||||||||
| Basic and diluted earnings per share |
�� | $ | 0.08 | �� | � | $ | 0.10 | �� | � | $ | 0.10 | �� | � | $ | 0.05 | �� | � | $ | 0.02 | �� |
| �� | � |
� |
� | � | � |
� |
� | � | � |
� |
� | � | � |
� |
� | � | � |
� |
� | |
| Net income per share available to common stockholders: |
�� | � | � | � | � | |||||||||||||||
| Basic and diluted earnings per share |
�� | $ | 0.08 | �� | � | $ | 0.10 | �� | � | $ | 0.10 | �� | � | $ | 0.05 | �� | � | $ | 0.02 | �� |
| �� | � |
� |
� | � | � |
� |
� | � | � |
� |
� | � | � |
� |
� | � | � |
� |
� | |
| Weighted-average common shares outstanding: |
�� | � | � | � | � | |||||||||||||||
| Basic |
�� | � | 194,022,619 | �� | � | � | 191,003,248 | �� | � | � | 190,905,867 | �� | � | � | 190,664,323 | �� | � | � | 190,646,722 | �� |
| �� | � |
� |
� | � | � |
� |
� | � | � |
� |
� | � | � |
� |
� | � | � |
� |
� | |
| Diluted |
�� | � | 199,574,893 | �� | � | � | 196,800,354 | �� | � | � | 196,545,536 | �� | � | � | 196,117,552 | �� | � | � | 196,131,643 | �� |
| �� | � |
� |
� | � | � |
� |
� | � | � |
� |
� | � | � |
� |
� | � | � |
� |
� | |
�
�
BALANCE SHEET / OPERATIONS STATEMENT DETAIL
SEPTEMBER 30, 2014
�
(In thousands)
�
| � | �� | 9/30/14 | � | � | 6/30/14 | � | � | 3/31/14 | � | � | 12/31/13 | � | � | 9/30/13 | � | |||||
| Restricted cash |
�� | $ | 8,297 | �� | � | $ | 9,096 | �� | � | $ | 11,190 | �� | � | $ | 11,500 | �� | � | $ | 9,386 | �� |
| Acquired above-market leases, net |
�� | � | 12,197 | �� | � | � | 13,262 | �� | � | � | 14,380 | �� | � | � | 15,828 | �� | � | � | 17,052 | �� |
| Acquired below-market ground lease, net |
�� | � | 25,256 | �� | � | � | 25,575 | �� | � | � | 21,865 | �� | � | � | 21,983 | �� | � | � | 19,648 | �� |
| Deferred loan costs, net |
�� | � | 16,997 | �� | � | � | 18,652 | �� | � | � | 17,291 | �� | � | � | 18,771 | �� | � | � | 20,407 | �� |
| Lease incentives, net |
�� | � | 23,907 | �� | � | � | 19,988 | �� | � | � | 19,135 | �� | � | � | 19,639 | �� | � | � | 20,138 | �� |
| Construction loan receivable, net (1) |
�� | � | ��� | �� | � | � | ��� | �� | � | � | 191,280 | �� | � | � | 151,823 | �� | � | � | 120,948 | �� |
| Other |
�� | � | 118,833 | �� | � | � | 98,833 | �� | � | � | 96,312 | �� | � | � | 68,045 | �� | � | � | 71,021 | �� |
| �� | � |
� |
� | � | � |
� |
� | � | � |
� |
� | � | � |
� |
� | � | � |
� |
� | |
| Other assets |
�� | $ | 205,487 | �� | � | $ | 185,406 | �� | � | $ | 371,453 | �� | � | $ | 307,589 | �� | � | $ | 278,600 | �� |
| �� | � |
� |
� | � | � |
� |
� | � | � |
� |
� | � | � |
� |
� | � | � |
� |
� | |
| Security deposits |
�� | $ | 14,766 | �� | � | $ | 14,348 | �� | � | $ | 13,833 | �� | � | $ | 13,728 | �� | � | $ | 13,538 | �� |
| Dividends and distributions payable |
�� | � | 50,715 | �� | � | � | 49,483 | �� | � | � | 49,477 | �� | � | � | 49,383 | �� | � | � | 46,418 | �� |
| Accounts payable, accrued expenses and other liabilities |
�� | � | 271,634 | �� | � | � | 253,259 | �� | � | � | 231,073 | �� | � | � | 210,986 | �� | � | � | 207,967 | �� |
| Derivative instruments |
�� | � | 1,328 | �� | � | � | 2,909 | �� | � | � | 2,154 | �� | � | � | 2,165 | �� | � | � | 2,620 | �� |
| Acquired below-market leases, net |
�� | � | 37,490 | �� | � | � | 38,959 | �� | � | � | 36,620 | �� | � | � | 38,121 | �� | � | � | 40,744 | �� |
| �� | � |
� |
� | � | � |
� |
� | � | � |
� |
� | � | � |
� |
� | � | � |
� |
� | |
| Accounts payable, accrued expenses and other liabilities |
�� | $ | 375,933 | �� | � | $ | 358,958 | �� | � | $ | 333,157 | �� | � | $ | 314,383 | �� | � | $ | 311,287 | �� |
| �� | � |
� |
� | � | � |
� |
� | � | � |
� |
� | � | � |
� |
� | � | � |
� |
� | |
| � | �� | � Three Months Ended |
� | |||||||||||||||||
| � | �� | 9/30/14 | � | � | 6/30/14 | � | � | 3/31/14 | � | � | 12/31/13 | � | � | 9/30/13 | � | |||||
| Lease termination revenue |
�� | $ | 3,300 | �� | � | $ | 1,023 | �� | � | $ | 5,287 | �� | � | $ | ��� | �� | � | $ | 1,504 | �� |
| Construction loan revenue (2) |
�� | � | ��� | �� | � | � | 8,653 | �� | � | � | 2,557 | �� | � | � | 2,190 | �� | � | � | 1,824 | �� |
| Other revenue |
�� | � | 152 | �� | � | � | 281 | �� | � | � | 2,271 | �� | � | � | 158 | �� | � | � | 113 | �� |
| �� | � |
� |
� | � | � |
� |
� | � | � |
� |
� | � | � |
� |
� | � | � |
� |
� | |
| Other revenue |
�� | $ | 3,452 | �� | � | $ | 9,957 | �� | � | $ | 10,115 | �� | � | $ | 2,348 | �� | � | $ | 3,441 | �� |
| �� | � |
� |
� | � | � |
� |
� | � | � |
� |
� | � | � |
� |
� | � | � |
� |
� | |
| Rental operations expenses |
�� | $ | 39,359 | �� | � | $ | 39,511 | �� | � | $ | 38,039 | �� | � | $ | 35,450 | �� | � | $ | 36,222 | �� |
| Real estate taxes |
�� | � | 15,540 | �� | � | � | 14,125 | �� | � | � | 14,484 | �� | � | � | 14,441 | �� | � | � | 15,466 | �� |
| �� | � |
� |
� | � | � |
� |
� | � | � |
� |
� | � | � |
� |
� | � | � |
� |
� | |
| Rental operations |
�� | $ | 54,899 | �� | � | $ | 53,636 | �� | � | $ | 52,523 | �� | � | $ | 49,891 | �� | � | $ | 51,688 | �� |
| �� | � |
� |
� | � | � |
� |
� | � | � |
� |
� | � | � |
� |
� | � | � |
� |
� | |
| Non-cash adjustment for securities |
�� | � | ��� | �� | � | � | (50 | )� | � | � | ��� | �� | � | � | ��� | �� | � | � | ��� | �� |
| (Loss)/gain on derivative instruments |
�� | � | (190 | )� | � | � | (270 | )� | � | � | 161 | �� | � | � | 296 | �� | � | � | 121 | �� |
| Gain on sale of assets |
�� | � | ��� | �� | � | � | ��� | �� | � | � | ��� | �� | � | � | ��� | �� | � | � | 230 | �� |
| Other investment gain/(loss) |
�� | � | 2,291 | �� | � | � | ��� | �� | � | � | (1,319 | )� | � | � | (107 | )� | � | � | (1,135 | )� |
| Realized gain on securities |
�� | � | 681 | �� | � | � | 546 | �� | � | � | 9,322 | �� | � | � | 787 | �� | � | � | 354 | �� |
| Realized (loss)/gain on foreign currency transactions |
�� | � | (96 | )� | � | � | 100 | �� | � | � | 29 | �� | � | � | 56 | �� | � | � | 190 | �� |
| Income tax (expense)/benefit |
�� | � | (538 | )� | � | � | 701 | �� | � | � | (30 | )� | � | � | 104 | �� | � | � | (447 | )� |
| �� | � |
� |
� | � | � |
� |
� | � | � |
� |
� | � | � |
� |
� | � | � |
� |
� | |
| Other income/(expense) |
�� | $ | 2,148 | �� | � | $ | 1,027 | �� | � | $ | 8,163 | �� | � | $ | 1,136 | �� | � | $ | (687 | )� |
| �� | � |
� |
� | � | � |
� |
� | � | � |
� |
� | � | � |
� |
� | � | � |
� |
� | |
�
| (1) | Represents funding of draws on a $355 million construction loan secured by first priority mortgages on a 1.1�million square foot laboratory, office and retail development project located in Boston, Massachusetts, which was repaid in May 2014 prior to maturity. |
| (2) | Construction loan revenue for the three months ended June�30, 2014 includes a prepayment fee of approximately $7.5 million, net of deferred loan fees write-offs. |
�
�
FFO, CFFO AND AFFO (1)
SEPTEMBER 30, 2014
�
(In thousands)
�
| � | �� | Three Months Ended | � | |||||||||||||||||
| � | �� | 9/30/14 | � | � | 6/30/14 | � | � | 3/31/14 | � | � | 12/31/13 | � | � | 9/30/13 | � | |||||
| Reconciliation of net income available to common stockholders to funds from operations excluding acquisition-related expenses (CFFO): |
�� | � | � | � | � | |||||||||||||||
| Net income available to common stockholders |
�� | $ | 15,960 | �� | � | $ | 18,636 | �� | � | $ | 18,833 | �� | � | $ | 10,279 | �� | � | $ | 4,247 | �� |
| Adjustments: |
�� | � | � | � | � | |||||||||||||||
| Gain on sale of assets |
�� | � | ��� | �� | � | � | ��� | �� | � | � | ��� | �� | � | � | ��� | �� | � | � | (230 | )� |
| Noncontrolling interests in operating partnership |
�� | � | 429 | �� | � | � | 514 | �� | � | � | 521 | �� | � | � | 285 | �� | � | � | 118 | �� |
| Depreciation�& amortization - unconsolidated partnerships |
�� | � | 2,312 | �� | � | � | 403 | �� | � | � | 373 | �� | � | � | 382 | �� | � | � | 380 | �� |
| Depreciation�& amortization - consolidated entities |
�� | � | 64,452 | �� | � | � | 62,736 | �� | � | � | 62,409 | �� | � | � | 58,781 | �� | � | � | 61,898 | �� |
| Depreciation�& amortization - allocable to noncontrolling interests of consolidated joint ventures |
�� | � | (699 | )� | � | � | (599 | )� | � | � | (441 | )� | � | � | (418 | )� | � | � | (515 | )� |
| �� | � |
� |
� | � | � |
� |
� | � | � |
� |
� | � | � |
� |
� | � | � |
� |
� | |
| Funds from operations (FFO) - basic |
�� | $ | 82,454 | �� | � | $ | 81,690 | �� | � | $ | 81,695 | �� | � | $ | 69,309 | �� | � | $ | 65,898 | �� |
| Interest expense - exchangeable senior notes due 2030 (2) |
�� | � | 1,241 | �� | � | � | 1,688 | �� | � | � | 1,688 | �� | � | � | 1,688 | �� | � | � | 1,688 | �� |
| �� | � |
� |
� | � | � |
� |
� | � | � |
� |
� | � | � |
� |
� | � | � |
� |
� | |
| FFO - diluted |
�� | $ | 83,695 | �� | � | $ | 83,378 | �� | � | $ | 83,383 | �� | � | $ | 70,997 | �� | � | $ | 67,586 | �� |
| Acquisition-related expenses |
�� | � | 487 | �� | � | � | 1,134 | �� | � | � | 1,250 | �� | � | � | 19 | �� | � | � | 907 | �� |
| �� | � |
� |
� | � | � |
� |
� | � | � |
� |
� | � | � |
� |
� | � | � |
� |
� | |
| CFFO - diluted |
�� | $ | 84,182 | �� | � | $ | 84,512 | �� | � | $ | 84,633 | �� | � | $ | 71,016 | �� | � | $ | 68,493 | �� |
| �� | � |
� |
� | � | � |
� |
� | � | � |
� |
� | � | � |
� |
� | � | � |
� |
� | |
| Reconciliation of CFFO to adjusted funds from operations (AFFO): |
�� | � | � | � | � | |||||||||||||||
| Adjustments: |
�� | � | � | � | � | |||||||||||||||
| Recurring capital expenditures and second generation tenant improvements (3) |
�� | � | (17,007 | )� | � | � | (21,553 | )� | � | � | (7,731 | )� | � | � | (8,028 | )� | � | � | (9,857 | )� |
| Leasing commissions |
�� | � | (1,741 | )� | � | � | (1,929 | )� | � | � | (1,910 | )� | � | � | (1,780 | )� | � | � | (1,703 | )� |
| Loss/(gain) on derivative instruments |
�� | � | 190 | �� | � | � | 270 | �� | � | � | (161 | )� | � | � | (296 | )� | � | � | (121 | )� |
| Non-cash adjustment for securities |
�� | � | ��� | �� | � | � | 50 | �� | � | � | ��� | �� | � | � | ��� | �� | � | � | ��� | �� |
| Non-cash debt adjustments |
�� | � | 3,046 | �� | � | � | 3,298 | �� | � | � | 3,094 | �� | � | � | 3,106 | �� | � | � | 3,426 | �� |
| Amortization of lease incentives |
�� | � | 656 | �� | � | � | 561 | �� | � | � | 557 | �� | � | � | 563 | �� | � | � | 561 | �� |
| Depreciation included in general and administrative expense |
�� | � | 848 | �� | � | � | 757 | �� | � | � | 740 | �� | � | � | 647 | �� | � | � | 629 | �� |
| Non-cash equity compensation |
�� | � | 3,658 | �� | � | � | 3,729 | �� | � | � | 3,750 | �� | � | � | 3,285 | �� | � | � | 3,489 | �� |
| Straight line rents |
�� | � | (1,174 | )� | � | � | (1,949 | )� | � | � | (3,194 | )� | � | � | (2,983 | )� | � | � | (4,078 | )� |
| Share of unconsolidated partnership adjustments (4) |
�� | � | 218 | �� | � | � | 18 | �� | � | � | 18 | �� | � | � | 18 | �� | � | � | 24 | �� |
| Fair-value lease revenue |
�� | � | (184 | )� | � | � | (442 | )� | � | � | (285 | )� | � | � | (153 | )� | � | � | (144 | )� |
| �� | � |
� |
� | � | � |
� |
� | � | � |
� |
� | � | � |
� |
� | � | � |
� |
� | |
| AFFO - diluted |
�� | $ | 72,692 | �� | � | $ | 67,322 | �� | � | $ | 79,511 | �� | � | $ | 65,395 | �� | � | $ | 60,719 | �� |
| �� | � |
� |
� | � | � |
� |
� | � | � |
� |
� | � | � |
� |
� | � | � |
� |
� | |
�
| (1) | For definitions and discussion of FFO, CFFO and AFFO, see page 36. |
| (2) | The calculations of FFO, CFFO and AFFO per share diluted include the assumed issuance of common stock pursuant to the exchange provision of the exchangeable senior notes due 2030, which is dilutive based on the �if converted� method for all periods presented since the original issuance in January 2010. Under the if converted method, if the add back of interest charges relating to the exchangeable senior notes due 2030 divided by the corresponding number of common shares issuable upon exchange is dilutive, the potentially issuable shares are included in the calculations of FFO, CFFO and AFFO per diluted share. |
| (3) | Includes revenue enhancing and non-revenue enhancing recurring capital expenditures. Excludes first generation tenant improvements. For definitions of recurring capital expenditures and first and second generation leases, see page 37. |
| (4) | Share of unconsolidated partnership adjustments includes the Company�s share of amortization of deferred loan costs, lease incentives, straight line rents and fair-value lease revenue. |
�
�
FFO, CFFO AND AFFO PER SHARE (1)
SEPTEMBER 30, 2014
�
(In thousands, except share, per share and ratio amounts)
�
| � | �� | Three Months Ended | � | |||||||||||||||||
| � | �� | 9/30/14 | � | � | 6/30/14 | � | � | 3/31/14 | � | � | 12/31/13 | � | � | 9/30/13 | � | |||||
| FFO - basic |
�� | $ | 82,454 | �� | � | $ | 81,690 | �� | � | $ | 81,695 | �� | � | $ | 69,309 | �� | � | $ | 65,898 | �� |
| FFO - diluted |
�� | � | 83,695 | �� | � | � | 83,378 | �� | � | � | 83,383 | �� | � | � | 70,997 | �� | � | � | 67,586 | �� |
| CFFO - diluted |
�� | � | 84,182 | �� | � | � | 84,512 | �� | � | � | 84,633 | �� | � | � | 71,016 | �� | � | � | 68,493 | �� |
| AFFO - diluted |
�� | � | 72,692 | �� | � | � | 67,322 | �� | � | � | 79,511 | �� | � | � | 65,395 | �� | � | � | 60,719 | �� |
| FFO per share - basic |
�� | $ | 0.41 | �� | � | $ | 0.41 | �� | � | $ | 0.41 | �� | � | $ | 0.35 | �� | � | $ | 0.33 | �� |
| FFO per share - diluted (2) |
�� | � | 0.40 | �� | � | � | 0.40 | �� | � | � | 0.40 | �� | � | � | 0.34 | �� | � | � | 0.33 | �� |
| CFFO per share - diluted (2) |
�� | � | 0.40 | �� | � | � | 0.40 | �� | � | � | 0.41 | �� | � | � | 0.34 | �� | � | � | 0.33 | �� |
| AFFO per share - diluted (2) |
�� | � | 0.35 | �� | � | � | 0.32 | �� | � | � | 0.38 | �� | � | � | 0.31 | �� | � | � | 0.29 | �� |
| Dividends and distributions declared per common share |
�� | $ | 0.250 | �� | � | $ | 0.250 | �� | � | $ | 0.250 | �� | � | $ | 0.250 | �� | � | $ | 0.235 | �� |
| �� | � |
� |
� | � | � |
� |
� | � | � |
� |
� | � | � |
� |
� | � | � |
� |
� | |
| CFFO payout ratio |
�� | � | 62.5 | %� | � | � | 62.5 | %� | � | � | 61.0 | %� | � | � | 73.5 | %� | � | � | 71.2 | %� |
| AFFO payout ratio |
�� | � | 71.4 | %� | � | � | 78.1 | %� | � | � | 65.8 | %� | � | � | 80.6 | %� | � | � | 81.0 | %� |
| Weighted-average common shares and units outstanding diluted (3) |
�� | � | 201,059,541 | �� | � | � | 198,309,809 | �� | � | � | 198,056,397 | �� | � | � | 197,563,868 | �� | � | � | 197,546,778 | �� |
| Dilutive effect of exchangeable senior notes due 2030 (2) |
�� | � | 7,589,600 | �� | � | � | 10,578,132 | �� | � | � | 10,525,410 | �� | � | � | 10,405,224 | �� | � | � | 10,405,224 | �� |
| �� | � |
� |
� | � | � |
� |
� | � | � |
� |
� | � | � |
� |
� | � | � |
� |
� | |
| Weighted-average common shares and units outstanding diluted - FFO, CFFO and AFFO |
�� | � | 208,649,141 | �� | � | � | 208,887,941 | �� | � | � | 208,581,807 | �� | � | � | 207,969,092 | �� | � | � | 207,952,002 | �� |
| �� | � |
� |
� | � | � |
� |
� | � | � |
� |
� | � | � |
� |
� | � | � |
� |
� | |
�
�
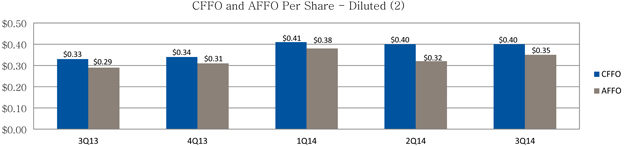
�
| (1) | For definitions and discussion of FFO, CFFO and AFFO, see page 36. |
| (2) | The calculations of FFO, CFFO and AFFO per share diluted include the assumed issuance of common stock pursuant to the exchange provision of the exchangeable senior notes due 2030, which is dilutive based on the �if converted� method for all periods presented since the original issuance in January 2010. Under the if converted method, if the add back of the exchangeable senior notes due 2030 divided by the corresponding number of common shares issuable upon exchange is dilutive, the potentially issuable shares are included in the interest charges relating to calculations of FFO, CFFO and AFFO per diluted share. |
| (3) | The three months ended September�30, 2014,�June�30, 2014,�March�31, 2014,�December�31, 2013, and September�30, 2013 include 1,484,648, 1,509,455, 1,510,861, 1,446,316, and 1,415,135 shares of unvested restricted stock, respectively, which are considered anti-dilutive for purposes of calculating diluted earnings per share. |
�
�
RECONCILIATION OF EBITDA AND ADJUSTED EBITDA (1)
SEPTEMBER 30, 2014
�
(In thousands)
�
| � | �� | Three Months Ended | � | |||||||||||||||||
| � | �� | 9/30/14 | � | �� | 6/30/14 | � | � | 3/31/14 | � | � | 12/31/13 | � | � | 9/30/13 | � | |||||
| Reconciliation of net income available to common stockholders to earnings before interest, taxes, depreciation and amortization (EBITDA) and Adjusted EBITDA: |
�� | �� | � | � | � | |||||||||||||||
| Net income available to common stockholders |
�� | $ | 15,960 | �� | �� | $ | 18,636 | �� | � | $ | 18,833 | �� | � | $ | 10,279 | �� | � | $ | 4,247 | �� |
| Interest expense, net |
�� | � | 22,215 | �� | �� | � | 23,131 | �� | � | � | 28,010 | �� | � | � | 27,837 | �� | � | � | 27,870 | �� |
| Interest expense - unconsolidated partnerships |
�� | � | 200 | �� | �� | � | 240 | �� | � | � | 238 | �� | � | � | 244 | �� | � | � | 251 | �� |
| Income tax expense/(benefit) |
�� | � | 538 | �� | �� | � | (701 | )� | � | � | 30 | �� | � | � | (104 | )� | � | � | 447 | �� |
| Depreciation�& amortization - consolidated entities |
�� | � | 64,452 | �� | �� | � | 62,736 | �� | � | � | 62,409 | �� | � | � | 58,781 | �� | � | � | 61,898 | �� |
| Depreciation�& amortization - unconsolidated partnerships |
�� | � | 2,312 | �� | �� | � | 403 | �� | � | � | 373 | �� | � | � | 382 | �� | � | � | 380 | �� |
| �� | � |
� |
� | �� | � |
� |
� | � | � |
� |
� | � | � |
� |
� | � | � |
� |
� | |
| EBITDA |
�� | � | 105,677 | �� | �� | � | 104,445 | �� | � | � | 109,893 | �� | � | � | 97,419 | �� | � | � | 95,093 | �� |
| Noncontrolling interests |
�� | � | 1,016 | �� | �� | � | 462 | �� | � | � | 1,934 | �� | � | � | 297 | �� | � | � | (111 | )� |
| Non-cash adjustment for securities |
�� | � | ��� | �� | �� | � | 50 | �� | � | � | ��� | �� | � | � | ��� | �� | � | � | ��� | �� |
| Gain on sale of assets |
�� | � | ��� | �� | �� | � | ��� | �� | � | � | ��� | �� | � | � | ��� | �� | � | � | (230 | )� |
| Net realized gain on securities (2) |
�� | � | ��� | �� | �� | � | ��� | �� | � | � | (8,003 | )� | � | � | ��� | �� | � | � | ��� | �� |
| Acquisition-related expenses |
�� | � | 487 | �� | �� | � | 1,134 | �� | � | � | 1,250 | �� | � | � | 19 | �� | � | � | 907 | �� |
| 4570 Executive Drive lease termination revenue, net |
�� | � | ��� | �� | �� | � | (374 | )� | � | � | (5,287 | )� | � | � | ��� | �� | � | � | ��� | �� |
| �� | � |
� |
� | �� | � |
� |
� | � | � |
� |
� | � | � |
� |
� | � | � |
� |
� | |
| Adjusted EBITDA |
�� | $ | 107,180 | �� | �� | $ | 105,717 | �� | � | $ | 99,787 | �� | � | $ | 97,735 | �� | � | $ | 95,659 | �� |
| �� | � |
� |
� | �� | � |
� |
� | � | � |
� |
� | � | � |
� |
� | � | � |
� |
� | |
�
| (1) | For definitions and discussion of EBITDA and Adjusted EBITDA, see page 36. |
| (2) | For the three months ended March�31, 2014 only. |
�
�
RECONCILIATION OF NET OPERATING INCOME (1)
SEPTEMBER 30, 2014
�
(In thousands, except ratio amounts)
�
| � | �� | Three Months Ended | � | |||||||||||||||||
| � | �� | 9/30/14 | � | � | 6/30/14 | � | � | 3/31/14 | � | � | 12/31/13 | � | � | 9/30/13 | � | |||||
| Net income |
�� | $ | 16,976 | �� | � | $ | 19,098 | �� | � | $ | 20,767 | �� | � | $ | 10,576 | �� | � | $ | 4,136 | �� |
| Equity in net (income)/loss of unconsolidated partnerships |
�� | � | (733 | )� | � | � | 10 | �� | � | � | 138 | �� | � | � | 208 | �� | � | � | 112 | �� |
| Interest expense, net |
�� | � | 22,215 | �� | � | � | 23,131 | �� | � | � | 28,010 | �� | � | � | 27,837 | �� | � | � | 27,870 | �� |
| Other (income)/expense |
�� | � | (2,148 | )� | � | � | (1,027 | )� | � | � | (8,163 | )� | � | � | (1,136 | )� | � | � | 687 | �� |
| �� | � |
� |
� | � | � |
� |
� | � | � |
� |
� | � | � |
� |
� | � | � |
� |
� | |
| Income from operations |
�� | � | 36,310 | �� | � | � | 41,212 | �� | � | � | 40,752 | �� | � | � | 37,485 | �� | � | � | 32,805 | �� |
| Depreciation and amortization |
�� | � | 64,452 | �� | � | � | 62,736 | �� | � | � | 62,409 | �� | � | � | 58,781 | �� | � | � | 61,898 | �� |
| General and administrative |
�� | � | 12,768 | �� | � | � | 12,443 | �� | � | � | 11,942 | �� | � | � | 11,817 | �� | � | � | 11,934 | �� |
| Acquisition-related expenses |
�� | � | 487 | �� | � | � | 1,134 | �� | � | � | 1,250 | �� | � | � | 19 | �� | � | � | 907 | �� |
| �� | � |
� |
� | � | � |
� |
� | � | � |
� |
� | � | � |
� |
� | � | � |
� |
� | |
| Consolidated net operating income |
�� | $ | 114,017 | �� | � | $ | 117,525 | �� | � | $ | 116,353 | �� | � | $ | 108,102 | �� | � | $ | 107,544 | �� |
| �� | � |
� |
� | � | � |
� |
� | � | � |
� |
� | � | � |
� |
� | � | � |
� |
� | |
| Revenues: |
�� | � | � | � | � | |||||||||||||||
| Rental |
�� | $ | 122,838 | �� | � | $ | 120,924 | �� | � | $ | 120,026 | �� | � | $ | 118,048 | �� | � | $ | 116,884 | �� |
| Tenant recoveries |
�� | � | 42,626 | �� | � | � | 40,280 | �� | � | � | 38,735 | �� | � | � | 37,597 | �� | � | � | 38,907 | �� |
| Other revenue (2) |
�� | � | 3,452 | �� | � | � | 9,957 | �� | � | � | 10,115 | �� | � | � | 2,348 | �� | � | � | 3,441 | �� |
| �� | � |
� |
� | � | � |
� |
� | � | � |
� |
� | � | � |
� |
� | � | � |
� |
� | |
| Total revenues |
�� | � | 168,916 | �� | � | � | 171,161 | �� | � | � | 168,876 | �� | � | � | 157,993 | �� | � | � | 159,232 | �� |
| Expenses: |
�� | � | � | � | � | |||||||||||||||
| Rental operations |
�� | � | 54,899 | �� | � | � | 53,636 | �� | � | � | 52,523 | �� | � | � | 49,891 | �� | � | � | 51,688 | �� |
| �� | � |
� |
� | � | � |
� |
� | � | � |
� |
� | � | � |
� |
� | � | � |
� |
� | |
| Consolidated net operating income |
�� | $ | 114,017 | �� | � | $ | 117,525 | �� | � | $ | 116,353 | �� | � | $ | 108,102 | �� | � | $ | 107,544 | �� |
| �� | � |
� |
� | � | � |
� |
� | � | � |
� |
� | � | � |
� |
� | � | � |
� |
� | |
| Consolidated net operating income - cash basis (3) |
�� | $ | 109,857 | �� | � | $ | 105,743 | �� | � | $ | 103,843 | �� | � | $ | 103,382 | �� | � | $ | 100,465 | �� |
| �� | � |
� |
� | � | � |
� |
� | � | � |
� |
� | � | � |
� |
� | � | � |
� |
� | |
| Operating margin (4) |
�� | � | 66.8 | %� | � | � | 66.7 | %� | � | � | 66.9 | %� | � | � | 67.9 | %� | � | � | 66.8 | %� |
| Operating expense recovery (5) |
�� | � | 77.6 | %� | � | � | 75.1 | %� | � | � | 73.7 | %� | � | � | 75.4 | %� | � | � | 75.3 | %� |
�
| (1) | For a definition and discussion of net operating income, see page 36. |
| (2) | Includes lease termination income, see page 11 for detail. |
| (3) | Consolidated net operating income - cash basis is calculated as (consolidated net operating income - straight line rents - fair value lease revenue - lease incentive revenue - bad debt expense - other revenue). |
| (4) | Operating margin is calculated as ((rental revenues + tenant recovery revenues - rental operations) / (rental revenues + tenant recovery revenues)). |
| (5) | Operating expense recovery is calculated as (tenant recovery revenues / rental operations). |
�
�
INTEREST EXPENSE
SEPTEMBER 30, 2014
�
(In thousands)
�
| � | �� | Three Months Ended | � | |||||||||||||||||
| � | �� | 9/30/14 | � | � | 6/30/14 | � | � | 3/31/14 | � | � | 12/31/13 | � | � | 9/30/13 | � | |||||
| Mortgage notes payable |
�� | $ | 6,156 | �� | � | $ | 5,982 | �� | � | $ | 11,593 | �� | � | $ | 11,699 | �� | � | $ | 11,969 | �� |
| Exchangeable senior notes |
�� | � | 1,241 | �� | � | � | 1,688 | �� | � | � | 1,688 | �� | � | � | 1,688 | �� | � | � | 1,688 | �� |
| Unsecured senior notes |
�� | � | 12,959 | �� | � | � | 12,288 | �� | � | � | 10,334 | �� | � | � | 10,334 | �� | � | � | 10,334 | �� |
| Unsecured senior term loan |
�� | � | 1,785 | �� | � | � | 1,791 | �� | � | � | 1,995 | �� | � | � | 2,009 | �� | � | � | 1,993 | �� |
| Unsecured line of credit |
�� | � | 1,793 | �� | � | � | 2,112 | �� | � | � | 2,076 | �� | � | � | 1,767 | �� | � | � | 1,242 | �� |
| Line of credit fees |
�� | � | 460 | �� | � | � | 471 | �� | � | � | 563 | �� | � | � | 576 | �� | � | � | 602 | �� |
| Derivative instruments |
�� | � | 895 | �� | � | � | 923 | �� | � | � | 859 | �� | � | � | 867 | �� | � | � | 600 | �� |
| �� | � |
� |
� | � | � |
� |
� | � | � |
� |
� | � | � |
� |
� | � | � |
� |
� | |
| Interest expense, net - cash basis |
�� | $ | 25,289 | �� | � | $ | 25,255 | �� | � | $ | 29,108 | �� | � | $ | 28,940 | �� | � | $ | 28,428 | �� |
| �� | � |
� |
� | � | � |
� |
� | � | � |
� |
� | � | � |
� |
� | � | � |
� |
� | |
| Non-cash interest expense: |
�� | � | � | � | � | |||||||||||||||
| Amortization of fair-value of debt acquired |
�� | � | (665 | )� | � | � | (631 | )� | � | � | (535 | )� | � | � | (509 | )� | � | � | (511 | )� |
| Amortization of debt discounts |
�� | � | 327 | �� | � | � | 302 | �� | � | � | 230 | �� | � | � | 233 | �� | � | � | 228 | �� |
| Amortization of deferred loan costs |
�� | � | 1,451 | �� | � | � | 1,707 | �� | � | � | 1,509 | �� | � | � | 1,504 | �� | � | � | 1,825 | �� |
| Amortization of deferred interest costs |
�� | � | 1,677 | �� | � | � | 1,684 | �� | � | � | 1,691 | �� | � | � | 1,698 | �� | � | � | 1,705 | �� |
| Amortization of put/call and preferred returns |
�� | � | 256 | �� | � | � | 237 | �� | � | � | 199 | �� | � | � | 178 | �� | � | � | 179 | �� |
| �� | � |
� |
� | � | � |
� |
� | � | � |
� |
� | � | � |
� |
� | � | � |
� |
� | |
| Non-cash debt adjustments |
�� | � | 3,046 | �� | � | � | 3,299 | �� | � | � | 3,094 | �� | � | � | 3,104 | �� | � | � | 3,426 | �� |
| Capitalized interest |
�� | � | (6,120 | )� | � | � | (5,423 | )� | � | � | (4,192 | )� | � | � | (4,207 | )� | � | � | (3,984 | )� |
| �� | � |
� |
� | � | � |
� |
� | � | � |
� |
� | � | � |
� |
� | � | � |
� |
� | |
| Interest expense, net |
�� | $ | 22,215 | �� | � | $ | 23,131 | �� | � | $ | 28,010 | �� | � | $ | 27,837 | �� | � | $ | 27,870 | �� |
| �� | � |
� |
� | � | � |
� |
� | � | � |
� |
� | � | � |
� |
� | � | � |
� |
� | |
�
�
COVERAGE RATIOS (1)
SEPTEMBER 30, 2014
�
(In thousands, except ratio amounts)
�
| � | �� | Three Months Ended | � | |||||||||||||||||
| � | �� | 9/30/14 | � | � | 6/30/14 | � | � | 3/31/14 | � | � | 12/31/13 | � | � | 9/30/13 | � | |||||
| Interest coverage ratio |
�� | � | � | � | � | |||||||||||||||
| Adjusted EBITDA |
�� | $ | 107,180 | �� | � | $ | 105,717 | �� | � | $ | 99,787 | �� | � | $ | 97,735 | �� | � | $ | 95,659 | �� |
| Interest expense: |
�� | � | � | � | � | |||||||||||||||
| Interest expense, net |
�� | � | 22,215 | �� | � | � | 23,131 | �� | � | � | 28,010 | �� | � | � | 27,837 | �� | � | � | 27,870 | �� |
| Interest expense - unconsolidated partnerships |
�� | � | 200 | �� | � | � | 240 | �� | � | � | 238 | �� | � | � | 244 | �� | � | � | 251 | �� |
| Amortization of deferred interest costs |
�� | � | (1,677 | )� | � | � | (1,684 | )� | � | � | (1,691 | )� | � | � | (1,698 | )� | � | � | (1,705 | )� |
| Amortization of deferred loan costs |
�� | � | (1,451 | )� | � | � | (1,707 | )� | � | � | (1,509 | )� | � | � | (1,504 | )� | � | � | (1,825 | )� |
| Amortization of debt discounts |
�� | � | (327 | )� | � | � | (302 | )� | � | � | (230 | )� | � | � | (233 | )� | � | � | (228 | )� |
| Amortization of fair-value of debt acquired |
�� | � | 665 | �� | � | � | 631 | �� | � | � | 535 | �� | � | � | 509 | �� | � | � | 511 | �� |
| �� | � |
� |
� | � | � |
� |
� | � | � |
� |
� | � | � |
� |
� | � | � |
� |
� | |
| Total interest expense |
�� | $ | 19,625 | �� | � | $ | 20,309 | �� | � | $ | 25,353 | �� | � | $ | 25,155 | �� | � | $ | 24,874 | �� |
| �� | � |
� |
� | � | � |
� |
� | � | � |
� |
� | � | � |
� |
� | � | � |
� |
� | |
| Interest coverage ratio |
�� | � | 5.5 | �� | � | � | 5.2 | �� | � | � | 3.9 | �� | � | � | 3.9 | �� | � | � | 3.8 | �� |
| �� | � |
� |
� | � | � |
� |
� | � | � |
� |
� | � | � |
� |
� | � | � |
� |
� | |
| Fixed charge coverage ratio |
�� | � | � | � | � | |||||||||||||||
| Adjusted EBITDA |
�� | $ | 107,180 | �� | � | $ | 105,717 | �� | � | $ | 99,787 | �� | � | $ | 97,735 | �� | � | $ | 95,659 | �� |
| Fixed charges: |
�� | � | � | � | � | |||||||||||||||
| Interest expense, net |
�� | � | 22,215 | �� | � | � | 23,131 | �� | � | � | 28,010 | �� | � | � | 27,837 | �� | � | � | 27,870 | �� |
| Interest expense - unconsolidated partnerships |
�� | � | 200 | �� | � | � | 240 | �� | � | � | 238 | �� | � | � | 244 | �� | � | � | 251 | �� |
| Amortization of deferred interest costs |
�� | � | (1,677 | )� | � | � | (1,684 | )� | � | � | (1,691 | )� | � | � | (1,698 | )� | � | � | (1,705 | )� |
| Amortization of deferred loan costs |
�� | � | (1,451 | )� | � | � | (1,707 | )� | � | � | (1,509 | )� | � | � | (1,504 | )� | � | � | (1,825 | )� |
| Amortization of debt discounts |
�� | � | (327 | )� | � | � | (302 | )� | � | � | (230 | )� | � | � | (233 | )� | � | � | (228 | )� |
| Amortization of fair-value of debt acquired |
�� | � | 665 | �� | � | � | 631 | �� | � | � | 535 | �� | � | � | 509 | �� | � | � | 511 | �� |
| Principal payments |
�� | � | 2,020 | �� | � | � | 1,977 | �� | � | � | 2,729 | �� | � | � | 2,705 | �� | � | � | 2,616 | �� |
| �� | � |
� |
� | � | � |
� |
� | � | � |
� |
� | � | � |
� |
� | � | � |
� |
� | |
| Total fixed charges |
�� | $ | 21,645 | �� | � | $ | 22,286 | �� | � | $ | 28,082 | �� | � | $ | 27,860 | �� | � | $ | 27,490 | �� |
| �� | � |
� |
� | � | � |
� |
� | � | � |
� |
� | � | � |
� |
� | � | � |
� |
� | |
| Fixed charge coverage ratio |
�� | � | 5.0 | �� | � | � | 4.7 | �� | � | � | 3.6 | �� | � | � | 3.5 | �� | � | � | 3.5 | �� |
| �� | � |
� |
� | � | � |
� |
� | � | � |
� |
� | � | � |
� |
� | � | � |
� |
� | |
�
| (1) | For a discussion of coverage ratios, see page 36. |
�
�
DEBT SUMMARY
SEPTEMBER 30, 2014
�
(Dollars in thousands)
�
| � | �� | Stated Rate |
� | � | Effective Rate |
� | � | Principal Balance |
� | �� | Unamortized Premium / (Discount) |
� | � | Carrying Value |
� | �� | Maturity Date |
� | ||||||
| Consolidated Debt: |
�� | � | � | �� | � | �� | ||||||||||||||||||
| Mortgage Notes Payable: |
�� | � | � | �� | � | �� | ||||||||||||||||||
| 9900 Belward Campus Drive |
�� | � | 5.64 | %� | � | � | 3.99 | %� | � | $ | 10,523 | �� | �� | $ | 478 | �� | � | $ | 11,001 | �� | �� | � | 07/17 | �� |
| 9901 Belward Campus Drive |
�� | � | 5.64 | %� | � | � | 3.99 | %� | � | � | 12,959 | �� | �� | � | 585 | �� | � | � | 13,544 | �� | �� | � | 07/17 | �� |
| 100 College Street |
�� | � | 2.40 | %� | � | � | 2.40 | %� | � | � | 61,224 | �� | �� | � | ��� | �� | � | � | 61,224 | �� | �� | � | 08/16 | �� |
| 4320 Forest Park Avenue |
�� | � | 4.00 | %� | � | � | 2.70 | %� | � | � | 21,000 | �� | �� | � | ��� | �� | � | � | 21,000 | �� | �� | � | 06/15 | �� |
| 300 George Street |
�� | � | 6.20 | %� | � | � | 4.91 | %� | � | � | 45,481 | �� | �� | � | 3,766 | �� | � | � | 49,247 | �� | �� | � | 07/25 | �� |
| Hershey Center for Applied Research |
�� | � | 6.15 | %� | � | � | 4.71 | %� | � | � | 13,072 | �� | �� | � | 1,313 | �� | � | � | 14,385 | �� | �� | � | 05/27 | �� |
| 500 Kendall Street (Kendall D) |
�� | � | 6.38 | %� | � | � | 5.45 | %� | � | � | 56,155 | �� | �� | � | 1,690 | �� | � | � | 57,845 | �� | �� | � | 12/18 | �� |
| Shady Grove Road |
�� | � | 5.97 | %� | � | � | 5.97 | %� | � | � | 141,631 | �� | �� | � | ��� | �� | � | � | 141,631 | �� | �� | � | 09/16 | �� |
| University of Maryland BioPark I |
�� | � | 5.93 | %� | � | � | 4.69 | %� | � | � | 16,237 | �� | �� | � | 1,346 | �� | � | � | 17,583 | �� | �� | � | 05/25 | �� |
| University of Maryland BioPark II |
�� | � | 5.20 | %� | � | � | 4.33 | %� | � | � | 62,170 | �� | �� | � | 3,584 | �� | � | � | 65,754 | �� | �� | � | 09/21 | �� |
| University of Maryland BioPark Garage |
�� | � | 5.20 | %� | � | � | 4.33 | %� | � | � | 4,679 | �� | �� | � | 270 | �� | � | � | 4,949 | �� | �� | � | 09/21 | �� |
| University of Miami Life Science�& Technology Park |
�� | � | 4.00 | %� | � | � | 2.89 | %� | � | � | 20,000 | �� | �� | � | 380 | �� | � | � | 20,380 | �� | �� | � | 02/16 | �� |
| �� | � |
� |
� | � | � |
� |
� | � | � |
� |
� | �� | � |
� |
� | � | � |
� |
� | �� | ||||
| Total / Weighted-Average on Mortgage Notes Payable |
�� | � | 5.27 | %� | � | � | 4.64 | %� | � | � | 465,131 | �� | �� | � | 13,412 | �� | � | � | 478,543 | �� | �� | |||
| Unsecured Fixed Rate Debt: |
�� | � | � | �� | � | �� | ||||||||||||||||||
| Unsecured Exchangeable Senior Notes Due 2030 (1) |
�� | � | 3.75 | %� | � | � | 3.75 | %� | � | � | 95,678 | �� | �� | � | ��� | �� | � | � | 95,678 | �� | �� | � | 01/30 | �� |
| Unsecured Senior Notes Due 2016 |
�� | � | 3.85 | %� | � | � | 3.99 | %� | � | � | 400,000 | �� | �� | � | (829 | )� | � | � | 399,171 | �� | �� | � | 04/16 | �� |
| Unsecured Senior Notes Due 2019 |
�� | � | 2.63 | %� | � | � | 2.72 | %� | � | � | 400,000 | �� | �� | � | (2,215 | )� | � | � | 397,785 | �� | �� | � | 05/19 | �� |
| Unsecured Senior Notes Due 2020 |
�� | � | 6.13 | %� | � | � | 6.27 | %� | � | � | 250,000 | �� | �� | � | (1,612 | )� | � | � | 248,388 | �� | �� | � | 04/20 | �� |
| Unsecured Senior Notes Due 2022 |
�� | � | 4.25 | %� | � | � | 4.36 | %� | � | � | 250,000 | �� | �� | � | (1,773 | )� | � | � | 248,227 | �� | �� | � | 07/22 | �� |
| Unsecured Variable Rate Debt: |
�� | � | � | �� | � | �� | ||||||||||||||||||
| Unsecured Senior Term Loan Due 2017 - U.S.�Dollar (2) |
�� | � | 1.55 | %� | � | � | 2.38 | %� | � | � | 243,596 | �� | �� | � | ��� | �� | � | � | 243,596 | �� | �� | � | 03/17 | �� |
| Unsecured Senior Term Loan Due 2017 - GBP (3) |
�� | � | 1.90 | %� | � | � | 2.14 | %� | � | � | 162,280 | �� | �� | � | ��� | �� | � | � | 162,280 | �� | �� | � | 03/17 | �� |
| Unsecured Senior Term Loan Due 2018 (4) |
�� | � | 1.35 | %� | � | � | 1.67 | %� | � | � | 350,000 | �� | �� | � | ��� | �� | � | � | 350,000 | �� | �� | � | 03/18 | �� |
| Unsecured Line of Credit (5) |
�� | � | 1.25 | %� | � | � | 1.25 | %� | � | � | 229,000 | �� | �� | � | ��� | �� | � | � | 229,000 | �� | �� | � | 03/18 | �� |
| �� | � |
� |
� | � | � |
� |
� | � | � |
� |
� | �� | � |
� |
� | � | � |
� |
� | �� | ||||
| Total / Weighted-Average on Consolidated Debt |
�� | � | 3.32 | %� | � | � | 3.39 | %� | � | $ | 2,845,685 | �� | �� | $ | 6,983 | �� | � | $ | 2,852,669 | �� | �� | |||
| �� | � |
� |
� | � | � |
� |
� | � | � |
� |
� | �� | � |
� |
� | � | � |
� |
� | �� | ||||
| Share of Unconsolidated Partnership Debt: |
�� | � | � | �� | � | �� | ||||||||||||||||||
| BioPark Fremont (50%)�(fixed) |
�� | � | 3.75 | %� | � | � | 3.70 | %� | � | � | 1,390 | �� | �� | � | 6 | �� | � | � | 1,396 | �� | �� | � | 05/15 | �� |
| PREI Secured Loan (20%)�(variable) |
�� | � | 2.21 | %� | � | � | 2.21 | %� | � | � | 27,795 | �� | �� | � | ��� | �� | � | � | 27,795 | �� | �� | � | 08/15 | �� |
| �� | � |
� |
� | � | � |
� |
� | � | � |
� |
� | �� | � |
� |
� | � | � |
� |
� | �� | ||||
| Total / Weighted-Average on Share of Unconsolidated Partnership Debt |
�� | � | 2.28 | %� | � | � | 2.28 | %� | � | � | 29,185 | �� | �� | � | 6 | �� | � | � | 29,191 | �� | �� | |||
| �� | � |
� |
� | � | � |
� |
� | � | � |
� |
� | �� | � |
� |
� | � | � |
� |
� | �� | ||||
| Total / Weighted-Average on Consolidated and Share of Unconsolidated Partnership Debt |
�� | � | 3.31 | %� | � | � | 3.38 | %� | � | $ | 2,874,870 | �� | �� | $ | 6,989 | �� | � | $ | 2,881,860 | �� | �� | |||
| �� | � |
� |
� | � | � |
� |
� | � | � |
� |
� | �� | � |
� |
� | � | � |
� |
� | �� | ||||
�
| (1) | During the quarter, at the request of the holders, 4,955,377 shares of common stock were issued in exchange for $84.3 million in aggregate principal of the Exchangeable Senior Notes. |
| (2) | The Company entered into interest rate swap agreements that effectively fix the interest rate on $200 million of the unsecured senior term loan facility due 2017 at 2.56% for the remaining term of the loan, subject to adjustments based on the Company�s credit ratings. Including the effect of these swaps, the weighted-average effective interest rate for the $243.6 million outstanding under the unsecured senior term loan facility due 2017 was 2.38% at September�30, 2014. |
| (3) | The Company amended the unsecured senior term loan facility and converted $156.4 million of outstanding borrowings into British pounds sterling equal to �100 million. The principal balance represents the dollar amount based on the exchange rate of $1.62 to �1.00 at the end of the quarter. The Company entered into interest rate swap agreements that effectively fix the interest rate on �100�million at 2.14% for the remaining term of the loan, subject to adjustments based on the Company�s credit ratings. |
| (4) | The Company entered into interest rate swap agreements effective October�1, 2013 that effectively fix the interest rate on $200 million of the unsecured senior term loan facility due 2018 at 1.90% for three years, subject to adjustments based on the Company�s credit ratings. |
| (5) | Effective rate excludes facility fee of 20 bps on the entire capacity of the unsecured line of credit, which equals approximately $450,000 per quarter. |
�
�
DEBT MATURITIES
SEPTEMBER 30, 2014
�
(In thousands)
Weighted-average debt maturity is 4.3 years for consolidated debt (excluding extension options).
�
| � | �� | 2014 | � | �� | 2015 | � | �� | 2016 | � | �� | 2017 | � | �� | 2018 | � | �� | Thereafter | � | �� | Total | � | |||||||
| Consolidated debt: |
�� | �� | �� | �� | �� | �� | �� | |||||||||||||||||||||
| Mortgage Notes Payable: |
�� | �� | �� | �� | �� | �� | �� | |||||||||||||||||||||
| Mortgage notes payable |
�� | $ | 2,080 | �� | �� | $ | 31,784 | �� | �� | $ | 229,632 | �� | �� | $ | 32,306 | �� | �� | $ | 47,804 | �� | �� | $ | 121,525 | �� | �� | $ | 465,131 | �� |
| Unsecured debt: |
�� | �� | �� | �� | �� | �� | �� | |||||||||||||||||||||
| Unsecured exchangeable senior notes due 2030 (1) |
�� | � | ��� | �� | �� | � | ��� | �� | �� | � | ��� | �� | �� | � | ��� | �� | �� | � | ��� | �� | �� | � | 95,678 | �� | �� | � | 95,678 | �� |
| Unsecured senior notes due 2016 |
�� | � | ��� | �� | �� | � | ��� | �� | �� | � | 400,000 | �� | �� | � | ��� | �� | �� | � | ��� | �� | �� | � | ��� | �� | �� | � | 400,000 | �� |
| Unsecured senior notes due 2019 |
�� | � | ��� | �� | �� | � | ��� | �� | �� | � | ��� | �� | �� | � | ��� | �� | �� | � | ��� | �� | �� | � | 400,000 | �� | �� | � | 400,000 | �� |
| Unsecured senior notes due 2020 |
�� | � | ��� | �� | �� | � | ��� | �� | �� | � | ��� | �� | �� | � | ��� | �� | �� | � | ��� | �� | �� | � | 250,000 | �� | �� | � | 250,000 | �� |
| Unsecured senior notes due 2022 |
�� | � | ��� | �� | �� | � | ��� | �� | �� | � | ��� | �� | �� | � | ��� | �� | �� | � | ��� | �� | �� | � | 250,000 | �� | �� | � | 250,000 | �� |
| Unsecured senior term loan due 2017 - U.S.�Dollar |
�� | � | ��� | �� | �� | � | ��� | �� | �� | � | ��� | �� | �� | � | 243,596 | �� | �� | � | ��� | �� | �� | � | ��� | �� | �� | � | 243,596 | �� |
| Unsecured senior term loan due 2017 - GBP |
�� | � | ��� | �� | �� | � | ��� | �� | �� | � | ��� | �� | �� | � | 162,280 | �� | �� | � | ��� | �� | �� | � | ��� | �� | �� | � | 162,280 | �� |
| Unsecured senior term loan due 2018 |
�� | � | ��� | �� | �� | � | ��� | �� | �� | � | ��� | �� | �� | � | ��� | �� | �� | � | 350,000 | �� | �� | � | ��� | �� | �� | � | 350,000 | �� |
| Unsecured line of credit |
�� | � | ��� | �� | �� | � | ��� | �� | �� | � | ��� | �� | �� | � | ��� | �� | �� | � | 229,000 | �� | �� | � | ��� | �� | �� | � | 229,000 | �� |
| �� | � |
� |
� | �� | � |
� |
� | �� | � |
� |
� | �� | � |
� |
� | �� | � |
� |
� | �� | � |
� |
� | �� | � |
� |
� | |
| Total unsecured debt |
�� | � | ��� | �� | �� | � | ��� | �� | �� | � | 400,000 | �� | �� | � | 405,876 | �� | �� | � | 579,000 | �� | �� | � | 995,678 | �� | �� | � | 2,380,554 | �� |
| Total consolidated debt |
�� | $ | 2,080 | �� | �� | $ | 31,784 | �� | �� | $ | 629,632 | �� | �� | $ | 438,182 | �� | �� | $ | 626,804 | �� | �� | $ | 1,117,203 | �� | �� | $ | 2,845,685 | �� |
| �� | � |
� |
� | �� | � |
� |
� | �� | � |
� |
� | �� | � |
� |
� | �� | � |
� |
� | �� | � |
� |
� | �� | � |
� |
� | |
| Share of unconsolidated partnership debt: |
�� | �� | �� | �� | �� | �� | �� | |||||||||||||||||||||
| BioPark Fremont (50%)�(fixed) |
�� | � | ��� | �� | �� | � | 1,390 | �� | �� | � | ��� | �� | �� | � | ��� | �� | �� | � | ��� | �� | �� | � | ��� | �� | �� | � | 1,390 | �� |
| PREI secured loan (20%)�(variable) (2) |
�� | � | ��� | �� | �� | � | 27,795 | �� | �� | � | ��� | �� | �� | � | ��� | �� | �� | � | ��� | �� | �� | � | ��� | �� | �� | � | 27,795 | �� |
| �� | � |
� |
� | �� | � |
� |
� | �� | � |
� |
� | �� | � |
� |
� | �� | � |
� |
� | �� | � |
� |
� | �� | � |
� |
� | |
| Share of total unconsolidated partnership debt |
�� | $ | ��� | �� | �� | $ | 29,185 | �� | �� | $ | ��� | �� | �� | $ | ��� | �� | �� | $ | ��� | �� | �� | $ | ��� | �� | �� | $ | 29,185 | �� |
| �� | � |
� |
� | �� | � |
� |
� | �� | � |
� |
� | �� | � |
� |
� | �� | � |
� |
� | �� | � |
� |
� | �� | � |
� |
� | |
| Total consolidated and share of unconsolidated partnership debt |
�� | $ | 2,080 | �� | �� | $ | 60,969 | �� | �� | $ | 629,632 | �� | �� | $ | 438,182 | �� | �� | $ | 626,804 | �� | �� | $ | 1,117,203 | �� | �� | $ | 2,874,870 | �� |
| �� | � |
� |
� | �� | � |
� |
� | �� | � |
� |
� | �� | � |
� |
� | �� | � |
� |
� | �� | � |
� |
� | �� | � |
� |
� | |
�
�
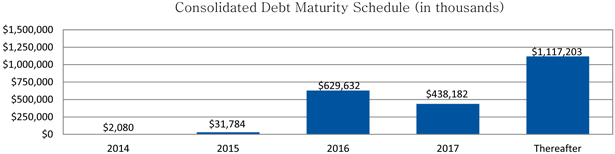
�
| (1) | The holders of the unsecured exchangeable senior notes due 2030 (the �2030 Notes�) have the right to require the Company to repurchase the 2030 Notes, in whole or in part, for cash on each of January�15, 2015,�January�15, 2020 and January�15, 2025, or upon the occurrence of a designated event, in each case for a repurchase price equal to 100% of the principal amount of the 2030 Notes plus accrued and unpaid interest. During the quarter, at the request of the holders, 4,955,377 shares of common stock were issued in exchange for $84.3 million in aggregate principal of the Exchangeable Senior Notes. |
| (2) | The maturity date of the PREI secured loan may be extended to August 2016 after satisfaction of certain conditions and payment of an extension fee. |
�
�
COMMON STOCK DATA
SEPTEMBER 30, 2014
�
(Shares in thousands)
�
| � | �� | Three Months Ended | � | |||||||||||||||||
| Summary of Common Shares |
�� | 09/30/14 | � | � | 06/30/14 | � | � | 03/31/14 | � | � | 12/31/13 | � | � | 09/30/13 | � | |||||
| Earnings per share |
�� | � | � | � | � | |||||||||||||||
| Weighted-average common shares outstanding |
�� | � | 194,023 | �� | � | � | 191,003 | �� | � | � | 190,906 | �� | � | � | 190,664 | �� | � | � | 190,647 | �� |
| Weighted-average OP and LTIP units outstanding |
�� | � | 5,405 | �� | � | � | 5,405 | �� | � | � | 5,410 | �� | � | � | 5,416 | �� | � | � | 5,416 | �� |
| Dilutive effect of performance units |
�� | � | 147 | �� | � | � | 392 | �� | � | � | 229 | �� | � | � | 38 | �� | � | � | 69 | �� |
| �� | � |
� |
� | � | � |
� |
� | � | � |
� |
� | � | � |
� |
� | � | � |
� |
� | |
| Diluted common shares - EPS |
�� | � | 199,575 | �� | � | � | 196,800 | �� | � | � | 196,545 | �� | � | � | 196,118 | �� | � | � | 196,132 | �� |
| �� | � |
� |
� | � | � |
� |
� | � | � |
� |
� | � | � |
� |
� | � | � |
� |
� | |
| Funds from operations |
�� | � | � | � | � | |||||||||||||||
| Weighted-average common shares outstanding |
�� | � | 194,023 | �� | � | � | 191,003 | �� | � | � | 190,906 | �� | � | � | 190,664 | �� | � | � | 190,647 | �� |
| Weighted-average OP and LTIP units outstanding |
�� | � | 5,405 | �� | � | � | 5,405 | �� | � | � | 5,410 | �� | � | � | 5,416 | �� | � | � | 5,416 | �� |
| Dilutive effect of performance units |
�� | � | 147 | �� | � | � | 392 | �� | � | � | 229 | �� | � | � | 38 | �� | � | � | 69 | �� |
| Dilutive effect of restricted stock |
�� | � | 1,485 | �� | � | � | 1,509 | �� | � | � | 1,511 | �� | � | � | 1,446 | �� | � | � | 1,415 | �� |
| Dilutive effect of exchangeable senior notes due 2030 |
�� | � | 7,589 | �� | � | � | 10,579 | �� | � | � | 10,526 | �� | � | � | 10,405 | �� | � | � | 10,405 | �� |
| �� | � |
� |
� | � | � |
� |
� | � | � |
� |
� | � | � |
� |
� | � | � |
� |
� | |
| Diluted common shares - FFO |
�� | � | 208,649 | �� | � | � | 208,888 | �� | � | � | 208,582 | �� | � | � | 207,969 | �� | � | � | 207,952 | �� |
| �� | � |
� |
� | � | � |
� |
� | � | � |
� |
� | � | � |
� |
� | � | � |
� |
� | |
| Closing common shares, OP and LTIP units outstanding |
�� | � | 202,860 | �� | � | � | 197,931 | �� | � | � | 197,908 | �� | � | � | 197,531 | �� | � | � | 197,523 | �� |
| High price |
�� | $ | 22.62 | �� | � | $ | 22.47 | �� | � | $ | 20.89 | �� | � | $ | 20.56 | �� | � | $ | 21.62 | �� |
| Low price |
�� | $ | 19.92 | �� | � | $ | 19.94 | �� | � | $ | 17.98 | �� | � | $ | 17.97 | �� | � | $ | 17.90 | �� |
| Average closing price |
�� | $ | 21.73 | �� | � | $ | 21.24 | �� | � | $ | 19.72 | �� | � | $ | 18.95 | �� | � | $ | 19.63 | �� |
| Closing price |
�� | $ | 20.20 | �� | � | $ | 21.83 | �� | � | $ | 20.49 | �� | � | $ | 18.12 | �� | � | $ | 18.59 | �� |
| Dividends per share - annualized |
�� | $ | 1.00 | �� | � | $ | 1.00 | �� | � | $ | 1.00 | �� | � | $ | 1.00 | �� | � | $ | 0.94 | �� |
| Closing dividend yield - annualized |
�� | � | 5.0 | %� | � | � | 4.6 | %� | � | � | 4.9 | %� | � | � | 5.5 | %� | � | � | 5.1 | %� |
| �� | � | � | � | � | ||||||||||||||||
| Dividends per Share |
�� | 09/30/14 | � | � | 06/30/14 | � | � | 03/31/14 | � | � | 12/31/13 | � | � | 09/30/13 | � | |||||
| Common Stock - BMR |
�� | � | � | � | � | |||||||||||||||
| Amount |
�� | $ | 0.250 | �� | � | $ | 0.250 | �� | � | $ | 0.250 | �� | � | $ | 0.250 | �� | � | $ | 0.235 | �� |
| Declared |
�� | � | September�16,�2014 | �� | � | � | June 16, 2014 | �� | � | � | March 17, 2014 | �� | � | � | December 12, 2013 | �� | � | � | September 16, 2013 | �� |
| Record |
�� | � | September 30, 2014 | �� | � | � | June�30,�2014 | �� | � | � | March�31,�2014 | �� | � | � | December�31,�2013 | �� | � | � | September�30,�2013 | �� |
| Paid |
�� | � | October 15, 2014 | �� | � | � | July 15, 2014 | �� | � | � | April 15, 2014 | �� | � | � | January 15, 2014 | �� | � | � | October 15, 2013 | �� |
�
�
MARKET SUMMARY
SEPTEMBER 30, 2014
�
�
| � | �� | � | � | � | Current (1) | � | � | Expiration (2) | � | |||||||||||||||||||
| Market |
�� | Leased Square Feet |
� | � | Annualized�Base Rent |
� | � | Percent
of Annualized Base�Rent |
� | � | Annualized Base�Rent� per Leased�Sq�Ft |
� | � | Annualized Base Rent |
� | �� | Percent of Annualized Base Rent |
� | � | Annualized Base Rent per Leased Sq Ft |
� | |||||||
| � | �� | � | � | � | (In thousands) | � | � | � | � | � | � | � | � | (In�thousands) | � | �� | � | � | � | � | � | |||||||
| Boston |
�� | � | 3,264,431 | �� | � | $ | 183,748 | �� | � | � | 33.0 | %� | � | $ | 56.29 | �� | � | $ | 194,965 | �� | �� | � | 30.3 | %� | � | $ | 59.72 | �� |
| Maryland |
�� | � | 1,929,487 | �� | � | � | 73,658 | �� | � | � | 13.2 | %� | � | � | 38.17 | �� | � | � | 87,749 | �� | �� | � | 13.6 | %� | � | � | 45.48 | �� |
| San Francisco |
�� | � | 2,484,875 | �� | � | � | 63,460 | �� | � | � | 11.4 | %� | � | � | 25.54 | �� | � | � | 75,196 | �� | �� | � | 11.7 | %� | � | � | 30.26 | �� |
| San Diego |
�� | � | 1,850,608 | �� | � | � | 61,578 | �� | � | � | 11.0 | %� | � | � | 33.27 | �� | � | � | 76,836 | �� | �� | � | 11.9 | %� | � | � | 41.52 | �� |
| New York / New Jersey |
�� | � | 1,592,696 | �� | � | � | 56,882 | �� | � | � | 10.2 | %� | � | � | 35.71 | �� | � | � | 69,223 | �� | �� | � | 10.8 | %� | � | � | 43.46 | �� |
| Cambridge, UK |
�� | � | 512,425 | �� | � | � | 19,037 | �� | � | � | 3.4 | %� | � | � | 37.15 | �� | � | � | 19,037 | �� | �� | � | 3.0 | %� | � | � | 37.15 | �� |
| Pennsylvania |
�� | � | 678,340 | �� | � | � | 17,719 | �� | � | � | 3.2 | %� | � | � | 26.12 | �� | � | � | 22,769 | �� | �� | � | 3.5 | %� | � | � | 33.57 | �� |
| North Carolina |
�� | � | 797,781 | �� | � | � | 13,959 | �� | � | � | 2.5 | %� | � | � | 17.50 | �� | � | � | 17,801 | �� | �� | � | 2.8 | %� | � | � | 22.31 | �� |
| Seattle |
�� | � | 283,436 | �� | � | � | 11,968 | �� | � | � | 2.1 | %� | � | � | 42.22 | �� | � | � | 15,362 | �� | �� | � | 2.4 | %� | � | � | 54.20 | �� |
| University Related - Other |
�� | � | 2,122,525 | �� | � | � | 55,639 | �� | � | � | 10.0 | %� | � | � | 26.21 | �� | � | � | 64,628 | �� | �� | � | 10.0 | %� | � | � | 30.45 | �� |
| �� | � |
� |
� | � | � |
� |
� | � | � |
� |
� | � | � |
� |
� | � | � |
� |
� | �� | � |
� |
� | � | � |
� |
� | |
| Total portfolio / weighted-average |
�� | � | 15,516,604 | �� | � | $ | 557,648 | �� | � | � | 100.0 | %� | � | $ | 35.94 | �� | � | $ | 643,566 | �� | �� | � | 100.0 | %� | � | $ | 41.48 | �� |
| �� | � |
� |
� | � | � |
� |
� | � | � |
� |
� | � | � |
� |
� | � | � |
� |
� | �� | � |
� |
� | � | � |
� |
� | |
| � | �� | Percent Leased | � | � | � | � | �� | � | � | � | � | � | ||||||||||||||||
| Market |
�� | Total Operating Portfolio |
� | � | Development (3) | � | � | Redevelopment�(3) | � | � | Unconsolidated Partnership Portfolio (4) |
� | � | � | � | �� | � | � | � | � | � | |||||||
| Boston |
�� | � | 99.2 | %� | � | � | ��� | �� | � | � | 86.5 | %� | � | � | 99.9 | %� | � | �� | � | |||||||||
| Maryland |
�� | � | 95.4 | %� | � | � | ��� | �� | � | � | ��� | �� | � | � | ��� | �� | � | �� | � | |||||||||
| San Francisco |
�� | � | 83.7 | %� | � | � | ��� | �� | � | � | ��� | �� | � | � | ��� | �� | � | �� | � | |||||||||
| San Diego |
�� | � | 92.7 | %� | � | � | ��� | �� | � | � | ��� | �� | � | � | 100.0 | %� | � | �� | � | |||||||||
| New York / New Jersey |
�� | � | 86.8 | %� | � | � | 100.0 | %� | � | � | ��� | �� | � | � | ��� | �� | � | �� | � | |||||||||
| Cambridge, UK |
�� | � | 99.5 | %� | � | � | 100.0 | %� | � | � | ��� | �� | � | � | ��� | �� | � | �� | � | |||||||||
| Pennsylvania |
�� | � | 75.9 | %� | � | � | ��� | �� | � | � | ��� | �� | � | � | ��� | �� | � | �� | � | |||||||||
| North Carolina |
�� | � | 92.9 | %� | � | � | ��� | �� | � | � | ��� | �� | � | � | ��� | �� | � | �� | � | |||||||||
| Seattle |
�� | � | 69.7 | %� | � | � | 20.5 | %� | � | � | ��� | �� | � | � | ��� | �� | � | �� | � | |||||||||
| University Related - Other |
�� | � | 91.2 | %� | � | � | 99.1 | %� | � | � | ��� | �� | � | � | ��� | �� | � | �� | � | |||||||||
| �� | � |
� |
� | � | � |
� |
� | � | � |
� |
� | � | � |
� |
� | � | �� | � | ||||||||||
| Total portfolio�(5) |
�� | � | 90.6 | %� | � | � | 84.1 | %� | � | � | 86.5 | %� | � | � | 99.9 | %� | � | �� | � | |||||||||
| �� | � |
� |
� | � | � |
� |
� | � | � |
� |
� | � | � |
� |
� | � | �� | � | ||||||||||
| Total portfolio weighted-average leased % (6) |
�� | � | 92.6 | %� | � | � | 83.8 | %� | � | � | 86.5 | %� | � | � | 99.9 | %� | � | �� | � | |||||||||
| �� | � | � |
� |
� | � | � |
� |
� | � | � |
� |
� | � | �� | � | |||||||||||||
�
| (1) | Current annualized base rent is the monthly contractual rent as of the current quarter ended, or if rent has not yet commenced, the first monthly rent payment due at each rent commencement date, multiplied by 12 months. |
| (2) | Annualized base rent at expiration is the monthly contractual rent as of date of expiration of the applicable lease (not including any extension option(s)), multiplied by 12 months. |
| (3) | See page 25 for detail of the consolidated portfolio and page 37 for definitions of terms. |
| (4) | See page 27 for detail of the unconsolidated partnership portfolio. |
| (5) | Calculated based on leased square feet divided by total square feet. |
| (6) | Calculated based on gross book value for each asset multiplied by the percentage leased. |
�
�
PROPERTY LISTING - CONSOLIDATED PORTFOLIO
SEPTEMBER 30, 2014
�
�
| � | �� | � | � | � | � | � | � | � | Rentable Square |
� | � | Percent�of Rentable |
� | � | Leased Square |
� | � | Percent Leased |
� | |||||||||
| � | �� | Property |
� | Acquisition�Date |
� | Buildings | � | � | Feet | � | � | Sq Ft | � | � | Feet | � | � | 9/30/14 | � | � | 6/30/14 | � | ||||||
| �� | Boston | � | � | � | � | � | � | � | ||||||||||||||||||||
| 1 |
�� | ����Albany Street | � | May 31, 2005 | � | � | 2 | �� | � | � | 75,003 | �� | � | � | 0.4 | %� | � | � | 75,003 | �� | � | � | 100.0 | %� | � | � | 100.0 | %� |
| 2 |
�� | ����320 Bent Street | � | December�14,�2011 | � | � | 1 | �� | � | � | 195,198 | �� | � | � | 1.2 | %� | � | � | 195,137 | �� | � | � | 100.0 | %� | � | � | 100.0 | %� |
| 3 |
�� | ����301 Binney Street | � | December 14, 2011 | � | � | 1 | �� | � | � | 417,290 | �� | � | � | 2.5 | %� | � | � | 412,074 | �� | � | � | 98.8 | %� | � | � | 96.7 | %� |
| 4 |
�� | ����301 Binney Street Garage | � | December 14, 2011 | � | � | 1 | �� | � | � | 528 Stalls | �� | � | � | n/a | �� | � | � | 443�Stalls | �� | � | � | 100.0 | %� | � | � | 100.0 | %� |
| 5 |
�� | ����210 Broadway | � | February 9, 2012 | � | � | 1 | �� | � | � | 64,812 | �� | � | � | 0.4 | %� | � | � | 64,812 | �� | � | � | 100.0 | %� | � | � | 100.0 | %� |
| 6 |
�� | ����Center for Life Science | Boston | � | November�17,�2006 | � | � | 1 | �� | � | � | 704,159 | �� | � | � | 4.2 | %� | � | � | 696,331 | �� | � | � | 98.9 | %� | � | � | 98.9 | %� |
| 7 |
�� | ����Charles Street | � | April 7, 2006 | � | � | 1 | �� | � | � | 47,912 | �� | � | � | 0.3 | %� | � | � | 47,912 | �� | � | � | 100.0 | %� | � | � | 100.0 | %� |
| 8 |
�� | ����320 Charles Street | � | June 18, 2013 | � | � | 1 | �� | � | � | 99,513 | �� | � | � | 0.6 | %� | � | � | 99,513 | �� | � | � | 100.0 | %� | � | � | 100.0 | %� |
| 9 |
�� | ����Coolidge Avenue | � | April 5, 2005 | � | � | 1 | �� | � | � | 37,684 | �� | � | � | 0.2 | %� | � | � | 34,580 | �� | � | � | 91.8 | %� | � | � | 91.8 | %� |
| 10 |
�� | ����21 Erie Street | � | May 31, 2005 | � | � | 1 | �� | � | � | 48,627 | �� | � | � | 0.3 | %� | � | � | 48,627 | �� | � | � | 100.0 | %� | � | � | 100.0 | %� |
| 11 |
�� | ����40 Erie Street | � | May 31, 2005 | � | � | 1 | �� | � | � | 100,854 | �� | � | � | 0.6 | %� | � | � | 100,854 | �� | � | � | 100.0 | %� | � | � | 100.0 | %� |
| 12 |
�� | ����47 Erie Street Parking Structure | � | May 31, 2005 | � | � | 1 | �� | � | � | 447�Stalls | �� | � | � | n/a | �� | � | � | 322 Stalls | �� | � | � | 73.2 | %� | � | � | 72.0 | %� |
| 13 |
�� | ����Fresh Pond Research Park | � | April 5, 2005 | � | � | 6 | �� | � | � | 90,702 | �� | � | � | 0.5 | %� | � | � | 89,176 | �� | � | � | 98.3 | %� | � | � | 98.3 | %� |
| 14 |
�� | ����50 Hampshire Street | � | February 9, 2012 | � | � | 1 | �� | � | � | 183,052 | �� | � | � | 1.1 | %� | � | � | 183,052 | �� | � | � | 100.0 | %� | � | � | 100.0 | %� |
| 15 |
�� | ����60 Hampshire Street | � | February 9, 2012 | � | � | 1 | �� | � | � | 41,257 | �� | � | � | 0.2 | %� | � | � | 35,703 | �� | � | � | 86.5 | %� | � | � | 86.5 | %� |
| 16 |
�� | ����Kendall Crossing Apartments | � | December�14,�2011 | � | � | 1 | �� | � | � | 37 Apts. | �� | � | � | n/a | �� | � | � | 36 Apts. | �� | � | � | 97.6 | %� | � | � | 100.0 | %� |
| 17 |
�� | ����450 Kendall Street (Kendall G) | � | May 31, 2011 | � | � | 1 | �� | � | � | 63,000 | �� | � | � | 0.4 | %� | � | � | ��� | �� | � | � | ��� | �� | � | � | ��� | �� |
| 18 |
�� | ����500 Kendall Street (Kendall D) | � | May 31, 2005 | � | � | 1 | �� | � | � | 349,325 | �� | � | � | 2.1 | %� | � | � | 344,097 | �� | � | � | 98.5 | %� | � | � | 98.5 | %� |
| 19 |
�� | ����675 W. Kendall Street (Kendall A) | � | May 31, 2005 | � | � | 1 | �� | � | � | 302,919 | �� | � | � | 1.8 | %� | � | � | 302,919 | �� | � | � | 100.0 | %� | � | � | 100.0 | %� |
| 20 |
�� | ����Sidney Street | � | May 31, 2005 | � | � | 1 | �� | � | � | 191,904 | �� | � | � | 1.1 | %� | � | � | 191,904 | �� | � | � | 100.0 | %� | � | � | 100.0 | %� |
| 21 |
�� | ����Vassar Street | � | May 31, 2005 | � | � | 1 | �� | � | � | 60,845 | �� | � | � | 0.4 | %� | � | � | 60,845 | �� | � | � | 100.0 | %� | � | � | 100.0 | %� |
| �� | � | � | � |
� |
� | � | � |
� |
� | � | � |
� |
� | � | � |
� |
� | � | � |
� |
� | � | � |
� |
� | |||
| �� | Total Boston | � | � | � | 27 | �� | � | � | 3,074,056 | �� | � | � | 18.3 | %� | � | � | 2,982,539 | �� | � | � | 97.0 | %� | � | � | 96.7 | %� | ||
| �� | � | � | � |
� |
� | � | � |
� |
� | � | � |
� |
� | � | � |
� |
� | � | � |
� |
� | � | � |
� |
� | |||
| �� | Maryland | � | � | � | � | � | � | � | ||||||||||||||||||||
| 22 |
�� | ����Beckley Street | � | December�17,�2004 | � | � | 1 | �� | � | � | 77,225 | �� | � | � | 0.5 | %� | � | � | 77,225 | �� | � | � | 100.0 | %� | � | � | 100.0 | %� |
| 23 |
�� | ����9900 Belward Campus Drive | � | July 18, 2012 | � | � | 1 | �� | � | � | 49,317 | �� | � | � | 0.3 | %� | � | � | 41,816 | �� | � | � | 84.8 | %� | � | � | 84.8 | %� |
| 24 |
�� | ����9901 Belward Campus Drive | � | July 18, 2012 | � | � | 1 | �� | � | � | 57,152 | �� | � | � | 0.3 | %� | � | � | 57,110 | �� | � | � | 99.9 | %� | � | � | 99.9 | %� |
| 25 |
�� | ����9911 Belward Campus Drive | � | May 24, 2006 | � | � | 1 | �� | � | � | 289,912 | �� | � | � | 1.7 | %� | � | � | 289,912 | �� | � | � | 100.0 | %� | � | � | 100.0 | %� |
| 26 |
�� | ����9920 Belward Campus Drive | � | May 8, 2007 | � | � | 1 | �� | � | � | 51,181 | �� | � | � | 0.3 | %� | � | � | 51,181 | �� | � | � | 100.0 | %� | � | � | 100.0 | %� |
| 27 |
�� | ����9704 Medical Center Drive | � | May 3, 2010 | � | � | 1 | �� | � | � | 122,600 | �� | � | � | 0.7 | %� | � | � | 122,600 | �� | � | � | 100.0 | %� | � | � | 100.0 | %� |
| 28 |
�� | ����9708-9714 Medical Center Drive | � | May 3, 2010 | � | � | 3 | �� | � | � | 92,125 | �� | � | � | 0.5 | %� | � | � | 49,910 | �� | � | � | 54.2 | %� | � | � | 17.4 | %� |
| 29 |
�� | ����1701 / 1711 Research Boulevard | � | May 9, 2011 | � | � | 1 | �� | � | � | 104,743 | �� | � | � | 0.6 | %� | � | � | 104,743 | �� | � | � | 100.0 | %� | � | � | 100.0 | %� |
| 30 |
�� | ����Shady Grove Road | � | May 24, 2006 | � | � | 4 | �� | � | � | 635,058 | �� | � | � | 3.8 | %� | � | � | 635,058 | �� | � | � | 100.0 | %� | � | � | 100.0 | %� |
| 31 |
�� | ����Tributary Street | � | December 17, 2004 | � | � | 1 | �� | � | � | 91,592 | �� | � | � | 0.5 | %� | � | � | 91,592 | �� | � | � | 100.0 | %� | � | � | 100.0 | %� |
| 32 |
�� | ����University of Maryland BioPark I | � | May 31, 2013 | � | � | 1 | �� | � | � | 76,542 | �� | � | � | 0.5 | %� | � | � | 75,367 | �� | � | � | 98.5 | %� | � | � | 98.5 | %� |
| 33 |
�� | ����University of Maryland BioPark II | � | May 31, 2013 | � | � | 1 | �� | � | � | 235,333 | �� | � | � | 1.4 | %� | � | � | 230,568 | �� | � | � | 98.0 | %� | � | � | 98.0 | %� |
| 34 |
�� | ����University of Maryland BioPark Garage | � | May 31, 2013 | � | � | 1 | �� | � | � | 638 Stalls | �� | � | � | n/a | �� | � | � | 638 Stalls | �� | � | � | 100.0 | %� | � | � | 100.0 | %� |
| 35 |
�� | ����50 West Watkins Mill Road | � | May 7, 2010 | � | � | 1 | �� | � | � | 57,410 | �� | � | � | 0.3 | %� | � | � | 20,000 | �� | � | � | 34.8 | %� | � | � | 34.8 | %� |
| 36 |
�� | ����55 / 65 West Watkins Mill Road | � | February�23,�2010 | � | � | 2 | �� | � | � | 82,405 | �� | � | � | 0.5 | %� | � | � | 82,405 | �� | � | � | 100.0 | %� | � | � | 100.0 | %� |
| �� | � | � | � |
� |
� | � | � |
� |
� | � | � |
� |
� | � | � |
� |
� | � | � |
� |
� | � | � |
� |
� | |||
| �� | Total Maryland | � | � | � | 21 | �� | � | � | 2,022,595 | �� | � | � | 11.9 | %� | � | � | 1,929,487 | �� | � | � | 95.4 | %� | � | � | 93.7 | %� | ||
| �� | � | � | � |
� |
� | � | � |
� |
� | � | � |
� |
� | � | � |
� |
� | � | � |
� |
� | � | � |
� |
� | |||
| �� | San Francisco | � | � | � | � | � | � | � | ||||||||||||||||||||
| 37 |
�� | ����Ardentech Court | � | November�18,�2004 | � | � | 1 | �� | � | � | 55,588 | �� | � | � | 0.3 | %� | � | � | 55,588 | �� | � | � | 100.0 | %� | � | � | 100.0 | %� |
| 38 |
�� | ����Ardenwood Venture (1) | � | June 14, 2006 | � | � | 1 | �� | � | � | 72,500 | �� | � | � | 0.4 | %� | � | � | 72,500 | �� | � | � | 100.0 | %� | � | � | 83.2 | %� |
| 39 |
�� | ����Bayshore Boulevard | � | August 17, 2004 | � | � | 3 | �� | � | � | 183,344 | �� | � | � | 1.1 | %� | � | � | 183,344 | �� | � | � | 100.0 | %� | � | � | 100.0 | %� |
| 40 |
�� | ����Bridgeview Technology Park I | � | September�10,�2004 | � | � | 2 | �� | � | � | 201,567 | �� | � | � | 1.2 | %� | � | � | 106,694 | �� | � | � | 52.9 | %� | � | � | 52.9 | %� |
| 41 |
�� | ����Bridgeview Technology Park II | � | March 16, 2005 | � | � | 1 | �� | � | � | 50,400 | �� | � | � | 0.3 | %� | � | � | 50,400 | �� | � | � | 100.0 | %� | � | � | 100.0 | %� |
| 42 |
�� | ����550 Broadway Street | � | April 27, 2012 | � | � | 1 | �� | � | � | 71,239 | �� | � | � | 0.4 | %� | � | � | 71,239 | �� | � | � | 100.0 | %� | � | � | 100.0 | %� |
| 43 |
�� | ����Dumbarton Circle | � | May 27, 2005 | � | � | 1 | �� | � | � | 44,000 | �� | � | � | 0.3 | %� | � | � | 44,000 | �� | � | � | 100.0 | %� | � | � | 100.0 | %� |
| 44 |
�� | ����Gateway Business Park | � | October 26, 2010 | � | � | 4 | �� | � | � | 176,503 | �� | � | � | 1.0 | %� | � | � | 145,056 | �� | � | � | 82.2 | %� | � | � | 82.2 | %� |
| 45 |
�� | ����Industrial Road | � | August 17, 2004 | � | � | 1 | �� | � | � | 175,144 | �� | � | � | 1.0 | %� | � | � | 175,144 | �� | � | � | 100.0 | %� | � | � | 100.0 | %� |
�
�
PROPERTY LISTING - CONSOLIDATED PORTFOLIO
SEPTEMBER 30, 2014
�
�
| � | �� | � | � | � | � | � | � | � | Rentable Square |
� | � | Percent�of Rentable |
� | � | Leased Square |
� | � | Percent Leased |
� | |||||||||
| � | �� | Property |
� | Acquisition�Date |
� | Buildings | � | � | Feet | � | � | Sq Ft | � | � | Feet | � | � | 9/30/14 | � | � | 6/30/14 | � | ||||||
| �� | San Francisco (Continued) | � | � | � | � | � | � | |||||||||||||||||||||
| 46 |
�� | ����Kaiser Drive | � | August�25,�2005 | � | � | 1 | �� | � | � | 87,953 | �� | � | � | 0.5 | %� | � | � | 71,215 | �� | � | � | 81.0 | %� | � | � | 81.0 | %� |
| 47 |
�� | ����Pacific Industrial Center | � | July 11, 2006 | � | � | 1 | �� | � | � | 305,026 | �� | � | � | 1.8 | %� | � | � | 262,124 | �� | � | � | 85.9 | %� | � | � | 85.9 | %� |
| 48 |
�� | ����Pacific Research Center North | � | July 11, 2006 | � | � | 6 | �� | � | � | 661,245 | �� | � | � | 3.9 | %� | � | � | 523,491 | �� | � | � | 79.2 | %� | � | � | 79.2 | %� |
| 49 |
�� | ����Pacific Research Center South | � | July 11, 2006 | � | � | 3 | �� | � | � | 423,246 | �� | � | � | 2.5 | %� | � | � | 263,543 | �� | � | � | 62.3 | %� | � | � | 62.3 | %� |
| 50 |
�� | ����Science Center at Oyster Point | � | October�26,�2010 | � | � | 2 | �� | � | � | 204,887 | �� | � | � | 1.2 | %� | � | � | 204,887 | �� | � | � | 100.0 | %� | � | � | 100.0 | %� |
| 51 |
�� | ����Woodside Technology Park | � | February�28,�2013 | � | � | 3 | �� | � | � | 255,650 | �� | � | � | 1.5 | %� | � | � | 255,650 | �� | � | � | 100.0 | %� | � | � | 76.1 | %� |
| �� | � | � | � |
� |
� | � | � |
� |
� | � | � |
� |
� | � | � |
� |
� | � | � |
� |
� | � | � |
� |
� | |||
| �� | Total San Francisco | � | � | 31 | �� | � | � | 2,968,292 | �� | � | � | 17.4 | %� | � | � | 2,484,875 | �� | � | � | 83.7 | %� | � | � | 81.2 | %� | |||
| �� | � | � | � |
� |
� | � | � |
� |
� | � | � |
� |
� | � | � |
� |
� | � | � |
� |
� | � | � |
� |
� | |||
| �� | San Diego | � | � | � | � | � | � | |||||||||||||||||||||
| 52 |
�� | ����Balboa Avenue | � | August 13, 2004 | � | � | 1 | �� | � | � | 35,344 | �� | � | � | 0.2 | %� | � | � | 35,344 | �� | � | � | 100.0 | %� | � | � | 100.0 | %� |
| 53 |
�� | ����Bernardo Center Drive | � | August 13, 2004 | � | � | 1 | �� | � | � | 61,286 | �� | � | � | 0.4 | %� | � | � | 61,286 | �� | � | � | 100.0 | %� | � | � | 100.0 | %� |
| 54 |
�� | ����Coast 9 | � | October 15, 2010 | � | � | 9 | �� | � | � | 162,074 | �� | � | � | 1.0 | %� | � | � | 137,062 | �� | � | � | 84.6 | %� | � | � | 84.6 | %� |
| 55 |
�� | ����4570 Executive Drive | � | September�17,�2010 | � | � | 1 | �� | � | � | 125,219 | �� | � | � | 0.7 | %� | � | � | 125,219 | �� | � | � | 100.0 | %� | � | � | 100.0 | %� |
| 56 |
�� | ����Faraday Avenue | � | September 19, 2005 | � | � | 1 | �� | � | � | 28,704 | �� | � | � | 0.2 | %� | � | � | 28,704 | �� | � | � | 100.0 | %� | � | � | 100.0 | %� |
| 57 |
�� | ����Gazelle Court | � | March 30, 2010 | � | � | 1 | �� | � | � | 176,000 | �� | � | � | 1.0 | %� | � | � | 176,000 | �� | � | � | 100.0 | %� | � | � | 100.0 | %� |
| 58 |
�� | ����3525 John Hopkins Court | � | December�28,�2010 | � | � | 1 | �� | � | � | 48,306 | �� | � | � | 0.3 | %� | � | � | 48,306 | �� | � | � | 100.0 | %� | � | � | 100.0 | %� |
| 59 |
�� | ����3545-3575 John Hopkins Court | � | August 16, 2006 | � | � | 1 | �� | � | � | 72,192 | �� | � | � | 0.4 | %� | � | � | 63,473 | �� | � | � | 87.9 | %� | � | � | 87.2 | %� |
| 60 |
�� | ����6114-6154 Nancy Ridge Drive | � | May 2, 2007 | � | � | 3 | �� | � | � | 196,557 | �� | � | � | 1.2 | %� | � | � | 196,557 | �� | � | � | 100.0 | %� | � | � | 100.0 | %� |
| 61 |
�� | ����6122-6126 Nancy Ridge Drive | � | April 25, 2012 | � | � | 1 | �� | � | � | 68,000 | �� | � | � | 0.4 | %� | � | � | 68,000 | �� | � | � | 100.0 | %� | � | � | 100.0 | %� |
| 62 |
�� | ����6828 Nancy Ridge Drive | � | April 21, 2005 | � | � | 1 | �� | � | � | 42,138 | �� | � | � | 0.3 | %� | � | � | 42,138 | �� | � | � | 100.0 | %� | � | � | 100.0 | %� |
| 63 |
�� | ����Pacific Center Boulevard | � | August 24, 2007 | � | � | 2 | �� | � | � | 66,745 | �� | � | � | 0.4 | %� | � | � | 66,745 | �� | � | � | 100.0 | %� | � | � | 100.0 | %� |
| 64 |
�� | ����Road to the Cure | � | December 14, 2006 | � | � | 1 | �� | � | � | 67,998 | �� | � | � | 0.4 | %� | � | � | 67,998 | �� | � | � | 100.0 | %� | � | � | 100.0 | %� |
| 65 |
�� | ����San Diego Science Center | � | October 21, 2004 | � | � | 1 | �� | � | � | 105,364 | �� | � | � | 0.6 | %� | � | � | 86,027 | �� | � | � | 81.6 | %� | � | � | 79.9 | %� |
| 66 |
�� | ����10240 Science Center Drive | � | September 23, 2010 | � | � | 1 | �� | � | � | 49,347 | �� | � | � | 0.3 | %� | � | � | 49,347 | �� | � | � | 100.0 | %� | � | � | 100.0 | %� |
| 67 |
�� | ����10255 Science Center Drive | � | September 24, 2004 | � | � | 1 | �� | � | � | 53,740 | �� | � | � | 0.3 | %� | � | � | 53,740 | �� | � | � | 100.0 | %� | � | � | 100.0 | %� |
| 68 |
�� | ����Sorrento Plaza | � | December 18, 2010 | � | � | 2 | �� | � | � | 31,184 | �� | � | � | 0.2 | %� | � | � | 31,184 | �� | � | � | 100.0 | %� | � | � | 100.0 | %� |
| 69 |
�� | ����Sorrento Valley Boulevard | � | December 7, 2006 | � | � | 1 | �� | � | � | 54,924 | �� | � | � | 0.3 | %� | � | � | ��� | �� | � | � | ��� | �� | � | � | ��� | �� |
| 70 |
�� | ����11388 Sorrento Valley Road | � | September 10, 2010 | � | � | 1 | �� | � | � | 35,940 | �� | � | � | 0.2 | %� | � | � | 35,940 | �� | � | � | 100.0 | %� | � | � | 100.0 | %� |
| 71 |
�� | ����Summers Ridge | � | June 8, 2012 | � | � | ��� | �� | � | � | ��� | �� | � | � | n/a | �� | � | � | ��� | �� | � | � | 100.0 | %� | � | � | 100.0 | %� |
| 72 |
�� | ����Torreyana Road | � | March 22, 2007 | � | � | 1 | �� | � | � | 81,204 | �� | � | � | 0.5 | %� | � | � | 81,204 | �� | � | � | 100.0 | %� | � | � | 100.0 | %� |
| 73 |
�� | ����9865 Towne Centre Drive | � | August 12, 2004 | � | � | 2 | �� | � | � | 94,866 | �� | � | � | 0.6 | %� | � | � | 94,866 | �� | � | � | 100.0 | %� | � | � | 100.0 | %� |
| 74 |
�� | ����9885 Towne Centre Drive | � | August 12, 2004 | � | � | 2 | �� | � | � | 104,870 | �� | � | � | 0.6 | %� | � | � | 104,870 | �� | � | � | 100.0 | %� | � | � | 100.0 | %� |
| 75 |
�� | ����Waples Street | � | March 1, 2005 | � | � | 1 | �� | � | � | 50,055 | �� | � | � | 0.3 | %� | � | � | 21,952 | �� | � | � | 43.9 | %� | � | � | 43.9 | %� |
| 76 |
�� | ����Wateridge Circle | � | November 1, 2011 | � | � | 3 | �� | � | � | 106,490 | �� | � | � | 0.6 | %� | � | � | 101,783 | �� | � | � | 95.6 | %� | � | � | 95.6 | %� |
| �� | � | � | � |
� |
� | � | � |
� |
� | � | � |
� |
� | � | � |
� |
� | � | � |
� |
� | � | � |
� |
� | |||
| �� | Total San Diego | � | � | 40 | �� | � | � | 1,918,547 | �� | � | � | 11.4 | %� | � | � | 1,777,745 | �� | � | � | 92.7 | %� | � | � | 92.5 | %� | |||
| �� | � | � | � |
� |
� | � | � |
� |
� | � | � |
� |
� | � | � |
� |
� | � | � |
� |
� | � | � |
� |
� | |||
| �� | New York / New Jersey | � | � | � | � | � | � | |||||||||||||||||||||
| 77 |
�� | ����Ardsley Park | � | June 23, 2011 | � | � | 5 | �� | � | � | 207,855 | �� | � | � | 1.2 | %� | � | � | 185,905 | �� | � | � | 89.4 | %� | � | � | 89.4 | %� |
| 78 |
�� | ����Graphics Drive | � | March 17, 2005 | � | � | 1 | �� | � | � | 72,300 | �� | � | � | 0.4 | %� | � | � | 46,386 | �� | � | � | 64.2 | %� | � | � | 64.2 | %� |
| 79 |
�� | ����Landmark at Eastview | � | August 12, 2004 | � | � | 5 | �� | � | � | 800,671 | �� | � | � | 5.0 | %� | � | � | 652,304 | �� | � | � | 81.5 | %� | � | � | 81.5 | %� |
| 80 |
�� | ����Landmark at Eastview II | � | August 12, 2004 | � | � | 3 | �� | � | � | 360,520 | �� | � | � | 2.1 | %� | � | � | 360,520 | �� | � | � | 100.0 | %� | � | � | 100.0 | %� |
| 81 |
�� | ����Landmark at Eastview III | � | August 12, 2004 | � | � | 2 | �� | � | � | 297,000 | �� | � | � | 1.8 | %� | � | � | 297,000 | �� | � | � | 100.0 | %� | � | � | 100.0 | %� |
| 82 |
�� | ����One Research Way | � | May 31, 2006 | � | � | 1 | �� | � | � | 50,581 | �� | � | � | 0.3 | %� | � | � | 50,581 | �� | � | � | 100.0 | %� | � | � | 100.0 | %� |
| �� | � | � | � |
� |
� | � | � |
� |
� | � | � |
� |
� | � | � |
� |
� | � | � |
� |
� | � | � |
� |
� | |||
| �� | Total New York / New Jersey | � | � | 17 | �� | � | � | 1,788,927 | �� | � | � | 10.8 | %� | � | � | 1,592,696 | �� | � | � | 89.0 | %� | � | � | 89.0 | %� | |||
| �� | � | � | � |
� |
� | � | � |
� |
� | � | � |
� |
� | � | � |
� |
� | � | � |
� |
� | � | � |
� |
� | |||
| �� | Cambridge, UK | � | � | � | � | � | � | |||||||||||||||||||||
| 83 |
�� | ����Granta Park | � | June 12, 2012 | � | � | 11 | �� | � | � | 472,234 | �� | � | � | 2.8 | %� | � | � | 470,015 | �� | � | � | 99.5 | %� | � | � | 99.5 | %� |
| 84 |
�� | ����430 Cambridge Science Park | � | May 15, 2014 | � | � | 1 | �� | � | � | 42,410 | �� | � | � | 0.3 | %� | � | � | 42,410 | �� | � | � | 100.0 | %� | � | � | 100.0 | %� |
| �� | � | � | � |
� |
� | � | � |
� |
� | � | � |
� |
� | � | � |
� |
� | � | � |
� |
� | � | � |
� |
� | |||
| �� | Total Cambridge, UK | � | � | 12 | �� | � | � | 514,644 | �� | � | � | 3.1 | %� | � | � | 512,425 | �� | � | � | 99.6 | %� | � | � | 99.6 | %� | |||
| �� | � | � | � |
� |
� | � | � |
� |
� | � | � |
� |
� | � | � |
� |
� | � | � |
� |
� | � | � |
� |
� | |||
| �� | Pennsylvania | � | � | � | � | � | � | |||||||||||||||||||||
| 85 |
�� | ����George Patterson Boulevard | � | October 28, 2005 | � | � | 1 | �� | � | � | 71,500 | �� | � | � | 0.4 | %� | � | � | 71,500 | �� | � | � | 100.0 | %� | � | � | 100.0 | %� |
�
�
PROPERTY LISTING - CONSOLIDATED PORTFOLIO
SEPTEMBER 30, 2014
�
�
| � | �� | � | � | � | � | � | � | � | Rentable Square |
� | � | Percent�of Rentable |
� | � | Leased Square |
� | � | Percent Leased |
� | |||||||||
| � | �� | Property |
� | Acquisition�Date |
� | Buildings | � | � | Feet | � | � | Sq Ft | � | � | Feet | � | � | 9/30/14 | � | � | 6/30/14 | � | ||||||
| �� | Pennsylvania (Continued) | � | � | � | � | � | � | |||||||||||||||||||||
| 86 |
�� | ����Hershey Center for Applied Research | � | May�31,�2013 | � | � | 1 | �� | � | � | 80,867 | �� | � | � | 0.5 | %� | � | � | 78,347 | �� | � | � | 96.9 | %� | � | � | 94.9 | %� |
| 87 |
�� | ����3711 Market Street (2) | � | May 31, 2013 | � | � | 1 | �� | � | � | 154,793 | �� | � | � | 0.9 | %� | � | � | 147,773 | �� | � | � | 95.5 | %� | � | � | 95.5 | %� |
| 88 |
�� | ����3737 Market Street (3) | � | May 31, 2013 | � | � | 1 | �� | � | � | 334,305 | �� | � | � | 2.0 | %� | � | � | 275,454 | �� | � | � | 82.4 | %� | � | � | 80.8 | %� |
| 89 |
�� | ����Phoenixville Pike | � | April 5, 2005 | � | � | 1 | �� | � | � | 104,400 | �� | � | � | 0.6 | %� | � | � | 43,659 | �� | � | � | 41.8 | %� | � | � | 37.5 | %� |
| 90 |
�� | ����Spring Mill Drive | � | July 20, 2006 | � | � | 1 | �� | � | � | 76,561 | �� | � | � | 0.5 | %� | � | � | 61,607 | �� | � | � | 80.5 | %� | � | � | 82.5 | %� |
| 91 |
�� | ����900 Uniqema Boulevard | � | January�13,�2006 | � | � | 1 | �� | � | � | 11,293 | �� | � | � | 0.1 | %� | � | � | ��� | �� | � | � | ��� | �� | � | � | ��� | �� |
| 92 |
�� | ����1000 Uniqema Boulevard | � | September�30,�2005 | � | � | 1 | �� | � | � | 59,821 | �� | � | � | 0.4 | %� | � | � | ��� | �� | � | � | ��� | �� | � | � | ��� | �� |
| �� | � | � | � |
� |
� | � | � |
� |
� | � | � |
� |
� | � | � |
� |
� | � | � |
� |
� | � | � |
� |
� | |||
| �� | Total Pennsylvania | � | � | 8 | �� | � | � | 893,540 | �� | � | � | 5.4 | %� | � | � | 678,340 | �� | � | � | 75.9 | %� | � | � | 74.8 | %� | |||
| �� | � | � | � |
� |
� | � | � |
� |
� | � | � |
� |
� | � | � |
� |
� | � | � |
� |
� | � | � |
� |
� | |||
| �� | North Carolina | � | � | � | � | � | � | |||||||||||||||||||||
| 93 |
�� | ����Paramount Parkway | � | July 20, 2010 | � | � | 1 | �� | � | � | 61,603 | �� | � | � | 0.4 | %� | � | � | 61,603 | �� | � | � | 100.0 | %� | � | � | 100.0 | %� |
| 94 |
�� | ����Patriot Drive | � | December 17, 2010 | � | � | 1 | �� | � | � | 48,394 | �� | � | � | 0.3 | %� | � | � | 48,394 | �� | � | � | 100.0 | %� | � | � | 100.0 | %� |
| 95 |
�� | ����Piedmont Triad Research - Wake 90 | � | May 31, 2013 | � | � | 1 | �� | � | � | 475,742 | �� | � | � | 2.8 | %� | � | � | 415,195 | �� | � | � | 87.3 | %� | � | � | 87.3 | %� |
| 96 |
�� | ����Wake Forest Biotech Place | � | May 31, 2013 | � | � | 1 | �� | � | � | 242,000 | �� | � | � | 1.4 | %� | � | � | 242,000 | �� | � | � | 100.0 | %� | � | � | 100.0 | %� |
| 97 |
�� | ����Weston Parkway | � | December 17, 2010 | � | � | 1 | �� | � | � | 30,589 | �� | � | � | 0.2 | %� | � | � | 30,589 | �� | � | � | 100.0 | %� | � | � | 100.0 | %� |
| �� | � | � | � |
� |
� | � | � |
� |
� | � | � |
� |
� | � | � |
� |
� | � | � |
� |
� | � | � |
� |
� | |||
| �� | Total North Carolina | � | � | 5 | �� | � | � | 858,328 | �� | � | � | 5.1 | %� | � | � | 797,781 | �� | � | � | 92.9 | %� | � | � | 92.9 | %� | |||
| �� | � | � | � |
� |
� | � | � |
� |
� | � | � |
� |
� | � | � |
� |
� | � | � |
� |
� | � | � |
� |
� | |||
| �� | Seattle | � | � | � | � | � | � | |||||||||||||||||||||
| 98 |
�� | ����Elliott Avenue | � | August 24, 2004 | � | � | 1 | �� | � | � | 151,194 | �� | � | � | 0.9 | %� | � | � | 84,657 | �� | � | � | 56.0 | %� | � | � | 56.0 | %� |
| 99 |
�� | ����500 Fairview Avenue | � | January 28, 2008 | � | � | 1 | �� | � | � | 121,569 | �� | � | � | 0.7 | %� | � | � | 24,866 | �� | � | � | 20.5 | %� | � | � | 20.5 | %� |
| 100 |
�� | ����530 Fairview Avenue | � | January 12, 2006 | � | � | 1 | �� | � | � | 101,118 | �� | � | � | 0.6 | %� | � | � | 101,118 | �� | � | � | 100.0 | %� | � | � | 100.0 | %� |
| 101 |
�� | ����Monte Villa Parkway | � | August 17, 2004 | � | � | 1 | �� | � | � | 51,000 | �� | � | � | 0.3 | %� | � | � | 30,167 | �� | � | � | 59.2 | %� | � | � | 59.2 | %� |
| 102 |
�� | ����217th Place | � | November 21, 2006 | � | � | 1 | �� | � | � | 67,799 | �� | � | � | 0.4 | %� | � | � | 42,628 | �� | � | � | 62.9 | %� | � | � | 62.9 | %� |
| �� | � | � | � |
� |
� | � | � |
� |
� | � | � |
� |
� | � | � |
� |
� | � | � |
� |
� | � | � |
� |
� | |||
| �� | Total Seattle | � | � | 5 | �� | � | � | 492,680 | �� | � | � | 2.9 | %� | � | � | 283,436 | �� | � | � | 57.5 | %� | � | � | 57.5 | %� | |||
| �� | � | � | � |
� |
� | � | � |
� |
� | � | � |
� |
� | � | � |
� |
� | � | � |
� |
� | � | � |
� |
� | |||
| �� | University Related - Other | � | � | � | � | � | � | |||||||||||||||||||||
| 103 |
�� | ����BRDG Park at Danforth Plant Science Center | � | May 31, 2013 | � | � | 1 | �� | � | � | 109,731 | �� | � | � | 0.7 | %� | � | � | 99,386 | �� | � | � | 90.6 | %� | � | � | 85.0 | %� |
| 104 |
�� | ����100 College Street (4) | � | April 4, 2014 | � | � | 1 | �� | � | � | 510,419 | �� | � | � | 3.0 | %� | � | � | 505,683 | �� | � | � | 99.1 | %� | � | � | 99.1 | %� |
| 105 |
�� | ����4320 Forest Park Avenue | � | May 31, 2013 | � | � | 1 | �� | � | � | 152,403 | �� | � | � | 0.9 | %� | � | � | 152,403 | �� | � | � | 100.0 | %� | � | � | 100.0 | %� |
| 106 |
�� | ����300 George Street (4) | � | April 4, 2014 | � | � | 1 | �� | � | � | 518,940 | �� | � | � | 3.1 | %� | � | � | 512,349 | �� | � | � | 98.7 | %� | � | � | 98.7 | %� |
| 107 |
�� | ����Heritage @ 4240 | � | May 31, 2013 | � | � | 1 | �� | � | � | 185,207 | �� | � | � | 1.1 | %� | � | � | 164,925 | �� | � | � | 89.0 | %� | � | � | 89.0 | %� |
| 108 |
�� | ����Innovation Research Park at ODU I | � | May 31, 2013 | � | � | 1 | �� | � | � | 95,634 | �� | � | � | 0.6 | %� | � | � | 86,102 | �� | � | � | 90.0 | %� | � | � | 90.0 | %� |
| 109 |
�� | ����Innovation Research Park at ODU II | � | May 31, 2013 | � | � | 1 | �� | � | � | 95,634 | �� | � | � | 0.6 | %� | � | � | 79,072 | �� | � | � | 82.7 | %� | � | � | 75.8 | %� |
| 110 |
�� | ����Trade Centre Avenue | � | August 9, 2006 | � | � | 2 | �� | � | � | 78,023 | �� | � | � | 0.5 | %� | � | � | 78,023 | �� | � | � | 100.0 | %� | � | � | 100.0 | %� |
| 111 |
�� | ����University of Miami Life Science & Technology Park | � | May 31, 2013 | � | � | 1 | �� | � | � | 258,681 | �� | � | � | 1.5 | %� | � | � | 166,598 | �� | � | � | 64.4 | %� | � | � | 64.9 | %� |
| 112 |
�� | ����University Tech Park at IIT | � | May 31, 2013 | � | � | 1 | �� | � | � | 128,000 | �� | � | � | 0.8 | %� | � | � | 128,000 | �� | � | � | 100.0 | %� | � | � | 100.0 | %� |
| 113 |
�� | ����Walnut Street | � | July 7, 2006 | � | � | 4 | �� | � | � | 149,984 | �� | � | � | 0.9 | %� | � | � | 149,984 | �� | � | � | 100.0 | %� | � | � | 100.0 | %� |
| �� | � | � | � |
� |
� | � | � |
� |
� | � | � |
� |
� | � | � |
� |
� | � | � |
� |
� | � | � |
� |
� | |||
| �� | Total University Related - Other | � | � | 15 | �� | � | � | 2,282,656 | �� | � | � | 13.7 | %� | � | � | 2,122,525 | �� | � | � | 93.0 | %� | � | � | 92.5 | %� | |||
| �� | � | � | � |
� |
� | � | � |
� |
� | � | � |
� |
� | � | � |
� |
� | � | � |
� |
� | � | � |
� |
� | |||
| �� | Total | � | � | 181 | �� | � | � | 16,814,265 | �� | � | � | 100.0 | %� | � | � | 15,161,849 | �� | � | � | 90.2 | %� | � | � | 89.3 | %� | |||
| �� | � | � | � |
� |
� | � | � |
� |
� | � | � |
� |
� | � | � |
� |
� | � | � |
� |
� | � | � |
� |
� | |||
�
| (1) | The Company owns 87.5% of the limited liability company that owns the Ardenwood Venture property. |
| (2) | The Company owns 60% of the limited liability company that owns the 3711 Market Street property. |
| (3) | The Company owns 68% of the limited liability company that owns the 3737 Market Street property. |
| (4) | The Company owns 93% of the limited liability company that owns the 100 College and 300 George properties. |
�
�
DEVELOPMENT, REDEVELOPMENT AND DEVELOPMENT POTENTIAL
SEPTEMBER 30, 2014
�
(Dollars in thousands)
�
| Property |
� | Market |
�� | Rentable Square� Feet |
� | �� | Percent Pre-Leased |
� | � | Investment to�Date� (1) |
� | �� | Estimated Total Investment�(2) |
� | �� | Estimated In-Service Date�(3) |
� | |||||
| Development: |
� | �� | �� | � | �� | �� | ||||||||||||||||
| 100 College Street |
� | University�Related�-�Other | �� | � | 510,419 | �� | �� | � | 99.1 | %� | � | $ | 101,000 | �� | �� | $ | 191,000 | �� | �� | � | Q1�2016 | �� |
| Landmark at Eastview III |
� | New�York�/�New�Jersey | �� | � | 297,000 | �� | �� | � | 100.0 | %� | � | � | 83,800 | �� | �� | � | 165,900 | �� | �� | � | Q4 2015 | �� |
| 500 Fairview Avenue |
� | Seattle | �� | � | 121,569 | �� | �� | � | 20.5 | %� | � | � | 5,600 | �� | �� | � | 73,000 | �� | �� | � | Q1 2016 | �� |
| 450 Kendall Street (Kendall G) |
� | Boston | �� | � | 63,000 | �� | �� | � | ��� | �� | � | � | 27,700 | �� | �� | � | 45,500 | �� | �� | � | Q2 2015 | �� |
| 430 Cambridge Science Park |
� | United Kingdom | �� | � | 42,410 | �� | �� | � | 100.0 | %� | � | � | 3,900 | �� | �� | � | 24,400 | �� | �� | � | Q3 2015 | �� |
| � | �� | � |
� |
� | �� | � |
� |
� | � | � |
� |
� | �� | � |
� |
� | �� | |||||
| Total / weighted-average |
� | �� | � | 1,034,398 | �� | �� | � | 84.1 | %� | � | $ | 222,000 | �� | �� | $ | 499,800 | �� | �� | ||||
| Redevelopment: |
� | �� | �� | � | �� | �� | ||||||||||||||||
| 60 Hampshire Street |
� | Boston | �� | � | 41,257 | �� | �� | � | 86.5 | %� | � | � | 11,200 | �� | �� | � | 15,900 | �� | �� | � | Q4 2014 | �� |
| � | �� | � |
� |
� | �� | � |
� |
� | � | � |
� |
� | �� | � |
� |
� | �� | |||||
| Total / weighted-average |
� | �� | � | 41,257 | �� | �� | � | 86.5 | %� | � | $ | 11,200 | �� | �� | $ | 15,900 | �� | �� | ||||
| � | �� | �� | � | � |
� |
� | �� | � |
� |
� | �� | |||||||||||
| Total |
� | �� | �� | � | $ | 233,200 | �� | �� | $ | 515,700 | �� | �� | ||||||||||
| � | �� | �� | � | � |
� |
� | �� | � |
� |
� | �� | |||||||||||
�
| Development Potential: | �� | � | � | �� | Estimated | � | �� | Total | � | |||
| � | �� | Pre-Development | � | �� | Developable | � | �� | Development | � | |||
| Market |
�� | Square Feet | � | �� | Square Feet | � | �� | Potential | � | |||
| Maryland |
�� | � | ��� | �� | �� | � | 800,000 | �� | �� | � | 800,000 | �� |
| San Francisco |
�� | � | 550,000 | �� | �� | � | 1,955,000 | �� | �� | � | 2,505,000 | �� |
| San Diego |
�� | � | 300,000 | �� | �� | � | ��� | �� | �� | � | 300,000 | �� |
| New York / New Jersey |
�� | � | ��� | �� | �� | � | 193,000 | �� | �� | � | 193,000 | �� |
| Cambridge, UK |
�� | � | ��� | �� | �� | � | 138,000 | �� | �� | � | 138,000 | �� |
| Pennsylvania |
�� | � | ��� | �� | �� | � | 2,818,000 | �� | �� | � | 2,818,000 | �� |
| North Carolina |
�� | � | 274,000 | �� | �� | � | ��� | �� | �� | � | 274,000 | �� |
| Seattle |
�� | � | ��� | �� | �� | � | 50,000 | �� | �� | � | 50,000 | �� |
| University Related - Other |
�� | � | ��� | �� | �� | � | 300,000 | �� | �� | � | 300,000 | �� |
| �� | � |
� |
� | �� | � |
� |
� | �� | � |
� |
� | |
| Total |
�� | � | 1,124,000 | �� | �� | � | 6,254,000 | �� | �� | � | 7,378,000 | �� |
| �� | � |
� |
� | �� | � |
� |
� | �� | � |
� |
� | |
�
| (1) | Includes amounts paid for acquiring the property, landlord improvements and tenant improvement allowances, but excludes any amounts accrued, and payroll, interest, ground rent. or operating expenses capitalized, through September�30, 2014. |
| (2) | Includes construction costs associated with speculative leasing. |
| (3) | Management�s estimate of the time in which construction is substantially completed. A project is considered substantially complete and held available for occupancy upon the completion of tenant improvements, but no later than one year from cessation of major construction activity. Upon completion, management expects the property to enter the Same Property Portfolio one year subsequent to the in-service date. |
�
�
CAPITAL EXPENDITURES
SEPTEMBER 30, 2014
�
(Dollars in thousands)
�
| Capital Expenditures: | �� | Three Months Ended | � | |||||||||||||||||
| � | �� | 9/30/14 | � | �� | 6/30/14 | � | �� | 3/31/14 | � | �� | 12/31/13 | � | �� | 9/30/13 | � | |||||
| Development / Pre-Development (1) |
�� | $ | 78,596 | �� | �� | $ | 50,678 | �� | �� | $ | 44,846 | �� | �� | $ | 63,650 | �� | �� | $ | 42,184 | �� |
| Redevelopment |
�� | � | 6,391 | �� | �� | � | 3,349 | �� | �� | � | 1,185 | �� | �� | � | 2,219 | �� | �� | � | 752 | �� |
| Tenant improvements - first generation (2) |
�� | � | 13,304 | �� | �� | � | 8,614 | �� | �� | � | 9,175 | �� | �� | � | 8,257 | �� | �� | � | 5,572 | �� |
| Recurring capital expenditures and second generation tenant improvements�(2)�(3) |
�� | � | 17,007 | �� | �� | � | 21,553 | �� | �� | � | 7,731 | �� | �� | � | 8,028 | �� | �� | � | 9,857 | �� |
| Other capital |
�� | � | 5,729 | �� | �� | � | 3,095 | �� | �� | � | 6,906 | �� | �� | � | 5,254 | �� | �� | � | 8,532 | �� |
| �� | � |
� |
� | �� | � |
� |
� | �� | � |
� |
� | �� | � |
� |
� | �� | � |
� |
� | |
| Total capital expenditures |
�� | $ | 121,027 | �� | �� | $ | 87,289 | �� | �� | $ | 69,843 | �� | �� | $ | 87,408 | �� | �� | $ | 66,897 | �� |
| �� | � |
� |
� | �� | � |
� |
� | �� | � |
� |
� | �� | � |
� |
� | �� | � |
� |
� | |
�
| Capitalized Interest: | �� | Investment |
� | �� | Three Months Ended | � | ||||||||||||||||||
| � | �� | to�Date�(4) | � | �� | 9/30/14 | � | � | 6/30/14 | � | � | 3/31/14 | � | � | 12/31/13 | � | � | 9/30/13 | � | ||||||
| Development |
�� | $ | 222,000 | �� | �� | $ | 1,704 | �� | � | $ | 1,777 | �� | � | $ | 981 | �� | � | $ | 695 | �� | � | $ | 1,367 | �� |
| Redevelopment |
�� | � | 11,200 | �� | �� | � | 96 | �� | � | � | 64 | �� | � | � | 64 | �� | � | � | 330 | �� | � | � | 294 | �� |
| Other Capital Improvements (5) |
�� | � | 393,300 | �� | �� | � | 3,336 | �� | � | � | 2,638 | �� | � | � | 2,048 | �� | � | � | 2,165 | �� | � | � | 947 | �� |
| Pre-Development |
�� | � | 101,300 | �� | �� | � | 984 | �� | � | � | 944 | �� | � | � | 1,099 | �� | � | � | 1,017 | �� | � | � | 1,376 | �� |
| �� | � |
� |
� | �� | � |
� |
� | � | � |
� |
� | � | � |
� |
� | � | � |
� |
� | � | � |
� |
� | |
| Total capitalized interest |
�� | $ | 727,800 | �� | �� | $ | 6,120 | �� | � | $ | 5,423 | �� | � | $ | 4,192 | �� | � | $ | 4,207 | �� | � | $ | 3,984 | �� |
| �� | � |
� |
� | �� | � |
� |
� | � | � |
� |
� | � | � |
� |
� | � | � |
� |
� | � | � |
� |
� | |
| Average interest rate capitalized |
�� | �� | � | 3.97 | %� | � | � | 3.94 | %� | � | � | 4.64 | %� | � | � | 4.75 | %� | � | � | 4.88 | %� | |||
�
| (1) | Projects include funds from tax credit dollars received during the quarter. Negative amounts reflect an excess in tax credit benefits received over expenditures incurred during the quarter. |
| (2) | For definitions of first and second generation leases, see page 37. |
| (3) | Includes revenue enhancing and non-revenue enhancing recurring capital expenditures. For a definition of recurring capital expenditures, see page 37. |
| (4) | Includes amounts paid for acquiring the property, landlord improvements and tenant improvement allowances, but for Development and Redevelopment properties excludes any amounts accrued, and payroll, interest or operating expenses capitalized, through September�30, 2014. |
| (5) | Includes improvements on operating properties, including major tenant improvement projects on properties which are not considered to be in Development, Redevelopment or Pre-development during the three months ended September�30, 2014. |
�
�
PROPERTY LISTING - UNCONSOLIDATED PARTNERSHIPS
SEPTEMBER 30, 2014
�
(Dollars in thousands)
�
| � | �� | � | �� | � | � | �� | Rentable | � | �� | Leased | � | �� | � | � | � | � | � | � | � | |||||
| � | �� | � | �� | � | � | �� | Square | � | �� | Square | � | �� | Percent Leased | � | � | � | ||||||||
| Property |
�� | Acquisition�Date |
�� | Buildings |
� | �� | Feet | � | �� | Feet | � | �� | 9/30/14 | � | � | 6/30/14 | � | � | Market | |||||
| McKellar Court |
�� | �� | �� | �� | �� | � | � | |||||||||||||||||
| McKellar Court |
�� | September�30,�2004 | �� | � | 1 | �� | �� | � | 72,863 | �� | �� | � | 72,863 | �� | �� | � | 100.0 | %� | � | � | 100.0 | %� | � | San�Diego |
| PREI |
�� | �� | �� | �� | �� | � | � | |||||||||||||||||
| 650 E. Kendall Street |
�� | April 4, 2007 | �� | � | 1 | �� | �� | � | 282,217 | �� | �� | � | 281,892 | �� | �� | � | 99.9 | %� | � | � | 71.5 | %� | � | Boston |
| 350 E. Kendall Street Garage (Kendall F) |
�� | April 4, 2007 | �� | � | 1 | �� | �� | � | 1,409�Stalls | �� | �� | � | 1,136�Stalls | �� | �� | � | 100.0 | %� | � | � | 100.0 | %� | � | Boston |
�
| Total assets |
�� | $ | 292,805 | �� |
| Total debt (1) |
�� | � | 152,036 | �� |
| Current annualized base rent |
�� | � | 17,911 | �� |
| BioMed�s net investment in unconsolidated partnerships |
�� | $ | 36,275 | �� |
| BioMed�s pro rata share of debt |
�� | � | 29,185 | �� |
| BioMed ownership percentage |
�� | � | 20 | %� |
�
| (1) | McKellar Court�s debt is payable to BioMed Realty, L.P. and is included in investments in unconsolidated partnerships on the Company�s consolidated balance sheet. |
�
�
LEASE EXPIRATIONS
SEPTEMBER 30, 2014
�
The weighted-average remaining lease term is 8 years for the total portfolio.
�
| � | � | � | � | � | � | � | � | Current (1) | � | � | Expiration (2) | � | � | GAAP | � | |||||||||||||||||||||||||||||
| Expiration |
� | Leased Square�Feet |
� | � | Percent�of Leased Square�Feet |
� | � | Annualized Base Rent |
� | � | Percent of Annualized Base Rent |
� | � | Annualized Base Rent per Leased Square�Feet |
� | � | Annualized Base Rent |
� | � | Percent of Annualized Base Rent |
� | � | Annualized Base Rent per Leased Square�Feet |
� | � | Annualized Base Rent |
� | � | Percent of Annualized Base Rent |
� | � | Annualized Base Rent per Leased Square�Feet |
� | |||||||||||
| � | � | � | � | � | � | � | � | (In�thousands) | � | � | � | � | � | � | � | � | (In�thousands) | � | � | � | � | � | � | � | � | (In�thousands) | � | � | � | � | � | � | � | |||||||||||
| Month-to-month |
� | � | 26,744 | �� | � | � | 0.2 | %� | � | $ | 456 | �� | � | � | 0.1 | %� | � | $ | 17.05 | �� | � | $ | 456 | �� | � | � | 0.1 | %� | � | $ | 17.05 | �� | � | $ | 456 | �� | � | � | 0.1 | %� | � | $ | 17.05 | �� |
| Fourth quarter 2014 |
� | � | 229,463 | �� | � | � | 1.5 | %� | � | � | 13,909 | �� | � | � | 2.5 | %� | � | � | 60.62 | �� | � | � | 13,909 | �� | � | � | 2.2 | %� | � | � | 60.62 | �� | � | � | 9,381 | �� | � | � | 1.6 | %� | � | � | 40.88 | �� |
| � | � |
� |
� | � | � |
� |
� | � | � |
� |
� | � | � |
� |
� | � | � |
� |
� | � | � |
� |
� | � | � |
� |
� | � | � |
� |
� | � | � |
� |
� | � | � |
� |
� | � | � |
� |
� | |
| 2014 |
� | � | 229,463 | �� | � | � | 1.5 | %� | � | � | 13,909 | �� | � | � | 2.5 | %� | � | � | 60.62 | �� | � | � | 13,909 | �� | � | � | 2.2 | %� | � | � | 60.62 | �� | � | � | 9,381 | �� | � | � | 1.6 | %� | � | � | 40.88 | �� |
| First quarter 2015 |
� | � | 97,278 | �� | � | � | 0.6 | %� | � | � | 2,903 | �� | � | � | 0.5 | %� | � | � | 29.84 | �� | � | � | 2,962 | �� | � | � | 0.5 | %� | � | � | 30.45 | �� | � | � | 2,795 | �� | � | � | 0.5 | %� | � | � | 28.73 | �� |
| Second quarter 2015 |
� | � | 264,677 | �� | � | � | 1.7 | %� | � | � | 9,221 | �� | � | � | 1.7 | %� | � | � | 34.84 | �� | � | � | 9,431 | �� | � | � | 1.7 | %� | � | � | 35.63 | �� | � | � | 9,311 | �� | � | � | 1.6 | %� | � | � | 35.18 | �� |
| Third quarter 2015 |
� | � | 403,681 | �� | � | � | 2.6 | %� | � | � | 12,146 | �� | � | � | 2.2 | %� | � | � | 30.09 | �� | � | � | 12,263 | �� | � | � | 2.2 | %� | � | � | 30.38 | �� | � | � | 11,793 | �� | � | � | 2.1 | %� | � | � | 29.21 | �� |
| Fourth quarter 2015 |
� | � | 59,366 | �� | � | � | 0.4 | %� | � | � | 1,571 | �� | � | � | 0.3 | %� | � | � | 26.46 | �� | � | � | 1,607 | �� | � | � | 0.3 | %� | � | � | 27.07 | �� | � | � | 1,523 | �� | � | � | 0.3 | %� | � | � | 25.65 | �� |
| � | � |
� |
� | � | � |
� |
� | � | � |
� |
� | � | � |
� |
� | � | � |
� |
� | � | � |
� |
� | � | � |
� |
� | � | � |
� |
� | � | � |
� |
� | � | � |
� |
� | � | � |
� |
� | |
| 2015 |
� | � | 825,002 | �� | � | � | 5.3 | %� | � | � | 25,841 | �� | � | � | 4.6 | %� | � | � | 31.32 | �� | � | � | 26,262 | �� | � | � | 4.1 | %� | � | � | 31.83 | �� | � | � | 25,422 | �� | � | � | 4.5 | %� | � | � | 30.81 | �� |
| 2016 |
� | � | 1,152,540 | �� | � | � | 7.4 | %� | � | � | 45,903 | �� | � | � | 8.2 | %� | � | � | 39.83 | �� | � | � | 47,391 | �� | � | � | 7.4 | %� | � | � | 41.12 | �� | � | � | 42,811 | �� | � | � | 7.5 | %� | � | � | 37.14 | �� |
| 2017 |
� | � | 871,977 | �� | � | � | 5.6 | %� | � | � | 26,153 | �� | � | � | 4.7 | %� | � | � | 29.99 | �� | � | � | 27,831 | �� | � | � | 4.3 | %� | � | � | 31.92 | �� | � | � | 25,362 | �� | � | � | 4.5 | %� | � | � | 29.09 | �� |
| 2018 |
� | � | 1,829,389 | �� | � | � | 11.8 | %� | � | � | 81,561 | �� | � | � | 14.6 | %� | � | � | 44.58 | �� | � | � | 84,415 | �� | � | � | 13.1 | %� | � | � | 46.14 | �� | � | � | 76,147 | �� | � | � | 13.4 | %� | � | � | 41.62 | �� |
| 2019 |
� | � | 1,015,681 | �� | � | � | 6.5 | %� | � | � | 26,782 | �� | � | � | 4.8 | %� | � | � | 26.37 | �� | � | � | 29,795 | �� | � | � | 4.6 | %� | � | � | 29.33 | �� | � | � | 28,189 | �� | � | � | 5.0 | %� | � | � | 27.75 | �� |
| 2020 |
� | � | 717,528 | �� | � | � | 4.6 | %� | � | � | 24,307 | �� | � | � | 4.4 | %� | � | � | 33.88 | �� | � | � | 25,873 | �� | � | � | 4.0 | %� | � | � | 36.06 | �� | � | � | 23,761 | �� | � | � | 4.2 | %� | � | � | 33.12 | �� |
| 2021 |
� | � | 644,309 | �� | � | � | 4.2 | %� | � | � | 19,695 | �� | � | � | 3.5 | %� | � | � | 30.57 | �� | � | � | 22,332 | �� | � | � | 3.5 | %� | � | � | 34.66 | �� | � | � | 19,583 | �� | � | � | 3.4 | %� | � | � | 30.39 | �� |
| 2022 |
� | � | 346,291 | �� | � | � | 2.2 | %� | � | � | 10,242 | �� | � | � | 1.8 | %� | � | � | 29.58 | �� | � | � | 12,326 | �� | � | � | 1.9 | %� | � | � | 35.59 | �� | � | � | 10,544 | �� | � | � | 1.9 | %� | � | � | 30.45 | �� |
| 2023 |
� | � | 1,413,472 | �� | � | � | 9.1 | %� | � | � | 58,323 | �� | � | � | 10.5 | %� | � | � | 41.26 | �� | � | � | 65,319 | �� | � | � | 10.1 | %� | � | � | 46.21 | �� | � | � | 59,455 | �� | � | � | 10.5 | %� | � | � | 42.06 | �� |
| Thereafter |
� | � | 6,444,208 | �� | � | � | 41.6 | %� | � | � | 224,476 | �� | � | � | 40.3 | %� | � | � | 34.83 | �� | � | � | 287,657 | �� | � | � | 44.7 | %� | � | � | 44.64 | �� | � | � | 247,453 | �� | � | � | 43.4 | %� | � | � | 38.40 | �� |
| � | � |
� |
� | � | � |
� |
� | � | � |
� |
� | � | � |
� |
� | � | � |
� |
� | � | � |
� |
� | � | � |
� |
� | � | � |
� |
� | � | � |
� |
� | � | � |
� |
� | � | � |
� |
� | |
| Total / weighted-average |
� | � | 15,516,604 | �� | � | � | 100.0 | %� | � | $ | 557,648 | �� | � | � | 100.0 | %� | � | $ | 35.94 | �� | � | $ | 643,566 | �� | � | � | 100.0 | %� | � | $ | 41.48 | �� | � | $ | 568,564 | �� | � | � | 100.0 | %� | � | $ | 36.64 | �� |
| � | � |
� |
� | � | � |
� |
� | � | � |
� |
� | � | � |
� |
� | � | � |
� |
� | � | � |
� |
� | � | � |
� |
� | � | � |
� |
� | � | � |
� |
� | � | � |
� |
� | � | � |
� |
� | |
�
�
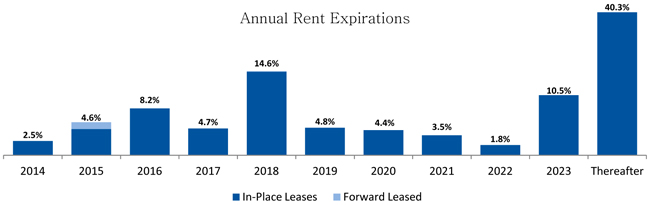
�
| (1) | Current annualized base rent is the monthly contractual rent as of the current quarter ended, or if rent has not yet commenced, the first monthly rent payment due at each rent commencement date, multiplied by 12 months. |
| (2) | Annualized base rent at expiration is the monthly contractual rent as of the date of expiration of the applicable lease (not including any extension option(s)), multiplied by 12 months. |
| (3) | For a definition of �forward leased�, see page 37. |
�
�
EXPIRATIONS BY MARKET
SEPTEMBER 30, 2014
�
�
| � | �� | Leased Square Feet | � | |||||||||||||||||||||||||||||||||||||||||
| Expiration |
�� | Boston | � | �� | Maryland | � | �� | San�Francisco | � | �� | San Diego | � | �� | New�York/ New� Jersey |
� | �� | Cambridge, UK |
� | �� | Pennsylvania | � | �� | North Carolina |
� | �� | Seattle | � | �� | University/ Other |
� | �� | Total | � | |||||||||||
| Month-to-month |
�� | � | ��� | �� | �� | � | 9,937 | �� | �� | � | ��� | �� | �� | � | 1,486 | �� | �� | � | 630 | �� | �� | � | ��� | �� | �� | � | 1,399 | �� | �� | � | ��� | �� | �� | � | ��� | �� | �� | � | 13,292 | �� | �� | � | 26,744 | �� |
| 2014 |
�� | � | 79,683 | �� | �� | � | 46,086 | �� | �� | � | 75,784 | �� | �� | � | 22,050 | �� | �� | � | ��� | �� | �� | � | ��� | �� | �� | � | 1,287 | �� | �� | � | ��� | �� | �� | � | ��� | �� | �� | � | 4,573 | �� | �� | � | 229,463 | �� |
| 2015 |
�� | � | 283,833 | �� | �� | � | 30,963 | �� | �� | � | 105,534 | �� | �� | � | 173,201 | �� | �� | � | 8,433 | �� | �� | � | 24,441 | �� | �� | � | 45,280 | �� | �� | � | 16,492 | �� | �� | � | ��� | �� | �� | � | 136,825 | �� | �� | � | 825,002 | �� |
| 2016 |
�� | � | 416,184 | �� | �� | � | 13,048 | �� | �� | � | 246,012 | �� | �� | � | 43,935 | �� | �� | � | 40,613 | �� | �� | � | 1,103 | �� | �� | � | 17,822 | �� | �� | � | 92,192 | �� | �� | � | 36,885 | �� | �� | � | 244,746 | �� | �� | � | 1,152,540 | �� |
| 2017 |
�� | � | 141,927 | �� | �� | � | 127,288 | �� | �� | � | 170,784 | �� | �� | � | 160,106 | �� | �� | � | 145,581 | �� | �� | � | 28,057 | �� | �� | � | 32,452 | �� | �� | � | 7,853 | �� | �� | � | 11,390 | �� | �� | � | 46,539 | �� | �� | � | 871,977 | �� |
| 2018 |
�� | � | 1,153,536 | �� | �� | � | 72,004 | �� | �� | � | 171,584 | �� | �� | � | 320,607 | �� | �� | � | 24,944 | �� | �� | � | ��� | �� | �� | � | 14,389 | �� | �� | � | 15,117 | �� | �� | � | 42,628 | �� | �� | � | 14,580 | �� | �� | � | 1,829,389 | �� |
| 2019 |
�� | � | 31,363 | �� | �� | � | 269,929 | �� | �� | � | 200,885 | �� | �� | � | 98,611 | �� | �� | � | 82,124 | �� | �� | � | 25,245 | �� | �� | � | 87,497 | �� | �� | � | 8,932 | �� | �� | � | ��� | �� | �� | � | 211,095 | �� | �� | � | 1,015,681 | �� |
| 2020 |
�� | � | 151,368 | �� | �� | � | 130,846 | �� | �� | � | 71,215 | �� | �� | � | 113,251 | �� | �� | � | 28,899 | �� | �� | � | 136,434 | �� | �� | � | 33,029 | �� | �� | � | 19,261 | �� | �� | � | ��� | �� | �� | � | 33,225 | �� | �� | � | 717,528 | �� |
| 2021 |
�� | � | 67,968 | �� | �� | � | 45,434 | �� | �� | � | 230,311 | �� | �� | � | 8,365 | �� | �� | � | 40,914 | �� | �� | � | 160,290 | �� | �� | � | 76,092 | �� | �� | � | 10,060 | �� | �� | � | ��� | �� | �� | � | 4,875 | �� | �� | � | 644,309 | �� |
| 2022 |
�� | � | 42,385 | �� | �� | � | 4,399 | �� | �� | � | 197,726 | �� | �� | � | 17,707 | �� | �� | � | 27,524 | �� | �� | � | ��� | �� | �� | � | 6,146 | �� | �� | � | ��� | �� | �� | � | ��� | �� | �� | � | 50,404 | �� | �� | � | 346,291 | �� |
| 2023 |
�� | � | 563,964 | �� | �� | � | 33,843 | �� | �� | � | 525,667 | �� | �� | � | 219,636 | �� | �� | � | ��� | �� | �� | � | 26,294 | �� | �� | � | ��� | �� | �� | � | ��� | �� | �� | � | ��� | �� | �� | � | 44,068 | �� | �� | � | 1,413,472 | �� |
| Thereafter |
�� | � | 332,220 | �� | �� | � | 1,145,710 | �� | �� | � | 489,373 | �� | �� | � | 671,653 | �� | �� | � | 1,193,034 | �� | �� | � | 110,561 | �� | �� | � | 362,947 | �� | �� | � | 627,874 | �� | �� | � | 192,533 | �� | �� | � | 1,318,303 | �� | �� | � | 6,444,208 | �� |
| �� | � |
� |
� | �� | � |
� |
� | �� | � |
� |
� | �� | � |
� |
� | �� | � |
� |
� | �� | � |
� |
� | �� | � |
� |
� | �� | � |
� |
� | �� | � |
� |
� | �� | � |
� |
� | �� | � |
� |
� | |
| Total |
�� | � | 3,264,431 | �� | �� | � | 1,929,487 | �� | �� | � | 2,484,875 | �� | �� | � | 1,850,608 | �� | �� | � | 1,592,696 | �� | �� | � | 512,425 | �� | �� | � | 678,340 | �� | �� | � | 797,781 | �� | �� | � | 283,436 | �� | �� | � | 2,122,525 | �� | �� | � | 15,516,604 | �� |
| �� | � |
� |
� | �� | � |
� |
� | �� | � |
� |
� | �� | � |
� |
� | �� | � |
� |
� | �� | � |
� |
� | �� | � |
� |
� | �� | � |
� |
� | �� | � |
� |
� | �� | � |
� |
� | �� | � |
� |
� | |
�
�
10 LARGEST TENANTS
SEPTEMBER 30, 2014
�
BioMed�s properties were leased to 365 tenants.
�
| � | �� | Tenant |
�� | Leased Square Feet |
� | �� | Percent�of Leased� Sq�Ft |
� | � | Annualized Base Rent Current�(1) (In�thousands) |
� | �� | Annualized Base Rent per Leased Sq Ft Current |
� | �� | Percent
of Annualized Base Rent Current Total�Portfolio |
� | � | Lease Expiration |
� | ||||||
| 1 |
�� | GlaxoSmithKline plc (2) | �� | � | 924,970 | �� | �� | � | 6.0 | %� | � | $ | 46,281 | �� | �� | $ | 50.04 | �� | �� | � | 8.3 | %� | � | � | June 2026 | �� |
| 2 |
�� | Regeneron Pharmaceuticals, Inc. (3) | �� | � | 1,003,366 | �� | �� | � | 6.5 | %� | � | � | 41,681 | �� | �� | � | 41.54 | �� | �� | � | 7.5 | %� | � | � | Multiple | �� |
| 3 |
�� | Vertex Pharmaceuticals Incorporated (4) | �� | � | 685,286 | �� | �� | � | 4.4 | %� | � | � | 37,115 | �� | �� | � | 54.16 | �� | �� | � | 6.7 | %� | � | � | Multiple | �� |
| 4 |
�� | Beth Israel Deaconess Medical Center, Inc. | �� | � | 362,364 | �� | �� | � | 2.3 | %� | � | � | 26,823 | �� | �� | � | 74.02 | �� | �� | � | 4.8 | %� | � | � | July 2023 | �� |
| 5 |
�� | Sanofi (5) | �� | � | 418,003 | �� | �� | � | 2.7 | %� | � | � | 22,978 | �� | �� | � | 54.97 | �� | �� | � | 4.1 | %� | � | � | Multiple | �� |
| 6 |
�� | Ironwood Pharmaceuticals, Inc. | �� | � | 311,952 | �� | �� | � | 2.0 | %� | � | � | 15,411 | �� | �� | � | 49.40 | �� | �� | � | 2.8 | %� | � | � | February�2018 | �� |
| 7 |
�� | Children�s Hospital Corporation (6) | �� | � | 200,081 | �� | �� | � | 1.3 | %� | � | � | 14,610 | �� | �� | � | 73.02 | �� | �� | � | 2.6 | %� | � | � | May 2023 | �� |
| 8 |
�� | Alexion Pharmaceuticals, Inc. (7) | �� | � | 413,545 | �� | �� | � | 2.7 | %� | � | � | 10,428 | �� | �� | � | 25.22 | �� | �� | � | 1.9 | %� | � | � | Multiple | �� |
| 9 |
�� | The Broad Institute, Inc. (8) | �� | � | 179,196 | �� | �� | � | 1.2 | %� | � | � | 10,233 | �� | �� | � | 57.11 | �� | �� | � | 1.8 | %� | � | � | Multiple | �� |
| 10 |
�� | Baxter Healthcare Corporation | �� | � | 156,804 | �� | �� | � | 1.0 | %� | � | � | 9,095 | �� | �� | � | 58.00 | �� | �� | � | 1.6 | %� | � | � | September�2026 | �� |
| �� | �� | � |
� |
� | �� | � |
� |
� | � | � |
� |
� | �� | � |
� |
� | �� | � |
� |
� | � | |||||
| �� | Total / weighted-average (9) | �� | � | 4,655,567 | �� | �� | � | 30.1 | %� | � | $ | 234,655 | �� | �� | $ | 50.40 | �� | �� | � | 42.1 | %� | � | ||||
| �� | �� | � |
� |
� | �� | � |
� |
� | � | � |
� |
� | �� | � |
� |
� | �� | � |
� |
� | � | |||||
�
| (1) | Based on current annualized base rent. Current annualized base rent is the monthly contractual rent as of the current quarter ended, or if rent has not yet commenced, the first monthly rent payment due at each rent commencement date, multiplied by 12 months. |
| (2) | The Company�s tenant is Human Genome Sciences (HGS), a wholly owned subsidiary of GlaxoSmithKline plc (GSK). GSK has executed a payment guarantee with respect to rental payments due under the Company�s leases with HGS. |
| (3) | On April�3, 2013, the Company entered into a build-to-suit transaction to construct two new buildings pre-leased to Regeneron for a 15 year term totaling approximately 297,000 square feet at Landmark at Eastview. 2,833 square feet will expire in July 2015, 7,568 square feet in January 2017, 314,173 square feet in July 2024 and 678,792 square feet in July 2029. |
| (4) | 81,204 square feet are leased with a subsidiary of Vertex Pharmaceuticals Incorporated. 292,758 square feet expire January 2016, 20,608 square feet expire May 2017, 290,716 square feet expire May 2018 and 81,204 square feet expire January 2019. |
| (5) | 343,000 square feet expire August 2018 and 75,003 square feet expire October 2018. |
| (6) | This tenant guarantees rent on 49,866 square feet leased at the Center for Life Science | Boston. |
| (7) | 3,134 square feet expire January 2018 and 410,411 square feet expire January 2025. |
| (8) | 79,683 square feet will expire in November 2014 and 92,513 square feet in September 2024. |
| (9) | Without regard to any early lease terminations and/or renewal options. |
�
�
SAME PROPERTY ANALYSIS
SEPTEMBER 30, 2014
�
(Dollars in thousands)
�
| � | �� | Three Months Ended | � | |||||||||
| � | �� | 9/30/14 | � | � | 9/30/13 | � | � | Percent�Change | � | |||
| Total Same Property Portfolio (1) |
�� | � | � | |||||||||
| Rentable square feet |
�� | � | 14,119,673 | �� | � | � | 14,119,673 | �� | � | |||
| Percent of total portfolio |
�� | � | 84.0 | %� | � | � | 89.6 | %� | � | |||
| Percent leased |
�� | � | 90.5 | %� | � | � | 88.1 | %� | � | |||
| Revenues: |
�� | � | � | |||||||||
| Rental |
�� | $ | 116,178 | �� | � | $ | 114,482 | �� | � | � | 1.5 | %� |
| Tenant recoveries |
�� | � | 39,161 | �� | � | � | 37,436 | �� | � | � | 4.6 | %� |
| �� | � |
� |
� | � | � |
� |
� | � | � |
� |
� | |
| Total revenues |
�� | � | 155,339 | �� | � | � | 151,918 | �� | � | � | 2.3 | %� |
| Expenses: |
�� | � | � | |||||||||
| Rental operations |
�� | � | 47,132 | �� | � | � | 46,859 | �� | � | � | 0.6 | %� |
| �� | � |
� |
� | � | � |
� |
� | � | � |
� |
� | |
| Same property net operating income (2) |
�� | $ | 108,207 | �� | � | $ | 105,059 | �� | � | � | 3.0 | %� |
| �� | � |
� |
� | � | � |
� |
� | � | � |
� |
� | |
| Less straight line rents, fair-value lease revenue, lease incentive revenue, and bad debt expense |
�� | � | 184 | �� | � | � | (3,949 | )� | � | � | (104.7 | %)� |
| �� | � |
� |
� | � | � |
� |
� | � | � |
� |
� | |
| Same property net operating income - cash basis (2)�(3) |
�� | $ | 108,391 | �� | � | $ | 101,110 | �� | � | � | 7.2 | %� |
| �� | � |
� |
� | � | � |
� |
� | � | � |
� |
� | |
| Rental revenue - cash basis (3) |
�� | $ | 115,266 | �� | � | $ | 109,339 | �� | � | � | 5.4 | %� |
| �� | � |
� |
� | � | � |
� |
� | � | � |
� |
� | |
�
| (1) | The Same Property portfolio includes properties in the total portfolio that were stabilized or in lease up throughout the full quarter in both the current year and the prior year. |
| (2) | For a definition and discussion of net operating income, see page 36. For a quantitative reconciliation of net operating income to net income in accordance with GAAP, see page 15. |
| (3) | Represents rents on a �cash-on-cash� basis. |
�
�
FUTURE LEASE COMMENCEMENTS
SEPTEMBER 30, 2014
�
(Dollars in thousands)
�
| � | �� | Annualized Base Rent (1) | � | |||||||||||||||||||||
| � | �� | Operating�&�Redevelopment | � | �� | Development | � | �� | Total | � | |||||||||||||||
| Expected Commencement Quarter (1) |
�� | GAAP (2) | � | �� | Cash (3) | � | �� | GAAP�(2) | � | �� | Cash (3) | � | �� | GAAP�(2) | � | �� | Cash (3) | � | ||||||
| 4Q14 |
�� | $ | 7,338 | �� | �� | $ | 5,143 | �� | �� | $ | ��� | �� | �� | $ | ��� | �� | �� | $ | 7,338 | �� | �� | $ | 5,143 | �� |
| 1Q15 |
�� | � | 6,853 | �� | �� | � | 5,267 | �� | �� | � | ��� | �� | �� | � | ��� | �� | �� | � | 6,853 | �� | �� | � | 5,267 | �� |
| 2Q15 |
�� | � | 3,320 | �� | �� | � | 4,536 | �� | �� | � | ��� | �� | �� | � | ��� | �� | �� | � | 3,320 | �� | �� | � | 4,536 | �� |
| 3Q15 |
�� | � | 4,780 | �� | �� | � | 8,847 | �� | �� | � | 1,783 | �� | �� | � | ��� | �� | �� | � | 6,564 | �� | �� | � | 8,847 | �� |
| 4Q15 |
�� | � | 202 | �� | �� | � | 1,988 | �� | �� | � | 15,463 | �� | �� | � | 13,182 | �� | �� | � | 15,665 | �� | �� | � | 15,169 | �� |
| 2016 |
�� | � | 375 | �� | �� | � | 1,398 | �� | �� | � | 14,149 | �� | �� | � | 14,993 | �� | �� | � | 14,524 | �� | �� | � | 16,391 | �� |
| �� | � |
� |
� | �� | � |
� |
� | �� | � |
� |
� | �� | � |
� |
� | �� | � |
� |
� | �� | � |
� |
� | |
| �� | $ | 22,868 | �� | �� | $ | 27,179 | �� | �� | $ | 31,395 | �� | �� | $ | 28,175 | �� | �� | $ | 54,264 | �� | �� | $ | 55,353 | �� | |
| �� | � |
� |
� | �� | � |
� |
� | �� | � |
� |
� | �� | � |
� |
� | �� | � |
� |
� | �� | � |
� |
� | |
| � | �� | Leased Square Feet (1) | � | |||||||||||||||||||||
| � | �� | Operating�&�Redevelopment | � | �� | Development | � | �� | Total | � | |||||||||||||||
| Expected Commencement Quarter (1) |
�� | GAAP (2) | � | �� | Cash (3) | � | �� | GAAP�(2) | � | �� | Cash (3) | � | �� | GAAP (2) | � | �� | Cash (3) | � | ||||||
| 4Q14 |
�� | � | 257,464 | �� | �� | � | 189,188 | �� | �� | � | ��� | �� | �� | � | ��� | �� | �� | � | 257,464 | �� | �� | � | 189,188 | �� |
| 1Q15 |
�� | � | 218,242 | �� | �� | � | 195,738 | �� | �� | � | ��� | �� | �� | � | ��� | �� | �� | � | 218,242 | �� | �� | � | 195,738 | �� |
| 2Q15 |
�� | � | 111,830 | �� | �� | � | 142,936 | �� | �� | � | ��� | �� | �� | � | ��� | �� | �� | � | 111,830 | �� | �� | � | 142,936 | �� |
| 3Q15 |
�� | � | 189,316 | �� | �� | � | 322,172 | �� | �� | � | 42,410 | �� | �� | � | ��� | �� | �� | � | 231,726 | �� | �� | � | 322,172 | �� |
| 4Q15 |
�� | � | 8,024 | �� | �� | � | 101,272 | �� | �� | � | 297,000 | �� | �� | � | 297,000 | �� | �� | � | 305,024 | �� | �� | � | 398,272 | �� |
| 2016 |
�� | � | 20,137 | �� | �� | � | 43,387 | �� | �� | � | 530,549 | �� | �� | � | 572,959 | �� | �� | � | 550,686 | �� | �� | � | 616,346 | �� |
| �� | � |
� |
� | �� | � |
� |
� | �� | � |
� |
� | �� | � |
� |
� | �� | � |
� |
� | �� | � |
� |
� | |
| �� | � | 805,013 | �� | �� | � | 994,693 | �� | �� | � | 869,959 | �� | �� | � | 869,959 | �� | �� | � | 1,674,972 | �� | �� | � | 1,864,652 | �� | |
| �� | � |
� |
� | �� | � |
� |
� | �� | � |
� |
� | �� | � |
� |
� | �� | � |
� |
� | �� | � |
� |
� | |
�
| (1) | Current estimates of future lease commencement timing. Actual results may vary from current estimates. Excludes unconsolidated joint ventures. |
| (2) | The annualized GAAP monthly rent (GABR). |
| (3) | The annualized first monthly cash rent payment due (CABR). |
�
�
ACQUISITIONS
SEPTEMBER 30, 2014
�
�
| Acquisitions Detail for 2014: |
�� | Market |
�� | Closing�Date | �� | Rentable Square Feet |
� | �� | Investment | � | �� | Percent Leased at Acquisition |
� | |||
| � | �� | �� | �� | �� | �� | |||||||||||
| Property |
�� | �� | �� | �� | �� | |||||||||||
| � | �� | � | �� | � | �� | � | � | �� | (In�thousands) | � | �� | � | � | |||
| First Quarter 2014 |
�� | �� | �� | �� | �� | |||||||||||
| None |
�� | �� | �� | �� | �� | |||||||||||
| Second Quarter 2014 |
�� | �� | �� | �� | �� | |||||||||||
| 100 College (1) |
�� | University�Related�-�Other | �� | April�4,�2014 | �� | � | 510,419 | �� | �� | $ | 191,000 | �� | �� | � | 99.1 | %� |
| 300 George (2) |
�� | University�Related�-�Other | �� | April 4, 2014 | �� | � | 518,940 | �� | �� | � | 117,000 | �� | �� | � | 98.7 | %� |
| 430 Cambridge Science Center (3) |
�� | Cambridge, UK | �� | May�15,�2014 | �� | � | 42,410 | �� | �� | � | 24,400 | �� | �� | � | 100.0 | %� |
| �� | �� | �� | � |
� |
� | �� | � |
� |
� | �� | � |
� |
� | |||
| Second quarter total (4) |
�� | �� | �� | � | 1,071,769 | �� | �� | $ | 332,400 | �� | �� | � | 98.9 | %� | ||
| Third Quarter 2014 |
�� | �� | �� | �� | �� | |||||||||||
| None |
�� | �� | �� | �� | �� | |||||||||||
| Total 2014 Acquisitions |
�� | �� | �� | � | 1,071,769 | �� | �� | $ | 332,400 | �� | �� | � | 98.9 | %� | ||
| �� | �� | �� | � |
� |
� | �� | � |
� |
� | �� | � |
� |
� | |||
�
| (1) | Investment includes a minority interest of $5.0 million, an assumed construction loan of $21.7 million and approximately $102.3 million in estimated completion costs. |
| (2) | Investment includes a minority interest of $5.0 million and an assumed mortgage note payable of $46.3 million. |
| (3) | Investment includes �11.95�million to be paid upon completion of the building in Q3 2015. |
| (4) | Excludes approximately 2.3�million square feet of estimated potential development resulting from a 99-year ground lease entered into with Drexel University for approximately $18.2 million during the quarter. |
�
�
LEASING ACTIVITY (1)
SEPTEMBER 30, 2014
�
�
| � | � | Leased Square Feet |
� | � | Current Annualized Base�Rent�per Leased Sq Ft |
� | �� | GAAP Annualized Base�Rent�per Leased Sq Ft |
� | �� | Forward-Leased Square Feet |
� | � | Current Annualized� Base Rent�per Forward- Leased� Sq�Ft |
� | �� | GAAP Annualized�Base Rent�per Forward- Leased�Sq�Ft |
� | ||||||
| Leased Square Feet as of June�30, 2014 |
� | � | 15,296,940 | �� | � | �� | �� | � | 233,061 | �� | � | �� | ||||||||||||
| Expirations |
� | � | (385,365 | )� | � | $ | 27.12 | �� | �� | $ | 28.36 | �� | �� | � | �� | |||||||||
| Terminations |
� | � | (106,629 | )� | � | � | 50.32 | �� | �� | � | 56.86 | �� | �� | � | �� | |||||||||
| Forward-lease delivery (2) |
� | � | 103,192 | �� | � | � | 33.74 | �� | �� | � | 33.75 | �� | �� | � | (103,192 | )� | � | $ | 33.74 | �� | �� | $ | 33.75 | �� |
| Renewals and extensions |
� | � | 277,313 | �� | � | � | 28.51 | �� | �� | � | 31.11 | �� | �� | � | �� | |||||||||
| New leases - 1st generation (2) |
� | � | 152,380 | �� | � | � | 39.02 | �� | �� | � | 43.43 | �� | �� | � | �� | |||||||||
| New leases - 2nd generation (2) |
� | � | 178,773 | �� | � | � | 44.10 | �� | �� | � | 48.92 | �� | �� | � | 49,280 | �� | � | � | 59.45 | �� | �� | � | 66.32 | �� |
| � | � |
� |
� | � | �� | �� | � |
� |
� | � | �� | |||||||||||||
| Leased Square Feet as of September�30, 2014 |
� | � | 15,516,604 | �� | � | �� | �� | � | 179,149 | �� | � | �� | ||||||||||||
| � | � |
� |
� | � | �� | �� | � |
� |
� | � | �� | |||||||||||||
�
| � | �� | Three Months Ended | � | |||||||||||||||||
| Leased Square Feet |
�� | 9/30/14 | � | �� | 6/30/14 | � | � | 3/31/14 | � | �� | 12/31/13 | � | �� | 9/30/13 | � | |||||
| Renewals and extensions |
�� | � | 277,313 | �� | �� | � | 319,067 | �� | � | � | 173,117 | �� | �� | � | 89,297 | �� | �� | � | 110,563 | �� |
| New leases |
�� | � | 380,433 | �� | �� | � | 493,152 | �� | � | � | 307,332 | �� | �� | � | 352,541 | �� | �� | � | 229,535 | �� |
| �� | � |
� |
� | �� | � |
� |
� | � | � |
� |
� | �� | � |
� |
� | �� | � |
� |
� | |
| Gross Leasing Activity |
�� | � | 657,746 | �� | �� | � | 812,219 | �� | � | � | 480,449 | �� | �� | � | 441,838 | �� | �� | � | 340,098 | �� |
| �� | � |
� |
� | �� | � |
� |
� | � | � |
� |
� | �� | � |
� |
� | �� | � |
� |
� | |
| Net Absorption (3) |
�� | � | 219,664 | �� | �� | � | (234,891 | )� | � | � | 96,103 | �� | �� | � | 186,657 | �� | �� | � | 111,265 | �� |
| �� | � |
� |
� | �� | � |
� |
� | � | � |
� |
� | �� | � |
� |
� | �� | � |
� |
� | |
�
�
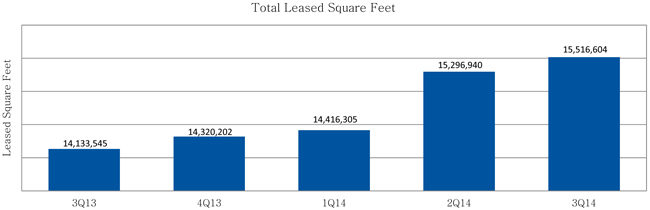
�
| (1) | Leasing activity for leases signed during the periods presented, which may be different than the period of actual occupancy. |
| (2) | For definitions of first and second generation leases and forward-leases, see page 37. |
| (3) | Net absorption is calculated as total square footage of new leases (excluding pre-leased), renewals, and forward-lease deliveries, less expirations and terminated square feet for the given period. |
�
�
TENANT IMPROVEMENTS, LEASING COMMISSIONS AND TENANT CONCESSIONS
SEPTEMBER 30, 2014
�
�
| � | �� | Three Months Ended | � | |||||||||||||||||
| � | �� | 9/30/14 | � | �� | 6/30/14 | � | �� | 3/31/14 | � | �� | 12/31/13 | � | �� | 9/30/13 | � | |||||
| Renewals and Extensions (1) |
�� | �� | �� | �� | �� | |||||||||||||||
| Number of renewals |
�� | � | 14 | �� | �� | � | 16 | �� | �� | � | 10 | �� | �� | � | 7 | �� | �� | � | 13 | �� |
| Square feet |
�� | � | 277,313 | �� | �� | � | 319,067 | �� | �� | � | 173,117 | �� | �� | � | 89,297 | �� | �� | � | 110,563 | �� |
| Tenant improvement costs per square foot (2) |
�� | $ | 1.50 | �� | �� | $ | 1.05 | �� | �� | $ | 19.11 | �� | �� | $ | 5.27 | �� | �� | $ | ��� | �� |
| Leasing commission costs per square foot (2) |
�� | � | 1.46 | �� | �� | � | 2.17 | �� | �� | � | 3.80 | �� | �� | � | 3.99 | �� | �� | � | 0.65 | �� |
| Tenant concession costs per square foot (2)�(3) |
�� | � | ��� | �� | �� | � | 0.37 | �� | �� | � | ��� | �� | �� | � | 0.97 | �� | �� | � | 1.21 | �� |
| �� | � |
� |
� | �� | � |
� |
� | �� | � |
� |
� | �� | � |
� |
� | �� | � |
� |
� | |
| Total tenant improvement, leasing commission, and tenant concession costs psf |
�� | $ | 2.99 | �� | �� | $ | 3.59 | �� | �� | $ | 22.91 | �� | �� | $ | 10.23 | �� | �� | $ | 1.86 | �� |
| �� | � |
� |
� | �� | � |
� |
� | �� | � |
� |
� | �� | � |
� |
� | �� | � |
� |
� | |
| New Leases - 1st Generation (4) |
�� | �� | �� | �� | �� | |||||||||||||||
| Number of leases |
�� | � | 12 | �� | �� | � | 16 | �� | �� | � | 13 | �� | �� | � | 11 | �� | �� | � | 16 | �� |
| Square feet |
�� | � | 152,380 | �� | �� | � | 193,532 | �� | �� | � | 133,811 | �� | �� | � | 63,231 | �� | �� | � | 199,909 | �� |
| Tenant improvement costs per square foot (2) |
�� | $ | 62.99 | �� | �� | $ | 56.63 | �� | �� | $ | 60.47 | �� | �� | $ | 34.00 | �� | �� | $ | 105.63 | �� |
| Leasing commission costs per square foot (2) |
�� | � | 12.60 | �� | �� | � | 5.27 | �� | �� | � | 12.45 | �� | �� | � | 6.97 | �� | �� | � | 9.81 | �� |
| Tenant concession costs per square foot (2)�(3) |
�� | � | 0.31 | �� | �� | � | 7.49 | �� | �� | � | 5.24 | �� | �� | � | 0.77 | �� | �� | � | 19.96 | �� |
| �� | � |
� |
� | �� | � |
� |
� | �� | � |
� |
� | �� | � |
� |
� | �� | � |
� |
� | |
| Total tenant improvement, leasing commission, and tenant concession costs psf |
�� | $ | 75.90 | �� | �� | $ | 69.39 | �� | �� | $ | 78.16 | �� | �� | $ | 41.74 | �� | �� | $ | 135.40 | �� |
| �� | � |
� |
� | �� | � |
� |
� | �� | � |
� |
� | �� | � |
� |
� | �� | � |
� |
� | |
| New Leases - 2nd Generation (4) |
�� | �� | �� | �� | �� | |||||||||||||||
| Number of leases |
�� | � | 21 | �� | �� | � | 28 | �� | �� | � | 36 | �� | �� | � | 16 | �� | �� | � | 8 | �� |
| Square feet |
�� | � | 228,053 | �� | �� | � | 244,536 | �� | �� | � | 173,521 | �� | �� | � | 289,310 | �� | �� | � | 29,626 | �� |
| Tenant improvement costs per square foot (2) |
�� | $ | 87.14 | �� | �� | $ | 37.34 | �� | �� | $ | 103.64 | �� | �� | $ | 34.60 | �� | �� | $ | 0.71 | �� |
| Leasing commission costs per square foot (2) |
�� | � | 12.19 | �� | �� | � | 9.59 | �� | �� | � | 5.88 | �� | �� | � | 9.33 | �� | �� | � | 0.72 | �� |
| Tenant concession costs per square foot (2)�(3) |
�� | � | 8.63 | �� | �� | � | 5.84 | �� | �� | � | 12.63 | �� | �� | � | 4.20 | �� | �� | � | 1.62 | �� |
| �� | � |
� |
� | �� | � |
� |
� | �� | � |
� |
� | �� | � |
� |
� | �� | � |
� |
� | |
| Total tenant improvement, leasing commission, and tenant concession costs psf |
�� | $ | 107.96 | �� | �� | $ | 52.77 | �� | �� | $ | 122.15 | �� | �� | $ | 48.13 | �� | �� | $ | 3.05 | �� |
| �� | � |
� |
� | �� | � |
� |
� | �� | � |
� |
� | �� | � |
� |
� | �� | � |
� |
� | |
| New Leases - Pre-Leased |
�� | �� | �� | �� | �� | |||||||||||||||
| Number of leases |
�� | � | ��� | �� | �� | � | 3 | �� | �� | � | ��� | �� | �� | � | ��� | �� | �� | � | ��� | �� |
| Square feet |
�� | � | ��� | �� | �� | � | 55,084 | �� | �� | � | ��� | �� | �� | � | ��� | �� | �� | � | ��� | �� |
| Tenant improvement costs per square foot (2) |
�� | $ | ��� | �� | �� | $ | 67.75 | �� | �� | $ | ��� | �� | �� | $ | ��� | �� | �� | $ | ��� | �� |
| Leasing commission costs per square foot (2) |
�� | � | ��� | �� | �� | � | 18.29 | �� | �� | � | ��� | �� | �� | � | ��� | �� | �� | � | ��� | �� |
| Tenant concession costs per square foot (2)�(3) |
�� | � | ��� | �� | �� | � | 9.99 | �� | �� | � | ��� | �� | �� | � | ��� | �� | �� | � | ��� | �� |
| �� | � |
� |
� | �� | � |
� |
� | �� | � |
� |
� | �� | � |
� |
� | �� | � |
� |
� | |
| Total tenant improvement, leasing commission, and tenant concession costs psf |
�� | $ | ��� | �� | �� | $ | 96.03 | �� | �� | $ | ��� | �� | �� | $ | ��� | �� | �� | $ | ��� | �� |
| �� | � |
� |
� | �� | � |
� |
� | �� | � |
� |
� | �� | � |
� |
� | �� | � |
� |
� | |
| Total |
�� | �� | �� | �� | �� | |||||||||||||||
| Number of renewals/leases |
�� | � | 47 | �� | �� | � | 63 | �� | �� | � | 59 | �� | �� | � | 34 | �� | �� | � | 37 | �� |
| Square feet |
�� | � | 657,746 | �� | �� | � | 812,219 | �� | �� | � | 480,449 | �� | �� | � | 441,838 | �� | �� | � | 340,098 | �� |
| Tenant improvement costs per square foot (2) |
�� | $ | 45.44 | �� | �� | $ | 29.74 | �� | �� | $ | 61.16 | �� | �� | $ | 28.59 | �� | �� | $ | 62.15 | �� |
| Leasing commission costs per square foot (2) |
�� | � | 7.76 | �� | �� | � | 6.24 | �� | �� | � | 6.96 | �� | �� | � | 7.92 | �� | �� | � | 6.04 | �� |
| Tenant concession costs per square foot (2)�(3) |
�� | � | 3.07 | �� | �� | � | 4.37 | �� | �� | � | 6.02 | �� | �� | � | 3.06 | �� | �� | � | 12.26 | �� |
| �� | � |
� |
� | �� | � |
� |
� | �� | � |
� |
� | �� | � |
� |
� | �� | � |
� |
� | |
| Total tenant improvement, leasing commission, and tenant concession costs psf |
�� | $ | 56.28 | �� | �� | $ | 40.35 | �� | �� | $ | 74.14 | �� | �� | $ | 39.57 | �� | �� | $ | 80.45 | �� |
| �� | � |
� |
� | �� | � |
� |
� | �� | � |
� |
� | �� | � |
� |
� | �� | � |
� |
� | |
�
| (1) | Does not include retained tenants that have relocated to new space or expanded into new space. |
| (2) | Based on management estimates. Assumes all tenant improvement, leasing commission, and tenant concession costs are paid in the calendar year in which the lease is executed, which may be different than the year in which they are actually paid. |
| (3) | Includes both rent concessions due to free or discounted rent periods and lease incentives paid to tenants. |
| (4) | Includes forward-leasing activity and retained tenants that have relocated to new space or expanded into new space within the Company�s portfolio. For definitions of first and second generation leases, see page 37. |
�
�
NON-GAAP FINANCIAL MEASURE DEFINITIONS
SEPTEMBER 30, 2014
�
This document includes certain non-GAAP financial measures that management believes are helpful in understanding our business, as further described below. Our definition and calculation of non-GAAP financial measures may differ from those of other REITs, and therefore, may not be comparable. The non-GAAP measures should not be considered an alternative to net income as an indicator of our performance and should be considered only a supplement to cash flows from operating, investing or financing activities as a measure of liquidity, computed in accordance with GAAP.
FFO, CFFO and AFFO
We present funds from operations, or FFO, FFO excluding acquisition-related expenses, or CFFO, and adjusted funds from operations, or AFFO, available to common shares and OP units because we consider them to be important supplemental measures of our operating performance and believe they are frequently used by securities analysts, investors and other interested parties in the evaluation of REITs, many of which present FFO, CFFO and AFFO when reporting their results.
FFO, CFFO and AFFO are intended to exclude GAAP historical cost depreciation and amortization of real estate and related assets, which assumes that the value of real estate assets diminishes ratably over time. Historically, however, real estate values have risen or fallen with market conditions. Because FFO, CFFO and AFFO exclude depreciation and amortization unique to real estate, gains and losses from property dispositions and extraordinary items, they provide performance measures that, when compared year over year, reflect the impact to operations from trends in occupancy rates, rental rates, operating costs, development activities and interest costs, providing perspective not immediately apparent from net income. We compute FFO in accordance with standards established by the Board of Governors of the National Association of Real Estate Investment Trusts, or NAREIT. As defined by NAREIT, FFO represents net income (computed in accordance with GAAP), excluding gains (or losses) from sales of depreciable property, impairment charges on depreciable real estate, real estate related depreciation and amortization (excluding amortization of loan origination costs) and after adjustments for unconsolidated partnerships and joint ventures.
We calculate CFFO by adding acquisition-related expenses to FFO. We calculate AFFO by adding to CFFO: (a)�non-cash revenues and expenses, (b)�recurring capital expenditures and second generation tenant improvements and (c)�leasing commissions.
Our computations may differ from the methodologies for calculating FFO, CFFO and AFFO utilized by other equity REITs and, accordingly, may not be comparable to such other REITs. Further, FFO, CFFO and AFFO do not represent amounts available for management�s discretionary use because of needed capital replacement or expansion, debt service obligations, or other commitments and uncertainties. FFO, CFFO and AFFO should not be considered alternatives to net income/(loss) (computed in accordance with GAAP) as indicators of our financial performance or to cash flow from operating activities (computed in accordance with GAAP) as indicators of our liquidity, nor are they indicative of funds available to fund our cash needs, including our ability to pay dividends or make distributions. FFO, CFFO and AFFO should be considered only as supplements to net income computed in accordance with GAAP as measures of our operations.
Earnings before Interest, Taxes, Depreciation and Amortization (EBITDA), and Adjusted EBITDA
EBITDA is defined as earnings before interest, taxes, depreciation and amortization. We calculate Adjusted EBITDA by adding to EBITDA: (a)�noncontrolling interests in our operating partnership, (b)�non-cash adjustments for securities, (c)�gains or losses from sales of real estate and (d)�acquisition-related expenses, and by subtracting from EBITDA (x)�lease termination fees related to 4570 Executive Drive, and (y)�net realized gains on investments in securities for the three months ended March�31, 2014. Management uses EBITDA and Adjusted EBITDA as indicators of our ability to incur and service debt. In addition, we consider EBITDA and Adjusted EBITDA to be appropriate supplemental measures of our performance because they eliminate depreciation and interest, which permits investors to view income from operations without the impact of non-cash depreciation or the cost of debt. However, because EBITDA and Adjusted EBITDA are calculated before recurring cash charges including interest expense and taxes, and are not adjusted for capital expenditures or other recurring cash requirements of our business, their utility is limited.
Coverage Ratios
We present interest and fixed charge ratios as supplemental liquidity measures. Management uses these ratios as indicators of our financial flexibility to service current interest expense and debt amortization from current cash net operating income. In addition, we believe that these coverage ratios represent common metrics used by securities analysts, investors and other interested parties to evaluate our ability to service fixed cash payments. However, because these ratios are derived from Adjusted EBITDA, their utility is limited by the same factors that limit the usefulness of Adjusted EBITDA as a liquidity measure.
Net Operating Income (NOI)
We use net operating income, or NOI, as a performance measure and believe NOI provides useful information to investors regarding our financial condition and results of operations because it reflects only those income and expense items that are incurred at the property level. We compute NOI by adding or subtracting certain items from net income, noncontrolling interest in the operating partnership, gains/losses from investment in unconsolidated partnerships, interest expense, interest income, depreciation and amortization and general and administrative expenses. NOI presented by us may not be comparable to NOI reported by other REITs that define NOI differently. NOI should not be considered as an alternative to net income as an indication of our performance or to cash flows as a measure of liquidity or ability to make distributions.
�
�
DEFINITIONS
SEPTEMBER 30, 2014
�
Property Status
Redevelopment
Represents properties that we are currently preparing for their intended use, and accordingly are capitalizing interest and other costs as of the end of the quarter.
Pre-development
Represents development properties that are engaged in activities related to planning, entitlement or other preparations for future construction.
Development
Represents properties that we are currently developing through ground up construction.
Development Potential
Represents estimates of the additional rentable square footage that we could put into service if management made the strategic election to pursue additional development.
Lease Type
First Generation
Leases on space which, in management�s evaluation, require significant improvements to prepare or condition the premises for its intended purpose or enhance the value of the property. This generally includes capital expenditures for development, redevelopment or repositioning a property.
Second Generation
Leases which are not considered by management to be first generation leases.
Pre-Leased
Leases on space that, prior to the execution, was classified as Pre-Development or Development Potential and is expected to enter the Company�s operating portfolio at a future date.
Forward-Leased
Leases on space which is currently occupied and which are expected to commence upon vacancy of the existing tenants.
Recurring Capital Expenditures
Recurring capital expenditures exclude (1)�items associated with the expansion of a building or its improvements, (2)�renovations to a building which change the underlying classification of the building, incurred to prepare or condition the premises for its intended purpose (for example, from office to laboratory) or (3)�capital improvements that represent an addition to the property rather than the replacement of property, plant or equipment.
Bond Covenants
Calculated in accordance with the covenants contained in the indenture that governs the terms of the Company�s unsecured senior notes due 2020 and supplemental and base indentures that govern the terms of the Company�s unsecured senior notes due 2016, unsecured senior notes due 2019, and unsecured senior notes due 2022, which are included as exhibits to the Company�s Forms 8-K filed with the SEC on April�30, 2010,�March�30, 2011,�June�28, 2012, and April�23, 2014, respectively. The covenants for the unsecured senior notes due 2020, unsecured senior notes due 2016, unsecured senior notes due 2019, and unsecured senior notes due 2022 are identical, except that the unencumbered total asset value definition for the unsecured senior notes due 2020 includes investments in unconsolidated partnerships accounted for under the equity method of accounting, whereas the unencumbered total asset value definition for the unsecured senior notes due 2016, unsecured senior notes due 2019, and unsecured senior notes due 2022 excludes such investments in unconsolidated partnerships.
�
Serious News for Serious Traders! Try StreetInsider.com Premium Free!
You May Also Be Interested In
- Lafayette - Fusion of music, theater and gastronomic pleasure
- Max Stock Limited announces immediate report of updated interested party holdings
- University of Phoenix College of Doctoral Studies Releases Mother’s Day White Paper on Skills Findings of Mothers Overcome More™ Report
Create E-mail Alert Related Categories
SEC FilingsSign up for StreetInsider Free!
Receive full access to all new and archived articles, unlimited portfolio tracking, e-mail alerts, custom newswires and RSS feeds - and more!
