

Form 8-K BENCHMARK ELECTRONICS For: Jul 23
 Tweet
Tweet Share
Share
UNITED STATES
SECURITIES AND EXCHANGE COMMISSION
Washington, D.C. 20549
FORM 8-K
CURRENT REPORT
Pursuant to Section 13 or 15(d) of
the Securities Exchange Act of 1934
Date of Report (Date of earliest event reported): July 23, 2015
BENCHMARK ELECTRONICS, INC.
(Exact name of registrant as specified in its charter)
|
Texas (State or other jurisdiction of incorporation) |
1-10560 (Commission File Number) |
74-2211011 (I.R.S. Employer Identification No.) |
3000 Technology Drive, Angleton, Texas 77515
(Address of principal executive offices) (Zip code)
Registrant’s telephone number, including area code: (979) 849-6550
Check the appropriate box below if the Form 8-K filing is intended to simultaneously satisfy the filing obligation of the registrant under any of the following provisions (see General Instruction A.2. below):
[ ] Written communications pursuant to Rule 425 under the Securities Act
(17 CFR 230.425)
[ ] Soliciting material pursuant to Rule 14a-12 under the Exchange Act
(17 CFR 240.14a-12)
[ ] Pre-commencement communications pursuant to Rule 14d-2(b) under the
Exchange Act (17 CFR 240.14d-2(b))
[ ] Pre-commencement communications pursuant to Rule 13e-4(c) under the
Exchange Act (17 CFR 240.13e-4(c))
Item 2.02. Results of Operations and Financial Condition.
On July 23, 2015, we issued a press release announcing our results of operations for the quarter ended June 30, 2015 and held an earnings conference call. Copies of the press release and presentation slides used in connection with the conference call are attached as Exhibit 99.1 and Exhibit 99.2 to this report and are hereby incorporated herein by reference.
Item 9.01. Financial Statements and Exhibits.
(d) Exhibits
Exhibit 99.1 Press release
Exhibit 99.2 Presentation slides
SIGNATURE
Pursuant to the requirements of the Securities Exchange Act of 1934, the registrant has duly caused this report to be signed on its behalf by the undersigned hereunto duly authorized.
|
|
BENCHMARK ELECTRONICS, INC. |
|
Dated: July 23, 2015 |
By: /s/ Donald F. Adam |
|
|
Donald F. Adam |
|
|
Chief Financial Officer |
|
|
|
|
EXHIBIT INDEX |
||
|
|
|
|
|
Exhibit |
|
|
|
Number |
|
Description of Exhibit |
|
|
|
|
|
99.1 |
|
Press Release |
|
99.2 |
|
Presentation slides |
Exhibit 99.1
FOR IMMEDIATE RELEASE
BENCHMARK ELECTRONICS REPORTS SECOND QUARTER RESULTS
· Revenue of $664 million at the high end of guidance
· Non-GAAP operating margin increased 40 basis points quarter-over-quarter
· Strong operating cash flow of $52 million
· Returned $19 million to shareholders through share repurchases
ANGLETON, TX, July 23, 2015 – Benchmark Electronics, Inc. (NYSE: BHE) today announced financial results for the quarter ended June 30, 2015.
|
|
|
|
Three Months Ended |
|
||||||
|
|
|
|
Jun 30, |
|
|
Mar 31, |
|
|
Jun 30, |
|
|
|
|
2015 |
|
|
2015 |
|
|
2014 |
|
|
|
Net sales (in millions) |
|
$664 |
|
|
$621 |
|
|
$717 |
|
|
|
Net income (in millions) |
|
$21 |
|
|
$14 |
|
|
$22 |
|
|
|
Net income – non-GAAP (in millions) |
|
$22 |
|
|
$18 |
|
|
$23 |
|
|
|
Diluted EPS |
|
$0.40 |
|
|
$0.27 |
|
|
$0.41 |
|
|
|
Diluted EPS – non-GAAP |
|
$0.42 |
|
|
$0.34 |
|
|
$0.43 |
|
|
|
Operating margin (%) |
|
3.9% |
|
|
3.0% |
|
|
3.8% |
|
|
|
Operating margin – non-GAAP (%) |
|
4.2% |
|
|
3.8% |
|
|
4.1% |
|
|
“Benchmark performed well, as evidenced by our 4.2% non-GAAP operating margin and revenue at the high end of our previously announced guidance range,” said Gayla Delly, Benchmark’s President and CEO. “Despite broad variability in end-market demand, consistent execution resulted in year-over-year revenue increases in the medical and test & instrumentation sectors where we have had strong new program bookings in the last 12 months. We also experienced higher demand during the quarter from computing and telecom customers.”
“Second quarter new program bookings should result in annualized revenue of $110-130 million when fully launched within the next 12-18 months. Bookings again aligned well with our focus on early engineering engagement and long-term manufacturing solutions for customers in both higher growth and traditional markets.”
“Benchmark returned $19 million to shareholders through share repurchases during the second quarter, and a total of $66 million over the last 12 months. We continue to have a strong balance sheet and the financial flexibility to simultaneously repurchase shares, reinvest in the business, and support strategic growth initiatives.”
Delly concluded, “We remain focused on our key strategic priorities that drive value for our customers and shareholders, including diversification of our portfolio towards higher margin programs, strong execution linked to lean and operational initiatives, and working capital
management. Our results this quarter show continued progress in each of these long-term objectives.”
Second Quarter 2015 Financial Highlights
· Cash flows from operating activities were $52 million
· Cash and cash equivalents were $409 million at June 30, 2015
· Accounts receivable were $501 million at June 30, 2015; calculated days sales outstanding were 68 days compared to 71 days at March 31, 2015
· Inventories were $445 million at June 30, 2015; inventory turns were 5.5 times compared to 5.3 at March 31, 2015
· Restructuring charges and integration costs totaled $2 million
The cash conversion cycle improved by eight days from the previous quarter driven by improvements in receivables, payables and inventory. Benchmark expects further improvements throughout the year.
Second Quarter 2015 Industry Sector Update
The following table sets forth revenue by industry sector for the referenced quarters.
|
|
|
Jun 30, |
|
Mar 31, |
|
Jun 30, |
|
|
|
|
2015 |
|
2015 |
|
2014 |
|
|
Industrial Controls |
30 |
% |
32 |
% |
29 |
% |
|
|
Telecommunications |
27 |
|
27 |
|
29 |
|
|
|
Computing |
20 |
|
19 |
|
21 |
|
|
|
Medical |
14 |
|
13 |
|
11 |
|
|
|
Test & Instrumentation |
9 |
|
9 |
|
10 |
|
|
|
|
|
100 |
% |
100 |
% |
100 |
% |
|
|
|
|
|
|
|
|
|
Revenues across all sectors improved quarter-over-quarter. Revenues from Industrial Controls benefitted from the positive impact of new program introductions, offsetting weaker demand for programs related to energy markets. Telecommunications and Computing customer revenues improved with strong sales in the final month of the quarter. Medical and Test & Instrumentation grew at a healthy pace with the successful qualification of new products.
Second Quarter 2015 Bookings Update
· New program bookings were $110-130 million
· 13 engineering awards supporting early engagement opportunities
· 29 manufacturing wins across all market sectors
Margin Improvement Initiatives
Benchmark continues to diversify its portfolio into higher margin business sectors and pursue lean and operational excellence initiatives. Improved operating margins reflect the benefits of these programs and the Company expects further benefits to accrue over time. Benchmark remains committed to achieving its long-term goal of a 4.5% operating margin.
Capital Allocation
· Second quarter 2015 common share repurchases totaled $19 million or 0.8 million shares
· Amount remaining on current share repurchase program is $69 million
· Over the past three years, more than 50% of free cash flows returned to shareholders through buybacks
In addition to ongoing share repurchases, Benchmark has spent $8 million in the second quarter and $25 million year-to-date on capital expenditures related to improving operations and expanding capabilities for customers. For the full year, capital expenditures are expected to range from $40-50 million.
Third Quarter 2015 Outlook
· Revenue between $635-$665 million
· Diluted earnings per share between $0.38-$0.42 (excluding restructuring charges)
Second Quarter 2015 Results Conference Call Details
A conference call hosted by Benchmark management will be held today at 10:00 am (Central Time) to discuss the financial results of the Company and its future outlook. This call will be broadcast via the internet and may be accessed by logging on to the Company’s website at www.bench.com.
About Benchmark Electronics, Inc.
Benchmark provides integrated manufacturing, design and engineering services to original equipment manufacturers of industrial control equipment (including equipment for the aerospace and defense industries), telecommunication equipment, computers and related products for business enterprises, medical devices, and test and instrumentation products. Benchmark’s global operations include facilities in seven countries, and its common shares trade on the New York Stock Exchange under the symbol BHE.
For More Information, Please Contact:
Lisa K. Weeks, VP of Strategy & Investor Relations
979-849-6550 (ext. 1361) or [email protected]
Non-GAAP Financial Measures
This press release includes financial measures for earnings and earnings per share that exclude certain items and therefore do not follow U.S. generally accepted accounting principles (GAAP). A detailed reconciliation between the GAAP results and results excluding special items (non-GAAP) is included at the end of this press release. Management discloses non-GAAP information to provide investors with additional information to analyze the Company’s performance and underlying trends. Management uses non-GAAP measures of net income and earnings per share that exclude certain items in order to better assess operating performance and help investors compare results with our previous guidance. Our non-GAAP information is not necessarily comparable to non-GAAP information used by other companies. Non-GAAP information should not be viewed as a substitute for, or superior to, net income or other data prepared in accordance with GAAP as measures of our profitability or liquidity. Users of this financial information should consider the types of events and transactions for which adjustments have been made.
Forward-Looking Statements
This press release contains certain forward-looking statements within the scope of the Securities Act of 1933 and the Securities Exchange Act of 1934. The words “expect,” “estimate,” “anticipate,” “predict,” “goals” and similar terms, and the negatives thereof, often identify forward-looking statements, which are not limited to historical facts. Our forward-looking statements include, among other things, those relating to future revenues from new program bookings, share repurchases, capital investment, strategic growth initiatives, cash management, operating margins, revenues, earnings per share, and other statements, express or implied, concerning: future operating results or the ability to generate sales, income or cash flow; and Benchmark’s business and growth strategies, including expected internal growth and performance goals. Although Benchmark believes these statements are based upon reasonable assumptions, they involve risks and uncertainties relating to our operations, markets and business environment generally. If one or more of these risks or uncertainties materialize, or underlying assumptions prove incorrect, actual outcomes may vary materially from those indicated.
All forward-looking statements included in this release are based upon information available to Benchmark as of the date of this release, and the Company assumes no obligation to update them. Readers are advised to consult further disclosures on related subjects, particularly in Item 1A, “Risk Factors” of the Company’s Annual Report on Form 10-K for the year ended December 31, 2014, in its other filings with the Securities and Exchange Commission and in its press releases.
###
|
Benchmark Electronics, Inc. and Subsidiaries |
||||||||||||
|
|
|
|
|
|
|
|
|
|
|
|
|
|
|
Reconciliation of GAAP to Non-GAAP Financial Results |
||||||||||||
|
(Amounts in Thousands, Except Per Share Data) |
||||||||||||
|
(UNAUDITED) |
||||||||||||
|
|
|
|
|
|
|
|
|
|
|
|
|
|
|
|
|
|
Three Months Ended |
|
|
Six Months Ended |
||||||
|
|
|
|
Jun 30, |
|
Mar 31, |
|
Jun 30, |
|
|
June 30, |
||
|
|
|
|
2015 |
|
2015 |
|
2014 |
|
|
2015 |
|
2014 |
|
|
|
|
|
|
|
|
|
|
|
|
|
|
|
Income from operations (GAAP) |
$ |
26,208 |
$ |
18,708 |
$ |
27,144 |
|
$ |
44,916 |
$ |
49,576 |
|
|
Restructuring charges and integration costs |
|
1,588 |
|
4,869 |
|
1,907 |
|
|
6,457 |
|
4,016 |
|
|
Thailand flood-related items, net of insurance |
|
- |
|
- |
|
- |
|
|
- |
|
(1,571) |
|
|
Non-GAAP income from operations |
$ |
27,796 |
$ |
23,577 |
$ |
29,051 |
|
$ |
51,373 |
$ |
52,021 |
|
|
|
|
|
|
|
|
|
|
|
|
|
|
|
|
|
|
|
|
|
|
|
|
|
|
|
|
|
|
|
|
|
|
|
|
|
|
|
|
|
|
|
|
Net income (GAAP) |
$ |
21,210 |
$ |
14,205 |
$ |
22,150 |
|
$ |
35,415 |
$ |
41,275 |
|
|
Restructuring charges and integration costs, |
|
|
|
|
|
|
|
|
|
|
|
|
|
net of tax |
|
772 |
|
3,595 |
|
1,243 |
|
|
4,368 |
|
2,626 |
|
|
Thailand flood-related items, net of insurance |
|
|
|
|
|
|
|
|
|
|
|
|
|
and tax |
|
- |
|
- |
|
- |
|
|
- |
|
(1,263) |
|
|
Non-GAAP net income |
$ |
21,982 |
$ |
17,800 |
$ |
23,393 |
|
$ |
39,783 |
$ |
42,638 |
|
|
|
|
|
|
|
|
|
|
|
|
|
|
|
|
|
|
|
|
|
|
|
|
|
|
|
|
|
|
Earnings per share: (GAAP) |
|
|
|
|
|
|
|
|
|
|
|
|
|
|
Basic |
$ |
0.41 |
$ |
0.27 |
$ |
0.41 |
|
$ |
0.68 |
$ |
0.77 |
|
|
Diluted |
$ |
0.40 |
$ |
0.27 |
$ |
0.41 |
|
$ |
0.67 |
$ |
0.76 |
|
|
|
|
|
|
|
|
|
|
|
|
|
|
|
Earnings per share: (Non-GAAP) |
|
|
|
|
|
|
|
|
|
|
|
|
|
|
Basic |
$ |
0.42 |
$ |
0.34 |
$ |
0.43 |
|
$ |
0.76 |
$ |
0.79 |
|
|
Diluted |
$ |
0.42 |
$ |
0.34 |
$ |
0.43 |
|
$ |
0.75 |
$ |
0.78 |
|
|
|
|
|
|
|
|
|
|
|
|
|
|
|
Weighted-average number of shares used in |
|
|
|
|
|
|
|
|
|
|
||
|
calculating earnings per share: |
|
|
|
|
|
|
|
|
|
|
||
|
|
Basic |
|
52,180 |
|
52,463 |
|
53,826 |
|
|
52,321 |
|
53,738 |
|
|
Diluted |
|
52,671 |
|
53,045 |
|
54,405 |
|
|
52,884 |
|
54,394 |
|
Benchmark Electronics, Inc. and Subsidiaries |
|||||||||||
|
|
|
|
|
|
|
|
|
|
|
|
|
|
Consolidated Statements of Income |
|||||||||||
|
(Amounts in Thousands, Except Per Share Data) |
|||||||||||
|
(UNAUDITED) |
|||||||||||
|
|
|||||||||||
|
|
|
|
Three Months Ended |
|
|
Six Months Ended |
|||||
|
|
|
|
June 30, |
|
|
June 30, |
|||||
|
|
|
2015 |
|
2014 |
|
|
2015 |
|
2014 |
||
|
Sales |
$ |
664,038 |
$ |
716,868 |
|
$ |
1,284,963 |
$ |
1,356,212 |
||
|
Cost of sales |
|
608,322 |
|
659,117 |
|
|
1,177,468 |
|
1,247,338 |
||
|
|
Gross profit |
|
55,716 |
|
57,751 |
|
|
107,495 |
|
108,874 |
|
|
Selling, general and administrative expenses |
|
27,920 |
|
28,700 |
|
|
56,122 |
|
56,853 |
||
|
Restructuring charges and integration costs |
|
1,588 |
|
1,907 |
|
|
6,457 |
|
4,016 |
||
|
Thailand flood-related items, net of insurance |
|
- |
|
- |
|
|
- |
|
(1,571) |
||
|
|
Income from operations |
|
26,208 |
|
27,144 |
|
|
44,916 |
|
49,576 |
|
|
Interest expense |
|
(497) |
|
(473) |
|
|
(932) |
|
(949) |
||
|
Interest income |
|
293 |
|
668 |
|
|
725 |
|
1,183 |
||
|
Other income (expense), net |
|
596 |
|
99 |
|
|
(461) |
|
125 |
||
|
|
Income before income taxes |
|
26,600 |
|
27,438 |
|
|
44,248 |
|
49,935 |
|
|
Income tax expense |
|
5,390 |
|
5,288 |
|
|
8,833 |
|
8,660 |
||
|
|
Net income |
$ |
21,210 |
$ |
22,150 |
|
$ |
35,415 |
$ |
41,275 |
|
|
|
|
|
|
|
|
|
|
|
|
|
|
|
Earnings per share: |
|
|
|
|
|
|
|
|
|
||
|
|
Basic |
$ |
0.41 |
$ |
0.41 |
|
$ |
0.68 |
$ |
0.77 |
|
|
|
Diluted |
$ |
0.40 |
$ |
0.41 |
|
$ |
0.67 |
$ |
0.76 |
|
|
|
|
|
|
|
|
|
|
|
|
|
|
|
Weighted-average number of shares used in calculating |
|
|
|
|
|
|
|
|
|||
|
earnings per share: |
|
|
|
|
|
|
|
|
|||
|
|
Basic |
|
52,180 |
|
53,826 |
|
|
52,321 |
|
53,738 |
|
|
|
Diluted |
|
52,671 |
|
54,405 |
|
|
52,884 |
|
54,394 |
|
|
Benchmark Electronics, Inc. and Subsidiaries |
||||||||
|
|
|
|
|
|
|
|
|
|
|
Condensed Consolidated Balance Sheets |
||||||||
|
(in thousands) |
||||||||
|
|
|
|
|
|
|
June 30, |
|
December 31, |
|
|
|
|
|
|
|
2015 |
|
2014 |
|
|
|
|
|
|
|
(unaudited) |
|
|
|
Assets |
|
|
|
|
||||
|
|
Current assets: |
|
|
|
|
|||
|
|
|
Cash and cash equivalents |
$ |
409,315 |
$ |
427,376 |
||
|
|
|
Accounts receivable, net |
|
500,713 |
|
520,389 |
||
|
|
|
Inventories |
|
444,652 |
|
401,261 |
||
|
|
|
Other current assets |
|
44,876 |
|
39,527 |
||
|
|
|
|
|
Total current assets |
|
1,399,556 |
|
1,388,553 |
|
|
Long-term investments |
|
924 |
|
1,008 |
|||
|
|
Property, plant and equipment, net |
|
185,535 |
|
190,180 |
|||
|
|
Goodwill and other, net |
|
96,486 |
|
99,148 |
|||
|
|
|
|
|
Total assets |
$ |
1,682,501 |
$ |
1,678,889 |
|
|
|
|
|
|
|
|
|
|
|
Liabilities and Shareholders’ Equity |
|
|
|
|
||||
|
|
Current liabilities: |
|
|
|
|
|||
|
|
|
Current installments of capital lease obligations |
$ |
724 |
$ |
676 |
||
|
|
|
Accounts payable |
|
286,379 |
|
289,786 |
||
|
|
|
Accrued liabilities |
|
73,009 |
|
68,636 |
||
|
|
|
|
|
Total current liabilities |
|
360,112 |
|
359,098 |
|
|
Capital lease obligations, less current installments |
|
8,470 |
|
8,845 |
|||
|
|
Other long-term liabilities |
|
19,593 |
|
19,906 |
|||
|
|
Shareholders’ equity |
|
1,294,326 |
|
1,291,040 |
|||
|
|
|
|
|
Total liabilities and shareholders’ equity |
$ |
1,682,501 |
$ |
1,678,889 |

Second Quarter 2015 July 23, 2015 Earnings Release Conference Call

design develop deliver advanced technology 2 Forward - Looking Statements This document contains forward - looking statements within the scope of the Securities Act of 1933 and the Securities Exchange Act of 1934 . The words “expect,” “estimate,” “anticipate,” “predict ” and similar expressions, and the negatives thereof, often identify forward - looking statements, which are not limited to historical facts . Our forward - looking statements include, among other things : future revenue estimates based on new program bookings ; guidance for the third quarter of 2015 relating to sales, operating margin, tax rate, and earnings per share ; other statements, express or implied, concerning future operating results or margins, the ability to generate sales, income or cash flow, and Benchmark’s business and growth strategies, including expected internal growth and performance goals . Although Benchmark believes these statements are based upon reasonable assumptions, they involve risks and uncertainties relating to our operations, markets and business environment generally . If one or more of these risks or uncertainties materialize, or underlying assumptions prove incorrect, actual outcomes may vary materially from those indicated . All forward - looking statements included in this document are based upon information available to Benchmark as of the date of this document, and the Company assumes no obligation to update them . Readers are advised to consult further disclosures on related subjects, particularly in Item 1 A, “Risk Factors” of the Company’s Annual Report on Form 10 - K for the year ended December 31 , 2014 , in its other filings with the Securities and Exchange Commission and in its press releases . This document includes certain financial measures, such as earnings and earnings per share, that exclude certain items and therefore are not in accordance with generally accepted accounting principles (“GAAP”) . A detailed reconciliation between GAAP results and results excluding special items (“non - GAAP”) is included in our earnings release and in the Appendix of this document .

design develop deliver advanced technology 3 ▪ Revenue of $664 million at the high end of guidance range ▪ Non - GAAP operating margin at 4.2% - a 40 basis point quarter - over - quarter and 10 basis point year - over - year improvement ▪ Generated non - GAAP EPS of $0.42 ▪ Strong operating cash flow of $52 million ▪ Returned $19 million to shareholders through share repurchases Second Quarter 2015 Highlights

design develop deliver advanced technology 4 Portfolio Trends Traditional Market Revenue ▪ Q2 sales in traditional markets driven by seasonality and stronger customer demand ▪ H igher growth markets >50% of sales for the third straight quarter Higher Growth Market Revenue (Computing and Telecom) 3 - Year CAGR = 5% 3 - Year CAGR = 10% (Industrial, Medical and T&I)

design develop deliver advanced technology 5 Second Quarter 2015 New Business Wins Q2 2015 Number of New Business Wins by Segment ▪ Q2 2015: 42 new business bookings, including 13 engineering projects ▪ E stimated annual revenue run rate between $110 - 130 million Quarterly Estimated Annual Revenue Run Rate for New Business Wins

design develop deliver advanced technology 6 Second Quarter 2015 Financial Summary (In millions, except EPS) Jun 30, 2015 Mar 31, 2015 Jun 30, 2014 Net Sales $664.0 $620.9 $716.9 Net Income – GAAP $21.2 $14.2 $22.2 Net Income – non - GAAP $22.0 $17.8 $23.4 Diluted EPS – GAAP $0.40 $0.27 $0.41 Diluted EPS – non - GAAP $0.42 $0.34 $0.43 Operating Margin – GAAP 3.9% 3.0% 3.8% Operating Margin – non - GAAP 4.2% 3.8% 4.1% Effective Tax Rate – non - GAAP 22.0% 20.9% 20.3% For the Three Months Ended Guidance Provided for the June 30, 2015 Quarter: ▪ Revenue (in millions) $635 – $665 Results within Guidance ▪ Diluted EPS – non - GAAP $0.37 – $0.41 Results above Guidance
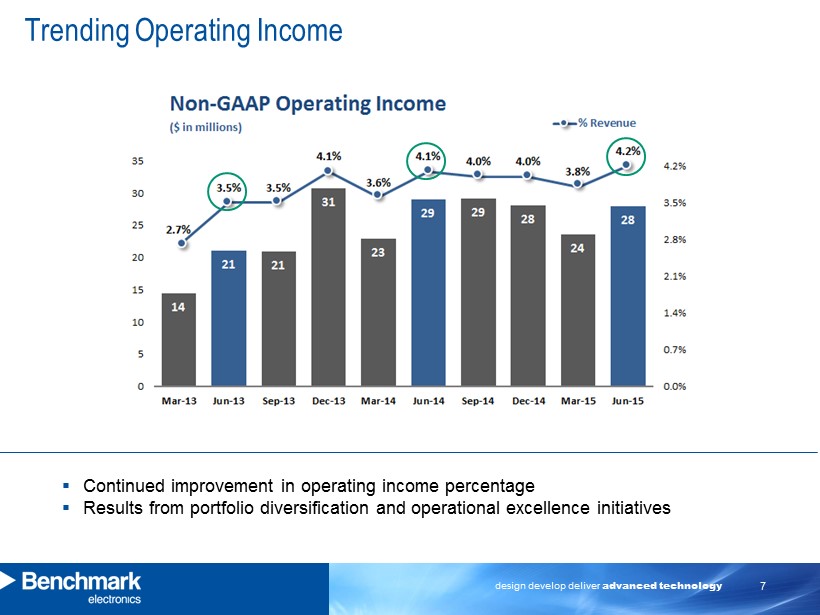
design develop deliver advanced technology 7 Trending Operating Income ▪ Continued improvement in operating income percentage ▪ Results from portfolio diversification and operational excellence initiatives

design develop deliver advanced technology 8 Second Quarter Industry Sector Update Revenue by Industry Sector Sector (in millions) Jun 30 , 2015 Mar 31, 2015 Jun 30 , 2014 Q2 YoY Industrial Controls 30% $201 32% $199 29% $211 (5)% Telecommunications 27% $177 27% $166 29% $205 (14%) Computing 20% $137 19% $120 21% $148 (7%) Medical 14% $90 13% $81 11% $81 11% Test & Instrumentation 9% $59 9% $55 10% $72* (17%) Total Revenue $664 $621 $717 Q2 - 2015 Q2 - 2014 *Includes $27 million of revenue from a customer that filed bankruptcy.

design develop deliver advanced technology 9 Financial Statement Highlights Balance Sheet and Cash Flows (In millions) Jun 30, 2015 Mar 31, 2015 Jun 30, 2014 Cash $409.3* $383.6 $401.9 Cash Flows from Operating Activities $52.0 ($10.9) $25.0 Capital Expenditures $8.2 $16.8 $15.7 Depreciation & Amortization $12.3 $12.1 $11.4 Accounts Receivable $500.7 $490.7 $499.5 Days Sales Outstanding 68 71 63 Inventory $444.7 $426.8 $421.2 Inventory Turns 5.5x 5.3x 6.3x Total Cost of Shares Repurchased $18.8 $15.8 $7.4 * Approximately $57 million of cash available in the U.S.

design develop deliver advanced technology 10 Working Capital Update Jun 30 , 2015 Mar 31 , 2015 Accounts Receivable Days 68 71 Accounts Payable Days 42 39 Inventory Days 66 68 Cash Conversion Cycle Days 91 99 ▪ Accounts Receivable and Accounts Payable each improved by three days; inventory improved by two days ▪ Cash Conversion Cycle improved by eight days ▪ Initiatives for working capital improvement: o Better alignment of customer and supplier payment terms o Demand and inventory optimization o Strategic sourcing initiatives
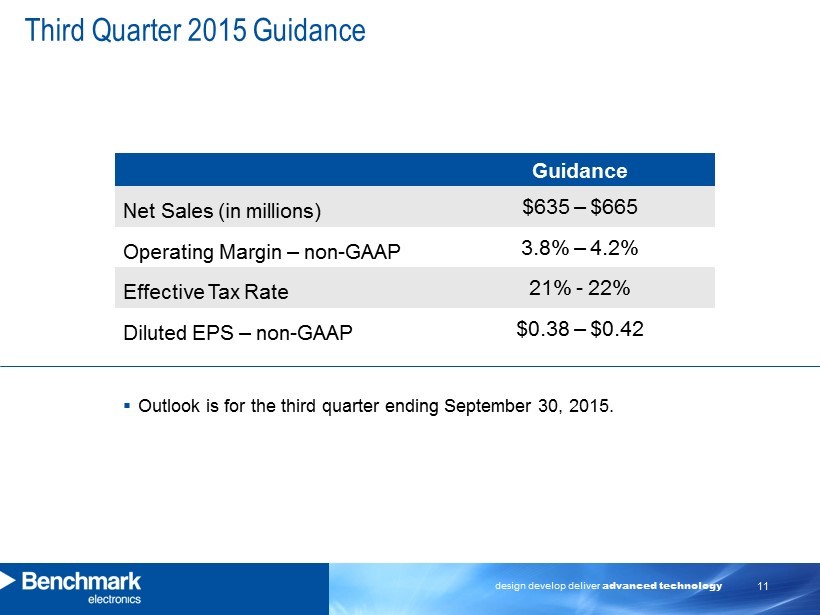
design develop deliver advanced technology 11 Third Quarter 2015 Guidance Guidance Net Sales (in millions) $635 – $665 Operating Margin – non - GAAP 3.8% – 4.2% Effective Tax Rate 21% - 22 % Diluted EPS – non - GAAP $0.38 – $0.42 ▪ Outlook is for the third quarter ending September 30, 2015.

design develop deliver advanced technology 12 Benchmark Market Overview Higher Growth Markets Jun 30 , 2015 Q3 - 15 Outlook (%) 2015 Outlook Industrial Controls 30% $201 Up Mid - Single Digits Growth Medical 14% $90 Up Mid - Single Digits Growth Test & Instrumentation 9% $59 Up Mid - Single Digits Stable Total Revenue $350 Traditional Markets Jun 30 , 2015 Q3 - 15 Outlook (%) 2015 Outlook Telecommunication s 27% $177 Down Low Double Digits Decline Computing 20% $137 Down Mid - Single Digits Decline Total Revenue $314

design develop deliver advanced technology 13 ▪ Near Term Cash Priorities: o Share repurchases ($69 million remaining in current program) o Capital expenditures $40 - 50 million in 2015 o Strategic growth investments ▪ Key Strategic Initiatives: o Portfolio Diversification o Lean and Operational Excellence o Working Capital Management ▪ Margin Expansion on track towards 4.5% longer term Summary Second Quarter 2015

design develop deliver advanced technology 14 Appendix

design develop deliver advanced technology 15 Reconciliation of GAAP to non - GAAP Financial Results (Amounts in Thousands, Except Per Share Data) – (UNAUDITED)
Serious News for Serious Traders! Try StreetInsider.com Premium Free!
You May Also Be Interested In
- BENCHMARK ELECTRONICS TO REPORT FIRST QUARTER 2024 RESULTS
- YPF SA reports
- Robbins LLP Reminds IRobot Corporation Shareholders of the Pending May 7, 2024 Lead Plaintiff Deadline
Create E-mail Alert Related Categories
SEC FilingsSign up for StreetInsider Free!
Receive full access to all new and archived articles, unlimited portfolio tracking, e-mail alerts, custom newswires and RSS feeds - and more!
