

Form 8-K Argo Group International For: Nov 17
 Tweet
Tweet Share
Share�
�
UNITED STATES
SECURITIES AND EXCHANGE COMMISSION
Washington, DC 20549
�
�
FORM 8-K
�
�
Current Report
Pursuant to Section�13 or 15(d)
of the Securities Exchange Act of 1934
Date of Report (Date of earliest event reported): November�17, 2014
�
�
Argo Group International Holdings, Ltd.
(Exact name of registrant as specified in its charter)
�
�
�
| Bermuda | � | 1-15259 | � | 98-0214719 |
| (State or other jurisdiction of incorporation) |
� | (Commission File Number) |
� | (I.R.S. Employer Identification No.) |
�
| 110 Pitts Bay Road Pembroke HM 08 Bermuda |
� | P.O. Box HM 1282 Hamilton HM FX Bermuda |
| (Address, Including Zip Code, of Principal Executive Offices) |
� | (Mailing Address) |
Registrant�s telephone number, including area code: (441)�296-5858
Not Applicable
(Former name or former address, if changed since last report)
�
�
Check the appropriate box below if the Form 8-K filing is intended to simultaneously satisfy the filing obligation of the registrant under any of the following provisions:
�
| � | Written communications pursuant to Rule 425 under the Securities Act (17 CFR 230.425) |
�
| � | Soliciting material pursuant to Rule 14a-12 under the Exchange Act (17 CFR 240.14a-12) |
�
| � | Pre-commencement communications pursuant to Rule 14d-2(b) under the Exchange Act (17 CFR 240.14d-2(b)) |
�
| � | Pre-commencement communications pursuant to Rule 13e-4(c) under the Exchange Act (17 CFR 240.13e-4(c)) |
�
�
�
| ITEM�7.01. | REGULATION FD DISCLOSURE. |
Argo Group International Holdings, Ltd. (�Argo Group�) may make presentations to members of the investment community from time to time using the the presentation materials attached hereto as Exhibit�99.1 to this Current Report on Form�8-K.
Note: The information in this report and Exhibit�99.1 attached hereto are furnished pursuant to Item�7.01 and shall not be deemed �filed� for purposes of Section�18 of the Securities Exchange Act of 1934 or otherwise subject to the liabilities of that section. This report will not be deemed an admission as to the materiality of any information in the report that is required to be disclosed solely by Regulation FD.
FORWARD-LOOKING STATEMENTS
This press release contains certain statements that are �forward-looking statements� within the meaning of Section�27A of the Securities Act of 1933 and Section�21E of the Securities Exchange Act of 1934, as amended. Such statements are qualified by the inherent risks and uncertainties surrounding future expectations generally and also may materially differ from actual future experience involving any one or more of such statements. For a more detailed discussion of such risks and uncertainties, see Argo Group�s filings with the SEC. The inclusion of a forward-looking statement herein should not be regarded as a representation by Argo Group that Argo Group�s objectives will be achieved. Argo Group undertakes no obligation to publicly update forward-looking statements, whether as a result of new information, future events or otherwise.
�
| ITEM�9.01. | FINANCIAL STATEMENTS AND EXHIBITS. |
(d) Exhibits:
�
| 99.1 | Argo Group International Holdings, Ltd. Presentation |
SIGNATURE
Pursuant to the requirements of the Securities Exchange Act of 1934, the registrant has duly caused this report to be signed on its behalf by the undersigned hereunto duly authorized.
�
| � | � | ARGO�GROUP�INTERNATIONAL�HOLDINGS,�LTD. | ||||
| � | � | By: | � | /s/ Jay S. Bullock | ||
| Dated: November�17, 2014 | � | � | Name: | � | Jay S. Bullock | |
| � | � | Title: | � | Executive Vice President and Chief Financial Officer | ||
�
2
 3Q
2014 Investor Presentation November 2014
Exhibit 99.1 |
 Forward-Looking Statements
2.
This presentation contains �forward-looking statements� which are made pursuant to the
safe harbor provisions of the Private Securities Litigation Reform Act of 1995. The
forward-looking statements are based on the Company's current expectations and beliefs
concerning future developments and their potential effects on the Company. There can be no
assurance that actual developments will be those anticipated by the Company. Actual results may
differ materially from those projected as a result of significant risks and uncertainties,
including non-receipt of the expected payments, changes in interest rates, effect of the
performance of financial markets on investment income and fair values of investments, development
of claims and the effect on loss reserves, accuracy in projecting loss reserves, the impact of
competition and pricing environments, changes in the demand for the Company's products, the
effect of general economic conditions, adverse state and federal legislation, regulations and
regulatory investigations into industry practices,� developments relating to existing
agreements, heightened competition, changes in pricing� environments, and changes in asset
valuations. The Company undertakes no obligation to publicly update any forward-looking
statements as a result of events or developments subsequent to the
presentation.��� |
 3.
Argo Group at a Glance
Exchange / Ticker:
NASDAQ / �AGII�
Share Price:
$55.29
Market Capitalization:
$1.4 billion
Annual Dividend / Yield:
$0.72 per share / 1.3%
Gross Written Premium:
$1.9 billion
Capital:
$2.0 billion
Analyst Coverage:
Raymond James (Outperform) �
Greg Peters
Sterne Agee (Buy) �
Dan Farrell
William Blair (Outperform) �
Adam Klauber
Compass Point (Neutral) �
Ken Billingsley
Dowling & Partners (Neutral) �
Aaron Woomer
KBW (Market Perform) �
Brett Shirreffs
Macquarie (Neutral) �
Amit Kumar
Atlanta
Bermuda
Boston
Brussels
Chicago
Dallas
Denver
Dubai
Houston
Irvine
London
Los Angeles
Malta
New York
Paris
Peoria
Portland
Richmond
Rio de Janeiro
Rockwood
San Antonio
San Francisco
Sao Paulo
Scottsdale
Seattle
Singapore
Zurich
Note: Market information as of November 5, 2014 and annual performance figures as
of TTM September 30, 2014. |
 4.
Leading Specialty Franchise
Global underwriter of specialty insurance &
reinsurance
Strategically located in major insurance centers
�
U.S., Bermuda and London
Established presence in attractive markets
�
Leader in U.S. Excess & Surplus Lines
�
Top Quartile Lloyd�s Syndicate by stamp
�
Strong core Commercial Specialty franchise
�
Flexible reinsurance & excess casualty platform
�
Primary presence in Brazil
Diversified by geography, product & distribution
Broad and strong producer relationships
�
Retailers, wholesalers and brokers (Lloyd�s, Re)
�A�
(excellent) A.M. Best rating
Primary
Insurance
Reinsurance
Property
Casualty
GWP by Business Type
GWP by Business Mix
Argo Franchise Overview
~40%
~60%
~90%
~10% |
 5.
Maximize
Shareholder
value
through
growth in
Book Value
per Share
Sustainable competitive advantage
�
Niche markets
�
Underwriting expertise
�
Superior customer service
�
Product innovation
Profitable organic & strategic growth
�
Profitable through cycles
�
Key underwriters/teams
�
Deals that meet stringent criteria
Deep, tenured management team
Active capital management
Strategy Aligned Toward Shareholder Value |
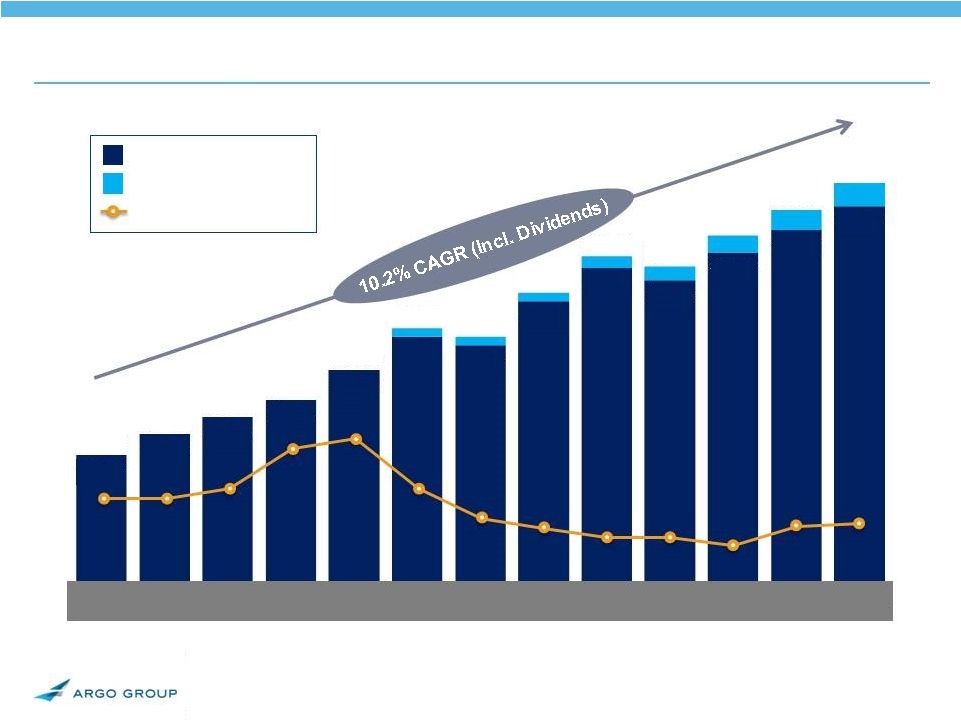
 6.
*Excludes GWP recorded in runoff and corporate & other.
Evolution of Growth and Diversification
2001
�
Acquired Colony
and Rockwood
�
Founded Trident
(Public Entity)
2005
�
Sold Risk�
Management
business
2007
�
Rebranded Argo Group
�
Completed acquisition
�
Formed Argo Re
Syndicate 1200
2011
�
Established� local
presence in Brazil
2002
2003
2004
2005
2006
2007
2008
2009
2010
2011
2012
2013
�14/3Q
TTM
BVPS
$27.60
$30.46
$35.52
$41.05
$39.62
$47.00
$52.55
$50.54
$55.22
$58.96
$62.99
Total Capital (Millions)
$717
$860
$992
$1,754
$1,763
$1,975
$1,986
$1,840
$1,915
$1,966
$2,008
$622
$788
$903
$1,056
$1,153
$1,182
$1,605
$1,987
$1,530
$1,544
$1,744
$1,888
$1,892
400
800
1,200
1,600
2,000
Total
Risk Management (sold renewal rights in 2005)
International Specialty
Syndicate 1200
Commercial Specialty
Excess & Surplus Lines
15%
30%
32%
22%
2008
�
Acquired Lloyd�s
in Bermuda |
 7.
Argo Group Business Mix ($1.9B in GWP)
GWP by Segment
Excess &
Surplus Lines
Commercial
Specialty
Syndicate
1200
International
Specialty
30%
15%
32%
GWP by Product
GWP by Geography
United
States
London
Bermuda
22%
15%
Excess &
Surplus Lines
32%
Other
Commercial
Specialty
Property
Public Entity
20%
5%
6%
Marine &
Aerospace
Surety 3%
Alteris
Mining 4%
Emerging Mkts 9%
6%
Emerging Markets 5%
54%
11%
30%
GWP by Business Type
Primary
Insurance
Reinsurance
*Data is based on TTM as of September 30, 2014. Excludes GWP recorded in runoff
and corporate & other. ~90%
~10% |
 8.
Multi-Channel Distribution Strategy
Retail Broker
/
Agent
General
Agency
Wholesale
Broker
Lloyd�s
Market
Reinsurance
Broker
Rockwood
X
Argo Insurance
X
Trident
X
Surety
X
X
Commercial Programs
X
Alteris
X
Contract
X
Transportation
X
Casualty
X
E&O
X
X
D&O
X
X
Environmental
X
Allied Medical
X
X
Specialty Property
X
Liability
X
Property
X
Aviation
X
Marine
X
Excess Casualty
X
X
Professional Liability
X
X
Emerging Markets
X
X
Reinsurance
X |
 9.
Maximizing
Shareholder
Value
�
BVPS
Growth
2002
Reported
Book
Value
1
Cumulative Dividends
Price/Book
2
2003
2004
2005
2006
2007
2008
2009
2010
2011
2012
2013
3Q �14
$21.27
$24.75
$27.60
$30.46
$35.52
$41.05
$39.62
$47.00
$52.55
$50.54
$55.22
$58.96
$62.99
$21.27
$24.75
$27.60
$30.46
$35.52
$42.55
$41.12
$48.50
$54.49
$52.92
$58.03
$62.36
$66.89
1.1x
1.1x
1.2x
1.6x
1.7x
1.2x
0.9x
0.8x
0.7x
0.7x
0.6x
0.8x
0.8x
(1)
Book value per common share:
(2) Price / book calculated at 52-week high and most recent book value per
share. Stock price adjusted for PXRE merger for 2006 and prior years.
-
Adjusted for June 2013 stock dividend
-
2008-2011
restated
to
reflect
adoption
of
ASU
2010-26
(related
to
accounting
for
costs
associated
with
acquiring
or
renewing
insurance
contracts);
2007
and
prior
not
restated
-
2006 and prior years adjusted for PXRE merger
-
2003-2006
includes
impact
of
Series
A
Mandatory
Convertible
Preferred
on
an
as-if
converted
basis.
Preferred
stock
fully
converted
into
common
shares
as
of
Dec.
31,
2007 |
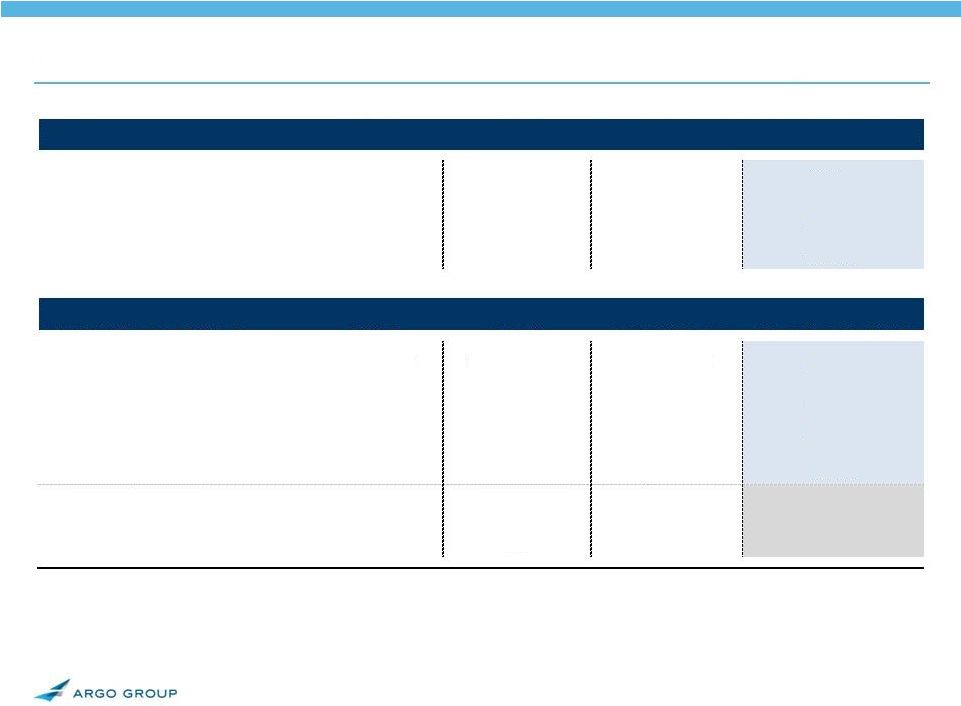 10.
Substantial Growth and Financial Strength
Scale
2002
2006
TTM 3Q '14
'02-3Q'14 Factor
Gross Written Premiums
$622.1
$1,155.6
$1,893.3
3.0x
Net Written Premiums
484.0
847.0
1,363.2
2.8x
Net Earned Premiums
378.4
813.0
1,341.0
3.5x
Financial Strength
2002
2006
TTM 3Q '14
'02-3Q'14 Factor
Total Assets
$2,208.9
$3,721.5
$6,388.6
2.9x
Total Investments
1,181.3
2,514.1
4,111.7
3.5x
Shareholder's Equity
327.7
847.7
1,626.9
5.0x
Total Capital
327.7
992.0
2,007.8
6.1x
Debt / Total Capital
0.0%
14.5%
19.0%
A.M. Best Rating
A
A
A |
 11.
Combined Ratio
93.7%
-2.6%
91.1%
Combined Ratio
95.9%
-7.1%
88.8%
Combined Ratio
98.0%
2.3%
100.3%
Combined Ratio
90.0%
-4.7%
85.3%
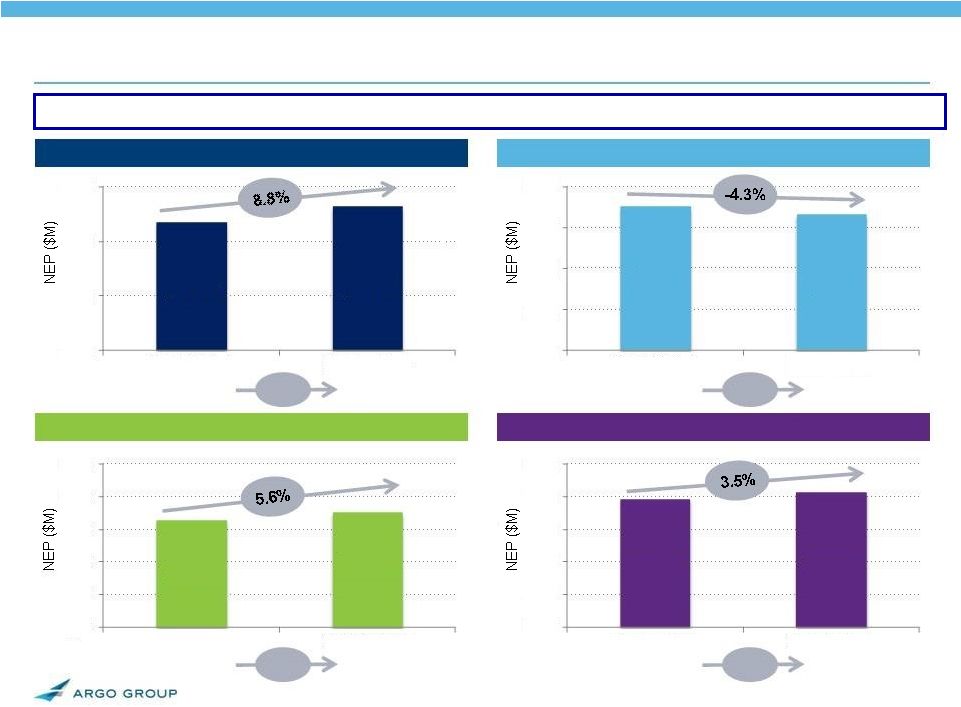
3Q YTD YoY Net Earned Premium & Combined Ratio
Consolidated NEP up 3.9% and Combined Ratio down 2.3% in 3Q YTD
2014 vs. 3Q YTD 2013
Excess & Surplus Lines
Commercial Specialty
International Specialty
Syndicate 1200
$334.4
$363.9
$100
$200
$300
$400
3Q '13 YTD
3Q '14 YTD
$225.1
$215.5
$50
$100
$150
$200
$250
3Q '13 YTD
3Q '14 YTD
$106.6
$112.6
$25
$50
$75
$100
$125
$150
3Q '13 YTD
3Q '14 YTD
$295.6
$305.9
$100
$150
$200
$250
$300
$350
3Q '13 YTD
3Q '14 YTD |
 $101.4
$112.7
$98.3
$64.7
$71.0
$74.4
$83.2
$96.3
$80.7
All data in millions except for ratio calculations. TTM = trailing twelve
months. Excess & Surplus Lines Segment (32% of TTM
GWP) 88.9%
89.3%
99.6%
97.4%
95.5%
91.9%
93.3%
85.3%
88.1%
About Us
�
Leader in U.S. Excess & Surplus Lines
�
Strong relationships with national,
local and regional wholesale brokers
�
Seasoned U/W expertise is a competitive
advantage
�
Target all sizes of non-standard (hard-to-place)
risks, with focus on small/medium accounts
�
Underwrites on both admitted & non-admitted
basis and across all business enterprises via
two brands:
GWP by Business Unit (TTM 9/30/14)
Casualty 35%
Transportation 7%
Environmental 5%
Allied Medical 6%
Management Liability 7%
Property 11%
Contract� 24%
Errors & Omissions 5%
Combined Ratio
PTOI
Gross Written Premium
PTOI
(1)
& Combined Ratio
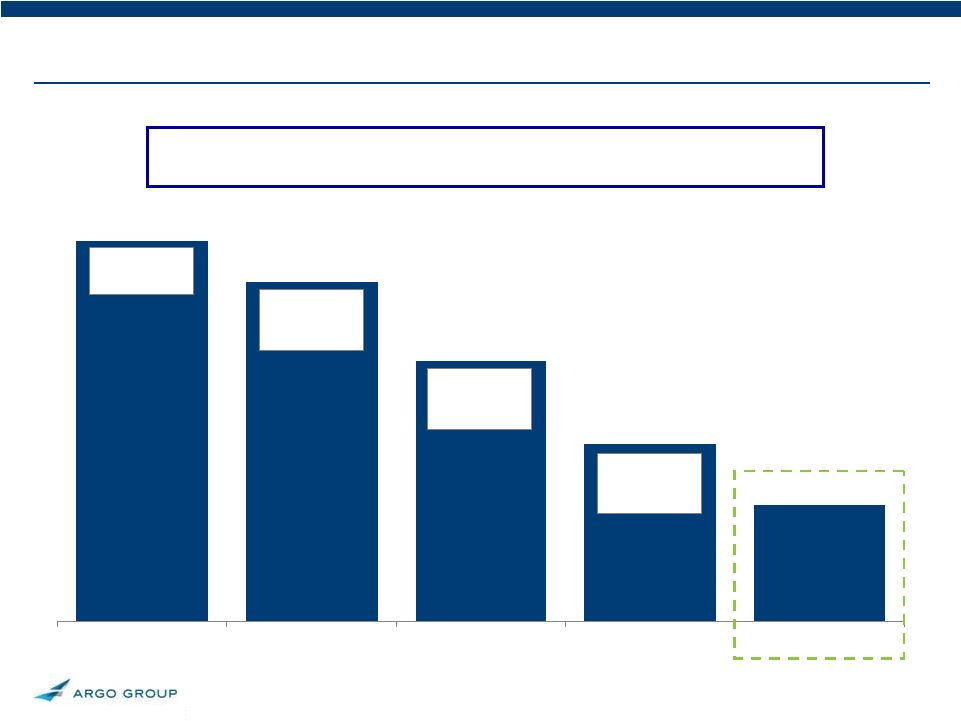
2006
2013
2011
2010
2009
2008
2012
2007
3Q�14
(2)
2013
2011
2010
2009
2008
2006
2012
2007
3Q�14
(3)
(1)
PTOI = Pre-Tax Operating Income. Excludes interest expense.
(2)
Data is based on year-to-date as of September 30, 2014.
(3)
Data is based on trailing twelve months as of September 30, 2014.
$753.2
$726.5
$684.3
$642.3
$522.6
$478.9
$513.5
$594.2
$613.7
�
Colony Specialty
�
Argo Pro
12. |
 13.
97.4%
95.5%
91.9%
88.1%
85.3%
2010
2011
2012
2013
3Q 2014 YTD
New segment
management
team is formed
Year of
restructuring
and strategy
enhancement
Year of execution
on the newly
restructured
platform
Continued
execution and
combined ratio
improvement
Restructuring initiatives and strategy enhancement has enabled
Argo to become an industry-leading E&S underwriter
E&S Operating Platform Enhancement |
 14.
Commercial Specialty Segment (22% of GWP)
About Us
�
Business primarily placed through
retail
distribution partners
�
Argo Insurance �
Designs customized
commercial insurance programs for grocers, dry
cleaners, restaurants and other specialty retail
clients
�
Trident
�
2
largest
provider
of
insurance
to
small and midsize U.S. public entities
�
Rockwood
�
2
largest
provider
of
commercial
insurance to coal mining industry
�
Alteris
�
fee based business where Argo or
others accept the risk
GWP by Business Unit (TTM 9/30/14)
U.S. Retail (Argo Insurance) 17%
Restaurants 6%
Grocery 7%
Dry Cleaners 2%
Other Industries 3%
Public Entity
(Trident) 21%
Surety 12%
Mining
(Rockwood) 19%
Other 4%
Alteris Managed Premium 27%
Transportation 3%
State Workers�
Comp Funds 19%
Self Insured Public Entity 5%
89.4%
88.7%
95.6%
98.1%
108.3%
115.1%
96.5%
100.3%
97.8%
Gross Written Premium
PTOI
(1)
& Combined Ratio
(1)
PTOI = Pre-Tax Operating Income. Excludes interest expense.
(2)
Data is based on year-to-date as of September 30, 2014.
(3)
Data is based on trailing twelve months as of September 30, 2014.
$389.1
$420.7
$510.9
$475.7
$428.1
$428.8
$437.0
$419.1
$417.0
$50.4
$61.3
$43.0
$45.8
$36.3
$1.4
($18.9)
$25.2
$11.6
2013
2011
2010
2009
2008
2006
2012
2007
3Q�14
(3)
2006
2013
2011
2010
2009
2008
2012
2007
3Q�14
(2)
Combined Ratio
PTOI
All data in millions except for ratio calculations. TTM = trailing twelve
months. nd
nd |
 15.
131.7%
115.2%
Syndicate 1200 Segment (30% of GWP)
General Liability 13%
Prof. Indemnity 13%
Int�l Casualty Treaty 3%
Directors & Officers 3%
Other 2%
About Us
�
Well-established multi-class
platform at Lloyd�s of London
�
Ranks among the largest
Syndicates at Lloyd�s by Stamp
Capacity
�
Lloyd�s market ratings:
�
�A�
(Excellent) by A.M. Best
�
�A+�
(Strong) by S&P
GWP by Business Unit (TTM 9/30/14)
Property 46%
Liability 35%
Specialty 15%
Aerospace 4%
Property Fac 18%
Personal Accident 12%
N. Am. & Int�l Binders 10%
Other 7%
95.8%
112.3%
96.2%
92.4%
Offshore Energy 7%
Onshore Energy 3%
Cargo 3%
Yachts & Hulls 2%
91.1%
Gross Written Premium
PTOI
(1)
& Combined Ratio
(1)
PTOI = Pre-Tax Operating Income. Excludes interest expense.
(2)
Data is based on year-to-date as of September 30, 2014.
(3)
Data is based on trailing twelve months as of September 30, 2014.
$282.9
$706.0
$389.9
$438.5
$533.4
$583.9
$569.0
($5.2)
$30.0
($27.7)
($63.8)
$31.8
$40.6
$37.1
2013
2011
2010
2009
2008
2012
3Q�14
(3)
2013
2011
2010
2009
2008
2012
3Q�14
(2)
Combined Ratio
PTOI
All data in millions except for ratio calculations. TTM = trailing twelve
months. |
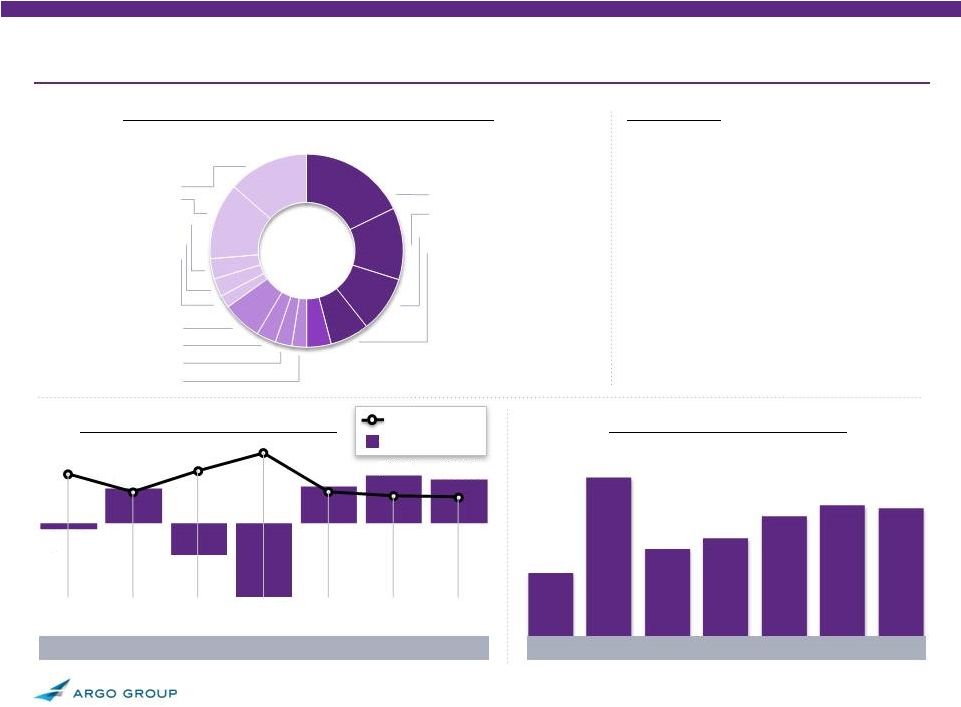
 16.
International Specialty Segment (15% of GWP)
About Us
�
Established primary operations in Brazil
�
Established operations in Euro zone
�
Established regional office in Dubai
GWP by Business Unit (TTM 9/30/14)
Excess Casualty 22%
Professional Liability 12%
Brazil 24%
Marine Cargo 10%
Property & Engineering 3%
Motor 5%
Financial Lines 6%
Reinsurance 42%
Other Assumed Re 4%
Property Risk XS 3%
Property Pro Rata 6%
Property Cat 30%
177.5%
71.7%
52.3%
77.9%
97.1%
95.5%
88.8%
Gross Written Premium
PTOI
(1)
& Combined Ratio
(1)
PTOI = Pre-Tax Operating Income. Excludes interest expense.
(2)
Data is based on year-to-date as of September 30, 2014.
(3)
Data is based on trailing twelve months as of September 30, 2014.
$126.4
$162.9
$188.9
$198.2
$260.2
$290.6
$292.1
$23.6
$50.3
$36.7
($67.7)
$15.7
$14.6
$18.7
2013
2011
2010
2009
2008
2012
3Q�14
(2)
2013
2011
2010
2009
2008
2012
3Q�14
(3)
Combined Ratio
PTOI
�
Bermuda team underwrites:
�
Distributes through brokers
�
Property cat, short tail per risk and
proportional treaty reinsurance worldwide
�
Excess casualty and professional liability for
Fortune 1000 accounts
�
Building diversity through international
expansion:
All data in millions except for ratio calculations. TTM = trailing twelve
months. |
 17.
(1)
Calculated using an assumed tax rate of 20%.
(2)
Defined as Losses & LAE / (Earned Premiums less Other Reinsurance-Related
Expenses). (3)
Defined as Underwriting, Acquisition and Insurance Expenses / (Earned Premiums
less Other Reinsurance-Related Expenses). 3Q 2014 Operating Results
3Q 2014
3Q 2013
Year to Date
3Q 2014
Year to Date
3Q 2013
Gross Written Premiums
$497.2
$495.1
$1,480.4
$1,475.5
Net Written Premiums
380.5
374.5
1,055.6
1,043.7
Earned Premiums
337.6
330.5
999.4
962.2
Losses and Loss Adjustment Expenses
191.9
190.9
559.5
554.1
Other Reinsurance-Related Expenses
0.0
4.6
0.0
14.4
Underwriting, Acquisition and Insurance Expenses
133.8
126.7
399.3
378.0
Underwriting Income
$11.9
$8.3
$40.6
$15.7
Net Investment Income
20.8
24.1
64.7
77.3
Fee Income, net
1.6
0.3
0.1
0.5
Interest Expense
4.9
5.1
15.0
15.1
Operating Income
$29.4
$27.6
$90.4
$78.4
Net Realized Investment Gains and Other
12.9
9.1
42.5
29.6
Foreign Currency Exchange (Gain) Loss
(6.0)
3.8
(2.8)
(5.2)
Income Before Taxes
$48.3
$32.9
$135.7
$113.2
Provision for Income Taxes
3.6
1.9
12.2
17.8
Net Income
$44.7
$31.0
$123.5
$95.4
Operating Income per Common Share (Diluted)
1
$0.89
$0.80
$2.72
$2.24
Net Income per Common Share (Diluted)
$1.69
$1.12
$4.63
$3.41
Loss Ratio
2
56.8%
58.6%
56.0%
58.4%
Expense Ratio
3
39.6%
38.9%
40.0%
39.9%
Combined Ratio
96.4%
97.5%
96.0%
98.3%
All data in millions except for per share data and ratio calculations.
|
 18.
*Duration includes cash & equivalents
As of September 30, 2014
Conservative Investment Strategy
17%
�
Duration of 2.5 years*
�
Average rating of �A1/A+�
�
Book yield of 2.7%*
�
Very liquid
�
Conservatively managed
Portfolio Characteristics
*Book yield is pre-tax & includes all fixed maturities
18.
Equity Investments by Sector
9% Health Care
Energy
25%
7% Financials
5% Industrials
9% Technology
7% Funds
4% Materials
7% Discretionary
Consumer
Staples
25%
Total:
$0.5b
Fixed Maturities by Type
11% Short Term
Corporate
42%.
13% Gov.
18% Structured
State/Muni
16%.
Total:
$3.2b*
*$2.8 billion in fixed maturities, $0.4 billion in short term
2% Utilities & Telecom
Asset Allocation
10% Other
Fixed
69%
Maturities.
9% Short Term
12% Equities
Total:
$4.1b
$77m of cash & cash equivalents not included above
$77m of cash & cash equivalents not included above
|
 19.
YTD
2010-3Q '14
2010
2011
2012
2013
3Q 2014
YTD Total
Total Shares Outstanding
31,206,796
31,285,469
31,384,271
34,066,889
34,268,995
Less: Treasury Shares
3,363,560
4,971,305
6,459,613
7,558,345
��
8,440,355
��
� Net Shares
27,843,236
26,314,164
24,924,658
26,508,544
25,828,640
Shares Repurchased
3,217,561
��
1,607,745
��
1,488,308
��
1,098,732
��
882,010
�����
8,294,356
��
� As % of Beg. Net Shares
10%
6%
6%
4%
3%
27%
Avg. Repurchase Price per Share
$33.05
$30.69
$29.89
$41.02
$47.78
$34.65
Total Repurchased ($m)
$106.3
$49.3
$44.5
$45.1
$42.1
$287.4
Dividends per Share
$0.48
$0.48
$0.48
$0.60
$0.51
$2.55
Dividend Payments ($m)
$15.3
$14.2
$13.4
$16.1
$13.3
$72.3
Repurchases + Dividends ($m)
$121.7
$63.6
$57.9
$61.1
$55.4
$359.7
Note: Not adjusted for June 2013 stock dividend.
Active Capital Management
Through share repurchases and dividends, we have returned $360 million of capital
and repurchased 27% of shares outstanding from 2010 through 3Q 2014
|
 20.
Source:� SNL Financial (as of 11/5/14).
Note:
Peer
Group
consists
of:
Allied
World,
American
Financial,
Arch
Capital,
Aspen,
AXIS
Capital,
Endurance,
Global
Indemnity,
HCC,
Markel,
Navigators, OneBeacon, RLI Corp, Selective Group, W.R. Berkley.
Stock Price Performance �
Last 2 Years
(10.0%)
+0.0%
+10.0%
+20.0%
+30.0%
+40.0%
+50.0%
+60.0%
+70.0%
+80.0%
+90.0%
Nov
-12
Jan
-13
Mar-13
May-13
Jul
-13
Sep-13
Nov
-13
Jan
-14
Mar-14
May-14
Jul
-14
Sep-14
Nov
-14
Argo Group
Peer Group
S&P 500
+43%
+82%
+40% |
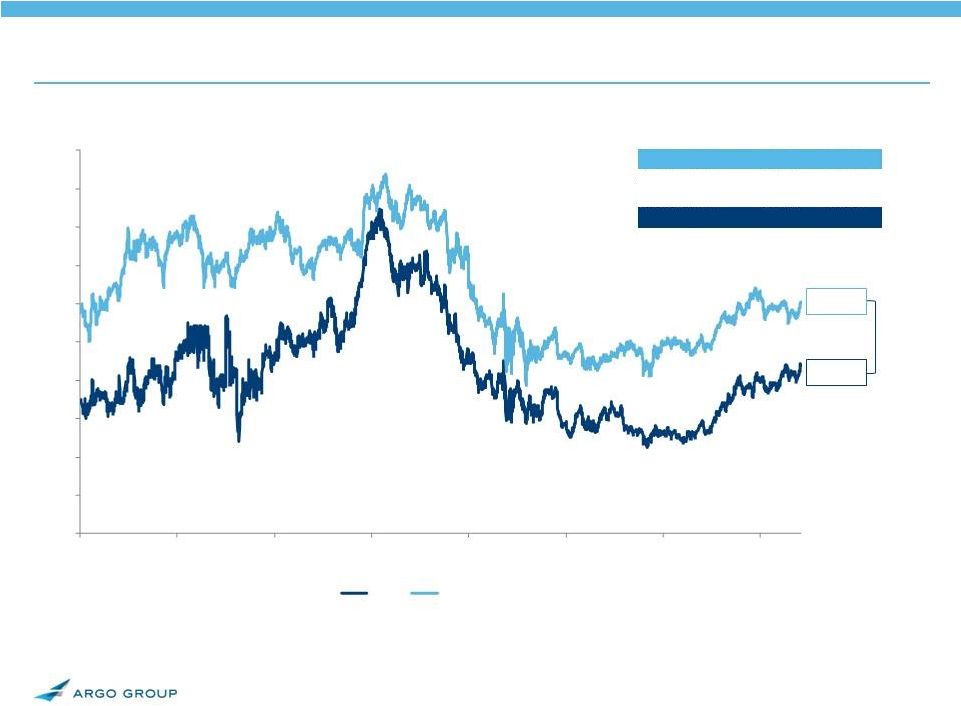 21.
0.88x
1.21x
0.33x
Difference
Source:� SNL Financial (as of 11/5/14).
Note:� Price to book is average price/book across all peer companies based on
latest reported book value.� Peer Group consists of: Allied World,
American Financial, Arch Capital, Aspen, AXIS Capital, Endurance, Global
Indemnity, HCC, Markel, Navigators, OneBeacon, RLI Corp, Selective Group,
W.R. Berkley. Compelling Valuation vs. Peer Group
Price/Book
Jan-00
Nov-14
Argo
0.70x
0.88x
Peer Avg.
1.17x
1.21x
Difference
0.47x
0.33x
-
0.2x
0.4x
0.6x
0.8x
1.0x
1.2x
1.4x
1.6x
1.8x
2.0x
Jan-00
Jan-02
Jan-04
Jan-06
Jan-08
Jan-10
Jan-12
Jan-14
Argo
Peer Group |
 22.
Well Positioned for Value Creation in 2014 and Beyond
�
Compelling investment case
�
Stock trading at a discount to book value and below peers
�
Upside potential as past and ongoing efforts continue
�
Significant changes to premium composition completed
�
Results of re-underwriting and efficiency efforts are emerging in
financials �
Continue to employ and attract some of the best talent in the industry
�
Brazil has traction and is beginning to scale
�
Incremental yield improvements can have a favorable impact on ROE
�
Moderate financial leverage
�
Strong balance sheet with adequate reserves and excellent asset quality
We
believe
that
Argo
Group
has
potential
to
generate
substantial
value
for
new
and
existing
investors |
Serious News for Serious Traders! Try StreetInsider.com Premium Free!
You May Also Be Interested In
- Alphabet stock surges 11% to record high on Q1 earnings beat, first-ever dividend
- Form 8.5 (EPT/RI) - Mattioli Woods
- Nel ASA: Hy Stor Energy places gigawatt capacity reservation for Mississippi Clean Hydrogen Hub
Create E-mail Alert Related Categories
SEC FilingsSign up for StreetInsider Free!
Receive full access to all new and archived articles, unlimited portfolio tracking, e-mail alerts, custom newswires and RSS feeds - and more!
