

Form 8-K Apollo Commercial Real For: Oct 28
 Tweet
Tweet Share
Share�
�
UNITED STATES
SECURITIES AND EXCHANGE COMMISSION
Washington, D.C. 20549
�
�
FORM 8-K
�
�
CURRENT REPORT
Pursuant to Section�13 or 15(d)
of The Securities Exchange Act of 1934
Date of Report (Date of earliest event reported): October�28, 2014
�
�
Apollo Commercial Real Estate Finance, Inc.
(Exact name of registrant as specified in its charter)
�
�
�
| Maryland | � | 001-34452 | � | 27-0467113 |
| (State or other jurisdiction of incorporation) |
� | (Commission File Number) |
� | (IRS Employer Identification�No.) |
�
| c/o Apollo Global Management, LLC 9 West 57th Street, 43rd Floor New York, New York |
� | 10019 |
| (Address of principal executive offices) | � | (Zip Code) |
Registrant�s telephone number, including area code: (212)�515-3200
n/a
(Former name or former address, if changed since last report.)
�
�
Check the appropriate box below if the Form 8-K filing is intended to simultaneously satisfy the filing obligation of the registrant under any of the following provisions (see General Instruction A.2. below):
�
| � | Written�communications pursuant to Rule 425 under the Securities Act (17 CFR 230.425) |
�
| � | Soliciting�material pursuant to Rule 14a-12 under the Exchange Act (17 CFR 240.14a-12) |
�
| � | Pre-commencement�communications pursuant to Rule 14d-2(b) under the Exchange Act (17�CFR�240.14d-2(b)) |
�
| � | Pre-commencement�communications pursuant to Rule 13e-4(c) under the Exchange Act (17�CFR�240.13e-4(c)) |
�
�
�
| ITEM�2.02. | Results of Operations and Financial Condition. |
On October�28, 2014, Apollo Commercial Real Estate Finance, Inc. (the �Company�) issued an earnings release announcing its financial results for the quarter ended September�30, 2014. A copy of the earnings release is attached as Exhibit 99.1 hereto and incorporated herein by reference.
On October�28, 2014, the Company posted supplemental financial information on the Investor Relations section of its website (www.apolloreit.com). A copy of the supplemental financial information is furnished as Exhibit 99.2 hereto and incorporated herein by reference.
The information in Item�2.02 of this Current Report, including Exhibits 99.1 and 99.2, is being furnished and shall not be deemed �filed� for purposes of Section�18 of the Securities Exchange Act of 1934, as amended, or otherwise subject to the liabilities of that Section. The information in this Current Report shall not be incorporated by reference into any registration statement or other document pursuant to the Securities Act of 1933, as amended, unless it is specifically incorporated by reference therein.
�
| ITEM�9.01. | Financial Statements and Exhibits. |
�
| (d) | Exhibits. |
�
| Exhibit |
�� | Description |
| 99.1 | �� | Earnings Release dated October 28, 2014 |
| 99.2 | �� | Supplemental Financial Information for the quarter ended September 30, 2014 |
SIGNATURES
Pursuant to the requirements of the Securities Exchange Act of 1934, the registrant has duly caused this report to be signed on its behalf by the undersigned hereunto duly authorized.
�
| � | � | Apollo Commercial Real Estate Finance, Inc. | ||||
| � | � | By: | � | /s/ Stuart A. Rothstein | ||
| � | � | Name: | � | Stuart A. Rothstein | ||
| � | � | Title: | � | President and Chief Executive Officer | ||
| Date: October�28, 2014 | � | � | � | |||
Exhibit Index
�
| Exhibit |
�� | Description |
| 99.1 | �� | Earnings Release dated October 28, 2014 |
| 99.2 | �� | Supplemental Financial Information for the quarter ended September 30, 2014 |
Exhibit 99.1
�

�
| FOR IMMEDIATE RELEASE | �� | � | NYSE:ARI | �� | ||
| CONTACT: | �� | Hilary Ginsberg | �� | |||
| �� | Investor Relations | �� | ||||
| �� | (212) 822-0767 | �� | ||||
APOLLO COMMERCIAL REAL ESTATE FINANCE, INC. REPORTS
THIRD QUARTER 2014 FINANCIAL RESULTS AND
DECLARES A COMMON STOCK QUARTERLY DIVIDEND OF $0.40 PER SHARE
� 26% Increase in Operating Earnings Per Share �
New York, NY, October�28, 2014 � Apollo Commercial Real Estate Finance, Inc. (the �Company� or �ARI�) (NYSE: ARI) today reported financial results for the quarter and nine month period ended September�30, 2014.
Third Quarter 2014 and Recent Highlights
�
| � | � | � | Reported Operating Earnings (a non-GAAP financial measure defined below) per share of common stock of $0.44 for the quarter ended September�30, 2014, an increase of 26% as compared to Operating Earnings per share of common stock of $0.35 for the quarter ended September�30, 2013; |
�
| � | � | � | Generated $26.6 million of net interest income from the Company�s $1.5 billion commercial real estate debt portfolio, which had a weighted average underwritten internal rate of return (�IRR�) of approximately 13.1% and a levered weighted average underwritten IRR of approximately 13.7% at September�30, 2014; |
�
| � | � | � | Closed $69.5 million of commercial real estate loans and invested $35.6 million of equity into commercial mortgage-backed securities (�CMBS�) with an aggregate purchase price of $178.2 million; |
�
| � | � | � | Completed an offering of $111.0 million aggregate principal amount of 5.50% Convertible Senior Notes due 2019; |
�
| � | � | � | Closed the acquisition of a minority participation in KBC Bank Deutschland AG (�KBCD�) together with other investors, including other affiliates of Apollo Global Management, LLC (�Apollo�); and |
�
| � | � | � | Subsequent to quarter end, invested $4.7 million of equity into CMBS with an aggregate purchase price of $23.3 million, bringing year-to-date investments to $1.0 billion. |
�ARI delivered a strong quarter of operating and financial performance, driven by the Company�s diversified investment portfolio and expanded capital base,� said Stuart Rothstein, Chief Executive Officer and President of the Company. �ARI continued to deploy capital into a variety of well-structured commercial real estate debt investments, which totaled $1.0 billion year-to-date. While the commercial real estate finance market remains competitive, we believe ARI continues to benefit from Apollo�s broad origination capabilities and global integrated platform. The Company has a substantial investment pipeline with a broad mix of asset classes and geographies. Importantly, we believe ARI is well positioned for a rising interest rate environment, as 50% of the loans in the Company�s portfolio have floating interest rates and the pipeline for future investments contains predominately floating rate loans as well.�
Third Quarter 2014 Operating Results
The Company reported Operating Earnings of $20.8 million, or $0.44 per share, for the three months ended September�30, 2014, representing a per share increase of 26% as compared to Operating Earnings of $13.3 million, or $0.35 per share, for the three months ended September�30, 2013. Net income available to common stockholders for the three months ended September�30, 2014 was $17.3 million, or $0.37 per share, as compared to net income available to common stockholders of $11.0 million, or $0.29 per share, for the three months ended September�30, 2013.
For the nine months ended September�30, 2014, the Company reported Operating Earnings of $52.8 million, or $1.24 per share, representing an 18%�per share increase as compared to Operating Earnings of $37.0 million, or $1.05 per share, for the nine months ended September�30, 2013. Net income available to common stockholders for the nine months ended September�30, 2014 was $55.1 million, or $1.30 per share, as compared to net income available to common stockholders of $31.0 million, or $0.88 per share, for the nine months ended September�30, 2013.
Third Quarter 2014 Investment and Portfolio Activity
New Investments � During the third quarter, ARI closed $287.2 million of commercial real estate and real estate-related debt transactions, including the KBCD transaction. ARI�s third quarter investments included the following transactions:
�
| � | � | � | $20.0 million floating-rate mezzanine loan secured by the equity interest in a 280-key hotel in the NoMad neighborhood of New York City. The mezzanine loan has a two-year initial term and three one-year extension options and an appraised loan-to-value (�LTV�) of approximately 61%. The mezzanine loan was underwritten to generate an IRR of approximately 12%; |
�
| � | � | � | $34.5 million ($30.0 million of which was funded at closing) floating-rate, first mortgage loan secured by a newly constructed, Class-A, 63-unit multifamily property located in Brooklyn, New York, which also includes approximately 7,300 square feet of retail space and 31 parking spaces. The first mortgage loan has a two-year initial term with three one-year extension options and an appraised LTV of approximately 63% based upon the initial funding. The future funding is contingent upon the property achieving certain occupancy and cash flow hurdles. On a levered basis, the loan was underwritten to generate an IRR of approximately 12%; |
�
| � | � | � | $15 million fixed-rate subordinate loan secured by a top-tier ski resort located in Montana. ARI�s loan has a six-year term and an appraised LTV of approximately 59%. The subordinate loan has been underwritten to generate an IRR of approximately 15%; |
�
| � | � | � | �30.7�million ($39.5 million) investment in an entity that acquired a minority participation in KBCD. As of December�31, 2013, KBCD had total assets of �2,187 million. Following the closing of the transaction, KBCD was renamed Bremer Kreditbank AG and will operate under the name BKB Bank; and |
�
| � | � | � | $35.6 million of equity for the acquisition of CMBS with an aggregate purchase price of $178.2 million. ARI financed the CMBS utilizing $142.5 million of borrowings under the Company�s master repurchase agreement with Deutsche Bank AG (the �Deutsche Bank Facility�), which was amended during the quarter and then again subsequent to quarter end to expand the total borrowing capacity to $300 million from $200 million. The CMBS have a weighted average life of 2.8 years and have been underwritten to generate an IRR of approximately 17%. |
Loan Repayment � During the third quarter, ARI received a $50 million principal repayment from a mezzanine loan secured by a pledge of the equity interests in a portfolio of office properties located throughout Florida. ARI realized a 13% IRR on this mezzanine investment.
Third Quarter 2014 Capital Markets Activity
Convertible Notes Offering � In August, the Company completed a public offering of $111.0 million aggregate principal amount of its 5.50% Convertible Senior Notes due 2019 (the �Notes�). The Notes were priced at 102% of face value plus accrued interest from, and including, March�17, 2014. The Notes are an additional issuance of, are fully fungible with and form a single series with the $143,750,000 aggregate principal amount of the Company�s 5.50% Convertible Senior Notes due 2019 issued in March 2014. The conversion rate will initially equal 55.3649 shares of common stock per $1,000 principal amount of Notes, which is equivalent to a conversion price of approximately $18.06 per share of common stock.
�
2
Quarter End Commercial Real Estate Debt Portfolio Summary
The following table sets forth certain information regarding the Company�s commercial real estate debt portfolio at September�30, 2014 ($ amounts in thousands):
�
| Description |
�� | Amortized Cost |
� | �� | Weighted Average Yield |
� | � | Debt | � | �� | Cost of Funds |
� | � | Equity at Cost(1) |
� | �� | Current Weighted Average Underwritten IRR (2) |
� | � | Levered Weighted Average Underwritten IRR(2)(3) |
� | |||||||
| First mortgage loans |
�� | $ | 369,924 | �� | �� | � | 8.9 | %� | � | $ | 122,722 | �� | �� | � | 2.7 | %� | � | $ | 247,202 | �� | �� | � | 13.0 | %� | � | � | 15.6 | %� |
| Subordinate loans |
�� | � | 585,504 | �� | �� | � | 12.0 | �� | � | � | ��� | �� | �� | � | ��� | �� | � | � | 585,504 | �� | �� | � | 12.8 | �� | � | � | 12.8 | �� |
| CMBS, held-to-maturity(4)(5) |
�� | � | 64,580 | �� | �� | � | 12.2 | �� | � | � | ��� | �� | �� | � | ��� | �� | � | � | 64,580 | �� | �� | � | 12.2 | �� | � | � | 12.2 | �� |
| CMBS |
�� | � | 511,445 | �� | �� | � | 6.3 | �� | � | � | 415,044 | �� | �� | � | 3.3 | �� | � | � | 99,988 | �� | �� | � | 16.1 | �� | � | � | 16.1 | �� |
| �� | � |
� |
� | �� | � |
� |
� | � | � |
� |
� | �� | � |
� |
� | � | � |
� |
� | �� | � |
� |
� | � | � |
� |
� | |
| Total/Weighted Average |
�� | $ | 1,531,453 | �� | �� | � | 9.4 | %� | � | $ | 537,766 | �� | �� | � | 3.2 | %� | � | $ | 997,274 | �� | �� | � | 13.1 | %� | � | � | 13.7 | %� |
| �� | � |
� |
� | �� | � |
� |
� | � | � |
� |
� | �� | � |
� |
� | � | � |
� |
� | �� | � |
� |
� | � | � |
� |
� | |
�
| (1) | CMBS includes $30,127 of restricted cash related to the Company�s repurchase facility with UBS AG and $26,540 related to investments purchased but not yet settled. |
| (2) | The underwritten IRR for the investments shown in the above table and elsewhere in this press release reflect the returns underwritten by ACREFI Management, LLC, the Company�s external manager, calculated on a weighted average basis assuming no dispositions, early prepayments or defaults but assuming that extension options are exercised and that the cost of borrowings remains constant over the remaining term. With respect to certain loans, the underwritten IRR calculation assumes certain estimates with respect to the timing and magnitude of future fundings for the remaining commitments and associated loan repayments, and assumes no defaults. IRR is the annualized effective compounded return rate that accounts for the time-value of money and represents the rate of return on an investment over a holding period expressed as a percentage of the investment. It is the discount rate that makes the net present value of all cash outflows (the costs of investment) equal to the net present value of cash inflows (returns on investment). It is derived from the negative and positive cash flows resulting from or produced by each transaction (or for a transaction involving more than one investment, cash flows resulting from or produced by each of the investments), whether positive, such as investment returns, or negative, such as transaction expenses or other costs of investment, taking into account the dates on which such cash flows occurred or are expected to occur, and compounding interest accordingly. There can be no assurance that the actual IRRs will equal the underwritten IRRs shown in the table.�See �Item 1A�Risk Factors�The Company may not achieve its underwritten internal rate of return on its investments which may lead to future returns that may be significantly lower than anticipated� included in the Company�s Annual Report on Form 10-K for the year ended December�31, 2013 for a discussion of some of the factors that could adversely impact the returns received by the Company from the investments shown in the table over time. |
| (3) | The Company�s ability to achieve its underwritten levered weighted average IRR with regard to its portfolio of first mortgage loans is additionally dependent upon the Company utilizing its master repurchase agreement with JPMorgan Chase Bank, N.A. or any replacement facility with similar terms and re-borrowing approximately $52,278 in total.�Without such re-borrowing, the levered weighted average underwritten IRRs will be as indicated in the current weighted average underwritten IRR column above. |
| (4) | CMBS, held-to-maturity, represents a loan the Company closed during May 2014 that was subsequently contributed to a securitization during August 2014. During May 2014, the Company closed a $155,000 floating-rate whole loan secured by the first mortgage and equity interests in an entity that owns a resort hotel in Aruba. During June 2014, the Company syndicated a $90,000 senior participation in the loan and retained a $65,000 junior participation. During August 2014, both the $90,000 senior participation and the Company�s $65,000 junior participation were contributed to a CMBS securitization. In exchange for contributing its $65,000 junior participation, the Company received a CMBS secured solely by the $65,000 junior participation. |
| (5) | CMBS, held-to-maturity, are net of the participation sold during June 2014 described above. ARI presents the participation sold as both assets and non-recourse liabilities because the participation does not qualify as a sale according to GAAP. At September�30, 2014, ARI had one such participation sold with a carrying amount of $89,418. |
Loan-to-Value
At September�30, 2014, the Company�s commercial real estate loan portfolio, which includes CMBS, held-to-maturity, had a weighted average LTV of 58%. Within the commercial real estate loan portfolio, the first mortgage loans had a weighted average LTV of 49% and the subordinate loans and CMBS, held-to-maturity, had a weighted average LTV of 63%.
�
3
Book Value
The Company�s book value per share at September�30, 2014 was $16.42, an increase of 1% as compared to book value per share of $16.30 at June�30, 2014. For purposes of GAAP accounting, the Company carries loans at amortized cost and its CMBS are marked to market. Management has estimated that the fair value of the Company�s loan portfolio at September�30, 2014 was approximately $7.0 million greater than the carrying value as of the same date.
Subsequent Events
New Investments � Subsequent to quarter end, ARI invested $4.7 million of equity into CMBS with an aggregate purchase price of $23.3 million.
Dividend � ARI�s Board of Directors declared a dividend of $0.40 per share of common stock, which is payable on January�15, 2015 to common stockholders of record on December�31, 2014.
Definition of Operating Earnings
Operating Earnings is a non-GAAP financial measure that is used by the Company to approximate cash available for distribution and is defined by the Company as net income available to common stockholders, computed in accordance with GAAP, adjusted for (i)�equity-based compensation expense (a portion of which may become cash-based upon final vesting and settlement of awards should the holder elect net share settlement to satisfy income tax withholding); (ii)�any unrealized gains or losses or other non-cash items included in net income available to common stockholders; (iii)�unrealized income from equity investments; and (iv)�the non-cash amortization expense related to the reclassification of a portion of the senior convertible notes to stockholders� equity in accordance with GAAP.
Reconciliation of Operating Earnings to Net Income Available to Common Stockholders
The tables below reconcile Operating Earnings and Operating Earnings per share with net income available to common stockholders and net income available to common stockholders per share for the three and nine month periods ended September�30, 2014 and September�30, 2013 ($ amounts in thousands, except share and per share data):
�
| � | �� | Three Months Ended September�30, 2014 |
� | � | Earnings�Per Share (Diluted) |
� | � | Three Months Ended September�30, 2013 |
� | � | Earnings Per�Share (Diluted) |
� | ||||
| Operating Earnings: |
�� | � | � | � | ||||||||||||
| Net income available to common stockholders |
�� | $ | 17,299 | �� | � | $ | 0.37 | �� | � | $ | 11,041 | �� | � | $ | 0.29 | �� |
| Adjustments: |
�� | � | � | � | ||||||||||||
| Unrealized (gain)/loss on securities |
�� | � | 2,147 | �� | � | � | 0.04 | �� | � | � | 1,472 | �� | � | � | 0.04 | �� |
| Unrealized (gain)/loss on derivative instruments |
�� | � | (3,026 | )� | � | � | (0.07 | )� | � | � | (25 | )� | � | � | ��� | �� |
| Foreign currency loss |
�� | � | 3,596 | �� | � | � | 0.08 | �� | � | � | ��� | �� | � | � | ��� | �� |
| Equity-based compensation expense |
�� | � | 308 | �� | � | � | 0.01 | �� | � | � | 784 | �� | � | � | 0.02 | �� |
| Income from equity investment |
�� | � | 88 | �� | � | � | ��� | �� | � | � | ��� | �� | � | � | ��� | �� |
| Amortization of convertible notes related to equity reclassification |
�� | � | 356 | �� | � | � | 0.01 | �� | � | � | ��� | �� | � | � | ��� | �� |
| �� | � |
� |
� | � | � |
� |
� | � | � |
� |
� | � | � |
� |
� | |
| Total adjustments: |
�� | � | 3,469 | �� | � | � | 0.07 | �� | � | � | 2,231 | �� | � | � | 0.06 | �� |
| �� | � |
� |
� | � | � |
� |
� | � | � |
� |
� | � | � |
� |
� | |
| Operating Earnings |
�� | $ | 20,768 | �� | � | $ | 0.44 | �� | � | $ | 13,272 | �� | � | $ | 0.35 | �� |
| �� | � |
� |
� | � | � |
� |
� | � | � |
� |
� | � | � |
� |
� | |
| Basic weighted average shares of common stock outstanding: |
�� | � | 46,848,675 | �� | � | � | � | 36,883,002 | �� | � | ||||||
| Diluted weighted average shares of common stock outstanding: |
�� | � | 47,068,929 | �� | � | � | � | 37,379,469 | �� | � | ||||||
�
4
| � | �� | Nine Months Ended September�30, 2014 |
� | � | Earnings�Per Share (Diluted) |
� | � | Nine Months Ended September�30, 2013 |
� | � | Earnings Per�Share (Diluted) |
� | ||||
| Operating Earnings: |
�� | � | � | � | ||||||||||||
| Net income available to common stockholders |
�� | $ | 55,118 | �� | � | $ | 1.30 | �� | � | $ | 31,041 | �� | � | $ | 0.88 | �� |
| Adjustments: |
�� | � | � | � | ||||||||||||
| Unrealized (gain)/loss on securities |
�� | � | (4,787 | )� | � | � | (0.11 | )� | � | � | 3,973 | �� | � | � | 0.11 | �� |
| Unrealized (gain)/loss on derivative instruments |
�� | � | (1,933 | )� | � | � | (0.05 | )� | � | � | (155 | )� | � | � | ��� | �� |
| Foreign currency loss |
�� | � | 2,637 | �� | � | � | 0.06 | �� | � | � | ��� | �� | � | � | ��� | �� |
| Equity-based compensation expense |
�� | � | 1,096 | �� | � | � | 0.03 | �� | � | � | 2,095 | �� | � | � | 0.06 | �� |
| Income from equity investments |
�� | � | 88 | �� | � | � | ��� | �� | � | � | ��� | �� | � | � | ��� | �� |
| Amortization of convertible notes related to equity reclassification |
�� | � | 586 | �� | � | � | 0.01 | �� | � | � | ��� | �� | � | � | ��� | �� |
| �� | � |
� |
� | � | � |
� |
� | � | � |
� |
� | � | � |
� |
� | |
| Total adjustments: |
�� | � | (2,313 | )� | � | � | (0.06 | )� | � | � | 5,913 | �� | � | � | 0.17 | �� |
| �� | � |
� |
� | � | � |
� |
� | � | � |
� |
� | � | � |
� |
� | |
| Operating Earnings |
�� | $ | 52,805 | �� | � | $ | 1.24 | �� | � | $ | 36,954 | �� | � | $ | 1.05 | �� |
| �� | � |
� |
� | � | � |
� |
� | � | � |
� |
� | � | � |
� |
� | |
| Basic weighted average shares of common stock outstanding: |
�� | � | 42,322,380 | �� | � | � | � | 34,647,941 | �� | � | ||||||
| Diluted weighted average shares of common stock outstanding: |
�� | � | 42,538,744 | �� | � | � | � | 35,103,285 | �� | � | ||||||
Teleconference Details:
The Company will host a conference call to discuss its financial results on Wednesday, October�29, 2014 at 9:00 a.m. Eastern Time. Members of the public who are interested in participating in the Company�s third quarter 2014 earnings teleconference call should dial from the U.S., (877)�331-6553, or from outside the U.S., (760)�666-3769, shortly before 9:00 a.m. and reference the Apollo Commercial Real Estate Finance, Inc. Teleconference Call (number 15213082). Please note the teleconference call will be available for replay beginning at 1:00 p.m. on Wednesday, October�29, 2014, and ending at midnight on Wednesday, November�5, 2014. To access the replay, callers from the U.S. should dial (855)�859-2056 and callers from outside the U.S. should dial (404)�537-3406, and enter conference identification number 15213082.
Webcast:
The conference call will also be available on the Company�s website at www.apolloreit.com. To listen to a live broadcast, please go to the site at least 15 minutes prior to the scheduled start time in order to register, download and install any necessary audio software. A replay of the call will also be available for 30 days on the Company�s website.
Supplemental Information
The Company provides supplemental financial information to offer more transparency into its results and make its reporting more informative and easier to follow. The supplemental financial information is available in the investor relations section of the Company�s website at www.apolloreit.com.
About Apollo Commercial Real Estate Finance, Inc.
Apollo Commercial Real Estate Finance, Inc. (NYSE: ARI) is a real estate investment trust that primarily originates, acquires, invests in and manages performing commercial real estate mortgage loans, subordinate financings, CMBS and other commercial real estate-related debt investments. The Company is externally managed and advised by ACREFI Management, LLC, a Delaware limited liability company and an indirect subsidiary of Apollo Global Management, LLC, a leading global alternative investment manager with approximately $168 billion of assets under management at June�30, 2014.
Additional information can be found on the Company�s website at www.apolloreit.com.
�
5
Dividend Reinvestment Plan
The Company adopted a Direct Stock Purchase and Dividend Reinvestment Plan (the �Plan�). The Plan provides new investors and existing holders of the Company�s common stock with a convenient and economical method to purchase shares of its common stock. By participating in the Plan, participants may purchase additional shares of the Company�s common stock by reinvesting some or all of the cash dividends received on their shares of the Company�s common stock. In addition, the Plan permits participants to make optional cash investments of up to $10,000 per month, and, with the Company�s prior approval, optional cash investments in excess of $10,000 per month, for the purchase of additional shares of the Company�s common stock.
The Plan is administered by a division of Wells Fargo Bank, N.A. (�Wells�). Stockholders and other persons may obtain a copy of the Plan prospectus and an enrollment form by contacting Wells at (800)�468-9716 or (651)�450-4064, if outside the United States, or visiting Wells� website at www.shareowneronline.com.
This communication does not constitute an offer to sell or the solicitation of an offer to buy securities.
Forward-Looking Statements
Certain statements contained in this press release constitute forward-looking statements as such term is defined in Section�27A of the Securities Act of 1933, as amended, and Section�21E of the Securities Exchange Act of 1934, as amended, and such statements are intended to be covered by the safe harbor provided by the same. Forward-looking statements are subject to substantial risks and uncertainties, many of which are difficult to predict and are generally beyond the Company�s control. These forward-looking statements include information about possible or assumed future results of the Company�s business, financial condition, liquidity, results of operations, plans and objectives. When used in this release, the words believe, expect, anticipate, estimate, plan, continue, intend, should, may or similar expressions, are intended to identify forward-looking statements. Statements regarding the following subjects, among others, may be forward-looking: the return on equity; the yield on investments; the ability to borrow to finance assets; the Company�s ability to deploy the proceeds of its capital raises or acquire its target assets; and risks associated with investing in real estate assets, including changes in business conditions and the general economy. For a further list and description of such risks and uncertainties, see the reports filed by the Company with the Securities and Exchange Commission. The forward-looking statements, and other risks, uncertainties and factors are based on the Company�s beliefs, assumptions and expectations of its future performance, taking into account all information currently available to the Company. Forward-looking statements are not predictions of future events. The Company disclaims any intention or obligation to update or revise any forward-looking statements, whether as a result of new information, future events or otherwise, except as required by law.
�
6
Apollo Commercial Real Estate Finance, Inc. and Subsidiaries
Condensed Consolidated Balance Sheets (Unaudited)
(in thousands�except share and per share data)
�
| � | �� | September�30,�2014 | � | � | December�31,�2013 | � | ||
| Assets: |
�� | � | ||||||
| Cash |
�� | $ | 58,649 | �� | � | $ | 20,096 | �� |
| Restricted cash |
�� | � | 30,127 | �� | � | � | 30,127 | �� |
| Securities available-for-sale, at estimated fair value |
�� | � | 17,919 | �� | � | � | 33,362 | �� |
| Securities, at estimated fair value |
�� | � | 499,701 | �� | � | � | 158,086 | �� |
| Securities, held-to-maturity |
�� | � | 153,998 | �� | � | � | ��� | �� |
| Commercial mortgage loans, held for investment |
�� | � | 369,924 | �� | � | � | 161,099 | �� |
| Subordinate loans, held for investment |
�� | � | 585,504 | �� | � | � | 497,484 | �� |
| Investment in unconsolidated joint venture |
�� | � | 38,719 | �� | � | � | ��� | �� |
| Derivative instrument |
�� | � | 1,933 | �� | � | � | ��� | �� |
| Interest receivable |
�� | � | 17,072 | �� | � | � | 6,022 | �� |
| Deferred financing costs, net |
�� | � | 8,124 | �� | � | � | 628 | �� |
| Other assets |
�� | � | 1,342 | �� | � | � | 600 | �� |
| �� | � |
� |
� | � | � |
� |
� | |
| Total Assets |
�� | $ | 1,783,012 | �� | � | $ | 907,504 | �� |
| �� | � |
� |
� | � | � |
� |
� | |
| Liabilities and Stockholders� Equity |
�� | � | ||||||
| Liabilities: |
�� | � | ||||||
| Borrowings under repurchase agreements |
�� | $ | 537,766 | �� | � | $ | 202,033 | �� |
| Convertible senior notes, net |
�� | � | 246,054 | �� | � | � | ��� | �� |
| Participations sold |
�� | � | 89,418 | �� | � | � | ��� | �� |
| Investments purchased, not yet settled |
�� | � | 26,540 | �� | � | � | ��� | �� |
| Accounts payable and accrued expenses |
�� | � | 3,602 | �� | � | � | 2,660 | �� |
| Payable to related party |
�� | � | 3,193 | �� | � | � | 2,628 | �� |
| Dividends payable |
�� | � | 20,753 | �� | � | � | 17,227 | �� |
| �� | � |
� |
� | � | � |
� |
� | |
| Total Liabilities |
�� | � | 927,326 | �� | � | � | 224,548 | �� |
| Stockholders� Equity: |
�� | � | ||||||
| Preferred stock, $0.01 par value, 50,000,000 shares authorized and 3,450,000 shares issued and outstanding in 2014 and 2013 ($86,250 aggregate liquidation preference) |
�� | � | 35 | �� | � | � | 35 | �� |
| Common stock, $0.01 par value, 450,000,000 shares authorized, 46,848,675 and 36,888,467 shares issued and outstanding in 2014 and 2013, respectively |
�� | � | 468 | �� | � | � | 369 | �� |
| Additional paid-in-capital |
�� | � | 867,598 | �� | � | � | 697,610 | �� |
| Retained earnings (accumulated deficit) |
�� | � | (11,661 | )� | � | � | (14,188 | )� |
| Accumulated other comprehensive loss |
�� | � | (754 | )� | � | � | (870 | )� |
| �� | � |
� |
� | � | � |
� |
� | |
| Total Stockholders� Equity |
�� | � | 855,686 | �� | � | � | 682,956 | �� |
| �� | � |
� |
� | � | � |
� |
� | |
| Total Liabilities and Stockholders� Equity |
�� | $ | 1,783,012 | �� | � | $ | 907,504 | �� |
| �� | � |
� |
� | � | � |
� |
� | |
�
�
7
Apollo Commercial Real Estate Finance, Inc. and Subsidiaries
Condensed Consolidated Statement of Operations (Unaudited)
(in thousands�except share and per share data)
�
| � | �� | Three months ended September�30, |
� | � | Nine months ended September�30, |
� | ||||||||||
| � | �� | 2014 | � | � | 2013 | � | � | 2014 | � | � | 2013 | � | ||||
| Net interest income: |
�� | � | � | � | ||||||||||||
| Interest income from securities |
�� | $ | 6,129 | �� | � | $ | 2,533 | �� | � | $ | 12,914 | �� | � | $ | 8,634 | �� |
| Interest income from securities, held to maturity |
�� | � | 2,219 | �� | � | � | ��� | �� | � | � | 2,219 | �� | � | � | ��� | �� |
| Interest income from commercial mortgage loans |
�� | � | 8,025 | �� | � | � | 4,954 | �� | � | � | 18,475 | �� | � | � | 12,222 | �� |
| Interest income from subordinate loans |
�� | � | 18,983 | �� | � | � | 12,184 | �� | � | � | 51,951 | �� | � | � | 35,137 | �� |
| Interest income from repurchase agreements |
�� | � | ��� | �� | � | � | ��� | �� | � | � | ��� | �� | � | � | 2 | �� |
| Interest expense |
�� | � | (8,786 | )� | � | � | (885 | )� | � | � | (15,802 | )� | � | � | (2,909 | )� |
| �� | � |
� |
� | � | � |
� |
� | � | � |
� |
� | � | � |
� |
� | |
| Net interest income |
�� | � | 26,570 | �� | � | � | 18,786 | �� | � | � | 69,757 | �� | � | � | 53,086 | �� |
| Operating expenses: |
�� | � | � | � | ||||||||||||
| General and administrative expenses (includes $308 and $1,096 of equity-based compensation in 2014 and $784 and $2,095 in 2013, respectively) |
�� | � | (1,434 | )� | � | � | (1,793 | )� | � | � | (4,355 | )� | � | � | (5,126 | )� |
| Management fees to related party |
�� | � | (3,193 | )� | � | � | (2,625 | )� | � | � | (8,725 | )� | � | � | (7,384 | )� |
| �� | � |
� |
� | � | � |
� |
� | � | � |
� |
� | � | � |
� |
� | |
| Total operating expenses |
�� | � | (4,627 | )� | � | � | (4,418 | )� | � | � | (13,080 | )� | � | � | (12,510 | )� |
| Income from equity investment |
�� | � | (88 | )� | � | � | ��� | �� | � | � | (88 | )� | � | � | ��� | �� |
| Interest income from cash balances |
�� | � | 21 | �� | � | � | 3 | �� | � | � | 26 | �� | � | � | 19 | �� |
| Unrealized gain/(loss) on securities |
�� | � | (2,147 | )� | � | � | (1,472 | )� | � | � | 4,787 | �� | � | � | (3,973 | )� |
| Foreign currency gain/(loss) |
�� | � | (3,596 | )� | � | � | ��� | �� | � | � | (2,637 | )� | � | � | ��� | �� |
| Gain/(loss) on derivative instruments (includes $3,026 and $1,933 of unrealized gains in 2014 and $25 and $155 of unrealized gains in 2013, respectively) |
�� | � | 3,026 | �� | � | � | 1 | �� | � | � | 1,933 | �� | � | � | (1 | )� |
| �� | � |
� |
� | � | � |
� |
� | � | � |
� |
� | � | � |
� |
� | |
| Net income |
�� | � | 19,159 | �� | � | � | 12,900 | �� | � | � | 60,698 | �� | � | � | 36,621 | �� |
| �� | � |
� |
� | � | � |
� |
� | � | � |
� |
� | � | � |
� |
� | |
| Preferred dividend |
�� | � | (1,860 | )� | � | � | (1,859 | )� | � | � | (5,580 | )� | � | � | (5,580 | )� |
| �� | � |
� |
� | � | � |
� |
� | � | � |
� |
� | � | � |
� |
� | |
| Net income available to common stockholders |
�� | $ | 17,299 | �� | � | $ | 11,041 | �� | � | $ | 55,118 | �� | � | $ | 31,041 | �� |
| �� | � |
� |
� | � | � |
� |
� | � | � |
� |
� | � | � |
� |
� | |
| Basic and diluted net income per share of common stock |
�� | $ | 0.37 | �� | � | $ | 0.29 | �� | � | $ | 1.30 | �� | � | $ | 0.88 | �� |
| �� | � |
� |
� | � | � |
� |
� | � | � |
� |
� | � | � |
� |
� | |
| Basic weighted average shares of common stock outstanding |
�� | � | 46,848,675 | �� | � | � | 36,883,002 | �� | � | � | 42,332,380 | �� | � | � | 34,647,941 | �� |
| �� | � |
� |
� | � | � |
� |
� | � | � |
� |
� | � | � |
� |
� | |
| Diluted weighted average shares of common stock outstanding |
�� | � | 47,068,929 | �� | � | � | 37,379,469 | �� | � | � | 42,538,744 | �� | � | � | 35,103,285 | �� |
| �� | � |
� |
� | � | � |
� |
� | � | � |
� |
� | � | � |
� |
� | |
| Dividend declared per share of common stock |
�� | $ | 0.40 | �� | � | $ | 0.40 | �� | � | $ | 1.20 | �� | � | $ | 1.20 | �� |
| �� | � |
� |
� | � | � |
� |
� | � | � |
� |
� | � | � |
� |
� | |
�
8
 October 29, 2014
Supplemental Financial Information Presentation
Q3 2014
Information is as of September 30, 2014 except as otherwise noted.�
It should not be assumed that investments made in the future will
be profitable or will equal the performance of investments in this document.
Exhibit 99.2 |
 Legal Disclaimer
1
COMMERCIAL REAL ESTATE FINANCE, INC. (�ARI�)
This presentation may contain forward-looking statements that are
within the meaning of Section 27A of the Securities Act of 1933, as amended, and Section 21E of the Securities
Exchange Act of 1934, as amended, and such statements are intended to
be covered by the safe harbor provided by the same. Forward-looking statements are subject to substantial risks
and uncertainties, many of which are difficult to predict and are
generally beyond management�s control. These forward-looking statements include information about possible
or assumed future results of Apollo Commercial Real Estate Finance,
Inc.�s (�ARI� or the �Company�) business, financial condition, liquidity, results of operations, plans and
objectives. When used in this presentation, the words
�believe,� �expect,� �anticipate,� �estimate,� �plan,� �continue,� �intend,� �should,� �may� or similar expressions, are
intended to identify forward-looking statements. Statements
regarding the following subjects, among others, may be forward-looking: ARI�s business and investment strategy; ARI�s
operating results; ARI�s ability to obtain and maintain financing
arrangements; the return on equity, the yield on investments and risks associated with investing in real estate
assets, including changes in business conditions and the general
economy. The forward-looking
statements are based on management�s beliefs, assumptions and expectations of future performance, taking into account all information currently available to ARI.
Forward-looking statements are not predictions of future events.
These beliefs, assumptions and expectations can change as a result of many possible events or factors, not all
of which are known to ARI. Some of these factors are described under
�Risk Factors,� and �Management�s Discussion and Analysis of Financial Condition and Results of
Operations� as included in ARI�s Annual Report on Form
10-K for the fiscal year ended December 31, 2013 and other periodic reports filed with the Securities and Exchange
Commission (�SEC�), which are accessible on the SEC�s
website at www.sec.gov. If a change occurs, ARI�s business, financial condition, liquidity and results of operations may vary
materially from those expressed in ARI�s forward-looking
statements. Any forward-looking statement speaks only as of the date on which it is made. New risks and uncertainties arise
over time, and it is not possible for management to predict those
events or how they may affect ARI. Except as required by law, ARI is not obligated to, and does not intend to, update or
revise any forward-looking statements, whether as a result of new
information, future events or otherwise.
This presentation contains information regarding ARI�s financial
results that is calculated and presented on the basis of methodologies other than in accordance with accounting
principles generally accepted in the United States (�GAAP�),
including Operating Earnings and Operating Earnings per share.� Please refer to slide 3 for a definition of �Operating
Earnings� and the reconciliation of �Operating Earnings�
to the applicable GAAP financial measure set forth on slide 19.
This presentation may contain statistics and other data that in some
cases has been obtained from or compiled from information made available by third-party service providers.� ARI
makes no representation or warranty, expressed or implied, with respect
to the accuracy, reasonableness or completeness of such information.
Past performance is not indicative nor a guarantee of future
returns.
Index performance and yield data are shown for illustrative purposes
only and have limitations when used for comparison or for other purposes due to, among other matters, volatility,
credit or other factors (such as number and types of securities).�
Indices are unmanaged, do not charge any fees or expenses, assume reinvestment of income and do not employ special
investment techniques such as leveraging or short selling.� No
such index is indicative of the future results of any investment by ARI. |
 Apollo Commercial Real Estate Finance, Inc.
2014 Third Quarter Earnings Call
October 29, 2014
Stuart Rothstein
Chief Executive Officer and President
Scott Weiner
Chief Investment Officer of the Manager
Megan Gaul
Chief Financial Officer, Treasurer and Secretary
Hilary Ginsberg
Investor Relations Manager
2
COMMERCIAL REAL ESTATE FINANCE, INC. (�ARI�)
|
 ARI �
Financial Summary
COMMERCIAL REAL ESTATE FINANCE, INC. (�ARI�)
3
(1)
Operating
Earnings
is
a
non-GAAP
financial
measure
that
is
used
by
the
Company
to
approximate
cash
available
for
distribution
and
is
defined
by
the
Company
as
net
income
available
to
common
stockholders,
computed
in
accordance
with
GAAP,
adjusted
for
(i) equity-
based
compensation
expense
(a
portion
of
which
may
become
cash-based
upon
final
vesting
and
settlement
of
awards
should
the
holder
elect
net
share
settlement
to
satisfy
income
tax
withholding),
(ii)
any
unrealized
gains
or
losses
or
other
non-cash
items
included
in
net
income,
(iii)
unrealized
income
from
equity
investments
and
(iv)
the
non-cash
amortization
expense
related
to
the
reclassification
of
a
portion
of
the
senior
convertible
notes
to
stockholders�
equity
in
accordance
with
GAAP.
Please
see
slide
19
for
a
reconciliation
of
Operating
Earnings
and
Operating
Earnings
per
Share
to
GAAP
net
income
and
GAAP
net
income
per
share.
(2)
Commercial
Mortgage
Backed
Securities,
(�CMBS�)
held-to-maturity,
are
net
of
a
participation
sold
during
June
2014.
ARI
presents
the
participation
sold
as
both
assets
and
non-recourse
liabilities
because
the
participation
does
not
qualify
as
a
sale
according
to
GAAP.
At
September
30,
2014,
ARI
had
one
such
participation
sold
with
a
carrying
amount
of
$89,418
(3)
Fixed� charge� coverage� is� EBITDA�
divided� by� interest� expense� plus� the� preferred� stock� dividends.
Net interest income
Operating earnings
1,531,453
$��
997,274
$����
Common stockholders' equity
769,436
$����
86,250
$������
537,766
$����
Convertible senior notes
246,054
$����
1.21x
3.8x
Interest income
Interest expense
Operating earnings per share
Diluted weighted average shares of common
stock outstanding
Investments at amortized cost
Net equity in investments at cost
Preferred stockholders' equity
Debt to common equity
Outstanding repurchase agreement borrowings
Fixed charge coverage
($ amounts in thousands, except per share data)
Income Statement
September 30, 2014
September 30, 2013
% Change
September 30, 2014
September 30, 2013
% Change
35,356
$������
85,559
$������
$�������
52.8%
(8,786)
$������
(15,802)
$�����
(2,909)
$��������
443.2%
26,570
$������
69,757
$������
53,086
$�������
31.4%
20,768
$������
52,805
$������
36,954
$�������
42.9%
0.44
$���������
1.24
$���������
1.05
$�����������
18.1%
47,068,929
37,379,469
25.9%
42,538,744
35,103,285
21.2%
Three Months Ended
Nine Months Ended
19,671
$�����������
79.7%
$�����������
��� 892.8%
18,786
$�����������
41.4%
13,272
$�����������
56.5%
0.35
$�����������
���� 25.7%
Balance sheet
September 30, 2014
December 31, 2013
% Change
55,995
(885)
848,761
$����������
80.4%
676,855
$����������
47.3%
596,706
$����������
28.9%
86,250
$�����������
-
202,033
$����������
166.2%
$�����������
����� 100.0%
0.4x
5.3x
(1)
(1)
(2)
(3)
- |
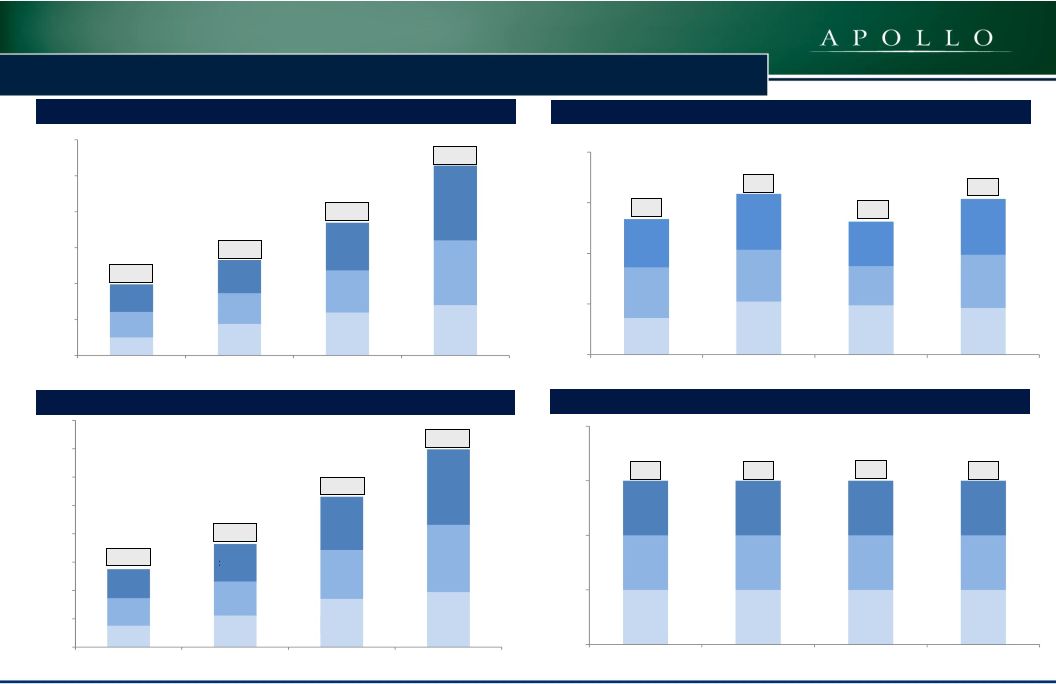 Operating Earnings ($000s)
(1)
Net Interest Income ($000s)
Dividends per Common Share
(1)
Operating Earnings is a non-GAAP financial measure that is used by
the Company to approximate cash available for distribution and is defined by the Company as net income available to common stockholders, computed in accordance with GAAP, adjusted for (i) equity-based compensation
expense (a portion of which may become cash-based upon final vesting
and settlement of awards should the holder elect net share settlement to satisfy income tax withholding), (ii) any unrealized gains or losses or other non-cash items included in net income, (iii) unrealized income from equity
investments and (iv) the non-cash amortization expense related to
the reclassification of a portion of the senior convertible notes to stockholders�
equity in accordance with GAAP.� Please see slide 19 for a
reconciliation of Operating Earnings and Operating Earnings per Share to GAAP net
income and GAAP net income per share.
Operating
Earnings
per
Common
Share
(1)
ARI �
Historical Financial Overview
$1.24
$1.05
$1.20
$1.20
$1.20
$1.20
$1.27
$1.07
$52,805
$36,954
$26,538
$19,775
$27,518
$36,375
$53,086
$69,757
$0
$10,000
$20,000
$30,000
$40,000
$50,000
$60,000
$5,047
$8,796
$7,086
$8,526
$7,643
$9,218
$11,963
$13,991
$11,721
$18,045
$13,272
$20,768
Nine Months Ended
September 30, 2011
Nine Months Ended
September 30, 2012
Nine Months Ended
September 30, 2013
Nine Months Ended
September 30, 2014
$0.00
$0.40
$0.80
$1.20
$1.60
$0.29
$0.42
$0.39
$0.37
$0.40
$0.41
$0.31
$0.42
$0.38
$0.44
$0.35
$0.44
Nine Months Ended
September 30, 2011
Nine Months Ended
September 30, 2012
Nine Months Ended
September 30, 2013
Nine Months Ended
September 30, 2014
$0
$10,000
$20,000
$30,000
$40,000
$50,000
$60,000
$70,000
$80,000
$7,599
$11,187
$17,067
$19,403
$9,683
$11,951
$17,233
$23,784
$10,236
$13,236
$18,786
$26,570
$0.00
$0.40
$0.80
$1.20
$1.60
Nine Months Ended
September 30, 2011
Nine Months Ended
September 30, 2012
Nine Months Ended
September 30, 2013
Nine Months Ended
September 30, 2014
$0.40
$0.40
$0.40
$0.40
$0.40
$0.40
$0.40
$0.40
$0.40
$0.40
$0.40
$0.40
Nine Months Ended
September 30, 2011
Nine Months Ended
September 30, 2012
Nine Months Ended
September 30, 2013
Nine Months Ended
September 30, 2014
4
COMMERCIAL REAL ESTATE FINANCE, INC. (�ARI�)
|
 5
COMMERCIAL REAL ESTATE FINANCE, INC. (�ARI�)
ARI �
Q3 Financial Highlights
Financial Results & Earnings Per Share
Operating Earnings for the quarter ended September 30, 2014 of $20.8
million, or $0.44 per share of common stock, a 26% per share
increase as compared to Operating Earnings of $13.3 million, or $0.35 per share of
common
stock
for
the
quarter
ended
September
30,
2013
(1)
�
Net interest income of $26.6 million for Q3 2014
�
Total expenses of $4.6 million, comprised of management fees of $3.2
million, G&A of $1.1 million and equity-based
compensation of $0.3 million
�
Net income available to common stockholders for the quarter ended
September 30, 2014 of $17.3 million, or $0.37 per diluted share
of common stock Dividends
Declared a dividend of $0.40 per share of common stock for the quarter
ending December 31, 2014 �
9.8% annualized dividend yield based on $16.40 closing price on
October 27, 2014 Declared a dividend on the Company�s 8.625%
Series A Cumulative Redeemable Perpetual Preferred Stock of
$0.5391 per share for stockholders of record on September 30,
2014 Book Value
GAAP book value of $16.42 per share as of September 30, 2014
(1)
Operating Earnings is a non-GAAP financial measure that is used by
the Company to approximate cash available for distribution and is defined by the Company as net income available to common stockholders, computed in accordance with GAAP, adjusted for (i) equity-based compensation
expense (a portion of which may become cash-based upon final vesting
and settlement of awards should the holder elect net share settlement to satisfy income tax withholding) (ii) any unrealized gains or losses or other non-cash items included in net income (iii) unrealized
income
from
equity
investments
and
(iv)
the
non-cash
amortization
expense
related
to
the
reclassification
of
a
portion
of
the
senior
convertible
notes
to
stockholders�
equity
in
accordance
with
GAAP.
Please
see
slide
19
for
a
reconciliation
of
Operating
Earnings
and
Operating
Earnings per
Share to GAAP net income and GAAP net income per share.
|
 6
COMMERCIAL REAL ESTATE FINANCE, INC. (�ARI�)
ARI �
Q3 New Investments
(1)
Based upon committed amount of loan.
(2)
The Internal Rate of Return (�IRR�) for the investments shown
in this presentation reflect the returns underwritten by ACREFI Management, LLC, the Company�s external manager (the �Manager�), calculated on a weighted average basis assuming no dispositions, early prepayments or defaults but
assuming that extension options are exercised and that the cost of
borrowings remains constant over the remaining term.� With respect to certain loans, the IRR calculation assumes certain estimates with respect to the timing and magnitude of future fundings for the remaining commitments and
associated loan repayments, and assumes no defaults. IRR is the
annualized effective compounded return rate that accounts for the time-value of money and represents the rate of return on an investment over a holding period expressed as a percentage of the investment. It is the discount rate that
makes the net present value of all cash outflows (the costs of
investment) equal to the net present value of cash inflows (returns on investment). It is derived from the negative and positive cash flows resulting from or produced by each transaction (or for a transaction involving more than one
investment,
cash
flows
resulting
from
or
produced
by
each
of
the
investments),
whether
positive,
such
as
investment
returns,
or
negative,
such
as
transaction
expenses
or
other
costs
of
investment,
taking
into
account
the
dates
on
which
such
cash
flows
occurred
or
are
expected
to
occur,
and
compounding interest accordingly. There can be no assurance that
the actual IRRs will equal the underwritten IRRs shown above.
See �Item 1A�Risk Factors�The Company may not achieve
its underwritten internal rate of return on its investments which may lead to future returns that may be
significantly lower than anticipated�
included in the Company�s Annual Report on Form 10-K for the
year ended December 31, 2013 for a discussion of some of the
factors that could adversely impact the returns received by the Company from the investments shown in the table over time.
Summary of New Investments
Q3 2014
9 Months Ended
9/30/2014
Number of Loans Closed
3
11
Capital Committed to Loans
($ in thousands)
46,725
$���������
608,715
$��������
Fixed Rate %/Floating Rate %
(1)
32%/68%
32%/68%
First Mortgage %/Subordinate Loan %
26%/74%
48%/52%
Weighted Average Loan-to-Value
63%
62%
Equity Invested in CMBS
($ in thousands)
35,631
$���������
75,001
$���������
Weighted Average Duration of CMBS
2.8 years
2.8 years
Total Capital Committed
($ in thousands)
82,356
$���������
683,716
$��������
Weighted Average IRR
(2)
15%
14% |
 ARI �
Q3 Investment, Portfolio & Capital Markets Activity
Investment and Portfolio Activity
KBC Bank Deutschland AG (�KBCD�) Transaction
�30.7 million ($39.5 million) investment in an entity that
acquired a minority participation in KBCD KBCD had total assets
of �2,187 billion as of December 31, 2013 KBCD
was
renamed
Bremer
Kreditbank
AG
and
will
operate
under
the
name
BKB
Bank
Loan Repayment
$50
million
principal
repayment
from
a
mezzanine
loan
secured
by
a
portfolio
of
Florida
office
properties
Realized IRR ~ 13%
Capital Markets Activity
Convertible Notes Offering
$112.5 million net proceeds raised from the underwritten public
offering of $111.0 million aggregate principal amount of 5.50%
Convertible Senior Notes due 2019; Notes were priced at 102% of face value, plus accrued
interest from, and including, March 17, 2014
Initial conversion rate equal to 55.3649 shares of common stock per
$1,000 principal amount of Notes, which is equivalent to a
conversion price of approximately $18.06 per share of common stock
Amendment of Credit Facility
During the quarter and subsequent to quarter end, expanded borrowing
capacity of master repurchase agreement with Deutsche Bank AG to
$300.0 million from $200.0 million �
�
�
�
�
�
�
�
7
COMMERCIAL REAL ESTATE FINANCE, INC. (�ARI�)
|
 8
COMMERCIAL REAL ESTATE FINANCE, INC. (�ARI�)
ARI �
Commercial Real Estate Debt Portfolio Overview
Asset Type
($000s)
Amortized
Cost
Borrowings
Equity
at
Cost
(1)
Remaining
Weighted
Average Life
(years )
(2)
Current
Weighted
Average
Underwritten
IRR
(3)(4)
Levered
Weighted
Average
Underwritten
IRR
(3)(4)(5)
First Mortgage Loans
$����������
369,924 $���������
122,722
$����������
247,202 2.9
13.0%
15.6%
Subordinate Loans
585,504
-
585,504
3.2
12.8
12.8
CMBS,
held-to-maturity
(6)(7)
64,580
-
64,580
4.6
12.2
12.2
CMBS
511,445
-
99,988
2.5
16.1
16.1
Investments at September 30, 2014
$������� 1,531,453
$��������� 537,766
$����������
997,274 3.0 Years
13.1%
13.7%
(1)
CMBS includes $30.1 million of restricted cash related to the
Company�s master repurchase agreement with UBS AG (the �UBS Facility�) and $26.5 million related to investments purchased but not yet settled.
(2)
Remaining Weighted Average Life assumes all extension options are
exercised. (3)
Borrowings under the Company�s master repurchase agreement with
JPMorgan Chase Bank, N.A. (the �JPMorgan Facility�) bear interest at LIBOR plus 250 basis points, or 2.7% at September 30, 2014. The IRR calculation further assumes the JPMorgan Facility or any replacement facility will remain available
over the life of these investments.
(4)
The underwritten IRR for the investments shown in this table reflect the
returns underwritten by the Manager, calculated on a weighted average basis assuming no dispositions, early prepayments or defaults but assuming that extension options are exercised and that the cost of borrowings remains� constant over the
remaining term.� With respect to certain loans, the
underwritten IRR calculation assumes certain estimates with respect to the timing and magnitude of future fundings for the remaining commitments and associated loan repayments, and assumes no defaults. IRR is the annualized effective compounded
return rate that accounts for the time-value of money and
represents the rate of return on an investment over a holding period
expressed as a percentage of the investment. It is the discount rate that makes the net present value of all cash outflows (the costs of investment) equal to the net present value of cash inflows (returns on investment). It is derived from the
negative and positive cash flows resulting from or produced by
each transaction (or for a transaction involving more than one investment, cash flows resulting from or produced by each of the investments), whether positive, such as investment returns, or negative, such as transaction expenses or other costs of
investment, taking into account the dates on which such cash flows
occurred or are expected to occur, and compounding interest accordingly.
There can be no assurance that the actual IRRs will equal the underwritten IRRs shown in the table. See �Item 1A�Risk Factors�The Company may not achieve its underwritten internal rate of return on its investments which may lead to
future returns that may be significantly lower than
anticipated� included in the Company�s Annual Report on Form 10-K for the year ended December 31, 2013 for a discussion of some of the factors that could adversely impact the returns received by the Company from the investments shown
in the table over time (5) The Company's ability to achieve
its underwritten levered weighted average IRR with regard to its portfolio of first mortgage loans is additionally dependent upon the Company re-borrowing approximately $52,278 in total under the JPMorgan Facility or any replacement facility
with similar terms.�� Without such re-borrowing, the levered
weighted average underwritten IRRs will be as indicated in the current
weighted average underwritten IRR column above.��
(6)
CMBS, held-to-maturity, represents a loan the Company closed
during May 2014 that was subsequently contributed to a securitization during August 2014.� During May 2014, the Company closed a $155,000 floating-rate whole loan secured by the first mortgage and equity interests in an entity that owns a
resort hotel in Aruba. During June 2014, the Company syndicated a
$90,000 senior participation in the loan and retained a $65,000 junior participation.� During August 2014, both the $90,000 senior participation and the Company's $65,000 junior participation were contributed to a CMBS securitization.� In
exchange for contributing its $65,000 junior participation, the
Company received a CMBS secured solely by the $65,000 junior
participation. (7)
CMBS, held-to-maturity, are net of a participation
sold during June 2014.� ARI presents the participation sold as both assets and non-recourse liabilities because the participation does not qualify as a sale according to GAAP.� At September 30, 2014, ARI had one such participation sold
with a carrying amount of $89,418. |
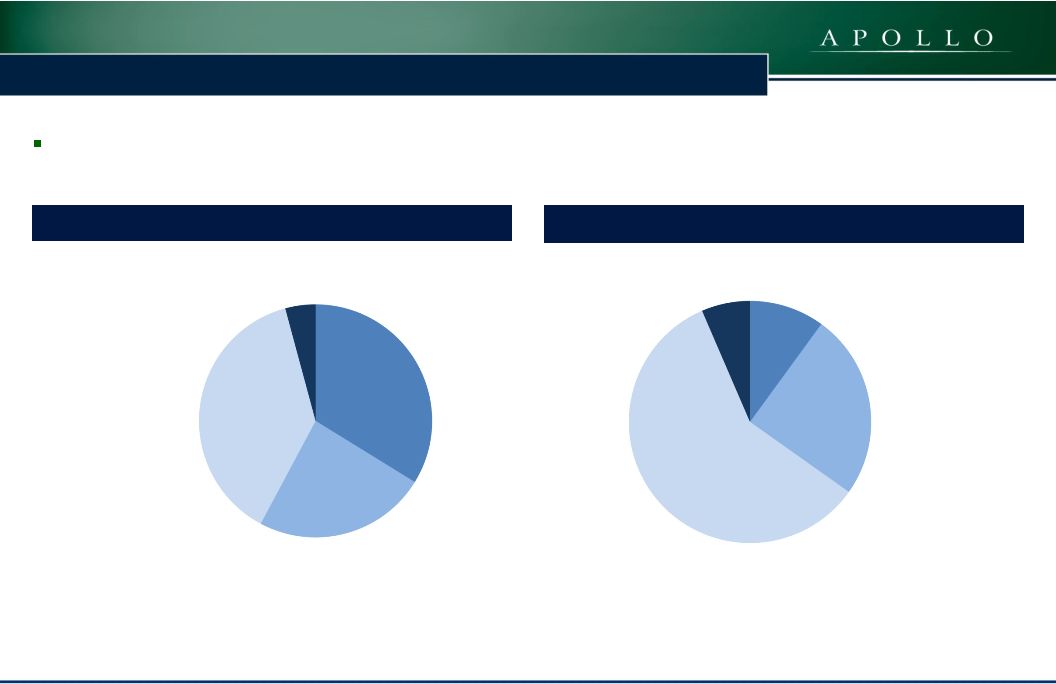 Diversified Commercial Real Estate Debt Portfolio with Amortized
Cost Basis of $1.5 billion
Net
Invested
Equity
at
Amortized
Cost
Basis
(1)
Gross
Assets
at
Amortized
Cost
Basis
(1)
(1)
CMBS,
held-to-maturity
are
net
of
a
participation
sold
during
June
2014.
ARI
presents
the
participation
sold
as
both
assets
and
non-recourse
liabilities
because
the
participation
does
not
qualify
as
a
sale
according
to
GAAP.
At
September
30,
2014,
ARI
had
one
such
participation
sold
with a carrying amount of $89,418.
ARI �
Commercial Real Estate Debt Portfolio Overview
CMBS
34%
First Mortgage Loans
24%
Subordinate Loans
38%
CMBS, held-to-
maturity
4%
CMBS
10%
First Mortgage
Loans
25%
Subordinate Loans
59%
CMBS, held-to-
maturity
6%
9
COMMERCIAL REAL ESTATE FINANCE, INC. (�ARI�)
|
 ARI �
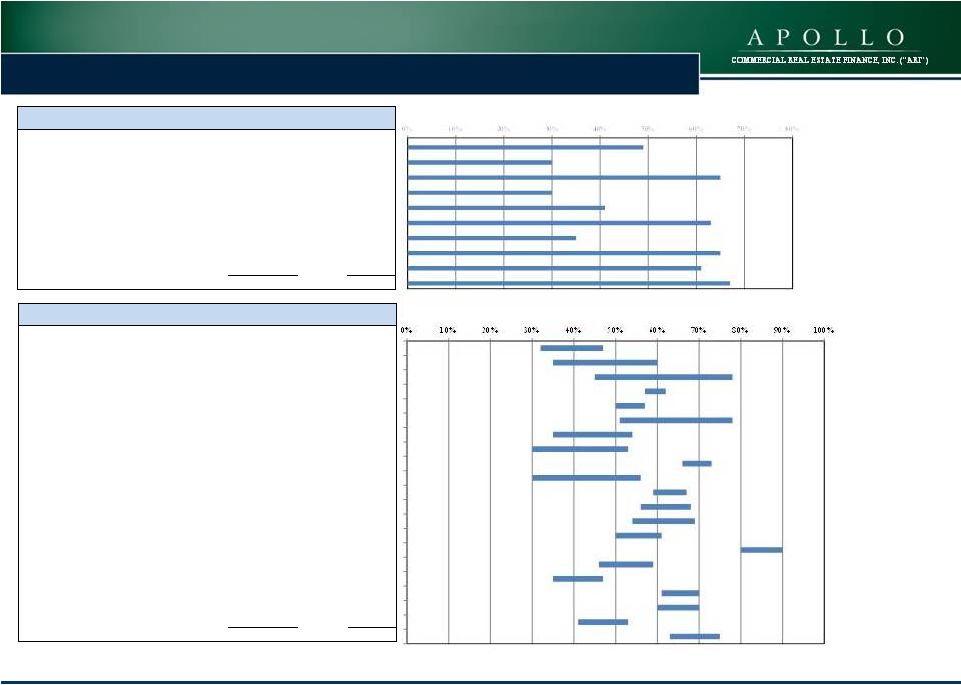
Commercial Real Estate Debt Portfolio Diversification
The Commercial Real Estate Debt Portfolio is diversified by property
type and geographic location Geographic Diversification by Net
Equity (1)
Property Type by Net Equity
(1)
(1)
CMBS, held-to-maturity, are not included in
�Securities� for this calculation. CMBS,
held-to-maturity are net of a participation sold during June 2014.� ARI presents the participation sold as both assets and non-recourse liabilities because the participation does not qualify as a sale
according to GAAP.� At September 30, 2014, ARI had one such
participation sold with a carrying amount of $89,418. 10
Securities
13%
Residential
42%
Industrial
3%
Hotel
23%
Mixed Use
3%
Office
6%
Healthcare
5%
Ski Resort
5%
New York City
32%
Northeast (excluding
NYC)
4%
Securities
14%
Southeast
5%
Mid
-
Atlantic
6%
Midwest
7%
West
13%
Southwest
4%
International
15%
COMMERCIAL REAL ESTATE FINANCE, INC. (�ARI�)
|
 11
COMMERCIAL REAL ESTATE FINANCE, INC. (�ARI�)
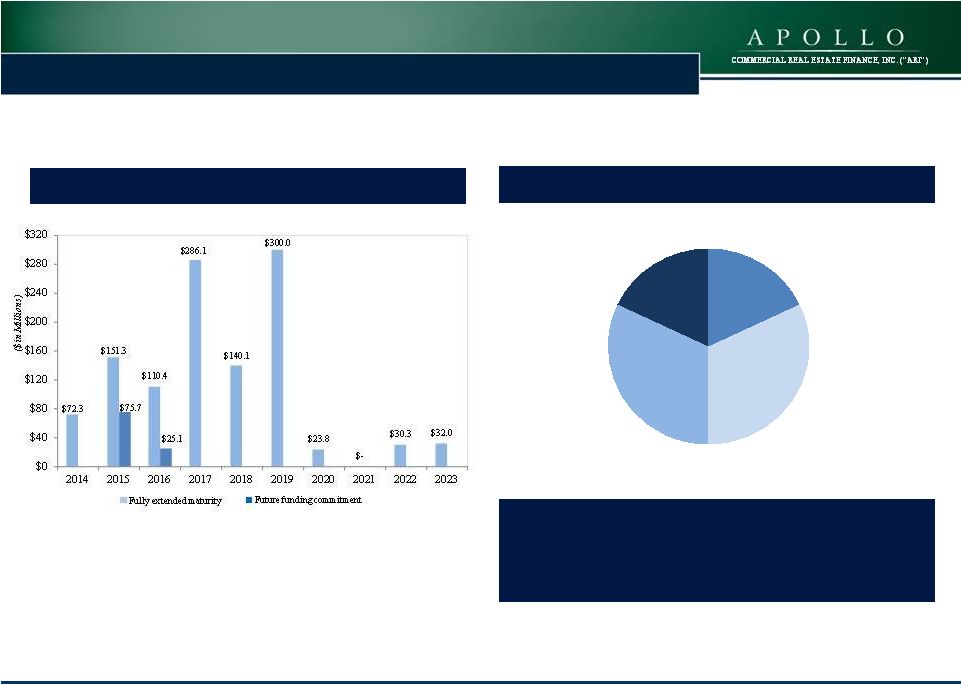
ARI �
Loan Portfolio -
Maturity and Type
Fully Extended Loan Maturities and Future Fundings
(1)(2)(3)(4)
(1)
Basedupon
Face
Amount
of
Loans;
Doesnot
include
CMBS,butdoes
include
CMBS,held-to-maturity.
(2)
Maturities reflect the fully funded amounts of the loans.
(3)
CMBS, held-to-maturity are net of a participation sold during
June 2014.� ARI presents the participation sold as both assets and non-recourse liabilities because the participation does not qualify as a sale according to GAAP.� At September 30, 2014, ARI had onesuch participation sold with a
carrying amount of $89,418.
(4)
Future funding dates are based upon the Manager�s projections and
are subject to change. Loan
Position
and
Rate
Type
(1)(3)
50% Floating Rate/50% Fixed Rate
%
of
Floating
Rate
Loans
With
LIBOR
Floor
�
31%
Weighted
Average
LIBOR
Floor
�
0.44%
Senior Loan Fixed
18%
Subordinate Loan
Fixed
32%
Subordinate Loan
Floating
32%
Senior Loan
Floating
18% |
 12
COMMERCIAL REAL ESTATE FINANCE, INC. (�ARI�)
ARI �
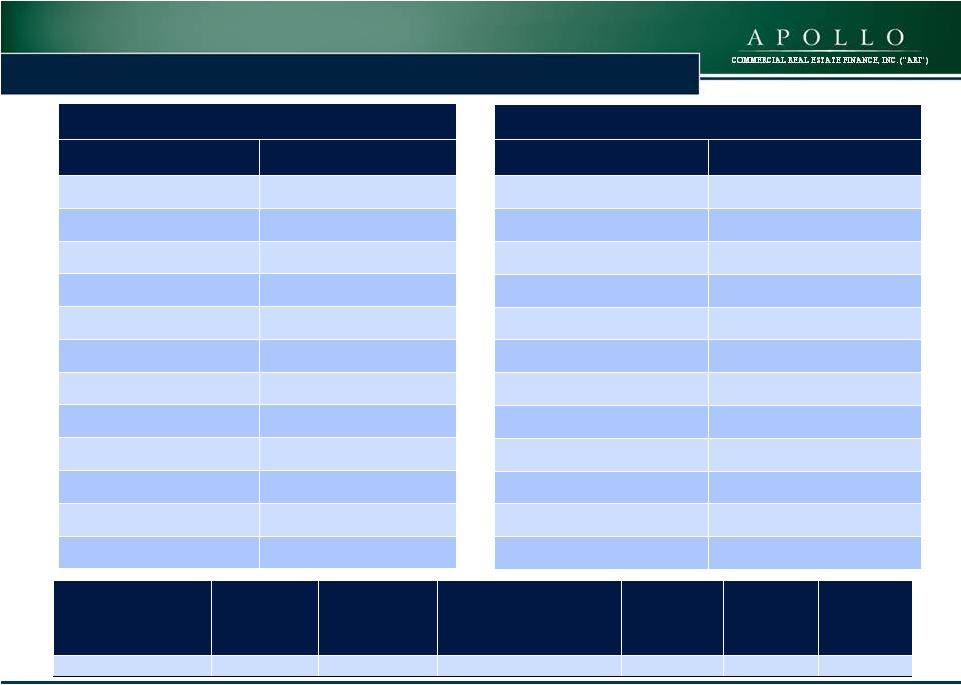
Loan Portfolio �
Loan Level LTV (Through Last Invested Dollar)
(1)
Both loans are for the same property.
(2)
Both loans are for the same property.
(3)
LTV is based upon the committed amount of $80 million.
(4)
This is CMBS, held-to-maturity and is net of a participation
sold.� ARI presents the participation sold as both assets and non-recourse liabilities because the participation does not qualify as a sale according to GAAP.� At September 30, 2014, this participation sold had a carrying amount of
$89,418. (5)
Based upon �32.1 face amount converted to USD based upon the
conversion rateon 9/30/2014. (6)
Ending LTV is based upon the committed amount of $19.5 million.
Subordinate Financings
First Mortgage Loans
Description ($ in thousands)
Location
Balance at�
9/30/2014
Starting LTV
Ending LTV
Subordinate - Condo Development
New York
73,844
$�����������
�� 32%
47%
Subordinate - Resort Hotel
(4)
Aruba
65,000
$�����������
�� 35%
60%
Subordinate - Condo Development
(5)
London
52,034
$�����������
�� 45%
78%
Subordinate - Healthcare Portfolio
Various
50,000
$�����������
�� 57%
62%
Subordinate - Hotel Portfolio
Various
47,172
$�����������
�� 50%
57%
Subordinate - Multifamily Conversion
New York
44,000
$�����������
�� 51%
78%
Subordinate - Ski Resort
California
40,000
$�����������
�� 35%
54%
Subordinate - Condo Conversion
(1)
New York
35,545
$�����������
�� 30%
53%
Subordinate - Industrial Portfolio
Various
32,000
$�����������
�� 66%
73%
Subordinate - Condo Conversion
(2)
New York
29,601
$�����������
�� 30%
56%
Subordinate - Hotel�
New York
28,250
$�����������
�� 59%
67%
Subordinate - Hotel Portfolio
Minnesota
24,560
$�����������
�� 56%
68%
Subordinate - Mixed Use
Pennsylvania
22,500
$�����������
�� 54%
69%
Subordinate - Hotel
New York
20,000
$�����������
�� 50%
61%
Subordinate - Multifamily/Condo/Hotel
(6)
Various
18,791
$�����������
�� 80%
90%
Subordinate - Ski Resort
Montana
15,000
$�����������
�� 46%
56%
Subordinate - Multifamily
New York
14,608
$�����������
�� 35%
47%
Subordinate - Office
New York
14,000
$�����������
�� 61%
70%
Subordinate - Office
Missouri
9,747
$�����������
���� 60%
70%
Subordinate - Office
Michigan
8,828
$�����������
���� 41%
53%
Subordinate - Mixed Use
North Carolina
6,525
$�����������
���� 63%
75%
Total/Weighted Average
652,005
$�����������
63%
Description ($ in thousands)
Location
Balance at
9/30/2014
Starting LTV
Ending LTV
First Mortgage - Destination Homes
Various
101,000
$�����������
-
49%
First Mortgage - Condo Conversion
(1)
New York
45,496
$�����������
�� -
30%
First Mortgage - Hotel
Pennsylvania
34,000
$�����������
�� -
65%
First Mortgage - Condo Conversion
(2)�
New York
33,675
$�����������
�� -
30%
First Mortgage - Hotel
New York�
31,115
$�����������
�� -
41%
First Mortgage - Multifamily
New York
30,000
$�����������
�� -
63%
First Mortgage - Office
New York
26,968
$�����������
�� -
35%
First Mortgage - Condo Development
(3)
Maryland
25,000
$�����������
�� -
65%
First Mortgage - Hotel
Maryland
24,684
$�����������
�� -
61%
First Mortgage - Condo Development
Maryland
20,000
$�����������
�� -
67%
Total/Weighted Average
371,938
$�����������
49% |
 13
COMMERCIAL REAL ESTATE FINANCE, INC. (�ARI�)
ARI �
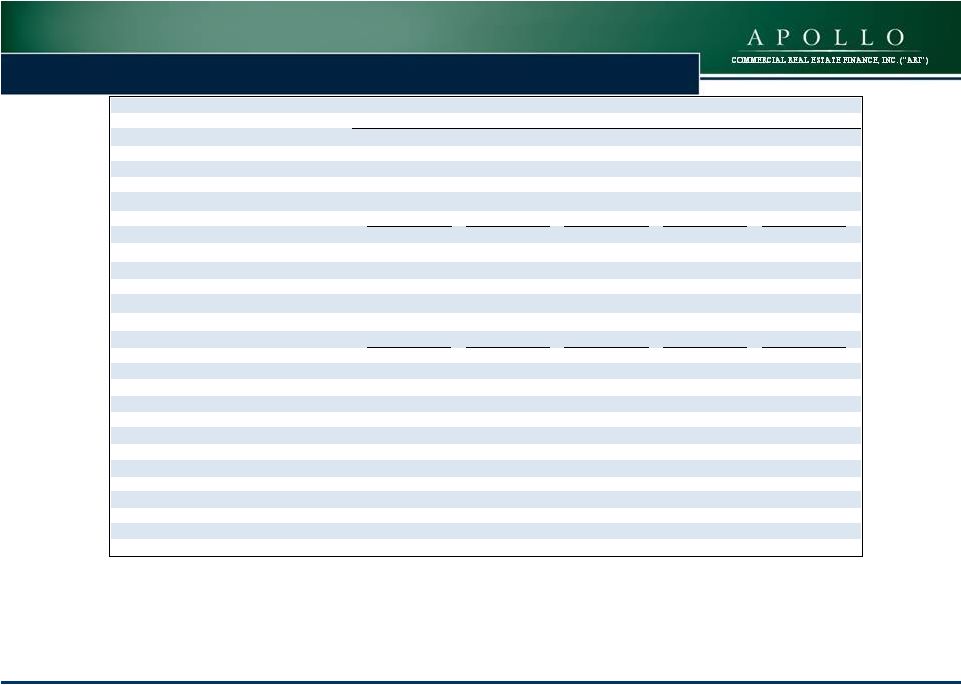
CMBS Portfolio
(1)
Face
Amortized Cost
Remaining Weighted
Average Life with
Extensions (years)
Estimated
Fair Value
Debt
Net Equity
at Cost
(2)
CMBS �
Total
$������������
� 521,545������������� $�������������
511,445�����������������
2.5 Years
$�����������
517,620����������� $������ 415,044���������
$������
99,988���������
CMBS
CUSIP
Description
07388YAB8
BSCMS 07-PW16 A2
61754KAC9
MSC 07-IQ14 A2
92978YAB6
WBCMT 07-C32 A2
61751NAD4
MSC 2007-HQ11 A31
92978TAB7
WBCMT 2007-C31 A2
92978PAJ8
WBCMT 2006-C29 AJ
07388QAH2
BSCMS 2007-PW17 AJ
07401DAH4
BSCMS 2007PW18 AJ
46625YVZ3
JPMCC 2005-CB13 AJ
50180CAG5
LBUBS 2006-C7 AJ
60688CAJ5
MLCFC 2007-9 AJ
05947US25
BACM 2005-3 AJ
CMBS
CUSIP
Description
59025KAG7
MLMT 2007-C1 AM
22546BAH3
CSMC 2007-C5 AM
36159XAH3
GECMC 2007-C1 AM
46627QBC1
JMPCC 2006-CB15 AM
46631BAJ4
JPMCC 2007-LD11 AM
14986DAJ9
CD 2006-CD3 AJ
17311QBN9
CGCMT 2007-C6 AJ
17313KAK7
CGCMT 2008-C7 AJ
20047QAH8
COMM 2006-C7 AJ
61755YAK0
MSC 2007-IQ15 AJ
46629YAH2
JPMCC 2007-CB18AJ
173311QAE0
CGCMT 2007-C6 AJFX
(1)
Does not include CMBS, held-to-maturity.
(2)
Includes
$30.1
million
of
restricted
cashrelated
to
the
UBS
Facility
and$26.5million
related
toinvestmentspurchased
not
yet
settled. |
 14
COMMERCIAL REAL ESTATE FINANCE, INC. (�ARI�)
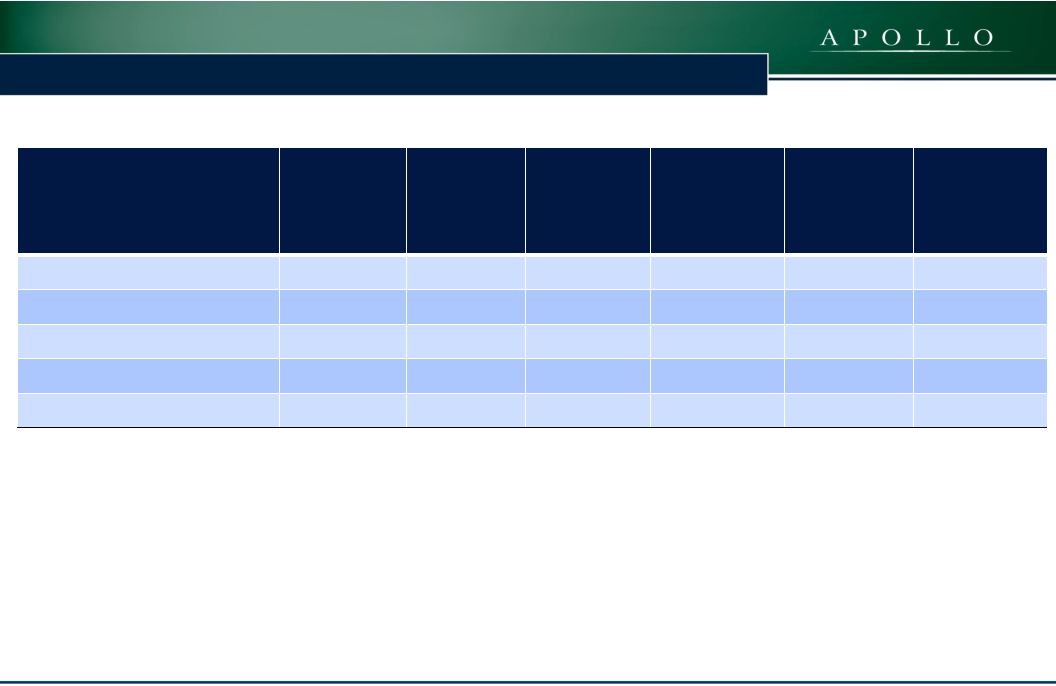
Portfolio Metrics �
Quarterly Migration Summary
Portfolio Metrics ($ in thousands)
Q3 2014
Q2 2014
Q1 2014
Q4 2013
Q3 2013
(Investment balances represent amortized cost)
First Mortgage Loans
369,924
$���������
343,810
$���������
185,516
$���������
161,099
$���������
160,893
$���������
Subordinate Loans
585,504
����������
659,045
����������
484,979
����������
497,484
����������
394,554
����������
CMBS
511,445
����������
339,724
����������
173,174
����������
190,178
����������
218,019
����������
CMBS - Held-to-Maturity
(1)
64,580
�����������
� -
�����������
������ -
�����������
������ -
�����������
������ -
�����������
������ CMBS - Hilton
-
�����������
������ -
�����������
������ -
�����������
������ -
�����������
������ 69,587
�����������
� Total Investments
1,531,453
$������
1,342,579
$������
843,669
$���������
848,761
$���������
843,053
$���������
(Investment balances represent net equity, at cost)
First Mortgage Loans
247,202
$���������
197,112
$���������
185,513
$���������
140,716
$���������
160,890
$���������
Subordinate Loans
585,504
����������
659,045
����������
484,979
����������
497,484
����������
394,554
����������
CMBS
99,988
�����������
� (4)
70,325
�����������
� (5)
36,310
�����������
� (5)
38,655
�����������
� (5)
36,760
�����������
� (6)
CMBS - Held-to-Maturity
(1)
64,580
�����������
� -
�����������
������ -
�����������
������ -
�����������
������ -
�����������
������ CMBS - Hilton
-
�����������
������ -
�����������
������ -
�����������
������ -
�����������
������ 23,049
�����������
� Net Equity in Investments at Cost
997,274
$���������
926,482
$���������
706,802
$���������
676,855
$���������
615,253
$���������
Levered Weighted Average Underwritten IRR
(2)
13.7%
(7)
13.9%
(7)
14.1%
(7)
14.1%
(7)
13.9%
(7)
Weighted Average Duration
3.0 Years
3.2 Years
3.2 Years
3.3 Years
3.0 Years
Loan Portfolio Weighted Average Ending LTV
(3)
58.0%
58.0%
58.0%
58.0%
55.0%
Borrowings Under Repurchase Agreements
537,766
$���������
446,224
$���������
166,994
$���������
202,033
$���������
227,167
$���������
Convertible Senior Notes
246,054
$���������
139,362
$���������
139,163
$���������
-
$�����������
���� -
$�����������
���� Debt-to-Common Equity
1.2x
0.9x
0.5x
0.4x
0.5x
(1)������ CMBS, held-to-maturity
are net of a participation sold during June 2014.� ARI presents the participation sold as both assets and non-recourse liabilities because the participation does not qualify as a sale according to GAAP.� At September 30, 2014, ARI had
one such participation
sold with a carrying amount of $89,418.
(2)������ The underwritten� IRR for
the investments shown in this presentation reflect the returns underwritten by the Manager, calculated on a weighted average basis assuming no dispositions,
early prepayments or defaults but assuming that extension options are
exercised and that the cost of borrowings remains constant over
the remaining term.� With respect to certain loans, the underwritten IRR calculation assumes certain estimates with respect to the timing and magnitude
of future fundings for the remaining commitments and associated
loan repayments,
and assumes no defaults. IRR is the annualized effective compounded
return rate that accounts for the time-value of money and represents the rate of return on an investment over a holding period expressed as a percentage of the investment. It is the discount rate that makes the net
present value of all cash outflows (the costs of investment) equal to
the net present value of cash inflows (returns on investment). It is derived from the negative and positive cash flows resulting from or produced by each transaction (or for a transaction involving more than one
investment, cash flows resulting from or produced by each of the
investments), whether positive, such as investment returns, or
negative, such as transaction expenses or other costs of investment, taking into account the dates on which such cash flows occurred or are expected to
occur, and compounding interest accordingly. There can be no assurance
that the actual IRRs will equal the underwritten IRRs shown in the table.
See �Item 1A�Risk Factors�The Company may not achieve
its underwritten internal rate of return on its investments which may
lead to future returns that may be significantly lower than
anticipated� included in the Company�s Annual Report on
Form 10-K for the year ended December 31, 2013 for a
discussion of some of the factors that could adversely impact the returns received by the Company from the
investments shown in the table over time
(3)������ Does not include CMBS.
(4)������ Includes $30.1 million of
restricted cash related to the UBS Facility and $26.5 million related to investments purchased not yet settled.
(5)������ Includes $30.1 million of
restricted cash related to the UBS Facility.
(6)������ Includes $15.8 million of
restricted cash related to the UBS Facility and $16.4 million of future borrowings related to unsettled trades
(7)������ Represents an underwritten
levered weighted average IRR. The Company's ability to achieve
the underwritten levered weighted average IRR additionally depends upon the Company re-borrowing approximately $52,278 under the JPMorgan Facility or any replacement facility
with similar terms with regard to its portfolio of first mortgage
loans. Without such re-borrowing, the levered weighted
average underwritten IRR will be lower than the amount shown
above, as indicated in the current weighted average underwritten IRR column on slide 8. |
 15
COMMERCIAL REAL ESTATE FINANCE, INC. (�ARI�)
ARI had total borrowings outstanding of $538 million at September 30,
2014: ARI�s
borrowings
had
the
following
remaining
maturities
at
September
30,
2014:
Financing Overview
Facility ($000s)
Debt Balance
Weighted
Average
Remaining
Maturity
(1)
Cost of Funds
Wells Facility
$�����������
�������� 20,990 0.4
1.0%
UBS Facility
133,899
4.0
2.8%
Deutsche Bank Facility
260,155
3.5
3.8%
JP Morgan Facility
122,722
0.3
2.7%
Total Borrowings at September 30, 2014
$537,766
2.8 Years
3.2%
Facility ($000s)
Less than 1 year
1 to 3 years
3 to 5 years
Total
Wells Facility
$�����������
������ 20,990
$�����������
����������������� -
$�����������
�������������� -
$�����������
������ 20,990 UBS Facility
(1)
-
133,899
-
133,899
Deutsche Bank Facility
5,530
153,463
101,162
260,155
JP Morgan Facility
122,722
-
-
122,722
Total Borrowings at September 30, 2014
$������������
��� 149,242
$������������
���� 287,362
$������������
� 101,162
$������������
��� 537,766 (1)
Assumes extension options on the UBS Facility are exercised.
|
 16
COMMERCIAL REAL ESTATE FINANCE, INC. (�ARI�)
Financials |
  17
COMMERCIAL REAL ESTATE FINANCE, INC. (�ARI�)
Consolidated Balance Sheets (Unaudited)
(in thousands�except share and per share data)
September 30, 2014
December 31, 2013
Assets:
Cash
58,649
$�����������
������ 20,096
$�����������
������ Restricted cash
30,127
�����������
�������� 30,127
�����������
�������� Securities
available-for-sale, at estimated fair value 17,919
�����������
�������� 33,362
�����������
�������� Securities, at
estimated fair value 499,701
�����������
������ 158,086
�����������
������ Securities,
held-to-maturity 153,998
�����������
������ -
�����������
�������������
Commercial mortgage loans, held for investment
369,924
�����������
������ 161,099
�����������
������ Subordinate loans, held for
investment 585,504
�����������
������ 497,484
�����������
������ Investment in
unconsolidated joint venture 38,719
�����������
�������� -
�����������
�������������
Derivative instrument
1,933
�����������
����������
-
�����������
�������������
Interest receivable
17,072
�����������
�������� 6,022
�����������
����������
Deferred financing costs, net
8,124
�����������
����������
628
�����������
������������
Other assets
1,342
�����������
����������
600
�����������
������������
Total Assets
1,783,012
$�����������
�� 907,504
$�����������
����� Liabilities and Stockholders'
Equity Liabilities:
Borrowings under repurchase agreements
537,766
$�����������
����� 202,033
$�����������
����� Convertible senior notes,
net 246,054
�����������
������ -
�����������
����������������
Participations sold
89,418
�����������
�������� -
�����������
����������������
Investments purchased, not yet settled
26,540
�����������
�������� -
�����������
����������������
Accounts payable and accrued expenses
3,602
�����������
����������
2,660
�����������
����������
Payable to related party
3,193
�����������
����������
2,628
�����������
����������
Dividends payable
20,753
�����������
�������� 17,227
�����������
�������� Total
Liabilities 927,326
�����������
������ 224,548
�����������
������ Stockholders' Equity:
Preferred stock, $0.01 par value, 50,000,000 shares authorized and
3,450,000 shares issued and outstanding in 2014 and 2013
($86,250 aggregate liquidation preference) 35
�����������
��������������
35
�����������
��������������
Common stock, $0.01 par value, 450,000,000 shares authorized
46,848,675 and 36,888,467 shares issued and outstanding in 2014
and 2013, respectively 468
�����������
������������
369
�����������
������������
Additional paid-in-capital
867,598
�����������
������ 697,610
�����������
������ Retained earnings
(accumulated deficit) (11,661)
�����������
������� (14,188)
�����������
������� Accumulated other
comprehensive loss (754)
�����������
�����������
(870)
�����������
�����������
Total Stockholders' Equity
855,686
�����������
������ 682,956
�����������
������ Total Liabilities and
Stockholders' Equity 1,783,012
$�����������
�� 907,504
$�����������
����� |
  18
COMMERCIAL REAL ESTATE FINANCE, INC. (�ARI�)
Consolidated Statement of Operations (Unaudited)
September 30,
2014
September 30,
2013
September 30,
2014
September 30,
2013
Net interest income:
Interest income from securities
6,129
$�����������
��� 2,533
$�����������
��� 12,914
$�����������
� 8,634
$�����������
��� Interest income from securities, held to
maturity 2,219
�����������
����� -
�����������
�������� 2,219
�����������
���� -
�����������
�������� Interest income
from commercial mortgage loans 8,025
�����������
����� 4,954
�����������
����� 18,475
�����������
�� 12,222
�����������
��� Interest income from subordinate loans
18,983
�����������
��� 12,184
�����������
��� 51,951
�����������
�� 35,137
�����������
��� Interest income from repurchase
agreements -
�����������
�������� -
�����������
�������� -
�����������
������� 2
�����������
�����������
Interest expense
(8,786)
�����������
��� (885)
�����������
������ (15,802)
�����������
� (2,909)
�����������
��� Net interest income
26,570
������������
18,786
������������
69,757
������������
53,086
������������
Operating expenses:
General and administrative expenses (includes $308 and $1,096 of
equity-based compensation in 2014 and $784 and $2,095 in
2013, respectively)
(1,434)
�����������
��� (1,793)
�����������
��� (4,355)
�����������
��� (5,126)
�����������
��� Management fees to related party
(3,193)
�����������
��� (2,625)
�����������
��� (8,725)
�����������
��� (7,384)
�����������
��� Total operating expenses
(4,627)
������������
� (4,418)
������������
� (13,080)
�����������
(12,510)
�����������
Income from equity investment
(88)
�����������
�������� -
�����������
�������� (88)
�����������
������� -
�����������
�������� Interest income
from cash balances 21
�����������
��������� 3
�����������
�����������
26
�����������
�������� 19
�����������
���������
Unrealized gain/(loss) on securities
(2,147)
�����������
��� (1,472)
�����������
��� 4,787
�����������
���� (3,973)
�����������
��� Foreign currency gain/(loss)
(3,596)
�����������
��� -
�����������
�������� (2,637)
�����������
��� -
�����������
�������� Gain/(loss) on
derivative instruments (includes $3,026 and $1,933 of
unrealized gains in 2014 and $25 and $155 of unrealized gains in
2013, respectively)
3,026
�����������
����� 1
�����������
�����������
1,933
�����������
���� (1)
�����������
��������� Net
income 19,159
$����������
12,900
$����������
60,698
$����������
36,621
$����������
Preferred dividends
(1,860)
�����������
��� (1,859)
�����������
��� (5,580)
�����������
��� (5,580)
�����������
��� Net income available to common
stockholders 17,299
$����������
11,041
$����������
55,118
$����������
31,041
$����������
Basic and diluted net income per share of common
stock��� 0.37
$�����������
���� 0.29
$�����������
���� 1.30
$�����������
���� 0.88
$�����������
���� Basic weighted average shares of common
stock outstanding 46,848,675
��������
36,883,002
��������
42,332,380
�������
34,647,941
��������
Diluted weighted average shares of common stock outstanding
47,068,929
��������
37,379,469
��������
42,538,744
�������
35,103,285
��������
Dividend declared per share of common stock
0.40
$�����������
���� 0.40
$�����������
���� 1.20
$�����������
���� 1.20
$�����������
���� Three months ended
Nine months ended |
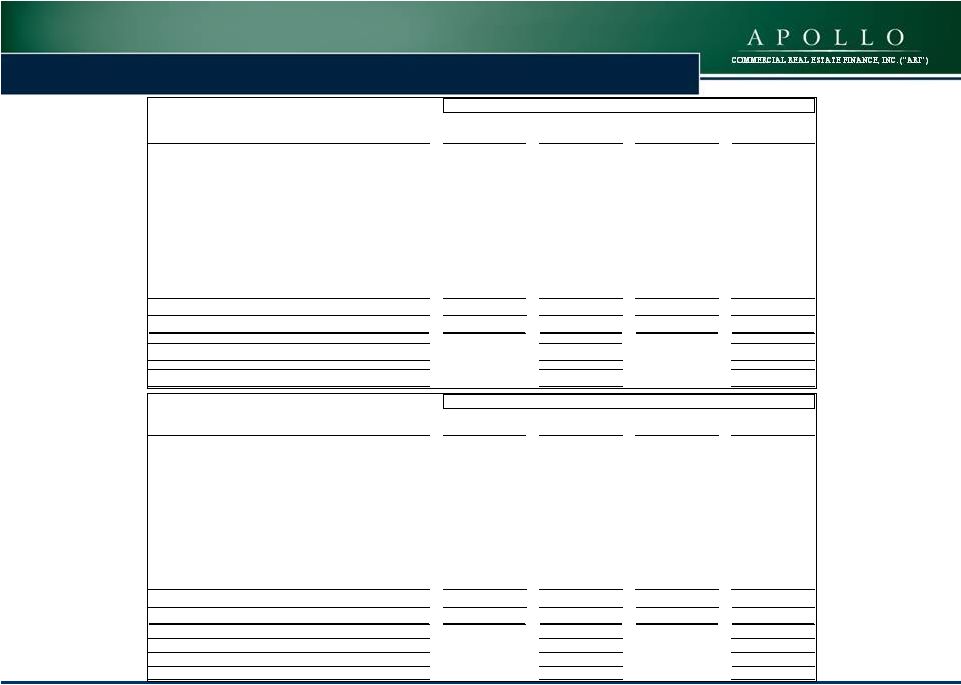 19
COMMERCIAL REAL ESTATE FINANCE, INC. (�ARI�)
Reconciliation of Operating Earnings to Net Income
September 30, 2014
Earnings Per Share
(Diluted)
September 30, 2013
Earnings Per Share
(Diluted)
Operating Earnings:
Net income available to common stockholders
17,299
$������������
������� 0.37
$������������
������������
$11,041
0.29
$������������
������������
Adjustments:
� Unrealized (gain)/loss on securities
2,147
������������
�������������
0.04
1,472
0.04
� Unrealized (gain)/loss on derivative instruments
(3,026)
������������
������������
(0.07)
(25)
-
�����������
�������������
� Foreign currency loss
3,596
������������
�������������
0.08
-
�����������
�������������
-
�����������
�������������
� Equity-based compensation expense
308
������������
����������������
0.01
784
0.02
� Income from equity investment
88
������������
������������������
-
�����������
�������������
-
�����������
�������������
-
�����������
�������������
� Amortization of convertible notes related to equity
reclassification 356
������������
����������������
0.01
-
�����������
�������������
-
�����������
�������������
Total adjustments:
3,469
������������
�������������
0.07
2,231
0.06
Operating Earnings
20,768
$������������
������� 0.44
$������������
������������
13,272
$������������
������� 0.35
$������������
������������
Basic weighted average shares of common stock outstanding
46,848,675
36,883,002
Diluted weighted average shares of common stock outstanding
47,068,929
37,379,469
Three Months Ended
September 30, 2014
Earnings Per Share
(Diluted)
September 30, 2013
Earnings Per Share
(Diluted)
Operating Earnings:
Net income available to common stockholders
55,118
$������������
������� 1.30
$������������
������������
31,041
$������������
������� 0.88
$������������
������������
Adjustments:
� Unrealized (gain)/loss on securities
(4,787)
������������
������������
(0.11)
3,973
0.11
� Unrealized (gain)/loss on derivative instruments
(1,933)
������������
������������
(0.05)
(155)
-
�����������
�������������
� Foreign currency loss
2,637
������������
�������������
0.06
-
�����������
�������������
-
�����������
�������������
� Equity-based compensation expense
1,096
������������
�������������
0.03
2,095
0.06
� Income from equity investments
88
������������
������������������
-
�����������
�������������
-
�����������
�������������
-
�����������
�������������
Amortization of convertible notes related to equity
reclassification 586
������������
����������������
0.01
-
�����������
�������������
-
�����������
�������������
Total adjustments:
(2,313)
������������
������������
(0.06)
5,913
0.17
Operating Earnings
52,805
$������������
������� 1.24
$������������
������������
36,954
$������������
������� 1.05
$������������
������������
Basic weighted average shares of common stock outstanding
42,322,380
34,647,941
Diluted weighted average shares of common stock outstanding
42,538,744
35,103,285
Nine Months Ended |
 20
COMMERCIAL REAL ESTATE FINANCE, INC. (�ARI�)
Financial Metrics �
Quarterly Migration Summary
(1)
Operating Earnings is a non-GAAP financial measure that is used by
the Company to approximate cash available for distribution and is defined by the Company as net income available to common stockholders, computed in accordance with GAAP,
adjusted
for
(i)
equity-based
compensation
expense
(a
portion
of
which
may
becomecash-based
upon
final
vesting
and
settlement
of
awards
should
the
holder
elect
net
share
settlement
to
satisfy
income
tax
withholding)
(ii)
any
unrealized
gains
or losses
or
other
non-
cash
items
included
in
net
income(iii)
unrealized
income
from
equity
investments
and
(iv)
the
non-cash
amortization
expense
related
to
the
reclassification
of
a
portion
of
the
senior
convertible
notes
to
stockholders�
equity
in accordance with GAAP.� Please see slide 19
for a reconciliation of Operating Earnings and Operating Earnings per
Share to GAAP net income and GAAP net income per share. (2)
Return
on
commonequity
is
calculated
as
annualized
Operating
Earnings
for
the
period
as
a
percentage
of
average
stockholders�equity
for
the
period.
Financial Metrics
($ in thousands, except per share data)
Q3 2014
Q2 2014
Q1 2014
Q4 2013
Q3 2013
Net Interest Income
26,570
$����������
23,784
$����������
19,403
$����������
20,021
$����������
18,786
$����������
Management Fee
3,193
�����������
��� 2,966
�����������
��� 2,565
�����������
��� 2,627
�����������
��� 2,625
�����������
�� General and Administrative Costs
1,126
�����������
��� 1,117
�����������
��� 1,016
�����������
��� 1,046
�����������
��� 1,009
�����������
�� Non-Cash Stock Based Compensation
308
�����������
����� 362
�����������
����� 426
�����������
����� 1,392
�����������
��� 784
�����������
����� Net Income Available to Common
Stockholders 17,299
$����������
22,098
$����������
15,720
$����������
14,004
$����������
11,041
$����������
GAAP Diluted EPS
0.37
$�����������
��� 0.51
$�����������
��� 0.42
$�����������
��� 0.37
$�����������
��� 0.29
$�����������
�� Operating Earnings
(1)
20,768
$����������
18,045
$����������
13,991
$����������
14,488
$����������
13,272
$����������
Operating EPS
(1)
0.44
$�����������
��� 0.42
$�����������
��� 0.37
$�����������
��� 0.39
$�����������
��� 0.35
$�����������
�� Distributions Declared to Common Stockholders
0.40
$�����������
��� 0.40
$�����������
��� 0.40
$�����������
��� 0.40
$�����������
��� 0.40
$�����������
�� GAAP Book Value per Share of Common Stock
16.42
$�����������
� 16.30
$�����������
� 16.21
$�����������
� 16.18
$�����������
� 16.18
$�����������
Total Stockholders' Equity
855,686
$���������
849,998
$���������
687,912
$���������
682,956
$���������
682,887
$��������
Diluted weighted average shares of common stock outstanding
47,068,929
������
43,099,354
������
37,341,050
������
37,390,369
������
37,379,469
������
Return on Common Equity Based on Operating Earnings
(2)
10.8%
10.6%
9.4%
9.7%
8.9% |
Serious News for Serious Traders! Try StreetInsider.com Premium Free!
You May Also Be Interested In
- Alphabet stock surges 11% to record high on Q1 earnings beat, first-ever dividend
- Gravity Announces Filing of Annual Report on Form 20-F for Fiscal Year 2023
- Dimensional Fund Advisors Ltd. : Form 8.3 - TRITAX BIG BOX REIT PLC - Ordinary Shares
Create E-mail Alert Related Categories
SEC FilingsSign up for StreetInsider Free!
Receive full access to all new and archived articles, unlimited portfolio tracking, e-mail alerts, custom newswires and RSS feeds - and more!
