

Form 6-K SUNCOR ENERGY INC For: Feb 04
 Tweet
Tweet Share
ShareQuickLinks -- Click here to rapidly navigate through this document
FORM 6-K
SECURITIES AND EXCHANGE COMMISSION
WASHINGTON, D.C. 20549
Report
of Foreign Private Issuer
Pursuant to Rule 13a-16 or 15d-16 of
the Securities Exchange Act of 1934
For the month of: February, 2016 |
Commission File Number: 1-12384 |
SUNCOR ENERGY INC.
(Name of registrant)
150 – 6th Avenue S.W.
P.O. Box 2844
Calgary, Alberta
Canada, T2P 3E3
Indicate by check mark whether the registrant files or will file annual reports under cover of Form 20-F or Form 40-F:
Form 20-F |
o | Form 40-F | ý |
Indicate
by check mark if the registrant is submitting the Form 6-K in paper as permitted by
Regulation S-T Rule 101(b)(1): o
Indicate by check mark if the registrant is submitting the Form 6-K in paper as permitted by
Regulation S-T Rule 101(b)(7): o
The Registrant's Report to Shareholders for the quarter ended December 31, 2015, included as Exhibit 99.1 of this Form 6-K, is incorporated by reference into and as an exhibit to, as applicable, the following of Registrant's Registration Statements under the Securities Act of 1933: Form S-8 (File No. 333-87604), Form S-8 (File No. 333-112234), Form S-8 (File No. 333-118648), Form S-8 (File No. 333-124415), Form S-8 (File No. 333-149532), Form S-8 (File No. 333-161021), Form S-8 (File No. 333-161029), Form F-10 (File No. 333-196501), Form F-80 (File No. 333-207268) and Form F-80 (File No. 333-209087).
Pursuant to the requirements of the Securities Exchange Act of 1934, the registrant has duly caused this report to be signed on its behalf by the undersigned, thereunto duly authorized.
|
SUNCOR ENERGY INC. |
|||
Date: February 4, 2016 |
||||
|
||||
|
By: |
"Shawn Poirier" |
||
| Exhibit | Description of Exhibit | |
|---|---|---|
99.1 |
Report to Shareholders for the fourth quarter ended December 31, 2015 | |
99.2 |
News release dated February 3, 2016, Suncor Energy reports fourth quarter results |
SIGNATURES
EXHIBIT INDEX
QuickLinks -- Click here to rapidly navigate through this document
EXHIBIT 99.1
Report to Shareholders for the fourth quarter ended December 31, 2015

FOURTH QUARTER 2015
Report to shareholders for the period ended December 31, 2015
![]()
Suncor Energy reports fourth quarter results
All financial figures are unaudited and presented in Canadian dollars (Cdn$) unless noted otherwise. Production volumes are presented on a working-interest basis, before royalties, unless noted otherwise. Certain financial measures in this document are not prescribed by Canadian generally accepted accounting principles (GAAP). For a description of these non-GAAP financial measures, see the Non-GAAP Financial Measures Advisory section of this Report to Shareholders (this document). See also the Advisories section of this document. References to Oil Sands operations production and cash operating costs exclude Suncor's interest in Syncrude's operations.
"In 2015 we generated cash flow that exceeded our annual sustaining capital and dividend commitments," said Steve Williams, president and chief executive officer. "Our integrated business model, our ability to reduce costs, and our relentless focus on operational discipline made this possible. As a result, we are well positioned to weather the current low crude oil price environment."
Highlights of the fourth quarter of 2015 include:
- •
- Cash
flow from operations(1) of $1.294 billion ($0.90 per common share), and an operating loss(1) of $26 million ($0.02 per common
share), driven by lower crude oil prices and a Refining and Marketing first-in, first-out (FIFO) loss of $77 million, partially offset by increased refining margins.
- •
- Net
loss of $2.007 billion ($1.38 per common share), due to non-cash asset writedowns, which were a result of the depressed commodity cycle, and a foreign exchange
loss on U.S. dollar denominated debt.
- •
- Oil
Sands operations cash operating costs per barrel(1) decreased to $28.00 for the fourth quarter of 2015, which was driven by strong production of
439,700 barrels per day (bbls/d), continued cost reduction initiatives, reduced unplanned maintenance activities and lower natural gas prices.
- •
- Effective
January 1, 2016, nameplate capacity of Firebag increased from 180,000 bbls/d to 203,000 bbls/d, as a result of completing cost-effective
debottleneck activities.
- •
- Subsequent to the end of the fourth quarter, Suncor and Canadian Oil Sands Limited (COS) reached an agreement for COS and its Board of Directors to support Suncor's offer to purchase all of the shares of COS for consideration of 0.28 of a Suncor share for each COS share. The transaction was valued at $6.6 billion at the time of the agreement.
- (1)
- Non-GAAP
financial measures. See page 4 for a reconciliation of net earnings to operating (loss) earnings. ROCE excludes capitalized costs related to major projects in
progress. See the Non-GAAP Financial Measures Advisory section of this document.
- (2)
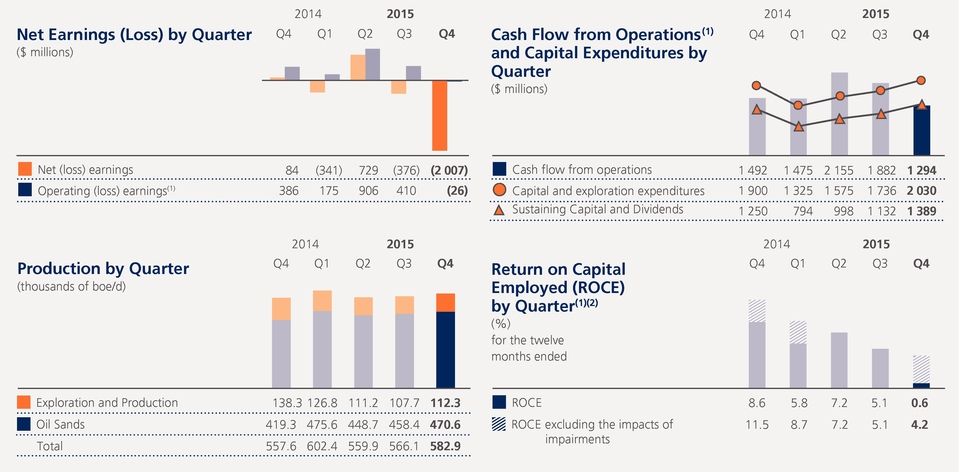
- ROCE, excluding the impacts of impairments of $1.238 billion in the second quarter of 2014 and $1.599 billion in the fourth quarter of 2015, would have been 11.5%, 8.7%, and 4.2% for the fourth quarter of 2014, first quarter of 2015, and fourth quarter of 2015, respectively.
Suncor recorded a fourth quarter 2015 operating loss of $26 million ($0.02 per common share), including a FIFO loss of $77 million, and cash flow from operations of $1.294 billion ($0.90 per common share) reflecting the lower crude oil price environment, compared to operating earnings of $386 million ($0.27 per common share), including a FIFO loss of $372 million, and cash flow from operations of $1.492 billion ($1.03 per common share), in the prior year quarter. Highlights in the fourth quarter of 2015 included a favourable downstream pricing environment, increased production from Oil Sands operations, and lower operating costs.
For the twelve months ended December 31, 2015, free cash flow(1) was $139 million, compared to $2.097 billion for the twelve months ended December 31, 2014.
A net loss of $2.007 billion ($1.38 per common share) was recorded in the fourth quarter of 2015, compared with net earnings of $84 million ($0.06 per common share) in the prior year quarter. Net loss for the fourth quarter of 2015 was impacted by the same factors influencing the operating loss and included $1.599 billion of non-cash impairment charges and an unrealized after-tax foreign exchange loss of $382 million on the revaluation of U.S. dollar denominated debt. Net earnings in the prior year quarter included the impact of an unrealized after-tax foreign exchange loss of $302 million.
Operating Results
Suncor's total upstream production increased to 582,900 barrels of oil equivalent per day (boe/d) in the fourth quarter of 2015, compared with 557,600 boe/d in the prior year quarter, primarily due to strong reliability in Oil Sands operations.
Oil Sands operations production increased to 439,700 bbls/d in the fourth quarter of 2015, compared to 384,200 bbls/d in the prior year quarter, primarily due to record In Situ production and reliable operations across all assets following the completion of planned maintenance early in the quarter.
Cash operating costs per barrel for Oil Sands operations decreased in the fourth quarter of 2015 to $28.00/bbl, compared to $34.45/bbl in the prior year quarter, due to higher production combined with lower operating expenses as a result of cost reduction initiatives, lower unplanned maintenance and lower natural gas prices.
"We have surpassed the reliability and cost reduction targets we established in early 2015," said Williams. "Operating costs across the organization are down almost $1 billion from last year, while Oil Sands upgrading reliability exceeded 90%, more than a year ahead of our original plan."
Suncor's share of Syncrude production was 30,900 bbls/d in the fourth quarter of 2015, compared to 35,100 bbls/d in the prior year quarter. The decrease was primarily due to unplanned maintenance activities during the fourth quarter of 2015.
Production volumes in Exploration and Production (E&P) decreased to 112,300 boe/d in the fourth quarter of 2015, compared to 138,300 boe/d in the prior year quarter, primarily due to shut-in production in Libya, natural declines at Terra Nova and temporary export pipeline constraints that impacted Buzzard, partially offset by higher production at Golden Eagle. Production in Libya temporarily resumed at the start of the quarter, but was shut in again in November. Libya continues to be impacted by political unrest, with the timing of a return to normal operations remaining uncertain.
During the fourth quarter of 2015, Refining and Marketing completed planned maintenance at the Montreal refinery. Average refinery utilization decreased to 93% in the fourth quarter, compared to 95% in the prior year quarter, primarily driven by unplanned maintenance at the Edmonton refinery and lower distillate demand in Western Canada.
Strategy Update
Subsequent to the end of the fourth quarter, Suncor and COS reached an agreement to support Suncor's offer to purchase all of the shares of COS for 0.28 of a Suncor share for each COS share. The offer has the support of the Boards of Directors of both companies, and expires on February 5, 2016. The transaction value at the time of the agreement of approximately $6.6 billion includes COS' estimated debt of $2.4 billion.
- (1)
- Non-GAAP financial measure. See the Non-GAAP Financial Measures Advisory section of this document.
2 SUNCOR ENERGY INC. 2015 FOURTH QUARTER
"We are pleased that the Board of COS is supporting our offer," said Williams. "We believe that, working with the operator, we can drive real improvements in Syncrude's performance with a larger ownership interest, creating value for our shareholders."
Suncor continues to deliver on its commitment to add shareholder value and invest in long-term profitable growth in its core asset areas, while maintaining a strong financial position. In addition to extending the offer to COS shareholders, the company also completed its acquisition of an additional 10% working interest in the Fort Hills oil sands project from Total E&P Canada Ltd. for $360 million. Suncor's share in the project is now 50.8%.
To maintain our strong financial position and flexibility, Suncor has reduced its capital guidance for 2016 to a range of $6.0 to $6.5 billion from $6.7 to $7.3 billion issued in November of 2015. The capital spending reduction is not anticipated to impact the company's near term production targets.
Enbridge's Line 9 reversal was commissioned during the fourth quarter of 2015. The reversal will provide Suncor the flexibility of supplying its Montreal refinery with a full slate of inland-priced crude.
During the quarter, the Government of Alberta announced a new climate plan which includes a carbon pricing regime coupled with an overall emissions limit for the oil sands. The climate plan places some certainty on the future greenhouse gas (GHG) costs for Suncor, while the limit on oil sands emissions will force companies to ensure only the most profitable and efficient projects are developed.
The Government of Alberta conducted a review of the province's oil and gas royalties. Subsequent to year end, the new royalty system was announced and included no changes to the existing oil sand royalty rates, and improved transparency concerning disclosure of royalty information.
Oil Sands Operations
In the fourth quarter of 2015, Suncor safely completed planned maintenance at Upgrader 2 on a coker set, vacuum tower and hydrogen plant.
In Situ continued to focus on well pad construction to sustain existing production at Firebag and MacKay River, and successfully completed cost-effective debottlenecking activities at Firebag, which increased nameplate capacity from 180,000 bbls/d to 203,000 bbls/d.
Oil Sands Ventures
The Fort Hills project remains on schedule with construction more than 50% complete at the end of the fourth quarter. Spending during the quarter included engineering, procurement, module fabrication and site construction. The project is expected to deliver approximately 91,000 bbls/d of bitumen to Suncor, following the completion of the acquisition of an additional 10% working interest in the project during the fourth quarter. First oil is expected in the fourth quarter of 2017, and is expected to ramp up to 90% of capacity within twelve months thereafter.
Exploration and Production
Construction of the Hebron project continued in the fourth quarter of 2015, with first oil expected in late 2017. Effective January 1, 2016, working interests in the Hebron project have been reset. As a result, Suncor's working interest in the project decreased from 22.7% to 21.0%, with Suncor to be reimbursed for costs incurred to December 31, 2015.
Development drilling at Golden Eagle continued through the fourth quarter. Exploration drilling at the deepwater Shelburne Basin offshore Nova Scotia commenced in the fourth quarter, and will continue during 2016.
SUNCOR ENERGY INC. 2015 FOURTH QUARTER 3
Operating (Loss) Earnings Reconciliation(1)
|
Three months ended December 31 |
Twelve months ended December 31 |
||||||||||
| ($ millions) | 2015 | 2014 | 2015 | 2014 | |||||||
|
|
|||||||||||
| Net (loss) earnings | (2 007 | ) | 84 | (1 995 | ) | 2 699 | |||||
|
|
|||||||||||
| Unrealized foreign exchange loss on U.S. dollar denominated debt | 382 | 302 | 1 930 | 722 | |||||||
|
|
|||||||||||
| Impairments(2) | 1 599 | — | 1 599 | 1 238 | |||||||
|
|
|||||||||||
| Impact of income tax rate adjustments on deferred taxes(3) | — | — | 17 | — | |||||||
|
|
|||||||||||
| Gain on significant disposal(4) | — | — | (68 | ) | (61 | ) | |||||
|
|
|||||||||||
| Restructuring charges(5) | — | — | 57 | — | |||||||
|
|
|||||||||||
| Insurance proceeds(6) | — | — | (75 | ) | — | ||||||
|
|
|||||||||||
| Reserves redetermination(7) | — | — | — | (32 | ) | ||||||
|
|
|||||||||||
| Income tax charge(8) | — | — | — | 54 | |||||||
|
|
|||||||||||
| Operating (loss) earnings(1) | (26 | ) | 386 | 1 465 | 4 620 | ||||||
|
|
|||||||||||
- (1)
- Operating
(loss) earnings is a non-GAAP financial measure. All reconciling items are presented on an after-tax basis. See the Non-GAAP Financial Measures Advisory section of
this document.
- (2)
- After-tax
impairment charges of $798 million on certain offshore E&P assets as a result of declining crude oil pricing, $415 million (Q2
2014 – $297 million) against the company's Libyan assets, $290 million (Q2 2014 – $718 million) on the
company's interest in the Joslyn mining project, and $96 million (Q2 2014 – $223 million) related to certain assets in the Oil Sands segment
following a review of repurpose options due to previously revised growth strategies in the fourth quarter of 2015.
- (3)
- Adjustments
to the company's deferred income taxes from a 12% decrease in the U.K. tax rate on oil and gas profits from the North Sea in the first quarter of 2015 of
$406 million, and a 2% increase in the Alberta corporate income tax rate in the second quarter of 2015 of $423 million.
- (4)
- After-tax
gain related to the sale of the company's Wilson Creek natural gas assets in the E&P segment in the third quarter of 2014 and the after-tax gain related to the sale
of the company's share of certain assets and liabilities of Pioneer Energy in the Refining and Marketing segment in the second quarter of 2015.
- (5)
- Restructuring
charges related to cost reduction initiatives in the Corporate segment recorded in the first quarter of 2015.
- (6)
- Business
interruption insurance proceeds recorded in the first quarter of 2015 for the Terra Nova asset in the E&P segment.
- (7)
- Reserves
redetermination of 1.2 million barrels of oil receivable recorded in the second quarter of 2014 related to an interest in a Norwegian asset that Suncor previously
owned.
- (8)
- Represents a current income tax and associated interest charge recorded in the third quarter of 2014 related to the timing of tax depreciation deductions taken on certain capital expenditures incurred in a prior period in the Oil Sands segment.
Corporate Guidance
Suncor has reduced its capital guidance for 2016 to a range of $6.0 to $6.5 billion from $6.7 to $7.3 billion issued on November 17, 2015, in part due to the deferral of Firebag planned maintenance to 2017.
The following 2016 full year outlook assumptions have also been adjusted: Brent at Sullom Voe to US$40/bbl from US$55/bbl, WTI at Cushing to US$39/bbl from US$50/bbl, WCS at Hardisty to US$26/bbl from US$35/bbl, and Cdn/US exchange rate from $0.75 to $0.70. For further details and advisories regarding Suncor's 2016 corporate guidance, see www.suncor.com/guidance.
Measurement Conversions
Certain natural gas volumes in this report to shareholders have been converted to boe on the basis of one bbl to six mcf. See the Advisories section of this document.
4 SUNCOR ENERGY INC. 2015 FOURTH QUARTER
FOURTH QUARTER DISCUSSION
February 3, 2016
Additional information about Suncor filed with Canadian securities regulatory authorities and the United States Securities and Exchange Commission (SEC), including quarterly and annual reports and Suncor's Annual Information Form dated February 26, 2015 (the 2014 AIF), which is also filed with the SEC under cover of Form 40-F, is available online at www.sedar.com, www.sec.gov and our website www.suncor.com. Information contained in or otherwise accessible through our website does not form part of this document, and is not incorporated into this document by reference.
References to "we", "our", "Suncor", or "the company" mean Suncor Energy Inc. and the company's subsidiaries and interests in associates and jointly controlled entities, unless the context otherwise requires.
Table of Contents
| 1. | Advisories | 5 | ||
| 2. | Fourth Quarter Highlights | 6 | ||
| 3. | Consolidated Financial Information | 7 | ||
| 4. | Segment Results and Analysis | 12 | ||
| 5. | Capital Investment Update | 21 | ||
| 6. | Financial Condition and Liquidity | 23 | ||
| 7. | Quarterly Financial Data | 26 | ||
| 8. | Other Items | 27 | ||
| 9. | Non-GAAP Financial Measures Advisory | 28 | ||
| 10. | Common Abbreviations | 32 | ||
| 11. | Forward-Looking Information | 33 |
1. ADVISORIES
Basis of Presentation
Unless otherwise noted, all financial information has been prepared in accordance with Canadian generally accepted accounting principles (GAAP), specifically International Accounting Standard (IAS) 34 Interim Financial Reporting as issued by the International Accounting Standards Board, which is within the framework of International Financial Reporting Standards (IFRS).
All financial information is reported in Canadian dollars, unless otherwise noted. Production volumes are presented on a working-interest basis, before royalties, unless otherwise noted. Certain prior year amounts in the Consolidated Statements of Comprehensive (Loss) Income have been reclassified to conform to the current year's presentation.
Non-GAAP Financial Measures
Certain financial measures in this document – namely operating (loss) earnings, cash flow from operations, return on capital employed (ROCE), Oil Sands cash operating costs, free cash flow, and last-in, first-out (LIFO) – are not prescribed by GAAP. Operating (loss) earnings, Oil Sands cash operating costs and LIFO are defined in the Non-GAAP Financial Measures Advisory section of this document and reconciled to GAAP measures in the Consolidated Financial Information and Segment Results and Analysis sections of this document. Cash flow from operations, ROCE and free cash flow are defined and reconciled to GAAP measures in the Non-GAAP Financial Measures Advisory section of this document.
Risk Factors and Forward-Looking Information
The company's financial and operational performance is potentially affected by a number of factors, including, but not limited to, the factors described within the Forward-Looking Information section of this document. This document contains forward-looking information based on Suncor's current expectations, estimates, projections and assumptions. This information is provided to assist readers in understanding the company's future plans and expectations and may not be appropriate for other purposes. Refer to the Forward-Looking Information section of this document for information on the material risk factors and assumptions underlying our forward-looking information.
Measurement Conversions
Certain crude oil and natural gas liquids volumes have been converted to mcfe on the basis of one bbl to six mcf. Also, certain natural gas volumes have been converted to boe or mboe on the same basis. Any figure presented in mcfe, boe or mboe may be misleading, particularly if used in isolation. A conversion ratio of one bbl of crude oil or natural gas liquids to six mcf of natural gas is based on an energy equivalency conversion method primarily applicable at the burner tip and does not represent a value equivalency at the wellhead. Given that the value ratio based on the current price of crude oil as compared to natural gas is significantly different from the energy equivalency of 6:1, conversion on a 6:1 basis may be misleading as an indication of value.
Common Abbreviations
For a list of abbreviations that may be used in this document, refer to the Common Abbreviations section of this document.
SUNCOR ENERGY INC. 2015 FOURTH QUARTER 5
- •
- Fourth quarter financial results.
- •
- Net
loss for the fourth quarter of 2015 was $2.007 billion, compared to net earnings of $84 million in the prior year quarter. Net loss for the fourth quarter
of 2015 included impairment charges of $1.599 billion and an unrealized after-tax foreign exchange loss on the revaluation of U.S. dollar denominated debt of $382 million. Net
earnings in the prior year quarter included the impact of an unrealized after-tax foreign exchange loss of $302 million.
- •
- Operating
loss(1) for the fourth quarter of 2015 was $26 million, including a first-in, first-out (FIFO) loss of $77 million, compared to
operating earnings of $386 million, including a FIFO loss of $372 million, for the prior year quarter. The decrease was driven by lower crude oil price realizations, partially offset by
a favourable downstream pricing environment, increased Oil Sands operations production, lower royalties and lower operating costs compared to the prior year quarter.
- •
- Cash
flow from operations(1) was $1.294 billion for the fourth quarter of 2015, compared to $1.492 billion for the fourth quarter of 2014. The
decrease was largely due to the same factors that impacted operating earnings. Free cash flow(1) was $139 million for the twelve months ended December 31, 2015, compared to
$2.097 billion for the twelve months ended December 31, 2014.
- •
- ROCE(1)
(excluding major projects in progress) decreased to 0.6% for the twelve months ended December 31, 2015, compared to 8.6% for the twelve months
ended December 31, 2014, and has trended unfavourably throughout 2015 as a result of the depressed crude oil price environment, offset by lower operating costs and strong downstream
performance. ROCE for the twelve months ended December 31, 2015 was 4.2% when the impacts of the impairment charges from the fourth quarter of 2015 are excluded.
- •
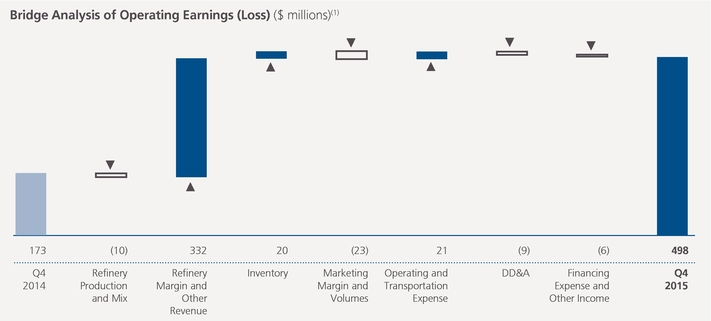
- Higher downstream refining margins on strong location differentials helped drive operating earnings of $498 million for the Refining and
Marketing segment in the quarter. The reversal of Enbridge's Line 9 will provide Suncor with the flexibility to supply its Montreal refinery with a full
slate of inland-priced crude.
- •
- Oil Sands operations cash operating costs(1) averaged $28.00/bbl for the quarter, compared to $34.45/bbl in the prior year
quarter. Increased production, a continued focus on cost reductions, lower unplanned maintenance and lower natural gas prices resulted in a 19% decrease quarter
over quarter.
- •
- Strong Oil Sands production demonstrates Suncor's ongoing commitment to operational discipline and delivering reliable
operations. Oil Sands operations production was 439,700 bbls/d, an increase of 14% from the prior year quarter, with record In Situ production of
233,300 bbls/d achieved in the quarter.
- •
- Firebag nameplate capacity increased from 180,000 bbls/d to 203,000 bbls/d. Cost-effective
debottlenecking activities have been completed at Firebag, with sustained production levels in excess of 180,000 bbls/d in 2015.
- •
- Suncor Energy and Canadian Oil Sands Limited (COS) reach agreement to support the offer by Suncor to purchase all of the shares of
COS. Subsequent to the fourth quarter of 2015, Suncor reached an agreement with COS to support Suncor's offer to purchase all of the shares of COS for
consideration of 0.28 of a Suncor share per COS share. The transaction was valued at $6.6 billion at the time of the agreement.
- •
- Substantial completion of detailed engineering work at Fort Hills. Construction was more
than 50% complete by
the end of the fourth quarter, with first oil expected in the fourth quarter of 2017. In addition, the company completed its acquisition of an additional 10% of the project.
- •
- Suncor continued to return cash to shareholders. Suncor has maintained a strong financial
position, returning
$419 million to shareholders through dividends during the fourth quarter of 2015.
- (1)
- Operating (loss) earnings, cash flow from operations, free cash flow, ROCE and Oil Sands cash operating costs are non-GAAP financial measures. See the Non-GAAP Financial Measures Advisory section of this document.
6 SUNCOR ENERGY INC. 2015 FOURTH QUARTER
3. CONSOLIDATED FINANCIAL INFORMATION
Financial Highlights
|
Three months ended December 31 |
Twelve months ended December 31 |
||||||||||
| ($ millions) | 2015 | 2014 | 2015 | 2014 | |||||||
|
|
|||||||||||
| Net (loss) earnings | |||||||||||
|
|
|||||||||||
| Oil Sands | (616 | ) | 180 | (856 | ) | 1 776 | |||||
|
|
|||||||||||
| Exploration and Production | (1 263 | ) | 198 | (758 | ) | 653 | |||||
|
|
|||||||||||
| Refining and Marketing | 498 | 173 | 2 266 | 1 692 | |||||||
|
|
|||||||||||
| Corporate, Energy Trading and Eliminations | (626 | ) | (467 | ) | (2 647 | ) | (1 422 | ) | |||
|
|
|||||||||||
| Total | (2 007 | ) | 84 | (1 995 | ) | 2 699 | |||||
|
|
|||||||||||
| Operating (loss) earnings(1) | |||||||||||
|
|
|||||||||||
| Oil Sands | (230 | ) | 180 | (111 | ) | 2 771 | |||||
|
|
|||||||||||
| Exploration and Production | (50 | ) | 198 | 7 | 857 | ||||||
|
|
|||||||||||
| Refining and Marketing | 498 | 173 | 2 234 | 1 692 | |||||||
|
|
|||||||||||
| Corporate, Energy Trading and Eliminations | (244 | ) | (165 | ) | (665 | ) | (700 | ) | |||
|
|
|||||||||||
| Total | (26 | ) | 386 | 1 465 | 4 620 | ||||||
|
|
|||||||||||
| Cash flow from (used in) operations(1) | |||||||||||
|
|
|||||||||||
| Oil Sands | 467 | 875 | 2 835 | 5 400 | |||||||
|
|
|||||||||||
| Exploration and Production | 257 | 401 | 1 386 | 1 909 | |||||||
|
|
|||||||||||
| Refining and Marketing | 596 | 240 | 2 872 | 2 178 | |||||||
|
|
|||||||||||
| Corporate, Energy Trading and Eliminations | (26 | ) | (24 | ) | (287 | ) | (429 | ) | |||
|
|
|||||||||||
| Total | 1 294 | 1 492 | 6 806 | 9 058 | |||||||
|
|
|||||||||||
| Capital and Exploration Expenditures(2) | |||||||||||
|
|
|||||||||||
| Sustaining | 952 | 823 | 2 602 | 3 014 | |||||||
|
|
|||||||||||
| Growth | 949 | 970 | 3 618 | 3 516 | |||||||
|
|
|||||||||||
| Total | 1 901 | 1 793 | 6 220 | 6 530 | |||||||
|
|
|||||||||||
|
Twelve months ended December 31 |
|||||
| ($ millions) | 2015 | 2014 | |||
|
|
|||||
| Free Cash Flow(1) | 139 | 2 097 | |||
|
|
|||||
- (1)
- Non-GAAP
financial measures. Operating (loss) earnings are reconciled to net earnings below. See the Non-GAAP Financial Measures Advisory section of this document.
- (2)
- Excludes capitalized interest.
SUNCOR ENERGY INC. 2015 FOURTH QUARTER 7
|
Three months ended December 31 |
Twelve months ended December 31 |
|||||||||
| 2015 | 2014 | 2015 | 2014 | |||||||
|
|
||||||||||
| Production volumes by segment | ||||||||||
|
|
||||||||||
| Oil Sands (mbbls/d) | 470.6 | 419.3 | 463.4 | 421.9 | ||||||
|
|
||||||||||
| Exploration and Production (mboe/d) | 112.3 | 138.3 | 114.4 | 113.0 | ||||||
|
|
||||||||||
| Total | 582.9 | 557.6 | 577.8 | 534.9 | ||||||
|
|
||||||||||
| Production mix | ||||||||||
|
|
||||||||||
| Crude oil and liquids / natural gas (%) | 99/1 | 99/1 | 99/1 | 99/1 | ||||||
|
|
||||||||||
| Refinery utilization (%) | 93 | 95 | 94 | 93 | ||||||
|
|
||||||||||
| Refinery crude oil processed (mbbls/d) | 430.2 | 440.8 | 432.1 | 427.5 | ||||||
|
|
||||||||||
Net Earnings
Suncor's consolidated net loss for the fourth quarter of 2015 was $2.007 billion, compared with net earnings of $84 million for the prior year quarter. Net loss for the year was $1.995 billion, compared to net earnings of $2.699 billion in the prior year. Net earnings were impacted by the same factors that influenced operating earnings described subsequently in this section of this document. Other items affecting net earnings over these periods included:
- •
- In
the fourth quarter of 2015, the company recorded after-tax impairment charges against property, plant and equipment and exploration and evaluation assets of
$359 million on White Rose, $331 million on Golden Eagle, $54 million on Terra Nova, and $54 million on Ballicatters, as a result of declining crude oil pricing, and
$290 million on the company's interest in the Joslyn mining project, due to uncertainty in the timing of development plans. In addition, $96 million of de-recognition charges were
recorded in Oil Sands following a review of certain assets that no longer fit with Suncor's growth strategies, and which could not be repurposed or otherwise deployed.
- •
- In
the fourth quarter of 2015, as a result of shut-in production due to the continued closure of certain Libyan export terminals, escalating political unrest, and increased
uncertainty with respect to the company's return to normal operations in the country, the company recorded an after-tax impairment charge of $415 million against property, plant and equipment
and exploration and evaluation assets.
- •
- The
after-tax unrealized foreign exchange loss on the revaluation of U.S. dollar denominated debt was $382 million for the fourth quarter of 2015 and
$1.930 billion for the twelve months of 2015, compared to $302 million for the fourth quarter of 2014 and $722 million for the twelve months of 2014.
- •
- In
the second quarter of 2015, the company recorded an after-tax gain of $68 million on the disposal of the company's share of certain assets and liabilities of
Pioneer Energy in the Refining and Marketing segment.
- •
- In
the second quarter of 2015, the company recorded a $423 million deferred income tax charge related to a 2% increase in the Alberta corporate income
tax rate.
- •
- In
the first quarter of 2015, the U.K. government enacted a decrease in the supplementary charge rate on oil and gas profits in the North Sea that reduced the
statutory tax rate on Suncor's earnings in the U.K. from 62% to 50%. The company revalued its deferred income tax balances, resulting in a one-time decrease to deferred income taxes of
$406 million.
- •
- In
the first quarter of 2015, the company recorded after-tax insurance proceeds of $75 million related to a claim on the Terra Nova asset in the Exploration and
Production (E&P) segment.
- •
- In
the first quarter of 2015, the company recorded after-tax restructuring charges of $57 million related to cost reduction initiatives in the Corporate segment.
- •
- In
the third quarter of 2014, the company recorded an after-tax gain of $61 million relating to the sale of its Wilson Creek natural gas assets in the
E&P segment.
- •
- In
the third quarter of 2014, the company recorded a current income tax expense adjustment and associated interest expense of $54 million related to the timing of tax
depreciation deductions taken on certain capital expenditures incurred in a prior period in the Oil Sands segment.
- •
- In the second quarter of 2014, Total E&P Canada Ltd. (Total E&P), the operator of the Joslyn mining project, together with Suncor and the other co-owners of the project agreed to scale back certain development activities in order to focus on engineering studies to further optimize the Joslyn project development plan. As a result of Suncor's assessment of expected future net cash flows and the uncertainty of the project, including the timing of the
8 SUNCOR ENERGY INC. 2015 FOURTH QUARTER
development plans, Suncor recorded an after-tax charge to net earnings of $718 million against property, plant and equipment and exploration and evaluation assets.
- •
- In
the second quarter of 2014, as a result of the continued closure of certain Libyan export terminals and the company's view on production plans during the remaining term
of the production sharing agreements, the company recorded an after-tax impairment charge of $297 million against property, plant and equipment and exploration and evaluation assets.
- •
- In
the second quarter of 2014, the company recorded after-tax impairment charges of $223 million in Oil Sands following a review of certain assets that no longer fit
with Suncor's previously revised growth strategies and which could not be repurposed or otherwise deployed. Such assets included a pipeline and related compressor, as well as steam generator
components.
- •
- In the second quarter of 2014, the company recorded after-tax earnings of $32 million related to an agreement reached for Suncor to receive a reserves redetermination of 1.2 million barrels of oil related to an interest in a Norwegian asset that Suncor previously owned.
Operating (Loss) Earnings Reconciliation(1)(2)
|
Three months ended December 31 |
Twelve months ended December 31 |
|||||||||
| ($ millions) | 2015 | 2014 | 2015 | 2014 | ||||||
|
|
||||||||||
| Net (loss) earnings | (2 007 | ) | 84 | (1 995 | ) | 2 699 | ||||
|
|
||||||||||
| Unrealized foreign exchange loss on U.S. dollar denominated debt | 382 | 302 | 1 930 | 722 | ||||||
|
|
||||||||||
| Impact of income tax rate adjustments on deferred taxes | — | — | 17 | — | ||||||
|
|
||||||||||
| Gain on significant disposal | — | — | (68 | ) | (61 | ) | ||||
|
|
||||||||||
| Restructuring charges | — | — | 57 | — | ||||||
|
|
||||||||||
| Insurance proceeds | — | — | (75 | ) | — | |||||
|
|
||||||||||
| Impairments | 1 599 | — | 1 599 | 1 238 | ||||||
|
|
||||||||||
| Reserves redetermination | — | — | — | (32 | ) | |||||
|
|
||||||||||
| Income tax charge | — | — | — | 54 | ||||||
|
|
||||||||||
| Operating (loss) earnings(1) | (26 | ) | 386 | 1 465 | 4 620 | |||||
|
|
||||||||||
- (1)
- Operating
(loss) earnings is a non-GAAP financial measure. All reconciling items are presented on an after-tax basis. See the Non-GAAP Financial Measures Advisory section of
this document.
- (2)
- Refer to net earnings discussion above for descriptions of the adjustments.
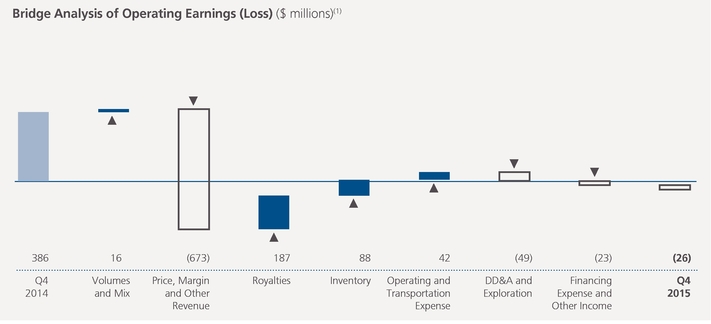
- (1)
- For an explanation of this bridge analysis, see the Non-GAAP Financial Measures Advisory section of this document.
SUNCOR ENERGY INC. 2015 FOURTH QUARTER 9
Suncor's consolidated operating loss for the fourth quarter of 2015 was $26 million, compared to $386 million of operating earnings for the prior year quarter, primarily due to significantly lower upstream price realizations consistent with the decline in benchmark crude oil prices. The decrease was partially offset by a favourable downstream pricing environment, increased Oil Sands operations production, lower royalties resulting from the decrease in crude oil prices, and lower operating costs, compared to the prior year quarter.
Suncor's consolidated operating earnings were $1.465 billion for the twelve months of 2015, compared to $4.620 billion for the prior year period. The decrease was primarily due to the significantly lower upstream price realizations consistent with the decline in benchmark crude prices, partially offset by strong Oil Sands operations production due to improved reliability, lower operating costs, and a strong downstream pricing environment.
After-Tax Share-Based Compensation Expense (Recovery) by Segment
|
Three months ended December 31 |
Twelve months ended December 31 |
||||||||
| ($ millions) | 2015 | 2014 | 2015 | 2014 | |||||
|
|
|||||||||
| Oil Sands | 17 | (3 | ) | 67 | 64 | ||||
|
|
|||||||||
| Exploration and Production | 2 | — | 8 | 11 | |||||
|
|
|||||||||
| Refining and Marketing | 9 | — | 39 | 37 | |||||
|
|
|||||||||
| Corporate, Energy Trading and Eliminations | 31 | (4 | ) | 120 | 139 | ||||
|
|
|||||||||
| Total share-based compensation expense (recovery) | 59 | (7 | ) | 234 | 251 | ||||
|
|
|||||||||
The after-tax share-based compensation expense increased to $59 million during the fourth quarter of 2015, compared to a recovery of $7 million during the prior year quarter, as a result of an increase in the company's share price in the fourth quarter of 2015 as compared to a decrease in the prior year quarter.
Business Environment
Commodity prices, refining crack spreads and foreign exchange rates are important factors that affect the results of Suncor's operations.
|
Average for three months ended December 31 |
Average for twelve months ended December 31 |
||||||||||
| 2015 | 2014 | 2015 | 2014 | ||||||||
|
|
|||||||||||
| WTI crude oil at Cushing | US$/bbl | 42.15 | 73.15 | 48.75 | 93.00 | ||||||
|
|
|||||||||||
| ICE Brent crude oil at Sullom Voe | US$/bbl | 44.70 | 77.00 | 53.60 | 99.50 | ||||||
|
|
|||||||||||
| Dated Brent/Maya crude oil FOB price differential | US$/bbl | 10.35 | 10.05 | 9.50 | 13.70 | ||||||
|
|
|||||||||||
| MSW at Edmonton | Cdn$/bbl | 53.55 | 75.95 | 57.60 | 94.85 | ||||||
|
|
|||||||||||
| WCS at Hardisty | US$/bbl | 27.70 | 58.90 | 35.25 | 73.60 | ||||||
|
|
|||||||||||
| Light/heavy differential for WTI at Cushing less WCS at Hardisty | US$/bbl | 14.50 | 14.25 | 13.50 | 19.40 | ||||||
|
|
|||||||||||
| Condensate at Edmonton | US$/bbl | 41.65 | 70.55 | 47.35 | 92.95 | ||||||
|
|
|||||||||||
| Natural gas (Alberta spot) at AECO | Cdn$/mcf | 2.45 | 3.60 | 2.65 | 4.50 | ||||||
|
|
|||||||||||
| Alberta Power Pool Price | Cdn$/MWh | 21.20 | 30.55 | 33.40 | 49.65 | ||||||
|
|
|||||||||||
| New York Harbor 3-2-1 crack(1) | US$/bbl | 13.60 | 16.15 | 19.70 | 19.65 | ||||||
|
|
|||||||||||
| Chicago 3-2-1 crack(1) | US$/bbl | 13.90 | 14.40 | 18.50 | 17.40 | ||||||
|
|
|||||||||||
| Portland 3-2-1 crack(1) | US$/bbl | 17.90 | 12.45 | 25.15 | 20.15 | ||||||
|
|
|||||||||||
| Gulf Coast 3-2-1 crack(1) | US$/bbl | 11.05 | 10.15 | 18.35 | 16.50 | ||||||
|
|
|||||||||||
| Exchange rate | US$/Cdn$ | 0.75 | 0.88 | 0.78 | 0.91 | ||||||
|
|
|||||||||||
| Exchange rate (end of period) | US$/Cdn$ | 0.72 | 0.86 | 0.72 | 0.86 | ||||||
|
|
|||||||||||
- (1)
- 3-2-1 crack spreads are indicators of the refining margin generated by converting three barrels of WTI into two barrels of gasoline and one barrel of diesel. The crack spreads presented here generally approximate the regions into which the company sells refined products through retail and wholesale channels.
10 SUNCOR ENERGY INC. 2015 FOURTH QUARTER
Suncor's sweet SCO price realizations are influenced primarily by the price of WTI at Cushing and by the supply and demand for sweet SCO from Western Canada. Price realizations in the fourth quarter of 2015 for sweet SCO were negatively affected by a lower WTI price of US$42.15/bbl, compared to US$73.15/bbl in the prior year quarter, partially offset by a lower differential for SCO relative to WTI. Suncor produces sour SCO, the price of which is influenced by various crude benchmarks, including, but not limited to, MSW at Edmonton and WCS at Hardisty, and which can also be affected by prices negotiated for spot sales. Prices for MSW at Edmonton and WCS at Hardisty decreased in the fourth quarter of 2015 to $53.55/bbl and US$27.70 /bbl, respectively, compared to $75.95/bbl and US$58.90/bbl, respectively, in the prior year quarter, resulting in lower price realizations for sour SCO.
Bitumen production that Suncor does not upgrade is blended with diluent or SCO to facilitate delivery on pipeline systems. Net bitumen price realizations are therefore influenced by both prices for Canadian heavy crude oil (WCS at Hardisty is a common reference), prices for diluent (Condensate at Edmonton) and SCO. Bitumen price realizations can also be affected by bitumen quality and spot sales.
Suncor's price realizations for production from East Coast Canada and International assets are influenced primarily by the price for Brent crude. Brent crude pricing decreased to an average of US$44.70/bbl in the fourth quarter of 2015, compared to US$77.00/bbl in the prior year quarter.
Natural gas used in Suncor's Oil Sands and Refining operations is primarily referenced to Alberta spot prices at AECO. The average AECO benchmark decreased to $2.45/mcf in the fourth quarter of 2015, from $3.60/mcf in the prior year quarter.
Suncor's refining margins are influenced primarily by 3-2-1 crack spreads, which are industry indicators approximating the gross margin on a barrel of crude oil that is refined to produce gasoline and distillates, and by light/heavy and light/sour crude differentials. More complex refineries can earn greater refining margins by processing less expensive, heavier crudes. Crack spreads do not necessarily reflect the margins of a specific refinery. Crack spreads are based on current crude feedstock prices whereas actual refining margins are based on FIFO inventory accounting, where a delay exists between the time that feedstock is purchased, processed and sold to a third party. FIFO losses normally reflect a declining price environment for crude oil and finished products, whereas FIFO gains reflect an increasing price environment for crude oil and finished products. Specific refinery margins are further impacted by actual crude purchase costs, refinery configuration and refined products sales markets unique to that refinery.
Excess electricity produced in Suncor's Oil Sands business is sold to the Alberta Electric System Operator (AESO), with the proceeds netted against the cash operating cost per barrel metric. The Alberta power pool price decreased to an average of $21.20/MWh in the fourth quarter of 2015 from $30.55/MWh in the prior year quarter.
The majority of Suncor's revenue from the sale of oil and natural gas commodities is based on prices that are determined by or referenced to U.S. dollar benchmark prices. The majority of Suncor's expenditures are realized in Canadian dollars. In the fourth quarter of 2015, the Canadian dollar weakened in relation to the U.S. dollar as the average exchange rate decreased to US$0.75 per one Canadian dollar from US$0.88 per one Canadian dollar in the prior year quarter. This rate decrease had a positive impact on price realizations for the company during the fourth quarter.
Suncor also has assets and liabilities, notably most of the company's debt, which are denominated in U.S. dollars and translated to Suncor's reporting currency (Canadian dollars) at each balance sheet date. A decrease in the value of the Canadian dollar relative to the U.S. dollar from the previous balance sheet date increases the amount of Canadian dollars required to settle U.S. dollar denominated obligations.
SUNCOR ENERGY INC. 2015 FOURTH QUARTER 11
4. SEGMENT RESULTS AND ANALYSIS
OIL SANDS
Financial Highlights
|
Three months ended December 31 |
Twelve months ended December 31 |
||||||||||
| ($ millions) | 2015 | 2014 | 2015 | 2014 | |||||||
|
|
|||||||||||
| Gross revenues | 2 017 | 2 838 | 9 332 | 14 561 | |||||||
|
|
|||||||||||
| Less: Royalties | (10 | ) | (107 | ) | (114 | ) | (982 | ) | |||
|
|
|||||||||||
| Operating revenues, net of royalties | 2 007 | 2 731 | 9 218 | 13 579 | |||||||
|
|
|||||||||||
| Net (loss) earnings | (616 | ) | 180 | (856 | ) | 1 776 | |||||
|
|
|||||||||||
| Adjusted for: | |||||||||||
|
|
|||||||||||
| Impact of income tax rate adjustments on deferred taxes(1) | — | — | 359 | — | |||||||
|
|
|||||||||||
| Income tax charge | — | — | — | 54 | |||||||
|
|
|||||||||||
| Impairment of Joslyn mining project and other assets(2) | 386 | — | 386 | 941 | |||||||
|
|
|||||||||||
| Operating (loss) earnings(3) | (230 | ) | 180 | (111 | ) | 2 771 | |||||
|
|
|||||||||||
| Oil Sands operations | (231 | ) | 182 | (33 | ) | 2 696 | |||||
|
|
|||||||||||
| Oil Sands ventures | 1 | (2 | ) | (78 | ) | 75 | |||||
|
|
|||||||||||
| Cash flow from operations(3) | 467 | 875 | 2 835 | 5 400 | |||||||
|
|
|||||||||||
- (1)
- Adjustment
to the company's deferred income taxes resulting from a 2% increase in the Alberta corporate income tax rate in Q2 2015.
- (2)
- After-tax
impairment charges of $290 million on the company's interest in the Joslyn mining project and $96 million related to certain assets in Oil Sands
operations.
- (3)
- Non-GAAP financial measures. See the Non-GAAP Financial Measures Advisory section of this document.
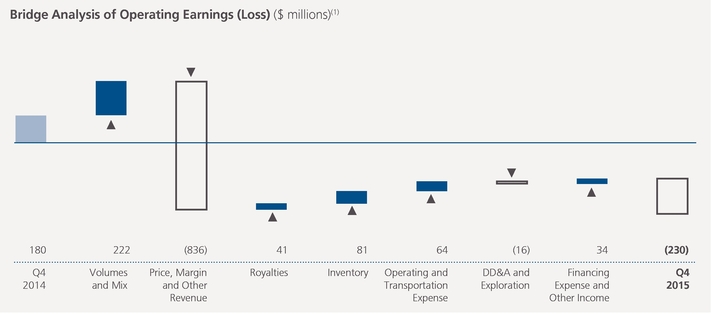
- (1)
- For an explanation of this bridge analysis, see the Non-GAAP Financial Measures Advisory section of this document.
Operating loss for Oil Sands operations was $231 million, compared to operating earnings of $182 million in the prior year quarter. The decrease was primarily due to lower price realizations as a result of lower crude oil benchmark prices, partially offset by increased production, lower operating and transportation expenses as a result of the impact of cost reduction initiatives, lower unplanned maintenance activities, lower natural gas prices, and lower royalties.
Operating earnings for Oil Sands ventures were $1 million, compared to an operating loss of $2 million in the prior year quarter, primarily due to lower operating costs and lower royalties, partially offset by lower price realizations and decreased production.
12 SUNCOR ENERGY INC. 2015 FOURTH QUARTER
Production Volumes(1)
|
Three months ended December 31 |
Twelve months ended December 31 |
|||||||||
| (mbbls/d) | 2015 | 2014 | 2015 | 2014 | ||||||
|
|
||||||||||
| Upgraded product (SCO and diesel) | 292.2 | 276.3 | 320.1 | 289.1 | ||||||
|
|
||||||||||
| Non-upgraded bitumen | 147.5 | 107.9 | 113.5 | 101.8 | ||||||
|
|
||||||||||
| Oil Sands operations | 439.7 | 384.2 | 433.6 | 390.9 | ||||||
|
|
||||||||||
| Oil Sands ventures | 30.9 | 35.1 | 29.8 | 31.0 | ||||||
|
|
||||||||||
| Total | 470.6 | 419.3 | 463.4 | 421.9 | ||||||
|
|
||||||||||
- (1)
- Bitumen production from Oil Sands Base operations is upgraded, while bitumen production from In Situ operations is either upgraded or sold directly to customers, including Suncor's own refineries. Yields of SCO and diesel from Suncor's upgrading process are approximately 79% of bitumen feedstock input.
Sales Volumes
|
Three months ended December 31 |
Twelve months ended December 31 |
|||||||||
| (mbbls/d) | 2015 | 2014 | 2015 | 2014 | ||||||
|
|
||||||||||
| Oil Sands operations sales volumes | ||||||||||
|
|
||||||||||
| Sweet SCO | 100.2 | 75.5 | 107.0 | 99.7 | ||||||
|
|
||||||||||
| Diesel | 29.4 | 31.2 | 31.3 | 30.7 | ||||||
|
|
||||||||||
| Sour SCO | 154.2 | 152.7 | 182.5 | 158.9 | ||||||
|
|
||||||||||
| Upgraded product | 283.8 | 259.4 | 320.8 | 289.3 | ||||||
|
|
||||||||||
| Non-upgraded bitumen | 136.3 | 110.2 | 107.7 | 101.4 | ||||||
|
|
||||||||||
| Oil Sands operations | 420.1 | 369.6 | 428.5 | 390.7 | ||||||
|
|
||||||||||
| Oil Sands ventures | 30.9 | 35.1 | 29.8 | 31.0 | ||||||
|
|
||||||||||
| Total | 451.0 | 404.7 | 458.3 | 421.7 | ||||||
|
|
||||||||||
Production volumes for Oil Sands operations increased to 439,700 bbls/d in the fourth quarter of 2015, compared to 384,200 bbls/d in the prior year quarter. The increase was primarily due to reliable operations across all assets, compared to the prior year quarter, which was impacted by unplanned maintenance at Upgrader 2 and on certain utility assets supporting upgrading and extraction. Planned upgrader maintenance was completed in the fourth quarter of 2015.
Sales volumes for Oil Sands operations increased to an average of 420,100 bbls/d in the fourth quarter of 2015, up from 369,600 bbls/d in the prior year quarter, due to higher production volumes. The SCO mix reflected higher sweet production due to less planned maintenance completed in the quarter. The prior year quarter included the impacts of planned and unplanned maintenance.
Inventory builds occurred in both quarters; however, the volumes built in the fourth quarter of 2015 had a relatively smaller impact on earnings due to the lower price environment.
Suncor's share of Syncrude production decreased to 30,900 bbls/d in the fourth quarter of 2015, compared to 35,100 bbls/d in the prior year quarter. The decrease was primarily due to unplanned maintenance activities associated with sulphur removal and water treatment assets, and an unplanned coker maintenance event that began late in the quarter.
SUNCOR ENERGY INC. 2015 FOURTH QUARTER 13
Bitumen Production
|
Three months ended December 31 |
Twelve months ended December 31 |
|||||||||
| 2015 | 2014 | 2015 | 2014 | |||||||
|
|
||||||||||
| Oil Sands Base | ||||||||||
|
|
||||||||||
| Bitumen production (mbbls/d) | 292.4 | 254.1 | 307.3 | 274.4 | ||||||
|
|
||||||||||
| Bitumen ore mined (thousands of tonnes per day) | 433.7 | 384.6 | 461.3 | 408.5 | ||||||
|
|
||||||||||
| Bitumen ore grade quality (bbls/tonne) | 0.67 | 0.66 | 0.67 | 0.67 | ||||||
|
|
||||||||||
| In Situ | ||||||||||
|
|
||||||||||
| Bitumen production – Firebag (mbbls/d) | 198.8 | 182.2 | 186.9 | 172.0 | ||||||
|
|
||||||||||
| Bitumen production – MacKay River (mbbls/d) | 34.5 | 28.7 | 30.7 | 27.0 | ||||||
|
|
||||||||||
| Total In Situ bitumen production | 233.3 | 210.9 | 217.6 | 199.0 | ||||||
|
|
||||||||||
| Steam-to-oil ratio – Firebag | 2.7 | 2.6 | 2.6 | 2.8 | ||||||
|
|
||||||||||
| Steam-to-oil ratio – MacKay River | 3.0 | 2.9 | 2.9 | 2.9 | ||||||
|
|
||||||||||
Oil Sands Base bitumen production from mining and extraction activities increased to an average of 292,400 bbls/d in the fourth quarter of 2015 from 254,100 bbls/d in the prior year quarter. The increase was mainly a result of stronger reliability in the fourth quarter of 2015.
In Situ achieved record bitumen production in the fourth quarter of 2015, increasing to 233,300 bbls/d from 210,900 bbls/d in the prior year quarter. The increase was primarily driven by cost-effective debottlenecking activities at Firebag and strong infill well performance. Effective January 1, 2016, nameplate capacity for Firebag has been increased to 203,000 bbls/d from 180,000 bbls/d with sustained production levels in excess of 180,000 bbls/d in 2015. Production at MacKay River increased to 34,500 bbls/d in the fourth quarter of 2015 from 28,700 bbls/d in the prior year quarter. The increase was primarily due to additional production associated with the debottlenecking project.
Steam-to-oil ratios for the fourth quarter of 2015 increased compared to the prior year quarter to 2.7 from 2.6 for Firebag and 3.0 from 2.9 for MacKay River, due to additional steam requirements for the commissioning of new wells.
Price Realizations
| Net of transportation costs, but before royalties |
Three months ended December 31 |
Twelve months ended December 31 |
|||||||||
| ($/bbl) | 2015 | 2014 | 2015 | 2014 | |||||||
|
|
|||||||||||
| Oil Sands operations | |||||||||||
|
|
|||||||||||
| Sweet SCO and diesel | 60.86 | 88.78 | 66.00 | 109.02 | |||||||
|
|
|||||||||||
| Sour SCO and bitumen | 32.93 | 61.68 | 41.58 | 76.66 | |||||||
|
|
|||||||||||
| Crude sales basket (all products) | 41.55 | 69.51 | 49.46 | 87.46 | |||||||
|
|
|||||||||||
| Crude sales basket, relative to WTI | (14.77 | ) | (13.57 | ) | (12.91 | ) | (15.28 | ) | |||
|
|
|||||||||||
| Oil Sands ventures | |||||||||||
|
|
|||||||||||
| Syncrude – sweet SCO | 57.37 | 81.85 | 61.55 | 99.32 | |||||||
|
|
|||||||||||
| Syncrude, relative to WTI | 1.06 | (1.23 | ) | (0.83 | ) | (3.42 | ) | ||||
|
|
|||||||||||
Average price realizations from Oil Sands operations decreased to $41.55/bbl in the fourth quarter of 2015 from $69.51/bbl in the prior year quarter, primarily due to lower benchmark prices, partially offset by favourable foreign exchange rates.
Royalties
Royalties for the Oil Sands segment were lower in the fourth quarter of 2015 compared to the prior year quarter, primarily due to lower bitumen prices, partially offset by higher production.
14 SUNCOR ENERGY INC. 2015 FOURTH QUARTER
Expenses and Other Factors
Operating and transportation expenses for the fourth quarter of 2015 decreased from the prior year quarter, primarily due to the impact of cost reduction initiatives, lower unplanned maintenance activities and lower natural gas prices. See the Cash Operating Costs Reconciliation section below for further details regarding cash operating costs and non-production costs for Oil Sands operations. Transportation expense for the fourth quarter of 2015 was higher than the prior year quarter, primarily due to the costs related to increased sales volumes.
DD&A expense for the fourth quarter of 2015 was higher in comparison to the same period in 2014, mainly due to assets commissioned in 2015, including well pads and infill wells, and increased In Situ production.
Cash Operating Costs Reconciliation(1)
|
Three months ended December 31 |
Twelve months ended December 31 |
||||||||||
| ($ millions) | 2015 | 2014 | 2015 | 2014 | |||||||
|
|
|||||||||||
| Operating, selling and general expense (OS&G) | 1 317 | 1 451 | 5 220 | 5 940 | |||||||
|
|
|||||||||||
| Syncrude OS&G | (118 | ) | (153 | ) | (471 | ) | (593 | ) | |||
|
|
|||||||||||
| Non-production costs(2) | (68 | ) | (49 | ) | (279 | ) | (340 | ) | |||
|
|
|||||||||||
| Other(3) | 1 | (31 | ) | (63 | ) | (187 | ) | ||||
|
|
|||||||||||
| Oil Sands cash operating costs | 1 132 | 1 218 | 4 407 | 4 820 | |||||||
|
|
|||||||||||
| Oil Sands cash operating costs ($/bbl) | 28.00 | 34.45 | 27.85 | 33.80 | |||||||
|
|
|||||||||||
- (1)
- Cash
operating costs and cash operating costs per barrel are non-GAAP financial measures. See the Non-GAAP Financial Measures Advisory section of this document.
- (2)
- Significant
non-production costs include, but are not limited to, share-based compensation adjustments, research, and the expense recorded as part of a non-monetary arrangement
involving a third-party processor.
- (3)
- Other includes the impacts of changes in inventory valuation and operating revenues associated with excess capacity, primarily associated with excess power from cogeneration units.
Cash operating costs per barrel for Oil Sands operations in the fourth quarter of 2015 decreased to $28.00, compared to $34.45 in the prior year quarter, primarily due to higher production volumes combined with the impact of cost reduction initiatives, lower unplanned maintenance activities and lower natural gas input costs. Total cash operating costs decreased to $1.132 billion, from $1.218 billion in the prior year quarter despite the increase in production.
In the fourth quarter of 2015, non-production costs, which are excluded from cash operating costs, were higher than the prior year quarter. The increase was primarily due to higher share-based compensation expense during the fourth quarter of 2015, partially offset by cost reduction initiatives, including reductions to discretionary spending, lower expenses related to a gas swap arrangement with a third-party processor, and a decrease in costs associated with future growth activities.
Other items, which are also excluded from cash operating costs, decreased in the fourth quarter of 2015 compared to the prior year quarter, primarily due to the impacts of changes in inventory and a decrease in operating revenues associated with excess power from cogeneration units as a result of the decrease in power prices.
Planned Maintenance
The company plans to complete a turnaround at Upgrader 2, commencing at the end of the first quarter of 2016. The impact of this maintenance has been reflected in the company's 2016 guidance.
Fort Hills Acquisition
During the fourth quarter of 2015, the company completed its purchase of an additional 10% working interest in the Fort Hills oil sands project from Total E&P for $360 million. Suncor's working interest in the project is now 50.8%.
SUNCOR ENERGY INC. 2015 FOURTH QUARTER 15
EXPLORATION AND PRODUCTION
Financial Highlights
|
Three months ended December 31 |
Twelve months ended December 31 |
||||||||||
| ($ millions) | 2015 | 2014 | 2015 | 2014 | |||||||
|
|
|||||||||||
| Gross revenues | 505 | 1 078 | 2 612 | 4 715 | |||||||
|
|
|||||||||||
| Less: Royalties | (33 | ) | (203 | ) | (267 | ) | (672 | ) | |||
|
|
|||||||||||
| Operating revenues, net of royalties | 472 | 875 | 2 345 | 4 043 | |||||||
|
|
|||||||||||
| Net (loss) earnings | (1 263 | ) | 198 | (758 | ) | 653 | |||||
|
|
|||||||||||
| Adjusted for: | |||||||||||
|
|
|||||||||||
| Impairments(1) | 1 213 | — | 1 213 | 297 | |||||||
|
|
|||||||||||
| Impact of income tax rate adjustments on deferred taxes(2) | — | — | (373 | ) | — | ||||||
|
|
|||||||||||
| Insurance proceeds(3) | — | — | (75 | ) | — | ||||||
|
|
|||||||||||
| Gain on significant disposals | — | — | — | (61 | ) | ||||||
|
|
|||||||||||
| Reserves redetermination | — | — | — | (32 | ) | ||||||
|
|
|||||||||||
| Operating (loss) earnings(4) | (50 | ) | 198 | 7 | 857 | ||||||
|
|
|||||||||||
| E&P Canada | (9 | ) | 85 | (14 | ) | 502 | |||||
|
|
|||||||||||
| E&P International | (41 | ) | 113 | 21 | 355 | ||||||
|
|
|||||||||||
| Cash flow from operations(4) | 257 | 401 | 1 386 | 1 909 | |||||||
|
|
|||||||||||
- (1)
- After-tax
impairment charges of $798 million on certain offshore E&P assets as a result of declining crude oil pricing and $415 million (Q2
2014 – $297 million) against the company's Libyan assets.
- (2)
- Adjustments
to the company's deferred income taxes from a 12% decrease in the U.K. tax rate on oil and gas profits from the North Sea in the first quarter of 2015 and a 2%
increase in the Alberta corporate income tax rate in the second quarter of 2015.
- (3)
- Business
interruption insurance proceeds recorded in the first quarter of 2015 for the Terra Nova asset.
- (4)
- Non-GAAP financial measures. See also the Non-GAAP Financial Measures Advisory section of this document.
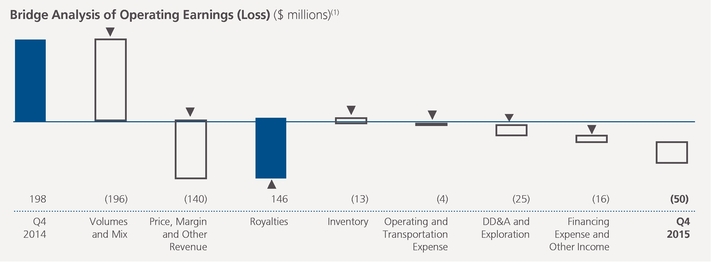
- (1)
- For an explanation of this bridge analysis, see the Non-GAAP Financial Measures Advisory section of this document.
E&P operating loss was $50 million in the fourth quarter of 2015, compared to operating earnings of $198 million in the prior year quarter.
Operating loss of $9 million in E&P Canada compared with operating earnings of $85 million in the prior year quarter, primarily due to lower price realizations and a decrease in production.
Operating loss of $41 million in E&P International compared with operating earnings of $113 million in the prior year quarter, primarily due to lower price realizations and lower Buzzard production, partially offset by additional production from Golden Eagle.
16 SUNCOR ENERGY INC. 2015 FOURTH QUARTER
|
Three months ended December 31 |
Twelve months ended December 31 |
|||||||||
| 2015 | 2014 | 2015 | 2014 | |||||||
|
|
||||||||||
| E&P Canada | ||||||||||
|
|
||||||||||
| Terra Nova (mbbls/d) | 13.1 | 24.0 | 13.5 | 17.3 | ||||||
|
|
||||||||||
| Hibernia (mbbls/d) | 15.6 | 20.8 | 18.1 | 23.1 | ||||||
|
|
||||||||||
| White Rose (mbbls/d) | 14.8 | 13.3 | 12.2 | 14.6 | ||||||
|
|
||||||||||
| North America Onshore (mboe/d) | 3.1 | 2.4 | 3.2 | 3.6 | ||||||
|
|
||||||||||
| 46.6 | 60.5 | 47.0 | 58.6 | |||||||
|
|
||||||||||
| E&P International | ||||||||||
|
|
||||||||||
| Buzzard (mboe/d) | 45.5 | 54.0 | 49.8 | 47.1 | ||||||
|
|
||||||||||
| Golden Eagle (mboe/d) | 17.7 | 2.2 | 14.8 | 0.6 | ||||||
|
|
||||||||||
| United Kingdom (mboe/d) | 63.2 | 56.2 | 64.6 | 47.7 | ||||||
|
|
||||||||||
| Libya (mbbls/d) | 2.5 | 21.6 | 2.8 | 6.7 | ||||||
|
|
||||||||||
| 65.7 | 77.8 | 67.4 | 54.4 | |||||||
|
|
||||||||||
| Total Production (mboe/d) | 112.3 | 138.3 | 114.4 | 113.0 | ||||||
|
|
||||||||||
| Production mix (liquids/gas) (%) | 96/4 | 97/3 | 96/4 | 97/3 | ||||||
|
|
||||||||||
E&P Canada production averaged 46,600 boe/d in the fourth quarter of 2015, compared to 60,500 boe/d in the prior year quarter. The decrease was primarily due to expected natural declines at Terra Nova and Hibernia, in addition to a planned turnaround at Hibernia and unplanned maintenance at Terra Nova.
E&P International production averaged 65,700 boe/d in the fourth quarter of 2015, compared to 77,800 boe/d in the prior year quarter. The decrease was primarily due to Libyan production being substantially shut in, as well as decreased production at Buzzard as a result of constraints on the export pipeline system due to unplanned maintenance at one of the terminals, partially offset by increased production at Golden Eagle, which operated at peak production rates in the fourth quarter of 2015. Production in Libya temporarily resumed at the start of the quarter, but was once again shut in during November. Production in Libya remains impacted by political unrest, with the timing of a return to normal operations remaining uncertain.
Price Realizations
|
Three months ended December 31 |
Twelve months ended December 31 |
|||||||||
| Net of transportation costs, but before royalties | 2015 | 2014 | 2015 | 2014 | ||||||
|
|
||||||||||
| Exploration and Production | ||||||||||
|
|
||||||||||
| E&P Canada – Crude oil and natural gas liquids ($/bbl) | 49.48 | 78.51 | 61.78 | 105.98 | ||||||
|
|
||||||||||
| E&P Canada – Natural gas ($/mcfe) | 1.03 | 3.42 | 1.78 | 4.49 | ||||||
|
|
||||||||||
| E&P International ($/boe) | 52.68 | 82.27 | 61.44 | 104.12 | ||||||
|
|
||||||||||
In the fourth quarter of 2015, price realizations for crude oil from E&P Canada and E&P International were lower than the prior year quarter, consistent with the decrease in benchmark prices for Brent crude oil, partially offset by favourable foreign exchange rates.
Royalties
Royalties were lower in the fourth quarter of 2015, compared with the prior year quarter, primarily due to lower production and lower price realizations.
Inventory
The inventory build during the fourth quarter of 2015 was slightly higher than the inventory build in the prior year quarter, due to timing of shuttle tankers in East Coast Canada.
SUNCOR ENERGY INC. 2015 FOURTH QUARTER 17
Expenses and Other Factors
DD&A and exploration expenses increased in the fourth quarter of 2015, compared to the prior year quarter, due to increased production associated with Golden Eagle.
Planned Maintenance
A planned four-week maintenance event at Terra Nova has been scheduled to commence in the second quarter of 2016. The impact of this maintenance has been reflected in the company's 2016 guidance.
REFINING AND MARKETING
Financial Highlights
|
Three months ended December 31 |
Twelve months ended December 31 |
|||||||||
| ($ millions) | 2015 | 2014 | 2015 | 2014 | ||||||
|
|
||||||||||
| Operating revenues | 4 442 | 6 056 | 19 826 | 26 627 | ||||||
|
|
||||||||||
| Net earnings | 498 | 173 | 2 266 | 1 692 | ||||||
|
|
||||||||||
| Adjusted for: | ||||||||||
|
|
||||||||||
| Impact of income tax rate adjustments on deferred taxes(1) | — | — | 36 | — | ||||||
|
|
||||||||||
| Gain on significant disposal(2) | — | — | (68 | ) | — | |||||
|
|
||||||||||
| Operating earnings(3) | 498 | 173 | 2 234 | 1 692 | ||||||
|
|
||||||||||
| Refining and Supply | 424 | 78 | 1 864 | 1 385 | ||||||
|
|
||||||||||
| Marketing | 74 | 95 | 370 | 307 | ||||||
|
|
||||||||||
| Cash flow from operations(3) | 596 | 240 | 2 872 | 2 178 | ||||||
|
|
||||||||||
- (1)
- Adjustment
to the company's deferred income taxes resulting from a 2% increase in the Alberta corporate income tax rate in Q2 2015.
- (2)
- After-tax
gain related to the sale of the company's share of certain assets and liabilities of Pioneer Energy in the Refining and Marketing segment in the second quarter
of 2015.
- (3)
- Non-GAAP financial measures. See the Non-GAAP Financial Measures Advisory section of this document.
- (1)
- For an explanation of this bridge analysis, see the Non-GAAP Financial Measures Advisory section of this document.
Refining and Supply operating earnings were $424 million in the fourth quarter of 2015, compared to $78 million in the prior year quarter. The increase in the fourth quarter of 2015 was primarily due to higher gasoline benchmark cracking margins, higher location differentials supported by the positive impact of the weaker Canadian dollar, partially offset by
18 SUNCOR ENERGY INC. 2015 FOURTH QUARTER
lower distillate cracking margins, lower throughput, and the impact of narrower inland crude differentials. In addition, the fourth quarter of 2015 included lower operating expenses driven by lower maintenance costs, lower environmental expenses, and the impact of cost reduction initiatives, partially offset by higher share-based compensation expense.
Marketing activities contributed $74 million to operating earnings in the fourth quarter of 2015, compared to $95 million in the prior year quarter, primarily due to lower wholesale volumes impacted by softer demand.
Volumes
|
Three months ended December 31 |
Twelve months ended December 31 |
|||||||||
| 2015 | 2014 | 2015 | 2014 | |||||||
|
|
||||||||||
| Crude oil processed (mbbls/d) | ||||||||||
|
|
||||||||||
| Eastern North America | 208.0 | 201.0 | 208.1 | 199.2 | ||||||
|
|
||||||||||
| Western North America | 222.2 | 239.8 | 224.0 | 228.3 | ||||||
|
|
||||||||||
| Total | 430.2 | 440.8 | 432.1 | 427.5 | ||||||
|
|
||||||||||
| Refinery utilization(1) (%) | ||||||||||
|
|
||||||||||
| Eastern North America | 94 | 91 | 94 | 90 | ||||||
|
|
||||||||||
| Western North America | 93 | 100 | 93 | 95 | ||||||
|
|
||||||||||
| Total | 93 | 95 | 94 | 93 | ||||||
|
|
||||||||||
| Refined product sales (mbbls/d) | ||||||||||
|
|
||||||||||
| Gasoline | 243.8 | 247.4 | 246.2 | 243.4 | ||||||
|
|
||||||||||
| Distillate | 187.0 | 211.6 | 198.0 | 199.7 | ||||||
|
|
||||||||||
| Other | 70.4 | 89.2 | 79.1 | 88.6 | ||||||
|
|
||||||||||
| Total | 501.2 | 548.2 | 523.3 | 531.7 | ||||||
|
|
||||||||||
- (1)
- Refinery utilization is the amount of crude oil and natural gas plant liquids run through crude distillation units, expressed as a percentage of the capacity of these units.
Refinery crude throughput decreased in the fourth quarter of 2015, resulting in an average refinery utilization of 93%, compared to 95% in the prior year quarter. In Eastern North America, the average volume of crude oil processed increased to 208,000 bbls/d in the fourth quarter of 2015 from 201,000 bbls/d in the prior year quarter. The increase was primarily due to an eight-week planned maintenance event at the Sarnia refinery in the prior year quarter, partially offset by a four-week planned maintenance event at the Montreal refinery that was completed at the beginning of the fourth quarter of 2015. The average volumes of crude oil processed in Western North America decreased to 222,200 bbls/d in the fourth quarter of 2015 from 239,800 bbls/d in the prior year quarter, primarily due to planned and unplanned maintenance work at the Edmonton refinery.
Total sales of 501,200 bbls/d in the fourth quarter of 2015 were lower than 548,200 bbls/d in the prior year quarter reflecting softer distillate demand.
Prices and Margins
Refined product margins in Refining and Supply were higher in the fourth quarter of 2015 than in the prior year quarter, and were impacted by the following factors:
- •
- In
the fourth quarter of 2015, the impact of the FIFO inventory valuation used by Suncor, as compared to an estimated LIFO(1) valuation, had a negative impact
to operating earnings of approximately $77 million after-tax. This compares to a negative impact to operating earnings of approximately $372 million after-tax in the prior year quarter,
for a total quarter over quarter positive impact to operating earnings of $295 million.
- •
- Refining
margins were also higher due to strong location differentials and the positive impact of the weaker Canadian dollar, partially offset by the impacts of narrower
inland crude differentials relative to WTI.
- •
- Benchmark
crack spreads were lower in the fourth quarter of 2015 relative to the prior year quarter due to lower distillate cracking margins, offset by higher gasoline
cracking margins.
- •
- Marketing margins in the fourth quarter of 2015 were lower than margins in the prior year quarter, primarily due to softer demand in Western North America, partially offset by higher lubricant margins.
SUNCOR ENERGY INC. 2015 FOURTH QUARTER 19
Expenses and Other Factors
Operating expenses were lower in the fourth quarter of 2015 compared to the prior year quarter, primarily due to lower environmental remediation expense, lower maintenance costs, and the impact of cost reduction initiatives, partially offset by higher share-based compensation expense. DD&A expense increased due to a larger asset base, while transportation expense was relatively unchanged between quarters.
CORPORATE, ENERGY TRADING AND ELIMINATIONS
Financial Highlights
|
Three months ended December 31 |
Twelve months ended December 31 |
||||||||||
| ($ millions) | 2015 | 2014 | 2015 | 2014 | |||||||
|
|
|||||||||||
| Net loss | (626 | ) | (467 | ) | (2 647 | ) | (1 422 | ) | |||
|
|
|||||||||||
| Adjusted for: | |||||||||||
|
|
|||||||||||
| Unrealized foreign exchange loss on U.S. dollar denominated debt | 382 | 302 | 1 930 | 722 | |||||||
|
|
|||||||||||
| Restructuring charges(1) | — | — | 57 | — | |||||||
|
|
|||||||||||
| Impact of income tax rate adjustments on deferred taxes(2) | — | — | (5 | ) | — | ||||||
|
|
|||||||||||
| Operating loss(3) | (244 | ) | (165 | ) | (665 | ) | (700 | ) | |||
|
|
|||||||||||
| Renewable Energy | 13 | 15 | 56 | 78 | |||||||
|
|
|||||||||||
| Energy Trading | (13 | ) | (13 | ) | 36 | 66 | |||||
|
|
|||||||||||
| Corporate | (249 | ) | (222 | ) | (799 | ) | (850 | ) | |||
|
|
|||||||||||
| Eliminations | 5 | 55 | 42 | 6 | |||||||
|
|
|||||||||||
| Cash flow from (used in) operations(3) | (26 | ) | (24 | ) | (287 | ) | (429 | ) | |||
|
|
|||||||||||
- (1)
- Restructuring
charges related to cost reduction initiatives in the Corporate segment.
- (2)
- Adjustment
to the company's deferred income taxes resulting from a 2% increase in the Alberta corporate income tax rate in Q2 2015.
- (3)
- Non-GAAP financial measures. See the Non-GAAP Financial Measures Advisory section of this document.
Renewable Energy
|
Three months ended December 31 |
Twelve months ended December 31 |
||||||||
| 2015 | 2014 | 2015 | 2014 | ||||||
|
|
|||||||||
| Power generation marketed (gigawatt hours) | 124 | 122 | 407 | 411 | |||||
|
|
|||||||||
| Ethanol production (millions of litres) | 111 | 109 | 418 | 412 | |||||
|
|
|||||||||
Renewable Energy had operating earnings of $13 million in the fourth quarter of 2015, which were comparable to the prior year quarter. The fourth quarter of 2015 included the impact of the Cedar Point and Adelaide wind projects, which began production in the year, offset by the disposal of Suncor's Kent Breeze wind project and its interest in the Wintering Hills wind project.
Energy Trading
Energy Trading had an operating loss of $13 million in the quarter, which was comparable to the prior year quarter.
Corporate
Corporate operating loss increased to $249 million for the fourth quarter of 2015, compared with $222 million for the prior year quarter, primarily due to increased share-based compensation expense, partially offset by lower overall spending as a result of cost reduction initiatives. The company capitalized $129 million of its borrowing costs in the fourth quarter of 2015 as part of the cost of major development assets and construction projects in progress, compared to $107 million in the prior year quarter. The increase was driven by the ramp up of construction at Fort Hills and the acquisition of an additional 10% working interest in the project.
- (1)
- LIFO is a Non-GAAP financial measure. See the Non-GAAP Financial Measures Advisory section of this document.
20 SUNCOR ENERGY INC. 2015 FOURTH QUARTER
Eliminations
Eliminations reflect the elimination of profit on crude oil sales from Oil Sands and East Coast Canada to Refining and Supply. Consolidated profits are only realized when the refined products produced from internal purchases of crude feedstock have been sold to third parties. During the fourth quarter of 2015, the company realized $5 million of previously eliminated after-tax intersegment profit, compared to $55 million of profit that was realized in the prior year quarter.
5. CAPITAL INVESTMENT UPDATE
Capital and Exploration Expenditures by Segment
|
Three months ended December 31 |
Twelve months ended December 31 |
|||||||||
| ($ millions) | 2015 | 2014 | 2015 | 2014 | ||||||
|
|
||||||||||
| Oil Sands | 1 267 | 954 | 4 181 | 3 826 | ||||||
|
|
||||||||||
| Exploration and Production | 375 | 449 | 1 459 | 1 819 | ||||||
|
|
||||||||||
| Refining and Marketing | 356 | 379 | 821 | 1 021 | ||||||
|
|
||||||||||
| Corporate, Energy Trading and Eliminations | 32 | 118 | 206 | 295 | ||||||
|
|
||||||||||
| Total capital and exploration expenditures | 2 030 | 1 900 | 6 667 | 6 961 | ||||||
|
|
||||||||||
| Less: capitalized interest on debt | (129 | ) | (107 | ) | (447 | ) | (431 | ) | ||
|
|
||||||||||
| 1 901 | 1 793 | 6 220 | 6 530 | |||||||
|
|
||||||||||
Capital and Exploration Expenditures by Type(1)(2)(3)
| Three months ended December 31, 2015 | Twelve months ended December 31, 2015 | |||||||||||||
| ($ millions) | Sustaining | Growth | Total | Sustaining | Growth | Total | ||||||||
|
|
||||||||||||||
| Oil Sands | 585 | 596 | 1 181 | 1 757 | 2 124 | 3 881 | ||||||||
|
|
||||||||||||||
| Oil Sands Base | 461 | 98 | 559 | 1 056 | 261 | 1 317 | ||||||||
|
|
||||||||||||||
| In Situ | 107 | 3 | 110 | 603 | 19 | 622 | ||||||||
|
|
||||||||||||||
| Oil Sands ventures | 17 | 495 | 512 | 98 | 1 844 | 1 942 | ||||||||
|
|
||||||||||||||
| Exploration and Production | 6 | 332 | 338 | 20 | 1 305 | 1 325 | ||||||||
|
|
||||||||||||||
| Refining and Marketing | 338 | 15 | 353 | 766 | 44 | 810 | ||||||||
|
|
||||||||||||||
| Corporate, Energy Trading and Eliminations | 23 | 6 | 29 | 59 | 145 | 204 | ||||||||
|
|
||||||||||||||
| 952 | 949 | 1 901 | 2 602 | 3 618 | 6 220 | |||||||||
|
|
||||||||||||||
- (1)
- Capital
expenditures in this table exclude capitalized interest on debt.
- (2)
- Growth
capital expenditures include capital investments that result in i) an increase in production levels at existing Oil Sands operations; ii) new facilities or
operations that increase overall production; iii) new infrastructure that is required to support higher production levels; iv) new reserves or a positive change in the company's reserves
profile in E&P operations; or v) margin improvement, by increasing revenues or reducing costs.
- (3)
- Sustaining capital expenditures include capital investments that i) ensure compliance or maintain relations with regulators and other stakeholders; ii) improve efficiency and reliability of operations or maintain productive capacity by replacing component assets at the end of their useful lives; iii) deliver existing proved developed reserves for E&P operations; or iv) maintain current production capacities at existing Oil Sands operations and Refining and Marketing operations.
SUNCOR ENERGY INC. 2015 FOURTH QUARTER 21
In the fourth quarter of 2015, total capital and exploration expenditures were $1.901 billion (excluding capitalized interest). Capital and exploration expenditures in the fourth quarter of 2015 increased compared to the prior year quarter primarily due to higher spend associated with the acquisition of an additional 10% working interest in the Fort Hills project. Activity in the fourth quarter of 2015 included the following:
Oil Sands
Oil Sands Base
Oil Sands Base capital and exploration expenditures were $559 million in the fourth quarter of 2015, of which $461 million and $98 million were directed towards sustaining and growth activities, respectively. Sustaining capital included expenditures related to the planned major maintenance program, including a vacuum unit and one Upgrader 2 coker set that was completed in the fourth quarter of 2015, and purchases of mine haul trucks, in addition to a number of reliability and sustainment projects across the operations. Growth capital was focused on logistical and storage assets which will support market access for Fort Hills' bitumen.
In Situ
In Situ capital and exploration expenditures were $110 million, of which $107 million was directed towards sustaining activities. Sustaining capital included ongoing well pad construction that is expected to maintain existing production levels at Firebag and MacKay River.
Oil Sands Ventures
Oil Sands ventures capital and exploration expenditures were $512 million. Growth capital expenditures of $495 million were incurred primarily for construction activities at the Fort Hills project, with construction more than 50% complete by the end of the fourth quarter. Spending during the quarter continued to be focused on engineering, procurement, module fabrication and site construction. Suncor completed the purchase of an additional 10% working interest in the Fort Hills project from Total E&P for $360 million, which increased the company's working interest in the project to 50.8%. Following closing, Suncor spent an additional $62 million of capital expenditures in 2015 as a result of the increased working interest.
Sustaining capital of $17 million consisted of Suncor's share of capital expenditures for the sustaining Syncrude operations.
Exploration and Production
Growth capital of $332 million was primarily focused on the construction of the Hebron project which continued in the fourth quarter of 2015, with first oil expected in late 2017. Effective January 1, 2016, working interests in the Hebron project have been reset. As a result, Suncor's working interest in the project decreased from 22.7% to 21.0%, with Suncor to be reimbursed for costs incurred to December 31, 2015. In addition, development drilling at Golden Eagle and exploration drilling at the deepwater Shelburne Basin offshore Nova Scotia occurred in the fourth quarter, and will continue during 2016.
Refining and Marketing
Refining and Marketing capital expenditures of $353 million related primarily to maintenance activities at the Edmonton and Montreal refineries to sustain operations, and a pipeline replacement project leading to the Denver refinery.
Corporate, Energy Trading and Eliminations
Corporate capital expenditures were $29 million, and consisted of information technology expenditures and the company's wind projects in Renewable Energy.
22 SUNCOR ENERGY INC. 2015 FOURTH QUARTER
6. FINANCIAL CONDITION AND LIQUIDITY
Indicators
|
Twelve months ended December 31 |
||||||
| 2015 | 2014 | |||||
|
|
||||||
| Return on Capital Employed(1) (%) | ||||||
|
|
||||||
| Excluding major projects in progress | 0.6 | 8.6 | ||||
|
|
||||||
| Including major projects in progress | 0.5 | 7.5 | ||||
|
|
||||||
| Net debt to cash flow from operations(2) (times) | 1.7 | 0.9 | ||||
|
|
||||||
| Interest coverage on long-term debt (times) | ||||||
|
|
||||||
| Earnings basis(3) | (1.8 | ) | 6.6 | |||
|
|
||||||
| Cash flow from operations basis(2)(4) | 9.3 | 15.5 | ||||
|
|
||||||
- (1)
- Non-GAAP
financial measure. ROCE is reconciled in the Non-GAAP Financial Measures Advisory section of this document.
- (2)
- Cash
flow from operations and metrics that use cash flow from operations are non-GAAP financial measures. See the Non-GAAP Financial Measures Advisory section of this document.
- (3)
- Net
earnings plus income taxes and interest expense, divided by the sum of interest expense and capitalized interest on debt.
- (4)
- Cash flow from operations plus current income taxes and interest expense, divided by the sum of interest expense and capitalized interest on debt.
Capital Resources
Suncor's capital resources consist primarily of cash flow provided by operating activities, cash and cash equivalents, and available lines of credit. Management believes the company will have the capital resources to fund its planned 2016 capital spending program of $6.0 to $6.5 billion, the sustaining capital costs and dividend requirements associated with the potential acquisition of COS, detailed below, and the incremental 10% share of the Fort Hills project acquired in 2015, and meet current and future working capital requirements through existing cash balances and short-term investments, cash flow provided by operating activities, available committed credit facilities, issuing commercial paper and/or by the issuance of long-term notes or debentures. The company's cash flow provided by operating activities depends on a number of factors, including commodity prices, production and sales volumes, refining and marketing margins, operating expenses, taxes, royalties and foreign exchange rates. If additional capital is required, Suncor's management believes adequate additional financing will be available in debt capital markets at commercial terms and rates.
The company has invested excess cash in short-term financial instruments that are presented as cash and cash equivalents. The objectives of the company's short-term investment portfolio are to ensure the preservation of capital, maintain adequate liquidity to meet Suncor's cash flow requirements and deliver competitive returns derived from the quality and diversification of investments within acceptable risk parameters. The maximum weighted average term to maturity of the short-term investment portfolio is not expected to exceed six months, and all investments will be with counterparties with investment grade debt ratings.
On October 5, 2015, Suncor made an offer to acquire all of the outstanding common shares of COS for 0.25 of a common share of Suncor for each common share of COS. COS has a 36.74% interest in Syncrude and an estimated 485 million shares outstanding at December 31, 2015. Subsequent to quarter end, Suncor and COS reached an agreement to support Suncor's offer to purchase all of the shares of COS for 0.28 of a Suncor share for each COS share. The offer has the support of the Boards of Directors of both companies, and expires on February 5, 2016. The transaction value of approximately $6.6 billion at the time of the agreement includes COS' estimated debt of $2.4 billion. If more than 51% of COS' common shares are tendered, Suncor plans to take up the tendered shares and pursue a subsequent acquisition transaction to acquire any shares not tendered.
Available Sources of Liquidity
Cash and cash equivalents decreased to $4.049 billion during the twelve months of 2015 from $5.495 billion at December 31, 2014, primarily due to the impact of low crude oil prices. Cash flow from operating activities more than covered sustaining capital, including associated capitalized interest, and dividends. Cash and cash equivalents decreased to $4.049 billion during the fourth quarter of 2015 from $5.409 billion at September 30, 2015, primarily due to capital and exploration expenditures, including capitalized interest, and dividends exceeding cash flow provided by operating activities.
As at December 31, 2015, the weighted average term to maturity of the short-term investment portfolio was approximately 10.5 days.
SUNCOR ENERGY INC. 2015 FOURTH QUARTER 23
Financing Activities
Management of debt levels continues to be a priority for Suncor given the company's long-term growth plans and pricing environment. Suncor believes a phased and flexible approach to existing and future growth projects should assist the company in maintaining its ability to manage project costs and debt levels.
Available lines of credit at December 31, 2015 increased to $7.034 billion, compared to $4.136 billion at December 31, 2014, primarily due to a new US$2.0 billion credit facility added in the first quarter of 2015 that matures in the second quarter of 2019.
Total Debt to Total Debt Plus Shareholders' Equity
Suncor is subject to financial and operating covenants related to its bank debt and public market debt. Failure to meet the terms of one or more of these covenants may constitute an "event of default" as defined in the respective debt agreements, potentially resulting in accelerated repayment of one or more of the debt obligations. The company is in compliance with its financial covenant that requires total debt to not exceed 65% of its total debt plus shareholders' equity. At December 31, 2015, total debt to total debt plus shareholders' equity was 28% (December 31, 2014 – 24%). The company is also currently in compliance with all operating covenants.
| ($ millions, except as noted) |
December 31 2015 |
December 31 2014 |
||||
|
|
||||||
| Short-term debt | 747 | 806 | ||||
|
|
||||||
| Current portion of long-term debt | 70 | 34 | ||||
|
|
||||||
| Long-term debt | 14 486 | 12 489 | ||||
|
|
||||||
| Total debt | 15 303 | 13 329 | ||||
|
|
||||||
| Less: Cash and cash equivalents | 4 049 | 5 495 | ||||
|
|
||||||
| Net debt | 11 254 | 7 834 | ||||
|
|
||||||
| Shareholders' equity | 39 039 | 41 603 | ||||
|
|
||||||
| Total debt plus shareholders' equity | 54 342 | 54 932 | ||||
|
|
||||||
| Total debt to total debt plus shareholders' equity (%) | 28 | 24 | ||||
|
|
||||||
Change in Net Debt
|
Three and twelve months ended December 31, 2015 |
|||||||
| ($ millions) | Q4 | YTD | |||||
|
|
|||||||
| Net debt – start of period | 9 551 | 7 834 | |||||
|
|
|||||||
| Increase in net debt | 1 703 | 3 420 | |||||
|
|
|||||||
| Net debt – December 31, 2015 | 11 254 | 11 254 | |||||
|
|
|||||||
| Decrease (increase) in net debt | |||||||
|
|
|||||||
| Cash flow from operations | 1 294 | 6 806 | |||||
|
|
|||||||
| Capital and exploration expenditures and other investments | (2 037 | ) | (6 685 | ) | |||
|
|
|||||||
| Proceeds from disposal of assets | 6 | 277 | |||||
|
|
|||||||
| Dividends less proceeds from exercise of share options | (400 | ) | (1 553 | ) | |||
|
|
|||||||
| Change in non-cash working capital | 116 | 57 | |||||
|
|
|||||||
| Foreign exchange on cash, debt and other balances | (682 | ) | (2 322 | ) | |||
|
|
|||||||
| (1 703 | ) | (3 420 | ) | ||||
|
|
|||||||
24 SUNCOR ENERGY INC. 2015 FOURTH QUARTER
Common Shares
Outstanding Shares
| (thousands) |
December 31, 2015 |
||
|
|
|||
| Common shares | 1 446 013 | ||
|
|
|||
| Common share options – exercisable | 17 527 | ||
|
|
|||
| Common share options – non-exercisable | 11 563 | ||
|
|
|||
As at January 28, 2016, the total number of common shares outstanding was 1,446,056,251 and the total number of exercisable and non-exercisable common share options outstanding was 28,973,451. Once exercisable, each outstanding common share option is convertible into one common share.
Share Repurchases
The company may repurchase shares pursuant to a normal course issuer bid (NCIB) through the facilities of the Toronto Stock Exchange, New York Stock Exchange and/or alternative trading platforms. Under its current NCIB, the company may purchase for cancellation up to approximately $500 million worth of its common shares beginning August 5, 2015 and ending August 4, 2016.
|
Three months ended December 31 |
Twelve months ended December 31 |
||||||||
| ($ millions, except as noted) | 2015 | 2014 | 2015 | 2014 | |||||
|
|
|||||||||
| Share repurchase activities (thousands of common shares) | 70 | 13 116 | 1 230 | 42 027 | |||||
|
|
|||||||||
| Share repurchase cost | 3 | 493 | 43 | 1 671 | |||||
|
|
|||||||||
| Weighted average repurchase price per share (dollars per share) | 35.50 | 37.63 | 34.93 | 39.67 | |||||
|
|
|||||||||
During the fourth quarter of 2015, the company had repurchased an additional 69,907 common shares at an average price of $35.50 per share, for $3 million. In accordance with applicable securities laws, repurchases under the program were suspended on October 5, 2015, as a result of the offer to the shareholders of COS.
Pursuant to the NCIB, Suncor has agreed that it will not purchase more than 43,375,481 common shares, which is equal to approximately 3% of Suncor's issued and outstanding common shares. Suncor security holders may obtain a copy of the notice, without charge, by contacting the company.
Contractual Obligations, Commitments, Guarantees, and Off-Balance Sheet Arrangements
In the normal course of business, the company is obligated to make future payments, including contractual obligations and non-cancellable commitments. Suncor has included these items in the Financial Condition and Liquidity section of its Management's Discussion and Analysis for the year ended December 31, 2014, dated February 26, 2015 (the 2014 annual MD&A). The company does not believe that it has any guarantees or off-balance sheet arrangements that have, or are reasonably likely to have, a current or future material effect on the company's financial performance or financial condition, results of operations, liquidity or capital expenditures. During the twelve months ended December 31, 2015, the company increased its commitments by approximately $4.9 billion. Approximately $4.6 billion of this relates to the Norlite Diluent Pipeline and Wood Buffalo Pipeline Extension commitments that received recent regulatory approval in support of Fort Hills ($4.1 billion is expected to be due from 2020 onward). These commitments will support the company's market access strategy, and activities to expand its storage and logistics network. The contract terms of these commitments range between three and 25 years, with payments commencing as early as the first quarter of 2016.
SUNCOR ENERGY INC. 2015 FOURTH QUARTER 25
Trends in Suncor's quarterly earnings and cash flow from operations are driven primarily by production volumes, which can be significantly impacted by major maintenance events. Trends in Suncor's quarterly earnings and cash flow from operations are also affected by changes in commodity prices, refining crack spreads and foreign exchange rates.
Financial Summary
|
Three months ended ($ millions, unless otherwise noted) |
Dec 31 2015 |
Sept 30 2015 |
June 30 2015 |
Mar 31 2015 |
Dec 31 2014 |
Sept 30 2014 |
June 30 2014 |
Mar 31 2014 |
|||||||||||
|
|
|||||||||||||||||||
| Total production (mboe/d) | |||||||||||||||||||
|
|
|||||||||||||||||||
| Oil Sands | 470.6 | 458.4 | 448.7 | 475.6 | 419.3 | 441.1 | 403.1 | 424.4 | |||||||||||
|
|
|||||||||||||||||||
| Exploration and Production | 112.3 | 107.7 | 111.2 | 126.8 | 138.3 | 78.2 | 115.3 | 120.9 | |||||||||||
|
|
|||||||||||||||||||
| 582.9 | 566.1 | 559.9 | 602.4 | 557.6 | 519.3 | 518.4 | 545.3 | ||||||||||||
|
|
|||||||||||||||||||
| Revenues and other income | |||||||||||||||||||
|
|
|||||||||||||||||||
| Operating revenues, net of royalties | 6 499 | 7 485 | 8 095 | 7 129 | 8 899 | 10 175 | 10 446 | 10 342 | |||||||||||
|
|
|||||||||||||||||||
| Other income | 94 | 72 | 49 | 257 | 192 | 98 | 203 | 135 | |||||||||||
|
|
|||||||||||||||||||
| 6 593 | 7 557 | 8 144 | 7 386 | 9 091 | 10 273 | 10 649 | 10 477 | ||||||||||||
|
|
|||||||||||||||||||
| Net (loss) earnings | (2 007 | ) | (376 | ) | 729 | (341 | ) | 84 | 919 | 211 | 1 485 | ||||||||
|
|
|||||||||||||||||||
| per common share – basic (dollars) | (1.38 | ) | (0.26 | ) | 0.50 | (0.24 | ) | 0.06 | 0.63 | 0.14 | 1.01 | ||||||||
|
|
|||||||||||||||||||
| per common share – diluted (dollars) | (1.38 | ) | (0.26 | ) | 0.50 | (0.24 | ) | 0.06 | 0.62 | 0.14 | 1.01 | ||||||||
|
|
|||||||||||||||||||
| Operating (loss) earnings(1) | (26 | ) | 410 | 906 | 175 | 386 | 1 306 | 1 135 | 1 793 | ||||||||||
|
|
|||||||||||||||||||
| per common share – basic(1) (dollars) | (0.02 | ) | 0.28 | 0.63 | 0.12 | 0.27 | 0.89 | 0.77 | 1.22 | ||||||||||
|
|
|||||||||||||||||||
| Cash flow from operations(1) | 1 294 | 1 882 | 2 155 | 1 475 | 1 492 | 2 280 | 2 406 | 2 880 | |||||||||||
|
|
|||||||||||||||||||
| per common share – basic(1) (dollars) | 0.90 | 1.30 | 1.49 | 1.02 | 1.03 | 1.56 | 1.64 | 1.96 | |||||||||||
|
|
|||||||||||||||||||
| ROCE(1) (%) for the twelve months ended | 0.6 | 5.1 | 7.2 | 5.8 | 8.6 | 9.4 | 10.1 | 12.6 | |||||||||||
|
|
|||||||||||||||||||
| Common share information (dollars) | |||||||||||||||||||
|
|
|||||||||||||||||||
| Dividend per common share | 0.29 | 0.29 | 0.28 | 0.28 | 0.28 | 0.28 | 0.23 | 0.23 | |||||||||||
|
|
|||||||||||||||||||
| Share price at the end of trading | |||||||||||||||||||
|
|
|||||||||||||||||||
| Toronto Stock Exchange (Cdn$) | 35.72 | 35.69 | 34.40 | 37.01 | 36.90 | 40.53 | 45.50 | 38.61 | |||||||||||
|
|
|||||||||||||||||||
| New York Stock Exchange (US$) | 25.80 | 26.72 | 27.52 | 29.25 | 31.78 | 36.15 | 42.63 | 34.96 | |||||||||||
|
|
|||||||||||||||||||
- (1)
- Non-GAAP financial measures. See the Non-GAAP Financial Measures Advisory section of this document. ROCE excludes capitalized costs related to major projects in progress.
26 SUNCOR ENERGY INC. 2015 FOURTH QUARTER
Business Environment
|
Three months ended (average for the period ended, except as noted) |
Dec 31 2015 |
Sept 30 2015 |
June 30 2015 |
Mar 31 2015 |
Dec 31 2014 |
Sept 30 2014 |
June 30 2014 |
Mar 31 2014 |
|||||||||||
|
|
|||||||||||||||||||
| WTI crude oil at Cushing | US$/bbl | 42.15 | 46.45 | 57.95 | 48.65 | 73.15 | 97.20 | 103.00 | 98.70 | ||||||||||
|
|
|||||||||||||||||||
| ICE Brent crude oil at Sullom Voe | US$/bbl | 44.70 | 51.20 | 63.50 | 55.15 | 77.00 | 103.40 | 109.75 | 107.80 | ||||||||||
|
|
|||||||||||||||||||
| Dated Brent/Maya FOB price differential | US$/bbl | 10.35 | 8.50 | 8.15 | 11.05 | 10.05 | 12.50 | 13.85 | 18.45 | ||||||||||
|
|
|||||||||||||||||||
| MSW at Edmonton | Cdn$/bbl | 53.55 | 52.35 | 68.05 | 52.25 | 75.95 | 97.45 | 105.90 | 100.10 | ||||||||||
|
|
|||||||||||||||||||
| WCS at Hardisty | US$/bbl | 27.70 | 33.25 | 46.35 | 33.90 | 58.90 | 77.00 | 82.95 | 75.55 | ||||||||||
|
|
|||||||||||||||||||
| Light/heavy crude oil differential for WTI at Cushing less WCS at Hardisty | US$/bbl | 14.50 | 13.20 | 11.60 | 14.75 | 14.25 | 20.20 | 20.05 | 23.15 | ||||||||||
|
|
|||||||||||||||||||
| Condensate at Edmonton | US$/bbl | 41.65 | 44.20 | 57.95 | 45.60 | 70.55 | 93.45 | 105.15 | 102.65 | ||||||||||
|
|
|||||||||||||||||||
| Natural gas (Alberta spot) at AECO | Cdn$/mcf | 2.45 | 2.90 | 2.55 | 2.75 | 3.60 | 4.00 | 4.65 | 5.70 | ||||||||||
|
|
|||||||||||||||||||
| Alberta Power Pool Price | Cdn$/MWh | 21.20 | 26.05 | 57.25 | 29.15 | 30.55 | 63.90 | 42.30 | 61.75 | ||||||||||
|
|
|||||||||||||||||||
| New York Harbor 3-2-1 crack(1) | US$/bbl | 13.60 | 22.25 | 23.85 | 19.20 | 16.15 | 20.50 | 21.55 | 20.40 | ||||||||||
|
|
|||||||||||||||||||
| Chicago 3-2-1 crack(1) | US$/bbl | 13.90 | 23.95 | 20.30 | 16.00 | 14.40 | 17.50 | 19.40 | 18.35 | ||||||||||
|
|
|||||||||||||||||||
| Portland 3-2-1 crack(1) | US$/bbl | 17.90 | 28.75 | 32.55 | 21.50 | 12.45 | 24.60 | 26.10 | 17.40 | ||||||||||
|
|
|||||||||||||||||||
| Gulf Coast 3-2-1 crack(1) | US$/bbl | 11.05 | 21.55 | 22.90 | 18.00 | 10.15 | 19.10 | 19.55 | 17.15 | ||||||||||
|
|
|||||||||||||||||||
| Exchange rate | US$/Cdn$ | 0.75 | 0.76 | 0.81 | 0.81 | 0.88 | 0.92 | 0.92 | 0.91 | ||||||||||
|
|
|||||||||||||||||||
| Exchange rate (end of period) | US$/Cdn$ | 0.72 | 0.75 | 0.80 | 0.79 | 0.86 | 0.89 | 0.94 | 0.90 | ||||||||||
|
|
|||||||||||||||||||
- (1)
- 3-2-1 crack spreads are indicators of the refining margin generated by converting three barrels of WTI into two barrels of gasoline and one barrel of diesel. The crack spreads presented here generally approximate the regions into which the company sells refined products through retail and wholesale channels.
8. OTHER ITEMS
Accounting Policies
Suncor's significant accounting policies and a summary of recently announced accounting standards are described in the Accounting Policies and Critical Accounting Estimates section of Suncor's 2014 annual MD&A.
Critical Accounting Estimates
The preparation of financial statements in accordance with GAAP requires management to make estimates, judgments and assumptions that affect reported assets, liabilities, revenues and expenses, gains and losses, and disclosures of contingencies. These estimates and assumptions are subject to change based on experience and new information. Critical accounting estimates are those that require management to make assumptions about matters that are highly uncertain at the time the estimate is made. Critical accounting estimates are also those estimates which, where a different estimate could have been used or where changes in the estimate that are reasonably likely to occur, would have a material impact on the company's financial condition, changes in financial condition or financial performance. Critical accounting estimates and judgments are reviewed annually by the Audit Committee of the Board of Directors. A detailed description of Suncor's critical accounting estimates is provided in note 4 to the audited Consolidated Financial Statements for the year ended December 31, 2014 and in the Accounting Policies and Critical Accounting Estimates section of Suncor's 2014 annual MD&A.
Financial Instruments
Suncor periodically enters into derivative contracts such as forwards, futures, swaps, options and costless collars to manage exposure to fluctuations in commodity prices and foreign exchange rates, and to optimize the company's position with respect to interest payments. The company also uses physical and financial energy derivatives to earn trading profits. For more information on Suncor's financial instruments and the related financial risk factors, see note 27 of the audited Consolidated Financial Statements for the year ended December 31, 2014, note 11 to the unaudited interim Consolidated
SUNCOR ENERGY INC. 2015 FOURTH QUARTER 27
Financial Statements for the three and twelve months ended December 31, 2015, and the Financial Condition and Liquidity section of Suncor's 2014 annual MD&A.
Income Taxes
In the second quarter of 2015, the Government of Alberta enacted an increase in the corporate income tax rate from 10% to 12% effective July 1, 2015. As a result, the company revalued its deferred income tax balances, resulting in a deferred income tax expense of $423 million.
In the first quarter of 2015, the U.K. government enacted a decrease in the supplementary charge rate on oil and gas profits in the North Sea that reduced the statutory tax rate on Suncor's earnings in the U.K. from 62% to 50%. The company revalued its deferred income tax balances, resulting in a decrease to deferred income taxes of $406 million.
Pursuant to the previously disclosed 2013 proposal letter from the Canada Revenue Agency (CRA), the company received a Notice of Reassessment (NOR) from the CRA during the second quarter of 2014, regarding the income tax treatment of realized losses in 2007 on the settlement of certain derivative contracts. The total amount of the NOR, including tax, penalty and interest, was approximately $920 million. The company strongly disagrees with the CRA's position and continues to firmly believe it will be able to successfully defend its original filing position and will take the appropriate actions to resolve this matter. In addition to the above, the company has:
- •
- Received
NORs related to the derivative contracts from the Provinces of Alberta, Ontario and Quebec for approximately $124 million, $100 million and
$42 million, respectively;
- •
- Provided
security to the CRA and the Provinces of Quebec and Ontario for approximately $642 million;
- •
- Filed
Notices of Objection with the CRA and the Provinces of Alberta, Ontario and Quebec; and
- •
- Filed a Notice of Appeal with the Tax Court of Canada in November 2014 and is now pursuing its Appeal to that Court.
If the company is unsuccessful in defending its tax filing position, it could be subject to an earnings and cash impact of up to $1.2 billion.
9. NON-GAAP FINANCIAL MEASURES ADVISORY
Certain financial measures in this document – namely operating (loss) earnings, ROCE, cash flow from operations, free cash flow, Oil Sands cash operating costs, and LIFO – are not prescribed by GAAP. These non-GAAP financial measures are included because management uses the information to analyze business performance, leverage and liquidity. These non-GAAP financial measures do not have any standardized meaning and, therefore, are unlikely to be comparable to similar measures presented by other companies. Therefore, these non-GAAP financial measures should not be considered in isolation or as a substitute for measures of performance prepared in accordance with GAAP. Except as otherwise indicated, these non-GAAP measures are calculated and disclosed on a consistent basis from period to period. Specific adjusting items may only be relevant in certain periods.
Operating Earnings
Operating earnings is a non-GAAP financial measure that adjusts net earnings for significant items that are not indicative of operating performance. Management uses operating earnings to evaluate operating performance because management believes it provides better comparability between periods. Operating earnings are reconciled to net earnings in the Consolidated Financial Information and Segment Results and Analysis sections of this document.
Bridge Analyses of Operating Earnings
Throughout this document, the company presents charts that illustrate the change in operating earnings from the comparative period through key variance factors. These factors are analyzed in the Operating Earnings narratives following the bridge analyses in particular sections of this document. These bridge analyses are presented because management uses this presentation to evaluate performance.
- •
- The
factor for Volumes and Mix is calculated based on production volumes and mix for the Oil Sands and E&P segments and throughput volumes and mix for the Refining and
Marketing segment.
- •
- The factor for Price, Margin and Other Revenue includes upstream price realizations before royalties, refining and marketing margins, other operating revenues, and the net impacts of sales and purchases of third-party crude, including product purchased for use as diluent in the company's Oil Sands operations and subsequently sold as part of diluted bitumen.
28 SUNCOR ENERGY INC. 2015 FOURTH QUARTER
- •
- The
factor for Royalties includes royalties in Libya that represent the difference between gross revenue, which is based on the company's working-interest share of
production, and the net revenue attributable to Suncor under the terms of the respective contracts.
- •
- The
factor for Inventory reflects the opportunity cost of building production volumes in inventory or the additional margin earned by drawing down inventory produced in
previous periods. The calculation of the Inventory factor in a bridge analysis permits the company to present the factor for Volumes and Mix based on production volumes, rather than based on
sales volumes.
- •
- The
factor for Operating and Transportation Expense includes project start-up costs, OS&G expense (adjusted for impacts of changes in inventory), and transportation expense.
- •
- The factor for Financing Expense and Other Income includes financing expenses, other income, operational foreign exchange gains and losses, changes in gains and losses on disposal of assets that are not operating earnings adjustments, changes in statutory income tax rates that are not operating earnings adjustments, and other income tax adjustments.
Return on Capital Employed (ROCE)
ROCE is a non-GAAP financial measure that management uses to analyze operating performance and the efficiency of Suncor's capital allocation process. Average capital employed is calculated as a twelve-month average of the capital employed balance at the beginning of the twelve-month period and the month-end capital employed balances throughout the remainder of the twelve-month period. Figures for capital employed at the beginning and end of the twelve-month period are presented to show the changes in the components of the calculation over the twelve-month period.
The company presents two ROCE calculations – one including and one excluding the impacts on capital employed of major projects in progress. Major projects in progress includes accumulated capital expenditures and capitalized interest for significant projects still under construction or in the process of being commissioned, and acquired assets that are still being evaluated. Management uses ROCE excluding the impacts of major projects in progress on capital employed to assess performance of operating assets.
|
For the twelve months ended December 31 ($ millions, except as noted) |
2015 | 2014 | |||||||
|
|
|||||||||
| Adjustments to net earnings | |||||||||
|
|
|||||||||
| Net earnings | (1 995 | ) | 2 699 | ||||||
|
|
|||||||||
| Add after-tax amounts for: | |||||||||
|
|
|||||||||
| Unrealized foreign exchange loss on U.S. dollar denominated debt | 1 930 | 722 | |||||||
|
|
|||||||||
| Net interest expense | 312 | 229 | |||||||
|
|
|||||||||
| A | 247 | 3 650 | |||||||
|
|
|||||||||
| Capital employed – beginning of twelve-month period | |||||||||
|
|
|||||||||
| Net debt | 7 834 | 6 256 | |||||||
|
|
|||||||||
| Shareholders' equity | 41 603 | 41 180 | |||||||
|
|
|||||||||
| 49 437 | 47 436 | ||||||||
|
|
|||||||||
| Capital employed – end of twelve-month period | |||||||||
|
|
|||||||||
| Net debt | 11 254 | 7 834 | |||||||
|
|
|||||||||
| Shareholders' equity | 39 039 | 41 603 | |||||||
|
|
|||||||||
| 50 293 | 49 437 | ||||||||
|
|
|||||||||
| Average capital employed | B | 50 565 | 48 797 | ||||||
|
|
|||||||||
| ROCE – including major projects in progress (%) | A/B | 0.5 | 7.5 | ||||||
|
|
|||||||||
| Average capitalized costs related to major projects in progress | C | 7 195 | 6 203 | ||||||
|
|
|||||||||
| ROCE – excluding major projects in progress (%) | A/(B-C) | 0.6 | 8.6 | ||||||
|
|
|||||||||
Cash Flow from Operations
Cash flow from operations is a non-GAAP financial measure that adjusts a GAAP measure – cash flow provided by operating activities – for changes in non-cash working capital, which management uses to analyze operating performance
SUNCOR ENERGY INC. 2015 FOURTH QUARTER 29
and liquidity. Changes to non-cash working capital can include, among other factors, the timing of offshore feedstock purchases and payments for fuel and income taxes, and the timing of cash flows related to accounts receivable and accounts payable, which reduces comparability between periods.
Cash flow from operations in this document for the twelve-month ended periods are the sum of the cash flow from operations for the particular quarter ended December 31 and each of the three preceding quarters. Cash flow from operations for each quarter are separately defined and reconciled to GAAP measures in the Non-GAAP Financial Measures Advisory section of each respective Management's Discussion and Analysis for the applicable quarter, and this document for the fourth quarter of 2015.
| Three months ended December 31 | Oil Sands |
Exploration and Production |
Refining and Marketing |
Corporate, Energy Trading and Eliminations |
Total | ||||||||||||||||||
| ($ millions) | 2015 | 2014 | 2015 | 2014 | 2015 | 2014 | 2015 | 2014 | 2015 | 2014 | |||||||||||||
|
|
|||||||||||||||||||||||
| Net (loss) earnings | (616 | ) | 180 | (1 263 | ) | 198 | 498 | 173 | (626 | ) | (467 | ) | (2 007 | ) | 84 | ||||||||
|
|
|||||||||||||||||||||||
| Adjustments for: | |||||||||||||||||||||||
|
|
|||||||||||||||||||||||
| Depreciation, depletion, amortization and impairment | 1 260 | 709 | 2 063 | 297 | 174 | 162 | 32 | 32 | 3 529 | 1 200 | |||||||||||||
|
|
|||||||||||||||||||||||
| Deferred income taxes | (174 | ) | 84 | (579 | ) | (83 | ) | (36 | ) | (10 | ) | 54 | 60 | (735 | ) | 51 | |||||||
|
|
|||||||||||||||||||||||
| Accretion of liabilities | 38 | 34 | 13 | 11 | 2 | 2 | (2 | ) | — | 51 | 47 | ||||||||||||
|
|
|||||||||||||||||||||||
| Unrealized foreign exchange loss on U.S. dollar denominated debt | — | — | — | — | — | — | 386 | 352 | 386 | 352 | |||||||||||||
|
|
|||||||||||||||||||||||
| Change in fair value of derivative contracts | (14 | ) | (32 | ) | — | (2 | ) | (32 | ) | (68 | ) | 56 | (54 | ) | 10 | (156 | ) | ||||||
|
|
|||||||||||||||||||||||
| (Gain) loss on disposal of assets | — | — | — | — | (4 | ) | (10 | ) | (1 | ) | — | (5 | ) | (10 | ) | ||||||||
|
|
|||||||||||||||||||||||
| Share-based compensation | 21 | (5 | ) | 3 | (1 | ) | 11 | (2 | ) | 35 | (4 | ) | 70 | (12 | ) | ||||||||
|
|
|||||||||||||||||||||||
| Exploration expenses | — | — | 41 | 8 | — | — | — | — | 41 | 8 | |||||||||||||
|
|
|||||||||||||||||||||||
| Settlement of decommissioning and restoration liabilities | (37 | ) | (70 | ) | (3 | ) | (3 | ) | (7 | ) | (10 | ) | — | — | (47 | ) | (83 | ) | |||||
|
|
|||||||||||||||||||||||
| Other | (11 | ) | (25 | ) | (18 | ) | (24 | ) | (10 | ) | 3 | 40 | 57 | 1 | 11 | ||||||||
|
|
|||||||||||||||||||||||
| Cash flow from (used in) operations | 467 | 875 | 257 | 401 | 596 | 240 | (26 | ) | (24 | ) | 1 294 | 1 492 | |||||||||||
|
|
|||||||||||||||||||||||
| (Increase) decrease in non-cash working capital | (2 | ) | 1 542 | 45 | 137 | 436 | 317 | (330 | ) | (1 473 | ) | 149 | 523 | ||||||||||
|
|
|||||||||||||||||||||||
| Cash flow provided by operating activities | 465 | 2 417 | 302 | 538 | 1 032 | 557 | (356 | ) | (1 497 | ) | 1 443 | 2 015 | |||||||||||
|
|
|||||||||||||||||||||||
30 SUNCOR ENERGY INC. 2015 FOURTH QUARTER
| Twelve months ended December 31 | Oil Sands |
Exploration and Production |
Refining and Marketing |
Corporate, Energy Trading and Eliminations |
Total | ||||||||||||||||||
| ($ millions) | 2015 | 2014 | 2015 | 2014 | 2015 | 2014 | 2015 | 2014 | 2015 | 2014 | |||||||||||||
|
|
|||||||||||||||||||||||
| Net (loss) earnings | (856 | ) | 1 776 | (758 | ) | 653 | 2 266 | 1 692 | (2 647 | ) | (1 422 | ) | (1 995 | ) | 2 699 | ||||||||
|
|
|||||||||||||||||||||||
| Adjustments for: | |||||||||||||||||||||||
|
|
|||||||||||||||||||||||
| Depreciation, depletion, amortization and impairment | 3 583 | 4 035 | 3 106 | 1 349 | 676 | 635 | 135 | 121 | 7 500 | 6 140 | |||||||||||||
|
|
|||||||||||||||||||||||
| Deferred income taxes | 172 | (139 | ) | (1 235 | ) | (115 | ) | (21 | ) | (43 | ) | 160 | 73 | (924 | ) | (224 | ) | ||||||
|
|
|||||||||||||||||||||||
| Accretion of liabilities | 144 | 140 | 50 | 44 | 7 | 7 | (4 | ) | 7 | 197 | 198 | ||||||||||||
|
|
|||||||||||||||||||||||
| Unrealized foreign exchange loss on U.S. dollar denominated debt | — | — | — | — | — | — | 1 967 | 839 | 1 967 | 839 | |||||||||||||
|
|
|||||||||||||||||||||||
| Change in fair value of derivative contracts | 20 | (34 | ) | — | — | 60 | (82 | ) | 50 | (154 | ) | 130 | (270 | ) | |||||||||
|
|
|||||||||||||||||||||||
| Loss (gain) on disposal of assets | 8 | 3 | (5 | ) | (82 | ) | (109 | ) | (11 | ) | (4 | ) | — | (110 | ) | (90 | ) | ||||||
|
|
|||||||||||||||||||||||
| Share-based compensation | 13 | 22 | 9 | 8 | 2 | 4 | (6 | ) | 72 | 18 | 106 | ||||||||||||
|
|
|||||||||||||||||||||||
| Exploration expenses | — | — | 255 | 104 | — | — | — | — | 255 | 104 | |||||||||||||
|
|
|||||||||||||||||||||||
| Settlement of decommissioning and restoration liabilities | (277 | ) | (324 | ) | (5 | ) | (20 | ) | (20 | ) | (20 | ) | — | — | (302 | ) | (364 | ) | |||||
|
|
|||||||||||||||||||||||
| Other | 28 | (79 | ) | (31 | ) | (32 | ) | 11 | (4 | ) | 62 | 35 | 70 | (80 | ) | ||||||||
|
|
|||||||||||||||||||||||
| Cash flow from (used in) operations | 2 835 | 5 400 | 1 386 | 1 909 | 2 872 | 2 178 | (287 | ) | (429 | ) | 6 806 | 9 058 | |||||||||||
|
|
|||||||||||||||||||||||
| (Increase) decrease in non-cash working capital | (27 | ) | 1 252 | 322 | 201 | 521 | (278 | ) | (738 | ) | (1 297 | ) | 78 | (122 | ) | ||||||||
|
|
|||||||||||||||||||||||
| Cash flow provided by (used in) operating activities | 2 808 | 6 652 | 1 708 | 2 110 | 3 393 | 1 900 | (1 025 | ) | (1 726 | ) | 6 884 | 8 936 | |||||||||||
|
|
|||||||||||||||||||||||
Free Cash Flow
Free cash flow is a non-GAAP financial measure that is calculated by deducting capital and exploration expenditures for the twelve-month period from cash flow from operations for the same period. Free cash flow reflects cash available for distribution to shareholders and to fund financing activities. Management uses free cash flow to measure financial performance and liquidity.
|
Twelve months ended December 31 |
|||||
| ($ millions) | 2015 | 2014 | |||
|
|
|||||
| Cash flow from operations | 6 806 | 9 058 | |||
|
|
|||||
| Less: Capital and exploration expenditures | 6 667 | 6 961 | |||
|
|
|||||
| Free Cash Flow | 139 | 2 097 | |||
|
|
|||||
Cash Operating Costs
Oil Sands cash operating costs and cash operating costs per barrel are non-GAAP financial measures, which are calculated by adjusting Oil Sands segment OS&G expense (a GAAP measure based on sales volumes) for i) costs pertaining to Syncrude operations; ii) non-production costs that management believes do not relate to the production performance of Oil Sands operations, including, but not limited to, share-based compensation adjustments, research, and the expense recorded as part of a non-monetary arrangement involving a third-party processor; iii) revenues associated with excess capacity, including excess power generated and sold that is recorded in operating revenue; iv) project start-up costs; and v) the impacts of changes in inventory levels, such that the company is able to present cost information based on production volumes. Oil Sands cash operating costs are reconciled in the Segment Results and Analysis – Oil Sands section of this document. Management uses cash operating costs to measure Oil Sands operating performance on a production barrel basis.
SUNCOR ENERGY INC. 2015 FOURTH QUARTER 31
Impact of First-in, First-out (FIFO) Inventory Valuation on Refining and Marketing Net Earnings
GAAP requires the use of a FIFO inventory valuation methodology. For Suncor, this results in a disconnect between the sales prices for refined products, which reflect current market conditions, and the amount recorded as the cost of sale for the related refinery feedstock, which reflects market conditions at the time when the feedstock was purchased. This lag between purchase and sale can be anywhere from several weeks to several months, and is influenced by the time to receive crude after purchase (which can be several weeks for foreign offshore crude purchases), regional crude inventory levels, the completion of refining processes, transportation time to distribution channels, and regional refined product inventory levels.
Suncor prepares and presents an estimate of the impact of using a FIFO inventory valuation methodology compared to a LIFO methodology, because management uses the information to analyze operating performance and compare itself against refining peers that are permitted to use LIFO inventory valuation under United States GAAP (U.S. GAAP).
The company's estimate is not derived from a standardized calculation and, therefore, may not be directly comparable to similar measures presented by other companies, and should not be considered in isolation or as a substitute for measures of performance prepared in accordance with GAAP or U.S. GAAP.
10. COMMON ABBREVIATIONS
The following is a list of abbreviations that may be used in this document:
| Measurement | ||
| bbl | barrel | |
| bbls/d | barrels per day | |
| mbbls/d | thousands of barrels per day | |
| boe | barrels of oil equivalent | |
| boe/d | barrels of oil equivalent per day | |
| mboe | thousands of barrels of oil equivalent | |
| mboe/d | thousands of barrels of oil equivalent per day | |
| GJ | gigajoule | |
| mcf | thousands of cubic feet of natural gas | |
| mcfe | thousands of cubic feet of natural gas equivalent | |
| mmcf | millions of cubic feet of natural gas | |
| mmcf/d | millions of cubic feet of natural gas per day | |
| mmcfe | millions of cubic feet of natural gas equivalent | |
| mmcfe/d | millions of cubic feet of natural gas equivalent per day | |
| MW | megawatts | |
| MWh | megawatts per hour | |
Places and Currencies |
||
| U.S. | United States | |
| U.K. | United Kingdom | |
| $ or Cdn$ | Canadian dollars | |
| US$ | United States dollars | |
Financial and Business Environment |
||
| Q2 | Three months ended June 30 | |
| Q4 | Three months ended December 31 | |
| DD&A | Depreciation, depletion and amortization | |
| WTI | West Texas Intermediate | |
| WCS | Western Canadian Select | |
| SCO | Synthetic crude oil | |
| MSW | Mixed Sweet Blend | |
| NYMEX | New York Mercantile Exchange | |
| YTD | Year to date | |
| ICE | Intercontinental Exchange | |
32 SUNCOR ENERGY INC. 2015 FOURTH QUARTER
11. FORWARD-LOOKING INFORMATION
The document contains certain forward-looking information and forward – looking statements (collectively referred to herein as "forward-looking statements") within the meaning of applicable Canadian and U.S. securities laws. Forward-looking statements and other information are based on Suncor's current expectations, estimates, projections and assumptions that were made by the company in light of information available at the time the statement was made and consider Suncor's experience and its perception of historical trends, including expectations and assumptions concerning: the accuracy of reserves and resources estimates; commodity prices and interest and foreign exchange rates; capital efficiencies and cost-savings; applicable royalty rates and tax laws; future production rates; the sufficiency of budgeted capital expenditures in carrying out planned activities; the availability and cost of labour and services; and the receipt, in a timely manner, of regulatory and third-party approvals. In addition, all other statements and other information that address expectations or projections about the future, and other statements and information about Suncor's strategy for growth, expected and future expenditures or investment decisions, commodity prices, costs, schedules, production volumes, operating and financial results, future financing and capital activities, and the expected impact of future commitments are forward-looking statements. Some of the forward-looking statements and information may be identified by words like "expects", "anticipates", "will", "estimates", "plans", "scheduled", "intends", "believes", "projects", "indicates", "could", "focus", "vision", "goal", "outlook", "proposed", "target", "objective", "continue", "should", "may", "future" and similar expressions. Forward-looking statements in the document include references to:
- •
- Suncor's belief it is well positioned to weather the current low crude oil price environment;
- •
- Suncor's commitment to add shareholder value and invest in long-term profitable growth in its core asset areas, while maintaining strong
financial position;
- •
- Suncor's belief that working with the operator it can drive real improvements in Syncrude's performance with a larger ownership interest,
creating
value for its shareholders;
- •
- The reversal of Enbridge's Line 9 is expected to provide Suncor with the flexibility to supply the Montreal refinery with a full slate of
inland-priced crude;
- •
- The expectation that the climate plan will provide certainty on the GHG costs for Suncor while limiting oil sands emissions will force
companies to
ensure only the most profitable and efficient projects are developed;
- •
- Suncor's growth projects, including: (i) statements around the Fort Hills project, which is expected to deliver approximately
91,000 bbls/d of bitumen to Suncor following the closing of the acquisition of an additional 10% working interest in Fort Hills, with first oil expected in the fourth quarter of 2017 and 90% of
capacity planned to be reached within twelve months thereafter, and (ii) statements around Hebron first oil expected in late 2017;
- •
- Exploration drilling at the deepwater Shelburne Basin offshore Nova Scotia will continue during 2016;
- •
- The company's estimated International tax rates and market assumptions for oil prices;
- •
- Suncor's belief that existing production levels at Firebag and MacKay River will be maintained due to ongoing well pad
construction;
- •
- The belief that Suncor will have the capital resources to fund its planned 2016 capital spending program of $6.0 to $6.5 billion, the
sustaining capital costs and dividend requirements associated with the potential acquisition of COS and the incremental 10% share of the Fort Hills project acquired in 2015, and meet current and
future working capital requirements through existing cash balances and short-term investments, cash flow provided by operating activities, available committed credit facilities, issuing commercial
paper and/or by the issuance of long-term notes or debentures and, if additional capital is required, the belief that adequate additional financing will be available in debt capital markets at
commercial terms and rates;
- •
- Suncor's capital spending reduction is not anticipated to impact the company's near term production targets;
- •
- Suncor's intentions to pursue a subsequent acquisition transaction to acquire any COS shares not tendered if more than 51% of
COS' common shares are tendered to Suncor's offer;
- •
- Planned maintenance schedules at Suncor's upgrader and Terra Nova;
- •
- Suncor's belief that a phased and flexible approach to existing and future growth projects should assist Suncor in its ability to manage project costs and debt levels;
SUNCOR ENERGY INC. 2015 FOURTH QUARTER 33
- •
- The company's belief that it does not have any guarantees or off-balance sheet arrangements that have, or are reasonably likely to have, a current or
future material effect on the company's financial performance or financial condition, results of operations, liquidity or capital expenditures; and
- •
- The company's position in respect of the NOR received from the CRA (and consequentially from the Provinces of Alberta, Ontario and Quebec) regarding the income tax treatment of realized losses in 2007 on the settlement of certain derivative contracts continues to be that it will be able to successfully defend its original filing position and it will take the appropriate actions to resolve this matter. The company has provided security to the CRA and the Provinces in the approximate amount of $642 million, but the company may be required to post cash instead of security in relation to the NORs.
Forward-looking statements and information are not guarantees of future performance and involve a number of risks and uncertainties, some that are similar to other oil and gas companies and some that are unique to Suncor. Suncor's actual results may differ materially from those expressed or implied by its forward-looking statements, so readers are cautioned not to place undue reliance on them. The financial and operating performance of the company's reportable operating segments, specifically Oil Sands, E&P, and Refining and Marketing, may be affected by a number of factors.
Factors that affect our Oil Sands segment include, but are not limited to, volatility in the prices for crude oil and other production, and the related impacts of fluctuating light/heavy and sweet/sour crude oil differentials; changes in the demand for refinery feedstock and diesel fuel, including the possibility that refiners that process our proprietary production will be closed, experience equipment failure or other accidents; our ability to operate our Oil Sands facilities reliably in order to meet production targets; the output of newly commissioned facilities, the performance of which may be difficult to predict during initial operations; the possibility that completed maintenance activities may not improve operational performance or the output of related facilities; our dependence on pipeline capacity and other logistical constraints, which may affect our ability to distribute our products to market; our ability to finance Oil Sands growth and sustaining capital expenditures; the availability of bitumen feedstock for upgrading operations, which can be negatively affected by poor ore grade quality, unplanned mine equipment and extraction plant maintenance, tailings storage, and in situ reservoir and equipment performance, or the unavailability of third-party bitumen; inflationary pressures on operating costs, including labour, natural gas and other energy sources used in oil sands processes; our ability to complete projects, including planned maintenance events, both on time and on budget, which could be impacted by competition from other projects (including other oil sands projects) for goods and services and demands on infrastructure in Alberta's Wood Buffalo region and the surrounding area (including housing, roads and schools); risks and uncertainties associated with obtaining regulatory and stakeholder approval for exploration and development activities; changes to royalty and tax legislation and related agreements that could impact our business; the potential for disruptions to operations and construction projects as a result of our relationships with labour unions that represent employees at our facilities; and changes to environmental regulations or legislation.
Factors that affect our E&P segment include, but are not limited to, volatility in crude oil and natural gas prices; operational risks and uncertainties associated with oil and gas activities, including unexpected formations or pressures, premature declines of reservoirs, fires, blow-outs, equipment failures and other accidents, uncontrollable flows of crude oil, natural gas or well fluids, and pollution and other environmental risks; the possibility that completed maintenance activities may not improve operational performance or the output of related facilities; adverse weather conditions, which could disrupt output from producing assets or impact drilling programs, resulting in increased costs and/or delays in bringing on new production; political, economic and socio-economic risks associated with Suncor's foreign operations, including the unpredictability of operating in Libya due to ongoing political unrest and that operations in Syria continue to be impacted by sanctions and political unrest; risks and uncertainties associated with obtaining regulatory and stakeholder approval for exploration and development activities; the potential for disruptions to operations and construction projects as a result of our relationships with labour unions that represent employees at our facilities; and market demand for mineral rights and producing properties, potentially leading to losses on disposition or increased property acquisition costs.
Factors that affect our Refining and Marketing segment include, but are not limited to, fluctuations in demand and supply for refined products that impact the company's margins; market competition, including potential new market entrants; our ability to reliably operate refining and marketing facilities in order to meet production or sales targets; the possibility that completed maintenance activities may not improve operational performance or the output of related facilities; risks and uncertainties affecting construction or planned maintenance schedules, including the availability of labour and other impacts of competing projects drawing on the same resources during the same time period; and the potential for disruptions to operations and construction projects as a result of our relationships with labour unions or employee associations that represent employees at our refineries and distribution facilities.
34 SUNCOR ENERGY INC. 2015 FOURTH QUARTER
Additional risks, uncertainties and other factors that could influence the financial and operating performance of all of Suncor's operating segments and activities include, but are not limited to, changes in general economic, market and business conditions, such as commodity prices, interest rates and currency exchange rates; fluctuations in supply and demand for Suncor's products; the successful and timely implementation of capital projects, including growth projects and regulatory projects; competitive actions of other companies, including increased competition from other oil and gas companies or from companies that provide alternative sources of energy; labour and material shortages; actions by government authorities, including the imposition or reassessment of taxes or changes to fees and royalties, such as the NORs received by Suncor from the CRA, Ontario, Alberta and Quebec, relating to the settlement of certain derivative contracts, including the risk that: (i) Suncor may not be able to successfully defend its original filing position and ultimately be required to pay increased taxes, interest and penalty as a result; or (ii) Suncor may be required to post cash instead of security in relation to the NORs; changes in environmental and other regulations; the ability and willingness of parties with whom we have material relationships to perform their obligations to us; outages to third-party infrastructure that could cause disruptions to production; the occurrence of unexpected events such as fires, equipment failures and other similar events affecting Suncor or other parties whose operations or assets directly or indirectly affect Suncor; the potential for security breaches of Suncor's information systems by computer hackers or cyberterrorists, and the unavailability or failure of such systems to perform as anticipated as a result of such breaches; our ability to find new oil and gas reserves that can be developed economically; the accuracy of Suncor's reserves, resources and future production estimates; market instability affecting Suncor's ability to borrow in the capital debt markets at acceptable rates; maintaining an optimal debt to cash flow ratio; the success of the company's risk management activities using derivatives and other financial instruments; the cost of compliance with current and future environmental laws; risks and uncertainties associated with closing a transaction for the purchase or sale of an oil and gas property, including estimates of the final consideration to be paid or received, the ability of counterparties to comply with their obligations in a timely manner and the receipt of any required regulatory or other third-party approvals outside of Suncor's control that are customary to transactions of this nature; and the accuracy of cost estimates, some of which are provided at the conceptual or other preliminary stage of projects and prior to commencement or conception of the detailed engineering that is needed to reduce the margin of error and increase the level of accuracy. The foregoing important factors are not exhaustive.
Many of these risk factors and other assumptions related to Suncor's forward-looking statements and information are discussed in further detail throughout this document, and in the company's 2014 annual MD&A, 2014 AIF and Form 40-F on file with Canadian securities commissions at www.sedar.com and the United States Securities and Exchange Commission at www.sec.gov. Readers are also referred to the risk factors and assumptions described in other documents that Suncor files from time to time with securities regulatory authorities. Copies of these documents are available without charge from the company.
SUNCOR ENERGY INC. 2015 FOURTH QUARTER 35
CONSOLIDATED STATEMENTS OF COMPREHENSIVE (LOSS) INCOME
(unaudited)
|
Three months ended December 31 |
Twelve months ended December 31 |
||||||||||
| ($ millions) | 2015 | 2014 | 2015 | 2014 | |||||||
|
|
|||||||||||
| Revenues and Other Income | |||||||||||
|
|
|||||||||||
| Operating revenues, net of royalties (note 3) | 6 499 | 8 899 | 29 208 | 39 862 | |||||||
|
|
|||||||||||
| Other income (note 4) | 94 | 192 | 472 | 628 | |||||||
|
|
|||||||||||
| 6 593 | 9 091 | 29 680 | 40 490 | ||||||||
|
|
|||||||||||
Expenses |
|||||||||||
|
|
|||||||||||
| Purchases of crude oil and products | 2 673 | 4 459 | 11 590 | 17 528 | |||||||
|
|
|||||||||||
| Operating, selling and general | 2 223 | 2 293 | 8 607 | 9 541 | |||||||
|
|
|||||||||||
| Transportation | 278 | 279 | 1 085 | 985 | |||||||
|
|
|||||||||||
| Depreciation, depletion, amortization and impairment | 3 529 | 1 200 | 7 500 | 6 140 | |||||||
|
|
|||||||||||
| Exploration | 67 | 53 | 478 | 367 | |||||||
|
|
|||||||||||
| Gain on disposal of assets (notes 15 and 16) | (5 | ) | (10 | ) | (110 | ) | (90 | ) | |||
|
|
|||||||||||
| Financing expenses (note 8) | 496 | 545 | 2 557 | 1 429 | |||||||
|
|
|||||||||||
| 9 261 | 8 819 | 31 707 | 35 900 | ||||||||
|
|
|||||||||||
| (Loss) Earnings before Income Taxes | (2 668 | ) | 272 | (2 027 | ) | 4 590 | |||||
|
|
|||||||||||
Income Taxes (note 9) |
|||||||||||
|
|
|||||||||||
| Current | 74 | 137 | 892 | 2 115 | |||||||
|
|
|||||||||||
| Deferred | (735 | ) | 51 | (924 | ) | (224 | ) | ||||
|
|
|||||||||||
| (661 | ) | 188 | (32 | ) | 1 891 | ||||||
|
|
|||||||||||
| Net (Loss) Earnings | (2 007 | ) | 84 | (1 995 | ) | 2 699 | |||||
|
|
|||||||||||
Other Comprehensive Income |
|||||||||||
|
|
|||||||||||
| Items reclassified to earnings | |||||||||||
|
|
|||||||||||
| Realized gain on disposal of assets available for sale, net of income taxes of $13 (note 15) | — | — | (85 | ) | — | ||||||
|
|
|||||||||||
| Items that may be subsequently reclassified to earnings | |||||||||||
|
|
|||||||||||
| Foreign currency translation adjustment | 131 | 97 | 846 | 304 | |||||||
|
|
|||||||||||
| Unrealized gain on disposal of assets available for sale, net of income taxes of $13 (note 15) | — | — | — | 85 | |||||||
|
|
|||||||||||
| Items that will not be reclassified to earnings | |||||||||||
|
|
|||||||||||
| Actuarial gain (loss) on employee retirement benefit plans, net of income taxes of $75 | 157 | 78 | 212 | (144 | ) | ||||||
|
|
|||||||||||
| Other Comprehensive Income | 288 | 175 | 973 | 245 | |||||||
|
|
|||||||||||
Total Comprehensive (Loss) Income |
(1 719 |
) |
259 |
(1 022 |
) |
2 944 |
|||||
|
|
|||||||||||
Per Common Share (dollars) (note 10) |
|||||||||||
|
|
|||||||||||
| Net (loss) earnings – basic | (1.38 | ) | 0.06 | (1.38 | ) | 1.84 | |||||
|
|
|||||||||||
| Net (loss) earnings – diluted | (1.38 | ) | 0.06 | (1.38 | ) | 1.84 | |||||
|
|
|||||||||||
| Cash dividends | 0.29 | 0.28 | 1.14 | 1.02 | |||||||
|
|
|||||||||||
See accompanying notes to the interim consolidated financial statements.
36 SUNCOR ENERGY INC. 2015 FOURTH QUARTER
CONSOLIDATED BALANCE SHEETS
(unaudited)
| ($ millions) |
December 31 2015 |
December 31 2014 |
|||||
|
|
|||||||
| Assets | |||||||
|
|
|||||||
| Current assets | |||||||
|
|
|||||||
| Cash and cash equivalents | 4 049 | 5 495 | |||||
|
|
|||||||
| Accounts receivable | 2 751 | 4 275 | |||||
|
|
|||||||
| Inventories | 3 090 | 3 466 | |||||
|
|
|||||||
| Income taxes receivable | 538 | 680 | |||||
|
|
|||||||
| Total current assets | 10 428 | 13 916 | |||||
|
|
|||||||
| Property, plant and equipment, net | 61 151 | 59 800 | |||||
|
|
|||||||
| Exploration and evaluation | 1 681 | 2 248 | |||||
|
|
|||||||
| Other assets | 1 153 | 598 | |||||
|
|
|||||||
| Goodwill and other intangible assets | 3 079 | 3 083 | |||||
|
|
|||||||
| Deferred income taxes | 35 | 26 | |||||
|
|
|||||||
| Total assets | 77 527 | 79 671 | |||||
|
|
|||||||
Liabilities and Shareholders' Equity |
|||||||
|
|
|||||||
| Current liabilities | |||||||
|
|
|||||||
| Short-term debt | 747 | 806 | |||||
|
|
|||||||
| Current portion of long-term debt | 70 | 34 | |||||
|
|
|||||||
| Accounts payable and accrued liabilities | 5 306 | 5 704 | |||||
|
|
|||||||
| Current portion of provisions | 769 | 752 | |||||
|
|
|||||||
| Income taxes payable | 244 | 1 058 | |||||
|
|
|||||||
| Total current liabilities | 7 136 | 8 354 | |||||
|
|
|||||||
| Long-term debt | 14 486 | 12 489 | |||||
|
|
|||||||
| Other long-term liabilities | 1 573 | 1 787 | |||||
|
|
|||||||
| Provisions | 5 339 | 4 895 | |||||
|
|
|||||||
| Deferred income taxes | 9 954 | 10 543 | |||||
|
|
|||||||
| Shareholders' equity | 39 039 | 41 603 | |||||
|
|
|||||||
| Total liabilities and shareholders' equity | 77 527 | 79 671 | |||||
|
|
|||||||
See accompanying notes to the interim consolidated financial statements.
SUNCOR ENERGY INC. 2015 FOURTH QUARTER 37
CONSOLIDATED STATEMENTS OF CASH FLOWS
(unaudited)
|
Three months ended December 31 |
Twelve months ended December 31 |
||||||||||
| ($ millions) | 2015 | 2014 | 2015 | 2014 | |||||||
|
|
|||||||||||
| Operating Activities | |||||||||||
|
|
|||||||||||
| Net (loss) earnings | (2 007 | ) | 84 | (1 995 | ) | 2 699 | |||||
|
|
|||||||||||
| Adjustments for: | |||||||||||
|
|
|||||||||||
| Depreciation, depletion, amortization and impairment | 3 529 | 1 200 | 7 500 | 6 140 | |||||||
|
|
|||||||||||
| Deferred income taxes | (735 | ) | 51 | (924 | ) | (224 | ) | ||||
|
|
|||||||||||
| Accretion | 51 | 47 | 197 | 198 | |||||||
|
|
|||||||||||
| Unrealized foreign exchange loss on U.S. dollar denominated debt | 386 | 352 | 1 967 | 839 | |||||||
|
|
|||||||||||
| Change in fair value of derivative contracts | 10 | (156 | ) | 130 | (270 | ) | |||||
|
|
|||||||||||
| Gain on disposal of assets | (5 | ) | (10 | ) | (110 | ) | (90 | ) | |||
|
|
|||||||||||
| Share-based compensation | 70 | (12 | ) | 18 | 106 | ||||||
|
|
|||||||||||
| Exploration | 41 | 8 | 255 | 104 | |||||||
|
|
|||||||||||
| Settlement of decommissioning and restoration liabilities | (47 | ) | (83 | ) | (302 | ) | (364 | ) | |||
|
|
|||||||||||
| Other | 1 | 11 | 70 | (80 | ) | ||||||
|
|
|||||||||||
| Decrease (increase) in non-cash working capital | 149 | 523 | 78 | (122 | ) | ||||||
|
|
|||||||||||
| Cash flow provided by operating activities | 1 443 | 2 015 | 6 884 | 8 936 | |||||||
|
|
|||||||||||
| Investing Activities | |||||||||||
|
|
|||||||||||
| Capital and exploration expenditures | (2 030 | ) | (1 900 | ) | (6 667 | ) | (6 961 | ) | |||
|
|
|||||||||||
| Acquisitions (notes 13 and 14) | (360 | ) | — | (360 | ) | (121 | ) | ||||
|
|
|||||||||||
| Proceeds from disposal of assets | 6 | 14 | 277 | 224 | |||||||
|
|
|||||||||||
| Other investments | (7 | ) | (16 | ) | (18 | ) | (64 | ) | |||
|
|
|||||||||||
| (Increase) decrease in non-cash working capital | (26 | ) | (150 | ) | (3 | ) | 59 | ||||
|
|
|||||||||||
| Cash flow used in investing activities | (2 417 | ) | (2 052 | ) | (6 771 | ) | (6 863 | ) | |||
|
|
|||||||||||
| Financing Activities | |||||||||||
|
|
|||||||||||
| Net change in debt | (41 | ) | (67 | ) | (258 | ) | (81 | ) | |||
|
|
|||||||||||
| Repayment of long-term debt | — | (452 | ) | — | (452 | ) | |||||
|
|
|||||||||||
| Issuance of long-term debt | — | 1 575 | — | 1 575 | |||||||
|
|
|||||||||||
| Issuance of common shares under share option plans | 19 | 10 | 95 | 247 | |||||||
|
|
|||||||||||
| Purchase of common shares for cancellation (note 7) | (3 | ) | (493 | ) | (43 | ) | (1 671 | ) | |||
|
|
|||||||||||
| Dividends paid on common shares | (419 | ) | (405 | ) | (1 648 | ) | (1 490 | ) | |||
|
|
|||||||||||
| Cash flow used in financing activities | (444 | ) | 168 | (1 854 | ) | (1 872 | ) | ||||
|
|
|||||||||||
(Decrease) Increase in Cash and Cash Equivalents |
(1 418 |
) |
131 |
(1 741 |
) |
201 |
|||||
|
|
|||||||||||
| Effect of foreign exchange on cash and cash equivalents | 58 | 13 | 295 | 92 | |||||||
|
|
|||||||||||
| Cash and cash equivalents at beginning of period | 5 409 | 5 351 | 5 495 | 5 202 | |||||||
|
|
|||||||||||
| Cash and Cash Equivalents at End of Period | 4 049 | 5 495 | 4 049 | 5 495 | |||||||
|
|
|||||||||||
Supplementary Cash Flow Information |
|||||||||||
|
|
|||||||||||
| Interest paid | 374 | 313 | 881 | 752 | |||||||
|
|
|||||||||||
| Income taxes paid | 112 | 425 | 1 424 | 2 697 | |||||||
|
|
|||||||||||
See accompanying notes to the interim consolidated financial statements.
38 SUNCOR ENERGY INC. 2015 FOURTH QUARTER
CONSOLIDATED STATEMENTS OF CHANGES IN SHAREHOLDERS' EQUITY
(unaudited)
| ($ millions) |
Share Capital |
Contributed Surplus |
Accumulated Other Comprehensive Income |
Retained Earnings |
Total |
Number of Common Shares (thousands) |
|||||||
|
|
|
||||||||||||
| At December 31, 2013 | 19 395 | 598 | 115 | 21 072 | 41 180 | 1 478 315 | |||||||
|
|
|
||||||||||||
| Net earnings | — | — | — | 2 699 | 2 699 | — | |||||||
|
|
|
||||||||||||
| Foreign currency translation adjustment | — | — | 304 | — | 304 | — | |||||||
|
|
|
||||||||||||
| Unrealized gain on assets available for sale, net of income taxes of $13 | — | — | 85 | — | 85 | — | |||||||
|
|
|
||||||||||||
| Actuarial loss on employee retirement benefit plans, net of income taxes of $56 | — | — | — | (144 | ) | (144 | ) | — | |||||
|
|
|
||||||||||||
| Total comprehensive income | — | — | 389 | 2 555 | 2 944 | — | |||||||
|
|
|
||||||||||||
| Issued under share option plans | 323 | (31 | ) | — | — | 292 | 7 831 | ||||||
|
|
|
||||||||||||
| Issued under dividend reinvestment plan | 38 | — | — | (38 | ) | — | — | ||||||
|
|
|
||||||||||||
| Purchase of common shares for cancellation | (553 | ) | — | — | (1 118 | ) | (1 671 | ) | (42 027 | ) | |||
|
|
|
||||||||||||
| Change in liability for share purchase commitment | 108 | — | — | 198 | 306 | — | |||||||
|
|
|
||||||||||||
| Share-based compensation | — | 42 | — | — | 42 | — | |||||||
|
|
|
||||||||||||
| Dividends paid on common shares | — | — | — | (1 490 | ) | (1 490 | ) | — | |||||
|
|
|
||||||||||||
| At December 31, 2014 | 19 311 | 609 | 504 | 21 179 | 41 603 | 1 444 119 | |||||||
|
|
|
||||||||||||
| Net loss | — | — | — | (1 995 | ) | (1 995 | ) | — | |||||
|
|
|
||||||||||||
| Foreign currency translation adjustment | — | — | 846 | — | 846 | — | |||||||
|
|
|
||||||||||||
| Realized gain on disposal of assets available for sale, net of income taxes of $13 (note 15) | — | — | (85 | ) | — | (85 | ) | — | |||||
|
|
|
||||||||||||
| Actuarial gain on employee retirement benefit plans, net of income taxes of $75 | — | — | — | 212 | 212 | — | |||||||
|
|
|
||||||||||||
| Total comprehensive income (loss) | — | — | 761 | (1 783 | ) | (1 022 | ) | — | |||||
|
|
|
||||||||||||
| Issued under share option plans | 125 | (20 | ) | — | — | 105 | 3 124 | ||||||
|
|
|
||||||||||||
| Issued under dividend reinvestment plan | 47 | — | — | (47 | ) | — | — | ||||||
|
|
|
||||||||||||
| Purchase of common shares for cancellation (note 7) | (17 | ) | — | — | (26 | ) | (43 | ) | (1 230 | ) | |||
|
|
|
||||||||||||
| Share-based compensation | — | 44 | — | — | 44 | — | |||||||
|
|
|
||||||||||||
| Dividends paid on common shares | — | — | — | (1 648 | ) | (1 648 | ) | — | |||||
|
|
|
||||||||||||
| At December 31, 2015 | 19 466 | 633 | 1 265 | 17 675 | 39 039 | 1 446 013 | |||||||
|
|
|
||||||||||||
See accompanying notes to the interim consolidated financial statements.
SUNCOR ENERGY INC. 2015 FOURTH QUARTER 39
NOTES TO THE CONSOLIDATED FINANCIAL STATEMENTS
(unaudited)
1. REPORTING ENTITY AND DESCRIPTION OF THE BUSINESS
Suncor Energy Inc. (Suncor or the company) is an integrated energy company headquartered in Canada. Suncor's operations include oil sands development and upgrading, onshore and offshore oil and gas production, petroleum refining, and product marketing primarily under the Petro-Canada brand. The consolidated financial statements of the company comprise the company and its subsidiaries and the company's interests in associates and joint arrangements.
The address of the company's registered office is 150 – 6th Avenue S.W., Calgary, Alberta, Canada, T2P 3E3.
(a) Statement of Compliance
These condensed interim consolidated financial statements have been prepared in accordance with International Financial Reporting Standards (IFRS), specifically International Accounting Standard (IAS) 34 Interim Financial Reporting as issued by the International Accounting Standards Board. They are condensed as they do not include all of the information required for full annual financial statements, and they should be read in conjunction with the consolidated financial statements for the year ended December 31, 2014.
The policies applied in these condensed interim consolidated financial statements are based on IFRS issued and outstanding as at December 31, 2014.
Comparative figures have been reclassified to conform to the current year financial statement presentation for certain gas purchases consumed in the secondary upgrading process in the Oil Sands segment, which are now classified as Purchases rather than Operating, Selling and General, and shipping-related charges in the Refining and Marketing segment, which are now classified as Transportation rather than Operating, Selling and General.
(b) Basis of Measurement
The consolidated financial statements are prepared on a historical cost basis except as detailed in the accounting policies disclosed in the company's consolidated financial statements for the year ended December 31, 2014.
(c) Functional Currency and Presentation Currency
These consolidated financial statements are presented in Canadian dollars, which is the company's functional currency.
(d) Use of Estimates and Judgment
The timely preparation of financial statements requires that management make estimates and assumptions and use judgment. Accordingly, actual results may differ from estimated amounts as future confirming events occur. Significant estimates and judgment used in the preparation of the financial statements are described in the company's consolidated financial statements for the year ended December 31, 2014.
(e) Income taxes
The company recognizes the impacts of income tax rate changes in earnings in the period the rate change is substantively enacted.
40 SUNCOR ENERGY INC. 2015 FOURTH QUARTER
The company's operating segments are reported based on the nature of their products and services and management responsibility.
Intersegment sales of crude oil and natural gas are accounted for at market values and are included, for segmented reporting, in revenues of the segment making the transfer and expenses of the segment receiving the transfer. Intersegment amounts are eliminated on consolidation.
| Three months ended December 31 | Oil Sands |
Exploration and Production |
Refining and Marketing |
Corporate, Energy Trading and Eliminations |
Total | |||||||||||||||||
| ($ millions) | 2015 | 2014 | 2015 | 2014 | 2015 | 2014 | 2015 | 2014 | 2015 | 2014 | ||||||||||||
|
|
||||||||||||||||||||||
| Revenues and Other Income | ||||||||||||||||||||||
|
|
||||||||||||||||||||||
| Gross revenues | 1 575 | 2 154 | 505 | 1 020 | 4 429 | 6 017 | 33 | 18 | 6 542 | 9 209 | ||||||||||||
|
|
||||||||||||||||||||||
| Intersegment revenues | 442 | 684 | — | 58 | 13 | 39 | (455 | ) | (781 | ) | — | — | ||||||||||
|
|
||||||||||||||||||||||
| Less: Royalties | (10 | ) | (107 | ) | (33 | ) | (203 | ) | — | — | — | — | (43 | ) | (310 | ) | ||||||
|
|
||||||||||||||||||||||
| Operating revenues, net of royalties | 2 007 | 2 731 | 472 | 875 | 4 442 | 6 056 | (422 | ) | (763 | ) | 6 499 | 8 899 | ||||||||||
|
|
||||||||||||||||||||||
| Other income | 68 | 74 | 14 | 33 | 43 | 97 | (31 | ) | (12 | ) | 94 | 192 | ||||||||||
|
|
||||||||||||||||||||||
| 2 075 | 2 805 | 486 | 908 | 4 485 | 6 153 | (453 | ) | (775 | ) | 6 593 | 9 091 | |||||||||||
|
|
||||||||||||||||||||||
| Expenses | ||||||||||||||||||||||
|
|
||||||||||||||||||||||
| Purchases of crude oil and products | 136 | 170 | — | 56 | 2 989 | 5 085 | (452 | ) | (852 | ) | 2 673 | 4 459 | ||||||||||
|
|
||||||||||||||||||||||
| Operating, selling and general | 1 317 | 1 451 | 126 | 126 | 565 | 586 | 215 | 130 | 2 223 | 2 293 | ||||||||||||
|
|
||||||||||||||||||||||
| Transportation | 170 | 162 | 22 | 24 | 100 | 104 | (14 | ) | (11 | ) | 278 | 279 | ||||||||||
|
|
||||||||||||||||||||||
| Depreciation, depletion, amortization and impairment | 1 260 | 709 | 2 063 | 297 | 174 | 162 | 32 | 32 | 3 529 | 1 200 | ||||||||||||
|
|
||||||||||||||||||||||
| Exploration | 8 | 14 | 59 | 39 | — | — | — | — | 67 | 53 | ||||||||||||
|
|
||||||||||||||||||||||
| Gain on disposal of assets | — | — | — | — | (4 | ) | (10 | ) | (1 | ) | — | (5 | ) | (10 | ) | |||||||
|
|
||||||||||||||||||||||
| Financing expenses (income) | 36 | 40 | 22 | 28 | (1 | ) | (2 | ) | 439 | 479 | 496 | 545 | ||||||||||
|
|
||||||||||||||||||||||
| 2 927 | 2 546 | 2 292 | 570 | 3 823 | 5 925 | 219 | (222 | ) | 9 261 | 8 819 | ||||||||||||
|
|
||||||||||||||||||||||
| (Loss) Earnings before Income Taxes | (852 | ) | 259 | (1 806 | ) | 338 | 662 | 228 | (672 | ) | (553 | ) | (2 668 | ) | 272 | |||||||
|
|
||||||||||||||||||||||
| Income Taxes | ||||||||||||||||||||||
|
|
||||||||||||||||||||||
| Current | (62 | ) | (5 | ) | 36 | 223 | 200 | 65 | (100 | ) | (146 | ) | 74 | 137 | ||||||||
|
|
||||||||||||||||||||||
| Deferred | (174 | ) | 84 | (579 | ) | (83 | ) | (36 | ) | (10 | ) | 54 | 60 | (735 | ) | 51 | ||||||
|
|
||||||||||||||||||||||
| (236 | ) | 79 | (543 | ) | 140 | 164 | 55 | (46 | ) | (86 | ) | (661 | ) | 188 | ||||||||
|
|
||||||||||||||||||||||
| Net (Loss) Earnings | (616 | ) | 180 | (1 263 | ) | 198 | 498 | 173 | (626 | ) | (467 | ) | (2 007 | ) | 84 | |||||||
|
|
||||||||||||||||||||||
| Capital and Exploration Expenditures | 1 267 | 954 | 375 | 449 | 356 | 379 | 32 | 118 | 2 030 | 1 900 | ||||||||||||
|
|
||||||||||||||||||||||
SUNCOR ENERGY INC. 2015 FOURTH QUARTER 41
| Twelve months ended December 31 | Oil Sands |
Exploration and Production |
Refining and Marketing |
Corporate, Energy Trading and Eliminations |
Total | |||||||||||||||||
| ($ millions) | 2015 | 2014 | 2015 | 2014 | 2015 | 2014 | 2015 | 2014 | 2015 | 2014 | ||||||||||||
|
|
||||||||||||||||||||||
| Revenues and Other Income | ||||||||||||||||||||||
|
|
||||||||||||||||||||||
| Gross revenues | 7 174 | 10 658 | 2 524 | 4 290 | 19 783 | 26 482 | 108 | 86 | 29 589 | 41 516 | ||||||||||||
|
|
||||||||||||||||||||||
| Intersegment revenues | 2 158 | 3 903 | 88 | 425 | 43 | 145 | (2 289 | ) | (4 473 | ) | — | — | ||||||||||
|
|
||||||||||||||||||||||
| Less: Royalties | (114 | ) | (982 | ) | (267 | ) | (672 | ) | — | — | — | — | (381 | ) | (1 654 | ) | ||||||
|
|
||||||||||||||||||||||
| Operating revenues, net of royalties | 9 218 | 13 579 | 2 345 | 4 043 | 19 826 | 26 627 | (2 181 | ) | (4 387 | ) | 29 208 | 39 862 | ||||||||||
|
|
||||||||||||||||||||||
| Other income | 146 | 115 | 150 | 217 | 58 | 151 | 118 | 145 | 472 | 628 | ||||||||||||
|
|
||||||||||||||||||||||
| 9 364 | 13 694 | 2 495 | 4 260 | 19 884 | 26 778 | (2 063 | ) | (4 242 | ) | 29 680 | 40 490 | |||||||||||
|
|
||||||||||||||||||||||
| Expenses | ||||||||||||||||||||||
|
|
||||||||||||||||||||||
| Purchases of crude oil and products | 319 | 457 | 3 | 459 | 13 588 | 21 093 | (2 320 | ) | (4 481 | ) | 11 590 | 17 528 | ||||||||||
|
|
||||||||||||||||||||||
| Operating, selling and general | 5 220 | 5 940 | 502 | 558 | 2 182 | 2 341 | 703 | 702 | 8 607 | 9 541 | ||||||||||||
|
|
||||||||||||||||||||||
| Transportation | 645 | 541 | 98 | 90 | 387 | 396 | (45 | ) | (42 | ) | 1 085 | 985 | ||||||||||
|
|
||||||||||||||||||||||
| Depreciation, depletion, amortization and impairment | 3 583 | 4 035 | 3 106 | 1 349 | 676 | 635 | 135 | 121 | 7 500 | 6 140 | ||||||||||||
|
|
||||||||||||||||||||||
| Exploration | 120 | 96 | 358 | 271 | — | — | — | — | 478 | 367 | ||||||||||||
|
|
||||||||||||||||||||||
| (Gain) loss on disposal of assets | 8 | 3 | (5 | ) | (82 | ) | (109 | ) | (11 | ) | (4 | ) | — | (110 | ) | (90 | ) | |||||
|
|
||||||||||||||||||||||
| Financing expenses (income) | 150 | 153 | 82 | 72 | (14 | ) | — | 2 339 | 1 204 | 2 557 | 1 429 | |||||||||||
|
|
||||||||||||||||||||||
| 10 045 | 11 225 | 4 144 | 2 717 | 16 710 | 24 454 | 808 | (2 496 | ) | 31 707 | 35 900 | ||||||||||||
|
|
||||||||||||||||||||||
| (Loss) Earnings before Income Taxes | (681 | ) | 2 469 | (1 649 | ) | 1 543 | 3 174 | 2 324 | (2 871 | ) | (1 746 | ) | (2 027 | ) | 4 590 | |||||||
|
|
||||||||||||||||||||||
| Income Taxes | ||||||||||||||||||||||
|
|
||||||||||||||||||||||
| Current | 3 | 832 | 344 | 1 005 | 929 | 675 | (384 | ) | (397 | ) | 892 | 2 115 | ||||||||||
|
|
||||||||||||||||||||||
| Deferred | 172 | (139 | ) | (1 235 | ) | (115 | ) | (21 | ) | (43 | ) | 160 | 73 | (924 | ) | (224 | ) | |||||
|
|
||||||||||||||||||||||
| 175 | 693 | (891 | ) | 890 | 908 | 632 | (224 | ) | (324 | ) | (32 | ) | 1 891 | |||||||||
|
|
||||||||||||||||||||||
| Net (Loss) Earnings | (856 | ) | 1 776 | (758 | ) | 653 | 2 266 | 1 692 | (2 647 | ) | (1 422 | ) | (1 995 | ) | 2 699 | |||||||
|
|
||||||||||||||||||||||
| Capital and Exploration Expenditures | 4 181 | 3 826 | 1 459 | 1 819 | 821 | 1 021 | 206 | 295 | 6 667 | 6 961 | ||||||||||||
|
|
||||||||||||||||||||||
42 SUNCOR ENERGY INC. 2015 FOURTH QUARTER
Other income consists of the following:
|
Three months ended December 31 |
Twelve months ended December 31 |
||||||||||
| ($ millions) | 2015 | 2014 | 2015 | 2014 | |||||||
|
|
|||||||||||
| Energy trading activities | |||||||||||
|
|
|||||||||||
| Change in fair value of contracts | 22 | 69 | 28 | 173 | |||||||
|
|
|||||||||||
| (Losses) gains on inventory valuation | (27 | ) | (87 | ) | 43 | (61 | ) | ||||
|
|
|||||||||||
| Risk management activities(1) | 41 | 143 | 93 | 176 | |||||||
|
|
|||||||||||
| Reserves redetermination(2) | — | — | — | 145 | |||||||
|
|
|||||||||||
| Investment and interest income | 11 | 12 | 62 | 90 | |||||||
|
|
|||||||||||
| Renewable energy grants | 5 | 9 | 30 | 34 | |||||||
|
|
|||||||||||
| Risk mitigation and insurance proceeds(3) | — | 21 | 121 | 21 | |||||||
|
|
|||||||||||
| Change in value of transportation commitments and other | 42 | 25 | 95 | 50 | |||||||
|
|
|||||||||||
| 94 | 192 | 472 | 628 | ||||||||
|
|
|||||||||||
- (1)
- Includes
fair value changes related to short-term derivative contracts in the Oil Sands and Refining and Marketing segments and long-term forward starting interest rate swaps in the
Corporate segment.
- (2)
- Other
income of $145 million ($32 million after-tax) in 2014 is for the reserves redetermination of 1.2 million barrels of oil receivable related to an interest
in a Norwegian asset that Suncor previously owned.
- (3)
- Includes insurance proceeds on assets in the Exploration and Production segment.
Oil Sands
Joslyn Mining Project
As a result of the decline in crude oil prices and uncertainty in the timing of development plans, the company reassessed the remaining carrying value of its interest in the Joslyn mining project for impairment as at December 31, 2015. As a result, the company recognized an after-tax impairment charge of $290 million against the Exploration and Evaluation assets. The remaining carrying value of the company's share of the Joslyn mining project at December 31, 2015 was $nil.
In the second quarter of 2014, as a result of the company's assessment of expected future net cash flows and the uncertainty of the project, including the timing of the development plans, the company recognized an after-tax impairment charge of $718 million against Property, Plant and Equipment ($318 million) and Exploration and Evaluation assets ($400 million).
Other
During the fourth quarter of 2015, the company recorded an after-tax impairment charge of $96 million in the Oil Sands segment following a review of certain assets, including engineering costs related to In Situ expansion, that no longer fit with Suncor's growth strategies and are not expected to be repurposed or otherwise deployed.
In the second quarter of 2014, the company recorded an after-tax impairment charge of $223 million in the Oil Sands segment following a review of certain assets that no longer fit with Suncor's previously revised growth strategies and which could not be repurposed or otherwise deployed. Such assets included a pipeline and related compressor, as well as steam generator components.
Exploration and Production
Libya
As a result of shut-in production due to the continued closure of certain Libyan export terminals, escalating political unrest, asset damages confirmed during the quarter, and the increasing uncertainty with respect to the company's return to normal operations in the country, the company impaired the remaining carrying value of its Libyan Property, Plant and Equipment, and Exploration and Evaluation assets, resulting in a $415 million after-tax impairment.
SUNCOR ENERGY INC. 2015 FOURTH QUARTER 43
During the second quarter of 2014, as a result of ongoing political unrest and intermittent production, the company recognized an after-tax impairment charge of $297 million related to its Libyan assets, charged against Property, Plant and Equipment ($129 million) and Exploration and Evaluation assets ($168 million).
Other
As a result of the decline in the crude oil price environment, the company performed impairment tests on its assets in the Exploration and Production segment as at December 31, 2015. The tests were performed using a fair value less cost of disposal methodology. An expected cash flow approach was used based on 2015 year-end reserves data with the following assumptions:
- •
- Brent
price forecasts of US$46.60/bbl in 2016, US$56.20/bbl in 2017, and US$63.80/bbl in 2018 (all expressed in today's dollars), escalating at 2% per year thereafter
and adjusted for asset-specific location and quality differentials; and
- •
- Risk-adjusted discount rate of 9.0% on after-tax cash flows.
As a result of the impairment tests, the company recorded after-tax impairments of $359 million on the company's share of the White Rose assets, $331 million on the company's share of the Golden Eagle assets, and $54 million on the company's share of the Terra Nova assets. At December 31, 2015, the remaining carrying values of the White Rose, Golden Eagle, and Terra Nova assets were $520 million, $1.0 billion, and $910 million, respectively.
During the fourth quarter of 2015, the company recognized an after-tax impairment charge of $54 million related to certain East Coast Canada exploration and evaluation assets as a result of future development uncertainty.
The following table summarizes the share-based compensation expense (recovery) recorded for all plans within Operating, Selling and General expense.
|
Three months ended December 31 |
Twelve months ended December 31 |
||||||||
| ($ millions) | 2015 | 2014 | 2015 | 2014 | |||||
|
|
|||||||||
| Equity-settled plans | 8 | 8 | 44 | 42 | |||||
|
|
|||||||||
| Cash-settled plans | 69 | (19 | ) | 254 | 266 | ||||
|
|
|||||||||
| 77 | (11 | ) | 298 | 308 | |||||
|
|
|||||||||
The company may repurchase shares pursuant to a normal course issuer bid (NCIB) through the facilities of the Toronto Stock Exchange, New York Stock Exchange and/or alternative trading platforms. Under its current NCIB, the company may purchase for cancellation up to approximately $500 million worth of its common shares beginning August 5, 2015 and ending August 4, 2016. In accordance with applicable securities laws, repurchases under the program were suspended on October 5, 2015, as a result of the offer to the Canadian Oil Sands Limited (COS) shareholders (note 20).
The following table summarizes the share repurchase activities during the period:
|
Three months ended December 31 |
Twelve months ended December 31 |
|||||||||
| ($ millions, except as noted) | 2015 | 2014 | 2015 | 2014 | ||||||
|
|
||||||||||
| Share repurchase activities (thousands of common shares) | ||||||||||
| Shares repurchased | 70 | 13 116 | 1 230 | 42 027 | ||||||
|
|
||||||||||
| Amounts charged to | ||||||||||
|
|
||||||||||
| Share capital | 1 | 171 | 17 | 553 | ||||||
|
|
||||||||||
| Retained earnings | 2 | 322 | 26 | 1 118 | ||||||
|
|
||||||||||
| Share repurchase cost | 3 | 493 | 43 | 1 671 | ||||||
|
|
||||||||||
44 SUNCOR ENERGY INC. 2015 FOURTH QUARTER
|
Three months ended December 31 |
Twelve months ended December 31 |
||||||||||
| ($ millions) | 2015 | 2014 | 2015 | 2014 | |||||||
|
|
|||||||||||
| Interest on debt | 226 | 196 | 870 | 739 | |||||||
|
|
|||||||||||
| Capitalized interest | (129 | ) | (107 | ) | (447 | ) | (431 | ) | |||
|
|
|||||||||||
| Interest expense | 97 | 89 | 423 | 308 | |||||||
|
|
|||||||||||
| Interest on pension and other post-retirement benefits | 13 | 14 | 52 | 55 | |||||||
|
|
|||||||||||
| Accretion | 51 | 47 | 197 | 198 | |||||||
|
|
|||||||||||
| Foreign exchange loss on U.S. dollar denominated debt | 386 | 352 | 1 967 | 839 | |||||||
|
|
|||||||||||
| Foreign exchange and other | (51 | ) | 43 | (82 | ) | 29 | |||||
|
|
|||||||||||
| 496 | 545 | 2 557 | 1 429 | ||||||||
|
|
|||||||||||
In the second quarter of 2015, the Government of Alberta enacted an increase in the corporate income tax rate from 10% to 12% effective July 1, 2015. As a result, the company revalued its deferred income tax balances, resulting in a deferred income tax expense of $423 million.
In the first quarter of 2015, the United Kingdom (U.K.) government enacted a decrease in the supplementary charge rate on oil and gas profits in the North Sea that reduced the statutory tax rate on Suncor's earnings in the U.K. from 62% to 50%. The company revalued its deferred income tax balances, resulting in a deferred income tax recovery of $406 million.
Pursuant to the previously disclosed 2013 proposal letter from the Canada Revenue Agency (CRA), the company received a Notice of Reassessment (NOR) from the CRA during the second quarter of 2014, regarding the income tax treatment of realized losses in 2007 on the settlement of certain derivative contracts. The total amount of the NOR, including tax, penalty and interest, was approximately $920 million. The company strongly disagrees with the CRA's position and continues to firmly believe it will be able to successfully defend its original filing position and will take the appropriate actions to resolve this matter. In addition to the above, the company has:
- •
- Received
NORs related to the derivative contracts from the Provinces of Alberta, Ontario and Quebec for approximately $124 million, $100 million and
$42 million, respectively;
- •
- Provided
security to the CRA and the Provinces of Quebec and Ontario for approximately $642 million;
- •
- Filed
Notices of Objection with the CRA and the Provinces of Alberta, Ontario and Quebec; and
- •
- Filed a Notice of Appeal with the Tax Court of Canada in November 2014 and is now pursuing its Appeal to that Court.
If the company is unsuccessful in defending its tax filing position, it could be subject to an earnings and cash impact of up to $1.2 billion.
SUNCOR ENERGY INC. 2015 FOURTH QUARTER 45
10. EARNINGS (LOSS) PER COMMON SHARE
|
Three months ended December 31 |
Twelve months ended December 31 |
||||||||
| ($ millions) | 2015 | 2014 | 2015 | 2014 | |||||
|
|
|||||||||
| Net (loss) earnings | (2 007 | ) | 84 | (1 995 | ) | 2 699 | |||
|
|
|||||||||
| Dilutive impact of accounting for awards as equity-settled(1) | — | (9 | ) | — | — | ||||
|
|
|||||||||
| Net (loss) earnings – diluted | (2 007 | ) | 75 | (1 995 | ) | 2 699 | |||
|
|
|||||||||
(millions of common shares) |
|||||||||
|
|
|||||||||
| Weighted average number of common shares | 1 446 | 1 448 | 1 446 | 1 462 | |||||
|
|
|||||||||
| Dilutive securities: | |||||||||
|
|
|||||||||
| Effect of share options | 1 | 2 | 1 | 3 | |||||
|
|
|||||||||
| Weighted average number of diluted common shares | 1 447 | 1 450 | 1 447 | 1 465 | |||||
|
|
|||||||||
(dollars per common share) |
|||||||||
|
|
|||||||||
| Basic (loss) earnings per share | (1.38 | ) | 0.06 | (1.38 | ) | 1.84 | |||
|
|
|||||||||
| Diluted (loss) earnings per share | (1.38 | ) | 0.06 | (1.38 | ) | 1.84 | |||
|
|
|||||||||
- (1)
- Cash payment alternatives are accounted for as cash-settled plans. As these awards can be exchanged for common shares of the company, they are considered potentially dilutive and are included in the calculation of the company's diluted net earnings per share if they have a dilutive impact in the period. Accounting for these awards as equity-settled was determined to have an anti-dilutive impact for the three and twelve months ended December 31, 2015.
Derivative Financial Instruments
(a) Non-Designated Derivative Financial Instruments
The following table presents the company's non-designated Energy Trading and Risk Management derivatives measured at fair value as at December 31, 2015.
| ($ millions) |
Energy Trading |
Risk Management |
Total | ||||||
|
|
|||||||||
| Fair value outstanding at December 31, 2014 | 20 | 110 | 130 | ||||||
|
|
|||||||||
| Fair value realized in earnings | (66 | ) | (183 | ) | (249 | ) | |||
|
|
|||||||||
| Changes in fair value (Note 4) | 28 | 93 | 121 | ||||||
|
|
|||||||||
| Fair value outstanding at December 31, 2015 | (18 | ) | 20 | 2 | |||||
|
|
|||||||||
The company uses forward starting interest rate swaps to mitigate its exposure to the effect of future interest rate movements on future debt issuances. As at December 31, 2015, the company had executed $1.3 billion in forward swaps.
46 SUNCOR ENERGY INC. 2015 FOURTH QUARTER
(b) Fair Value Hierarchy
The following table presents the company's financial instruments measured at fair value for each hierarchy level as at December 31, 2015.
| ($ millions) | Level 1 | Level 2 | Level 3 |
Total Fair Value |
|||||||
|
|
|||||||||||
| Accounts receivable | 14 | 76 | — | 90 | |||||||
|
|
|||||||||||
| Accounts payable | (20 | ) | (68 | ) | — | (88 | ) | ||||
|
|
|||||||||||
| (6 | ) | 8 | — | 2 | |||||||
|
|
|||||||||||
During the fourth quarter of 2015, there were no transfers between Level 1 and Level 2 fair value measurements and no transfers into and out of Level 3 fair value measurements.
Non-Derivative Financial Instruments
At December 31, 2015, the carrying value of fixed-term debt accounted for under amortized cost was $13.3 billion (December 31, 2014 – $11.5 billion) and the fair value was $14.5 billion (December 31, 2014 – $13.5 billion). The estimated fair value of long-term debt is based on pricing sourced from market data.
12. ASSET SWAP WITH TRANSALTA CORPORATION
On August 31, 2015, Suncor completed an exchange of assets with TransAlta Corporation (TransAlta). Suncor exchanged Kent Breeze and its share of the Wintering Hills wind power facilities for TransAlta's Poplar Creek cogeneration facilities, which provide steam and power for Suncor's Oil Sands operations. The acquisition of the Poplar Creek cogeneration facilities is expected to enhance the reliability and efficiency of Suncor's base operations.
As part of the agreement, Suncor entered into a 15-year lease with TransAlta to finance the difference between the fair value of the cogeneration facilities and the fair value of the wind farms. The leased assets consist of two gas turbine generators and heat recovery steam generators. Ownership of these assets will automatically transfer to Suncor at the end of the term for a nominal amount. Although the legal form of this arrangement is a lease, in substance it is a deferred financing arrangement because it was entered into to finance the remaining balance of this acquisition and ownership of the assets will automatically transfer to Suncor at the end of the term. The lease is accounted for as a deferred financing arrangement that is part of the business combination because it is a component of the consideration provided to TransAlta.
The transaction was determined to have commercial substance since Suncor acquired operational control of Poplar Creek and will be entitled to all of the electrical output. The acquisition of the Poplar Creek assets was treated as a business combination, whereby the assets and liabilities acquired were recorded at their fair value. The fair values were calculated using an expected future cash flow approach with risk-adjusted discount rates between 6% and 8%. Key assumptions used in the calculation were discount rate, power price and natural gas price.
Purchase consideration
| ($ millions) | |||
|
|
|||
| Fair value of Kent Breeze wind farm | 47 | ||
|
|
|||
| Fair value of Suncor's share of Wintering Hills wind farm | 77 | ||
|
|
|||
| Fair value of deferred financing arrangement | 303 | ||
|
|
|||
| Total purchase consideration | 427 | ||
|
|
|||
SUNCOR ENERGY INC. 2015 FOURTH QUARTER 47
Purchase price allocation
The preliminary purchase price allocation is based on management's best estimates of the fair value of the acquired assets and assumed liabilities. Upon finalization, adjustments to the initial estimates may be required.
| ($ millions) | ||||
|
|
||||
| Working capital | 36 | |||
|
|
||||
| Property, plant and equipment | 393 | |||
|
|
||||
| Decommissioning provision | (2 | ) | ||
|
|
||||
| Net assets acquired | 427 | |||
|
|
||||
13. ACQUISITION OF ADDITIONAL OWNERSHIP IN FORT HILLS
On November 6, 2015, Suncor completed the acquisition of an additional 10% working interest in the Fort Hills oil sands project from Total E&P Canada Ltd. for consideration of $360 million. Suncor's share in the project has increased to 50.8%.
14. ACQUISITION OF A SULPHUR FACILITY
On July 17, 2014, the company completed a business combination of a sulphur recovery facility in its Refining and Marketing segment.
The purchase price allocation is based on management's best estimates of the fair value of the acquired assets and assumed liabilities.
The fair value of consideration transferred and the assets acquired and liabilities assumed at the date of acquisition were as follows:
| ($ millions) | ||||
|
|
||||
| Total purchase price | 121 | |||
|
|
||||
| Purchase price allocation | ||||
|
|
||||
| Property, plant and equipment | 161 | |||
|
|
||||
| Net working capital | (1 | ) | ||
|
|
||||
| Deferred tax liabilities | (39 | ) | ||
|
|
||||
| Net assets acquired | 121 | |||
|
|
||||
All acquisition and transaction costs for this asset acquisition were expensed.
During the third quarter of 2014, the company announced that, along with The Pioneer Group Inc., it had reached an agreement to sell the assets of Pioneer Energy, including retail gas stations in Ontario and Manitoba. The company's investment in Pioneer was recorded at fair value and classified as an available for sale financial instrument. The transaction closed in the second quarter of 2015 and the company received $183 million for its 50% share of Pioneer Energy and realized an after-tax gain of $68 million in the Refining and Marketing segment.
During the third quarter of 2014, the company sold its Wilson Creek assets in central Alberta for $168.5 million before closing adjustments and other closing costs, with an effective date of July 1, 2014 and a closing date of September 30, 2014. The sale of these assets resulted in an after-tax gain of $61 million in the Exploration and Production segment.
48 SUNCOR ENERGY INC. 2015 FOURTH QUARTER
For the twelve months ended December 31, 2015, there was a net increase in provisions of $461 million, primarily due to a $402 million increase in the decommissioning and restoration provision mainly as a result of additional disturbances and increases to estimates.
18. PENSIONS AND OTHER POST-RETIREMENT BENEFITS
For the twelve months ended December 31, 2015, a net after-tax actuarial gain of $212 million was recorded based on the most recent actuarial remeasurement of the company's pension and other post-retirement benefit plans. A corresponding decrease was recorded in Other Long-Term Liabilities.
During the twelve months ended December 31, 2015, the company increased its commitments by approximately $4.9 billion as a result of receiving regulatory approval of pipeline transportation agreements, which will support the company's market access strategy, activities to expand its storage and logistics network, and drilling exploration activities.
On October 5, 2015, Suncor announced that it had commenced an unsolicited offer to acquire all of the outstanding shares of COS on the basis of one COS share in exchange for 0.25 Suncor common shares. At the time of the offer, the total transaction value was approximately $6.6 billion based on Suncor's share consideration valued at approximately $4.3 billion and COS' estimated outstanding net debt of $2.3 billion as at June 30, 2015.
On January 18, 2016, Suncor increased the offer to acquire all of the outstanding shares of COS to an exchange ratio of 0.28 Suncor common share per COS share from an exchange ratio of 0.25. The amended offer has the full support of the Boards of Directors of Suncor and COS. At the time of the amended offer, the transaction value was approximately $6.6 billion based on the share consideration of approximately $4.2 billion and COS' estimated outstanding net debt of $2.4 billion as at September 30, 2015. The amended offer expires on February 5, 2016.
Effective January 1, 2016, working interests in the Hebron project have been reset. As a result, Suncor's working interest in the Hebron project decreased from 22.729% to 21.034%. Suncor will be reimbursed for capital expenditures and financing costs related to the reduction in working interest incurred to December 31, 2015. The transaction will be recorded as a reduction to property, plant and equipment in the first quarter of 2016.
SUNCOR ENERGY INC. 2015 FOURTH QUARTER 49
QUARTERLY FINANCIAL SUMMARY
(unaudited)
| Three months ended | Twelve months ended | ||||||||||||||||
| ($ millions, except per share amounts) |
Dec 31 2015 |
Sept 30 2015 |
Jun 30 2015 |
Mar 31 2015 |
Dec 31 2014 |
Dec 31 2015 |
Dec 31 2014 |
||||||||||
|
|
|||||||||||||||||
| Revenues and other income | 6 593 | 7 557 | 8 144 | 7 386 | 9 091 | 29 680 | 40 490 | ||||||||||
|
|
|||||||||||||||||
| Net (loss) earnings | |||||||||||||||||
|
|
|||||||||||||||||
| Oil Sands | (616 | ) | (50 | ) | (44 | ) | (146 | ) | 180 | (856 | ) | 1 776 | |||||
|
|
|||||||||||||||||
| Exploration and Production | (1 263 | ) | (1 | ) | 44 | 462 | 198 | (758 | ) | 653 | |||||||
|
|
|||||||||||||||||
| Refining and Marketing | 498 | 613 | 663 | 492 | 173 | 2 266 | 1 692 | ||||||||||
|
|
|||||||||||||||||
| Corporate, Energy Trading and Eliminations | (626 | ) | (938 | ) | 66 | (1 149 | ) | (467 | ) | (2 647 | ) | (1 422 | ) | ||||
|
|
|||||||||||||||||
| (2 007 | ) | (376 | ) | 729 | (341 | ) | 84 | (1 995 | ) | 2 699 | |||||||
|
|
|||||||||||||||||
| Operating (loss) earnings(A) | |||||||||||||||||
|
|
|||||||||||||||||
| Oil Sands | (230 | ) | (50 | ) | 315 | (146 | ) | 180 | (111 | ) | 2 771 | ||||||
|
|
|||||||||||||||||
| Exploration and Production | (50 | ) | (1 | ) | 77 | (19 | ) | 198 | 7 | 857 | |||||||
|
|
|||||||||||||||||
| Refining and Marketing | 498 | 613 | 631 | 492 | 173 | 2 234 | 1 692 | ||||||||||
|
|
|||||||||||||||||
| Corporate, Energy Trading and Eliminations | (244 | ) | (152 | ) | (117 | ) | (152 | ) | (165 | ) | (665 | ) | (700 | ) | |||
|
|
|||||||||||||||||
| (26 | ) | 410 | 906 | 175 | 386 | 1 465 | 4 620 | ||||||||||
|
|
|||||||||||||||||
| Cash flow from (used in) operations(A) | |||||||||||||||||
|
|
|||||||||||||||||
| Oil Sands | 467 | 785 | 1 058 | 525 | 875 | 2 835 | 5 400 | ||||||||||
|
|
|||||||||||||||||
| Exploration and Production | 257 | 253 | 427 | 449 | 401 | 1 386 | 1 909 | ||||||||||
|
|
|||||||||||||||||
| Refining and Marketing | 596 | 798 | 800 | 678 | 240 | 2 872 | 2 178 | ||||||||||
|
|
|||||||||||||||||
| Corporate, Energy Trading and Eliminations | (26 | ) | 46 | (130 | ) | (177 | ) | (24 | ) | (287 | ) | (429 | ) | ||||
|
|
|||||||||||||||||
| 1 294 | 1 882 | 2 155 | 1 475 | 1 492 | 6 806 | 9 058 | |||||||||||
|
|
|||||||||||||||||
| Per common share | |||||||||||||||||
|
|
|||||||||||||||||
| Net (loss) earnings | |||||||||||||||||
|
|
|||||||||||||||||
| – basic | (1.38 | ) | (0.26 | ) | 0.50 | (0.24 | ) | 0.06 | (1.38 | ) | 1.84 | ||||||
|
|
|||||||||||||||||
| – diluted | (1.38 | ) | (0.26 | ) | 0.50 | (0.24 | ) | 0.06 | (1.38 | ) | 1.84 | ||||||
|
|
|||||||||||||||||
| Operating earnings – basic | (0.02 | ) | 0.28 | 0.63 | 0.12 | 0.27 | 1.01 | 3.15 | |||||||||
|
|
|||||||||||||||||
| Cash dividends – basic | 0.29 | 0.29 | 0.28 | 0.28 | 0.28 | 1.14 | 1.02 | ||||||||||
|
|
|||||||||||||||||
| Cash flow from operations – basic | 0.90 | 1.30 | 1.49 | 1.02 | 1.03 | 4.71 | 6.19 | ||||||||||
|
|
|||||||||||||||||
| For the Twelve Months Ended | ||||||||||||
|
Dec 31 2015 |
Sept 30 2015 |
Jun 30 2015 |
Mar 31 2015 |
Dec 31 2014 |
||||||||
|
|
||||||||||||
| Return on capital employed(A) | ||||||||||||
|
|
||||||||||||
| – excluding major projects in progress (%) | 0.6 | 5.1 | 7.2 | 5.8 | 8.6 | |||||||
|
|
||||||||||||
| – including major projects in progress (%) | 0.5 | 4.5 | 6.3 | 5.0 | 7.5 | |||||||
|
|
||||||||||||
- (A)
- Non-GAAP financial measures – see accompanying footnotes and definitions to the quarterly operating summaries.
50 SUNCOR ENERGY INC. 2015 FOURTH QUARTER
QUARTERLY OPERATING SUMMARY
(unaudited)
| Three months ended | Twelve months ended | |||||||||||||||
| Oil Sands |
Dec 31 2015 |
Sept 30 2015 |
Jun 30 2015 |
Mar 31 2015 |
Dec 31 2014 |
Dec 31 2015 |
Dec 31 2014 |
|||||||||
|
|
||||||||||||||||
| Total Production (mbbls/d) | 470.6 | 458.4 | 448.7 | 475.6 | 419.3 | 463.4 | 421.9 | |||||||||
|
|
||||||||||||||||
Oil Sands operations |
||||||||||||||||
|
|
||||||||||||||||
| Production volumes (mbbls/d) | ||||||||||||||||
|
|
||||||||||||||||
| Upgraded product (sweet SCO, sour SCO & diesel) | 292.2 | 314.9 | 327.4 | 346.5 | 276.3 | 320.1 | 289.1 | |||||||||
|
|
||||||||||||||||
| Non-upgraded bitumen | 147.5 | 115.4 | 96.4 | 93.9 | 107.9 | 113.5 | 101.8 | |||||||||
|
|
||||||||||||||||
| Oil Sands operations production | 439.7 | 430.3 | 423.8 | 440.4 | 384.2 | 433.6 | 390.9 | |||||||||
|
|
||||||||||||||||
| Bitumen production (mbbls/d) | ||||||||||||||||
|
|
||||||||||||||||
| Mining | 292.4 | 303.3 | 315.5 | 318.3 | 254.1 | 307.3 | 274.4 | |||||||||
|
|
||||||||||||||||
| In Situ – Firebag | 198.8 | 191.7 | 168.1 | 188.7 | 182.2 | 186.9 | 172.0 | |||||||||
|
|
||||||||||||||||
| In Situ – MacKay River | 34.5 | 27.4 | 31.5 | 29.3 | 28.7 | 30.7 | 27.0 | |||||||||
|
|
||||||||||||||||
| Total bitumen production | 525.7 | 522.4 | 515.1 | 536.3 | 465.0 | 524.9 | 473.4 | |||||||||
|
|
||||||||||||||||
| Sales (mbbls/d) | ||||||||||||||||
|
|
||||||||||||||||
| Light sweet crude oil | 100.2 | 112.9 | 102.4 | 112.5 | 75.5 | 107.0 | 99.7 | |||||||||
|
|
||||||||||||||||
| Diesel | 29.4 | 30.0 | 35.1 | 30.8 | 31.2 | 31.3 | 30.7 | |||||||||
|
|
||||||||||||||||
| Light sour crude oil | 154.2 | 180.7 | 194.4 | 201.3 | 152.7 | 182.5 | 158.9 | |||||||||
|
|
||||||||||||||||
| Upgraded product (SCO & diesel) | 283.8 | 323.6 | 331.9 | 344.6 | 259.4 | 320.8 | 289.3 | |||||||||
|
|
||||||||||||||||
| Non-upgraded bitumen | 136.3 | 106.3 | 91.8 | 95.8 | 110.2 | 107.7 | 101.4 | |||||||||
|
|
||||||||||||||||
| Total sales | 420.1 | 429.9 | 423.7 | 440.4 | 369.6 | 428.5 | 390.7 | |||||||||
|
|
||||||||||||||||
| Average sales price(1) ($/bbl) | ||||||||||||||||
|
|
||||||||||||||||
| Sweet SCO and diesel | 60.86 | 62.13 | 77.65 | 63.36 | 88.78 | 66.00 | 109.02 | |||||||||
|
|
||||||||||||||||
| Sour SCO and bitumen | 32.93 | 40.86 | 52.71 | 40.10 | 61.68 | 41.58 | 76.66 | |||||||||
|
|
||||||||||||||||
| Average | 41.55 | 47.93 | 60.81 | 47.67 | 69.51 | 49.46 | 87.46 | |||||||||
|
|
||||||||||||||||
Cash operating costs(2) ($/bbl) |
||||||||||||||||
|
|
||||||||||||||||
| Cash costs | 25.70 | 24.95 | 26.15 | 25.70 | 31.15 | 25.65 | 30.00 | |||||||||
|
|
||||||||||||||||
| Natural gas | 2.30 | 2.05 | 1.85 | 2.70 | 3.30 | 2.20 | 3.80 | |||||||||
|
|
||||||||||||||||
| 28.00 | 27.00 | 28.00 | 28.40 | 34.45 | 27.85 | 33.80 | ||||||||||
|
|
||||||||||||||||
| Cash operating costs – In Situ bitumen production only(2) ($/bbl) | ||||||||||||||||
|
|
||||||||||||||||
| Cash costs | 8.10 | 8.80 | 9.25 | 9.90 | 8.85 | 9.00 | 10.20 | |||||||||
|
|
||||||||||||||||
| Natural gas | 3.55 | 3.75 | 3.80 | 4.10 | 5.20 | 3.80 | 6.45 | |||||||||
|
|
||||||||||||||||
| 11.65 | 12.55 | 13.05 | 14.00 | 14.05 | 12.80 | 16.65 | ||||||||||
|
|
||||||||||||||||
Syncrude |
||||||||||||||||
|
|
||||||||||||||||
| Production (mbbls/d) | 30.9 | 28.1 | 24.9 | 35.2 | 35.1 | 29.8 | 31.0 | |||||||||
|
|
||||||||||||||||
| Average sales price(1) ($/bbl) | 57.37 | 61.00 | 75.19 | 56.00 | 81.85 | 61.55 | 99.32 | |||||||||
|
|
||||||||||||||||
| Cash operating costs(2) ($/bbl)* | ||||||||||||||||
|
|
||||||||||||||||
| Cash costs | 38.55 | 39.70 | 54.45 | 34.20 | 42.85 | 40.35 | 46.75 | |||||||||
|
|
||||||||||||||||
| Natural gas | 1.60 | 1.95 | 1.65 | 1.50 | 1.85 | 1.65 | 2.40 | |||||||||
|
|
||||||||||||||||
| 40.15 | 41.65 | 56.10 | 35.70 | 44.70 | 42.00 | 49.15 | ||||||||||
|
|
||||||||||||||||
See accompanying footnotes and definitions to the quarterly operating summaries.
SUNCOR ENERGY INC. 2015 FOURTH QUARTER 51
QUARTERLY OPERATING SUMMARY (continued)
(unaudited)
| Three months ended | Twelve months ended | |||||||||||||||||
| Exploration and Production |
Dec 31 2015 |
Sept 30 2015 |
Jun 30 2015 |
Mar 31 2015 |
Dec 31 2014 |
Dec 31 2015 |
Dec 31 2014 |
|||||||||||
|
|
||||||||||||||||||
| Total Production (mboe/d) | 112.3 | 107.7 | 111.2 | 126.8 | 138.3 | 114.4 | 113.0 | |||||||||||
|
|
||||||||||||||||||
Production Volumes |
||||||||||||||||||
|
|
||||||||||||||||||
| Exploration and Production Canada | ||||||||||||||||||
|
|
||||||||||||||||||
| East Coast Canada | ||||||||||||||||||
|
|
||||||||||||||||||
| Terra Nova (mbbls/d) | 13.1 | 10.4 | 7.3 | 23.3 | 24.0 | 13.5 | 17.3 | |||||||||||
|
|
||||||||||||||||||
| Hibernia (mbbls/d) | 15.6 | 16.6 | 18.3 | 22.0 | 20.8 | 18.1 | 23.1 | |||||||||||
|
|
||||||||||||||||||
| White Rose (mbbls/d) | 14.8 | 9.9 | 11.4 | 12.8 | 13.3 | 12.2 | 14.6 | |||||||||||
|
|
||||||||||||||||||
| North America Onshore (mboe/d) | 3.1 | 3.7 | 2.4 | 3.6 | 2.4 | 3.2 | 3.6 | |||||||||||
|
|
||||||||||||||||||
| 46.6 | 40.6 | 39.4 | 61.7 | 60.5 | 47.0 | 58.6 | ||||||||||||
|
|
||||||||||||||||||
Exploration and Production International |
||||||||||||||||||
|
|
||||||||||||||||||
| Buzzard (mboe/d) | 45.5 | 50.0 | 52.4 | 51.4 | 54.0 | 49.8 | 47.1 | |||||||||||
|
|
||||||||||||||||||
| Golden Eagle (mboe/d) | 17.7 | 17.0 | 14.5 | 9.8 | 2.2 | 14.8 | 0.6 | |||||||||||
|
|
||||||||||||||||||
| United Kingdom (mboe/d) | 63.2 | 67.0 | 66.9 | 61.2 | 56.2 | 64.6 | 47.7 | |||||||||||
|
|
||||||||||||||||||
| Libya (mbbls/d) | 2.5 | 0.1 | 4.9 | 3.9 | 21.6 | 2.8 | 6.7 | |||||||||||
|
|
||||||||||||||||||
| 65.7 | 67.1 | 71.8 | 65.1 | 77.8 | 67.4 | 54.4 | ||||||||||||
|
|
||||||||||||||||||
Netbacks |
||||||||||||||||||
|
|
||||||||||||||||||
| East Coast Canada ($/bbl) | ||||||||||||||||||
|
|
||||||||||||||||||
| Average price realized | 52.51 | 59.09 | 78.23 | 66.38 | 80.42 | 65.12 | 108.21 | |||||||||||
|
|
||||||||||||||||||
| Royalties | (5.79 | ) | (4.39 | ) | (16.38 | ) | (17.58 | ) | (14.52 | ) | (12.49 | ) | (25.97 | ) | ||||
|
|
||||||||||||||||||
| Transportation costs | (2.81 | ) | (2.97 | ) | (1.73 | ) | (1.76 | ) | (1.91 | ) | (2.18 | ) | (1.97 | ) | ||||
|
|
||||||||||||||||||
| Operating costs | (16.86 | ) | (17.66 | ) | (16.63 | ) | (9.57 | ) | (14.66 | ) | (14.15 | ) | (13.11 | ) | ||||
|
|
||||||||||||||||||
| Operating netback | 27.05 | 34.07 | 43.49 | 37.47 | 49.33 | 36.30 | 67.16 | |||||||||||
|
|
||||||||||||||||||
United Kingdom ($/boe) |
||||||||||||||||||
|
|
||||||||||||||||||
| Average price realized | 54.91 | 62.86 | 72.84 | 64.48 | 84.87 | 63.85 | 106.96 | |||||||||||
|
|
||||||||||||||||||
| Transportation costs | (2.22 | ) | (2.43 | ) | (2.66 | ) | (2.32 | ) | (2.60 | ) | (2.41 | ) | (2.84 | ) | ||||
|
|
||||||||||||||||||
| Operating costs | (6.20 | ) | (5.99 | ) | (5.86 | ) | (7.33 | ) | (4.47 | ) | (6.29 | ) | (6.42 | ) | ||||
|
|
||||||||||||||||||
| Operating netback | 46.49 | 54.44 | 64.32 | 54.83 | 77.80 | 55.15 | 97.70 | |||||||||||
|
|
||||||||||||||||||
See accompanying footnotes and definitions to the quarterly operating summaries.
52 SUNCOR ENERGY INC. 2015 FOURTH QUARTER
QUARTERLY OPERATING SUMMARY (continued)
(unaudited)
| Three months ended | Twelve months ended | ||||||||||||||||
| Refining and Marketing |
Dec 31 2015 |
Sept 30 2015 |
Jun 30 2015 |
Mar 31 2015 |
Dec 31 2014 |
Dec 31 2015 |
Dec 31 2014 |
||||||||||
|
|
|||||||||||||||||
| Refined product sales (mbbls/d) | 501.2 | 546.4 | 525.5 | 519.7 | 548.2 | 523.3 | 531.7 | ||||||||||
|
|
|||||||||||||||||
| Crude oil processed (mbbls/d) | 430.2 | 444.8 | 416.8 | 437.1 | 440.8 | 432.1 | 427.5 | ||||||||||
|
|
|||||||||||||||||
| Utilization of refining capacity (%) | 93 | 96 | 90 | 95 | 95 | 94 | 93 | ||||||||||
|
|
|||||||||||||||||
Eastern North America |
|||||||||||||||||
|
|
|||||||||||||||||
| Refined product sales (mbbls/d) | |||||||||||||||||
|
|
|||||||||||||||||
| Transportation fuels | |||||||||||||||||
|
|
|||||||||||||||||
| Gasoline | 116.1 | 119.1 | 121.8 | 118.6 | 120.8 | 118.9 | 120.6 | ||||||||||
|
|
|||||||||||||||||
| Distillate | 86.2 | 90.5 | 91.8 | 96.0 | 84.9 | 91.1 | 81.9 | ||||||||||
|
|
|||||||||||||||||
| Total transportation fuel sales | 202.3 | 209.6 | 213.6 | 214.6 | 205.7 | 210.0 | 202.5 | ||||||||||
|
|
|||||||||||||||||
| Petrochemicals | 8.9 | 10.4 | 10.6 | 13.3 | 13.0 | 10.8 | 12.1 | ||||||||||
|
|
|||||||||||||||||
| Asphalt | 14.1 | 18.4 | 12.0 | 7.6 | 13.3 | 13.1 | 13.6 | ||||||||||
|
|
|||||||||||||||||
| Other | 28.2 | 24.8 | 31.8 | 31.0 | 36.4 | 28.9 | 32.5 | ||||||||||
|
|
|||||||||||||||||
| Total refined product sales | 253.5 | 263.2 | 268.0 | 266.5 | 268.4 | 262.8 | 260.7 | ||||||||||
|
|
|||||||||||||||||
| Crude oil supply and refining | |||||||||||||||||
|
|
|||||||||||||||||
| Processed at refineries (mbbls/d) | 208.0 | 200.5 | 211.6 | 212.4 | 201.0 | 208.1 | 199.2 | ||||||||||
|
|
|||||||||||||||||
| Utilization of refining capacity (%) | 94 | 90 | 95 | 96 | 91 | 94 | 90 | ||||||||||
|
|
|||||||||||||||||
Western North America |
|||||||||||||||||
|
|
|||||||||||||||||
| Refined product sales (mbbls/d) | |||||||||||||||||
|
|
|||||||||||||||||
| Transportation fuels | |||||||||||||||||
|
|
|||||||||||||||||
| Gasoline | 127.7 | 135.3 | 126.7 | 119.2 | 126.6 | 127.3 | 122.8 | ||||||||||
|
|
|||||||||||||||||
| Distillate | 100.8 | 115.8 | 100.7 | 110.2 | 126.7 | 106.9 | 117.8 | ||||||||||
|
|
|||||||||||||||||
| Total transportation fuel sales | 228.5 | 251.1 | 227.4 | 229.4 | 253.3 | 234.2 | 240.6 | ||||||||||
|
|
|||||||||||||||||
| Asphalt | 10.8 | 13.9 | 13.9 | 9.7 | 10.6 | 11.9 | 10.6 | ||||||||||
|
|
|||||||||||||||||
| Other | 8.4 | 18.2 | 16.2 | 14.1 | 15.9 | 14.4 | 19.8 | ||||||||||
|
|
|||||||||||||||||
| Total refined product sales | 247.7 | 283.2 | 257.5 | 253.2 | 279.8 | 260.5 | 271.0 | ||||||||||
|
|
|||||||||||||||||
| Crude oil supply and refining | |||||||||||||||||
|
|
|||||||||||||||||
| Processed at refineries (mbbls/d) | 222.2 | 244.3 | 205.2 | 224.7 | 239.8 | 224.0 | 228.3 | ||||||||||
|
|
|||||||||||||||||
| Utilization of refining capacity (%) | 93 | 102 | 86 | 94 | 100 | 93 | 95 | ||||||||||
|
|
|||||||||||||||||
See accompanying footnotes and definitions to the quarterly operating summaries.
SUNCOR ENERGY INC. 2015 FOURTH QUARTER 53
QUARTERLY OPERATING SUMMARY (continued)
Non-GAAP Financial Measures
Certain financial measures in this document – namely operating (loss) earnings, cash flow from (used in) operations, return on capital employed and Oil Sands cash operating costs – are not prescribed by GAAP. Suncor includes these financial measures because investors may use this information to analyze business performance, leverage and liquidity. These non-GAAP financial measures do not have any standardized meaning and, therefore, are unlikely to be comparable to similar measures presented by other companies. The additional information should not be considered in isolation or as a substitute for measures of performance prepared in accordance with GAAP.
Operating (loss) earnings and Oil Sands cash operating costs for each quarter in 2015 and 2014 are each defined in the Non-GAAP Financial Measures Advisory section and reconciled to GAAP measures in the Consolidated Financial Information and/or Segment Results and Analysis sections of each respective quarterly Report to Shareholders issued in respect of the relevant quarter for 2015 and 2014 (Quarterly Report). Cash flow from (used in) operations and return on capital employed for each quarter in 2015 and 2014 are defined and reconciled to GAAP measures in the Non-GAAP Financial Measures Advisory section of each respective Quarterly Report. The remainder of the non-GAAP financial measures not otherwise mentioned in this paragraph are defined and reconciled in Suncor's Management's Discussion and Analysis contained in the 2014 Annual Report.
Definitions
- (1)
- Average
sales price – This is calculated including the impact of hedging activities, before royalties (where applicable) and net of related
transportation costs.
- (2)
- Cash operating costs – Include cash costs that are defined as operating, selling and general expenses (excluding inventory changes and non-production costs), and including operating revenues associated with excess power from cogeneration units.
Explanatory Notes
- *
- Users are cautioned that the Syncrude cash costs per barrel measure may not be fully comparable to similar information calculated by other entities (including Suncor's own cash costs per barrel excluding Syncrude) due to differing operations of each company as well as their respective accounting policy choices.
Abbreviations
| bbl | – barrel |
| mbbls/d | – thousands of barrels per day |
| mcf | – thousands of cubic feet |
| mcfe | – thousands of cubic feet equivalent |
| mmcf/d | – millions of cubic feet per day |
| mmcfe/d | – millions of cubic feet equivalent per day |
| boe | – barrels of oil equivalent |
| boe/d | – barrels of oil equivalent per day |
| mboe/d | – thousands of barrels of oil equivalent per day |
| netback | – netbacks have been calculated by subtracting royalties, transportation and operating costs from average realized price |
| m3/d | – cubic metres per day |
| SCO | – synthetic crude oil |
Metric Conversion
| Crude oil, refined products, etc. | 1m3 (cubic metre) = approx. 6.29 barrels |
54 SUNCOR ENERGY INC. 2015 FOURTH QUARTER

Suncor Energy Inc. 150 - 6 Avenue S.W., Calgary, Alberta, Canada T2P 3E3 T: 403-296-8000 suncor.com |
EXHIBIT 99.1 Report to Shareholders for the fourth quarter ended December 31, 2015
1. REPORTING ENTITY AND DESCRIPTION OF THE BUSINESS
2. BASIS OF PREPARATION
3. SEGMENTED INFORMATION
4. OTHER INCOME
5. ASSET IMPAIRMENT
6. SHARE-BASED COMPENSATION
7. NORMAL COURSE ISSUER BID
8. FINANCING EXPENSES
9. INCOME TAXES
10. EARNINGS (LOSS) PER COMMON SHARE
11. FINANCIAL INSTRUMENTS
12. ASSET SWAP WITH TRANSALTA CORPORATION
13. ACQUISITION OF ADDITIONAL OWNERSHIP IN FORT HILLS
14. ACQUISITION OF A SULPHUR FACILITY
15. PIONEER DISPOSITION
16. NATURAL GAS DISPOSITIONS
17. PROVISIONS
18. PENSIONS AND OTHER POST-RETIREMENT BENEFITS
19. COMMITMENTS
20. CANADIAN OIL SANDS OFFER
21. SUBSEQUENT EVENTS
QuickLinks -- Click here to rapidly navigate through this document
EXHIBIT 99.2
News release dated February 3, 2016, Suncor Energy reports fourth quarter results
|
News Release |
FOR IMMEDIATE RELEASE
Suncor Energy reports fourth quarter 2015 results
Unless otherwise noted, all financial figures are unaudited, presented in Canadian dollars (Cdn$), and have been prepared in accordance with International Financial Reporting Standards (IFRS), specifically International Accounting Standard (IAS) 34 Interim Financial Reporting as issued by the International Accounting Standards Board. Production volumes are presented on a working interest basis, before royalties, unless noted otherwise. Certain financial measures referred to in this document (cash flow from operations, operating (loss) earnings, Oil Sands cash operating costs and free cash flow) are not prescribed by Canadian generally accepted accounting principles (GAAP). See the Non-GAAP Financial Measures section of this news release. References to Oil Sands operations production and cash operating costs exclude Suncor's interest in Syncrude's operations.
Calgary, Alberta (Feb. 3, 2016) – "In 2015 we generated cash flow that exceeded our annual sustaining capital and dividend commitments," said Steve Williams, president and chief executive officer. "Our integrated business model, our ability to reduce costs, and our relentless focus on operational discipline made this possible. As a result, we are well positioned to weather the current low crude oil price environment."
Highlights of the fourth quarter of 2015 include:
- •
- Cash flow from operations of $1.294 billion ($0.90 per common share), and an operating loss of $26 million
($0.02 per common share), driven by lower crude oil prices and a Refining and Marketing first-in, first-out (FIFO) loss of $77 million, partially offset by increased refining margins.
- •
- Net loss of $2.007 billion ($1.38 per common share), due to non-cash asset writedowns, which
were a result of the depressed commodity cycle, and a foreign exchange loss on U.S. dollar denominated debt.
- •
- Oil Sands operations cash operating costs per barrel decreased to $28.00 for the fourth quarter of 2015, which was driven
by strong production of 439,700 barrels per day (bbls/d), continued cost reduction initiatives, reduced unplanned maintenance activities and lower natural gas prices.
- •
- Effective January 1, 2016, nameplate capacity of Firebag increased from 180,000 bbls/d to
203,000 bbls/d, as a result of completing cost-effective debottleneck activities.
- •
- Subsequent to the end of the fourth quarter, Suncor and Canadian Oil Sands Limited (COS) reached an agreement for COS and its Board of Directors to support Suncor's offer to purchase all of the shares of COS for consideration of 0.28 of a Suncor share for each COS share. The transaction was valued at $6.6 billion at the time of the agreement.
Financial Results
Suncor recorded a fourth quarter 2015 operating loss of $26 million ($0.02 per common share), including a FIFO loss of $77 million, and cash flow from operations of $1.294 billion ($0.90 per common share) reflecting the lower crude oil price environment, compared to operating earnings of $386 million ($0.27 per common share), including a FIFO loss of $372 million, and cash flow from operations of $1.492 billion ($1.03 per common share), in the prior year quarter. Highlights in the fourth quarter of 2015 included a favourable downstream pricing environment, increased production from Oil Sands operations, and lower operating costs.
For the twelve months ended December 31, 2015, free cash flow was $139 million, compared to $2.097 billion for the twelve months ended December 31, 2014.
|
Suncor Energy 150 6 Avenue S.W. Calgary, Alberta T2P 3E3 suncor.com |
A net loss of $2.007 billion ($1.38 per common share) was recorded in the fourth quarter of 2015, compared with net earnings of $84 million ($0.06 per common share) in the prior year quarter. Net loss for the fourth quarter of 2015 was impacted by the same factors influencing the operating loss and included $1.599 billion of non-cash impairment charges and an unrealized after-tax foreign exchange loss of $382 million on the revaluation of U.S. dollar denominated debt. Net earnings in the prior year quarter included the impact of an unrealized after-tax foreign exchange loss of $302 million.
Operating Results
Suncor's total upstream production increased to 582,900 barrels of oil equivalent per day (boe/d) in the fourth quarter of 2015, compared with 557,600 boe/d in the prior year quarter, primarily due to strong reliability in Oil Sands operations.
Oil Sands operations production increased to 439,700 bbls/d in the fourth quarter of 2015, compared to 384,200 bbls/d in the prior year quarter, primarily due to record In Situ production and reliable operations across all assets following the completion of planned maintenance early in the quarter.
Cash operating costs per barrel for Oil Sands operations decreased in the fourth quarter of 2015 to $28.00/bbl, compared to $34.45/bbl in the prior year quarter, due to higher production combined with lower operating expenses as a result of cost reduction initiatives, lower unplanned maintenance and lower natural gas prices.
"We have surpassed the reliability and cost reduction targets we established in early 2015," said Williams. "Operating costs across the organization are down almost $1 billion from last year, while Oil Sands upgrading reliability exceeded 90%, more than a year ahead of our original plan."
Suncor's share of Syncrude production was 30,900 bbls/d in the fourth quarter of 2015, compared to 35,100 bbls/d in the prior year quarter. The decrease was primarily due to unplanned maintenance activities during the fourth quarter of 2015.
Production volumes in Exploration and Production (E&P) decreased to 112,300 boe/d in the fourth quarter of 2015, compared to 138,300 boe/d in the prior year quarter, primarily due to shut-in production in Libya, natural declines at Terra Nova and temporary export pipeline constraints that impacted Buzzard, partially offset by higher production at Golden Eagle. Production in Libya temporarily resumed at the start of the quarter, but was shut in again in November. Libya continues to be impacted by political unrest, with the timing of a return to normal operations remaining uncertain.
During the fourth quarter of 2015, Refining and Marketing completed planned maintenance at the Montreal refinery. Average refinery utilization decreased to 93% in the fourth quarter, compared to 95% in the prior year quarter, primarily driven by unplanned maintenance at the Edmonton refinery and lower distillate demand in Western Canada.
Strategy Update
Subsequent to the end of the fourth quarter, Suncor and COS reached an agreement to support Suncor's offer to purchase all of the shares of COS for 0.28 of a Suncor share for each COS share. The offer has the support of the Boards of Directors of both companies, and expires on February 5, 2016. The transaction value at the time of the agreement of approximately $6.6 billion includes COS' estimated debt of $2.4 billion.
"We are pleased that the Board of COS is supporting our offer," said Williams. "We believe that, working with the operator, we can drive real improvements in Syncrude's performance with a larger ownership interest, creating value for our shareholders."
Suncor continues to deliver on its commitment to add shareholder value and invest in long-term profitable growth in its core asset areas, while maintaining a strong financial position. In addition to extending the offer to COS shareholders, the company also completed its acquisition of an additional 10% working interest in the Fort Hills oil sands project from Total E&P Canada Ltd. for $360 million. Suncor's share in the project is now 50.8%.
To maintain our strong financial position and flexibility, Suncor has reduced its capital guidance for 2016 to a range of $6.0 to $6.5 billion from $6.7 to $7.3 billion issued in November of 2015. The capital spending reduction is not anticipated to impact the company's near term production targets.
Enbridge's Line 9 reversal was commissioned during the fourth quarter of 2015. The reversal will provide Suncor the flexibility of supplying its Montreal refinery with a full slate of inland-priced crude.
During the quarter, the Government of Alberta announced a new climate plan which includes a carbon pricing regime coupled with an overall emissions limit for the oil sands. The climate plan places some certainty on the future greenhouse gas (GHG) costs for Suncor, while the limit on oil sands emissions will force companies to ensure only the most profitable and efficient projects are developed.
The Government of Alberta conducted a review of the province's oil and gas royalties. Subsequent to year end, the new royalty system was announced and included no changes to the existing oil sand royalty rates, and improved transparency concerning disclosure of royalty information.
Oil Sands Operations
In the fourth quarter of 2015, Suncor safely completed planned maintenance at Upgrader 2 on a coker set, vacuum tower and hydrogen plant.
In Situ continued to focus on well pad construction to sustain existing production at Firebag and MacKay River, and successfully completed cost-effective debottlenecking activities at Firebag, which increased nameplate capacity from 180,000 bbls/d to 203,000 bbls/d.
Oil Sands Ventures
The Fort Hills project remains on schedule with construction more than 50% complete at the end of the fourth quarter. Spending during the quarter included engineering, procurement, module fabrication and site construction. The project is expected to deliver approximately 91,000 bbls/d of bitumen to Suncor, following the completion of the acquisition of an additional 10% working interest in the project during the fourth quarter. First oil is expected in the fourth quarter of 2017, and is expected to ramp up to 90% of capacity within twelve months thereafter.
Exploration and Production
Construction of the Hebron project continued in the fourth quarter of 2015, with first oil expected in late 2017. Effective January 1, 2016, working interests in the Hebron project have been reset. As a result, Suncor's working interest in the project decreased from 22.7% to 21.0%, with Suncor to be reimbursed for costs incurred to December 31, 2015.
Development drilling at Golden Eagle continued through the fourth quarter. Exploration drilling at the deepwater Shelburne Basin offshore Nova Scotia commenced in the fourth quarter, and will continue during 2016.
Operating (Loss) Earnings Reconciliation(1)
| |
Three months ended December 31 |
Twelve months ended December 31 |
|||||||||||
|---|---|---|---|---|---|---|---|---|---|---|---|---|---|
($ millions)
|
2015 | 2014 | 2015 | 2014 | |||||||||
Net (loss) earnings |
(2 007 | ) | 84 | (1 995 | ) | 2 699 | |||||||
Unrealized foreign exchange loss on U.S. dollar denominated debt |
382 | 302 | 1 930 | 722 | |||||||||
Impairments(2) |
1 599 | — | 1 599 | 1 238 | |||||||||
Impact of income tax rate adjustments on deferred taxes(3) |
— | — | 17 | — | |||||||||
Gain on significant disposal(4) |
— | — | (68 | ) | (61 | ) | |||||||
Restructuring charges(5) |
— | — | 57 | — | |||||||||
Insurance proceeds(6) |
— | — | (75 | ) | — | ||||||||
Reserves redetermination(7) |
— | — | — | (32 | ) | ||||||||
Income tax charge(8) |
— | — | — | 54 | |||||||||
Operating (loss) earnings(1) |
(26 | ) | 386 | 1 465 | 4 620 | ||||||||
- (1)
- Operating (loss) earnings is a non-GAAP financial measure. All reconciling items are presented on an after-tax basis. See the
Non-GAAP Financial Measures Advisory section of Suncor's fourth quarter report to shareholders dated February 3, 2016 (the Quarterly
Report).
- (2)
- After-tax impairment charges of $798 million on certain offshore E&P assets as a result of declining crude oil pricing,
$415 million (Q2 2014 – $297 million) against the company's Libyan assets, $290 million
(Q2 2014 – $718 million) on the company's interest in the Joslyn mining project, and $96 million (Q2
2014 – $223 million) related to certain assets in the Oil Sands segment following a review of repurpose options due to previously revised growth strategies
in the fourth quarter of 2015.
- (3)
- Adjustments to the company's deferred income taxes from a 12% decrease in the U.K. tax rate on oil and gas profits from the
North Sea in the first quarter of 2015 of $406 million, and a 2% increase in the Alberta corporate income tax rate in the second quarter of 2015 of
$423 million.
- (4)
- After-tax gain related to the sale of the company's Wilson Creek natural gas assets in the E&P segment in the third quarter of 2014
and the after-tax gain related to the sale of the company's share of certain assets and liabilities of Pioneer Energy in the Refining and Marketing segment in the second quarter
of 2015.
- (5)
- Restructuring charges related to cost reduction initiatives in the Corporate segment recorded in the first quarter
of 2015.
- (6)
- Business interruption insurance proceeds recorded in the first quarter of 2015 for the Terra Nova asset in the
E&P segment.
- (7)
- Reserves redetermination of 1.2 million barrels of oil receivable recorded in the second quarter of 2014 related to an
interest in a Norwegian asset that Suncor previously owned.
- (8)
- Represents a current income tax and associated interest charge recorded in the third quarter of 2014 related to the timing of tax depreciation deductions taken on certain capital expenditures incurred in a prior period in the Oil Sands segment.
Corporate Guidance
Suncor has reduced its capital guidance for 2016 to a range of $6.0 to $6.5 billion from $6.7 to $7.3 billion issued on November 17, 2015, in part due to the deferral of Firebag planned maintenance to 2017.
The following 2016 full year outlook assumptions have also been adjusted: Brent at Sullom Voe to US$40/bbl from US$55/bbl, WTI at Cushing to US$39/bbl from US$50/bbl, WCS at Hardisty to US$26/bbl from US$35/bbl, and Cdn/US exchange rate from $0.75 to $0.70. For further details and advisories regarding Suncor's 2016 corporate guidance, see suncor.com/guidance.
Non-GAAP Financial Measures
Operating (loss) earnings and Oil Sands cash operating costs are defined in the Non-GAAP Financial Measures Advisory section of the Quarterly Report and reconciled to GAAP measures in the Consolidated Financial Information and Segment Results and Analysis sections of the Quarterly Report. Cash flow from operations and free cash flow are defined and reconciled to GAAP measures in the Non-GAAP Financial Measures Advisory section of the Quarterly Report. These non-GAAP financial measures are included because management uses this information to analyze business performance, leverage and liquidity. These non-GAAP measures do not have any standardized meaning and therefore are unlikely to be comparable to similar measures presented by
other companies and should not be considered in isolation or as a substitute for measures of performance prepared in accordance with GAAP.
Legal Advisory – Forward-Looking Information
This news release contains certain forward-looking information and forward-looking statements (collectively referred to herein as "forward-looking statements") within the meaning of applicable Canadian and U.S. securities laws. Forward-looking statements are based on Suncor's current expectations, estimates, projections and assumptions that were made by the company in light of its information available at the time the statement was made and consider Suncor's experience and its perception of historical trends, including expectations and assumptions concerning: the accuracy of reserves and resources estimates; commodity prices and interest and foreign exchange rates; capital efficiencies and cost savings; applicable royalty rates and tax laws; future production rates; the sufficiency of budgeted capital expenditures in carrying out planned activities; the availability and cost of labour and services; and the receipt, in a timely manner, of regulatory and third-party approvals. In addition, all other statements and information about Suncor's strategy for growth, expected and future expenditures or investment decisions, commodity prices, costs, schedules, production volumes, operating and financial results and the expected impact of future commitments are forward-looking statements. Some of the forward-looking statements and information may be identified by words like "expects", "anticipates", "will", "estimates", "plans", "scheduled", "intends", "believes", "projects", "indicates", "could", "focus", "vision", "goal", "outlook", "proposed", "target", "objective", "continue", "should", "may" and similar expressions.
Forward-looking statements in this news release include references to: Suncor's belief it is well positioned to weather the current low crude oil price environment; Suncor's commitment to add shareholder value and invest in long-term profitable growth in its core asset areas, while maintaining a strong financial position; Suncor's belief that working with the operator it can drive real improvements in Syncrude's performance with a larger ownership interest, creating value for its shareholders; the reversal of Enbridge's Line 9 is expected to provide Suncor with the flexibility to supply the Montreal refinery with a full slate of inland-priced crude; the expectation that the climate plan will provide certainty on the GHG costs for Suncor while limiting oil sands emissions will force companies to ensure only the most profitable and efficient projects are developed; Suncor's growth projects, including: (i) statements around the Fort Hills project, which is expected to deliver approximately 91,000 bbls/d of bitumen to Suncor following the closing of the acquisition of an additional 10% working interest in Fort Hills, with first oil expected in the fourth quarter of 2017 and 90% of capacity planned to be reached within twelve months thereafter, and (ii) statements around Hebron first oil expected in late 2017; exploration drilling at the deepwater Shelburne Basin offshore Nova Scotia will continue during 2016; the company's anticipated capital guidance range for 2016 of $6.0 to $6.5 billion and market assumptions for oil prices and the Cdn/US exchange rate; and the capital spending reduction is not anticipated to impact the company's near term production targets.
Forward-looking statements and information are not guarantees of future performance and involve a number of risks and uncertainties, some that are similar to other oil and gas companies and some that are unique to Suncor. Suncor's actual results may differ materially from those expressed or implied by its forward-looking statements, so readers are cautioned not to place undue reliance on them.
The Quarterly Report and Suncor's Annual Information Form, Form 40-F and Annual Report to Shareholders, each dated February 26, 2015, and other documents it files from time to time with securities regulatory authorities describe the risks, uncertainties, material assumptions and other factors that could influence actual results and such factors are incorporated herein by reference. Copies of these documents are available without charge from Suncor at 150 6th Avenue S.W., Calgary, Alberta T2P 3E3, by calling 1-800-558-9071, or by email request to [email protected] or by referring to the company's profile on SEDAR at sedar.com or EDGAR at sec.gov. Except as required by applicable securities laws, Suncor disclaims any intention or obligation to publicly update or revise any forward-looking statements, whether as a result of new information, future events or otherwise.
Legal Advisory – BOEs
Certain natural gas volumes have been converted to barrels of oil equivalent (boe) on the basis of one barrel to six thousand cubic feet. Any figure presented in boe may be misleading, particularly if used in isolation. A conversion ratio of one bbl of crude oil or natural gas liquids to six thousand cubic feet of natural gas is based
on an energy equivalency conversion method primarily applicable at the burner tip and does not represent a value equivalency at the wellhead. Given that the value ratio based on the current price of crude oil as compared to natural gas is significantly different from the energy equivalency of 6:1, utilizing a conversion on a 6:1 basis may be misleading as an indication of value.
Suncor Energy is Canada's leading integrated energy company. Suncor's operations include oil sands development and upgrading, conventional and offshore oil and gas production, petroleum refining, and product marketing under the Petro-Canada brand. A member of Dow Jones Sustainability indexes, FTSE4Good and CDP, Suncor is working to responsibly develop petroleum resources while also growing a renewable energy portfolio. Suncor is listed on the UN Global Compact 100 stock index and the Corporate Knights' Global 100. Suncor's common shares (symbol: SU) are listed on the Toronto and New York stock exchanges.
– 30 –
For more information about Suncor visit our web site at suncor.com, follow us on Twitter @SuncorEnergy or come and See what Yes can do.
A full copy of Suncor's fourth quarter 2015 Report to Shareholders and the financial statements and notes (unaudited) can be downloaded at suncor.com/financialreporting.
To listen to the conference call discussing Suncor's fourth quarter results, visit suncor.com/webcasts.
Media
inquiries:
403-296-4000
[email protected]
Investor
inquiries:
800-558-9071
[email protected]
EXHIBIT 99.2 News release dated February 3, 2016, Suncor Energy reports fourth quarter results
Serious News for Serious Traders! Try StreetInsider.com Premium Free!
You May Also Be Interested In
- Schneider Electric Releases All-In-One Battery Energy Storage System for Microgrids
- Suncor Energy (SU:CN) (SU) PT Raised to Cdn$75 at National Bank Financial
- PMD Device Solutions Publishes 2023 Annual Report
Create E-mail Alert Related Categories
SEC FilingsSign up for StreetInsider Free!
Receive full access to all new and archived articles, unlimited portfolio tracking, e-mail alerts, custom newswires and RSS feeds - and more!
