

Form 6-K PLATINUM GROUP METALS For: Nov 25
 Tweet
Tweet Share
Share�
�
UNITED STATES
SECURITIES AND EXCHANGE COMMISSION
Washington, D.C. 20549
�
FORM�6-K
�
Report of Foreign Private Issuer
Pursuant to Rule�13a-16 or 15d-16
of the Securities Exchange Act of 1934
�
Commission File Number: 001-33562
�
For the month of: November, 2014
�
PLATINUM GROUP METALS LTD.
�
Suite�788 � 550 Burrard Street, Vancouver BC, V6C 2B5, CANADA
Address of Principal Executive Office
�
Indicate by check mark whether the registrant files or will file annual reports under cover:
�
Form�20-F o �Form�40-F x
�
Indicate by check mark if the registrant is submitting the Form�6-K in paper as permitted by Regulation S-T Rule�101(b)(1): o
�
Indicate by check mark if the registrant is submitting the Form�6-K in paper as permitted by Regulation S-T Rule�101(b)(7): o
�
�
�
�
SIGNATURE
�
Pursuant to the requirements of the Securities Exchange Act of 1934, the registrant has duly caused this report to be signed on its behalf by the undersigned, thereunto duly authorized.
�
|
Date: |
November�25, 2014 |
� |
�R. Michael Jones� |
|
� |
R. MICHAEL JONES | ||
|
� |
DIRECTOR�& CEO | ||
�
�
EXHIBIT�INDEX
�
|
Exhibit |
� |
Description |
|
� |
� |
� |
|
99.1 |
� |
Technical Report for the Update on Exploration Drilling at the Waterberg Joint Venture and Waterberg Extension Projects, South Africa (Latitude 23� 14� 11�S, Longitude 28� 54� 42�E) with an exploration drilling update effective date of October�21, 2014 and a mineral resource estimate effective date of June�12, 2014* |
|
99.2 |
� |
Consent of Qualified Person dated November�24, 2014 |
|
99.3 |
� |
Consent of Qualified Person dated November�24, 2014 |
�
* Incorporated by reference into the Company�s preliminary offering circular dated November�3, 2014.
�
Exhibit�99.1
�

�
Platinum Group Metals Ltd
�
Technical Report for the Update on Exploration
Drilling at the Waterberg Joint Venture and
Waterberg Extension Projects, South Africa
(Latitude 23� 14� 11�S, Longitude 28� 54� 42�E)
�
Report Date:������������������������������������������������������������������������������������������������������������������������������������������������������������������������������������������������� 24 November�2014
Exploration Drilling Update Effective Date:����������������������������� 21 October�2014
Mineral Resource Estimate Effective Date:������������������������������� 12 June�2014
�
Qualified Person:�������������������������������������������������� Kenneth Lomberg (Pr.Sci.Nat.)
����������������������������������������������������������������������������������������������������������������������������������������������� Alan Goldschmidt (Pr.Sci.Nat.)
�

�
�
Coffey Mining South Africa (Pty) Ltd
�
|
Author(s): |
� |
� |
|
� |
� |
� |
|
Kenneth Lomberg |
Senior Principal |
B.Sc. (Hons) Geology, B.Com. M.Eng. Pr.Sci.Nat., FGSSA |
|
� |
� |
� |
|
Alan Goldschmidt |
Senior Consultant |
B.Sc.(Hons) Geology, GDE, Pr.Sci.Nat., MGSSA |
|
� |
� |
� |
|
Date: |
24 November�2014 |
� |
|
� |
� |
� |
|
Project Number: |
JWAT05 |
� |
�
Document Review and Sign Off
�
|
|
� |
|
|
Alan Goldschmidt |
� |
Kenneth Lomberg |


�
|
Technical Report for the Update on Exploration Drilling at the for Waterberg Joint Venture and |
� |
�
�
Coffey Mining South Africa (Pty) Ltd
�
Date and Signature Page
�
This report titled �Technical Report for the Update on Exploration Drilling at the for Waterberg Joint Venture and Waterberg Extension Projects, South Africa� with an effective date of 21 October 2014 was prepared on behalf of Platinum Group Metals (Pty) Ltd by Kenneth Lomberg and Alan Goldschmidt and signed:
�
Dated at Roodepoort, South Africa, this 24 November�2014
�
|
|
� |
|
Kenneth Lomberg, B.Sc.(Hons) Geology, B.Com., M.Eng., Pr.Sci.Nat., FGSSA. |
� |
|
� |
� |
|
|
� |
|
Alan Goldschmidt, B.Sc.(Hone) Geology, Pr.Sci.Nat., MGSSA |
� |

�
|
Technical Report for the Update on Exploration Drilling at the for Waterberg Joint Venture and |
� |
�
�
Coffey Mining South Africa (Pty) Ltd
�
Table of Contents
�
|
1 |
Summary |
1 | ||
|
� |
� |
� |
� | |
|
� |
1.1 |
Introduction |
1 | |
|
� |
� |
� |
� | |
|
� |
1.2 |
Project Area and Location |
1 | |
|
� |
� |
� |
� | |
|
� |
1.3 |
Geological Setting, Deposit Type and Mineralization |
2 | |
|
� |
� |
� |
� | |
|
� |
1.4 |
Local Geology |
3 | |
|
� |
� |
� |
� | |
|
� |
1.5 |
Exploration Status |
4 | |
|
� |
� |
� |
� | |
|
� |
� |
1.5.1 |
Drilling |
7 |
|
� |
� |
� |
� |
� |
|
� |
� |
1.5.2 |
Sample Preparation |
8 |
|
� |
� |
� |
� |
� |
|
� |
� |
1.5.3 |
Analysis |
8 |
|
� |
� |
� |
� |
� |
|
� |
� |
1.5.4 |
Quality Control and Quality Assurance |
9 |
|
� |
� |
� |
� | |
|
� |
1.6 |
Mineral Resources |
9 | |
|
� |
� |
� |
� | |
|
� |
1.7 |
Interpretation and Conclusions |
12 | |
|
� |
� |
� |
� | |
|
2 |
Introduction |
15 | ||
|
� |
� |
� |
� | |
|
� |
2.1 |
Scope of the Report |
15 | |
|
� |
� |
� |
� | |
|
� |
2.2 |
Principal Sources of Information |
15 | |
|
� |
� |
� |
� | |
|
� |
2.3 |
Qualifications and Experience |
15 | |
|
� |
� |
� |
� | |
|
� |
2.4 |
Independence |
16 | |
|
� |
� |
� |
� | |
|
3 |
Reliance on Other Experts |
17 | ||
|
� |
� |
� | ||
|
4 |
Property Description and Location |
18 | ||
|
� |
� |
� |
� | |
|
� |
4.1 |
Property Description and Location |
18 | |
|
� |
� |
� |
� | |
|
� |
4.2 |
Mining Tenure |
20 | |
|
� |
� |
� |
� | |
|
� |
4.3 |
Licence Status |
21 | |
|
� |
� |
� |
� | |
|
� |
4.4 |
Holdings Structure |
25 | |
|
� |
� |
� |
� | |
|
� |
4.5 |
Royalties and Agreements |
26 | |
|
� |
� |
� |
� | |
|
� |
4.6 |
Environmental Liabilities |
26 | |
|
� |
� |
� |
� | |
|
� |
4.7 |
Legal Access |
26 | |
|
� |
� |
� |
� | |
|
5 |
Accessibility, Climate, Local Resources,�Infrastructure and Physiography |
27 | ||
|
� |
� |
� |
� | |
|
� |
5.1 |
Access |
27 | |
|
� |
� |
� |
� | |
|
� |
5.2 |
Climate |
27 | |
|
� |
� |
� |
� | |
|
� |
5.3 |
Physiography |
27 | |
|
� |
� |
� |
� | |
|
� |
5.4 |
Local Resources and Infrastructure |
28 | |
|
� |
� |
� |
� | |
|
6 |
History |
29 | ||
|
� |
� |
� |
� | |
|
� |
6.1 |
Ownership History |
29 | |
�
|
Technical Report for the Update on Exploration Drilling at the for Waterberg Joint Venture and |
� |
�
�
Coffey Mining South Africa (Pty) Ltd
�
|
� |
6.2 |
Exploration History |
29 | |
|
� |
� |
� |
� | |
|
� |
6.3 |
Mineral Resource History � Waterberg JV Project |
30 | |
|
� |
� |
� |
� | |
|
� |
� |
6.3.1 |
September�2012 |
30 |
|
� |
� |
� |
� |
� |
|
� |
� |
6.3.2 |
February�2013 |
31 |
|
� |
� |
� |
� |
� |
|
� |
� |
6.3.3 |
September�2013 |
32 |
|
� |
� |
� |
� | |
|
� |
6.4 |
Production History |
33 | |
|
� |
� |
� |
� | |
|
7 |
Geological Setting and Mineralization |
34 | ||
|
� |
� |
� |
� | |
|
� |
7.1 |
Regional and Local Setting |
34 | |
|
� |
� |
� |
� | |
|
� |
� |
7.1.1 |
Bushveld Complex Stratigraphy |
35 |
|
� |
� |
� |
� |
� |
|
� |
� |
7.1.2 |
The Northern Limb |
37 |
|
� |
� |
� |
� |
� |
|
� |
� |
7.1.3 |
The Platreef and its Mineralization |
40 |
|
� |
� |
� |
� | |
|
� |
7.2 |
Waterberg Group /Bushveld Complex Age Relationship |
41 | |
|
� |
� |
� |
� | |
|
� |
7.3 |
Project Geology |
42 | |
|
� |
� |
� |
� | |
|
� |
� |
7.3.1 |
Stratigraphy |
48 |
|
� |
� |
� |
� |
� |
|
� |
� |
7.3.2 |
Structure |
50 |
|
� |
� |
� |
� | |
|
� |
7.4 |
Mineralized Zones |
50 | |
|
� |
� |
� |
� | |
|
8 |
Deposit Types |
54 | ||
|
� |
� |
� | ||
|
9 |
Exploration |
55 | ||
|
� |
� |
� |
� | |
|
� |
9.1 |
Current Exploration |
55 | |
|
� |
� |
� |
� | |
|
� |
� |
9.1.1 |
Surface Mapping |
55 |
|
� |
� |
� |
� |
� |
|
� |
� |
9.1.2 |
Geochemical Soil Sampling |
56 |
|
� |
� |
� |
� | |
|
� |
9.2 |
Geophysical Surveys |
56 | |
|
� |
� |
� |
� | |
|
� |
� |
9.2.1 |
Waterberg JV Project � Initial survey |
56 |
|
� |
� |
� |
� |
� |
|
� |
� |
9.2.2 |
Extended Airborne Gravity Gradient and Magnetics |
57 |
|
� |
� |
� |
� |
� |
|
� |
� |
9.2.3 |
Ground Gravity |
62 |
|
� |
� |
� |
� | |
|
� |
9.3 |
Coffey: Technical Review |
62 | |
|
� |
� |
� |
� | |
|
10 |
Drilling |
63 | ||
|
� |
� |
� |
� | |
|
� |
10.1 |
Drilling in 2010 |
63 | |
|
� |
� |
� |
� | |
|
� |
10.2 |
Drilling in 2011 to 2013 |
63 | |
|
� |
� |
� |
� | |
|
� |
10.3 |
Exploration Drilling Status 21 October�2014 |
63 | |
|
� |
� |
� |
� | |
|
� |
10.4 |
Drilling Quality |
67 | |
|
� |
� |
� |
� | |
|
� |
10.5 |
Diamond Core Sampling |
67 | |
|
� |
� |
� |
� | |
|
� |
10.6 |
Sample Recovery |
67 | |
|
� |
� |
� |
� | |
|
� |
10.7 |
Sample Quality |
67 | |
|
� |
� |
� |
� | |
|
� |
10.8 |
Interpretation of Results |
67 | |
|
� |
� |
� |
� | |
|
� |
10.9 |
Coffey: Technical Review |
72 | |
|
� |
� |
� |
� | |
|
11 |
Sample Preparation, Analyses and Security |
73 | ||
�
|
Technical Report for the Update on Exploration Drilling at the for Waterberg Joint Venture and |
� |
�
�
Coffey Mining South Africa (Pty) Ltd
�
|
� |
11.1 |
Core Handling |
73 | |
|
� |
� |
� |
� | |
|
� |
11.2 |
Core Logging and Identification of Mineralized Layers |
73 | |
|
� |
� |
� |
� | |
|
� |
11.3 |
Sampling Methodology |
74 | |
|
� |
� |
� |
� | |
|
� |
11.4 |
Sample Quality and Sample Bias |
76 | |
|
� |
� |
� |
� | |
|
� |
11.5 |
Supervision of Sample Preparation |
76 | |
|
� |
� |
� |
� | |
|
� |
11.6 |
Sample Preparation |
77 | |
|
� |
� |
� |
� | |
|
� |
11.7 |
Sample Security |
77 | |
|
� |
� |
� |
� | |
|
� |
11.8 |
Chain of Custody |
78 | |
|
� |
� |
� |
� | |
|
� |
11.9 |
Analytical Procedure |
78 | |
|
� |
� |
� |
� | |
|
� |
11.10 |
Sample Preparation |
78 | |
|
� |
� |
� |
� | |
|
� |
11.11 |
Precious Metal Determination |
78 | |
|
� |
� |
� |
� | |
|
� |
11.12 |
Base metals Determination |
79 | |
|
� |
� |
� |
� | |
|
� |
11.13 |
Laboratory QA/QC |
79 | |
|
� |
� |
� |
� | |
|
� |
11.14 |
Quality Assurance and Quality Control (QA/QC) Procedures and Results |
79 | |
|
� |
� |
� |
� | |
|
� |
11.15 |
Analytical Quality Assurance and Quality Control Data |
80 | |
|
� |
� |
� |
� | |
|
� |
11.16 |
Waterberg JV Project Area |
83 | |
|
� |
� |
� |
� | |
|
� |
11.17 |
Waterberg Extension Project Area |
86 | |
|
� |
� |
� |
� | |
|
� |
11.18 |
Recommendations and Conclusion |
88 | |
|
� |
� |
� |
� | |
|
� |
11.19 |
Adequacy of Procedures |
89 | |
|
� |
� |
� |
� | |
|
� |
11.20 |
Coffey: Technical Review |
89 | |
|
� |
� |
� |
� | |
|
12 |
Data Verification |
90 | ||
|
� |
� |
� |
� | |
|
� |
12.1 |
Accurate Placement and Survey of Borehole Collars |
90 | |
|
� |
� |
� |
� | |
|
� |
12.2 |
Downhole Surveys |
91 | |
|
� |
� |
� |
� | |
|
13 |
Mineral Processing and Metallurgical Testing |
92 | ||
|
� |
� |
� | ||
|
14 |
Mineral Resource Estimates |
94 | ||
|
� |
� |
� |
� | |
|
� |
14.1 |
Methodology |
95 | |
|
� |
� |
� |
� | |
|
� |
� |
14.1.1 |
T - Zone Estimation |
95 |
|
� |
� |
� |
� |
� |
|
� |
� |
14.1.2 |
F - Zone Estimation |
96 |
|
� |
� |
� |
� | |
|
� |
14.2 |
Density |
101 | |
|
� |
� |
� |
� | |
|
� |
14.3 |
Compositing |
101 | |
|
� |
� |
� |
� | |
|
� |
14.4 |
Descriptive Statistics: Composites |
101 | |
|
� |
� |
� |
� | |
|
� |
14.5 |
Rhodium Analysis |
102 | |
|
� |
� |
� |
� | |
|
� |
14.6 |
Outlier Analysis |
104 | |
|
� |
� |
� |
� | |
|
� |
14.7 |
Block Model Development |
104 | |
|
� |
� |
� |
� | |
|
� |
� |
14.7.1 |
T - Zone |
104 |
|
� |
� |
� |
� |
� |
|
� |
� |
14.7.2 |
F � Zone Units |
104 |
|
� |
� |
� |
� | |
|
� |
14.8 |
Mineral Resource Estimate |
105 | |
|
� |
� |
� |
� | |
�
|
Technical Report for the Update on Exploration Drilling at the for Waterberg Joint Venture and |
� |
�
�
Coffey Mining South Africa (Pty) Ltd
�
|
� |
� |
14.8.1 |
T � Zone |
105 |
|
� |
� |
� |
� |
� |
|
� |
� |
14.8.2 |
F � Zone |
106 |
|
� |
� |
� |
� | |
|
� |
14.9 |
Search Criteria |
107 | |
|
� |
� |
� |
� | |
|
� |
14.10 |
Cut-off Grades |
107 | |
|
� |
� |
� |
� | |
|
� |
14.11 |
Geological Loss |
108 | |
|
� |
� |
� |
� | |
|
� |
14.12 |
Classification |
110 | |
|
� |
� |
� |
� | |
|
� |
14.13 |
Mineral Resource Reporting |
111 | |
|
� |
� |
� |
� | |
|
15 |
Adjacent Properties |
114 | ||
|
� |
� |
� |
� | |
|
� |
15.1 |
The Pan Palladium/Impala Platinum JV |
114 | |
|
� |
� |
� |
� | |
|
� |
15.2 |
Mogalakwena Mine |
114 | |
|
� |
� |
� |
� | |
|
� |
15.3 |
Akanani Project |
114 | |
|
� |
� |
� |
� | |
|
� |
15.4 |
Boikgantsho Project |
114 | |
|
� |
� |
� |
� | |
|
� |
15.5 |
Harriet�s Wish and Aurora Projects |
115 | |
|
� |
� |
� |
� | |
|
� |
15.6 |
Platreef Project (Ivanplats) |
115 | |
|
� |
� |
� |
� | |
|
16 |
Other Relevant Data and Information |
116 | ||
|
� |
� |
� | ||
|
17 |
Interpretation and Conclusions |
117 | ||
|
� |
� |
� | ||
|
18 |
Recommendations |
119 | ||
|
� |
� |
� | ||
|
19 |
References |
120 | ||
�
|
Technical Report for the Update on Exploration Drilling at the for Waterberg Joint Venture and |
� |
�
�
Coffey Mining South Africa (Pty) Ltd
�
List of Tables
�
|
Table 1.6_1 � Waterberg Project Mineral Resource Estimate (12 June�2014) |
11 |
|
� |
� |
|
Table 4.2_1 � Summary of Mineral Exploration and Mining Rights (South Africa) |
20 |
|
� |
� |
|
Table 4.3_1 � Summary of Waterberg Extension Project Prospecting Rights |
22 |
|
� |
� |
|
Table 6.3.1_1 � Waterberg Project Mineral Resource Estimate (1 September�2012) |
31 |
|
� |
� |
|
Table 6.3.2_1 � Waterberg Project Mineral Resource Estimate (1 February�2013) |
32 |
|
� |
� |
|
Table 6.3.3_1 � Waterberg Project Mineral Resource Estimate (2 September�2013) |
33 |
|
� |
� |
|
Table 10.8_1 � Recent T-Zone intercepts for the Waterberg JV Project Area |
68 |
|
� |
� |
|
Table 10.8_2 � Recent F-Zone intercepts for the Waterberg JV Project Area |
69 |
|
� |
� |
|
Table 10.8_3 � Recent F-Zone intercepts for the Waterberg Extension Project Area |
71 |
|
� |
� |
|
Table 11.15_1 � Summary of the Number of Control Samples Used in the Waterberg JV Project Area |
82 |
|
� |
� |
|
Table 11.15_2 � Summary of the Number of Control Samples Used in the Extension Project Area |
82 |
|
� |
� |
|
Table 11.15_3 � Summary of Certified Reference Standards Used |
83 |
|
� |
� |
|
Table 14_1 � Summary of the Mineral Resource Estimate Data |
94 |
|
� |
� |
|
Table 14.5_1 � Correlation Coefficient for Rh against other assayed elements |
102 |
|
� |
� |
|
Table 14.5_2 � Correlation Factors for Rh |
104 |
|
� |
� |
|
Table 14.7.1_1 � Summary of the Block Model details |
104 |
|
� |
� |
|
Table 14.7.2_1 � Summary of Block Model Details |
105 |
|
� |
� |
|
Table 14.9_1 � Estimation search parameters (F � Layers) |
107 |
|
� |
� |
|
Table 14.12_1 � Confidence Levels of Key Criteria |
110 |
|
� |
� |
|
Table 14.13_1 � Waterberg Project Mineral Resource Estimate F - Zone (12 June�2014) |
112 |
|
� |
� |
|
Table 14.13_2 � Waterberg Project Mineral Resource Estimate (12 June�2014) |
113 |
�
|
Technical Report for the Update on Exploration Drilling at the for Waterberg Joint Venture and |
� |
�
�
Coffey Mining South Africa (Pty) Ltd
�
List of Figures
�
|
Figure 1.5_1 � Borehole Location and Geology of the Waterberg JV and Extension Projects |
6 |
|
� |
� |
|
Figure 4.1_1 � Location of the Waterberg Project Properties on the Bushveld Complex |
19 |
|
� |
� |
|
Figure 4.3_1 � Locations of the Waterberg Project Properties |
23 |
|
� |
� |
|
Figure 4.3_2 � Location of the Waterberg Project Prospecting Rights |
24 |
|
� |
� |
|
Figure 4.4_1 � Schematic Diagram of the Holdings of the Waterberg Project |
25 |
|
� |
� |
|
Figure 5.3_1 � Photograph looking towards the Eastern side of the Waterberg Project |
28 |
|
� |
� |
|
Figure 7.1_1 � Geological map of the Bushveld Complex showing the location of the Waterberg Projects |
35 |
|
� |
� |
|
Figure 7.1.1_1 � Generalised Stratigraphic Column of Rustenburg Layered Suite |
37 |
|
� |
� |
|
Figure 7.1.2_1 � General Geology of the northern limb of the Bushveld Complex |
38 |
|
� |
� |
|
Figure 7.1.2_2 �Geology of the northern limb showing the Various Footwall Lithologies |
39 |
|
� |
� |
|
Figure 7.3_1 � Geology of the Waterberg Project |
43 |
|
� |
� |
|
Figure 7.3_2 � Section�Showing Geology at Waterberg Project |
44 |
|
� |
� |
|
Figure 7.3_3 � Geology of the Waterberg Extension Project |
47 |
|
� |
� |
|
Figure 7.3.1_1 � General Stratigraphy of the Waterberg Projects |
49 |
|
� |
� |
|
Figure 7.4_1 � Stratigraphy of the Mineralised Layers |
51 |
|
� |
� |
|
Figure 7.4_2 � Individual Units of the F - Zone |
53 |
|
� |
� |
|
Figure 9.1.2_1 � Locations of Geochemical Sampling and Geophysical Traverses |
58 |
|
� |
� |
|
Figure 9.2.2_1 � Airborne Gradient Gravity and Magnetic Survey Flight Lines |
59 |
|
� |
� |
|
Figure 9.2.2_2 �Airborne Gradient Gravity Plot with Interpreted Bushveld Complex Edge |
60 |
|
� |
� |
|
Figure 9.2.2_3 � Airborne Total Field Magnetics Plot with Interpreted Bushveld Complex Edge |
61 |
|
� |
� |
|
Figure 10.3_1 � Location of Boreholes on the Waterberg JV Project |
65 |
|
� |
� |
|
Figure 10.3_2 � Location of Boreholes on the Waterberg Extension Project |
66 |
|
� |
� |
|
Figure 11.1_1 � Photograph of an Example of Borehole Marking |
74 |
|
� |
� |
|
Figure 11.3_1 � Photograph of Core Cutting |
75 |
|
� |
� |
|
Figure 11.3_2 � Photograph of an Example of Sampling Methodology |
76 |
|
� |
� |
|
Figure 12.1_1 � Permanent Borehole Beacon |
90 |
|
� |
� |
|
Figure 14.1.1_1 � A Geological Interpretation for the T - Zone |
96 |
|
� |
� |
|
Figure 14.1_1 � Area Underlain by the T- Layer and F - Zone |
98 |
�
|
Technical Report for the Update on Exploration Drilling at the for Waterberg Joint Venture and |
� |
�
�
Coffey Mining South Africa (Pty) Ltd
�
|
Figure 14.1_2 � Isometric views of the Structural Model for the T- Layer and F - Zone |
100 |
|
� |
� |
|
Figure 14.4_1 � Summary of Statistics for the Composites of Each Layer |
102 |
|
� |
� |
|
Figure 14.4_2 � Summary of Statistics for the Composites of Each Layer |
102 |
|
� |
� |
|
Figure 14.5_1 � Correlation of Rh against Pt and Pd |
103 |
|
� |
� |
|
Figure 14.11_1 � Area of Geological Loss for the T- Zone and F - Zones |
109 |
�
List of Appendices
�
|
Appendix A � Authors Certificate |
1 |
�
|
Technical Report for the Update on Exploration Drilling at the for Waterberg Joint Venture and |
� |
�
�
Coffey Mining South Africa (Pty) Ltd
�
1������������������������������������������������� SUMMARY
�
1.1��������������������������������������� Introduction
�
Coffey Mining (South Africa) Pty Limited (Coffey) has been requested by Platinum Group Metals� (Pty) Ltd (PTM), on behalf of Platinum Group Metals Ltd, the issuer, to complete an Independent Technical Report on the Exploration Drilling supporting the October�21, 2014 public disclosure of the Updated drilling results for the at the Waterberg Joint Venture (JV) Project and the Waterberg Extension Project.� These are two adjoining projects targeting a previously unknown extension to the northern limb of the Bushveld Complex that may have the potential for Platinum Group Metals (PGMs), gold and base metals (Cu, Ni).� This report complies with disclosure and reporting requirements set forth in the Toronto Stock Exchange Manual, National Instrument 43-101 Standards of Disclosure for Mineral Project (NI 43-101), Companion Policy 43-101CP to NI 43-101, and Form�43-101F1 of NI 43-101.
�
This report reviews the geology, the exploration activities and states the most recent mineral resource estimation on the Waterberg JV Project and Waterberg Extension Project (Effective Date: 12 June-2014).� The report provides an update of the exploration activities completed subsequent to the last filed technical report on the resource estimate dated 12 June-2014 up to the effective date of 21 October- 2014 to correspond to the public disclosure up to that date.
�
1.2��������������������������������������� Project Area and Location
�
The Waterberg JV Project and Waterberg Extension Project are adjoining Projects that cover an area along the strike length of the previously unknown northward extension of the Bushveld Complex.
�
Waterberg JV Project
�
The Waterberg Project is the result of a regional target initiative of PTM.� The area was targeted based on detailed geophysical, geochemical and geological work that indicated potential for a package of Bushveld Complex rocks under the Waterberg Group cover rocks.� The project area is along trend, off the northern end of the mapped northern limb of the Bushveld Complex in South Africa that indicated potential for a package of Bushveld Complex rocks under the Waterberg formation cover rocks.
�
The Waterberg JV Project is made up of four prospecting rights covering an area of 25,465ha.� PTM has prospecting rights which allow it to apply for the conversion of the prospecting right into a mining right within the renewal period of three years.
�
|
Technical Report for the Update on Exploration Drilling at the for Waterberg Joint Venture and |
� |
|
Waterberg Extension Projects South Africa � 24 November�2014 |
� |
�
�
Coffey Mining South Africa (Pty) Ltd
�
Waterberg Extension Project
�
The southern boundary of the Waterberg Extension Project is located some 85km north of the town of Mokopane, Limpopo Province.� The project currently consists of five prospecting rights.� The area of the prospecting rights covers 86,417ha and extends some 42km from north to south and 42km from east to west.
�
1.3��������������������������������������� Geological Setting, Deposit Type and Mineralization
�
PGM-dominated deposits occur in large layered intrusions, such as the Bushveld Complex (South Africa), the Stillwater Complex (Montana) and the Great Dyke (Zimbabwe).� The Waterberg JV and Extension Projects are located on the northern limb of the Bushveld Complex.� The 2,060�million year old Bushveld Complex, with a total extent of approximately 66,000km2, is the world�s largest zoned mafic intrusions.� The mafic rocks of the Bushveld Complex host zones rich in PGMs, chromium and vanadium, and constitute the largest known resource of these metals.� In addition, nickel and copper are generally associated with the PGMs and are significant by-products.
�
The mafic rocks are collectively termed the Rustenburg Layered Suite�(RLS) and have been divided into five zones known as the Marginal, Lower, Critical, Main and Upper Zones.
�
The Critical Zone is characterised by regular rhythmic layering of cumulus chromite within pyroxenites, anorthosites, norites and olivine-rich rocks.� It hosts virtually all the economic mineralization encountered in the Bushveld Complex.
�
The first economically significant cycle from a PGM perspective is the UG2 Chromitite Layer.� The two uppermost cycles of the Critical Zone are the Merensky and Bastard cycles.� The former is of great economic importance as it contains at its base the PGM-bearing Merensky Reef.� In the western part of the Bushveld Complex, several metres below the Merensky Reef, a unit known as the Pseudo Reef occurs that is known to be mineralized with PGMs.
�
In the northern limb, the Platreef mineralization occurs proximal to the basal contact of the Bushveld Complex with the country rock, typically as a thicker zone (up to 30m thick) containing disseminated sulphides.� Where the Bushveld Complex is in contact with the Archaean granite and sediments of the Transvaal Supergroup floor rocks, the Platreef is developed.� The contact between the RLS and footwall rocks in the northern limb is transgressive, with the Platreef in contact with progressively older rocks of different lithologies from south to north.
�
The Platreef is a series of pyroxenites and norites, containing xenoliths/rafts of footwall rocks.� It is irregularly mineralized with PGM, Cu and Ni.� The Platreef (senso stricto) has a strike extent of some 30km, whereas Platreef-style mineralization occurs over the 110km strike length of the northern limb (Kinnaird et al, 2005).� The Platreef varies from 400m thick in the south of the
�
|
Technical Report for the Update on Exploration Drilling at the for Waterberg Joint Venture and |
� |
|
Waterberg Extension Projects South Africa � 24 November�2014 |
� |
�
�
Coffey Mining South Africa (Pty) Ltd
�
northern limb to <50m in the north.� The overall strike is northwest or north, with dips 40��45� to the west at surface with the dip becoming shallower down dip.� The overall geometry of the southern Platreef appears to have been controlled by irregular floor topography.
�
The Waterberg JV Project and Waterberg Extension Project appear to be on strike along an extension of the Bushveld Complex.� The mineralization has a different setting and metal ratio to the Platreef.
�
1.4��������������������������������������� Local Geology
�
The drilling programmes undertaken by PTM on the Waterberg JV Project and Waterberg Extension Project have identified an extension to the Bushveld Complex beneath the sedimentary rocks of the Proterozoic Waterberg Group which in areas is covered by a veneer of Quaternary sand.� Further west, the Waterberg Group thickens to more than 760m and typically displays a downward coarsening with pebble beds and conglomerates towards the base.
�
The PGM mineralization at the Waterberg JV Project and the Waterberg Extension Project is hosted in modified felsic rocks: gabbros and anorthosites as well as in pyroxenites, troctolites, harzburgites and gabbronorites of the Bushveld Complex.� Layers of PGM mineralization are generally accompanied by significant concentrations of base metal sulphides, with pyrrhotite and chalcopyrite being dominant over pentlandite.
�
A geological model was developed for the project area based on the data from the various boreholes, structural interpretation from aerial photographs and geophysics.� A general dip of 34��-�38� towards the northwest is observed from borehole core for the layered units intersected on the Waterberg property within the Bushveld Package.� However, some blocks may be tilted at different angles depending on structural and /or tectonic controls.� Generally the Bushveld package strikes southwest to northeast.
�
The field relationships in the vicinity of the Waterberg JV Project and Waterberg Extension Project were noted to indicate that the Bushveld Complex is unconformably overlain by the sandstones of the Setlaole Formation of the Waterberg Group, which is post-Bushveld in age.� The core drilling undertaken by PTM shows that an angular unconformity exists between the Waterberg Group and underlying Bushveld Complex.� The nature of the relationship between the Waterberg Group and the Bushveld Complex is confirmed as having no bearing on the presence of mineralization in Bushveld Complex.� The mineralization in the Waterberg Project area generally comprises sulphide blebs, net-textured to interstitial sulphides and disseminated sulphides within gabbronorite and norite, pyroxenite, troctolite, harzburgite.
�
The T - Zone occurs within the Main Zone just beneath the contact of the overlaying Upper Zone.� Although the T � Zone consists of numerous mineralized layers, two potential economical layers
�
|
Technical Report for the Update on Exploration Drilling at the for Waterberg Joint Venture and |
� |
|
Waterberg Extension Projects South Africa � 24 November�2014 |
� |
�
�
Coffey Mining South Africa (Pty) Ltd
�
have been identified, T1- and T2 - Layers.� They are composed mainly of anorthosite, pegmatoidal gabbros, pyroxenite, troctolite, harzburgite, gabbronorite and norite.
�
The F - Zone occurs towards the bottom of the Bushveld Complex in a cyclic unit of olivine rich lithologies.� T his zone consists of alternating units of harzburgite, troctolite and pyroxenites.� The F - Zone has been sub divided into the FH and FP layers.� The FH layer has significantly higher volumes of olivine in contrast with the lower lying FP layer, which is predominately pyroxenite.� The FH layer is further subdivided into six cyclic units chemically identified by their geochemical signature, especially chrome.� The base of these units can also be lithologically identified by a pyroxenite layer.
�
The base of the Bushveld Complex is a mix of the Archaean age Hout River Gneiss Suite�and fine grained pyroxenitic bands.
�
1.5��������������������������������������� Exploration Status
�
The Waterberg JV Project is more advanced in terms of the exploration status and includes an Inferred Mineral Resource estimate.� The majority of the Waterberg Extension Project is at an advanced exploration stage.� However recent drilling on the property Early Dawn, just north of the Waterberg JV Project has established sufficient surface drilling information to confirm continuity of mineralization, hence areas can be classified as an Inferred Mineral Resource.
�
Waterberg JV Project
�
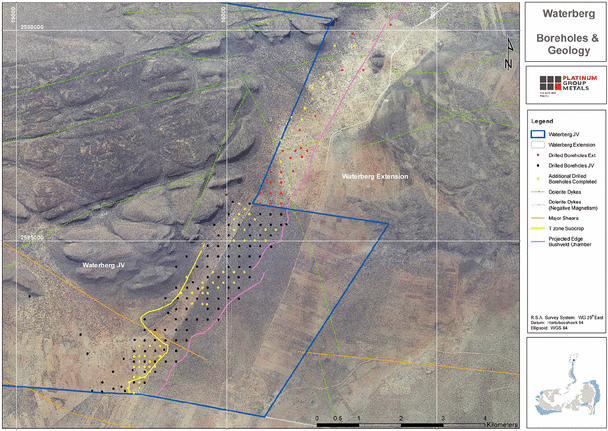
Previous mineral exploration activities were limited due to the extensive sand cover and the understanding that the area was underlain by the Waterberg Group.� Surface mapping has been undertaken but it is noted that most of the area surrounding the Waterberg Mountains is covered by Waterberg sands (Figure 1.5_1).� Mapping in these areas has provided no additional information as the Bushveld Complex is sub outcropped below Waterberg sediments.
�
In March�2010 (two north-south sampling lines) and later during December�2011 and January�2012 (two additional north-south lines), geochemical soil sampling was undertaken.� A total of 601 samples, of which 255 were soil samples, 277 stream sediment samples and 79 rock chip samples, were collected.
�
Approximately 60 lines of geophysical survey for 488 line km using gravity and magnetics were traversed in March�2010.� A second phase of Geophysical Survey was also conducted on the farm Ketting 368LR from August�2011 to September�2011.
�
Anomalous soil results in platinum group metals in areas that were thought, in the regional mapping, to be covered by thick sediments younger than the Bushveld Complex, provided initial interest in the property.� The geochemistry added to the geophysical results which suggested a
�
|
Technical Report for the Update on Exploration Drilling at the for Waterberg Joint Venture and |
� |
|
Waterberg Extension Projects South Africa � 24 November�2014 |
� |
�
�
Coffey Mining South Africa (Pty) Ltd
�
Bushveld Complex extension in the property area, potentially at reasonable depth.� Based on the exploration combined with the target generation, diamond drilling commenced in 2010.� The drilling confirmed the presence of the rocks of the Bushveld Complex.� Exploration has thus been largely driven by drilling.� The relationship between the Bushveld Complex and Waterberg Group is the subject of discussion between PTM and geologists from various universities.� The age of the rocks of the Bushveld rocks relative to the sedimentary cover is not considered critical to the geological model of the mineralized rocks in the Bushveld Complex.
�
|
Technical Report for the Update on Exploration Drilling at the for Waterberg Joint Venture and |
� |
|
Waterberg Extension Projects South Africa � 24 November�2014 |
� |
�
�
Coffey Mining South Africa (Pty) Ltd
�
Figure 1.5_1
Borehole Location and Geology of the Waterberg JV and Extension Projects
�
�
|
Technical Report for the Update on Exploration Drilling at the for Waterberg Joint Venture and |
� |
|
Waterberg Extension Projects South Africa � 24 November�2014 |
� |
�
�
Coffey Mining South Africa (Pty) Ltd
�
Waterberg Extension Project
�
PTM contracted FUGRO Airborne Surveys (Pty) Ltd.� to conduct airborne FALCON� gravity gradiometry and a total field magnetic survey in April�2013.� The target for the surveys was the interpreted edge sub-outcropping of the denser Bushveld Complex to which the Waterberg Group sediments form the regional hanging wall.� The survey was flown on 100m and 200m line spacing and was comprised of 2306.16 line kilometres of Airborne Gravity Gradiometry (AGG) data and 2469.35 line kilometres of magnetic and radiometric data.� The total extent of the survey covered approximately 30km2�of interpreted Bushveld Complex edge within the Waterberg JV Project and Waterberg Extension Project areas.� Modelling of the data suggests that there may be a northeast and north trending continuity to the Bushveld Complex rocks on the Waterberg Extension Project which may have the potential to host PGM mineralization.
�
Later in September�2013 nine ground gravity traverses were completed by Geospec Instruments (Pty) Ltd along roads and tracks.� The survey lines were designed to traverse across the projected edge of the Bushveld Complex on the Waterberg Extension Project in the same area covered by the airborne survey as ground confirmation of the airborne results.� The two surveys were compared and there was acceptable correlation between gravity data sets.� In planning the ground survey, one control line over the known Bushveld Complex edge, at the point where it projected from the adjacent Waterberg JV Project was completed in order to acquire a signature profile over a known source with which to compare the remaining regional lines. �The interpretation of the linked ground gravity profiles suggests that there may be a northeast trending continuity to the Bushveld Complex rocks.� The drilling confirmed the presence of the rocks of the Bushveld Complex.
�
Ground exploration work undertaken includes geological mapping and ground verification of the geology presented in various government and academic papers.� The major faults and South Marginal Zone (SMZ) geology described was confirmed to exist within the property.� Contact relations with the Bushveld Complex were not seen due to the Waterberg cover rock and quaternary sand deposits.
�
1.5.1����������������������������� Drilling
�
Since the declaration of the mineral resource (12June�2014), an additional 71,459m of diamond drilling have been completed at the Waterberg JV and Waterberg Extension combined.� This report updates the technical disclosure of that drilling.
�
The management of the drilling programmes, logging and sampling have been undertaken from the same facility at the town of Marken in Limpopo Province, South Africa.
�
Drilled core is cleaned, de-greased and packed into metal core boxes by the drilling company.� The core is collected from the drilling site on a daily basis by a PTM geologist and transported to
�
|
Technical Report for the Update on Exploration Drilling at the for Waterberg Joint Venture and |
� |
|
Waterberg Extension Projects South Africa � 24 November�2014 |
� |
�
�
Coffey Mining South Africa (Pty) Ltd
�
the coreyard by PTM personnel.� Before the core is taken off the drilling site, core recovery and the depths are checked.� Core logging is done by hand on a pro-forma sheet by qualified geologists under supervision of the Project Geologist.
�
Waterberg JV Project
�
Based on the target generation and the results of the geochemical sampling and geochemical surveys, two boreholes were initially drilled between July�and October�2010 on the farm Disseldorp 369LR.� A total of 1934.77m was drilled for the first two boreholes in 2010.� Drilling resumed in 2011 on the farm Ketting.� The geological information revealed by this borehole lead to the extension of the drilling campaign in 2012, 2013 and 2014.
�
Subsequent to the boreholes used for the mineral resource estimate of 12 June-2014, an additional 53,684m representing 56 exploration boreholes and 58 deflections have been completed on the Waterberg JV Project.
�
Waterberg Extension Project
�
Based on the strike projections from the Waterberg JV Project, modelling of regional government data, detailed airborne gradient gravity and total field magnetic responses along with ground gravity confirmation, drill targets were generated and drilling commenced in October�2013 on the farm Early Dawn 369LR.
�
Subsequent to the boreholes used for the mineral resource estimate of 12 June-2014 and additional 17,775,m in 12 exploration boreholes and 26 deflections have been completed on the Waterberg Extension Project.
�
1.5.2����������������������������� Sample Preparation
�
The sampling methodology concurs with PTM protocol based on industry best practice.� The quality of the sampling is monitored and supervised by a qualified geologist.� The sampling is done in a manner that includes the entire potentially economic unit.
�
1.5.3����������������������������� Analysis
�
For the present database, field samples have been analyzed by two different laboratories: the primary laboratory is currently Set Point laboratories (South Africa).� Genalysis (Australia) is used for referee test work to confirm the accuracy of the primary laboratory.
�
Samples are received, sorted, verified and checked for moisture and dried if necessary.� Each sample is weighed and the results are recorded.� Rocks, rock chips or lumps are crushed using a jaw crusher to less than 10mm.� The samples are then milled for 5 minutes in a Labtech Essa
�
|
Technical Report for the Update on Exploration Drilling at the for Waterberg Joint Venture and |
� |
|
Waterberg Extension Projects South Africa � 24 November�2014 |
� |
�
�
Coffey Mining South Africa (Pty) Ltd
�
LM2 mill to achieve a fineness of 90% less than 106�m, which is the minimum requirement to ensure the best accuracy and precision during analysis.
�
Samples are analysed for Pt (ppm), Pd (ppm) Rh (ppm) and Au (ppm) by standard 25g lead fire-assay using a silver collector.� Rh (ppm) is assayed using the same method but with a palladium collector and only for selected samples.� After pre-concentration by fire assay the resulting solutions are analysed using ICP-OES (Inductively Coupled Plasma�Optical Emission Spectrometry).
�
The base metals (copper, nickel, cobalt and chromium) are analysed using ICP-OES (Inductively Coupled Plasma � Optical Emission Spectrometry) after a four acid digestion.� This technique results in �almost� total digestion.
�
The drilling, sampling and analytical aspects of the project are considered to have been undertaken to industry standards.� The data is considered to be reliable and suitable for mineral resource estimation.
�
1.5.4����������������������������� Quality Control and Quality Assurance
�
PTM have instituted a complete QA/QC programme including the insertion of blanks and certified reference materials as well as referee analyses.� The programme is being followed and is considered to be to industry standard.� The data is as a result, considered reliable.
�
1.6��������������������������������������� Mineral Resources
�
The mineral resource estimate (Effective Date: 12 June�2014) is reported for completeness of this report.� There have been no new mineral resource estimates declared since that date.� The mineral resources reported are located within the Waterberg JV Project Area and in the southern portion of the Waterberg Extension Project Area (Table 1.6_1).� There has been insufficient drilling elsewhere on Waterberg Extension Project to update the mineral resource estimate.
�
Mineral resources have been declared for the T- and F - Zone mineralization on the property Ketting 368LR and Goedetrouw 366LR of the Waterberg JV Project and Early Dawn 361LR of the Waterberg Extension Project.
�
The data that formed the basis of the estimate are the boreholes drilled by PTM which consist of geological logs, the borehole collars, the downhole surveys and the assay data.� The area where each layer was present was delineated after examination of the intersections in the various boreholes.
�
The data was used to define the characteristics of the various layers based on their geochemical signatures.� However, it was necessary to check the procedure against the core.� As a result a
�
|
Technical Report for the Update on Exploration Drilling at the for Waterberg Joint Venture and |
� |
|
Waterberg Extension Projects South Africa � 24 November�2014 |
� |
�
�
Coffey Mining South Africa (Pty) Ltd
�
validation was undertaken on the core with the intention of finding diagnostic features to identify the layers directly from the core.� This was successfully achieved for the T � Zone.� However, due to pervasive alteration, this proved difficult for the F - Zone.� For estimation of the mineral resources reported in September�2013, modelling of the mineralization within the F - Zone was based on its stratigraphic position at the base of the magmatic sequence and on geochemical data.
�
Seven subunits within the broader F - Zone (FP and FH1 � FH6) have been identified based on their geochemical characteristics.
�
Data from the drilling completed by PTM in the estimate consists of intersections from 138 completed boreholes.� Each borehole was examined for completeness in respect of data (geology, sampling, collar) and sample recovery prior to inclusion in the estimate.
�
Geological models (wireframes) of the seven F - Zone units were modelled by CAE Mining (South Africa) on behalf of PTM, using the Strat 3D module of CAE Mining Studio�.
�
The coded borehole database supplied by PTM was composited for Pt, Pd, Au, Cu, Ni and density.� For each unit a three dimensional block model was modelled and an inverse distance weighted (power 2) estimate was undertaken.
�
Coffey considers that the mineral resource of the various layers should be classified as an Inferred Mineral Resource.� The data is of sufficient quality and the geological understanding and interpretation are considered appropriate for this level of mineral resource classification.
�
Two areas were defined defining areas where geological loss of 25% and 12.5% were applied.� These were based primarily on the spacing of surface boreholes and on the knowledge of this type of deposit.� The geological losses are made up of areas where the Zones may be absent due to faults, dykes and mafic/ultramafic pegmatites.
�
|
Technical Report for the Update on Exploration Drilling at the for Waterberg Joint Venture and |
� |
|
Waterberg Extension Projects South Africa � 24 November�2014 |
� |
�
�
Coffey Mining South Africa (Pty) Ltd
�
Table 1.6_1
Waterberg Project-
Mineral Resource Estimate (SAMREC Code) (12 June�2014)
�
|
� |
� |
Stratigraphic |
� |
Tonnage |
� |
Pt�(g/t) |
� |
Pd |
� |
Rh |
� |
Au |
� |
PGE+Au |
� |
Pt:Pd:Rh:Au |
� |
PGE+Au |
� |
Cu�(%) |
� |
Ni�(%) |
� |
Cu |
� |
Ni |
|
T1 |
� |
2.44 |
� |
10.49 |
� |
1.02 |
� |
1.52 |
� |
� |
� |
0.47 |
� |
3.01 |
� |
34:50:0:16 |
� |
1,015 |
� |
0.17 |
� |
0.10 |
� |
40 |
� |
23 |
|
T2 |
� |
3.87 |
� |
43.57 |
� |
1.14 |
� |
1.99 |
� |
� |
� |
0.82 |
� |
3.95 |
� |
29:50:0:21 |
� |
5,540 |
� |
0.17 |
� |
0.09 |
� |
167 |
� |
90 |
|
T Total |
� |
3.60 |
� |
54.06 |
� |
1.12 |
� |
1.90 |
� |
� |
� |
0.75 |
� |
3.77 |
� |
30:50:0:20 |
� |
6,555 |
� |
0.17 |
� |
0.10 |
� |
207 |
� |
114 |
|
F |
� |
2.75-60 |
� |
232.82 |
� |
0.90 |
� |
1.93 |
� |
0.05 |
� |
0.14 |
� |
3.01 |
� |
30:64:2:4 |
� |
22,529 |
� |
0.08 |
� |
0.19 |
� |
409 |
� |
994 |
|
Total |
� |
� |
� |
286.88 |
� |
0.94 |
� |
1.92 |
� |
0.04 |
� |
0.25 |
� |
3.15 |
� |
30:61:1:8 |
� |
29,084 |
� |
0.10 |
� |
0.18 |
� |
617 |
� |
1,107 |
|
Content (koz) |
� |
8,652 |
� |
17,741 |
� |
341 |
� |
2,350 |
� |
� |
� |
� |
� |
kt |
� |
280 |
� |
502 |
� |
� |
� |
� | ||||
�
Waterberg Project- (JV)
�
|
� |
� |
Stratigraphic |
� |
Tonnage |
� |
Pt�(g/t) |
� |
Pd |
� |
Rh |
� |
Au |
� |
PGE+Au |
� |
Pt:Pd:Rh:Au |
� |
PGE+Au |
� |
Cu�(%) |
� |
Ni�(%) |
� |
Cu |
� |
Ni |
|
T1 |
� |
2.44 |
� |
10.49 |
� |
1.02 |
� |
1.52 |
� |
� |
� |
0.47 |
� |
3.01 |
� |
34:50:0:16 |
� |
1,015 |
� |
0.17 |
� |
0.10 |
� |
40 |
� |
23 |
|
T2 |
� |
3.87 |
� |
43.57 |
� |
1.14 |
� |
1.99 |
� |
� |
� |
0.82 |
� |
3.95 |
� |
29:50:0:21 |
� |
5,540 |
� |
0.17 |
� |
0.09 |
� |
167 |
� |
90 |
|
T Total |
� |
3.60 |
� |
54.06 |
� |
1.12 |
� |
1.90 |
� |
� |
� |
0.75 |
� |
3.77 |
� |
30:50:0:20 |
� |
6,555 |
� |
0.17 |
� |
0.10 |
� |
207 |
� |
114 |
|
F |
� |
2.75-60 |
� |
164.58 |
� |
0.88 |
� |
1.91 |
� |
0.05 |
� |
0.13 |
� |
2.97 |
� |
30:64:2:4 |
� |
15,713 |
� |
0.07 |
� |
0.18 |
� |
247 |
� |
649 |
|
Total |
� |
� |
� |
218.64 |
� |
0.94 |
� |
1.91 |
� |
0.03 |
� |
0.29 |
� |
3.17 |
� |
30:60:1:9 |
� |
22,268 |
� |
0.09 |
� |
0.16 |
� |
455 |
� |
763 |
|
Content (koz) |
� |
6,605 |
� |
13,407 |
� |
239 |
� |
2,018 |
� |
� |
� |
� |
� |
kt |
� |
207 |
� |
346 |
� |
� |
� |
� | ||||
�
Waterberg Project- (Ext)
�
|
� |
� |
Stratigraphic |
� |
Tonnage |
� |
Pt�(g/t) |
� |
Pd |
� |
Rh |
� |
Au |
� |
PGE+Au |
� |
Pt:Pd:Rh:Au |
� |
PGE+Au |
� |
Cu�(%) |
� |
Ni�(%) |
� |
Cu |
� |
Ni |
|
F |
� |
2.75-60 |
� |
68.04 |
� |
0.93 |
� |
1.98 |
� |
0.05 |
� |
0.15 |
� |
3.11 |
� |
30:64:2:4 |
� |
6,802 |
� |
0.11 |
� |
0.23 |
� |
162 |
� |
344 |
|
Total |
� |
� |
� |
68.04 |
� |
0.93 |
� |
1.98 |
� |
0.05 |
� |
0.15 |
� |
3.11 |
� |
30:64:2:4 |
� |
6,802 |
� |
0.11 |
� |
0.23 |
� |
162 |
� |
344 |
|
Content (koz) |
� |
2,043 |
� |
4,325 |
� |
102 |
� |
331 |
� |
� |
� |
� |
� |
kt |
� |
73 |
� |
156 |
� |
� |
� |
� | ||||
�
The T-Zone cut-off is reported as 2PGE+Au and the F - Zone cut-off is reported as 3PGE+Au grade
Individual numbers may not add up due to rounding
�
|
Technical Report for the Update on Exploration Drilling at the for Waterberg Joint Venture and |
� |
|
Waterberg Extension Projects South Africa � 24 November 2014 |
�
�
�
Coffey Mining South Africa (Pty) Ltd
�
Mineral resources which are not mineral reserves have demonstrated economic viability.� The estimate of mineral resources may be materially affected by environmental, permitting, legal, marketing, or other relevant issues.
�
The quantity and grade of reported Inferred Mineral Resources in this estimate are conceptual in nature.� There is no guarantee that all or any part of the Mineral Resource will be converted to a Mineral Reserve.
�
The independent Qualified Persons responsible for the mineral resource estimate in this report and summarized in Table 1.6_1 are Kenneth Lomberg and Alan Goldschmidt
�
Kenneth Lomberg, a geologist with some 29 years� experience in mine and exploration geology, resource and reserve estimation and project management in the minerals industry (especially platinum and gold).� He is a practising geologist registered with the South African Council for Natural Scientific Professions (Pr.Sci.Nat.) and is independent of Platinum Group Metals Ltd as that term is defined in Section�1.5 of the Instrument.
�
Alan Goldschmidt, a geologist with some 29 years� experience in minerals industry.� He has been primarily been involved with geological block models and geostatistical resource estimation.� He is a practising geologist registered with the South African Council for Natural Scientific Professions (Pr.Sci.Nat.) and is independent of Platinum Group Metals Ltd as that term is defined in Section�1.5 of the Instrument.
�
1.7��������������������������������������� Interpretation and Conclusions
�
Exploration drilling by PTM has intersected layered magmatic PGM mineralization in what is interpreted to be the northern extension of the northern limb of the Bushveld Complex under the Waterberg Group rocks.
�
Exploration drilling has confirmed the presence of mineralization.� Elevated PGM concentrations have been identified in mineralized zones/layers consistent with layered magmatic sulphide deposits and displays characteristics of a geological setting, including the ratio of precious metals that differs from other locations in the Bushveld Complex.
�
In conclusion, Coffey recommended that drilling continue and that more detailed logging be undertaken to improve the geological understanding and allow for improved layer definition.
�
The scale of the inferred mineral resource and the fact that the mineralization is open to the west would suggest that a drill program be extended into this area.
�
|
Technical Report for the Update on Exploration Drilling at the for Waterberg Joint Venture and |
� |
|
Waterberg Extension Projects South Africa � 24 November�2014 |
� |
�
�
Coffey Mining South Africa (Pty) Ltd
�
Waterberg JV Project
�
After the mineral resource estimate (Effective Date: 2 September�2013) there was an update (Effective Date 12 June�2104) which is a significant increase in inferred mineral resource.� This is primarily due to extension of the mineral resource further north and to a depth of 1250m from a previous 1,000m depth cut-off.� The delineation of the F - Zone has been advanced due to better understanding of the geology.
�
The mineral resource (Effective Date 12 June�2104) for the identified mineralized layers within this project area, utilised the exploration database that contained 114 boreholes with 307 intersections.�� The mineralization is considered open down-dip and along strike.
�
It is recommended to advance that further detailed logging and refined modelling the geological will advance the geological confidence in the model.�� In addition the infill drilling should continue as it may assist to improve the confidence in determining the grade and geological continuity.
�
Waterberg Extension Project
�
Exploration on the Waterberg Extension Project has confirmed the presence of Bushveld rocks under the Waterberg Group.� Exploration drilling has confirmed the presence of the continuation of the mineralized F - Zone along strike from the adjacent Waterberg JV Project.� Elevated PGM concentrations have been identified in mineralized zones/layers consistent with layered magmatic sulphide deposits and displays characteristics of a geological setting, including the ratio of precious metals that differs from other locations in the Bushveld Complex.
�
An interpretation of the position of the Bushveld Complex was made after modelling of data from airborne gradient gravity and magnetics, regional magnetics and ground gravity surveys.� The three methods of interpretation all indicate that the Bushveld Complex continues in a northeast to northerly arc from the known position from drilling in the southern area of the Project.
�
The continuity of geological features and mineralized layers has been confirmed.� The database for the Waterberg Extension Project used fro the latest mineral resource estimate (Effective Date 12 June�2104) contains 24 boreholes with 56 intersections.� The geophysical data and the new drilling supports the model that the mineralization is open down-dip and along strike.� The new data supports the previous recommendation that further drilling would confirm the location of the northern extension of the Bushveld Complex.
�
It is now recommended that drilling continue on the Waterberg Extension Project on a 250m x 250m grid to support a Mineral Resource Estimate in the areas where mineralization of sufficient grade and width has been intersected.� In addition the infill drilling should continue as it may assist to improve the confidence in determining the grade and geological continuity.
�
|
Technical Report for the Update on Exploration Drilling at the for Waterberg Joint Venture and |
� |
|
Waterberg Extension Projects South Africa � 24 November�2014 |
� |
�
�
Coffey Mining South Africa (Pty) Ltd
�
It is recommended that consideration be given to the commencement of a Pre-feasibility Study.
�
|
Technical Report for the Update on Exploration Drilling at the for Waterberg Joint Venture and |
� |
|
Waterberg Extension Projects South Africa � 24 November�2014 |
� |
�
�
Coffey Mining South Africa (Pty) Ltd
�
�
2������������������������������������������������� INTRODUCTION
�
2.1��������������������������������������� Scope of the Report
�
Coffey Mining (South Africa) Pty Limited (Coffey) has been requested by Platinum Group Metals� (Pty) Ltd (PTM), on behalf of Platinum Group Metals Ltd, the issuer, to complete an Independent Technical Report on Exploration Drilling supporting the October�21, 2014 public disclosure of the Updated drilling results for the combined Waterberg Joint Venture (JV) Project and the Waterberg Extension Project, two adjoining projects targeting a previously unknown extension to the northern limb of the Bushveld Complex which may have the potential for Platinum Group Metals (PGMs), gold and base metals (Cu, Ni).� This report complies with disclosure and reporting requirements set forth in the Toronto Stock Exchange Manual, National Instrument 43-101 Standards of Disclosure for Mineral Project (NI 43-101), Companion Policy 43-101CP to NI 43-101, and Form�43-101F1 of NI 43-101.
�
This report reviews and updates the geology, the exploration activities and states the mineral resource estimation (Effective date: 12 June�2014) on the project areas based on documentation related to the project, and discussions with project management up to 21 October�2014.
�
2.2��������������������������������������� Principal Sources of Information
�
The sources of information and data include both public domain data (conventional publications, �Open File� and Internet) and information gathered or otherwise acquired by PTM, which are not generally available in the public domain.� Where possible, published and/or generally available data on �Open File� in the Council of Geoscience, Pretoria, South Africa, was used.
�
The public domain sources and documents that were supplied by PTM are listed in Section�19 - References.
�
2.3��������������������������������������� Qualifications and Experience
�
Coffey is an integrated Australian-based consulting firm, which has been providing services and advice to the international mineral industry and financial institutions since 1987.� Coffey has maintained a fully operational office at Accra in Ghana since 1996, providing an operational base for consulting and contracting assignments throughout the West African region.� An additional African office was established in Johannesburg, South Africa, in 1999 to support expanding activities within southern and eastern portions of the continent.
�
The following persons were nominated to the project team and their specific areas of responsibility are shown below.� The qualifications and appropriate experience of the authors are detailed in the attached Authors� Certificates.� Mr.�K�G�Lomberg visited the Waterberg JV site on 16-18 April�2012, 16�18 August�2012, 21�22 August�2012, 13-15 January�2013 and 24 - 25 July�
�
|
Technical Report for the Update on Exploration Drilling at the for Waterberg Joint Venture and |
� |
|
Waterberg Extension Projects South Africa � 24 November�2014 |
� |
�
�
Coffey Mining South Africa (Pty) Ltd
�
2013, 24 � 25 March�2014,6 � 7 October�2014 and the Waterberg Extension site on 8 November�2013.� Mr.�Goldschmidt visited site on 24 - 25 July�2013.
�
PTM personnel on site facilitated the technical review by providing documentation, overview presentations, field visits, access to the exploration and drilling already completed, and access to project databases.
�
The overall report was compiled by Mr.�Lomberg and Mr.�Goldschmidt.
�
Kenneth Lomberg, Principal Consultant Resources, Coffey � Southern Africa
Project management, site visits, geological review and interpretation, mineral resource estimation, report preparation.
�
Mr.�Lomberg has the relevant experience to the type of deposit and resource estimation that is the subject of this report.� Mr.�Lomberg has done consultant work on various projects on the Bushveld Complex including Aurora, Kransplaats, Bokoni Mine, Mecklenburg, Smokey Hills, Kalplats, Garatau, Kennedy�s Vale, Kalkfontein, Blue Ridge Mine, Eland Mine, Western Bushveld Joint Venture (WBJV), Palmietfontein, Stellite, Townlands and Tharisa.� Mr.�Lomberg has assisted with approximately 15 of the estimated 20 Junior Platinum Exploration and Mining Companies in South Africa.� These assignments have ranged from listings documents, Due Diligences, CPRs,�ITRs, feasibility studies, NI�43-101 compliant resource estimations and valuations.
�
Alan Goldschmidt, Senior Consultant Resources, Coffey � Southern Africa
Site visit, geological review and interpretation, mineral resource estimation, report preparation.
�
Mr.�Goldschmidt has some 29 years experience in the minerals industry.� He has been involved in exploration and mine geology.� His expertise is project management, reserve, and resource estimation.� Primarily he has been involved with geological block modelling and geostatistical resource estimation, reserve, and resource estimation.
�
2.4�������������������������������������� Independence
�
Neither Coffey, nor the key personnel nominated for the completed and reviewed work, have any material interest in PTM or its mineral properties.� The proposed work, and any other work done by Coffey for PTM, is strictly in return for professional fees.� Payment for the work is not in any way dependent on the outcome of the work or on the success or otherwise of PTM�s own business dealings.� As such there is no conflict of interest in Coffey undertaking the Independent Qualified Person�s Report as contained in this document.
�
|
Technical Report for the Update on Exploration Drilling at the for Waterberg Joint Venture and |
� |
|
Waterberg Extension Projects South Africa � 24 November�2014 |
� |
�
�
Coffey Mining South Africa (Pty) Ltd
�
3������������������������������������������������� RELIANCE ON OTHER EXPERTS
�
This report was prepared as a National Instrument 43-101 Technical Report, in accordance with Form�43-101F1, for Platinum Group Metals� (Pty) Ltd (PTM), on behalf of Platinum Group Metals Ltd, the issuer, by Coffey Mining (South Africa) Pty Ltd (Coffey).� The quality of information and conclusions contained herein is consistent with the level of effort involved in Coffey�s services and based on:
�
i)���������������������������������������� Information available at the time of preparation by PTM,
�
ii)������������������������������������� Previously completed and filed technical reports on the resource estimate titled: �Revised and Updated Mineral Resource Estimate for the Waterberg Platinum Project, South Africa� dated 2 September�2013 and �Amended and Combined Technical Report, Waterberg Joint Venture and Waterberg Extension projects, South Africa�� dated� 9th�December�2013.
�
iii)���������������������������������� Third party technical reports prepared by Government agencies and previous tenement holders, along with other relevant published and unpublished third party information.
�
iv)��������������������������������� This report is intended to be used by PTM, subject to the terms and conditions of its contract with Coffey.� This contract permits PTM to file this report as a Technical Report with Canadian Securities Regulatory Authorities pursuant to National Instrument 43-101, Standards of Disclosure for Mineral Projects.� Any other use of this report by any third party is at that party�s sole risk.
�
A final draft of this report was provided to PTM, along with a written request to identify any material errors or omissions, prior to lodgement.
�
Neither Coffey, nor the authors of this report, are qualified to provide extensive comment on legal facets associated with ownership and other rights pertaining to PTM�s mineral properties described in Section�4.� Coffey did not see or carry out any legal due diligence confirming the legal title of PTM to the properties.
�
Similarly, neither Coffey nor the authors of this report are qualified to provide extensive comment on environmental issues associated with PTM�s mineral properties, as discussed in Section�4.
�
|
Technical Report for the Update on Exploration Drilling at the for Waterberg Joint Venture and |
� |
|
Waterberg Extension Projects South Africa � 24 November�2014 |
� |
�
�
Coffey Mining South Africa (Pty) Ltd
�
4������������������������������������������������� PROPERTY DESCRIPTION AND LOCATION
�
4.1��������������������������������������� Property Description and Location
�
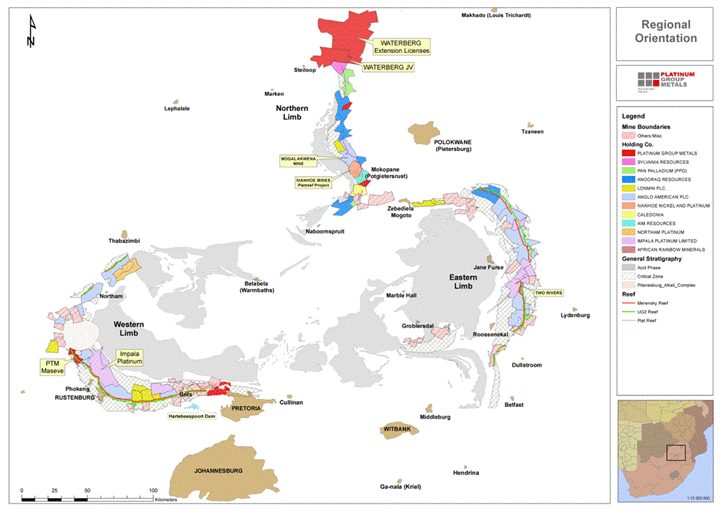
The Waterberg Project (PTM and JOGMEC Joint venture) is some 85km north of the town of Mokopane (formerly Potgietersrus) (Figure 4.1_1).� The exploration area comprises a number of prospecting rights.� Their status is tabled in Table 4.3_1.
�
|
Technical Report for the Update on Exploration Drilling at the for Waterberg Joint Venture and |
� |
|
Waterberg Extension Projects South Africa � 24 November�2014 |
� |
�
�
Coffey Mining South Africa (Pty) Ltd
�
Figure 4.1_1
Location of the Waterberg JV and Waterberg Extension Project Properties on the Bushveld Complex
�
�
|
Technical Report for the Update on Exploration Drilling at the for Waterberg Joint Venture and |
� |
|
Waterberg Extension Projects South Africa � 24 November�2014 |
� |
�
�
Coffey Mining South Africa (Pty) Ltd
�
4.2��������������������������������������� Mining Tenure
�
A summary of the mineral exploration and mining rights regime for South Africa is provided in Table�4.2_1.� It should be noted that PTM have a Prospecting Right which allows them should they meet the requirements in the required time, to have the sole mandate to file an application for the conversion of the registered Prospecting Right to a Mining Right.
�
Table 4.2_1
Summary of Mineral Exploration and Mining Rights
(South Africa)
�
|
South Africa |
� |
Mineral Exploration and Mining Rights |
|
Mining Act |
: |
Mineral and Petroleum Resources Development Act, No.� 28 of 2002 (Implemented 1 May�2004) |
|
State Ownership of Minerals |
: |
State custodianship |
|
Negotiated Agreement |
: |
In part, related to work programmes and expenditure commitments. |
|
� |
� |
� |
|
Mining Title/Licence Types |
� |
� |
|
Reconnaissance Permission |
: |
Yes |
|
Prospecting Right |
: |
Yes |
|
Mining Right |
: |
Yes |
|
Retention Permit |
: |
Yes |
|
Special Purpose Permit/Right |
: |
Yes |
|
Small Scale Mining Rights |
: |
Yes |
|
� |
� |
� |
|
Reconnaissance Permission |
� |
� |
|
Name |
: |
Reconnaissance Permission |
|
Purpose |
: |
Geological, geophysical, photo geological, remote sensing surveys. Does not include �prospecting�, i.e. does not allow disturbance of the surface of the earth. |
|
Maximum Area |
: |
Not limited. |
|
Duration |
: |
Maximum 2 years. |
|
Renewals |
: |
No and no exclusive right to apply for prospecting right. |
|
Area Reduction |
: |
No. |
|
Procedure |
: |
Apply to Regional Department of Mineral Resources. |
|
Granted by |
: |
Minister. |
|
� |
� |
� |
|
Prospecting Right |
� |
� |
|
Name |
: |
Prospecting Right. |
|
Purpose |
: |
All exploration activities including bulk sampling. |
|
Maximum Area |
: |
Not limited. |
|
Duration |
: |
Up to 5 years. |
|
Renewals |
: |
Once, for 3 years. |
|
Area Reduction |
: |
No. |
|
Procedure |
: |
Apply to Regional Department of Mineral Resources. |
|
Granted by |
: |
Minister. |
|
� |
� |
� |
|
Mining Right |
� |
� |
|
Name |
: |
Mining Right. |
|
Purpose |
: |
Mining and processing of minerals. |
|
Maximum Area |
: |
Not limited. |
|
Duration |
: |
Up to 30 years. |
|
Renewals |
: |
Yes, with justification. |
|
Procedure |
: |
Apply to Regional Department of Mineral Resources. |
|
Granted by |
: |
Minister. |
�
|
Technical Report for the Update on Exploration Drilling at the for Waterberg Joint Venture and |
� |
|
Waterberg Extension Projects South Africa � 24 November�2014 |
� |
�
�
Coffey Mining South Africa (Pty) Ltd
�
4.3��������������������������������������� Licence Status
�
The Waterberg JV Project and Waterberg Extension Project are defined by licence boundaries with differing status and ownership structure.� A summary of the prospecting rights and their status is summarised in Table 4.3_1 and their location on Figures 4.3_1 and 4.3_2
�
|
Technical Report for the Update on Exploration Drilling at the for Waterberg Joint Venture and |
� |
|
Waterberg Extension Projects South Africa � 24 November�2014 |
� |
�
�
Coffey Mining South Africa (Pty) Ltd
�
Table 4.3_1
Summary of Mineral Exploration and Mining Rights (South Africa)
�
|
Holder |
� |
DMR�P�R |
� |
Hectares |
� |
Period�of�Prospecting�Right |
� |
Minerals |
� |
Status |
� |
Status�Details |
|
PTM (JV) |
� |
1265 PR |
� |
15257.00 ha |
� |
2 September�2009 to 1 September�2012 |
� |
PGM, Gold, Chrome, Nickel, Cobalt, Copper, Molybdenum, Rare Earths, Silver, Zinc and Lead |
� |
Granted |
� |
Renewal applied for and acknowledged by DMR � Renewal pending |
|
PTM (JV) |
� |
10667 PR |
� |
6254.80 ha |
� |
2 October�2013 to 1 October�2018 |
� |
PGM, Gold, Chrome, Nickel, Cobalt, Copper, Molybdenum, Rare Earths, Silver, Zinc and Lead |
� |
Granted |
� |
Notarially Executed on 2/10/2013 |
|
PTM (JV) |
� |
10809 PR |
� |
� |
Applied for prospecting period of 5�years, which is the maximum in terms of section 16 MPRDA. |
� |
Vanadium and Iron |
� |
Accepted |
� |
Written acceptance by DMR on 28/05/2013 | |
|
PTM (JV) |
� |
10668 PR |
� |
3953.05 ha |
� |
2 October�2013 to1 October�2018 |
� |
PGM, Gold, Chrome, Nickel, Cobalt, Copper, Molybdenum, Rare Earths, Silver, Zinc and Lead |
� |
Granted |
� |
Notarially Executed on 2/10/2013 |
|
PTM (EXT) |
� |
10804 PR |
� |
26961.59 ha |
� |
Prospecting granted for 5 years with effect 2 October�2013 to 1 October�2018 |
� |
PGM, Chrome, Copper, Gold, Nickel, Vanadium and Iron |
� |
Granted |
� |
Notarially Executed on 2/10/2013 |
|
PTM(EXT) |
� |
10805 PR |
� |
17734.80 ha |
� |
Prospecting granted for 5 years with effect 2 October�2013 to 1�October�2018 |
� |
PGM, Chrome, Copper, Gold, Nickel, Vanadium and Iron |
� |
Granted |
� |
Notarially Executed on 2/10/2013. |
|
PTM(EXT) |
� |
10805 PR � Section�102 |
� |
4475.13 ha |
� |
Section�102 application when granted will have the same benefits as 10804 (prospecting right will be granted from 1/10/2013 to 2/10/2018) |
� |
PGM, Chrome, Copper, Gold, Nickel, Vanadium and Iron |
� |
Accepted |
� |
Written acceptance by DMR on 09/12/2013 |
|
PTM(EXT) |
� |
10806 PR |
� |
13143.53 ha |
� |
Applied for prospecting period of 5�years, which is the maximum in terms of section 16 MPRDA. |
� |
PGM |
� |
Accepted |
� |
Written Acceptance by DMR on 28/05/2013 |
|
PTM (EXT) |
� |
10810 PR |
� |
4189.86 ha |
� |
Prospecting granted for 5 years with effect 23 October�2013 to 22 October�2018 |
� |
PGM, Chrome, Copper, Gold, Nickel, Vanadium and Iron |
� |
Granted |
� |
Notarially Executed on 23/10/2013 |
|
PTM(EXT) |
� |
11286 PR |
� |
19912.44 ha |
� |
Applied for prospecting period of 5 years, which is the maximum in terms of section 16 MPRDA. |
� |
PGM, Gold, Chrome, Nickel, Cobalt, Copper, Molybdenum, Rare Earths, Silver, Zinc and Lead, Vanadium,�Iron |
� |
Accepted |
� |
Formal Acceptance by DMR on 05/06/2103 |
�
|
Technical Report for the Update on Exploration Drilling at the for Waterberg Joint Venture and |
� |
|
Waterberg Extension Projects South Africa � 24 November�2014 |
� |
�
�
�
Coffey Mining South Africa (Pty) Ltd
�
Figure 4.3_1
Locations of the Waterberg Project Properties
�
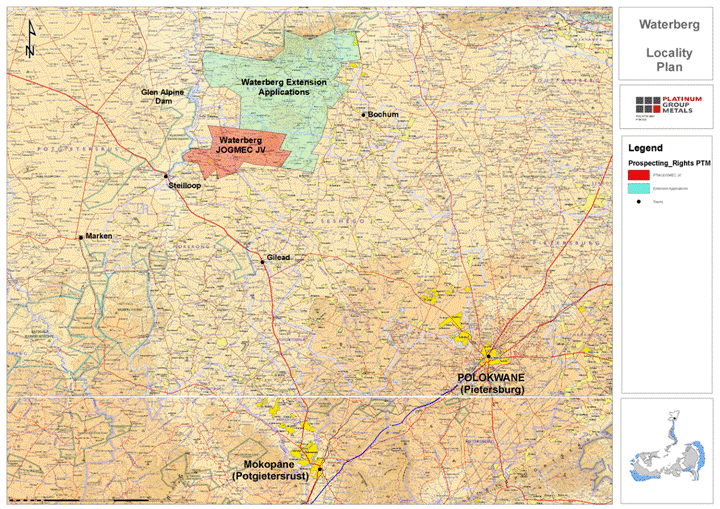
�
|
Technical Report for the Update on Exploration Drilling at the for Waterberg Joint Venture and |
� |
|
Waterberg Extension Projects South Africa � 24 November�2014 |
� |
�
�
Coffey Mining South Africa (Pty) Ltd
�
Figure 4.3_2
Location of the Waterberg Project Prospecting Rights
�
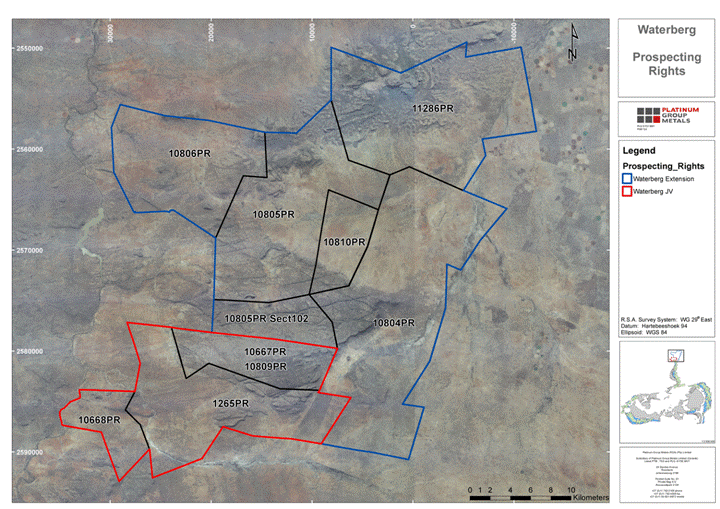
�
|
Technical Report for the Update on Exploration Drilling at the for Waterberg Joint Venture and |
� |
|
Waterberg Extension Projects South Africa � 24 November�2014 |
� |
�
�
Coffey Mining South Africa (Pty) Ltd
�
4.4��������������������������������������� Holdings Structure
�
The Waterberg JV Project and the Waterberg Extension Project are managed and explored under the direction of separate technical committees and are currently planned for separate development according to the needs, requirements and objectives of the two distinct ownership groups.
�
Waterberg JV Project
�
PTM initially held a 74% share in the project with Mnombo Wethu (Pty) Ltd (Mnombo), a BEE partner, holding the remaining 26% share (Figure 4.4_1).
�
In October�2009, PTM entered an agreement with the Japanese Oil, Gas and Metals National Corporation (JOGMEC) and Mnombo whereby JOGMEC may earn up to a 37% interest in the project for an optional work commitment of US$3.2 million over 4 years, while at the same time Mnombo is required to match JOGMEC�s expenditures on a 26/74 basis.� PTM agreed to loan Mnombo their first $87,838 in project funding.� JOGMEC has completed the expenditure of their earn-in amount.
�
On November�7, 2011 the Company entered into an agreement with Mnombo whereby the Company will acquire 49.9% of the issued and outstanding shares of Mnombo in exchange for cash payments totalling R 1.2 million and paying for Mnombo�s 26% share of project costs to feasibility.� When combined with the Company�s 37% direct interest in the Waterberg JV Project (after JOGMEC earn-in), the 12.974% indirect interest to be acquired through Mnombo will bring the Company�s effective project interest to 49.974%.
�
Figure 4.4_1
Schematic Diagram of the Holdings of Waterberg JV Project
�

�
|
Technical Report for the Update on Exploration Drilling at the for Waterberg Joint Venture and |
� |
|
Waterberg Extension Projects South Africa � 24 November�2014 |
� |
�
�
Coffey Mining South Africa (Pty) Ltd
�
During 2012, PTM made application to the DMR to acquire three additional prospecting rights adjacent to the west (one property of 3,938 ha), north (one property of 6,272 ha) and east (one property of 1,608 ha) of the existing Waterberg JV Project.� Upon grant by the DMR, these three new prospecting rights covering a total of 118km2�became part of the existing joint venture with JOGMEC and Mnombo, bringing the total area in the joint venture to 255km2.� Mnombo is carrying costs for the Feasibility Study in respect of the Waterberg JV Project.
�
Waterberg Extension Project
�
PTM holds a direct 74% share in the Waterberg Extension Project with Mnombo Wethu (Pty) Ltd (Mnombo), a BEE partner, holding the remaining 26% share.
�
On November�7, 2011 the Company entered into an agreement with Mnombo whereby the Company will acquire 49.9% of the issued and outstanding shares of Mnombo in exchange for cash payments totalling R 1.2 million and paying for Mnombo�s 26% share of project costs to feasibility.� When combined with the Company�s 74% direct interest in the Waterberg Extension Project, the 12.974% indirect interest to be acquired through Mnombo will bring PTM�s effective project interest to 86.974%.� In respect of the Waterberg Extension Project, PTM is currently accruing Mnombo�s cost share.
�
4.5�������������������������������������� Royalties and Agreements
�
Coffey is not aware of any royalties, back-in rights, payments or other encumbrances that could prevent PTM from carrying out its plans or the trading of its rights to its licence holdings at the Waterberg JV Project and Waterberg Extension Project.
�
4.6��������������������������������������� Environmental Liabilities
�
All environmental requirements on the properties are subject to the terms of a current Environmental Management Plan (EMP) approved by the Department of Minerals Resources (DMR) prior to commencement of work on the properties.� All rehabilitation of borehole sites and access roads required in terms of this EMP have been completed or are on-going.� In addition the required deposits into the approved environmental rehabilitation trust in respect of related potential liabilities are up to date.� There are no other known material environmental liabilities on the properties at this time.
�
All the necessary permissions and permits in terms of the environmental liabilities have been obtained.� There are no known encumbrances of an environmental nature that may restrict the exploration of the properties.
�
4.7��������������������������������������� Legal Access
�
PTM has consulted with the community and received permissions to access the land where it holds Prospecting Permit licences.
�
|
Technical Report for the Update on Exploration Drilling at the for Waterberg Joint Venture and |
� |
|
Waterberg Extension Projects South Africa � 24 November�2014 |
� |
�
�
Coffey Mining South Africa (Pty) Ltd
�
5������������������������������������������������� ACCESSIBILITY, CLIMATE, LOCAL RESOURCES,�INFRASTRUCTURE AND PHYSIOGRAPHY
�
5.1��������������������������������������� Access
�
The shared boundary of the Waterberg JV Project and Waterberg Extension Project is located some 85km north of the town of Mokopane (formerly Potgietersrus) in Seshego and Mokerong, districts of the Limpopo Province.� Mokopane provides a full spectrum of local and urban infrastructure.
�
The Waterberg JV Project is situated some 13.5km from the N11 national road that links Mokopane with the Grobblers Bridge border post to Botswana.� The current drilling area is some 32km from the N11 National Road.� Access to the area from the national road is by unpaved roads that are generally in a reasonable condition.
�
The Waterberg Extension Project is situated some 18.5km from the N11 national road that links Mokopane with the Grobblers Bridge border post to Botswana.� The current drilling area is some 38km to 45km from the N11 National Road.� Access to the area from the national road is by unpaved roads that are generally in a reasonable condition.
�
5.2��������������������������������������� Climate
�
The climate is semi-arid with moderate winter temperatures and warm to hot in the summer.� The majority of the 350-400mm of average annual rainfall occurs in the period November�to March.� Climatic conditions have virtually no impact on potential mining operations in the project area.� Mining and exploration activities can continue throughout the year.
�
5.3��������������������������������������� Physiography
�
The project area to the west and east is relatively flat but the area in the central part of the project area is more mountainous with some steep near vertical cliffs and an elevation difference of 160 - 200m (Figure 5.3_1)� The lowest point in the project area is at 880m amsl and the highest point at 1,365m amsl.� The drilling has been undertaken on the eastern flat area with an elevation of approximately 1,000m amsl.� The area is farmed by the local people who grow crops on a limited scale and farm various cattle.� The vegetation is typically bushveld vegetation.� The Seepabana River cuts across the southwestern side of the Waterberg JV Project area from east to west joining the Molagakwena River which flows north into the Glen Alpine Dam.� The remainder of the area has non-perennial rivers.
�
|
Technical Report for the Update on Exploration Drilling at the for Waterberg Joint Venture and |
� |
|
Waterberg Extension Projects South Africa � 24 November�2014 |
� |
�
�
Coffey Mining South Africa (Pty) Ltd
�
Figure 5.3_1
Photograph looking towards the Eastern side of the Waterberg JV Project
�
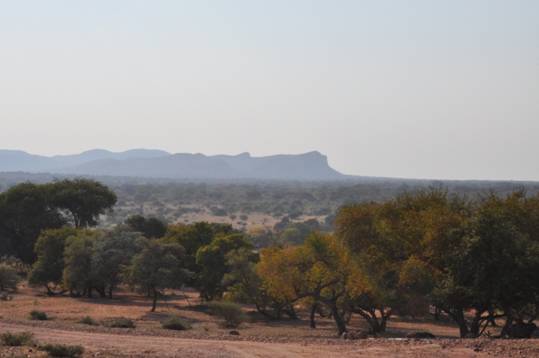
�
5.4��������������������������������������� Local Resources and Infrastructure
�
Mining services and recruitment are readily available from Mokopane which has a long history of mining with the Mogalakwena Mine, formerly Potgietersrus Platinum Mine (Anglo Platinum), situated north of the town.� Furthermore, drilling contractors, mining services and consultants are readily sourced within the greater Gauteng area.
�
Power, sewage and water infrastructure are poorly developed in this area.� The infrastructural requirements of a mine would require additional planning to provide suitable infrastructure to the site.� The current activity in the area is in the form of local people undertaking small scale farming on a subsistence basis for cattle and crops.� The major restriction is water although the Glen Alpine dam is located 2km to the northwest of the project area and 23km northwest of the area of current activity and 10km to the west of the Waterberg Extension Project.
�
|
Technical Report for the Update on Exploration Drilling at the for Waterberg Joint Venture and |
� |
|
Waterberg Extension Projects South Africa � 24 November�2014 |
� |
�
�
Coffey Mining South Africa (Pty) Ltd
�
6������������������������������������������������� HISTORY
�
Waterberg JV Project
�
The Waterberg JV Project is a part of a group of exploration projects that came from a regional target initiative of the Company over the past two years.� Platinum Group Metals targeted this area based on its own detailed geophysical, geochemical and geological work along trend, off the north end of the mapped northern limb of the Bushveld Complex.
�
Waterberg Extension Project
�
The permits for the Waterberg Extension Project properties were applied for based on the initial findings on the adjacent Waterberg JV Project combined with an analysis of publicly available regional government geophysical data that showed an arching NNE tend to the signature of the interpreted edge of the Bushveld Complex.
�
6.1��������������������������������������� Ownership History
�
PTM developed the exploration concept for the Waterberg JV Project and filed for a Prospecting Right application which was granted in 2009.� In October�2009, PTM entered an agreement with JOGMEC and Mnombo whereby JOGMEC may earn up to a 37% interest in the project for an optional work commitment of US$3.2 million over 4 years on the Waterberg JV Project only.� It is a condition that over the same time period Mnombo is required to match JOGMEC�s expenditures on a 26/74 basis.� PTM agreed to loan Mnombo their first $87,838 in project funding.� JOGMEC has completed their earn-in expenditure in 2012.� This only applies to the Waterberg JV Project.� JOGMEC has no interest or association with the Waterberg Extension Project.
�
On November�7, 2011 the Company entered into an agreement with Mnombo whereby the Company will acquire 49.9% of the issued and outstanding shares of Mnombo in exchange for cash payments totalling R 1.2 million and paying for Mnombo�s 26% share of project costs to feasibility.� When combined with the Company�s 37% direct interest in the Waterberg JV Project (after JOGMEC earn-in), the 12.974% indirect interest to be acquired through Mnombo will bring the Company�s effective project interest to 49.974%.
�
The Waterberg Extension Project Licences were applied for separately and at a later date with PTM having a direct 74% interest and Mnombo retaining the remaining 26%.
�
6.2��������������������������������������� Exploration History
�
Previous work that has been conducted over the property was the regional mapping by the Council for Geoscience as presented on the 1:250,000 scale � Map No 2328 � Pietersburg.� This sheet is the published geological map of the area and the basis for the metallurgical sheets, as well as regional aeromagnetic and gravity surveys that now form part of the public domain dataset.
�
There is no publically available detailed exploration history available for the area.� As a result of the cover on the Bushveld Complex there is no record of specific exploration for platinum group
�
|
Technical Report for the Update on Exploration Drilling at the for Waterberg Joint Venture and |
� |
|
Waterberg Extension Projects South Africa � 24 November�2014 |
� |
�
�
Coffey Mining South Africa (Pty) Ltd
�
metals and the extensive exploration for platinum group metals on the Platreef targets to the south did not extend this far north.� There are undocumented reports of a borehole through the Waterberg Group into the Bushveld Complex on a farm immediately north of the Waterberg JV Project and immediately west of the Waterberg Extension Projects.
�
The original exploration models for the property involved a potential for paleo placer at the base of the Waterberg Group sediments or an embayment to the west.� Both of these models have been discarded with the current discovery and drilling data showing a strike to the north northeast.
�
Since previous mineral resource estimates and at the drilling cut-off date for the mineral resource estimate (31 May�2014), new borehole intersections are available in both the Waterberg JV Project and in the property Early Dawn 361LR in the south eastern portion of the Waterberg Extension Project.� Early Dawn 361LR is just north of the property Goedetrouw 386LR of the Waterberg JV Project area.� On the Waterberg JV Project a total of 307 intersection points have been drilled.� NQ core size (47.6mm) has been drilled.
�
Twenty four boreholes have been drilled on the Waterberg Extension Project (56 intersections).� Where possible, a basic 250m x 250m drilling grid has been used.
�
6.3��������������������������������������� Mineral Resource History � Waterberg JV Project
�
6.3.1����������������������������� September�2012
�
The initial mineral resource was declared for the T- and F - Zone mineralization and is confined to only the property Ketting 368LR of the Waterberg JV Project.� Data from the drilling completed by PTM to September�2012 were used to undertake a mineral resource estimate from over 58 intersections representing 27 boreholes.� The data and the geological understanding and interpretation were considered of sufficient quality for the declaration of an inferred mineral resource classification.� The resource estimate has been classified based on the criteria set out in Table�6.3.1_1.� This estimate was presented in a NI 43-101 in September�2012 by Mr.�KG�Lomberg, entitled �Exploration Results and Mineral Resource Estimate for the Waterberg Platinum Project, South Africa.� (Latitude 23� 21� 53�S, Longitude 28� 48� 23�E)�.
�
The borehole intersections were composited for Pt, Pd, Au, Cu and Ni.� A common seam block model was developed into which the estimate was undertaken.� An inverse distance weighted (power 2) was undertaken using the 3D software package CAE Mining Studio�.
�
Geological loss of 25% was estimated based on the knowledge of the deposit.� The geological losses are made up of areas of where the layers are absent due to faults, dykes, potholes and mafic/ultramafic pegmatites.
�
|
Technical Report for the Update on Exploration Drilling at the for Waterberg Joint Venture and |
� |
�
�
Coffey Mining South Africa (Pty) Ltd
�
Table 6.3.1_1
Waterberg JV Project-
Mineral Resource Estimate; 1 September�2012
�
|
� |
� |
Strati- |
� |
Tonnage |
� |
Pt |
� |
Pd |
� |
Au |
� |
2PGE+Au |
� |
Pt:Pd:Au |
� |
2PGE+Au |
� |
Cu |
� |
Ni |
|
T1 |
� |
2.85 |
� |
10.49 |
� |
0.77 |
� |
1.27 |
� |
0.51 |
� |
2.55 |
� |
30:50:20 |
� |
863 |
� |
0.17 |
� |
0.10 |
|
T2 |
� |
3.46 |
� |
16.25 |
� |
1.10 |
� |
1.82 |
� |
0.92 |
� |
3.84 |
� |
29:47:24 |
� |
2,001 |
� |
0.18 |
� |
0.09 |
|
T Total |
� |
3.19 |
� |
26.74 |
� |
� |
� |
� |
� |
� |
� |
3.33 |
� |
29:48:23 |
� |
2,864 |
� |
� |
� |
� |
|
FH |
� |
4.63 |
� |
18.10 |
� |
0.80 |
� |
1.48 |
� |
0.09 |
� |
2.37 |
� |
34:62:4 |
� |
1,379 |
� |
0.03 |
� |
0.12 |
|
FP |
� |
5.91 |
� |
23.20 |
� |
1.01 |
� |
2.00 |
� |
0.13 |
� |
3.14 |
� |
32:64:4 |
� |
2,345 |
� |
0.04 |
� |
0.11 |
|
F Total |
� |
5.27 |
� |
41.30 |
� |
� |
� |
� |
� |
� |
� |
2.80 |
� |
31:57:12 |
� |
3,724 |
� |
� |
� |
� |
|
Total |
� |
4.19 |
� |
68.04 |
� |
0.94 |
� |
1.71 |
� |
0.37 |
� |
3.01 |
� |
� |
� |
6,588 |
� |
� |
� |
� |
|
Content (koz) |
� |
2,049 |
� |
3,733 |
� |
806 |
� |
� | ||||||||||||
�
6.3.2����������������������������� February�2013
�
An updated mineral resource was declared for the T- and F - Zone mineralization and confined to only the properties Ketting 368LR and Goedetrouw 366LR of the Waterberg JV Project.� Data from the drilling completed by PTM to February�2013 were used to undertake a mineral resource estimate from 207 intersections representing 40 boreholes.� The data and the geological understanding and interpretation were considered of sufficient quality for the declaration of an inferred mineral resource classification.� The resource estimate has been classified based on the criteria set out in Table�6.3.2_1.� This estimate was presented in a NI 43-101 in February�2013 by Mr.�KG Lomberg, entitled �Revised and Updated Mineral Resource Estimate for the Waterberg Platinum, South Africa (Latitude 23� 21� 53�S, Longitude 28� 48� 23�E)�.
�
The borehole intersections were composited for Pt, Pd, Au, Cu and Ni.� A common seam block model was developed into which the estimate was undertaken.� An inverse distance weighted (power 2) was undertaken using the 3D software package CAE Mining Studio�.
�
Geological loss of 25% was estimated based on the knowledge of the deposit. �The geological losses are made up of areas of where the layers are absent due to faults, dykes, potholes and mafic/ultramafic pegmatites.
�
|
Technical Report for the Update on Exploration Drilling at the for Waterberg Joint Venture and |
� |
�
�
Coffey Mining South Africa (Pty) Ltd
�
Table 6.3.2_1
Waterberg JV Project-
Mineral Resource Estimate; 1 February�2013
�
|
� |
� |
Strati- |
� |
Tonnage |
� |
Pt�(g/t) |
� |
Pd�(g/t) |
� |
Au |
� |
2PGE+Au |
� |
Pt:Pd:Au |
� |
2PGE+ |
� |
Cu |
� |
Ni�(%) |
|
T1 |
� |
2.58 |
� |
4.33 |
� |
0.91 |
� |
1.37 |
� |
0.52 |
� |
2.80 |
� |
32:49:19 |
� |
390 |
� |
0.21 |
� |
0.11 |
|
T2 |
� |
4.08 |
� |
25.46 |
� |
1.07 |
� |
1.87 |
� |
0.78 |
� |
3.72 |
� |
29:50:21 |
� |
3,045 |
� |
0.17 |
� |
0.09 |
|
T Total |
� |
3.76 |
� |
29.78 |
� |
1.05 |
� |
1.79 |
� |
0.75 |
� |
3.59 |
� |
29:50:21 |
� |
3,435 |
� |
0.18 |
� |
0.09 |
|
FH |
� |
4.02 |
� |
7.19 |
� |
1.09 |
� |
2.37 |
� |
0.20 |
� |
3.66 |
� |
30:65:6 |
� |
847 |
� |
0.10 |
� |
0.22 |
|
FP |
� |
5.46 |
� |
55.95 |
� |
1.01 |
� |
2.10 |
� |
0.14 |
� |
3.25 |
� |
31:65:4 |
� |
5,838 |
� |
0.06 |
� |
0.16 |
|
F Total |
� |
5.24 |
� |
63.15 |
� |
1.02 |
� |
2.13 |
� |
0.15 |
� |
3.29 |
� |
31:65:4 |
� |
6,685 |
� |
0.06 |
� |
0.17 |
|
Total |
� |
4.63 |
� |
92.93 |
� |
1.03 |
� |
2.02 |
� |
0.34 |
� |
3.39 |
� |
30:60:10 |
� |
10,120 |
� |
� |
� |
� |
|
Content (koz) |
� |
3,071 |
� |
6,040 |
� |
1,009 |
� |
� |
� |
� |
� |
� |
� |
� |
� |
� | ||||
�
6.3.3����������������������������� September�2013
�
Waterberg JV Project
�
A mineral resource was declared for the T- and F - Zone mineralization and confined to only the properties Ketting 368LR and Goedetrouw 366LR of the Waterberg JV Project.� Data from the drilling completed by PTM to 1August�2013 was used to undertake a mineral resource estimate from 337 intersections representing 112 boreholes.� The data and the geological understanding and interpretation were considered of sufficient quality for the declaration of an inferred mineral resource classification.� The resource estimate has been classified based on the criteria set out in Table�6.3.3_1.� This estimate was presented in a NI 43-101 in September�2013 by Mr.�KG Lomberg and Mr.�AB Goldschmidt; entitled �Revised and Updated Mineral Resource Estimate for the Waterberg Platinum Project, South Africa�.
�
The borehole intersections were composited for Pt, Pd, Au, Cu and Ni.� A common seam block model was developed into which the estimate was undertaken.� An inverse distance weighted (power 2) was undertaken using the 3D software package CAE Mining Studio�.
�
Geological loss of 12.5% was estimated based on the knowledge of the deposit.� The geological losses are made up of areas of where the layers are absent due to faults, dykes, potholes and mafic/ultramafic pegmatites.
�
Waterberg Extension Project
�
A mineral resource estimate had not been declared for the Waterberg Extension Project.� There was insufficient drilling completed to support a resource estimate in September�2013.
�
|
Technical Report for the Update on Exploration Drilling at the for Waterberg Joint Venture and |
� |
�
�
Coffey Mining South Africa (Pty) Ltd
�
Table 6.3.3_1
Waterberg JV Project-
Mineral Resource Estimate
2 September�2013
�
|
� |
� |
Strati- |
� |
Tonnage |
� |
Pt�(g/t) |
� |
Pd�(g/t) |
� |
Au |
� |
2PGE+ |
� |
Pt:Pd:Au |
� |
2PGE+ |
� |
Cu |
� |
Ni |
|
T1 |
� |
2.30 |
� |
8.5 |
� |
1.04 |
� |
1.55 |
� |
0.47 |
� |
3.06 |
� |
34:51:15 |
� |
842 |
� |
0.17 |
� |
0.10 |
|
T2 |
� |
3.77 |
� |
39.2 |
� |
1.16 |
� |
2.04 |
� |
0.84 |
� |
4.04 |
� |
29:51:21 |
� |
5,107 |
� |
0.18 |
� |
0.10 |
|
T Total |
� |
3.38 |
� |
47.7 |
� |
1.14 |
� |
1.95 |
� |
0.77 |
� |
3.86 |
� |
30:51:20 |
� |
5,948 |
� |
0.18 |
� |
0.10 |
|
F |
� |
� |
� |
119.0 |
� |
0.91 |
� |
1.98 |
� |
0.13 |
� |
3.02 |
� |
30:65:4 |
� |
11,575 |
� |
0.07 |
� |
0.17 |
|
Total |
� |
� |
� |
166.7 |
� |
0.98 |
� |
1.97 |
� |
0.32 |
� |
3.26 |
� |
30:60:10 |
� |
17,523 |
� |
0.10 |
� |
0.15 |
|
Content (koz) |
� |
5,252 |
� |
10,558 |
� |
1,715 |
� |
� |
� |
� |
� |
� |
� |
� |
� |
� | ||||
Cut-off applied on 2PGE+Au grade
�
6.4��������������������������������������� Production History
�
There has been no production from the Waterberg JV Project or Waterberg Extension Project.
�
|
Technical Report for the Update on Exploration Drilling at the for Waterberg Joint Venture and |
� |
�
�
Coffey Mining South Africa (Pty) Ltd
�
7������������������������������������������������� GEOLOGICAL SETTING AND MINERALIZATION
�
7.1��������������������������������������� Regional and Local Setting
�
The stable Kaapvaal and Zimbabwe Cratons in southern Africa are characterised by the presence of large mafic to ultramafic layered complexes, the best known of which are the Great Dyke in the Zimbabwe Craton and the Bushveld and Molopo Complexes in the Kaapvaal Craton.� By far the largest, best-known and economically most important of these is the Bushveld Complex (Figure�7.1_1), which was intruded about 2,060 million years ago into rocks of the Transvaal Supergroup, largely along an unconformity between the Magaliesberg quartzite of the Pretoria Group and the overlying Rooiberg felsites.� The total estimated extent of the Bushveld Complex is some 66,000 km2, of which about 55% is covered by younger formations.� The mafic rocks of the Bushveld Complex host layers rich in Platinum Group Metals (PGM), chromium and vanadium, and constitute the world�s largest known resource of these metals.
�
The Waterberg JV Project and Waterberg Extension Project are situated off the northern end of the previously known northern limb, where the mafic rocks have a different sequence to those of the eastern and western limbs.� Furthermore the Bushveld rocks transgress the Transvaal Supergroup from the Smelterskop and Magaliesberg formations in the south to the ironstones of the Penge formation further north, the dolomites of the Malmani Subgroup, and eventually resting on the Turfloop granite in the north (Vermaak and Van der Merwe, 2000).
�
The Bushveld Complex in the Waterberg JV Project and Waterberg Extension Project area has intruded across a pre-existing craton scale lithological and structural boundary between two geological zones.� The known northern limb has a north - south orientation to the edge contact that makes an abrupt strike change to the northeast coincident with projection of the east-west trending Hout River Shear system, a major shear that marks the southern boundary of the South Marginal Zone (SMZ).� The SMZ is a 3500Ma aged compressional terrain formed within the Kaapvaal Craton during the collision with the Zimbabwe Craton.� It is comprised of granulite facies granitic gneiss, amphibolitic gneiss and minor quartzite.� Within the SMZ there are several major shears that trend parallel the Hout River Shear (van Reenen, 1992) and trend through the Waterberg Extension Project area (Figure 7.1_1).� The footwall to the Bushveld on Waterberg Project is interpreted to be comprised of facies of the SMZ.
�
The geology of the northern limb of the Bushveld Complex is characterised by the existence of the platiniferous Platreef which was first described by Van der Merwe (Van der Merwe, 1976).� The Platreef is typically a wide pyroxenite hosted zone (up to 100s of metres), of elevated Cu and Ni mineralization with associated anomalous PGM concentrations.� The sulphide mineralization is typically pyrrhotite, chalcopyrite and pentlandite.� It has been postulated that the interaction with the basement rocks and in particular the dolomites has been instrumental in the formation of the mineralization (Vermaak and Van der Merwe, 2000).
�
The Waterberg JV Project and Waterberg Extension Project are an extension of the northern limb of the Bushveld Complex.� The mineralized layers are considered have a different setting to the Platreef.
�
|
Technical Report for the Update on Exploration Drilling at the for Waterberg Joint Venture and |
� |
�
�
Coffey Mining South Africa (Pty) Ltd
�
Figure 7.1._1
Geological Map of the Bushveld Complex
Showing the Location of the Waterberg JV and Waterberg Extension Projects
�
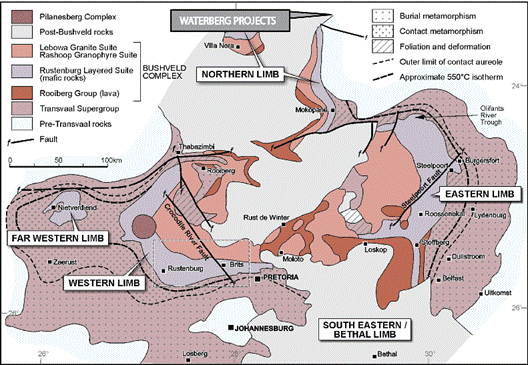
�
Source: After Cawthorn et al 2006
�
7.1.1����������������������������� Bushveld Complex Stratigraphy
�
The mafic rocks (collectively termed the Rustenburg Layered Suite�(RLS)) can be divided into five zones known as the Marginal, Lower, Critical, Main and Upper Zones from the base upwards (Figure�7.1.1_1).
�
The Marginal Zone is comprised of generally finer grained rocks than those of the interior of the Bushveld Complex and contains abundant xenoliths of country rock.� It is highly variable in thickness and may be completely absent in some areas and contains no known economic mineralization.
�
The Lower Zone is dominated by orthopyroxenite with associated olivine-rich cumulates in the form of harzburgites and dunites.� The Lower Zone may be completely absent in some areas.
�
The Critical Zone is characterised by regular and often fine-scale rhythmic, or cyclic, layering of well-defined layers of cumulus chromite within pyroxenites, olivine-rich rocks and plagioclase-rich rocks (norites, anorthosites etc).� The economically important PGM deposits are part of the Critical Zone.
�
The Critical Zone hosts all the chromitite layers of the Bushveld Complex, of which up to 14 have been identified.� The first important cycle is the Upper Group Chromitite Layer (UG1 Chromitite Layer and UG2 Chromitite Layer).� The UG1 Chromitite Layer, which is the lower unit, consists of a chromitite layer and underlying footwall chromitite layers that are interlayered
�
|
Technical Report for the Update on Exploration Drilling at the for Waterberg Joint Venture and |
� |
�
�
Coffey Mining South Africa (Pty) Ltd
�
with anorthosite.� The most important of the chromite cycles for PGM mineralization is the upper unit, the UG2 Chromitite Layer, which averages some 1m in thickness.
�
Underlying the UG Chromitite Layers are the Middle Group Chromitite Layers which consists of four groups of chromitite layers with an overall thickness of 15 � 80m.
�
The two uppermost units of the Critical Zone are the Merensky and Bastard units.� The former is also of great economic importance as it contains at its base the PGM-bearing Merensky Reef, a feldspathic pyroxenitic assemblage with associated thin chromitite layers that rarely exceeds 1m in thickness.� The top of the Critical Zone is generally defined as the top of the robust anorthosite (the Giant Mottled Anorthosite) that forms the top of the Bastard cyclic unit.
�
The Critical Zone may be subdivided into the Upper and Lower Critical Zones based on the last appearance of cumulus feldspar.� This boundary is considered to be between the Upper and Middle Group Chromitite Layers.
�
The economically viable chromite reserves of the Bushveld Complex, most of which are hosted in the Critical Zone, are estimated at 68% of the world�s total, whilst the Bushveld Complex also contains 56% of all known platinum group metals.� The Merensky Reef, which developed near the top of the Critical Zone, can be traced along strike for 280km and is estimated to contain 60,000t of PGM to a depth of 1,200m below surface.� The pyroxenitic Platreef mineralization, north of Mokopane (formerly Potgietersrus), contains a wide zone of more disseminated style platinum mineralization, along with higher grades of nickel and copper than occur in the rest of the Bushveld Complex.
�
The well-developed Main Zone consists of norites grading upwards into gabbronorites.� It includes several mottled anorthosite layers in its lower sector and a distinctive pyroxenite layer two thirds of the way up, termed the Pyroxenite Marker.
�
The base of the overlying Upper Zone is defined by the first appearance of cumulus magnetite above the Pyroxenite Marker.� In all, 25 layers of cumulus magnetite punctuate the Upper Zone, the fourth (Main Magnetite layer) being the most prominent.� This is a significant marker, some 2m thick, resting upon anorthosite, and is exploited for its vanadium and titanium content in the eastern and western limbs of the Bushveld Complex.
�
|
Technical Report for the Update on Exploration Drilling at the for Waterberg Joint Venture and |
� |
�
�
Coffey Mining South Africa (Pty) Ltd
�
Figure 7.1.1_1
Waterberg JV Project
Generalised Stratigraphic Columns of the Eastern and Western Limbs compared to the Stratigraphy of The Northern Limb of the Bushveld Complex.
�

�
7.1.2����������������������������� The Northern Limb
�
The northern limb is a slightly sinuous, north-south striking sequence of igneous rocks of the Bushveld Complex with a length of 110km and a maximum width of 15km (Figures 7.1.2_1 and 7.1.2_2).� It is generally divided up into three different sectors namely the Southern, Central and Northern sectors which have characteristic footwalls:-
�
���������������������� The Southern Sector is characterised by a footwall of the Penge Formation of the Transvaal Supergroup
�
���������������������� The Central Sector generally has a footwall of Malmani Subgroup and
�
���������������������� The Northern Sector has a footwall consisting of Archaean granite
�
|
Technical Report for the Update on Exploration Drilling at the for Waterberg Joint Venture and |
� |
�
�
Coffey Mining South Africa (Pty) Ltd
�
Figure 7.1.2_1
General Geology of the northern limb of the Bushveld Complex
�

������������������������������� Source: Sharman-Harris (2006)
�
|
Technical Report for the Update on Exploration Drilling at the for Waterberg Joint Venture and |
� |
�
�
Coffey Mining South Africa (Pty) Ltd
�
Figure 7.1.2_2
Geology of the northern limb of the Bushveld Complex showing the Various Footwall Lithologies
�
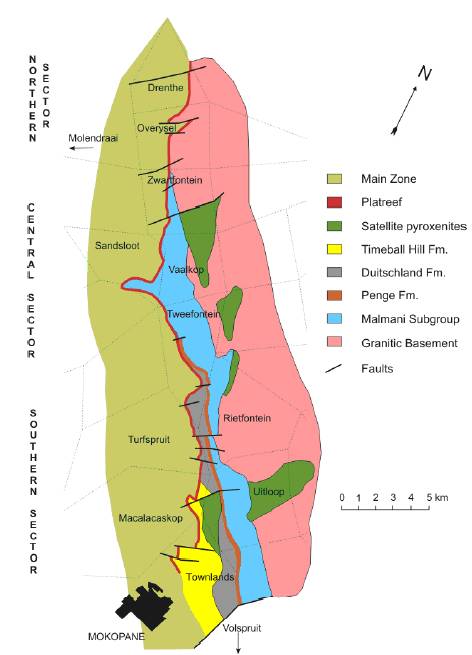
������������������������������� Source: Sharman-Harris (2006)
�
|
Technical Report for the Update on Exploration Drilling at the for Waterberg Joint Venture and |
� |
�
�
Coffey Mining South Africa (Pty) Ltd
�
7.1.3����������������������������� The Platreef and its Mineralization
�
In the northern limb of the Bushveld Complex, the Lower and the Critical Zones of the Bushveld Complex are poorly developed.� Where the Bushveld Complex is in contact with the Archaean granite and sediments of the Transvaal Supergroup floor rocks the Platreef is developed.� The contact between the RLS and footwall rocks in the northern limb is transgressive, with the Platreef in contact with progressively older rocks of different lithologies from south to north.
�
The Platreef is a series of pyroxenites and norites, containing xenoliths/rafts of footwall rocks.� It is irregularly mineralized with PGM, Cu and Ni.� The Platreef (senso stricto) has a strike extent of some 30km, whereas Platreef-style mineralization occurs over the 110km strike length of the northern limb (Kinnaird et al, 2005).� The Platreef varies from 400m thick in the south of the northern limb to <50m in the north.� The overall strike is northwest or north, with dips 40�45� to the west at surface with the dip becoming shallower down dip.� The overall geometry of the southern Platreef appears to have been controlled by irregular floor topography.
�
The Platreef is also a highly geochemically variable unit, with research suggesting that lateral variations in the geochemistry of the Platreef are the result of interaction with and incorporation of different types of footwall rock.� The Platreef consists of a complex assemblage of pyroxenites, serpentinites and calc-silicates.� The nature of these rocks is related to interaction of the Bushveld magma with the lime-rich floor rocks which resulted in the formation of abundant lime-rich minerals (calc-silicates) as well as the serpentinization of the overlying pyroxenites.� Base metal and PGM concentrations are found to be highly irregular, both in value as well as in distribution.� The mineralization in places reaches a thickness of up to 40m.
�
Lithologically, the southern Platreef is heterogeneous and more variable than sectors further north and, although predominantly pyroxenitic, includes dunites, peridotites and norite cycles with anorthosite in the mid to upper portion.� Zones of intense serpentinisation may occur throughout the package.� Country rock xenoliths, <1,500m long, are common.� In the south these are typically quartzites and hornfels (metamorphosed banded ironstones, shales, mudstones and siltstones) whereas further north dolomitic or calcsilicate xenoliths also occur.
�
Faults offset the strike of the Platreef: a north�south, steeply dipping set is predominant with secondary east-northeast and east-southeast sets dipping 50�70�S.� The fault architecture was pre-Bushveld and also locally controlled thickening and thinning of the succession.
�
Although the major platinum group minerals consist of PGM tellurides, platinum arsenides and platinum sulphides, there appears to be a link between the rock type and the type of platinum group minerals with the serpentinites being characterised by a relative enrichment in sperrylite (PtAs2), the upper pyroxenites generally being characterised by more abundant PGM sulphides and alloy (Schouwstra et al 2000).� PGM alloys typically dominate the mineralization closer to the floor rocks.� Sulphides may reach >30% in some intersections.� These are dominated by pyrrhotite, with lesser pentlandite and chalcopyrite, minor pyrite and traces of a wide compositional range of sulphides.� The presence of massive sulphides is localised, commonly, but not exclusively towards the contact with footwall metasedimentary rocks.� The magmatic sulphides are disseminated or have a net-texture with a range of a few microns to 2cm sized grains.� Much of the sulphide mineralization is associated with intergranular plagioclase, or
�
|
Technical Report for the Update on Exploration Drilling at the for Waterberg Joint Venture and |
� |
�
�
Coffey Mining South Africa (Pty) Ltd
�
quartz-feldspar symplectites, along the margins of rounded cumulus orthopyroxenes.� The PGMs in the southern sector occur as tellurides, bismuthides, arsenides, antimonides, bismuthoantimonides and complex bismuthotellurides.� PGM are rarely included in the sulphides but occur as micron-sized satellite grains around interstitial sulphides and within alteration assemblages in serpentinized zones.� The Pt:Pd ratio �1 with the PGM concentration not necessarily linked to either the sulphur or base metal abundance.
�
In the southern sector, mineralized zones have grades of 0.1�0.25% Cu and 0.15�0.36% Ni.
�
7.2��������������������������������������� Waterberg Group /Bushveld Complex Age Relationship
�
The age relationship of the Waterberg Group and the Bushveld Complex was re-examined as a result of this data.
�
Conventional understanding is that the Bushveld Complex is dated at 2,060Ma.� The Waterberg Group is dated at 1,879 � 1,872Ma based on dolerite intrusions into the upper strata.� Other references in the literature are made to the relationship:
�
���������������������� An unconformity resting on rocks including the Bushveld granites and mafic rock of the Bushveld (Barker et al, 2006)
�
���������������������� The Swaershoek Formation which is at the base of the Nylstroom Subgroup is reported to be deposited penecontemporaneous with the Bushveld granites (Barker et al, 2006)
�
���������������������� The Nebo Granite which are recognised to form the roof to the Bushveld
�
���������������������� The SHRIMP U-Pb dating of the Waterberg Group suggests that quartz porphyry lavas near the base have ages between 2,054�4Ma and 2,051�8Ma.� It has been interpreted that sedimentation began immediately after the intrusion of the Bushveld Complex (Dorland et al., 2006).
�
In this context the relationship has been examined by Prof TS McCarthy of The University of the Witwatersrand (October 2012).� The field relationships in the vicinity of the Waterberg JV Project were noted to indicate that the Bushveld Complex is unconformably overlain by the sandstones of the Setlaole Formation of the Waterberg Group, which is post-Bushveld in age.� The core drilling undertaken by PTM shows that an angular unconformity exists between the Waterberg Group and underlying Bushveld Complex.
�
The contact between the Waterberg Group and the weathered Bushveld Complex has been observed in the borehole core to generally be sharp.� In several of the drill intersections, conglomerate and grit horizons are developed on the contact and appear to contain altered magnetite, suggesting the development of placer mineralization.� If present, such mineralization is likely to be channelized, as the basal deposits appear to be fluvial.� The unusual contact zone between the two rock units was examined by Prof McCarthy and is interpreted as a palaeosol (fossilized soil) developed on the Bushveld gabbros.� Features in the palaeosol are reminiscent of modern weathering of Bushveld rocks were observed.� The weathering is considered typically spheroidal in character and culminates in a very fine-grained upper black turf layer (vertisol), corresponding to the �shale� in the drill intersections.
�
|
Technical Report for the Update on Exploration Drilling at the for Waterberg Joint Venture and |
� |
�
�
Coffey Mining South Africa (Pty) Ltd
�
The nature of the relationship between the Waterberg Group and the Bushveld Complex is confirmed as having no bearing on the presence of mineralization in the gabbros (T or F - Zones) (McCarthy, 2012).
�
Further to this Prof McCarthy observed that the northern extremity of the northern limb of the Bushveld Complex contains a well developed Platreef horizon, but in addition has mineralization developed in the Upper Zone.� The T - Zone has a high Cu/Ni ratio and is Pd and Au dominated.� Sulphides similar to this have been described previously from the Upper Zone, but occur in very small quantities, suggesting that atypical conditions pertain in the project area (McCarthy, 2012).� In addition, the layered sequence in the north is underlain by quartzite which appears to be a correlative of the upper Pretoria Group.� This being the case, Prof McCarthy considers that there is the potential for the development of a fairly extensive Bushveld sub-basin beneath the Waterberg which is also supported by a local gravity high in the area.
�
7.3��������������������������������������� Project Geology
�
The Waterberg JV and Waterberg Extension Projects are adjoining projects located along the strike extension of the Bushveld Complex (Figure 7.3_1).
�
Waterberg JV Project
�
The Waterberg JV Project consists predominantly of the Bushveld Main Zone gabbros, gabbronorites, norites, pyroxenites and anorthositic rock types with more mafic rock material such as harzburgite and troctolites that partially grade into dunites towards the base of the package.� In the southern part of the project area, Bushveld Upper Zone lithologies such as magnetite gabbros and gabbronorites do occur as intersected in borehole WB001 and WB002.� The Lower Magnetite Layer of the Upper Zone was intersected on the south of the project property (Disseldorp) where borehole WB001 was drilled and intersected a 2.5m thick magnetite band.
�
A general dip of 34� - 38� towards the west is observed from borehole core for the layered units intersected on Waterberg property within the Bushveld Package (Figure 7.3_2).� However, some blocks may be tilted at different angles depending on structural and /or tectonic controls.� And generally the Bushveld package strikes south-west to north-east
�
The Bushveld Upper Zone is overlain by a 120m to 760m thick Waterberg Group which is a sedimentary package predominantly made up of sandstones, and within the project area the two sedimentary formations known as the Setlaole and Makgabeng Formations constitute the Waterberg Group.� The Waterberg package is flat lying with dip angles ranging from to 2� to 5�.
�
The base of the Bushveld Main Zone package is marked by the presence of a transitional zone that constitutes a mixed zone of Bushveld and altered sediments/quartzites before intersecting the Transvaal Basement Quartzite and Metasediments.
�
|
Technical Report for the Update on Exploration Drilling at the for Waterberg Joint Venture and |
� |
�
�
Coffey Mining South Africa (Pty) Ltd
�
Figure 7.3_1
Geology of the Waterberg Project
�

�
|
Technical Report for the Update on Exploration Drilling at the for Waterberg Joint Venture and |
� |
�
�
Coffey Mining South Africa (Pty) Ltd
�
Structurally, the area has abundant intrusives in the form of thick dolerite, diorite and granodiorite sills or dykes predominantly in the Waterberg package.� A few thin sills or dykes were intersected within the Bushveld package.� Faults have been interpolated from the aerial photographs, geophysics and sectional interpretation and drilling.� The faults generally trend (east-west across the property and some are north-west and south-west trending (Figure 7.3_1).
�
Figure 7.3_2
Section Showing Geology at Waterberg Project
�
�
Waterberg Extension Project
�
The project geology in the southern portion of the Waterberg Extension Project appears to be similar to the adjoining Waterberg JV Project to the southwest.� However, due to the widely spaced drilling further north on the Waterberg Extension Project there is limited information on the nature of the Bushveld stratigraphy.
�
Borehole intercepts to date of the Bushveld Complex at the Waterberg Extension Project consists predominantly of Main Zone gabbros, gabbronorites, norites, pyroxenites and anorthositic rock types with more mafic rock material such as harzburgite and troctolites that partially grade into dunites towards the base of the package.� In the southern part of the project area, Bushveld Upper Zone lithologies such as magnetite gabbros and gabbronorites have not
�
|
Technical Report for the Update on Exploration Drilling at the for Waterberg Joint Venture and |
� |
�
�
Coffey Mining South Africa (Pty) Ltd
�
been noted in drill core to date but given the geometry of the intrusive suite may sub-outcrop below the Waterberg Group further west on the Property.�
�
A general dip of the layers in the Bushveld Complex rocks of 25� - 38� towards the west is observed from the geometry from borehole logging (Figure 7.3_2).� However, some blocks may be tilted at different angles depending on structural and /or tectonic controls.� Generally the Bushveld layered package strikes south-west to north-east in the southern 5km part of the Project area and then appears to turn to a more north-south strike direction.� This change in strike direction loosely corresponds to the western strike projection of a major shear within the SMZ.
�
The Bushveld Complex as intersected to date in the Project area is overlain by a minimum 300m of Waterberg Group which is a sedimentary package predominantly made up of sandstones.� The two sedimentary formations known as the Setlaole and Makgabeng Formations constitute the Waterberg Group within the Project area.� The Waterberg package is flat lying with dip angles ranging from to 2� to 5�.
�
The base of the Bushveld Main Zone package is marked by the presence of a transitional zone that constitutes a mixed zone of Bushveld with gneiss and/or altered sediments/quartzites before intersecting the Basement Gneiss, quartzite/ metasediments and lithologies of the SMZ mobile belt lithologies consisting of granulite facies gneiss, mafic gneiss and a later pegmatoidal pink granitoid.� SMZ rocks are mapped on surface to within 1km east of the intrusive edge before being covered by Waterberg Group.� The nature of the basement rock on the Waterberg Extension Project is currently being studied in the context of regional geology.
�
Structurally, faults have been interpolated from the aerial photographs, airborne geophysical surveys and geological interpretation from drilling and regional mapping projects (Van Reenen, 1992).� The faults generally trend east-west across the property and some are north-west and south-west trending (Figure 7.3_3).� Two major shear zones from the SMZ project into the Project area; the Matok Shear and the Petronella Shear (Van Reenen, 1992).� These structures were pre-existent to the intrusion of the Bushveld Complex and are interpreted to play a role in the geometry of the intrusive chamber and mineralized layers.
�
There is a general increase in the frequency of late intrusive rocks in the form of dolerite, diorite and granodiorite dykes predominantly in the Waterberg package.� A few thin sills or dykes were intersected within the Bushveld package.� The dolerite dykes have a variable positive magnetic response and have been modelled in 3D from the detailed airborne magnetic data as being vertical to a minimum depth of 300m.� Field mapping confirms the vertical nature of the dykes and recessive weathering nature on surface.� The sills and dykes are of similar composition however, the interrelation of the two is currently not known.� Many of the east-west dykes appear to have exploited pre-existing structures such as major shears and faults.
�
A flat lying granodiorite sill with average thicknesses of 80m appears to be exploiting the contact between the Bushveld Complex igneous rocks and the overlying Waterberg sedimentary rocks (Figure 7.3_3).� This sill as seen in borehole intercepts displays both an upper and lower chill margin indicating post Waterberg emplacement.� The sill outcrops to the east of the projected
�
|
Technical Report for the Update on Exploration Drilling at the for Waterberg Joint Venture and |
� |
�
�
Coffey Mining South Africa (Pty) Ltd
�
edge of the Bushveld and forms low, flat top hills.� Using the depth of the sill intersections in drilling and the surface outcrop pattern to the east there appears to be a kink in the dip of sill at or near the projected Bushveld edge that explains the vertical difference in the position of the sill between surface and downhole.
�
|
Technical Report for the Update on Exploration Drilling at the for Waterberg Joint Venture and |
� |
�
�
Coffey Mining South Africa (Pty) Ltd
�
|
Figure 7.3_3 Geology of the Waterberg Extension Project |
|
|
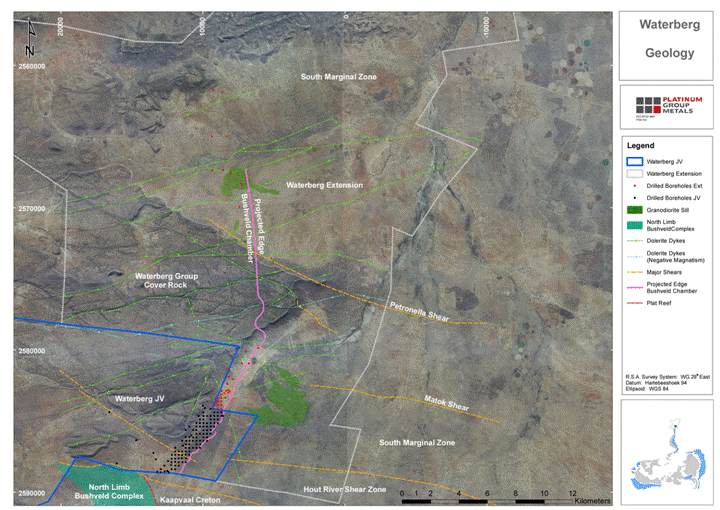
�
|
Technical Report for the Update on Exploration Drilling at the for Waterberg Joint Venture and |
� |
|
Waterberg Extension Projects South Africa � 24 November�2014 |
�
�
Coffey Mining South Africa (Pty) Ltd
�
7.3.1����������������������������� Stratigraphy
�
The initial phase of diamond exploration drilling (WB001 and WB002) on the Waterberg JV Project intersected Waterberg Group Sediments (sandstones) and Bushveld Upper Zone and Main Zone lithologies in the western portion of Disseldorp property.� The follow-up drilling campaign revealed a generalised schematic stratigraphic section that has been adopted for use in this property as presented in Figure 7.3.1_1.
�
The initial phase of diamond exploration drilling on Waterberg Extension Project has intercepted similar stratigraphy to the adjacent and contiguous Waterberg JV Project to the south.� Generally, the layers correlate well between the projects and at Waterberg Extension Project initial drilling has intersected Waterberg Group Sediments (sandstones) and Bushveld Complex Main Zone lithologies in the southern portion of the farm Early Dawn.
�
Floor Rocks
�
The floor rocks underlying the Transitional zone are predominantly granite gneiss hosting remnants of magnetite quartzite, metaquartzite, metapelites, serpentinites and metasediments.� Some boreholes within the project area have shown dolerite intrusions within the floor rocks, such as borehole WB028.� Pink pegmatoidal granite was noted in the Basement of one borehole on the Waterberg Extension Project.
�
Bushveld Complex
�
Igneous Bushveld Complex lithologies underlie the Waterberg Group starting with the Upper Zone and underlain by the Main Zone.
�
The Main Zone
�
The Main Zone which hosts the PGM mineralized layers in its cyclic sequences of mafic and felsic rocks, is 150m to 900m thick.� It is predominantly composed of gabbronorite, norite, pyroxenite, harzburgite, troctolite with occasional anorthositic phases
�
Abundant alteration occurs in these lithologies including chloritisation, epidotisation and serpentinisation.� Parts of the F - Zone are magnetic due to the serpentinisation of the olivines.� The F - Zone forms the base of the Main Zone, and it is usually underlain by a transitional zone of intermixed lithologies such as metasediments, metaquartzite / quartzite, and Bushveld lithologies.
�
The Upper Zone
�
The south-western part of the project area (west of the farm Ketting towards farm Disseldorp) has a thick package of Upper Zone lithologies.� The package in the project consists of magnetite gabbro, mela-gabbronorite and magnetite seams and may be as thick as 350m.� Borehole WB001 on farm Disseldorp collared in Upper Zone and drilled to the depth of 322m and while still in the Upper Zone intersected a 2.5m thick magnetite seam.
�
The appearance of the first non-magnetic mafic lithologies indicates the start of the underlying Main Zone.
�
|
Technical Report for the Update on Exploration Drilling at the for Waterberg Joint Venture and |
� |
|
Waterberg Extension Projects South Africa � 24 November�2014 |
�
�
Coffey Mining South Africa (Pty) Ltd
�
|
Figure 7.3.1_1 General Stratigraphy of the Waterberg Projects
|

�
|
Technical Report for the Update on Exploration Drilling at the for Waterberg Joint Venture and |
� |
|
Waterberg Extension Projects South Africa � 24 November�2014 |
�
�
Coffey Mining South Africa (Pty) Ltd
�
Waterberg Group
�
The Waterberg Sedimentary package occurs with mostly two formations within the project area i.e.� the Makgabeng and Setlaole Formations.� The whole package may have a thickness ranging from 120m to just over 760m.� Generally the Waterberg Sedimentary package in the southwest and thins towards the centre of the project area before thickening to the north.� The east-west trending feature through the middle part of the Project is considered to be an erosional channel.
�
Setlaole Formation
�
This is the sedimentary formation underlying the Makgabeng Formation and sits at the base of the Waterberg Group sedimentary succession.� It is this formation that overlies the Bushveld igneous rocks, and has been intersected in more than 90% of the boreholes within the project area.
�
Lithologically, the Setlaole Formation consists of medium to coarse grained sandstones and several mudstones and shales, that have a general purple colour and usually the package displays a coarsening down sequence.� Towards the base of the formation, pebbles may be seen that will eventually appear to be forming conglomerates.� The rocks are frequently intruded by dolerite and granodiorite sills.� A red shale band of variable thickness is generally present at the base of the Setlaole Formation, below the basal conglomerate.
�
Makgabeng Formation
�
This sedimentary formation overlies the Setlaole Formation and is mostly exposed in the mountain cliffs in the northern part of the project area.� The formation is composed of light- red coloured banded sandstone rocks and generally displays a horizontal inclination.
�
7.3.2����������������������������� Structure
�
The Waterberg Sedimentary package has been intersected by numerous criss-crossing dolerite or granodiorite sills or dykes.� These usually range from as thin as 5cm to as thick as 90m.
�
A major northwest-southeast trending fault has been inferred based on boreholes towards the southern part of the Ketting property.� The fault throw is estimated to be approximately 300m.� A further fault splay has also been interpreted on the south-eastern part of Ketting.
�
7.4��������������������������������������� Mineralized Zones
�
PGM mineralization within the Bushveld package underlying the Waterberg JV Project is hosted in two main layers: the T - Zone and the F � Zone.
�
The T - Zone occurs within the Main Zone just beneath the contact of the overlaying Upper Zone.� Although the T � Zone consists of numerous mineralized layers, two potential economical layers have been identified, T1- and T2 - Layers.� They are composed mainly of anorthosite, pegmatoidal gabbros, pyroxenite, troctolite, harzburgite, gabbronorite and norite.�
�
The F - Zone is hosted in a cyclic unit of olivine rich lithologies towards the base of the Main Zone towards the bottom of the Bushveld Complex.� This zone consists of alternating units of
�
|
Technical Report for the Update on Exploration Drilling at the for Waterberg Joint Venture and |
� |
|
Waterberg Extension Projects South Africa � 24 November�2014 |
�
�
Coffey Mining South Africa (Pty) Ltd
�
harzburgite, troctolite and pyroxenites.� The F - Zone has been divided into the FH and FP layers.� The FH layer has significantly higher volumes of olivine in contrast with the lower lying FP layer, which is predominately pyroxenite.� The FH layer is further subdivided into six cyclic units chemically identified by their geochemical signature, especially chrome.� The base of these units can also lithologically identified by a pyroxenite layer.
�
The mineralization generally comprises sulphide blebs, net-textured to interstitial sulphides and disseminated sulphides within gabbronorite and norite, pyroxenite, harzburgite.
�
Within the F - Zone, basement topography may have played a role in the formation of higher grade and thicknesses where embayments or large scale changes in magma flow direction facilitated the accumulation of magmatic sulphides.� These areas are referred to by PTM as the �Super F� Zones where the sulphide mineralization is over 40m thick and within the defined areas average 3g/t to 4g/t 2PGE+Au.� Layered magmatic sulphide mineralization is generally present at the base of the F - Zone.� As with the T - Zone, the sub-outcrop of the F - Zone unconformably abuts the base of the Waterberg Group sedimentary rocks and trends northeast from the end of the known northern limb and dips moderately to the northwest.
�
The T - Zone includes a number of lithologically different and separate layers (Figure 7.4_1) which were initially recognised in the drilling.� With subsequent drilling, it has become clear that the most easily identifiable and consistent are the T1 and T2 - Layers.
�
|
Figure 7.4_1 Stratigraphy of the Mineralised Layers |
|
|

�
|
Technical Report for the Update on Exploration Drilling at the for Waterberg Joint Venture and |
� |
|
Waterberg Extension Projects South Africa � 24 November�2014 |
�
�
Coffey Mining South Africa (Pty) Ltd
�
Description of Mineralised Zones
�
T - Zone
�
The T - Zone is a correlateable unit which includes five identifiable layers.� The two mineralized and economical potential layers are the T1 - Layer underlain by the T2 - Layer.� The remaining layers are considered to have less economic potential at this stage and are seen as internal waste between the T1 - and T2 - Layers.
�
UPA (Upper Pegmatoidal Anorthosite) � This is the T1 - Layer hangingwall which has a pegmatoidal texture, is mostly anorthositic and in a few cases gabbroic.� This unit is generally not mineralized however it has been found to have some sulphide mineralization in a few boreholes and the mineralization is hosted within the mafic crystals of the pegmatoidal texture.
�
This unit has a thickness range of 2m to as thick as 100m, and it has over 80% correlation throughout the boreholes.� It must be noted that the unit is absent in some few boreholes and it also appears more mafic in some instances due to alteration of the anorthositic and gabbroic phases.
�
Mineralization within the T1 � Layer is hosted in a troctolite with variations in places where troctolite grades into feldspathic harzburgite. In other localities, olivine bearing feldspathic pyroxenite grades into feldspathic harzburgite.� The 3PGE+Au grade (g/t) is typically 1-7g/t with a Pt:Pd ratio of about 1:1.7.� The Cu and Ni grades are typically 0.08% and 0.08% respectively.
�
The unit is mineralized with blebby to net-textured Cu-Ni sulphides (chalcopyrite/pyrite and pentlandite) with very minimal Fe-sulphides (pyrrhotite).� The thickness of the layer varies from 2m to 6m.
�
The direct footwall unit of the T1 - Layer can be divided into two identifiable units: the Lower Pegmatoidal Anorthosite (LPA) and the Lower Pegmatoidal Pyroxenite (LPP).� These units have an unconformable relationship with one another as both are not always present.
�
LPA (Lower Pegmatoidal Anorthosite) � This is the first middling unit underlying the T1 � Layer.� It has the same composition as that of the UPA but is usually thinner than the UPA.� The thickness for this unit ranges from 0 � 3m, and in some boreholes this unit is not developed.� This unit is mineralized in some boreholes.
�
LPP (Lower Pegmatoidal Pyroxenite) � This is the second middling unit which underlies the LPA, and it predominantly composed of pegmatoidal pyroxenite.� It also ranges from 0 � 3m as it is not developed in other boreholes.� This unit also sits as a T2 - Layer hangingwall.� Mineralization has not been identified in this unit.
�
Mineralization within the T2 � Layer is hosted in Main Zone norite and gabbronorite that shows a distinctive elongated texture of milky feldspars.� In some instances, the T2 gabbronorite / norite tends to grade into pyroxenite and in places�into�a pegmatoidal feldspathic pyroxenitic phases, with the same style of mineralization as in the gabbronorite / norite.� Lithologically, the T2 - Layer is generally thicker than the T1 � Layer.� The high grade zones range from 2m to
�
|
Technical Report for the Update on Exploration Drilling at the for Waterberg Joint Venture and |
� |
|
Waterberg Extension Projects South Africa � 24 November�2014 |
�
�
Coffey Mining South Africa (Pty) Ltd
�
approximately 10m within these lithologies.� Sulphide mineralization in T2 � Layer is net textured to disseminated with higher concentration of sulphides compared to the overlying T1 - Layer.� The 3PGE+Au grade (g/t) is typically 1-6g/t with a Pt:Pd ratio of about 1:1.7.� The Cu and Ni grades are typically 0.17% and 0.09% respectively.
�
A thick package of norite and gabbronorite ranging from 100m to about 450m underlies the T - Zone and overlies the F - Zone.
�
F - Zone mineralization is hosted in a thick package of troctolite which usually has small-sized bands of pyroxenite�and / or pegmatoidal pyroxenite and harzburgite.� These layers or pulses have been identified using their geochemical signatures and various elemental ratios.� The initial subdivision has been into a harzburgitic layer (FH) which is overlain by a pyroxenitic layer (FP).� The harzburgitic layer (FH) has been further subdivided into six units of varying thickness based on the noted significant occurrence of chrome in the geochemical signature (Figure�7.4_2).� In each case the concentration of the chrome falls off steadily going up in the sequence until the next significant occurrence of chrome is noted.
�
|
Figure 7.4_2 Individual Units of the F - Zone |
|
|
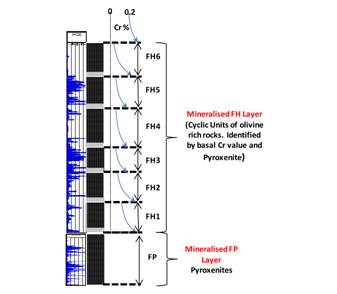
�
|
Technical Report for the Update on Exploration Drilling at the for Waterberg Joint Venture and |
� |
|
Waterberg Extension Projects South Africa � 24 November�2014 |
�
�
Coffey Mining South Africa (Pty) Ltd
�
8������������������������������������������������� DEPOSIT TYPES
�
The Platreef (senso stricto) as described in Section�7.1.2 has a strike extent of some 30 km, whereas Platreef-style mineralization, which is the anticipated target of the Waterberg JV Project, occurs over the 110km strike length of the northern limb (Kinnaird et al, 2005).
�
The Platreef is a layered deposit hosted by a combination of norite, pyroxenite, and harzburgite lithologies and is present towards the base of the Bushveld Complex, in contact with metasedimentary and granitic floor rocks.� The Platreef varies from 400m thick in the south of the northern limb to <50m in the north.� The overall strike is northwest or north, with dips 40�45� to the west at surface with the dip becoming shallower down dip.� The overall geometry of the southern Platreef appears to have been controlled by irregular floor topography.
�
The Platreef-type deposits can include the following features:
�
���������������������� Sulphide hosted nickel, copper and PGM mineralization considered to be of magmatic origin.
�
���������������������� A deposit hosted by a composite a combination of norite, pyroxenite, and harzburgite rocks.
�
���������������������� Contact style mineralization along the base of the intrusion; which may be several hundreds of metres in thickness.
�
���������������������� The mineralized rocks contain locally abundant xenoliths of floor rocks (typically dolomite and shale) suggesting interaction of the magma with relatively reactive floor rocks.
�
���������������������� Thick mineralized intervals greater than 5m and locally tens to hundreds of metres thick.
�
The mineralized layers of the Waterberg JV and Waterberg Extension Projects meet some these criteria:
�
���������������������� The mineralization is hosted by sulphides that are apparently magmatic in origin.
�
���������������������� The mineralized layers can be relatively thick, greater than 10m.
�
The other criteria relating to the Platreef have yet to be demonstrated.� As a result this mineralization is considered to be similar i.e.� Platreef-like but its stratigraphic position, geochemical and lithological profiles suggest a type of mineralization not previously recognised in the Bushveld Complex.
�
|
Technical Report for the Update on Exploration Drilling at the for Waterberg Joint Venture and |
� |
|
Waterberg Extension Projects South Africa � 24 November�2014 |
�
�
Coffey Mining South Africa (Pty) Ltd
�
9������������������������������������������������� EXPLORATION
�
9.1��������������������������������������� Current Exploration
�
The Waterberg JV Project is at a more advanced exploration status and includes an Inferred Mineral Resource estimate.� The Waterberg Extension Project is at an advanced exploration stage that was initiated later to investigate the interpreted strike extension of the Bushveld Complex from the Waterberg JV Project.� As a result of this drilling program portions of the Waterberg Extension Project can be classified as an Inferred Mineral Resource.
�
A multidisciplinary project team established by PTM identified and ranked 108 Southern African targets through an interactive process using an expert ranking system.� These are located in mafic to ultramafic rocks and have the potential, or have already been shown, to host PGM and Ni deposits.� Targets were characterised by varying maturity.� In addition, an innovative approach has been adopted, which also resulted in the identification and definition of �out of the box� targets defining some 12 targets.� Application for the prospecting rights in respect of four of these targets has been made.
�
Farm boundaries were defined for these various targets areas.� Project activities began with the deed searches, detailed desk top studies of the selected areas, and the subsequent compilation of prospecting right applications.
�
The shape and extent of the extension to the Bushveld Complex below younger rocks and cover, was not known.� Regional gravity and magnetics indicated potential existence of rocks of the Bushveld Complex that had not been explored.� Detailed gravity and magnetic surveys by PTM, funded by JOGMEC indicated the possibility of Bushveld Complex rocks within the Waterberg JV Project area.� Later detailed airborne geophysics funded by PTM indicated the possibility of further strike extension of the Bushveld Complex within the Waterberg Extension Project area.
�
Previous mineral exploration activities were limited due to the extensive sand cover and the understanding that the area was underlain by the Waterberg Group.� Initial exploration was driven by detailed gravity and magnetics.� Subsequently exploration was driven by drilling and has been undertaken by PTM.
�
9.1.1����������������������������� Surface Mapping
�
Topographical and aerial maps for Waterberg at a scale of 1:10,000 were used for surface mapping.� A combination of the surface maps and the public aeromagnetic and gravity maps formed the basis for the structural map.
�
Ground exploration work undertaken includes geological mapping and ground verification of the geology presented in various government and academic papers.� The major faults and SMZ geology described was confirmed to exist within the property.� Contact relationships with the Bushveld Complex were not seen due to the Waterberg cover rock and quaternary sand deposits.
�
|
Technical Report for the Update on Exploration Drilling at the for Waterberg Joint Venture and |
� |
|
Waterberg Extension Projects South Africa � 24 November�2014 |
�
�
Coffey Mining South Africa (Pty) Ltd
�
Data for any outcrop observed (or control point) was recorded.� Each of such outcrop points had the following recorded in the field book: point�s name, description of the outcrop�s rock, identified rock name, XY coordinate points, and if well oriented the dip and strike for the outcrop.
�
It is noted that most of the area surrounding the Waterberg Mountains is covered by Waterberg sands and as such mapping in these areas has provided minimal information.� Access to some parts of the Waterberg Mountains is problematic due to steep slopes close to the mountains.
�
9.1.2����������������������������� Geochemical Soil Sampling
�
In March�2010 two north-south sampling lines (Figure 9.1.2_1) were undertaken.� Sampling stations were made at intervals of 25m.� Each sample hole was allowed to go to a minimum depth of 50cm to 1.00m at most.
�
During December�2011 and January�2012 two additional north-south lines on the property Niet Mogelyk 371LR were also sampled (Figure 9.1.2_1).� These two lines were done to target the east-west trending dykes that are running through this property and the sampling stations were set at 50m apart.
�
During January�2013 an additional three lines were taken on the farms Bayswater 370LR and Niet Mogelyk 371LR.� These samples were taken to investigate soil anomalies discover by the previous sampling programs (Figure 9.1.2_1)
�
A total of 723 samples, of which 367 were soil samples, 277 stream sediment samples and 79 rock chip samples, were collected during this process.
�
Geochemical sampling of the soils was also partially compromised due to very thin overburden because of sub cropping rock formations.
�
9.2��������������������������������������� Geophysical Surveys
�
Initial detailed ground geophysical surveys were confined to the Waterberg JV Project and were funded by the JV partner JOGMEC.� The detailed airborne survey was completed predominantly over the Waterberg Extension Project, with some overlap over the defined Bushveld edge geology on the advanced stage Waterberg JV Project to obtain response characteristics.
�
9.2.1����������������������������� Waterberg JV Project � Initial survey
�
Approximately 60 lines of geophysical survey for 488 line km using gravity and magnetics were traversed in March�2010 (Figure 9.1.2_1).� These were east � west trending lines and were traversed on the farms Disseldorp 369LR, Kirstenspruit 351LR, Bayswater 370LR, Niet Mogelyk 371LR and Carlsruhe 390LR.� At this time, farm Ketting Prospecting Right was still pending.
�
As soon as Ketting was granted, a second phase of Geophysical Survey was also conducted on the farm from mid-August�2011 to September�2011 (Figure 9.1.2_1).
�
|
Technical Report for the Update on Exploration Drilling at the for Waterberg Joint Venture and |
� |
|
Waterberg Extension Projects South Africa � 24 November�2014 |
�
�
Coffey Mining South Africa (Pty) Ltd
�
Two additional north-south ground magnetics lines were surveyed over the farm Ketting in November�2012.� This information was used to interpret and locate east-west striking structures (Figure 9.1.2_1).
�
When considering the Waterberg Extension, due to the presence of Waterberg Group cover rocks, there has been no exposure of Bushveld Complex rocks on the property.� Geophysical techniques have been employed to aid in the modelling of the projected Bushveld Complex.� Comparing the projected edge of the Bushveld Complex from the regional geophysics modelling, the FALCON airborne survey interpretation and the ground gravity profiles, there is general correlation, with local variations, of a north-northeast arch of where the edge of the more dense mafic intrusive rock may project beneath the Waterberg Group sediment cover.
�
9.2.2����������������������������� Extended Airborne Gravity Gradient and Magnetics
�
An airborne gravity survey was completed on 100 and 200m line spacing.� An interpretation of the results of the survey suggests that there may be continuity to the Bushveld Complex rocks to the northwest and north, which has the potential to host PGM mineralization to the northeast within the Waterberg Extension Project area.
�
PTM contracted FUGRO Airborne Surveys (Pty) Ltd.� to conduct airborne FALCON� gravity gradiometry and total field magnetic surveys.� The target for the survey was the interpreted edge sub-cropping of the Bushveld Complex to which the Waterberg sediments form the regional hanging wall.� Conducted in April�2013, the survey was comprised of 2306.16 line kilometres of Airborne Gravity Gradiometry (AGG) data and 2469.35 line kilometres of magnetic and radiometric data.� The total extent of the survey covered approximately 25km of interpreted Bushveld Complex edge within the Waterberg Extension Project area (Figure 9.2.2_1).
�
Interpretation was based on creating a starting model using the known geology from drilling at the adjacent Waterberg JV Project and linking it to the airborne response (Figures 9.2.2_2 and 9.2.2_3).� The geologic units were modelled in three dimensions in order to facilitate a three dimensional stochastic inversion of the geometry and density of the units making use of the gravity gradient data.� Average rock unit densities were extrapolated from the adjacent Waterberg JV Project.
�
|
Technical Report for the Update on Exploration Drilling at the for Waterberg Joint Venture and Waterberg Extension Projects South Africa � 24 November�2014 |
� |
�
�
Coffey Mining South Africa (Pty) Ltd
�
|
Figure 9.1.2_1 Locations of Geochemical Sampling and Geophysical Traverses
|
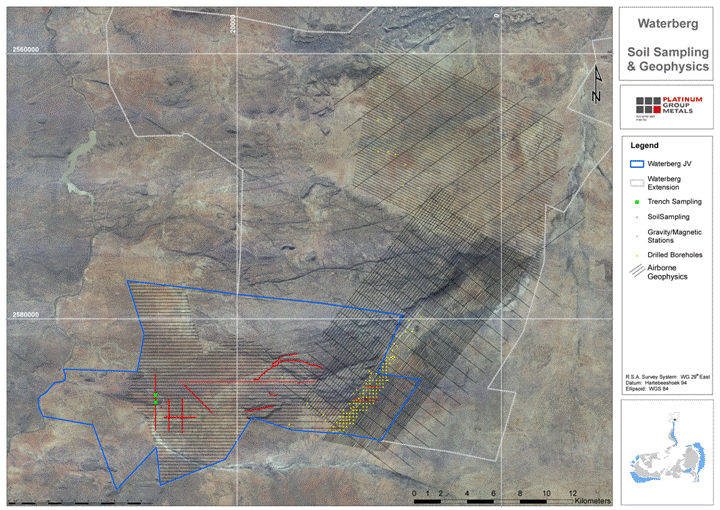
�
|
Technical Report for the Update on Exploration Drilling at the for Waterberg Joint Venture and Waterberg Extension Projects South Africa � 24 November�2014 |
� |
�
�
Coffey Mining South Africa (Pty) Ltd
�
|
Figure 9.2.2_1 Airborne Gradient Gravity and Magnetic Survey Flight Lines
|

�
|
Technical Report for the Update on Exploration Drilling at the for Waterberg Joint Venture and Waterberg Extension Projects South Africa � 24 November�2014 |
� |
�
�
Coffey Mining South Africa (Pty) Ltd
�
|
Figure 9.2.2_2 Waterberg Extension Project Airborne Gradient Gravity Plot with Interpreted Bushveld Complex Edge
|
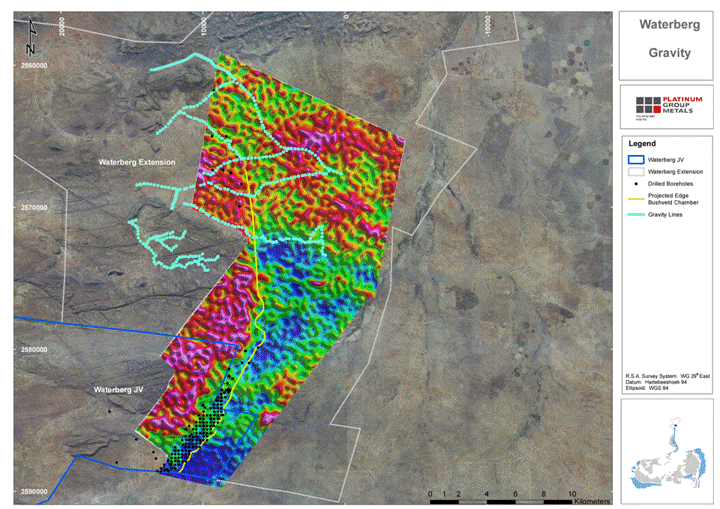
�
|
Technical Report for the Update on Exploration Drilling at the for Waterberg Joint Venture and Waterberg Extension Projects South Africa � 24 November�2014 |
� |
�
�
Coffey Mining South Africa (Pty) Ltd
�
|
Figure 9.2.2_3 Airborne Total Field Magnetics Plot with Interpreted Bushveld Complex Edge
|
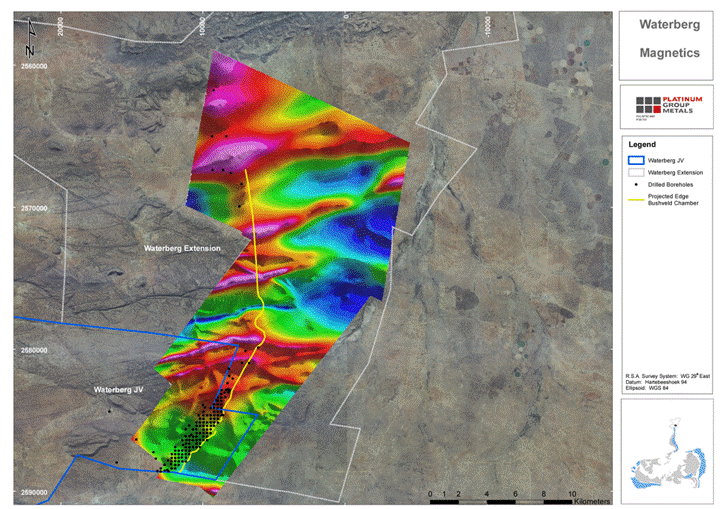
�
|
Technical Report for the Update on Exploration Drilling at the for Waterberg Joint Venture and Waterberg Extension Projects South Africa � 24 November�2014 |
� |
�
�
Coffey Mining South Africa (Pty) Ltd
�
9.2.3����������������������������� Ground Gravity
�
A total of nine ground gravity traverses were completed by Geospec Instruments (Pty) Ltd along roads and tracks.� The survey lines were designed to traverses across the projected edge of the Bushveld Complex in the same area covered by the airborne survey as ground confirmation of the airborne results.� The two surveys were compared and good correlation between gravity data sets noted.� In planning the ground survey, one control line over the known deposit edge at the point where it projected from the adjacent Waterberg JV Project was completed in order to acquire a signature profile over a known source to compare the remaining regional lines to.� The interpretation of the linked ground gravity profiles suggests that there may be a northwest trending continuity to the Bushveld Complex rocks which have the potential to host PGM mineralization.
�
9.3��������������������������������������� Coffey: Technical Review
�
Suitable exploration has been undertaken with appropriate conclusions and follow-up work completed.
�
|
Technical Report for the Update on Exploration Drilling at the for Waterberg Joint Venture and Waterberg Extension Projects South Africa � 24 November�2014 |
� |
�
�
Coffey Mining South Africa (Pty) Ltd
�
10������������������������������������������ DRILLING
�
10.1�������������������������������� Drilling in 2010
�
Based on the target generation and the results of the geochemical sampling and geochemical surveys, two boreholes WB001 and WB002 were initially drilled between July�and October�2011 on the farm Disseldorp 369LR.� A total of 1,934.77m was drilled for the first two boreholes in 2010.
�
10.2�������������������������������� Drilling in 2011 to 2013
�
Waterberg JV Project
�
Drilling resumed in 2011 with a third borehole WB003 was drilled on the farm Ketting.� The geological information revealed by this borehole lead to the extension of the drilling campaign such that in 2012, drilling with up to 10 diamond drill rigs was undertaken.
�
A total of 130,342m of core had been drilled by September�2013, the cut off date of the mineral resource estimate.� NQ core size (47.6mm) was drilled.� The results of 112�boreholes were available for the mineral resource estimate.� A basic 250m x 250m grid drilled grid was used to place the boreholes where possible.
�
Drilling in some areas proved to be difficult due to bad ground formations particularly in the Waterberg sediments and so some boreholes had to be re-drilled a few metres away or totally abandoned or moved.� An example of such a borehole is WB007 which had high water pressure to the extent that the drilling rods were being pushed out of the hole.� This borehole is located outside the current mineral resource area.
�
Waterberg Extension Project
�
Diamond drilling commenced in October�2013 upon the official granting of the prospecting right for the Waterberg Extension Projects.� The initial borehole locations were chosen to test the interpreted northeast strike continuation of the Bushveld Complex edge and mineralized layers defined on the adjacent Waterberg JV Project with step outs of 1 to 2km.� Six diamond drill machines were mobilized.� Eight of the nine initial boreholes intersected Bushveld Complex stratigraphy.
�
10.3�������������������������������� Exploration Drilling Status 21 October�2014
�
Waterberg JV Project
�
For the resource estimate (Effective Date: 12 June�2014), the raw database consisted of 114 boreholes with 193 deflections, totaling 307 intersection points (131,762m).� Since then an additional 53,684m representing 56 exploration boreholes and 58 deflections has been completed on the Waterberg JV Project
�
|
Technical Report for the Update on Exploration Drilling at the for Waterberg Joint Venture and Waterberg Extension Projects South Africa � 24 November�2014 |
� |
�
�
Coffey Mining South Africa (Pty) Ltd
�
Waterberg Extension Project
�
The mineral resource (Effective Date: 12 June�2014) for the Waterberg Extension Project area utilised a database comprising 27 boreholes with 56 intersection points (23,132m).� Eleven boreholes (8,690m) have been drilled on farms north of Early Dawn to confirm the continuation of mineralization.� Since then 17,775m representing 12 exploration boreholes and 26 deflections has been completed on the Waterberg Extension Project.
�
|
Technical Report for the Update on Exploration Drilling at the for Waterberg Joint Venture and Waterberg Extension Projects South Africa � 24 November�2014 |
� |
�
�
Coffey Mining South Africa (Pty) Ltd
�
|
Figure 10.3_1 Location of Boreholes on the Waterberg JV Project �
|

�
|
Technical Report for the Update on Exploration Drilling at the for Waterberg Joint Venture and Waterberg Extension Projects South Africa � 24 November�2014 |
� |
�
�
Coffey Mining South Africa (Pty) Ltd
�
|
Figure 10.3_2 Location of Boreholes on the Waterberg Extension Project �
|
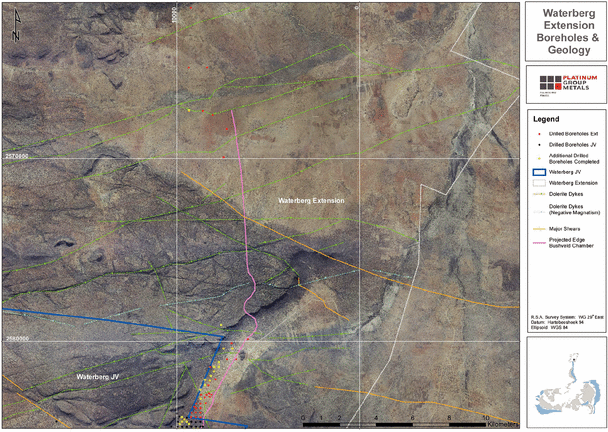
�
|
Technical Report for the Update on Exploration Drilling at the for Waterberg Joint Venture and Waterberg Extension Projects South Africa � 24 November�2014 |
� |
�
�
Coffey Mining South Africa (Pty) Ltd
�
10.4�������������������������������� Drilling Quality
�
Coffey has examined randomly selected borehole cores.� The core recovery and core quality meet or exceed industry standards.
�
10.5�������������������������������� Diamond Core Sampling
�
Sample selection was undertaken by qualified geologists based on a minimum sample length of approximately 25cm � 50cm.� Not all borehole core has been sampled, but all core with visually identifiable sulphide mineralization has been analysed, and low grade to waste portions straddling these layers have also been sampled.� A maximum sample length of 1m has been applied where appropriate.� The true width of the shallow dipping (30� to 35�) mineralized zones that have been sampled are approximately 82% to 87% of the reported interval from the vertical borehole.
�
The sampled core is split using an electric powered circular diamond blade saw.
�
10.6�������������������������������� Sample Recovery
�
Core recoveries, RQD (Rock Quality Designation) and a note of core quality, are recorded continuously for each borehole.� Minimum core recovery accepted was 95% measured over a 6m run.� This was achieved for all boreholes.
�
10.7�������������������������������� Sample Quality
�
Coffey has examined selected boreholes and has assessed the quality of sampling to meet or exceed industry standards.
�
10.8�������������������������������� Interpretation of Results
�
The results of the drilling and the general geological interpretation are digitally captured in SABLE and a GIS software package named ARCVIEW.� The borehole locations, together with the geology and assay results, are plotted on plan.� Regularly spaced sections are drawn to assist with correlation and understanding of the geology.� This information was useful for interpreting the sequence of the stratigraphy intersected as well as for verifying the borehole information.
�
Waterberg JV Project
�
The drilling on the Waterberg JV Project is at an advanced stage and has been utilized to estimate an Inferred Mineral Resource (Effective Date: 12 June�2014).� This report updates the exploration drilling completed subsequent to the last resource estimate.� The latest drillhole intersections announced on are presented in Table10.810.8 _1 and Table 10.8_2).
�
|
Technical Report for the Update on Exploration Drilling at the for Waterberg Joint Venture and |
� |
|
Waterberg Extension Projects South Africa � 24 November�2014 |
� |
�
�
Coffey Mining South Africa (Pty) Ltd
�
Table 10.8_1
Waterberg JV Project
Recent T-Zone intercepts
�
|
Hole�ID |
� |
Y |
� |
X |
� |
FROM |
� |
TO |
� |
Zone |
� |
LENGTH |
� |
Pt |
� |
Pd |
� |
Au |
� |
3E |
� |
Pt:Pd:Au |
� |
Cu% |
� |
Ni% |
|
WB124 |
� |
11 832.26 |
� |
2 588 003.90 |
� |
210.98 |
� |
220.00 |
� |
T2 |
� |
9.02 |
� |
0.71 |
� |
0.42 |
� |
0.98 |
� |
2.11 |
� |
34:20:46 |
� |
0.20 |
� |
0.09 |
|
WB125 |
� |
12 080.78 |
� |
2 588 255.99 |
� |
197.25 |
� |
203.00 |
� |
T2 |
� |
5.75 |
� |
1.58 |
� |
2.54 |
� |
1.17 |
� |
5.29 |
� |
30:48:22 |
� |
0.24 |
� |
0.12 |
|
WB126 |
� |
11 829.15 |
� |
2 587 877.99 |
� |
236.00 |
� |
245.00 |
� |
T2 |
� |
9.00 |
� |
1.61 |
� |
3.64 |
� |
0.98 |
� |
6.23 |
� |
26:58:16 |
� |
0.29 |
� |
0.15 |
|
WB127 |
� |
12 078.90 |
� |
2 587 883.36 |
� |
381.68 |
� |
392.50 |
� |
T2 |
� |
10.82 |
� |
1.31 |
� |
3.52 |
� |
0.74 |
� |
5.57 |
� |
24:63:13 |
� |
0.13 |
� |
0.09 |
|
WB130 |
� |
12 078.21 |
� |
2 588 004.00 |
� |
327.93 |
� |
333.00 |
� |
T2 |
� |
5.07 |
� |
0.41 |
� |
0.39 |
� |
0.31 |
� |
1.11 |
� |
37:35:28 |
� |
0.06 |
� |
0.05 |
|
WB131 |
� |
11 954.18 |
� |
2 588 007.22 |
� |
269.10 |
� |
276.00 |
� |
T2 |
� |
6.90 |
� |
0.22 |
� |
0.19 |
� |
0.51 |
� |
0.92 |
� |
24:21:55 |
� |
0.11 |
� |
0.06 |
|
WB133 |
� |
12 079.71 |
� |
2 587 754.44 |
� |
444.00 |
� |
457.03 |
� |
T2 |
� |
13.03 |
� |
0.95 |
� |
1.53 |
� |
0.85 |
� |
3.33 |
� |
29:46:26 |
� |
0.12 |
� |
0.07 |
|
WB134 |
� |
12 203.74 |
� |
2 588 629.65 |
� |
Faulted | ||||||||||||||||||||
|
WB135 |
� |
12 322.26 |
� |
2 588 382.25 |
� |
Faulted | ||||||||||||||||||||
|
WB137 |
� |
11 706.42 |
� |
2 588 002.47 |
� |
152.50 |
� |
154.50 |
� |
T2 |
� |
2.00 |
� |
0.82 |
� |
0.80 |
� |
0.76 |
� |
2.38 |
� |
34:34:32 |
� |
0.21 |
� |
0.10 |
|
WB139 |
� |
12 200.99 |
� |
2 588 004.74 |
� |
383.00 |
� |
389.09 |
� |
T2 |
� |
6.09 |
� |
1.35 |
� |
2.20 |
� |
0.88 |
� |
4.43 |
� |
30:50:20 |
� |
0.12 |
� |
0.07 |
|
WB140 |
� |
11 948.55 |
� |
2 587 754.44 |
� |
365.77 |
� |
373.50 |
� |
T2 |
� |
7.73 |
� |
1.28 |
� |
1.62 |
� |
1.27 |
� |
4.17 |
� |
31:39:30 |
� |
0.16 |
� |
0.07 |
|
WB141 |
� |
12 312.72 |
� |
2 588 600.59 |
� |
Faulted | ||||||||||||||||||||
|
WB142 |
� |
11 954.35 |
� |
2 588 253.36 |
� |
177.00 |
� |
185.00 |
� |
T2 |
� |
8.00 |
� |
0.22 |
� |
0.15 |
� |
0.35 |
� |
0.72 |
� |
31:21:49 |
� |
0.10 |
� |
0.06 |
|
WB145 |
� |
12 075.15 |
� |
2 588 381.77 |
� |
Faulted | ||||||||||||||||||||
|
WB147 |
� |
12 203.63 |
� |
2 587 757.99 |
� |
493.89 |
� |
498.00 |
� |
T2 |
� |
4.11 |
� |
1.17 |
� |
3.36 |
� |
1.02 |
� |
5.55 |
� |
21:61:18 |
� |
0.17 |
� |
0.09 |
|
WB148 |
� |
11 825.48 |
� |
2 588 127.09 |
� |
188.00 |
� |
190.00 |
� |
T2 |
� |
2.00 |
� |
0.30 |
� |
0.17 |
� |
0.55 |
� |
1.02 |
� |
29:17:54 |
� |
0.09 |
� |
0.05 |
|
WB149 |
� |
12 202.23 |
� |
2 588 254.21 |
� |
256.35 |
� |
267.50 |
� |
T2 |
� |
11.15 |
� |
0.84 |
� |
0.61 |
� |
1.75 |
� |
3.20 |
� |
26:19:55 |
� |
0.37 |
� |
0.17 |
|
WB156 |
� |
11 825.44 |
� |
2 587 506.14 |
� |
393.00 |
� |
399.01 |
� |
T2 |
� |
6.01 |
� |
0.97 |
� |
2.00 |
� |
0.69 |
� |
3.66 |
� |
27:55:19 |
� |
0.12 |
� |
0.08 |
|
WB157 |
� |
11 580.94 |
� |
2 587 754.89 |
� |
159.50 |
� |
165.00 |
� |
T2 |
� |
5.50 |
� |
0.48 |
� |
0.70 |
� |
0.19 |
� |
1.37 |
� |
35:51:14 |
� |
0.03 |
� |
0.02 |
|
WB158 |
� |
11 577.72 |
� |
2 587 505.97 |
� |
225.25 |
� |
230.50 |
� |
T2 |
� |
5.25 |
� |
0.11 |
� |
0.10 |
� |
0.10 |
� |
0.31 |
� |
35:32:32 |
� |
0.02 |
� |
0.02 |
|
WB159 |
� |
12 080.02 |
� |
2 587 507.07 |
� |
545.50 |
� |
550.63 |
� |
T2 |
� |
5.13 |
� |
1.01 |
� |
1.82 |
� |
0.69 |
� |
3.52 |
� |
29:52:20 |
� |
0.10 |
� |
0.05 |
�
*The true thickness of the intercepts is estimated to be 78% of the vertical thickness.
�
|
Technical Report for the Update on Exploration Drilling at the for Waterberg Joint Venture and |
� |
�
�
Coffey Mining South Africa (Pty) Ltd
�
F Zone intercepts
�
The F Zone consists of a broad mineralized package generally, with higher grade top and bottom loaded cuts. Final cuts for modelling will be determined later and may include the selected or broader cuts in certain areas.
�
Table 10.8_2
Waterberg JV Project
Recent F-Zone intercepts
�
|
Hole�ID |
� |
Y |
� |
X |
� |
FROM |
� |
TO |
� |
Zone |
� |
LENGTH |
� |
Pt |
� |
Pd |
� |
Au |
� |
3E |
� |
Pt:Pd:Au |
� |
Cu% |
� |
Ni% |
|
WB113 |
� |
10 204.81 |
� |
2 586 125.87 |
� |
500.63 |
� |
570.50 |
� |
Super F |
� |
69.87 |
� |
0.49 |
� |
1.25 |
� |
0.10 |
� |
1.84 |
� |
27:68:5 |
� |
0.05 |
� |
0.15 |
|
WB113 |
� |
10 204.81 |
� |
2 586 125.87 |
� |
500.63 |
� |
506.50 |
� |
Top |
� |
5.87 |
� |
1.01 |
� |
1.85 |
� |
0.15 |
� |
3.01 |
� |
34:61:5 |
� |
0.05 |
� |
0.22 |
|
WB113 |
� |
10 204.81 |
� |
2 586 125.87 |
� |
561.00 |
� |
570.50 |
� |
Bottom |
� |
9.50 |
� |
0.88 |
� |
2.64 |
� |
0.17 |
� |
3.69 |
� |
24:72:5 |
� |
0.08 |
� |
0.17 |
|
WB114 |
� |
10 453.92 |
� |
2 586 257.99 |
� |
654.50 |
� |
678.30 |
� |
Super F |
� |
23.80 |
� |
0.54 |
� |
1.22 |
� |
0.11 |
� |
1.87 |
� |
29:65:6 |
� |
0.08 |
� |
0.22 |
|
WB114 |
� |
10 453.92 |
� |
2 586 257.99 |
� |
654.50 |
� |
657.50 |
� |
Top |
� |
3.00 |
� |
1.04 |
� |
2.27 |
� |
0.17 |
� |
3.48 |
� |
30:65:5 |
� |
0.16 |
� |
0.30 |
|
WB114 |
� |
10 453.92 |
� |
2 586 257.99 |
� |
668.71 |
� |
671.30 |
� |
Bottom |
� |
2.59 |
� |
0.94 |
� |
2.19 |
� |
0.17 |
� |
3.30 |
� |
28:66:5 |
� |
0.14 |
� |
0.30 |
|
WB115 |
� |
10 078.91 |
� |
2 586 007.67 |
� |
506.50 |
� |
578.92 |
� |
Super F |
� |
72.42 |
� |
0.59 |
� |
1.48 |
� |
0.11 |
� |
2.18 |
� |
27:68:5 |
� |
0.07 |
� |
0.17 |
|
WB115 |
� |
10 078.91 |
� |
2 586 007.67 |
� |
506.50 |
� |
520.86 |
� |
Top |
� |
14.36 |
� |
0.51 |
� |
1.22 |
� |
0.10 |
� |
1.83 |
� |
28:67:5 |
� |
0.06 |
� |
0.20 |
|
WB115 |
� |
10 078.91 |
� |
2 586 007.67 |
� |
544.40 |
� |
578.50 |
� |
Bottom |
� |
34.10 |
� |
0.91 |
� |
2.35 |
� |
0.17 |
� |
3.43 |
� |
27:69:5 |
� |
0.09 |
� |
0.18 |
|
WB116 |
� |
10 328.29 |
� |
2 585 755.66 |
� |
750.50 |
� |
798.04 |
� |
Super F |
� |
47.54 |
� |
1.13 |
� |
2.43 |
� |
0.17 |
� |
3.73 |
� |
30:65:5 |
� |
0.06 |
� |
0.16 |
|
WB116 |
� |
10 328.29 |
� |
2 585 755.66 |
� |
750.50 |
� |
766.50 |
� |
Top |
� |
16.00 |
� |
1.65 |
� |
3.69 |
� |
0.26 |
� |
5.60 |
� |
29:66:5 |
� |
0.09 |
� |
0.22 |
|
WB116 |
� |
10 328.29 |
� |
2 585 755.66 |
� |
777.50 |
� |
798.04 |
� |
Bottom |
� |
20.54 |
� |
1.03 |
� |
2.15 |
� |
0.14 |
� |
3.32 |
� |
31:65:4 |
� |
0.05 |
� |
0.14 |
|
WB117 |
� |
10 576.75 |
� |
2 586 509.23 |
� |
613.00 |
� |
643.00 |
� |
Super F |
� |
30.00 |
� |
0.85 |
� |
2.09 |
� |
0.13 |
� |
3.07 |
� |
28:68:4 |
� |
0.05 |
� |
0.19 |
|
WB117 |
� |
10 576.75 |
� |
2 586 509.23 |
� |
613.00 |
� |
618.50 |
� |
Top |
� |
5.50 |
� |
0.68 |
� |
3.06 |
� |
0.15 |
� |
3.89 |
� |
17:79:4 |
� |
0.05 |
� |
0.22 |
|
WB117 |
� |
10 576.75 |
� |
2 586 509.23 |
� |
630.00 |
� |
643.00 |
� |
Bottom |
� |
13.00 |
� |
1.14 |
� |
2.45 |
� |
0.15 |
� |
3.74 |
� |
30:66:4 |
� |
0.07 |
� |
0.19 |
|
WB118 |
� |
10 078.99 |
� |
2 585 752.86 |
� |
568.00 |
� |
587.50 |
� |
Super F |
� |
19.50 |
� |
0.73 |
� |
1.59 |
� |
0.18 |
� |
2.50 |
� |
29:64:7 |
� |
0.06 |
� |
0.18 |
|
WB118 |
� |
10 078.99 |
� |
2 585 752.86 |
� |
568.00 |
� |
573.50 |
� |
Top |
� |
5.50 |
� |
1.42 |
� |
2.99 |
� |
0.40 |
� |
4.81 |
� |
30:62:8 |
� |
0.09 |
� |
0.24 |
|
WB118 |
� |
10 078.99 |
� |
2 585 752.86 |
� |
582.09 |
� |
587.50 |
� |
Bottom |
� |
5.41 |
� |
0.59 |
� |
1.34 |
� |
0.11 |
� |
2.04 |
� |
29:66:5 |
� |
0.04 |
� |
0.18 |
|
WB119 |
� |
10 327.27 |
� |
2 586 004.22 |
� |
681.00 |
� |
741.31 |
� |
Super F |
� |
60.31 |
� |
0.71 |
� |
1.54 |
� |
0.11 |
� |
2.36 |
� |
30:65:5 |
� |
� |
� |
� |
|
WB119 |
� |
10 327.27 |
� |
2 586 004.22 |
� |
681.00 |
� |
686.00 |
� |
Top |
� |
5.00 |
� |
0.90 |
� |
2.23 |
� |
0.15 |
� |
3.28 |
� |
27:68:5 |
� |
� |
� |
� |
|
WB119 |
� |
10 327.27 |
� |
2 586 004.22 |
� |
729.37 |
� |
741.31 |
� |
Bottom |
� |
11.94 |
� |
1.74 |
� |
3.16 |
� |
0.20 |
� |
5.10 |
� |
34:62:4 |
� |
� |
� |
� |
|
WB120 |
� |
9 578.87 |
� |
2 585 755.12 |
� |
269.21 |
� |
319.50 |
� |
Super F |
� |
50.29 |
� |
0.27 |
� |
0.61 |
� |
0.05 |
� |
0.93 |
� |
29:66:5 |
� |
0.02 |
� |
0.13 |
|
WB120 |
� |
9 578.87 |
� |
2 585 755.12 |
� |
269.21 |
� |
274.25 |
� |
Top |
� |
5.04 |
� |
0.70 |
� |
1.57 |
� |
0.12 |
� |
2.39 |
� |
29:66:5 |
� |
0.06 |
� |
0.16 |
�
|
Technical Report for the Update on Exploration Drilling at the for Waterberg Joint Venture and Waterberg Extension Projects South Africa � 24 November 2014 |
� |
�
�
Coffey Mining South Africa (Pty) Ltd
�
Table 10.8_2
Waterberg JV Project
Recent F-Zone intercepts
�
|
Hole�ID |
� |
Y |
� |
X |
� |
FROM |
� |
TO |
� |
Zone |
� |
LENGTH |
� |
Pt |
� |
Pd |
� |
Au |
� |
3E |
� |
Pt:Pd:Au |
� |
Cu% |
� |
Ni% |
|
WB120 |
� |
9�578.87 |
� |
2�585�755.12 |
� |
314.50 |
� |
319.50 |
� |
Bottom |
� |
5.00 |
� |
0.82 |
� |
2.07 |
� |
0.17 |
� |
3.06 |
� |
27:68:6 |
� |
0.06 |
� |
0.16 |
|
WB121 |
� |
9 828.95 |
� |
2 585 751.26 |
� |
394.55 |
� |
479.96 |
� |
Super F |
� |
85.41 |
� |
0.28 |
� |
0.52 |
� |
0.04 |
� |
0.84 |
� |
33:62:5 |
� |
0.01 |
� |
0.11 |
|
WB121 |
� |
9 828.95 |
� |
2 585 751.26 |
� |
394.55 |
� |
397.44 |
� |
Top |
� |
2.89 |
� |
0.74 |
� |
1.41 |
� |
0.11 |
� |
2.26 |
� |
33:62:5 |
� |
0.03 |
� |
0.16 |
|
WB121 |
� |
9 828.95 |
� |
2 585 751.26 |
� |
474.00 |
� |
479.96 |
� |
Bottom |
� |
5.96 |
� |
1.18 |
� |
2.54 |
� |
0.15 |
� |
3.87 |
� |
30:66:4 |
� |
0.05 |
� |
0.17 |
|
WB122 |
� |
10 464.21 |
� |
2 586 520.00 |
� |
495.00 |
� |
504.50 |
� |
Super F |
� |
9.50 |
� |
0.80 |
� |
1.24 |
� |
0.06 |
� |
2.10 |
� |
38:59:3 |
� |
0.03 |
� |
0.11 |
|
WB122 |
� |
10 464.21 |
� |
2 586 520.00 |
� |
495.00 |
� |
498.50 |
� |
Top |
� |
3.50 |
� |
1.76 |
� |
2.58 |
� |
0.02 |
� |
4.36 |
� |
40:59:0 |
� |
0.01 |
� |
0.11 |
|
WB123 |
� |
9 825.49 |
� |
2 586 004.86 |
� |
370.00 |
� |
450.00 |
� |
Super F |
� |
80.00 |
� |
1.41 |
� |
3.18 |
� |
0.21 |
� |
4.80 |
� |
29:66:4 |
� |
0.10 |
� |
0.23 |
|
WB123 |
� |
9 825.49 |
� |
2 586 004.86 |
� |
370.00 |
� |
403.67 |
� |
Top |
� |
33.67 |
� |
1.52 |
� |
4.01 |
� |
0.25 |
� |
5.78 |
� |
26:69:4 |
� |
0.12 |
� |
0.25 |
|
WB123 |
� |
9 825.49 |
� |
2 586 004.86 |
� |
418.50 |
� |
450.00 |
� |
Bottom |
� |
31.50 |
� |
1.64 |
� |
3.02 |
� |
0.21 |
� |
4.87 |
� |
34:62:4 |
� |
0.10 |
� |
0.24 |
|
WB132 |
� |
10 574.57 |
� |
2 586 252.39 |
� |
773.00 |
� |
819.34 |
� |
Super F |
� |
46.34 |
� |
0.70 |
� |
1.51 |
� |
0.13 |
� |
2.34 |
� |
30:65:6 |
� |
0.09 |
� |
0.21 |
|
WB132 |
� |
10 574.57 |
� |
2 586 252.39 |
� |
776.40 |
� |
783.00 |
� |
Top |
� |
6.60 |
� |
0.87 |
� |
2.26 |
� |
0.20 |
� |
3.33 |
� |
26:68:6 |
� |
0.15 |
� |
0.25 |
|
WB132 |
� |
10 574.57 |
� |
2 586 252.39 |
� |
809.03 |
� |
815.46 |
� |
Bottom |
� |
6.43 |
� |
1.14 |
� |
2.11 |
� |
0.20 |
� |
3.45 |
� |
33:61:6 |
� |
0.12 |
� |
0.25 |
|
WB150 |
� |
10 824.80 |
� |
2 586 253.02 |
� |
906.00 |
� |
972.50 |
� |
Super F |
� |
66.50 |
� |
0.90 |
� |
2.40 |
� |
0.17 |
� |
3.47 |
� |
26:69:5 |
� |
� |
� |
� |
|
WB150 |
� |
10 824.80 |
� |
2 586 253.02 |
� |
906.00 |
� |
933.00 |
� |
Top |
� |
27.00 |
� |
1.12 |
� |
2.77 |
� |
0.21 |
� |
4.10 |
� |
27:68:5 |
� |
� |
� |
� |
|
WB150 |
� |
10 824.80 |
� |
2 586 253.02 |
� |
962.08 |
� |
972.50 |
� |
Bottom |
� |
10.42 |
� |
0.93 |
� |
2.71 |
� |
0.19 |
� |
3.83 |
� |
24:71:5 |
� |
� |
� |
� |
|
WB160 |
� |
10 825.09 |
� |
2 586 507.16 |
� |
808.00 |
� |
840.00 |
� |
Super F |
� |
32.00 |
� |
0.48 |
� |
0.87 |
� |
0.07 |
� |
1.42 |
� |
34:61:5 |
� |
0.04 |
� |
0.16 |
|
WB160 |
� |
10 825.09 |
� |
2 586 507.16 |
� |
808.00 |
� |
811.00 |
� |
Top |
� |
3.00 |
� |
1.08 |
� |
1.78 |
� |
0.12 |
� |
2.98 |
� |
36:60:4 |
� |
0.05 |
� |
0.19 |
|
WB160 |
� |
10 825.09 |
� |
2 586 507.16 |
� |
833.89 |
� |
840.00 |
� |
Bottom |
� |
6.11 |
� |
0.96 |
� |
1.58 |
� |
0.13 |
� |
2.67 |
� |
36:59:5 |
� |
0.08 |
� |
0.16 |
|
WB161 |
� |
10 579.67 |
� |
2 586 126.40 |
� |
771.00 |
� |
817.79 |
� |
Super F |
� |
46.79 |
� |
1.06 |
� |
2.51 |
� |
0.19 |
� |
3.76 |
� |
28:67:5 |
� |
0.10 |
� |
0.19 |
|
WB161 |
� |
10 579.67 |
� |
2 586 126.40 |
� |
771.00 |
� |
793.00 |
� |
Top |
� |
22.00 |
� |
1.11 |
� |
2.57 |
� |
0.19 |
� |
3.87 |
� |
29:66:5 |
� |
0.11 |
� |
0.19 |
|
WB161 |
� |
10 579.67 |
� |
2 586 126.40 |
� |
797.95 |
� |
817.79 |
� |
Bottom |
� |
19.84 |
� |
1.18 |
� |
2.85 |
� |
0.23 |
� |
4.26 |
� |
28:67:5 |
� |
0.12 |
� |
0.20 |
|
WB163 |
� |
11 080.61 |
� |
2 586 253.03 |
� |
1 004.93 |
� |
1 077.00 |
� |
Super F |
� |
72.07 |
� |
0.75 |
� |
1.96 |
� |
0.14 |
� |
2.85 |
� |
26:69:5 |
� |
� |
� |
� |
|
WB163 |
� |
11 080.61 |
� |
2 586 253.03 |
� |
1 004.93 |
� |
1 021.47 |
� |
Top |
� |
16.54 |
� |
1.06 |
� |
3.10 |
� |
0.22 |
� |
4.38 |
� |
24:71:5 |
� |
� |
� |
� |
|
WB163 |
� |
11 080.61 |
� |
2 586 253.03 |
� |
1 071.00 |
� |
1 077.00 |
� |
Bottom |
� |
6.00 |
� |
1.21 |
� |
3.05 |
� |
0.21 |
� |
4.47 |
� |
27:68:5 |
� |
� |
� |
� |
|
WB164 |
� |
10 578.88 |
� |
2 586 004.53 |
� |
803.75 |
� |
828.54 |
� |
Super F |
� |
24.79 |
� |
0.85 |
� |
2.51 |
� |
0.18 |
� |
3.54 |
� |
24:71:5 |
� |
� |
� |
� |
|
WB164 |
� |
10 578.88 |
� |
2 586 004.53 |
� |
804.50 |
� |
812.00 |
� |
Top |
� |
7.50 |
� |
0.64 |
� |
1.70 |
� |
0.12 |
� |
2.46 |
� |
26:69:5 |
� |
� |
� |
� |
|
WB164 |
� |
10 578.88 |
� |
2 586 004.53 |
� |
818.01 |
� |
828.54 |
� |
Bottom |
� |
10.53 |
� |
1.22 |
� |
3.94 |
� |
0.27 |
� |
5.43 |
� |
22:73:5 |
� |
� |
� |
� |
�
|
Technical Report for the Update on Exploration Drilling at the for Waterberg Joint Venture and |
� |
�
�
Coffey Mining South Africa (Pty) Ltd
�
*The true thickness of the intercepts is estimated to be 78% of the vertical thickness.
�
Table 10.8_3
Waterberg Extension Project
Recent F-Zone intercepts
�
|
Hole�ID |
� |
Y |
� |
X |
� |
FROM |
� |
TO |
� |
Zone |
� |
LENGTH |
� |
Pt |
� |
Pd |
� |
Au |
� |
3E |
� |
Pt:Pd:Au |
� |
Cu% |
� |
Ni% |
|
WE046 |
� |
7 560 |
� |
2�579 083 |
� |
1 475.00 |
� |
1 477.50 |
� |
F Zone |
� |
2.50 |
� |
0.61 |
� |
1.33 |
� |
0.06 |
� |
2.00 |
� |
30:67:3 |
� |
0.02 |
� |
0.16 |
|
WE048 |
� |
7 429 |
� |
2 580 381 |
� |
535.60 |
� |
538.50 |
� |
T Zone |
� |
2.90 |
� |
0.88 |
� |
2.10 |
� |
0.14 |
� |
3.12 |
� |
28:67:5 |
� |
� |
� |
� |
|
WE048 |
� |
7 429 |
� |
2 580 381 |
� |
� |
� |
� |
� |
F zone |
� |
Awaiting assays | ||||||||||||||
�
*The true thickness of the intercepts is estimated to be 78% of the vertical thickness.
.
�
Waterberg Extension Project
�
At the effective date of this report the assays from 24 boreholes on the Waterberg Extension Project have been returned.� The stratigraphic position and assay results of the sulphide mineralized zones intercepted in drilling of the Waterberg Extension Project confirm that they are F - Zone mineralization.� The latest drillhole intersections announced on are presented in Table 10.8_3).
�
|
Technical Report for the Update on Exploration Drilling at the for Waterberg Joint Venture and Waterberg Extension Projects South Africa � 24 November�2014 |
� |
�
�
Coffey Mining South Africa (Pty) Ltd
�
10.9�������������������������������� Coffey: Technical Review
�
Suitable drilling has been undertaken with appropriate standards in place to ensure that the data is suitable for use in geological modelling and mineral resource estimation on the Waterberg JV Project.� Further exploration drilling is ongoing.
�
The current drilling programme should be completed prior to updating of the geological model and estimating an updated mineral resource estimation.
�
|
Technical Report for the Update on Exploration Drilling at the for Waterberg Joint Venture and Waterberg Extension Projects South Africa � 24 November�2014 |
� |
�
�
Coffey Mining South Africa (Pty) Ltd
�
11������������������������������������������ SAMPLE PREPARATION, ANALYSES AND SECURITY
�
11.1�������������������������������� Core Handling
�
Drilled core is cleaned, de-greased and packed into metal core boxes by the drilling company.� The core is collected from the drilling site on a daily basis by a PTM geologist and transported to the coreyard at Marken by PTM personnel.� Before the core is taken off the drilling site, the depths are checked and entered on a daily drilling report, which is then signed off by PTM.� The core yard manager is responsible for checking all drilled core pieces and recording the following information:
�
���������������������� Drillers� depth markers (discrepancies are recorded);
�
���������������������� Fitment and marking of core pieces;
�
���������������������� Core losses and core gains;
�
���������������������� Grinding of core;
�
���������������������� One-meter-interval markings on core for sample referencing; and
�
���������������������� Re-checking of depth markings for accuracy
�
An example of the marking of a borehole is presented in Figure 11.1_1.
�
11.2�������������������������������� Core Logging and Identification of Mineralized Layers
�
Core logging is done by hand on a pro-forma sheet by qualified geologists under supervision of the Project Geologist.� This data is entered into an electronic logging program, SABLE, by data capturers under supervision of the Database Manager.� Electronic data is backed up daily and the entire database is backed up on a weekly basis and duplicated off-site.
�
A printout of the logging is handed back to the relevant geologists, who then verify their logging for precision and accuracy.
�
If the geologist is satisfied with the validity of the data, the logging is signed off and filed in a designated borehole file.� The borehole files are stored in a filing cabinet on site and will ultimately contain all relevant information pertaining to a particular borehole and all activities relating to it.� A control matrix forms part of the borehole file QA/QC and only when completed, will be signed off by the Project Geologist, the Internal QP as well as the External QP.
�
|
Technical Report for the Update on Exploration Drilling at the for Waterberg Joint Venture and Waterberg Extension Projects South Africa � 24 November�2014 |
� |
�
�
Coffey Mining South Africa (Pty) Ltd
�
Figure 11.1_1
Photographs of an Example of Borehole Marking
�

�

�
11.3�������������������������������� Sampling Methodology
�
Sampling tests are usually conducted at the beginning of exploration programs to determine the heterogeneity of mineralization in order to eliminate sampling error and to determine proper sampling protocol.� Deposit type, lithologies encountered, style of mineralization and heterogeneity all play a role in the method of sampling.
�
The sampling methodology is applied is based on industry accepted �Best Practices�.� The sampling is done in a manner that includes the entire economic unit together with hanging wall and foot wall sampling.
�
The first step in the sampling of the diamond core is to mark the core from the distance below collar in 1m units.� The lithologies are logged and an initial stratigraphy interpreted.� The potential mineralized layers are marked for sampling.� Thereafter the core is oriented using the layering or stratification as a reference and to ensure a consistent approach to the sampling.� A centre cut line is then drawn lengthways for cutting.� After cutting, the material is replaced in the
�
|
Technical Report for the Update on Exploration Drilling at the for Waterberg Joint Venture and Waterberg Extension Projects South Africa � 24 November�2014 |
� |
�
�
Coffey Mining South Africa (Pty) Ltd
�
core trays (Figure 11.3_1).� The sample intervals are then marked as a line and a distance from collar.
�
Figure 11.3_1
Photograph of Core Cutting
�
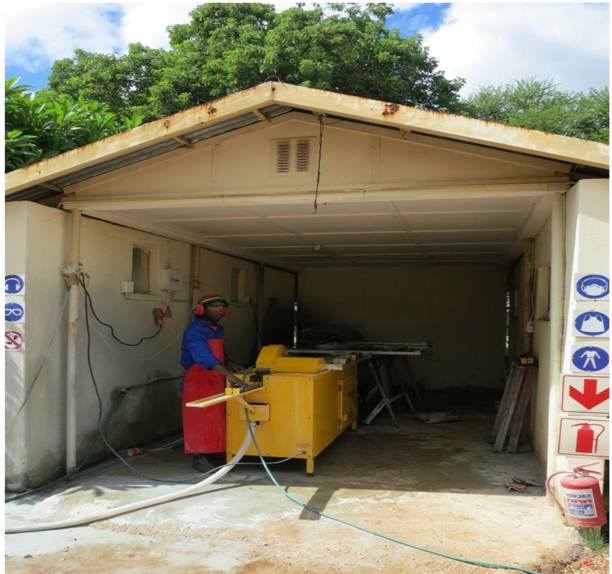
�
The sample intervals are typically 25-50cm in length.� In areas where potential mineralization is less likely, the sampling interval could be as much as a metre.� The sample intervals are allocated a sampling number, which is written on the core for reference purposes.� The half-core is then removed and placed into high-quality plastic bags together with a sampling tag containing the sampling number, which is entered onto a sample sheet.� The start and end depths are marked on the core with a corresponding line (Figure 11.3_2).� The duplicate tag stays as a permanent record in the sample booklet, which is secured on site.� The responsible project geologist then seals the sampling bag.� The sampling information is recorded on a specially designed sampling sheet that facilitates digital capture into the SABLE database
�
|
Technical Report for the Update on Exploration Drilling at the for Waterberg Joint Venture and Waterberg Extension Projects South Africa � 24 November�2014 |
� |
�
�
Coffey Mining South Africa (Pty) Ltd
�
(commercially available logging software).� The sampling extends to core which is considered to be of less economic potential in order to verify the bounds of mineralization.
�
Figure 11.3_2
Photograph of an Example of Sampling Methodology
�

�
11.4�������������������������������� Sample Quality and Sample Bias
�
The sampling methodology accords with PTM protocol based on industry best practice.� The quality of the sampling is monitored and supervised by a qualified geologist.� The sampling is done in a manner that includes the entire potentially economic unit.� Sampling over-selection and sampling bias is minimised by rotating the core so that the stratification is vertical and by inserting a cutline down the centre of the core and removing one side of the core only.
�
11.5�������������������������������� Supervision of Sample Preparation
�
Core sampling is undertaken by samplers under the guidance of qualified geologists and the supervision of the project geologist, who is responsible for timely delivery of the samples to the relevant laboratory.� The supervising and project geologists ensure that samples are transported in accordance with the PTM protocols.
�
|
Technical Report for the Update on Exploration Drilling at the for Waterberg Joint Venture and Waterberg Extension Projects South Africa � 24 November�2014 |
� |
�
�
Coffey Mining South Africa (Pty) Ltd
�
11.6�������������������������������� Sample Preparation
�
When samples are prepared for shipment to the analytical facility the following steps are followed:
�
���������������������� Samples are sequenced within the secure storage area and the sample sequences examined to determine if any samples are out of order or missing;
�
���������������������� The sample sequences and numbers shipped are recorded both on the chain-of-custody form and on the analytical request form;
�
���������������������� The samples are placed according to sequence into large plastic bags.� (The numbers of the samples are enclosed on the outside of the bag with the shipment, waybill or order number and the number of bags included in the shipment);
�
���������������������� The chain-of-custody form and analytical request sheet are completed, signed and dated by the project geologist before the samples are removed from secured storage.� The project geologist keeps copies of the analytical request form and the chain-of-custody form on site; and
�
���������������������� Once the above is completed and the sample shipping bags are sealed, the samples may be removed from the secured area.� The method by which the sample shipment bags have been secured must be recorded on the chain-of-custody document so that the recipient can inspect for tampering of the shipment.
�
11.7�������������������������������� Sample Security
�
Samples (half or quarter core) are labelled twice, once in the bag and again on the top of the bag.� Batches of approximately 20 samples are packed into large poly-weave bags and sealed with a plastic cable tie.� The batch submission number, sample numbers and number of samples are recorded on the outside of the bag.
�
Sample batches are collected by the laboratory.� Duplicate sample forms, bearing the batch lot number, sample numbers and number of samples are delivered with each batch.� One copy is signed for by the laboratory receiving personnel and the duplicate is returned to the Marken office for incorporation into the database.
�
Crushed coarse fraction of the samples and the balance of the pulp is eventually returned and stored at the Marken office.� These are bagged together, labelled and stored in plastic crates in a dry storage area.
�
All drill core is stored in galvanised steel core trays in a secure under cover core racking system.
�
Assay results from the Set Point laboratory are transmitted electronically in a standard format to the PTM Johannesburg office.� They are imported into the Master SABLE database directly from the laboratory files.� Certified assay certificates and a CD containing PDF versions of the certificates are filed at the Marken office.
�
The database has been customised to site specific use and all logging data, core recoveries and sampling data are captured.� Assays are electronically matched to the sample number.
�
|
Technical Report for the Update on Exploration Drilling at the for Waterberg Joint Venture and Waterberg Extension Projects South Africa � 24 November�2014 |
� |
�
�
Coffey Mining South Africa (Pty) Ltd
�
11.8�������������������������������� Chain of Custody
�
Samples are subject to a chain of custody which is tracked at all times.� Samples are not removed from their secured storage location without the chain of custody documentation being completed to track the movement of the samples and persons responsible for the security of the samples during the movement.� Ultimate responsibility for the safe and timely delivery of the samples to the chosen analytical facility rests with the Project Geologist and samples are not transported in any manner without his written permission.
�
During the transportation process between the project site and SetPoint�s sample preparation facility in Mokopane, the samples are inspected and signed for by each individual or company handling the samples.� It is the mandate of both the Supervising and Project Geologist to ensure safe transportation of the samples to the sample preparation facility.� The Project Geologist ensures that the analytical facility is aware of the PTM requirements.� A photocopy of the chain of custody letter, signed and dated by an official from the facility in Mokopane, is faxed to PTM�s offices in Johannesburg upon receipt of the samples and the original signed sample receipt letter is returned to PTM.� The sample receipt letter is filed in the borehole file in the exploration office.
�
Hard copies of the signed analytical certificates are delivered to PTM�s Johannesburg office for archiving.
�
11.9�������������������������������� Analytical Procedure
�
For the present database, field samples have been analyzed by two different laboratories.� The primary laboratory is currently Set Point laboratories (South Africa) and Genalysis (Australia) is used for referee analyses to confirm the accuracy of the primary laboratory.� Both laboratories are independent of PTM.
�
Set Point Laboratory is accredited with the South African National Accreditation System (SANAS).� Sample preparation is undertaken at the preparation facility at Mokopane.� Transportation of prepared sample pulps from their preparation facility in Mokopane to their analytical laboratory in Johannesburg is done under secure conditions as required by PTM.
�
11.10������������������������� Sample Preparation
�
Samples are received, sorted, verified and checked for moisture and dried if necessary.� Each sample is weighed and the results are recorded.� Rocks, rock chips or lumps are crushed using a jaw crusher to less than 10mm.� The samples are then milled for 5 minutes in a Labtech Essa LM2 mill to achieve a fineness of 90% less than 106�m, which is the minimum requirement to ensure the best accuracy and precision during analysis.
�
11.11������������������������� Precious Metal Determination
�
Samples are analysed for Pt (ppm), Pd (ppm) Rh (ppm) and Au (ppm) by standard 25g lead fire-assay using silver as requested by a co-collector to facilitate easier handling of prills as well as to minimise losses during the cupellation process.� Although collection of three elements (Pt, Pd and Au) is enhanced by this technique, the contrary is true for rhodium (Rh), which
�
|
Technical Report for the Update on Exploration Drilling at the for Waterberg Joint Venture and Waterberg Extension Projects South Africa � 24 November 2014 |
� |
�
�
Coffey Mining South Africa (Pty) Ltd
�
volatilises in the presence of silver during cupellation.� Palladium is used as the co-collector for Rh analysis and then only for selected samples.� The resulting prills are dissolved with aqua regia for Inductively Coupled Plasma (�ICP�) analysis.
�
After pre-concentration by fire assay and microwave dissolution, the resulting solutions are analysed for Au and PGMs by the technique of ICP-OES (Inductively Coupled Plasma�Optical Emission Spectrometry).
�
11.12������������������������� Base metals Determination
�
The base metals (copper, nickel, cobalt and chromium) are analysed using ICP-OES (Inductively Coupled Plasma � Optical Emission Spectrometry) after a four acid digestion.� This technique results in �almost� total digestion.
�
11.13������������������������� Laboratory QA/QC
�
Precious Metals
�
A calibration range contains at least 4 data points for all elements.� The correlation coefficient of the calibration must be greater than 0.999.� If this fails, the instrument is recalibrated.� If it fails again new standards are to be made up to calibrate with.
�
After the instrument is calibrated, the Drift control standard is read back to ensure that the calibration is correct.� Thereafter, this standard is read at the end of every worksheet to check for instrument drift.� The limits for this standard are not be greater than 10% (in the range from 1 to 25ppm) for Au, Pt or Pd or else the batch fails.
�
Base Metals
�
After the ICP-OES instrument is calibrated, the QC control standard is read back to ensure that it has been calibrated correctly.� Thereafter, this standard is read at intervals of 35 samples or less to check for instrument drift.� Each batch of samples shall contain at least one blank sample, one QC sample and a duplicate.� The duplicate is a repeat of a randomly chosen sample from the batch.
�
11.14������������������������� Quality Assurance and Quality Control (QA/QC) Procedures and Results
�
The PTM protocols for quality control are as follows:-
�
1.��������������������������� The core yard manager oversees the core quality control;
�
2.��������������������������� The project geologist oversees the sampling process;
�
3.��������������������������� The exploration geologists and the sample technician is responsible for the actual sampling process;
�
4.��������������������������� The project geologist oversees the chain of custody;
�
5.��������������������������� The internal QP verifies both processes and receives the laboratory data;
�
6.��������������������������� The internal resource geologist and the database manager merge the data and produce the SABLE sampling log with assay values;
�
|
Technical Report for the Update on Exploration Drilling at the for Waterberg Joint Venture and Waterberg Extension Projects South Africa � 24 November 2014 |
� |
�
�
Coffey Mining South Africa (Pty) Ltd
�
7.��������������������������� The second external database auditor verifies the SABLE database and highlights QA&QC failures;
�
8.��������������������������� The responsible person runs the QA&QC analysis including graphs of the standards, blanks and duplicates) and reports anomalies and failures to the internal QP;
�
9.��������������������������� The internal QP requests re-assays;
�
10.�������������������� Check samples are sent to a second laboratory to verify the validity of data received from the first laboratory;
�
11.�������������������� Together with the project geologist, the resource geologist determines the initial resource cut; and
�
12.�������������������� The external auditor verifies the sampling process and signs off on the resource cut.
�
11.15������������������������� Analytical Quality Assurance and Quality Control Data
�
A quality assurance and quality control (QA/QC) programme was undertaken.� The QA/QC programme identifies various aspects of the results that could have negatively influenced the subsequent resource estimate.� It was possible to identify samples that had been swapped, missing samples, and incorrect labelling amongst other aspects.
�
The QA/QC aims to confirm both the precision and accuracy of the laboratory and thereby confirm that the data used in the mineral resource estimate is of sufficient quality.
�
The control samples used comprised of a standard and a blank within every 12 samples submitted and one duplicate within every 20 samples.� The intended aim was approximately 8% coverage for both standards and blanks and 5% coverage for coarse duplicates.� Further control on data integrity was achieved through submittal of pulps to a referee laboratory (Genalysis, Australia).
�
Definition of terms related to the QA/QC protocols applied and subsequent evaluations are provided below:
�
A standard is a reference sample with a known (statistically) element abundance and standard deviation (certified independently).� Reference standards are used to gauge the accuracy of analytical reporting by comparing the pre-determined values to those reported by the analytical laboratory used during an exploration project.
�
A blank is a standard with abundance of the element of interest below the level of detection of the analytical technique (certified independently).
�
A duplicate is the split of a sample taken at a particular stage of the sampling process; e.g. Field Duplicate or Pulp Duplicate.
�
The precision and accuracy will be discussed in terms of the following statistical measures routinely applied by Coffey.
�
���������������������� Thompson and Howarth Plot showing the mean relative percentage error of grouped assay pairs across the entire grade range, used to visualise precision levels by comparing against given control lines.
�
|
Technical Report for the Update on Exploration Drilling at the for Waterberg Joint Venture and Waterberg Extension Projects South Africa � 24 November 2014 |
� |
�
�
Coffey Mining South Africa (Pty) Ltd
�
���������������������� Rank HARD Plot, which ranks all assay pairs in terms of precision levels measured as half of the absolute relative difference from the mean of the assay pairs (HARD), used to visualise relative precision levels and to determine the percentage of the assay pairs population occurring at a certain precision level.
�
���������������������� Mean vs HARD Plot, used as another way of illustrating relative precision levels by showing the range of HARD over the grade range.
�
���������������������� Mean vs HRD Plot is similar to the above, but the sign is retained, thus allowing negative or positive differences to be computed.� This plot gives an overall impression of precision and also shows whether or not there is significant bias between the assay pairs by illustrating the mean percent half relative difference between the assay pairs (mean HRD).
�
���������������������� Correlation Plot is a simple plot of the value of assay 1 against assay 2.� This plot allows an overall visualisation of precision and bias over selected grade ranges.� Correlation coefficients are also used.
�
���������������������� Quantile-Quantile (Q-Q) Plot is a means where the marginal distributions of two datasets can be compared.� Similar distributions should be noted if the data is unbiased.
�
Quality control monitoring protocols involved submission of blanks and certified reference standards with the core sample batches.� After every 5th sample an alternating blank or standard was allocated to the sampling sequence.� The laboratory was requested to create one duplicate from the coarse reject of a randomly selected sample within every batch of 20 samples.� The selection of one pulp duplicate of a randomly selected sample within every batch of 20 samples is also requested.� The actual numbers of control samples submitted are shown in Table 11.15_1 for the Waterberg JV area and Table 11.15_2 for the Waterberg Extension Area.� A total of 10 different standards of varying grades were used at various times throughout this program depending on availability of the standards from African Mineral Standards (Pty) Ltd (AMIS).� A summary of the expected values for all standards can be seen in Table�11.15_3.� All standards were supplied by AMIS.� Quartz material supplied by Set Point has been used as the blank material.
�
|
Technical Report for the Update on Exploration Drilling at the for Waterberg Joint Venture and Waterberg Extension Projects South Africa � 24 November 2014 |
� |
�
�
Coffey Mining South Africa (Pty) Ltd
�
Table 11.15_1
Waterberg Project
Summary of the Number of Control Samples Used in the Waterberg JV Project Area
�
|
� |
� |
� |
Submitted�Rate |
� |
� |
Total�Number |
� |
� |
Proportion |
� |
|
Control�Type |
� |
� |
of�Control |
� |
� |
of�Samples |
� |
� |
of�Total |
� |
|
AMIS0002 |
� |
� |
45 |
� |
� |
� |
� |
� |
0.05 |
% |
|
AMIS0110 |
� |
� |
1601 |
� |
� |
� |
� |
� |
1.7 |
% |
|
AMIS0124 |
� |
� |
214 |
� |
� |
� |
� |
� |
0.2 |
% |
|
AMIS0148 |
� |
� |
683 |
� |
� |
� |
� |
� |
0.7 |
% |
|
AMIS0170 |
� |
� |
531 |
� |
� |
� |
� |
� |
0.6 |
% |
|
AMIS0277 |
� |
� |
9 |
� |
� |
� |
� |
� |
0.01 |
% |
|
AMSI0278 |
� |
� |
968 |
� |
� |
94,385 |
� |
� |
1.0 |
% |
|
AMIS0302 |
� |
� |
1525 |
� |
� |
� |
� |
� |
1.6 |
% |
|
AMIS0325 |
� |
� |
1469 |
� |
� |
� |
� |
� |
1.6 |
% |
|
AMIS0326 |
� |
� |
648 |
� |
� |
� |
� |
� |
0.7 |
% |
|
Blank |
� |
� |
7924 |
� |
� |
� |
� |
� |
8.4 |
% |
|
Pulp Duplicates |
� |
� |
281 |
� |
� |
� |
� |
� |
0.3 |
% |
|
Coarse Reject Duplicates |
� |
� |
255 |
� |
� |
� |
� |
� |
0.3 |
% |
|
Referee |
� |
� |
339 |
� |
� |
12013 |
* |
� |
2.80 |
% |
�
* samples grading 0.25g/t Pt and above
�
Table 11.15_2
Waterberg Project
Summary of the Number of Control Samples Used in the Extension Area
�
|
� |
� |
� |
Submitted�Rate |
� |
� |
Total�Number |
� |
� |
Proportion |
� |
|
Control�Type |
� |
� |
of�Control |
� |
� |
of�Samples |
� |
� |
of�Total |
� |
|
AMIS0148 |
� |
� |
180 |
� |
� |
� |
� |
� |
1.90 |
% |
|
AMIS0302 |
� |
� |
223 |
� |
� |
� |
� |
� |
2.40 |
% |
|
AMIS0325 |
� |
� |
200 |
� |
� |
� |
� |
� |
2.10 |
% |
|
AMIS0326 |
� |
� |
158 |
� |
� |
9479 |
� |
� |
1.70 |
% |
|
Blank |
� |
� |
801 |
� |
� |
� |
� |
� |
8.50 |
% |
|
Pulp Duplicates |
� |
� |
42 |
� |
� |
� |
� |
� |
0.40 |
% |
|
Coarse Duplicates |
� |
� |
480 |
� |
� |
� |
� |
� |
5.10 |
% |
|
Referee |
� |
� |
28 |
� |
� |
1459 |
* |
� |
2 |
% |
�
* samples grading 0.25g/t Pt and above
�
|
Technical Report for the Update on Exploration Drilling at the for Waterberg Joint Venture and Waterberg Extension Projects South Africa � 24 November 2014 |
� |
�
�
Coffey Mining South Africa (Pty) Ltd
�
Table 11.15_3
Platinum Group Metals Ltd: Waterberg Project
Summary of Expected Values of Certified Reference Standards Used
�
|
Standard |
� |
� |
� |
Pt�g/t |
� |
Pd�g/t |
� |
Au�g/t |
� |
Cu�g/t |
� |
Ni�g/t |
� |
Co�g/t |
� |
Cr�g/t |
|
AMIS0002 |
� |
EV |
� |
0.82 |
� |
0.89 |
� |
0.155 |
� |
131 |
� |
197 |
� |
NC |
� |
NC |
|
� |
� |
�2 Std Dev |
� |
0.112 |
� |
0.066 |
� |
0.016 |
� |
15 |
� |
13 |
� |
� |
� |
� |
|
AMIS0110 |
� |
EV |
� |
NC |
� |
NC |
� |
2.3 |
� |
NC |
� |
NC |
� |
NC |
� |
NC |
|
� |
� |
�2 Std Dev |
� |
� |
� |
� |
� |
0.18 |
� |
� |
� |
� |
� |
� |
� |
� |
|
AMIS0124 |
� |
EV |
� |
0.84 |
� |
0.87 |
� |
0.16* |
� |
1324 |
� |
1917 |
� |
94.3* |
� |
133* |
|
� |
� |
�2 Std Dev |
� |
0.07 |
� |
0.06 |
� |
0.02 |
� |
106 |
� |
136 |
� |
15.4 |
� |
30.4 |
|
AMIS0148 |
� |
EV |
� |
1.64 |
� |
1.13 |
� |
0.84 |
� |
541 |
� |
900 |
� |
151 |
� |
NC |
|
� |
� |
�2 Std Dev |
� |
0.1 |
� |
0.08 |
� |
0.04 |
� |
55 |
� |
77 |
� |
11 |
� |
� |
|
AMIS0170 |
� |
EV |
� |
0.72 |
� |
0.81 |
� |
0.09 |
� |
709 |
� |
1071 |
� |
51 |
� |
NC |
|
� |
� |
�2 Std Dev |
� |
0.06 |
� |
0.04 |
� |
0.01 |
� |
45 |
� |
87 |
� |
5 |
� |
� |
|
AMIS0277 |
� |
EV |
� |
1.34 |
� |
1.47 |
� |
0.2 |
� |
1318 |
� |
2305 |
� |
95 |
� |
NC |
|
� |
� |
�2 Std Dev |
� |
0.06 |
� |
0.12 |
� |
0.02 |
� |
58 |
� |
241 |
� |
9 |
� |
� |
|
AMSI0278 |
� |
EV |
� |
1.7 |
� |
2.12 |
� |
0.26 |
� |
1294 |
� |
2026 |
� |
76.5* |
� |
NC |
|
� |
� |
�2 Std Dev |
� |
0.1 |
� |
0.14 |
� |
0.02 |
� |
80 |
� |
236 |
� |
14.1 |
� |
� |
|
AMIS0302 |
� |
EV |
� |
NC |
� |
NC |
� |
4.47 |
� |
NC |
� |
NC |
� |
NC |
� |
NC |
|
� |
� |
�2 Std Dev |
� |
� |
� |
� |
� |
0.34 |
� |
� |
� |
� |
� |
� |
� |
� |
|
AMIS0325 |
� |
EV |
� |
2.06 |
� |
2.25 |
� |
0.3 |
� |
2426 |
� |
4091 |
� |
201 |
� |
NC |
|
� |
� |
�2 Std Dev |
� |
0.18 |
� |
0.18 |
� |
0.04 |
� |
178 |
� |
283 |
� |
20 |
� |
� |
|
AMIS0326 |
� |
EV |
� |
1.05 |
� |
1.26 |
� |
0.17 |
� |
1403 |
� |
2446 |
� |
83 |
� |
NC |
|
� |
� |
�2 Std Dev |
� |
0.08 |
� |
0.08 |
� |
0.02 |
� |
89 |
� |
99 |
� |
10 |
� |
� |
�
All standards supplied by African Mineral Standards (Pty) Ltd
�
* Provisional Concentration
NC � Not Certified for element or method
�
11.16������������������������� Waterberg JV Project Area
�
AMIS0002
�
Greater than 98% of values for all elements except Ni are within two standard deviation limits of the expected value (EV) with <-2% bias.� Only 64% of values for Ni fall within two standard deviations of the EV but all are well within three standard deviations with a bias of -6%.
�
AMIS0110
�
This standard is only certified for Au but greater than 99% of the values are within two standard deviation limits of the EV with a bias of -1.5%
�
AMIS0124
�
Greater than 97% of values for all elements are within two standard deviations of the EV�s with bias of <3% except for Cr and Au.� The Cr values have 100% of values within tolerance but with a high negative bias of -8% which is likely due to the fact that this element is only provisionally
�
|
Technical Report for the Update on Exploration Drilling at the for Waterberg Joint Venture and |
� |
|
Waterberg Extension Projects South Africa � 24 November 2014 |
�
�
Coffey Mining South Africa (Pty) Ltd
�
certified.� The Au graph shows only 88% of values are within tolerance but the EV is very close to detection limit and values are unlikely to be accurate.� A single sample, G7096 fails for Pt and Pd but has acceptable concentrations for the other elements.�� All real samples in the vicinity are low grade and so no follow-up is required.
�
AMIS0148
�
Greater than 89% of the results for Pt and Pd are within two standard deviations of the EV with a bias of less than -3%.� Only 68% of Au results are within two standard deviations with a bias of -3%, however it is possible that this is due to the fact that the certified tolerance is too tight for an EV below 1 g/t where accuracy is more difficult to obtain.� For Cu, Ni and Co 97%, 81% and 63% respectively were within two standard deviations of the EV but with a bias of -5%.� This standard is created from an altered variety of Platreef material and it is possible that the matrix differs to the other standards used and this coupled with the high CaO content, the methodology used may not be able to produce accurate results.� Due to the issues with this standard it is recommended that it is not used in future.� There are three noticeable fails for this standard.� The first is O117370 which has been incorrectly named in the database and is a blank, and O120479 which has been incorrectly named and should be AMIS0326 in the database.� Finally O130563 is a possible transposition with another sample and it is recommended that this sample as well as five samples either side of it within the same batch be re-assayed to confirm results.
�
AMIS0170
�
Greater than 97% of values for all elements are within two standard deviation limits of the EV with <-3% bias.� However there are six samples that have been incorrectly named as this standard and should be AMIS0110.� These are: O66268, O66718, O71377, O72492, O73066 and O75893.� These errors should be fixed manually in the database.
�
AMIS0277
�
All certified elements for this standard except Cu and Co have all of their values within the EV range with a bias <-3% Two samples, O47361 and O47385 have returned slightly higher than expected results for Cu but this trend is not repeated for either Ni or Co and so no follow up is deemed necessary.� A different sample has returned slightly lower than expected results for Co, but for both Cu and Co all samples are well within three standard deviations and as the anomalies are not present in any other element the results are considered acceptable.
�
AMIS0278
�
All certified elements for this standard have greater than 98% of their values within the EV range with -1% bias or less.� There are three samples which fail for a different element each.� As they only fail in a single element it is not deemed necessary to follow up with the laboratory.� These samples are: O48612 for Pt, O50986 for Pd and P59620 for Au.
�
AMIS0302
�
This standard is only certified for Au but greater than 99% of the Au values are within tolerance and a bias of -2% Six samples that have been incorrectly named as this standard.� Sample O84283 has been misnamed and should be a Blank.� Sample O116147 has been misnamed
�
|
Technical Report for the Update on Exploration Drilling at the for Waterberg Joint Venture and |
� |
|
Waterberg Extension Projects South Africa � 24 November 2014 |
�
�
Coffey Mining South Africa (Pty) Ltd
�
and should be AMIS0148 and O87274, O88905, O80202 and O122859 were found to be AMIS0325.� These samples should be corrected manually in the database.
�
AMIS0325
�
Greater than 98% of values for all elements are within two standard deviation limits of the EV with a bias of <-4% except for Au which has a bias of -5% There are 14 samples which have been incorrectly named as this standard.� Samples O87286, G109233, G119702, O94190, O92869, O95858, O104710 and O107930 should be AMIS0302.� There are also two samples, O84271 and O90102 which should be Blanks.� Finally samples O11887, O113545, O120127 and O120371 should be AMIS0326.� All these samples need to have the standard name manually corrected in the database.
�
AMIS0326
�
Greater than 96% of values for all elements except Au are within two standard deviation limits of the EV with a bias of <3%.� Greater than 86% of values for Au are within two standard deviations with a bias of 3%.� There are five samples which have been incorrectly named as this standard in the database.� Samples O106036, O119714, O121305 and O124519 should be AMIS0325, whilst O112241 should be AMIS0148.� These samples should be corrected manually in the database.� Samples O107536 and O130574 fails on all elements; they do not correspond with another standard but possibly could be a transposition.� It is recommended that these samples and five samples either side of it within the same batch be re-assayed to confirm results.
�
Blanks
�
For the most part the blanks return results close to the detection limits for the methods used and are deemed acceptable.� Samples O49041, O72774, O72756, O48909, O49005, O107136, O110857, O110881, O129232 and O130414 have returned higher than expected results possibly due to slight contamination from the preceding samples during the milling process or possible due to a different Blank material being used.
�
Duplicates
�
Three types of duplicates have been assayed.� A random selection of pulp samples grading 0.25g/t Pt or more were sent back to Setpoint for re-assay as pulp duplicates. These samples were given new Sample Numbers before being submitted.� More recently the laboratory was also requested to randomly select a sample within every 20 samples and create a duplicate from the coarse reject. The laboratory also routinely randomly selects a a sample within every 20 samples and creates a duplicate from the pulp.
�
In the pulp duplicates dataset, Pt, Pd and Co have greater than 90% or more of the data pairs which grade more than ten times the detection limit passing 10% HARD precision limits.� Cu and Ni have 87% and 89% respectively and Au only has 73% passing 10% HARD precision limits.� There are a number of samples which are fails and these should be reviewed as the wrong sample could have been re-submitted or re-numbered incorrectly.� There also seems to be poorer precision at higher grades though what the issue here could be cannot be determined.
�
|
Technical Report for the Update on Exploration Drilling at the for Waterberg Joint Venture and |
� |
|
Waterberg Extension Projects South Africa � 24 November 2014 |
�
�
Coffey Mining South Africa (Pty) Ltd
�
In the coarse reject duplicates all elements have greater than 99% of the data pairs which grade more than ten times the detection limit passing 20% HARD precision limits.� As the duplicates are created from coarse rejects there should be a slightly greater variation on the results returned.� However the coarse reject duplicates have performed slightly better than the pulp.� It is possible that because the laboratory is able to track these duplicates easily as they have the same sample ID and that they are monitored more closely to ensure better precision.� This should be investigated further and in future a more suitable way would be to leave an empty packet with a unique sample number assigned in the sampling stream for a coarse reject duplicate to be created.� This way the duplicate sample is not known after preparation.
�
Referee Analysis
�
A random selection of pulps grading 0.25g/t Pt or higher was sent to Genalysis Laboratories in Johannesburg.� The analytical techniques employed were the same as those utilised by Set Point in the primary analysis to ensure compatibility of data.�� However the detection limits at the two laboratories differ.� For this reason all results grading less than ten times the higher detection limit for each element were removed before plotting the results to gain a more accurate comparison.� The comparison graphs for all elements except Au show 89% or more of the data pairs passing 10% HARD.� The comparison for Au is slightly poorer with only 77% of the sample pairs passing 10% HARD, but for the most part the samples pairs with higher variability are also of higher grade and therefore is likely due to the nugget effect of Au.
�
The graphs for the standards inserted into the referee batches have insufficient data to allow for a comprehensive analysis.� Although there are less than ten samples of any particular standard which is insufficient for comprehensive analysis, greater than 86% of values for all elements are within two standard deviations of the EV and 100% of the values for all elements are within three standard deviations and can be considered acceptable.
�
11.17������������������������� Waterberg Extension Project Area
�
AMIS0148
�
Greater than 91% of the results for all elements except Ni and Co are within two standard deviations of the EV with a bias of less than-3% except for Cu which has a bias of -6%.� For Ni 82% of the values are within tolerance with a bias of -4%, and Co 61% of values are within tolerance with a bias of -6%.� This standard is created from an altered variety of Platreef material and it is possible that the matrix differs to the other standards used and this coupled with the high CaO content, the methodology used may not be able to produce accurate results.� Due to the issues with this standard it is recommended that it is not used in future.
�
AMIS0302
�
This standard is only certified for Au but greater than 98% of the Au values are within tolerance and a bias of -2%.� Samples O138474 and O138832 fail and do not correspond with another standard but possibly could be a transposition.� It is recommended that these samples and five samples either side of it within the same batch be re-assayed to confirm results.
�
|
Technical Report for the Update on Exploration Drilling at the for Waterberg Joint Venture and |
� |
|
Waterberg Extension Projects South Africa � 24 November 2014 |
�
�
Coffey Mining South Africa (Pty) Ltd
�
AMIS0325
�
Greater than 98% of values for all elements are within two standard deviation limits of the EV with a bias of <-4%.� There are three samples which have been incorrectly named as this standard. �Samples O136406, O136930 and O140026 should be AMIS0326.� These samples need to have the standard name manually corrected in the database.
�
AMIS0326
�
Greater than 99% of values for all elements are within two standard deviation limits of the EV with a bias of <2%.� One sample, O137198, has been incorrectly named in the database and should be AMIS0325.
�
Blanks
�
For the most part the blanks return results close to the detection limits for the methods used and are deemed acceptable.� O135613 has returned higher than expected results possibly due to slight contamination from the preceding samples during the milling process or possibly a transposition with an adjacent sample.� A review of the surrounding results and possible re-assay from the coarse rejects would be required to confirm.� Sample O131406 fails in the Ni and Co graphs only suggesting a transposition with another sample before the base metal analysis as only these graphs are affected.� A review of the results from the surrounding samples is required to confirm.
�
Duplicates
�
Three types of duplicates have been assayed.� A single batch of pulp samples from borehole WE007 were re-assayed by Set Point as the original assay results did not concur with the mineralization seen in the core.�� The lab was also requested to randomly select a sample within every 20 samples and create a duplicate from the coarse reject.� The laboratory also routinely randomly selects a a sample within every 20 samples and creates a duplicate from the pulp.
�
In the pulp duplicates all elements except Au have 90% or more of the data pairs which graded more than ten times the detection limit passing 10% HARD precision limits.� Au has only 61% of all data pairs passing 10% HARD precision limits.� It was not possible to filter out data pairs that grade lower than ten times the detection for Au as all but four samples were below which is the likely reason for the poorer comparison.
�
In the coarse reject duplicates, all elements have greater than 97% of the data pairs which grade more than ten times the detection limit passing 20% HARD precision limits.� A single sample O138474 falls outside acceptable limits for Au as well as all the base metal results.� It is recommended that this samples and five samples either side of it within the same batch be re-assayed to confirm results.� As the duplicates are created from coarse rejects there should be a slightly greater variation on the results returned.� However again the coarse reject duplicates have performed slightly better than the pulp and likely for the same reasons as stated previously.
�
|
Technical Report for the Update on Exploration Drilling at the for Waterberg Joint Venture and |
� |
|
Waterberg Extension Projects South Africa � 24 November 2014 |
�
�
Coffey Mining South Africa (Pty) Ltd
�
Referee Analysis
�
A single batch of samples from borehole WE007 was sent to Genalysis laboratories in Johannesburg for referee analysis as the original assay results did not concur with the mineralization seen in the core.� The analytical techniques employed were the same as those utilised by Set Point in the primary analysis to ensure compatibility of data.�� However the detection limits at the two laboratories differ.� For this reason all results grading less than ten times the higher detection limit for each element was removed before plotting the results to gain a more accurate comparison.� The comparison graphs for Pd, Cu and Ni show only 75% or more of the data pairs passing 20% HARD, and Pt and Au show 52% and 58% respectively.� There was insufficient numbers of standards inserted in this batch to graph but they returned results within acceptable limits.� It is suspected that the poor comparison between laboratories is due to the fact that a separate � split of core was sent to Genalysis rather than remaining pulp samples and a high nugget effect is being displayed especially with regards to Pt and Au grades.� This will require further investigation to confirm.
�
11.18������������������������� Recommendations and Conclusion
�
From the analysis of the QA/QC data Coffey recommends the following:-
�
������������������ AMIS0148 is a standard created from altered Platreef material which also has a high CaO content.� The QA/QC evaluation has highlighted an issue with this standard, possibly connected to it having a different matrix compared to the other standards used.� This coupled with the high CaO content, would indicate that the methodology used may not be able to produce accurate results.� It is therefore recommended that this standard is not used in the future.
�
������������������ There are still insufficient duplicate pairs in the database for the JV area to check the precision at the primary laboratory.� It was previously recommended that 592 samples (10% of all samples where the Pt grade is higher than 0.25g/t) be submitted for this purpose to Set Point.� To date approximately half of this has been submitted as pulp duplicates.
�
������������������ Currently between 2% and 3% of samples with 0.25g/t Pt or higher have been submitted to Genalysis for referee analysis.� It is recommended that this is increased to 5% for each area.
�
������������������ It is noted that Blanks have been included in the batches sent to the referee laboratory.� As pulps are being sent it is not necessary to include Blanks to check for contamination as the referee laboratory is not carrying out any preparation on the samples.� It would be more suitable to insert standards instead to confirm accuracy.
�
������������������ As noted above for the Extension Area there is a higher than expected variation between the original and referee laboratory result possibly due to the fact that a different � split of the core was sent to Genalysis rather than a pulp.� This variation should however be investigated further.
�
Notwithstanding the corrections required with mis-labelled standards in the database as well as the queries highlighted above, the data is deemed acceptable for the current resource estimation.
�
|
Technical Report for the Update on Exploration Drilling at the for Waterberg Joint Venture and |
� |
|
Waterberg Extension Projects South Africa � 24 November 2014 |
�
�
Coffey Mining South Africa (Pty) Ltd
�
11.19������������������������� Adequacy of Procedures
�
The assay techniques used are considered appropriate for the style of mineralization and the anticipated concentrations of the metals of interest.�� The techniques are certified and sufficient laboratory QA/QC is undertaken to ensure the results can be relied upon.
�
11.20������������������������� Coffey: Technical Review
�
The drilling, sampling and analytical aspects of the project are considered to have been undertaken to industry standards.� The data is considered to be reliable and suitable for mineral resource estimation.
�
|
Technical Report for the Update on Exploration Drilling at the for Waterberg Joint Venture and |
� |
|
Waterberg Extension Projects South Africa � 24 November 2014 |
�
�
Coffey Mining South Africa (Pty) Ltd
�
12������������������������������������������ DATA VERIFICATION
�
The Quality Assurance and Quality Control program of PTM addresses all aspects of the exploration project to ensure high integrity of data obtained through drilling, sampling, assaying and recording of geological observations for the purpose of attaining an accurate geological model and a reliable mineral resource estimate.� The data has been verified by Coffey to a level satisfactory for Inferred Resource estimation and disclosure of the selected grade intervals.
�
12.1�������������������������������� Accurate Placement and Survey of Borehole Collars
�
Boreholes were sited with a handheld GPS (Garmin GPSMAP 62) by the Project Geologist on an initial grid of 250m by 250m.� This grid was designed and laid out using ArcView GIS onto the known 1:250 000 Geological Map of the area along strike with section lines approximately perpendicular to the dip.� Coordinates were determined in ArcView GIS and electronically communicated to the Project Geologist.� The projected coordinate system, WG27, is a Transverse Mercator projection with the central meridian at 29, the D_Hartebeesthoek_1994 datum and WGS_1984 spheroid.� All borehole collar positions are permanently marked on completion and surveyed by an accredited surveyor.� This photograph illustrates the concrete block and steel rod marking the collar position of a drilled borehole (Figure 12.1_1).
�
Figure 12.1_1
Permanent Borehole Beacon
�
|
|
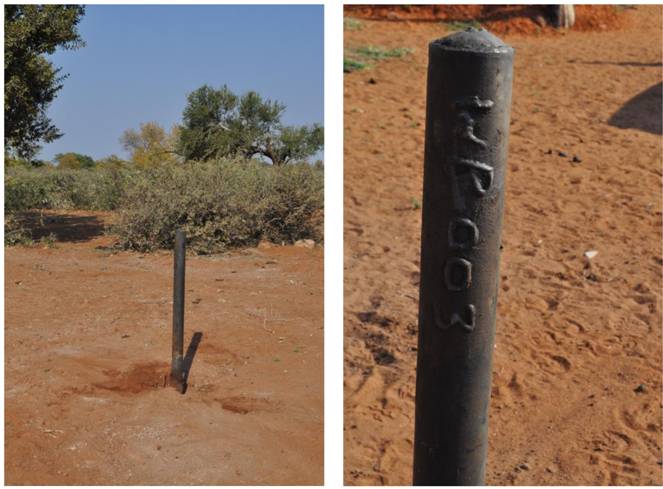
�
The borehole casings installed in all boreholes are left in the borehole and the boreholes are plugged and marked with a steel rod.� This provides access to the borehole if, at a later stage, it
�
|
Technical Report for the Update on Exploration Drilling at the for Waterberg Joint Venture and |
� |
|
Waterberg Extension Projects South Africa � 24 November 2014 |
�
�
Coffey Mining South Africa (Pty) Ltd
�
is needed for any reason e.g. geophysical down-hole surveys or drilling of more deflections.� The borehole number is welded onto the rod.
�
12.2�������������������������������� Downhole Surveys
�
The original boreholes as well as all deflections when applicable are surveyed with a down-hole survey instrument in order to accurately determine the coordinates of intersections and plot the deflection (off the vertical) of the original borehole.� Down-hole surveys have been conducted by the company, BCR Surveys, using a Reflex EZ-AQ/EMS down-hole survey instrument.
�
A random down-hole check survey (Waterberg JV Project) was being conducted by Digital Borehole Surveying Pty Ltd using a Gyro Smart tm�instrument to confirm the accuracy of the reflex instrument.� All the down hole surveys for boreholes on the Waterberg Extension Project were conducted by Digital Borehole Surveying Pty Ltd using a Gyro Smart tm�instrument.
�
|
Technical Report for the Update on Exploration Drilling at the for Waterberg Joint Venture and |
� |
|
Waterberg Extension Projects South Africa � 24 November 2014 |
�
�
Coffey Mining South Africa (Pty) Ltd
�
13������������������������������������������ MINERAL PROCESSING AND METALLURGICAL TESTING
�
Waterberg JV Project
�
Mineralogical characterisation was undertaken on samples from the F - Zone and T2 Layer by SGS in Johannesburg.� Scoping testwork indicated that both samples are fairly soft and mill easily.� Feed characterization showed that the T2 - Layer sample has a greater Pt, Pd, Au, Ni and Cu content than the F - Zone sample.� Quantitative mineralogy was carried out on composites to ascertain the mineral speciation, particle size and mode of occurrence (association, degree of liberation and exposure).� Based on the mineralogical properties, the T2 - Layer sample has better beneficiation properties than the F - Zone sample, since there is a greater degree of liberation and particle size.
�
Flotation testwork on both samples confirmed the mineralogical observations.� The T2 - Layer sample has a better rate of flotation and maximum recovery for the economic metals.� However, the T2 - Layer sample contains clayish minerals and floatable gangue, indicating a good plant operating requirement
�
Based on the scoping testwork, the estimated recovery for the precious metals are:
�
���������������������� 2PGE (Pt,Pd)+Au: 88% (T2 - Layer) and 83% (F - Zone)
�
���������������������� Total Cu: 87% (T2 - Layer) and 74% (F - Zone)
�
���������������������� Total Ni: 83% (T2 - Layer) and 59% (F - Zone)
�
Two samples of F - Zone and the T2 - Layer material were delivered to SGS for flotation and mineralogical characterisation.� The flotation testwork was carried out at scoping level.� The mineralogical testwork consisted of petrographic and quantitative microscope analysis (QEMSCAN).� The analysis included petrography examination of the cores, and quantitative analysis of sample material milled to a grind of P80�75 �m.� A detailed analysis was carried out on each sample for Ni, Cu, Co, Zn, Pb, Fe, Cr and Mn plus Al2O3, SiO2, Fe2O3, MgO, MnO, CaO, K2O, Na2O, TiO2, P2O5, V2O5, Cr2O3.� F - Zone material feed assay was 3.24g/t 2PGE+Au and T2 - Layer 7.22g/t 2PGE+Au.
�
After milling to a grind of P80�75 �m, a single rougher-cleaner flotation test was carried out on each sample to determine the recovery and upgrading of PGMs, total Ni and total Cu.
�
While the T2 - Layer flotation response is good at 88% recovery, the best recovery on F - Zone material achieved in the testwork was 83%
�
Further test work supplied to Worley Parson�s was reported in the Preliminary Economic Assessment dated February 14, 2014.� This further work determined that concentrate grades of greater than 100 g/t could be achieved from the material tested from the T - and F - Zones without significant reductions in recoveries.
�
Further testwork should be carried out to establish optimum operating conditions including the likely grade and recovery of F - Zone material.
�
|
Technical Report for the Update on Exploration Drilling at the for Waterberg Joint Venture and |
� |
|
Waterberg Extension Projects South Africa � 24 November 2014 |
�
�
Coffey Mining South Africa (Pty) Ltd
�
Waterberg Extension Project
�
There has been no mineral processing or metallurgical testing completed on the mineralization encountered on the Waterberg Extension Project.
�
|
Technical Report for the Update on Exploration Drilling at the for Waterberg Joint Venture and |
� |
|
Waterberg Extension Projects South Africa � 24 November 2014 |
�
�
Coffey Mining South Africa (Pty) Ltd
�
14������������������������������������������ MINERAL RESOURCE ESTIMATES
�
The Mineral Resource Estimate section of this report is taken form the report dated 12 June�2014 and has not been changed from that last report. It is included for completeness.
�
Mineral resource estimates have been declared for both the T and F � Zone mineralization of the farms Ketting 368LR, Goedetrouw 366LR and Early Dawn 369LR.
�
Two primary mineralized layers have been identified in the T - Zone.� In the deeper F - Zone, based on lithological, mineralogical, geochemical and textural characteristics, seven different units (FP and FH1 to FH6) have been identified.� It is the identification of these units and the classification of historical exploration data to fit this new interpretation that is the primary difference between this and previous mineral resource estimates.
�
Table 14_1
Waterberg Project
Summary of the Mineral Resource Estimate Data
�
|
� |
� |
Depth�of�modelling |
� |
Depth�of |
� |
� |
� |
� |
� |
� |
� | ||||
|
Zone/Layer/Unit |
� |
Min |
� |
Max |
� |
Min |
� |
Max |
� |
No�of |
� |
No�of�Inter- |
� |
Mineral |
� |
|
T1 |
� |
124 |
� |
650 |
� |
176 |
� |
1,363 |
� |
24 |
� |
62 |
� |
Yes |
� |
|
T2 |
� |
127 |
� |
1,250 |
� |
141 |
� |
1,370 |
� |
26 |
� |
69 |
� |
Yes |
� |
|
FH5 |
� |
88 |
� |
1,250 |
� |
232 |
� |
1302 |
� |
78 |
� |
230 |
� |
Yes |
� |
|
FH4 |
� |
166 |
� |
1,250 |
� |
259 |
� |
1311 |
� |
67 |
� |
194 |
� |
Yes |
� |
|
FH3 |
� |
190 |
� |
1,250 |
� |
330 |
� |
1324 |
� |
58 |
� |
163 |
� |
Yes |
� |
|
FH2 |
� |
213 |
� |
1,250 |
� |
339 |
� |
1289 |
� |
49 |
� |
137 |
� |
Yes |
� |
|
FH1 |
� |
218 |
� |
1,250 |
� |
348 |
� |
1296 |
� |
42 |
� |
107 |
� |
Yes |
� |
�
Based on the available data a mineral resource estimate has been undertaken.� Prior to declaration of the mineral resource, Coffey took into consideration the prospect that the project �has reasonable prospects for economic extraction�.
�
At the request of PTM, a Preliminary Economic Assessment (PEA) was compiled by Worley Parsons RSA, �The Preliminary Economic Assessment on Waterberg Joint Venture Project, Limpopo Province, South Africa� (14 February�2014).� The report represents the output of a Preliminary Economic Assessment undertaken by Worley Parsons RSA that commenced in August�2013.
�
The main objective of the study was to provide sufficient confidence that further studies (Pre- Feasibility) should be undertaken to further improve the confidence level of the Waterberg Joint Venture Project as a viable business case.
�
|
Technical Report for the Update on Exploration Drilling at the for Waterberg Joint Venture and |
|
|
Waterberg Extension Projects South Africa � 24 November�2014 |
� |
�
Coffey Mining South Africa (Pty) Ltd
�
Relevant findings of the study were:
�
������������������ Financial Valuation indicates a viable Project within a 30% level of confidence.� Based on this, the way forward is to progress to the next level of study.
������������������ The Waterberg Joint Venture Project could support a decline accessed mine with a 19 year life and steady state production averaging 655,000 ounces per year of platinum, palladium and gold.
�
Based on these findings Coffey consider that for both the Waterberg JV Project and the Waterberg Extension Project there are reasonable prospects for economic extraction.
�
14.1�������������������������������� Methodology
�
The data that formed the basis for the mineral resource estimate was an exploration database that contained the details of geological logging and assay values derived from a surface drilling programme.� The area where each zone/layer was present was delineated after examination of the intersections in the various boreholes (Figure 14.1_1).� A structural model of each layer was also created based on the intersections of the boreholes (Figure 14.1_2).
�
14.1.1���������������������� T - Zone Estimation
�
The data was used to define the characteristics of the various layers based on their geological characteristics and geochemical signatures.� The core was carefully examined to ensure the designations and correlations were valid.� Diagnostic features were found to identify the T - Zone directly from the core.� A geological interpretation had previously been developed to assist in the understanding of the T � Zone characteristics (Figure 14.1.1_1).� The additional drilling confirmed the geological interpretation and understanding.
�
All the intersections were checked on the core to ensure that the layer designation was true to the core and consistency for all the deflections from a borehole.� These cuts formed the basis of the mineral resource estimate.� The cuts were also defined based on the geology, a marginal cut-off grade of 0.01g/t PGM and a minimum thickness of 2m.� Basic statistics were undertaken on the data noting that the data was clustered due to the number of deflections for each borehole.
�
Data in the estimate from the drilling completed by PTM consists of over a 69 intersections from 26 boreholes.� Each borehole was examined for completeness in respect of data (geology, sampling, collar coordinates and sample recovery) prior to inclusion in the estimate.
�
An inverse distance weighted (power 2) estimate was undertaken using the 3D software package CAE Mining Studio�.� A common seam block model was developed into which the estimate was undertaken.� A geological loss of 12.5% was applied based on the geological understanding of the deposit which is informed by the regular drilling grid of 250m x 250m.
�
|
Technical Report for the Update on Exploration Drilling at the for Waterberg Joint Venture and |
|
|
Waterberg Extension Projects South Africa � 24 November�2014 |
� |
�
Coffey Mining South Africa (Pty) Ltd
Figure 14.1.1_1
Waterberg Project
A Geological Interpretation of the T- Layer
�
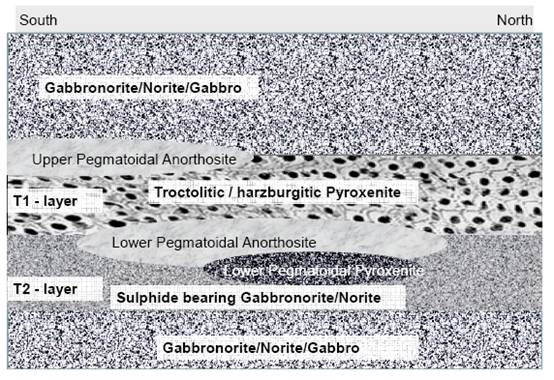
�
14.1.2���������������������� F - Zone Estimation
�
Previously the entire F - Zone was modelled as a single unit.� In the �Revised and Updated Mineral Resource Estimate for the Waterberg Platinum Project, South Africa � September�2013�.� The layering of mineralization within the broader F - Zone was modelled by defining areas where the nature of the mineralization was similar � a facies approach.� Distribution of grade values within the F - Zone was controlled by creating a geological block model with a flat base representing the base of the F - Zone and interpolating grade values using inverse distance weighted (power 2) interpolation methodology.� The model estimation search volume was set parallel with the base of the F - Zone.� The thickness of the F - Zone was modelled using the intersected thickness within each borehole as control points.� The report also documented a study of the relationship between rock types and mineralization.� It was determined that the mineralized portions were not directly related to specific rock types.
�
In the most recent data base, within each borehole, the intersection depths for each of unit (FP and FH1 to FH6) described above, were supplied as separate data files.� The improved understanding of the geometry and nature of the mineralization within the F - Zone has now made it possible to construct a three dimensional block model into which grade values have been interpolated.� PTM provided closed wireframe models that represent the volume of each of the F - Zone Units.
�
|
Technical Report for the Update on Exploration Drilling at the for Waterberg Joint Venture and |
|
|
Waterberg Extension Projects South Africa � 24 November�2014 |
� |
�
Coffey Mining South Africa (Pty) Ltd
�
Coffey studied these wireframe models in relation to the borehole logs and found there to be consistent correlation between the borehole data and the wireframe models.� Occasional inconsistencies were found, specifically in the wireframe defining the FH6 Unit.� Coffey does not, however, believe that these significantly affect the mineral resource estimate.
�
The most common sample thickness in the database is 1m and 0.5m.� Borehole intersections were composited for Pt, Pd, Au, Cu and Ni to 1m lengths across each Unit.� A minimum composite thickness of 50cm was permitted at bounding surfaces.� It was determined that each Unit is generally continuous across the project area.
�
For each F - Zone Unit a three dimensional block model was developed utilising the 3D software package CAE Mining Studio�.
�
Basic descriptive statistics were determined for the sample data within each of the mineralized layers, noting that data points are often spatially clustered because a number of deflections were usually drilled from each motherhole.
�
The area modelled is bounded in the south by the tenement boundary.� In the north the limit of the resource estimate is defined based on the spacing of the borehole intersections, specifically those located on Early Dawn 369LR.� The eastern extent is limited by the sub-outcrop.� The average elevation of the topography is 1040m above mean sea level.� The block models extend to an elevation of -210m, approximately 1250m below surface.� The Waterberg Group is open to the west.
�
|
Technical Report for the Update on Exploration Drilling at the for Waterberg Joint Venture and |
|
|
Waterberg Extension Projects South Africa � 24 November�2014 |
� |
�
�
Coffey Mining South Africa (Pty) Ltd
�
Figure 14.1_1
Area Underlain by the T- Layer and F - Zone
T - Zone
�
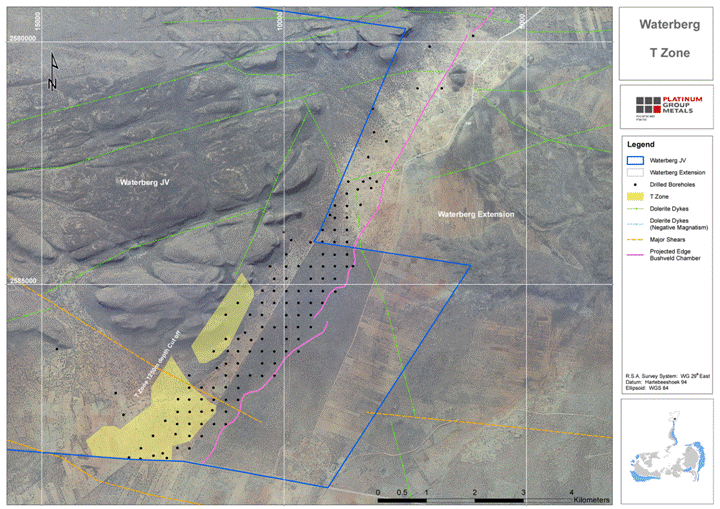
�
|
Technical Report for the Update on Exploration Drilling at the for Waterberg Joint Venture and |
|
|
Waterberg Extension Projects South Africa � 24 November�2014 |
� |
�
�
Coffey Mining South Africa (Pty) Ltd
�
F - Zone
�
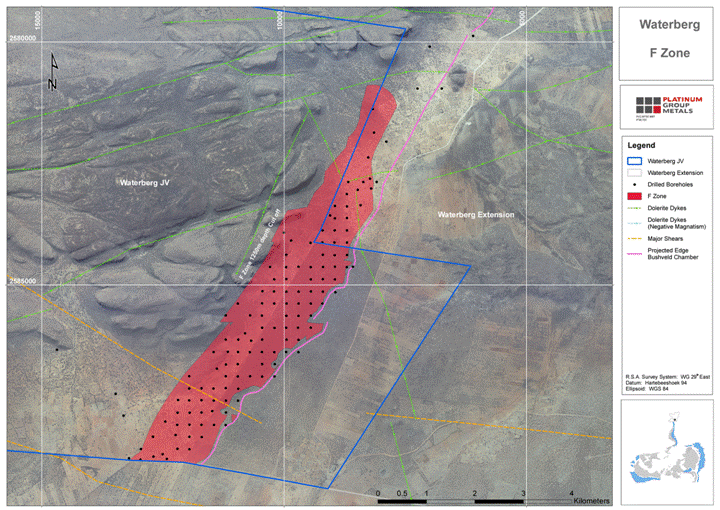
�
|
Technical Report for the Update on Exploration Drilling at the for Waterberg Joint Venture and |
|
|
Waterberg Extension Projects South Africa � 24 November�2014 |
� |
�
�
Coffey Mining South Africa (Pty) Ltd
�
Figure 14.1_2
Waterberg Project
Isometric views of the Structural Model for the T- Layer and F - Zone
�

�
|
Technical Report for the Update on Exploration Drilling at the for Waterberg Joint Venture and |
|
|
Waterberg Extension Projects South Africa � 24 November�2014 |
� |
�
�
Coffey Mining South Africa (Pty) Ltd
�
14.2 ������������������������������� Density
�
The density data for the majority of the pulps was measured by gas pycnometer.� As a result there are some gaps in the data.� The gaps were assigned values according to their lithology and the analysis described below.� It is noted that the methodology is not considered appropriate for the determination of bulk density.� However, there is no bulk density data (Archimedes method) which could be used to determine a conversion factor.
�
The existing data was used and applied to lithologies where no data existed based on the logged lithology.
�
14.3 ������������������������������� Compositing
�
The borehole intersections for the T � Zone intersections were composited for Pt, Pd, Rh, Au, Cu and Ni.� The compositing utilised the weighing of density and thickness.
�
For the F � Zone, the raw borehole data was composited to a constant 1m interval utilised the weighting of density and thickness.
�
14.4 ������������������������������� Descriptive Statistics: Composites
�
Detailed descriptive statistical analysis has been completed based on the total composite data for the mineralized layers.� Figure�14.4_1 and Figure 14.4_2
�
Figure 14.4_1
Summary of Statistics for the Composites of Each Layer
�

�
|
Technical Report for the Update on Exploration Drilling at the for Waterberg Joint Venture and |
|
|
Waterberg Extension Projects South Africa � 24 November�2014 |
� |
�
�
Coffey Mining South Africa (Pty) Ltd
�
Figure 14.4_2
Summary of Statistics for the Composites of Each Layer
�

�
14.5 ������������������������������� Rhodium Analysis
�
The determination of Rh has not been undertaken for every sample submitted because the grades have generally been low and the analysis is very expensive.� In order to determine a factor, a suite of samples was analyzed for all the PGMs including Rh.� A regression analysis was undertaken to determine if a factor could be applied (Table 14.5_1 and Figure 14.5_1).� A comparison between the regression using Pt or Pd was undertaken with a range of difference between -1.5% to 6.6% and typically a difference of less than 0.01g/t Rh.� After analysis the grade of Pt was used as the factor for the addition of Rh (Table 14.5_2).
�
Table 14.5_1
Correlation Coefficient for Rh against other assayed elements
�
|
Correlation |
� |
Number |
� |
Pt |
� |
Pd |
� |
Au |
� |
Cu |
� |
Ni |
� |
Cr |
� |
S% |
� |
|
FH5 |
� |
1,520 |
� |
0.83 |
� |
0.83 |
� |
0.40 |
� |
0.12 |
� |
0.11 |
� |
-0.17 |
� |
0.09 |
� |
|
FH4 |
� |
1,106 |
� |
0.61 |
� |
0.60 |
� |
0.23 |
� |
-0.04 |
� |
0.11 |
� |
-0.35 |
� |
-0.12 |
� |
|
FH3 |
� |
715 |
� |
0.60 |
� |
0.52 |
� |
0.27 |
� |
0.03 |
� |
0.17 |
� |
-0.42 |
� |
-0.02 |
� |
|
FH2 |
� |
832 |
� |
0.64 |
� |
0.64 |
� |
0.43 |
� |
0.17 |
� |
0.30 |
� |
-0.42 |
� |
0.14 |
� |
|
FH1 |
� |
748 |
� |
0.43 |
� |
0.46 |
� |
0.23 |
� |
0.07 |
� |
0.18 |
� |
-0.31 |
� |
0.05 |
� |
�
|
Technical Report for the Update on Exploration Drilling at the for Waterberg Joint Venture and |
|
|
Waterberg Extension Projects South Africa � 24 November�2014 |
� |
�
�
Coffey Mining South Africa (Pty) Ltd
�
Figure 14.5_1
Correlation of Rh against Pt and Pd
�

�
|
Technical Report for the Update on Exploration Drilling at the for Waterberg Joint Venture and |
|
|
Waterberg Extension Projects South Africa � 24 November�2014 |
� |
�
Coffey Mining South Africa (Pty) Ltd
�
Table 14.5_2
Correlation Factors for Rh
�
|
� |
� |
� |
� |
� |
� |
Average�grade�Rh�(g/t)�using |
� |
Accuracy�from |
� | ||
|
� |
� |
Pt�factor |
� |
Pd�factor |
� |
Pt�factor |
� |
Pd�factor |
� |
Pt |
� |
|
FH5 |
� |
0.83 |
� |
0.83 |
� |
0.06 |
� |
0.07 |
� |
2.2 |
% |
|
FH4 |
� |
0.61 |
� |
0.60 |
� |
0.05 |
� |
0.04 |
� |
-1.5 |
% |
|
FH3 |
� |
0.60 |
� |
0.52 |
� |
0.04 |
� |
0.04 |
� |
1.0 |
% |
|
FH2 |
� |
0.64 |
� |
0.64 |
� |
0.04 |
� |
0.04 |
� |
6.6 |
% |
|
FH1 |
� |
0.43 |
� |
0.46 |
� |
0.05 |
� |
0.05 |
� |
0.6 |
% |
�
14.6 ������������������������������� Outlier Analysis
�
An assessment of the high-grade composite was completed to determine whether high-grade capping was required.� The approach taken to the assessment of the potential outliers is summarised as:-
�
� ������������������������������ Detailed review of histograms with significant breaks in populations interpreted as possible outliers.
�
� ������������������������������ The ranking of the composite data and the investigation of the influence of individual composites on the mean and standard deviation plots.
�
Based on this analysis no capping or cutting was required.
�
14.7 ������������������������������� Block Model Development
�
14.7.1 ��������������������� T - Zone
�
A series of three-dimensional (3D) estimates representing each layer as defined by the geological logging and interpretation (Figure 14.7.1_1).� The block model cell size utilised was based on borehole spacing
�
Table 14.7.1_1
Summary of the Block Model Details (T � Zone)
�
|
� |
� |
Block�Model�Origin�(Centroid) |
� |
� |
� |
� |
� |
Sub�cell |
� | ||
|
� |
� |
Min |
� |
Max |
� |
Parent�Cell�Size |
� |
No�of�blocks |
� |
splitting |
� |
|
� |
� |
� |
� |
T layer |
� |
� |
� |
� |
� | ||
|
XC |
� |
- 16,000 |
� |
-7,000 |
� |
200 |
� |
45 |
� |
No |
� |
|
YC |
� |
- 2,591,000 |
� |
- 2,581,000 |
� |
200 |
� |
50 |
� |
No |
� |
�
14.7.2 ��������������������� F � Zone Units
�
The wireframe volumes supplied by PTM were checked by looking at a number of dip cross sections though the wireframes and though the borehole intersections from which they were created.� It was noted that the wireframes snapped on or very close to the top or bottom of the relevant sample.� Some areas were noted where the wireframe surface representing the top of one unit did not correspond precisely to the bottom surface of the overlaying unit.� Coffey
�
|
Technical Report for the Update on Exploration Drilling at the for Waterberg Joint Venture and |
� |
|
Waterberg Extension Projects South Africa � 24 November�2014 |
� |
�
�
Coffey Mining South Africa (Pty) Ltd
�
considers that these will cause only differences in volume estimates and are suitable for the estimation of mineral resources.
�
Separate Datamine block models were created for each unit: FH1, FH2, FH3, FH4, FH5, FH6 and FP.� The base of the model was set at an elevation of -210m below sea level.� This elevation is 1250m below the average surface elevation of 1040m above sea level.� In places the thickness of some of the units are very thin, particularly were one unit pinches out against another.� To accommodate this geometry, the dimensions of the models cells were set to constant dimensions of 10m x 10m in plan and 3m vertically.� After creating the block models, the volume of the block models were compared to the volume of the wireframes.� They were found to match within a faction of a percent.
�
Table 14.7.2_1
Summary of the Block Model Details (F � Zone Units)
�
|
� |
� |
Block Model Origin (Base, West, |
� |
� |
� |
� |
� |
Sub�cell |
� | |||
|
� |
� |
Min |
� |
Max |
� |
Parent�Cell�Size |
� |
No�of�blocks |
� |
splitting |
� | |
|
� |
� |
� |
� |
All F � Zone Units |
� |
� |
� |
� |
� | |||
|
XC |
� |
-15,000 |
� |
-5,000 |
� |
10 |
� |
1000 |
� |
No |
� | |
|
YC |
� |
-2,590,000 |
� |
-2,577,500 |
� |
10 |
� |
1250 |
� |
No |
� | |
|
ZC |
� |
-210 |
� |
1221 |
� |
3 |
� |
477 |
� |
No |
� | |
�
14.8 ������������������������������� Mineral Resource Estimate
�
14.8.1 ��������������������� T � Zone
�
A series of two-dimensional estimates based on the designated cut were undertaken.� Each deflection within the borehole database has been retained as separate data.� These deflections have been offset from the surveyed reef intersection location of the motherhole utilizing the downhole survey data.� Maintaining the individual deflections as separate data rather than compositing the deflections to a single intersection composite is preferred.
�
The structural model for the Waterberg separates the area into a number of fault blocks.� Coffey has treated all fault blocks together, as they would have originally been continuous.
�
The precision of a block estimate is a function of the block size, the amount of local data, the method of estimation and the estimation technique.� A block size of 200m x 200m was selected based on the distribution of the boreholes.� The block model was not rotated.
�
The variables Pt, Pd, Au, Cu and Ni as well as the thickness and density were estimated directly.� Rh was not estimated as the assay of Rh was only commissioned where the combined Pt+Pd+Au>1g/t.� The result is therefore considered biased.
�
|
Technical Report for the Update on Exploration Drilling at the for Waterberg Joint Venture and |
|
|
Waterberg Extension Projects South Africa � 24 November�2014 |
� |
�
Coffey Mining South Africa (Pty) Ltd
�
14.8.2 ��������������������� F � Zone
�
Layer Modelling
�
Previous mineral resource estimates of the F - Zone have identified separate areas of grade and thickness of the entire F - Zone.� A better understanding of the mineralization has resulted in the definition of seven conformable layers: FP and FH1 to FH6.� Coffey considers that the control of mineralization can be better modelled using these layers than using the previous facies approach.
�
A number of structural faults have been identified in the project area.� These have been taken into account in the modelling of the Unit wireframes.
�
Grade Interpolation
�
The dip and dip direction of every triangle in each wireframe volume were calculated.� This information was interpolated into the geological models using a nearest neighbour search.
�
Grade values for Pt, Pd, Au, Cu, Ni and density were interpolated into the structural models using an inverse distance squared (IDW) methodology using a dynamic search ellipsoid.
�
Each deflection within the borehole database has been retained as separate data.� The deflections are offset from the motherhole by utilising the borehole survey data.� Retaining the deflections, rather that averaging the deflections into a single intersection is preferred.
�
The reported grade of platinum group metals (2PGE+Au) was derived by adding the interpolated values of Pt, Pd and Au.
�
A visual and statistical review was completed on the estimates prior to accepting the model.� Acceptable levels of mean reproduction were noted between the block model and input composited data.� Coffey considers the resource estimate to be appropriate and robust.
�
|
Technical Report for the Update on Exploration Drilling at the for Waterberg Joint Venture and |
|
|
Waterberg Extension Projects South Africa � 24 November�2014 |
� |
�
�
Coffey Mining South Africa (Pty) Ltd
�
14.9 ������������������������������� Search Criteria
�
The estimation search criteria for the estimation of grade and density values took into account the orientation of the layering, the spacing of the borehole data, presence of close spaced intersections (deflections) and samples within each intersection.� A three-pass estimation strategy was used, applying progressively expanded and less restrictive sample searches to successive estimation passes, and only considering blocks not previously assigned an estimate.� The parameters were determined after consideration of the method of estimation and the data density.� The sample search and estimation parameters are provided in Table�14.9_1.
�
Table 14.9_1
Waterberg Project
Estimation Search Parameters (F � Layers)
�
|
Search�Parameter |
� |
� |
Value |
� | ||||||
|
Anisotropy |
� |
� |
Omnidirectional |
� | ||||||
|
� |
� |
� |
First |
� |
� |
Second |
� |
� |
Third |
� |
|
Search volume radius � plan |
� |
� |
500m |
� |
� |
1500m |
� |
� |
1500m |
� |
|
Search volume radius - vertical |
� |
� |
9m |
� |
� |
18m |
� |
� |
18m |
� |
|
Minimum number of samples |
� |
� |
12 |
� |
� |
12 |
� |
� |
3 |
� |
|
Maximum number of samples |
� |
� |
36 |
� |
� |
36 |
� |
� |
36 |
� |
|
Maximum number of samples per borehole |
� |
� |
� |
� |
� |
3 |
� |
� |
� |
� |
|
Dip direction of search ellipsoid |
� |
� |
Interpolated into model |
� | ||||||
|
Dip direction of search ellipsoid |
� |
� |
Interpolated into model |
� | ||||||
�
A visual and statistical review was completed on the estimates prior to accepting the model.� Acceptable levels of mean reproduction are noted between the block model and input composite data.� Coffey considers the resource estimate to be appropriate and robust.
�
14.10 ������������������������ Cut-off Grades
�
The approach to the estimate utilised typical estimation techniques in which the determination of the mining cut is critical as the initial step.� This effectively defines the mineralized unit.� The important aspects were the stratigraphic determination and correlation between intersections.� As the mineralization is disseminated within the stratigraphy, the selection of a marginal cut-off and consideration of a potential mining cut are necessary.� In addition the area underlain by each layer was delineated based on the borehole intersections.
�
|
Technical Report for the Update on Exploration Drilling at the for Waterberg Joint Venture and |
|
|
Waterberg Extension Projects South Africa � 24 November�2014 |
� |
�
Coffey Mining South Africa (Pty) Ltd
�
A cut-off grade was applied to the T1 Layer block model in order to ensure that the mineralized layer has �reasonable and realistic prospects for eventual economic extraction� (SAMREC, 2009).� A block cut off grade of 2g/t for the 2PGE+Au grade was applied.
�
No cut-off was applied to the T2 Layer block model.
�
A cut-off grade was applied to the F � Zone block model in order to ensure that the mineralized layer has �reasonable and realistic prospects for eventual economic extraction� (SAMREC, 2009).� A block cut-off grade of 2g/t for the 2PGE+Au grade was applied.
�
14.11������������������������� Geological Loss
�
Two areas were defined defining areas where geological loss of 25% and 12.5% were applied.� These were based primarily on the spacing of surface boreholes and on the knowledge of this type of deposit.� These areas are indicated on Figure 14.11_1.� The geological losses are made up of areas where the layers are absent due to faults, dykes and mafic/ultramafic pegmatites.
�
|
Technical Report for the Update on Exploration Drilling at the for Waterberg Joint Venture and |
|
|
Waterberg Extension Projects South Africa � 24 November�2014 |
� |
�
Coffey Mining South Africa (Pty) Ltd
�
Figure 14.11_1
Waterberg JV Project
Areas of Geological Loss for the T- Layer and F - Zones
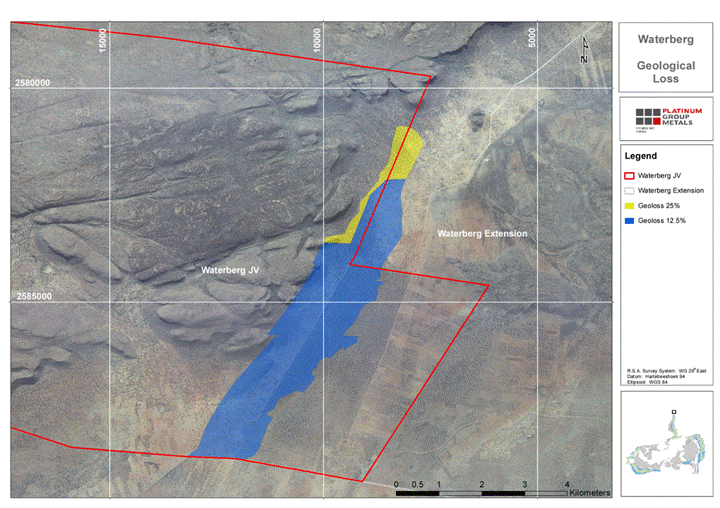
�
|
Technical Report for the Update on Exploration Drilling at the for Waterberg Joint Venture and |
|
|
Waterberg Extension Projects South Africa � 24 November�2014 |
� |
�
Coffey Mining South Africa (Pty) Ltd
�
14.12������������������������� Classification
�
Coffey considers that the mineral resource of the various layers should be classified as an Inferred Mineral Resource.� The data is of sufficient quality and the geological understanding and interpretation are considered appropriate for this level of mineral resource classification.� The resource estimate has been classified based on the criteria set out in Table�14.12_1.
�
Table 14.12_1
Waterberg JV Project
Confidence Levels of Key Criteria
�
|
Items |
� |
Discussion |
� |
Confidence |
|
Drilling Techniques |
� |
Diamond drilling - Industry Standard approach |
� |
High |
|
Logging |
� |
Standard nomenclature and apparent high quality. |
� |
High |
|
Drill Sample Recovery |
� |
Based on site visits the core recovery is estimated as >95% |
� |
High |
|
Sub-sampling Techniques and Sample Preparation |
� |
Industry standard |
� |
High |
|
Quality of Assay Data |
� |
Available data is of industry standard quality. |
� |
High |
|
Verification of Sampling and Assaying |
� |
Verification of sampling undertaken |
� |
High |
|
Location of Sampling Points |
� |
Survey of all collars. Vertical boreholes with typically small deviation. |
� |
High |
|
Data Density and Distribution |
� |
Boreholes spaced across the property. |
� |
Low |
|
Audits or Reviews |
� |
None of which Coffey is aware |
� |
High |
|
Tonnage Factors (Bulk Density) |
� |
Based on specific gravity data |
� |
Low/Moderate |
|
Database Integrity |
� |
Minor errors identified and rectified. Data scrutinised prior to inclusion in resource model database. |
� |
Moderate |
|
Geological Interpretation |
� |
The broad structural confidence but the zones determined are previously not identified the Bushveld Complex. |
� |
Moderate |
|
Compositing |
� |
Single composites were used for each mineralized unit for each intersection. |
� |
High |
|
Statistics |
� |
High coefficient of variation for the variables modelled and relatively well defined statistical distributions. |
� |
Low |
|
Block size |
� |
Appropriate block size selected |
� |
Moderate |
|
Estimation and Modelling Techniques |
� |
Inverse Distance Weighting |
� |
Moderate |
|
Cut-off Grades |
� |
A marginal cut off applied when determining the cuts (0.01g/t PGM and minimum cut of 2m) on which the estimate is based |
� |
High |
|
Mining Factors or Assumptions |
� |
Preliminary Economic Assessment undertaken |
� |
Moderate |
|
Metallurgical Factors or Assumptions |
� |
Preliminary Economic Assessment undertaken |
� |
Moderate |
�
The classification of the mineral resource estimate was underlain in accordance with requirements and guidelines of The South African Code for the Reporting of Exploration Results, Mineral Resources And Mineral Reserves (The SAMREC Code) (2007 Edition as amended July�
�
|
Technical Report for the Update on Exploration Drilling at the for Waterberg Joint Venture and |
|
|
Waterberg Extension Projects South Africa � 24 November�2014 |
� |
�
Coffey Mining South Africa (Pty) Ltd
�
2009).� The reconciliation of the SAMREC Code classification with the CIM Standards (2010) indicates that the criteria for classification and the classes of mineral resource are compatible.
�
It should be noted that an Inferred Mineral Resource has a degree of uncertainty attached.� It cannot be assumed that all or any part of an inferred mineral resource will ever be upgraded to a higher category.� No assumption can be made that any part or all of mineral deposits in this category will ever be converted into mineral reserves.
�
14.13������������������������� Mineral Resource Reporting
�
Metal contents and block tonnages were accumulated and formed the basis for reporting the resource estimate.� The results are presented in Table 14.13_1 and Table 14.13_2.
�
Mineral resources which are not mineral reserves do not have demonstrated economic viability.� The estimate of mineral resources may be materially affected by environmental, permitting, legal, marketing, or other relevant issues.
�
The quantity and grade of reported Inferred Mineral Resources in this estimate are conceptual in nature.� There is no guarantee that all or any part of the Mineral Resource will be converted to a Mineral Reserve.
�
The independent Qualified Persons responsible for the mineral resource estimate in this report and summarized in Table 14.13_1 are Kenneth Lomberg and Alan Goldschmidt.� Mr.�Lomberg is a geologist with some 29 years� experience in mine and exploration geology, resource and reserve estimation and project management in the minerals industry (especially platinum and gold).� He is a practising geologist registered with the South African Council for Natural Scientific Professions (Pr.Sci.Nat.) and is independent of Platinum Group Metals Ltd as that term is defined in Section�1.5 of the Instrument.
�
Mr.�Goldschmidt, a geologist with some 29 years� experience in minerals industry.� He has been primarily involved with geological block models and geostatistical resource estimation.� He is a practising geologist registered with the South African Council for Natural Scientific Professions (Pr.Sci.Nat.) and is independent of Platinum Group Metals Ltd as that term is defined in Section�1.5 of the Instrument.
�
|
Technical Report for the Update on Exploration Drilling at the for Waterberg Joint Venture and |
|
|
Waterberg Extension Projects South Africa � 24 November�2014 |
� |
�
Coffey Mining South Africa (Pty) Ltd
�
Table 14.13_1
Waterberg Project
F - Zone
�
|
� |
� |
Tonnes |
� |
Pt |
� |
Pd |
� |
Rh |
� |
Au |
� |
2PGE+Au |
� |
Cu |
� |
Ni |
� |
Pt |
� |
Pd |
� |
Rh |
� |
Au |
� |
PGE+Au |
� |
Cu |
� |
Ni |
� |
� |
|
Unit |
� |
Mt |
� |
g/t |
� |
g/t |
� |
g/t |
� |
g/t |
� |
g/t |
� |
% |
� |
% |
� |
Moz |
� |
Moz |
� |
Moz |
� |
Moz |
� |
Moz |
� |
(�000)t |
� |
(�000)t |
� |
Pt:Pd:Rh:Au |
|
FH5 |
� |
116.90 |
� |
0.92 |
� |
1.94 |
� |
0.05 |
� |
0.14 |
� |
3.05 |
� |
0.07 |
� |
0.20 |
� |
3.46 |
� |
7.28 |
� |
0.18 |
� |
0.53 |
� |
11.45 |
� |
86 |
� |
228 |
� |
30:64:2:5 |
|
FH4 |
� |
46.32 |
� |
0.91 |
� |
1.90 |
� |
0.04 |
� |
0.14 |
� |
3.00 |
� |
0.08 |
� |
0.19 |
� |
1.36 |
� |
2.84 |
� |
0.07 |
� |
0.20 |
� |
4.47 |
� |
37 |
� |
87 |
� |
30:64:2:5 |
|
FH3 |
� |
40.33 |
� |
0.88 |
� |
1.91 |
� |
0.04 |
� |
0.14 |
� |
2.98 |
� |
0.10 |
� |
0.21 |
� |
1.14 |
� |
2.48 |
� |
0.05 |
� |
0.19 |
� |
3.87 |
� |
40 |
� |
83 |
� |
30:64:1:5 |
|
FH2 |
� |
21.47 |
� |
0.74 |
� |
1.82 |
� |
0.04 |
� |
0.12 |
� |
2.72 |
� |
0.08 |
� |
0.18 |
� |
0.51 |
� |
1.26 |
� |
0.03 |
� |
0.08 |
� |
1.88 |
� |
17 |
� |
39 |
� |
27:67:1:4 |
|
FH1 |
� |
7.80 |
� |
0.93 |
� |
2.32 |
� |
0.05 |
� |
0.15 |
� |
3.46 |
� |
0.07 |
� |
0.18 |
� |
0.23 |
� |
0.58 |
� |
0.01 |
� |
0.04 |
� |
0.87 |
� |
6 |
� |
14 |
� |
27:67:1:4 |
|
� |
� |
232.82 |
� |
0.90 |
� |
1.93 |
� |
0.05 |
� |
0.14 |
� |
3.01 |
� |
0.08 |
� |
0.19 |
� |
6.707 |
� |
14.438 |
� |
0.341 |
� |
1.043 |
� |
22.529 |
� |
186 |
� |
451 |
� |
30:64:2:4 |
�
Individual numbers may not add up due to rounding
�
|
Technical Report for the Update on Exploration Drilling at the for Waterberg Joint Venture and |
� |
�
�
Coffey Mining South Africa (Pty) Ltd
�
Table 14.13_2
Waterberg Project-
Mineral Resource Estimate (SAMREC Code) (12 June 2014)
�
|
� |
� |
Stratigraphic |
� |
Tonnage |
� |
Pt�(g/t) |
� |
Pd |
� |
Rh |
� |
Au |
� |
PGE+Au |
� |
Pt:Pd:Rh:Au |
� |
PGE+Au |
� |
Cu�(%) |
� |
Ni�(%) |
� |
Cu |
� |
Ni |
� |
|
T1 |
� |
2.44 |
� |
10.49 |
� |
1.02 |
� |
1.52 |
� |
� |
� |
0.47 |
� |
3.01 |
� |
34:50:0:16 |
� |
1,015 |
� |
0.17 |
� |
0.10 |
� |
40 |
� |
23 |
� |
|
T2 |
� |
3.87 |
� |
43.57 |
� |
1.14 |
� |
1.99 |
� |
� |
� |
0.82 |
� |
3.95 |
� |
29:50:0:21 |
� |
5,540 |
� |
0.17 |
� |
0.09 |
� |
167 |
� |
90 |
� |
|
T Total |
� |
3.60 |
� |
54.06 |
� |
1.12 |
� |
1.90 |
� |
� |
� |
0.75 |
� |
3.77 |
� |
30:50:0:20 |
� |
6,555 |
� |
0.17 |
� |
0.10 |
� |
207 |
� |
114 |
� |
|
F |
� |
2.75-60 |
� |
232.82 |
� |
0.90 |
� |
1.93 |
� |
0.05 |
� |
0.14 |
� |
3.01 |
� |
30:64:2:4 |
� |
22,529 |
� |
0.08 |
� |
0.19 |
� |
409 |
� |
994 |
� |
|
Total |
� |
� |
� |
286.88 |
� |
0.94 |
� |
1.92 |
� |
0.04 |
� |
0.25 |
� |
3.15 |
� |
30:61:1:8 |
� |
29,084 |
� |
0.10 |
� |
0.18 |
� |
617 |
� |
1,107 |
� |
|
Content (koz) |
� |
8,652 |
� |
17,741 |
� |
341 |
� |
2,350 |
� |
� |
� |
� |
� |
kt |
� |
280 |
� |
502 |
� |
� |
� |
� |
� | ||||
�
Waterberg Project- (JV)
�
|
� |
� |
Stratigraphic |
� |
Tonnage |
� |
Pt�(g/t) |
� |
Pd |
� |
Rh |
� |
Au |
� |
PGE+Au |
� |
Pt:Pd:Rh:Au |
� |
PGE+Au |
� |
Cu�(%) |
� |
Ni�(%) |
� |
Cu |
� |
Ni |
� |
|
T1 |
� |
2.44 |
� |
10.49 |
� |
1.02 |
� |
1.52 |
� |
� |
� |
0.47 |
� |
3.01 |
� |
34:50:0:15 |
� |
1,015 |
� |
0.17 |
� |
0.10 |
� |
40 |
� |
23 |
� |
|
T2 |
� |
3.87 |
� |
43.57 |
� |
1.14 |
� |
1.99 |
� |
� |
� |
0.82 |
� |
3.95 |
� |
29:50:0:21 |
� |
5,540 |
� |
0.17 |
� |
0.09 |
� |
167 |
� |
90 |
� |
|
T Total |
� |
3.60 |
� |
54.06 |
� |
1.12 |
� |
1.90 |
� |
� |
� |
0.75 |
� |
3.77 |
� |
30:50:0:20 |
� |
6,555 |
� |
0.17 |
� |
0.10 |
� |
207 |
� |
114 |
� |
|
F |
� |
2.75-60 |
� |
164.58 |
� |
0.88 |
� |
1.91 |
� |
0.05 |
� |
0.13 |
� |
2.97 |
� |
30:64:2:4 |
� |
15,713 |
� |
0.07 |
� |
0.18 |
� |
247 |
� |
649 |
� |
|
Total |
� |
� |
� |
218.64 |
� |
0.94 |
� |
1.91 |
� |
0.03 |
� |
0.29 |
� |
3.17 |
� |
30:60:1:9 |
� |
22,268 |
� |
0.09 |
� |
0.16 |
� |
455 |
� |
763 |
� |
|
Content (koz) |
� |
6,605 |
� |
13,407 |
� |
239 |
� |
2,018 |
� |
� |
� |
� |
� |
kt |
� |
207 |
� |
346 |
� |
� |
� |
� |
� | ||||
�
Waterberg Project- (Ext)
�
|
� |
� |
Stratigraphic |
� |
Tonnage |
� |
Pt�(g/t) |
� |
Pd |
� |
Rh |
� |
Au |
� |
PGE+Au |
� |
Pt:Pd:Rh:Au |
� |
PGE+Au |
� |
Cu�(%) |
� |
Ni�(%) |
� |
Cu |
� |
Ni |
� |
|
F |
� |
2.75-60 |
� |
68.04 |
� |
0.93 |
� |
1.98 |
� |
0.05 |
� |
0.15 |
� |
3.11 |
� |
30:64:2:4 |
� |
6,802 |
� |
0.11 |
� |
0.23 |
� |
162 |
� |
344 |
� |
|
Total |
� |
� |
� |
68.04 |
� |
0.93 |
� |
1.98 |
� |
0.05 |
� |
0.15 |
� |
3.11 |
� |
30:64:2:4 |
� |
6,802 |
� |
0.11 |
� |
0.23 |
� |
162 |
� |
344 |
� |
|
Content (koz) |
� |
2,043 |
� |
4,325 |
� |
102 |
� |
331 |
� |
� |
� |
� |
� |
kt |
� |
73 |
� |
156 |
� |
� |
� |
� |
� | ||||
�
The T-Zone cut-off is reported as 2PGE +Au and the F - Zone cut-off is reported as 3PGE +Au grade
Individual numbers may not add up due to rounding
�
|
Technical Report for the Update on Exploration Drilling at the for Waterberg Joint Venture and |
� |
�
�
Coffey Mining South Africa (Pty) Ltd
�
15������������������������������������������ ADJACENT PROPERTIES
�
Numerous mineral deposits have been outlined along the northern limb of the Bushveld Complex.� Kenneth Lomberg, the qualified person for this report, has been unable to verify the information on these deposits which is not necessarily indicative of the mineralization on the property that is the subject of this technical report.� The T - Zone on the Waterberg JV Project are in a different position in the northern limb geology as reported at the other deposits and the T - Zones have distinctively different metal ratios with elevated gold values compared to the reported other deposit grades.� The F - Zones have some similarities to the other northern limb deposits in metal prill splits however there may be distinct differences in the geological units containing the mineralization.
�
15.1�������������������������������� The Pan Palladium/Impala Platinum JV
�
The Pan Palladium/Impala Platinum JV on the most northern farm on Platreef outcrop has reported resources of 50Mt at 1.19 g/t (2PGE+Au), 0.07% Ni, 0.21% Cu (Pan Palladium Annual Report, 2003).� Kenneth Lomberg, the qualified person for this report, has been unable to verify the information on which it is based.� It is noted that this estimate is not necessarily indicative of the mineralization on the property that is the subject of this technical report.
�
15.2�������������������������������� Mogalakwena Mine
�
Some 60km south of the project is the world�s largest opencast platinum mine, Mogalakwena Mine (formerly Potgietersrust Platinum Mine), which mines the Platreef and produced 304,800 platinum ounces in 2013.� The latest Mineral Resource and Reserve statement for Mogalakwena Mine is available on the website www.angloplatinum.com and Anglo Platinum Annual Report 2013.
�
15.3�������������������������������� Akanani Project
�
Akanani Project, majority held by Lonmin, is downdip of the Anglo Platinum Mogalakwena Mine, is an exploration project with studies continuing to develop it into a viable operation.� Information pertaining to this project including the latest mineral resource and reserve statement are available on the Lonmin website (www.lomin.com) and in their latest Annual Report 2013.
�
15.4�������������������������������� Boikgantsho Project
�
Located on the northern limb of the Bushveld Complex, and adjacent to Anglo Platinum�s Mogalakwena Mine, this project was acquired through a land acquisition by Atlatsa Resources (formerly Anooraq Resources) in 2000 and a joint venture with Anglo Platinum in 2004.� Historically, exploration drilling has been conducted at the project site which has led to the
�
|
Technical Report for the Update on Exploration Drilling at the for Waterberg Joint Venture and |
� |
�
�
Coffey Mining South Africa (Pty) Ltd
�
estimate of indicated and inferred Mineral Resources.� A preliminary economic assessment was completed in 2005; the results of this work showed that the project warrants further investigation.
�
Details of the project as well as mineral resource and reserve information is available via the company website (www.atlatsaresources.co.za)
�
15.5�������������������������������� Harriet�s Wish and Aurora Projects
�
Sylvania Resources is undertaking exploration activities on the extreme northern end of the northern limb on the farm Harriet�s Wish which is adjacent to and contiguous with the southern boundary of the Waterberg JV Project.� According to Sylvania, the northern portion of Harriet�s Wish is covered by the Waterberg Sediments and the boreholes have intersected PGM mineralization with descriptions similar to that of mineralization found in the Waterberg JV Project.� The author has not been able to verify this data.� No mineral resource or reserve has been declared.� (www.sylvaniaplatinum.com)
�
15.6�������������������������������� Platreef Project (Ivanplats)
�
The Platreef Project, is jointly owned by Ivanplats (90%) and a Japanese consortium of Itochu Corporation; Japan Oil, Gas and Metals National Corporation (JOGMEC) and JGC Corporation (10%).� The Platreef Project is a recently discovered underground deposit of thick, PGM-nickel-copper mineralization on the southern end of the northern limb of the Bushveld Complex (close to Mokpane).� The Platreef Project hosts the southern sector of the Platreef on three contiguous properties: Turfspruit, Macalacaskop and Rietfontein.
�
Ivanplats has delineated a large zone of mineralization within the Platreef, which essentially comprises a steeply-dipping, near-surface mineralized area and a gently-dipping to subhorizontal (<15�) deeper zone from approximately 700m depth downward (the �Flatreef�).� The mineralization is considered open for expansion along the southern and western boundaries of the Flatreef deposit.� The northernmost property, Turfspruit, is contiguous with, and along strike from, Anglo Platinum�s Mogalakwena group of properties and mining operations.� A mineral resource and a mineral reserve have been declared.� (www.ivanplats.com)
�
|
Technical Report for the Update on Exploration Drilling at the for Waterberg Joint Venture and |
� |
�
�
Coffey Mining South Africa (Pty) Ltd
�
16������������������������������������������ OTHER RELEVANT DATA AND INFORMATION
�
To the best of the author�s knowledge there is no other relevant data or information, the omission of which would make this report misleading.
�
|
Technical Report for the Update on Exploration Drilling at the for Waterberg Joint Venture and |
� |
�
�
Coffey Mining South Africa (Pty) Ltd
�
17������������������������������������������ INTERPRETATION AND CONCLUSIONS
�
The Waterberg JV Project and Waterberg Extension Project are two adjoining projects that are located on the northern extension of the Bushveld Complex.� These two projects are at different stages of exploration maturity and are controlled under separate ownership structures.
�
Since the 12 June-2014 mineral resource estimate an additional 71,459m of diamond drilling have been completed at the Waterberg JV and Waterberg Extension Projects combined. The drilling program has been successful at expanding and detailing the Waterberg T, F and Super F zones as part of a continuing prefeasibility study.
�
The findings of a Preliminary Economic Assessment, compiled by Worley Parsons RSA (Pty) Ltd.� were taken into consideration, to confirm that the mineral resource �has a reasonable prospect for economic extraction�.
�
Waterberg JV Project
�
The exploration undertaken confirmed the presence of Bushveld Rocks under the Waterberg Group rocks on the Waterberg JV Project.� Exploration confirmed the presence of elevated PGM concentrations in zones/layers of identified mineralization.� The mineralization is consistent with layered magmatic sulphide deposits and displays characteristics of a geological setting, including the ratio of precious metals in the T - Zone that differs from other locations in the Bushveld Complex.
�
It has been possible to determine and declare a mineral resource for the identified mineralized layers on the Waterberg JV and Waterberg Extension Projects.� The continuity of the mineralized layers between the 111 boreholes allowed for the resource estimate to be made over a length of 5.5km and given the nature of the mineralization, it can be stated that the zones are open down-dip and along strike.
�
Waterberg Extension Project
�
The exploration undertaken on the Waterberg Extension Project has confirmed the northward strike extension of Bushveld Complex rocks under the Waterberg Group cover rocks.� Continued exploration drilling has confirmed the presence of elevated PGM concentrations in zones/layers of identified mineralization.� The mineralization is consistent with layered magmatic sulphide deposits and displays characteristics of a geological setting that differs from other locations in the Bushveld Complex and has been included in the mineral resource estimation.
�
Geophysical surveys including airborne gradient gravity and magnetics, ground gravity and regional government magnetics and gravity display characteristics similar to those associated known mineralization on the Waterberg JV Project.� Modelling of gravity survey data shows areas
�
|
Technical Report for the Update on Exploration Drilling at the for Waterberg Joint Venture and |
� |
�
�
Coffey Mining South Africa (Pty) Ltd
�
of higher density extending a further 25km northeast and curving to north within the Waterberg Extension Project area.� These high density zones are targets for drill testing to test for the presence of dense mafic intrusive rocks of the Bushveld Complex that may host sulphide mineralization with elevated PGM values.
�
The continuity of the mineralized layers based on the geophysical information and the drilling allowed for the mineral resource estimate to be completed over a strike length of 9km.� Based on the available information, the nature of the mineralization, the mineralized zones are expected to continue both down-dip and along strike.
�
|
Technical Report for the Update on Exploration Drilling at the for Waterberg Joint Venture and |
� |
�
�
Coffey Mining South Africa (Pty) Ltd
�
18������������������������������������������ RECOMMENDATIONS
�
Waterberg JV Project
�
It is recommended that exploration drilling be completed as planned to advance the geological confidence in the deposit through infill drilling.� This will provide more data for detailed logging and refined modelling.� This is expected to confirm the geological continuity and allow the declaration of an Indicated Mineral Resource.� Consideration is recommended to commence with a Pre-feasibility Study.� The estimated budget would be US$15 million.
�
Waterberg Extension Project
�
Given the results of the diamond drilling on the Waterberg Extension Project and the extent of target areas generated by geophysical surveys, the completion of the planned exploration drilling is recommended north of the location of the current exploration programme.� The objective of the exploration drilling would be to find the limit of the current deposit, confirm the understanding of the F � Zone and allow appropriate selection of the potential mining cut as well as improve geoscientific confidence in order to be able to declare an Indicated Mineral Resource.� It is recommended that 20,000m of drilling, at an estimated cost of US$2 million, be undertaken.
�
|
Technical Report for the Update on Exploration Drilling at the for Waterberg Joint Venture and |
� |
�
�
Coffey Mining South Africa (Pty) Ltd
�
19������������������������������������������ REFERENCES
�
Barker OB, Brandl G, Callaghan CC, Erickson PG, van der Neut M.� (2006).� The Soutpansberg and Waterberg Groups and the Blouberg Formation.� In Johnson MR, Anhasueer CR and Thomas RJ (Eds).� The Geology of South Africa.� Geological Society of South Africa.� Johannesburg/Council of Geoscience, Pretoria, 301 � 318
�
Bumby AJ.� (November 2000)� The geology of the Blouberg Formation, Waterberg and Soutpansberg Groups in the area of Blouberg mountain, Northern Province, South Africa.� Doctor of Philosophy thesis (unpublished), Faculty of Science University of Pretoria.
�
CIM DEFINITION STANDARDS - For Mineral Resources and Mineral Reserves Prepared by the CIM Standing Committee on Reserve Definitions Adopted by CIM Council on November 27, 2010
�
Cawthorn RG, Eales HV, Walvaren F, Uken R, Watkeys MK (2006).� The Bushveld Complex.� In Johnson MR, Anhasueer CR and Thomas RJ (Eds).� The Geology of South Africa.� Geological Society of South Africa.� Johannesburg/Council of Geoscience, Pretoria, 261 � 282
�
De Waal S, McCarthy S,� Meadon H, Green B, Vermaak V, Vlock N, Govender T, Lambert P, Schweitzer J.� (16 April 2007).� Target generation report.� Internal Report (S0103/07-1) by Shango Solutions
�
Kinnaird, JA, Hutchinson, D, Schurmann, L, Nex, PAM and de Lange, R.� (2005).� Petrology and mineralization of the southern Platreef: northern limb of the Bushveld Complex, South Africa; Mineralium Deposita 40, p.� 576-597
�
Lomberg, KG (5 November 2012).� Updated Exploration Results and Mineral Resource Estimate for the Waterberg Platinum Project, South Africa.� (Latitude 23� 212 53�S, Longitude 28� 482 23�E) NI 43-101 prepared for Platinum Group Metals.
�
Lomberg, KG (1 September 2012).� Exploration Results and Mineral Resource Estimate for the Waterberg Platinum Project, South Africa.� (Latitude 23� 212 53�S, Longitude 28� 482 23�E) NI 43-101 prepared for Platinum Group Metals.
�
Lomberg, KG (9 December 2013).� Amended and Combined Technical Report, Waterberg Joint Venture and Waterberg Extension Projects, South Africa (Latitude 23� 222 01�S, Longitude 28� 492 42�E) NI 43-101 prepared for Platinum Group Metals.
�
Lomberg, KG, Mckinney, R.L.� (31 January 2013).� Waterberg JV Project � QA/QC for data to end of January 2013.� Memorandum prepared for Platinum Group Metals.
�
Lomberg, KG, Goldschmidt, A (2 September 2013) Revised and Updated Mineral Resource Estimate for the Waterberg Platinum Project, South Africa (Latitude 23� 222 01�S, Longitude 28�
�
|
Technical Report for the Update on Exploration Drilling at the for Waterberg Joint Venture and |
� |
�
�
Coffey Mining South Africa (Pty) Ltd
�
492 42�E) NI 43-101 prepared for Platinum Group Metals.
�
Lomberg, KG, Goldschmidt, A (12 June 2014) Revised and Updated Mineral Resource Estimate for Waterberg Joint Venture and Waterberg Extension Projects, South Africa (Latitude 23� 14� 11�S, Longitude 28� 54� 42�E) NI 43-101 prepared for Platinum Group Metals.
�
McCarthy, TS (12 October, 2012).Observations on the Geology of PTM�s Waterberg Prospect.� Report prepared for Platinum Group Metals.
�
Schouwstra RP, Kinloch ED, Lee CA (2000).� A Short Geological Review of the Bushveld Complex.� Platinum Minerals Rev., 2000, 44, (1).� 33-39
�
Roberts, M, Lomberg, KG, (14 February 2014).� Preliminary Economic Assessment on Waterberg Joint Venture Project, Limpopo Province, South Africa by Worley Parsons RSA
�
Sharman-Harris, E (2006).� Geochemical and Isotopic Studies of the Platreef with special emphasis on Sulphide Mineralisation.� Master�s Thesis (unpublished)
�
Van Buren R (May 2013) Interpretation Report for Platinum Group Metals Ltd.� Waterberg Project.� Internal report (FCR2602) by FUGRO Airborne Surveys (pty) Ltd.
�
Van Reenen DD, Roering C, Ashwal LD and de Wit MJ (1992).� Regional geological settings of the Limpopo Belt.� Precambrian Res., 55.� 1-5
�
|
Technical Report for the Update on Exploration Drilling at the for Waterberg Joint Venture and |
� |
�
�
|
� |
Appendix A |
|
� |
Authors Certificate |
�
�
Certificate of Qualified Person
�
As the author of the report entitled �Technical Report for the Update on Exploration Drilling at the for Waterberg Joint Venture and Waterberg Extension Projects, South Africa.� (Latitude 23� 14� 11�S, Longitude 28� 54� 42�E)� dated effective 21 October 2014 (the �Report�),�I hereby state:
�
1.������������� My name is Kenneth Graham Lomberg and I am Principal Consultant Resources with the firm of Coffey Mining South Africa Pty.� Ltd. of 604 Kudu Avenue, Allen�s Nek 1737, Gauteng, South Africa.
�
2.������������� I am a practising geologist registered with the South African Council for Natural Scientific Professions (Pr.Sci.Nat.).
�
3.������������� I am a graduate of the University of Cape Town and hold a Bachelor of Science with Honours (Geology) degree (1984) from this institute.� I also hold a Bachelor of Commerce degree (1993) from the University of South Africa and a Masters in Engineering (2011) from The University of the Witwatersrand.
�
4.������������� I have practiced my profession continuously since 1985.� I have over 5 years of relevant experience having completed mineral resource estimations on various properties located on the Bushveld Complex hosting Magmatic Layered Intrusive style mineralization including for the Waterberg Joint Venture and Waterberg Extension Projects.
�
5.������������� I am a �qualified person� as that term is defined in and for the purposes of the National Instrument 43-101 (Standards of Disclosure for Mineral Projects) (the �Instrument�).
�
6.������������� I have performed consulting services and reviewed files and data supplied by Platinum Group Metals Ltd on the Waterberg Joint Venture Project between April�2013 and September�2013 and on the Waterberg Extension Project since October�2013.
�
7.������������� I have visited site on 16-18 April�2012, 16�18 August�2012, 21�22 August�2012, 13-15 January�2013, 24 - 25 July�2013, 8 November�2013, 24-25 March 2014, 6-7 October 2014.
�
8.������������� I prepared all sections of the report and am responsible for the Report.
�
9.������������� I am not aware of any material fact or material change with respect to the subject matter of the Report, which is not reflected in the Report, the omission of which would make the Report misleading.
�
10.������ I am independent of Platinum Group Metals Ltd pursuant to section�1.5 of the Instrument.
�
11.������ I have read the Instrument and Form�43-101F1 (the �Form) and the Report has been prepared in compliance with the Instrument and the Form.
�
12.������ I do not have nor do I expect to receive a direct or indirect interest in the Mineral Properties of Platinum Group Metals Ltd, and I do not beneficially own, directly or indirectly, any securities of Platinum Group Metals Ltd or any associate or affiliate of such company.
�
13.������ I have not been involved in any capacity on the Waterberg Joint Venture Project prior to April�2012 after which time I prepared an independent mineral resource estimate on the Waterberg Joint Venture
�
�
Project (F - Zone).� I have not been involved in any capacity on the Waterberg Extension Project prior to October�2013.
�
14.������ At the effective date of the Report, to the best of my knowledge, information and belief, the Report contains all scientific and technical information that is required to be disclosed to make the Report not misleading.
�
Dated at Johannesburg, South Africa, on 24 November�2014
�
|
|
� |
|
Kenneth Lomberg Senior Principal |
��B.Sc Hons (Geology), B.Com, M.Eng., Pr.Sci.Nat. |

�
�
Certificate of Qualified Person
�
As the author of the report entitled �Technical Report for the Update on Exploration Drilling at the for Waterberg Joint Venture and Waterberg Extension Projects, South Africa.� (Latitude 23� 14� 11�S, Longitude 28� 54� 42�E)� dated effective 21 October 2014 (the �Report�),�I hereby state:
�
1.������������� My name is Alan Bernard Goldschmidt and I am Senior Consultant Resources with the firm of Coffey Mining South Africa Pty.� Ltd. of 604 Kudu Avenue, Allen�s Nek 1737, Gauteng, South Africa.
�
2.������������� I am a practising geologist registered with the South African Council for Natural Scientific Professions (Pr.Sci.Nat.).
�
3.������������� I am a graduate of the University of Cape Town and hold a Bachelor of Science with Honours (Geology) degree (1987) from this institute.� I also hold a Graduate Diploma, Mining Engineering (1991) from The University of the Witwatersrand.
�
4.������������� I have practiced my profession continuously since 1988.� I have over 5 years of relevant experience having completed mineral resource estimations on various properties.
�
5.������������� I am a �qualified person� as that term is defined in and for the purposes of the National Instrument 43-101 (Standards of Disclosure for Mineral Projects) (the �Instrument�).
�
6.������������� I have performed consulting services and reviewed files and data supplied by Platinum Group Metals Ltd between April�2013 and September�2013.
�
7.������������� I have visited the Waterberg Platinum Project for personal inspection on 24-25 July�2013.
�
8.������������� I contributed to sections 1, 7, 9, 10, 11, 12, 14, 17, 18 of this report and am responsible for these sections.
�
9.������������� I am not aware of any material fact or material change with respect to the subject matter of the Report, which is not reflected in the Report, the omission of which would make the Report misleading.
�
10.������ I am independent of Platinum Group Metals Ltd pursuant to section�1.5 of the Instrument.
�
11.������ I have read the National Instrument and Form�43-101F1 (the �Form) and the Report has been prepared in compliance with the Instrument and the Form.
�
12.������ I do not have nor do I expect to receive a direct or indirect interest in the Mineral Properties of Platinum Group Metals Ltd, and I do not beneficially own, directly or indirectly, any securities of Platinum Group Metals Ltd or any associate or affiliate of such company.
�
13.������ I have not been involved in any capacity on the Waterberg Platinum Project prior to April�2013.
�
14.������ At the effective date of the Report, to the best of my knowledge, information and belief, the Report contains all scientific and technical information that is required to be disclosed to make the Report not misleading.
�
Dated at Johannesburg, South Africa, on 24 November�2014
�
|
|
� |
|
Alan Goldschmidt Senior Consultant |
��B.Sc Hons (Geology), GDE., Pr.Sci.Nat. |
�
Exhibit 99.2
�
|
|
t: +27 11 619 3331 f: +27 11 679 3272 coffey.com |

�
|
TO: |
The Toronto Stock Exchange |
|
� |
NYSE MKT LLC |
|
� |
British Columbia Securities Commission |
|
� |
Alberta Securities Commission |
|
� |
Saskatchewan Financial Services Commission |
|
� |
The Manitoba Securities Commission |
|
� |
Ontario Securities Commission |
|
� |
Autorit� des march�s financiers |
|
� |
New Brunswick Securities Commission |
|
� |
Nova Scotia Securities Commission |
|
� |
Prince Edward Island Securities Office |
|
� |
Securities Commission of Newfoundland and Labrador |
|
� |
� |
|
AND TO: |
Platinum Group Metals Ltd. |
�
RE:��������������� Platinum Group Metals Ltd. (the �Company�) � Consent of Qualified Person
�
1.������������������������������������ I, Alan Bernard Goldschmidt,, consent to the public filing of the technical report titled �Technical Report for the Update on Exploration Drilling at the Waterberg Joint Venture and Waterberg Extension Projects, South Africa� dated 24 November, 2014 (the �Technical Report�).
�
2.������������������������������������ I also consent to the use of extracts from, or a summary of, the Technical Report in the annual information form of the Company dated 24 November, 2014 (the �AIF�).
�
3.������������������������������������ I confirm that I have read the AIF and that the AIF fairly and accurately represents the information in the parts of the Technical Report that I am responsible for.
�
�
Dated this 24th�day of November, 2014.
�
�
|
/s/ Alan Bernard Goldschmidt |
� |
|
� |
� |
|
Alan Bernard Goldschmidt |
� |
|
B.Sc. (Hons) Geology, GDE, Pr.Sci.Nat., MGSSA |
� |
�
Coffey Mining South Africa (Pty) Ltd (2006/030152/079)
VAT Number (415 023 9327)
Block D, Somerset Office Estate, 604 Kudu Street, Allen�s Nek� 1737
Roodepoort, South Africa
www.coffey.com/mining
�
�
Exhibit 99.3
�
|
|
t: +27 11 619 3331 f: +27 11 679 3272 coffey.com |

�
|
TO: |
The Toronto Stock Exchange |
|
� |
NYSE MKT LLC |
|
� |
British Columbia Securities Commission |
|
� |
Alberta Securities Commission |
|
� |
Saskatchewan Financial Services Commission |
|
� |
The Manitoba Securities Commission |
|
� |
Ontario Securities Commission |
|
� |
Autorit� des march�s financiers |
|
� |
New Brunswick Securities Commission |
|
� |
Nova Scotia Securities Commission |
|
� |
Prince Edward Island Securities Office |
|
� |
Securities Commission of Newfoundland and Labrador |
|
� |
� |
|
AND TO: |
Platinum Group Metals Ltd. |
�
RE:��������������� Platinum Group Metals Ltd. (the �Company�) � Consent of Qualified Person
�
1.������������������������������������ I, Kenneth Graham Lomberg, consent to the public filing of the technical report titled �Technical Report for the Update on Exploration Drilling at the Waterberg Joint Venture and Waterberg Extension Projects, South Africa� dated 24 November, 2014 (the �Technical Report�).
�
2.������������������������������������ I also consent to the use of extracts from, or a summary of, the Technical Report in the annual information form of the Company dated 24 November, 2014 (the �AIF�).
�
3.������������������������������������ I confirm that I have read the AIF and that the AIF fairly and accurately represents the information in the parts of the Technical Report that I am responsible for.
�
�
Dated this 24th�day of November, 2014.
�
�
|
/s/ Kenneth Graham Lomberg |
� |
|
� |
� |
|
Kenneth Graham Lomberg |
� |
|
B.Sc. (Hons) Geology, BCom, M. Eng., Pr.Sci.Nat., FGSSA |
� |
�
Coffey Mining South Africa (Pty) Ltd (2006/030152/079)
VAT Number (415 023 9327)
Block D, Somerset Office Estate, 604 Kudu Street, Allen�s Nek� 1737
Roodepoort, South Africa
www.coffey.com/mining
�
�
Serious News for Serious Traders! Try StreetInsider.com Premium Free!
You May Also Be Interested In
- Alphabet stock surges 11% to record high on Q1 earnings beat, first-ever dividend
- Nel ASA: Hy Stor Energy places gigawatt capacity reservation for Mississippi Clean Hydrogen Hub
- Form 8.5 (EPT/RI) - musicMagpie Plc
Create E-mail Alert Related Categories
SEC FilingsSign up for StreetInsider Free!
Receive full access to all new and archived articles, unlimited portfolio tracking, e-mail alerts, custom newswires and RSS feeds - and more!
