

Form 6-K NORDIC AMERICAN TANKERS For: Nov 30
 Tweet
Tweet Share
ShareUNITED STATES
SECURITIES AND EXCHANGE COMMISSION
Washington, D.C. 20549
FORM 6-K
REPORT OF FOREIGN PRIVATE ISSUER
PURSUANT TO RULE 13A-16 OR 15D-16 OF
THE SECURITIES EXCHANGE ACT OF 1934
For the month of November 2015
Commission File Number: 001-13944
NORDIC AMERICAN TANKERS LIMITED
(Translation of registrant's name into English)
LOM Building, 27 Reid Street, Hamilton, HM 11, Bermuda
(Address of principal executive office)
Indicate by check mark whether the registrant files or will file annual reports under cover of Form 20-F or Form 40-F.
Form 20-F ☒ Form 40-F ☐
Indicate by check mark if the registrant is submitting the Form 6-K in paper as permitted by Regulation S-T Rule 101(b)(1): ☐
Note: Regulation S-T Rule 101(b) (1) only permits the submission in paper of a Form 6-K if submitted solely to provide an attached annual report to security holders.
Indicate by check mark if the registrant is submitting the Form 6-K in paper as permitted by Regulation S-T Rule 101(b)(7): ☐
Note: Regulation S-T Rule 101(b)(7) only permits the submission in paper of a Form 6-K if submitted to furnish a report or other documesnt that the registrant foreign private issuer must furnish and make public under the laws of the jurisdiction in which the registrant is incorporated, domiciled or legally organized (the registrant's "home country"), or under the rules of the home country exchange on which the registrant's securities are traded, as long as the report or other document is not a press release, is not required to be and has not been distributed to the registrant's security holders, and, if discussing a material event, has already been the subject of a Form 6-K submission or other Commission filing on EDGAR.
INFORMATION CONTAINED IN THIS FORM 6-K REPORT
Attached as Exhibit 99.1 is a copy of the press release of Nordic American Tankers Limited (the "Company"), dated November 11, 2015, announcing the Company's financial results for the third quarter ended September 30, 2015.
SIGNATURES
Pursuant to the requirements of the Securities Exchange Act of 1934, the registrant has duly caused this report to be signed on its behalf by the undersigned, thereunto duly authorized.
|
|
|
NORDIC AMERICAN TANKERS LIMITED
(registrant)
|
||||
|
Dated: November 12, 2015
|
|
|
By:
|
/s/ Herbjørn Hansson |
|
|
|
|
|
Name:
|
Herbjørn Hansson
|
|
||
|
|
|
Title:
|
Chairman, Chief Executive Officer and President
|
|
||
Exhibit 99.1
Nordic American Tankers' 3Q2015 Report (NYSE: NAT) – Cash dividend declared for the 73rd time.
Hamilton, Bermuda, November 11, 2015
Thanks to a cash break-even rate below $12,000 per day per ship, an increasing NAT Suezmax fleet and achieved spot rates of about $35,000 per day per ship, 3Q2015 produced good results with operating cash flow1 of $49.1m. In 2Q2015, the operating cash flow was $54.5m. For the nine months ending September 30, 2015, operating cash flow was $154.6m. For the full year 2014, operating cash flow was $77.7m. In 2013 operating cash flow was negative, -$11.1m. For the NAT fleet, it is not meaningful to compare quarter for quarter in a precise way. During the first three quarters of 2015 the level of the Suezmax spot tanker market was healthy. So far, 4Q2015 is progressing well with achieved spot rates above the average for the first three quarters of 2015.
The quality of the NAT fleet is at the top of the tanker industry as evidenced by our vetting statistics, that is, inspections of our ships by clients. In such processes safety is a main consideration. Any company should renew its fleet over time. However, whether a ship is 5, 10, 15 years or more is not our focus. The technical and operational quality of the ships is the main criteria for our clients and for NAT.
There is a significant liquidity in the NAT stock. It is attractive for investors to be able to buy and sell shares related to the crude tanker market whenever they wish. In 3Q2015 about 2.2 million shares were traded daily, equating to more than $32m worth of shares changing hands every day. The average volume for 2014 as a whole was about 1.3 million shares per day. The market capitalization of NAT is about $1.4 billion at this time. Net Asset Value (NAV), or the steel value of a vessel, is irrelevant when valuing NAT as a going concern on the stock exchange.
On October 14, 2015, NAT declared a cash dividend of $0.38 per share payable to shareholders of record as of October 29, 2015. Payment of the dividend is expected to take place on or about November 12, 2015. Since NAT commenced operations in the fall of 1997, the Company has paid a dividend 73 times, with total dividend payments over the period amounting to $46.54 per share, including the dividend to be paid on November 12, 2015.
NAT has announced the acquisition of two 2010 built Suezmax tankers. The first one was taken over by us on September 22, 2015 and the second ship was delivered to NAT on October 29, 2015. At this time, our fleet stands at 26 ships of which one newbuilding is planned for delivery in 2016 and a second newbuilding in early 2017. No equity offering is planned in conjunction with the addition of these four vessels.
During the last year, oil prices have decreased significantly, positively impacting Suezmax tanker rates.
Key points to consider:
|
·
|
Tanker rates achieved on average for 3Q2015 were about $35,000 per day per vessel. In 2Q2015 and 3Q2014 the spot rates were $38,800 and $21,000 per day per ship, respectively. Earnings per share (EPS) in 3Q2015 came to $0.29. In 2Q2015 and 3Q2014 EPS were $0.35 and $0.01, respectively.
|
|
·
|
The balance sheet was strengthened in 3Q2015 as we retained about $15.2m of operating cash flow during the quarter to finance future commitments.
|
|
·
|
The undrawn part of our credit facility plus net working capital stood at about $280m at the end of 3Q2015. At the end of 3Q2015, the Company had net debt of about $6.8m per vessel.
|
|
·
|
The two newbuildings for delivery 3Q2016 and 1Q2017 are on schedule.
|
Nordic American Tankers is very different from other tanker companies.
For a variety of reasons, NAT has an operating model that has proven itself to be sustainable in both a weak and a strong tanker market. Accretive fleet growth, low net debt per vessel and quarterly dividend payments are central elements of the strategy. NAT has one type of vessel – the Suezmax vessel that can carry one million barrels of oil. A homogenous fleet reduces our operating costs, which helps to keep our cash-breakeven for NAT below $12,000 per day per vessel.
Financial Information
The Company declared a cash dividend of $0.38 on October 14, 2015, which is expected to be paid about November 12, 2015 to shareholders of record as of October 29, 2015. The number of NAT shares outstanding at the time of this report is 89,182,001. At the same time the market capitalization of NAT is about $1.4 billion. Quarterly dividend payments will continue to be a central part of our strategy.
The Company's operating cash flow in 3Q2015 was $49.1m. In 2Q2015 and 3Q2014 the operating cash flow was $54.5m and $21.7m, respectively.
Earnings per share (EPS) in 3Q2015 were $0.29. In 2Q2015 and 3Q2014 the EPS were $0.35 and $0.01, respectively.
We had a total of 102 days offhire during the quarter. Two more vessels are scheduled to enter drydock later this year.
As a matter of policy and in particular because of high volatility in the tanker market, NAT maintains a strong balance sheet with low net debt and focuses on keeping low financial risk. At the end of 3Q2015, the Company had net debt of about $162m or about $6.8m per vessel.
|
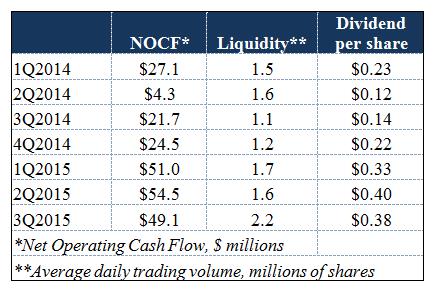
The table on the right shows our cash flow, stock liquidity and dividend over the last seven quarters. So far in 2015, the Company has a significantly stronger cashflow than for 2014 as a whole. Liquidity in the stock is high compared with other tanker companies.
Our primary objective is to enhance total return2 for our shareholders, including paying a quarterly dividend.
|
 |
1 Operating cash flow is a non-GAAP measure. Please see later in this announcement for a reconciliation of operating cash flow to income from vessel operations.
2 Total return is defined as stock price plus dividends, assuming dividends are reinvested in the stock.
1
The Company has in place a non-amortizing credit facility of $430m maturing in November 2017, of which $250m has been drawn. Cash on hand is about $47m. Net working capital and undrawn amounts of the credit facility amount to $280m.
For further details on our financial position for 3Q2015, 2Q2015 and 3Q2014, please see later in this release.
We believe that Nordic American Offshore Ltd. (NAO) over time will add value to NAT. The G&A costs of NAT benefit from resource sharing with NAO. As our respective fleets grow, both companies benefit. Further growth should result in lower costs on a per vessel basis. NAT's investment in NAO is accounted for using the equity method. The reduced level of the oil price has impacted the operations of NAO negatively.
The Fleet
The Company has a fleet of 26 vessels of which two are under construction. By way of comparison, in the autumn of 2004, the Company had three vessels. Our vessels are in excellent technical condition.
In the arbitration case against Gulf Navigation Holding PJSC (GNH) regarding the Suezmax vessel Gulf Scandic (now named Nordic Harrier) NAT was awarded $10.2m plus interest and costs. An agreement has been made with GNH where NAT will receive compensation for the claim. According to the agreement NAT shall receive GNH mandatory convertible bonds (MCBs). These MCBs, which are expected to be received by us in late 4Q2015, will be converted into GNH shares and are expected to be sold in the market over time as market liquidity permits. GNH is listed on the Dubai Financial Market (DFM) stock exchange in Dubai.
NAT is focused on maintaining a top technical quality of the fleet. Our operational performance remains at the forefront of the industry. 3Q2015 inspections had an average of 3.6 observations which is an excellent result. NAT's performance can be considered industry best practice.
World Economy and the Tanker Market
The development of the world economy affects the tanker industry. Seaborne imports of crude oil into the US have decreased over the recent past. Going forward, shale oil and tar sand oil projects are expected to affect the US and Canadian oil sector. Some of these projects are vulnerable to reduced oil prices as we see at the time of this report. In terms of transportation work (ton miles), the reduced imports to the US are more than outweighed by the increased imports to the Far East. European crude imports have recently shown a rising trend. A low oil price is stimulating the world economy which is positive for the tanker market.
Tanker market rates are also affected by newbuildings that enter the markets, increasing the supply of vessels. Scrapping impacts supply in the other direction.
The Suezmax fleet (excl. shuttle tankers) counts 453 vessels at the end of 3Q2015, following an increase of eight vessels this year.
A number of orders have been placed with the shipbuilders in the past year. The current orderbook stands at 81 vessels from now to late 2017. This represents about 18% of the Suezmax fleet. In 2009, the orderbook was at over 50% of the existing fleet. At the time of this report, the orderbook for the remainder of 2015 counts one Suezmax vessel, with 39 vessels scheduled to be delivered in 2016. However, we expect the real number of deliveries for 2016 to be lower.
2
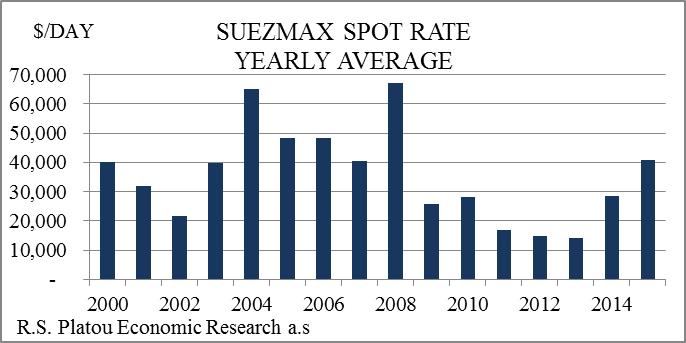
The graph above shows the average yearly spot rates since 2000 as reported by R.S. Platou Economic Research a.s. The daily rates as reported by shipbrokers may vary significantly from the actual rates we achieve in the market, but these rates are in general an indication of the level of the market and its direction.
Corporate Governance/Conflict of Interests
It is vital for NAT to ensure that there is no conflict of interests among shareholders, management, affiliates and related parties. Interests must be aligned. From time to time in the shipping industry, we see that questionable transactions take place which are not in harmony with sound corporate governance principles, both as to transparency and related party aspects.
Strategy going forward
Our objective is to have a strategy that is flexible and has benefits in both a strong tanker market and a weak one. In an improved market, higher earnings and dividends can be expected. The Company is in a position to reap the benefits of strong markets. Over the last year the Company has improved its relative position. After an acquisition of vessels or other forms of expansion, our objective is for the Company to pay a higher dividend per share and produce higher earnings per share than had such an acquisition not taken place. In an opportunistic way NAT is now assessing investments that can further build the Company.
Our dividend policy will continue to enable us to achieve a competitive, risk adjusted cash yield over time compared with that of other tanker companies.
NAT is firmly committed to protecting its underlying earnings and dividend potential. We shall endeavor to safeguard and further strengthen this position for our shareholders in a deliberate, predictable and transparent way.
We encourage prospective investors interested in the crude tanker sector to consider buying shares in NAT.
* * * * *
3
NORDIC AMERICAN TANKERS LIMITED
|
|
||||||||||||||||||||
|
CONSOLIDATED CONDENSED STATEMENTS OF OPERATION
|
Three Months Ended
|
Nine Months Ended
|
||||||||||||||||||
|
Sep. 30, 2015 (unaudited)
|
Jun. 30, 2015 (unaudited)
|
Sep. 30, 2014 (unaudited)
|
Sep 30, 2015 (unaudited)
|
Sep 30, 2014 (unaudited)
|
||||||||||||||||
|
Amounts in USD '000
|
||||||||||||||||||||
|
Net Voyage Revenue
|
66,673
|
73,464
|
40,908
|
209,697
|
108,546
|
|||||||||||||||
|
Vessel Operating Expenses
|
(15,733
|
)
|
(16,894
|
)
|
(16,011
|
)
|
(48,762
|
)
|
(46,372
|
)
|
||||||||||
|
General and Administrative Expenses
|
(1,384
|
)*
|
(2,840
|
)*
|
(3,220
|
)*
|
(6,290
|
)**
|
(10,350
|
)**
|
||||||||||
|
Depreciation Expenses
|
(20,477
|
)
|
(20,187
|
)
|
(20,514
|
)
|
(60,944
|
)
|
(59,916
|
)
|
||||||||||
|
Operating Expenses
|
(37,594
|
)
|
(39,920
|
)
|
(39,746
|
)
|
(115,996
|
)
|
(116,638
|
)
|
||||||||||
|
Net Operating Gain (Loss)
|
29,079
|
33,543
|
1,162
|
93,701
|
(8,093
|
)
|
||||||||||||||
|
Interest Income
|
33
|
34
|
51
|
106
|
137
|
|||||||||||||||
|
Interest Expense
|
(2,604
|
)
|
(2,564
|
)
|
(3,250
|
)
|
(8,004
|
)
|
(9,668
|
)
|
||||||||||
|
Other Financial Income (Expense)
|
(678
|
)
|
(113
|
)
|
2,520
|
(1,330
|
)
|
5,562
|
||||||||||||
|
Total Other Expenses
|
(3,249
|
)
|
(2,644
|
)
|
(679
|
)
|
(9,228
|
)
|
(3,969
|
)
|
||||||||||
|
Net Gain (Loss)
|
25,831
|
30,900
|
483
|
84,472
|
(12,062
|
)
|
||||||||||||||
|
Basic Gain (Loss) per Share
|
0.29
|
0.35
|
0.01
|
0.95
|
(0.14
|
)
|
||||||||||||||
|
Basic Weighted Average Number of Common Shares Outstanding
|
89,182,001
|
89,182,001
|
89,182,001
|
89,182,001
|
84,127,056
|
|||||||||||||||
|
Common Shares Outstanding
|
89,182,001
|
89,182,001
|
89,182,001
|
89,182,001
|
89,182,001
|
|||||||||||||||
| *) | The G&A for the three months ended September 30, 2015, June 30, 2015 and September 30, 2014 include non-cash charges of $(0.5m), $0.8m and $0.1m respectively which are charges related to share based compensation and pension cost. |
| **) | The G&A for the nine months ended September 30, 2015 and September 30, 2014 include non-cash charges of $(0.1m) and $1.4m which are charges related to share based compensation and pension cost. |
|
CONSOLIDATED CONDENSED BALANCE SHEET
|
||||||||||||
|
Amounts in USD '000
|
Sep 30, 2015 (unaudited)
|
Sep 30, 2014 (unaudited)
|
Dec. 31, 2014
(unaudited)1 |
|||||||||
|
Cash and Cash Equivalents
|
47,375
|
89,258
|
100,735
|
|||||||||
|
Accounts Receivable, net
|
26,934
|
17,316
|
16,412
|
|||||||||
|
Prepaid Expenses
|
3,275
|
3,340
|
5,513
|
|||||||||
|
Inventory
|
17,334
|
30,617
|
22,223
|
|||||||||
|
Voyages in Progress
|
18,473
|
24,923
|
29,586
|
|||||||||
|
Other Current Assets
|
2,852
|
2,133
|
2,029
|
|||||||||
|
Total current assets
|
116,242
|
167,588
|
176,498
|
|||||||||
|
Vessels, Net
|
919,102
|
928,415
|
909,992
|
|||||||||
|
Deposit for vessels
|
44,450
|
0
|
0
|
|||||||||
|
Goodwill
|
18,979
|
18,979
|
18,979
|
|||||||||
|
Investment in Nordic American Offshore Ltd.
|
57,244
|
58,429
|
62,058
|
|||||||||
|
Other Non-current Assets
|
6,868
|
10,093
|
8,331
|
|||||||||
|
Total non-current assets
|
1,046,644
|
1,015,917
|
999,361
|
|||||||||
|
Total Assets
|
1,162,886
|
1,183,505
|
1,175,859
|
|||||||||
|
Accounts Payable
|
4,401
|
8,358
|
6,664
|
|||||||||
|
Accrued Voyage Expenses
|
4,204
|
3,576
|
8,784
|
|||||||||
|
Other Current Liabilities
|
7,736
|
6,413
|
8,587
|
|||||||||
|
Total Current liabilities
|
16,341
|
18,347
|
24,035
|
|||||||||
|
Long-term Debt
|
250,000
|
250,000
|
250,000
|
|||||||||
|
Deferred Compensation Liability
|
12,222
|
12,473
|
12,914
|
|||||||||
|
Total Non-current Liabilities
|
262,222
|
262,473
|
262,914
|
|||||||||
|
Shareholders' Equity
|
884,324
|
902,685
|
888,909
|
|||||||||
|
Total Liabilities and Shareholders' Equity
|
1,162,886
|
1,183,505
|
1,175,859
|
|||||||||
1 Annual 2014 financial information is derived from audited financial statements.
4
NORDIC AMERICAN TANKERS LIMITED
|
|
||||||||||||
|
CONSOLIDATED CONDENSED STATEMENTS OF CASH FLOW
|
Nine months ended
|
Twelve
|
||||||||||
|
Months ended
|
||||||||||||
|
Sep. 30, 2015
|
Sep. 30, 2014
|
Dec. 31, 2014
|
||||||||||
|
Amounts in USD '000
|
(unaudited)
|
(unaudited)
|
(unaudited)1
|
|||||||||
|
Net Cash Provided by (Used in) Operating Activities
|
139,205
|
31,164
|
57,460
|
|||||||||
|
Investment in Vessels
|
(106,851
|
)
|
(73,747
|
)
|
(73,772
|
)
|
||||||
|
Investment in Nordic American Offshore Ltd
|
0
|
(5,640
|
)
|
(11,403
|
)
|
|||||||
|
Other
|
0
|
(325
|
)
|
(281
|
)
|
|||||||
|
Return of investments
|
3,553
|
2,470
|
3,791
|
|||||||||
|
Net Cash Provided by (Used in) Investing Activities
|
(103,298
|
)
|
(77,242
|
)
|
(81,666
|
)
|
||||||
|
Net Proceeds from Issuance of Common Stock
|
0
|
113,433
|
113,433
|
|||||||||
|
Dividends paid
|
(89,182
|
)
|
(43,713
|
)
|
(54,069
|
)
|
||||||
|
Net Cash Provided by (Used in) Financing Activities
|
(89,182
|
)
|
69,720
|
59,364
|
||||||||
|
Net Increase (Decrease) in Cash and Cash Equivalents
|
(53,276
|
)
|
23,642
|
35,158
|
||||||||
|
Effect of exchange rate changes on Cash
|
(84
|
)
|
(58
|
)
|
(97
|
)
|
||||||
|
Cash and Cash Equivalents at Beginning of Period
|
100,735
|
65,675
|
65,675
|
|||||||||
|
Cash and Cash Equivalents at End of Period
|
47,375
|
89,258
|
100,735
|
|||||||||
1 Annual 2014 financial information is derived from audited financial statements.
5
NORDIC AMERICAN TANKERS LIMITED
|
|
||||||||||||||||||||
|
RECONCILIATION OF NON-GAAP FINANCIAL MEASURES
|
Three Months Ended
|
Nine Months ended
|
||||||||||||||||||
|
Amounts in USD '000
|
Sep 30, 2015
(unaudited) |
Jun 30, 2015
(unaudited) |
Sep 30, 2014
(unaudited) |
Sep. 30, 2015
(unaudited)
|
Sep. 30, 2014
(unaudited)
|
|||||||||||||||
|
Voyage Revenue
|
101,884
|
116,333
|
94,946
|
331,179
|
255,758
|
|||||||||||||||
|
Voyage Expense
|
(35,211
|
)
|
(42,869
|
)
|
(54,037
|
)
|
(121,482
|
)
|
(147,212
|
)
|
||||||||||
|
Net Voyage Revenue (1)
|
66,673
|
73,464
|
40,908
|
209,697
|
108,546
|
|||||||||||||||
|
|
Three Months Ended
|
Twelve Months ended
|
||||||||||||||
|
|
Sep 30, 2015
(unaudited) |
Jun 30, 2015
(unaudited) |
Sep 30, 2014
(unaudited) |
Dec 31, 2014
(unaudited) |
||||||||||||
|
Net Operating Gain (Loss)
|
29,079
|
33,543
|
1,162
|
(4,775
|
)
|
|||||||||||
|
Depreciation Expense
|
20,477
|
20,187
|
20,514
|
80,531
|
||||||||||||
|
Share Based Compensation and Pension Cost
|
(499
|
)
|
809
|
81
|
1,913
|
|||||||||||
|
Operating Cash Flow (2)
|
49,057
|
54,539
|
21,757
|
77,669
|
||||||||||||
(1) Net voyage revenues represents voyage revenues less voyage expenses such as bunker fuel, port fees, canal tolls and brokerage commissions. Net voyage revenues is included because certain investors use this data to measure a shipping company's financial performance. Net voyage revenues is not required by accounting principles generally accepted in the United States and should not be considered as an alternative to net income or any other indicator of the Company's performance required by accounting principles generally accepted in the United States.
(2) Operating cash flow represents income from vessel operations before depreciation and non-cash administrative charges. Operating cash flow is included because certain investors use this data to measure a shipping company's financial performance. Operating cash flow is not required by accounting principles generally accepted in the United States and should not be considered as an alternative to net income or any other indicator of the Company's performance required by accounting principles generally accepted in the United States.
6
CAUTIONARY STATEMENT REGARDING FORWARD-LOOKING STATEMENTS
Matters discussed in this press release may constitute forward-looking statements. The Private Securities Litigation Reform Act of 1995 provides safe harbor protections for forward-looking statements in order to encourage companies to provide prospective information about their business. Forward-looking statements include statements concerning plans, objectives, goals, strategies, future events or performance, and underlying assumptions and other statements, which are other than statements of historical facts.
The Company desires to take advantage of the safe harbor provisions of the Private Securities Litigation Reform Act of 1995 and is including this cautionary statement in connection with this safe harbor legislation. The words "believe," "anticipate," "intend," "estimate," "forecast," "project," "plan," "potential," "will," "may," "should," "expect," "pending" and similar expressions identify forward-looking statements.
The forward-looking statements in this press release are based upon various assumptions, many of which are based, in turn, upon further assumptions, including without limitation, our management's examination of historical operating trends, data contained in our records and other data available from third parties. Although we believe that these assumptions were reasonable when made, because these assumptions are inherently subject to significant uncertainties and contingencies which are difficult or impossible to predict and are beyond our control, we cannot assure you that we will achieve or accomplish these expectations, beliefs or projections. We undertake no obligation to update any forward-looking statement, whether as a result of new information, future events or otherwise.
Important factors that, in our view, could cause actual results to differ materially from those discussed in the forward-looking statements include the strength of world economies and currencies, general market conditions, including fluctuations in charter rates and vessel values, changes in demand in the tanker market, as a result of changes in OPEC's petroleum production levels and world wide oil consumption and storage, changes in our operating expenses, including bunker prices, drydocking and insurance costs, the market for our vessels, availability of financing and refinancing, changes in governmental rules and regulations or actions taken by regulatory authorities, potential liability from pending or future litigation, general domestic and international political conditions, potential disruption of shipping routes due to accidents or political events, vessels breakdowns and instances of off-hires and other important factors described from time to time in the reports filed by the Company with the Securities and Exchange Commission, including the prospectus and related prospectus supplement, our Annual Report on Form 20-F, and our reports on Form 6-K.
Contacts:
Jan H. A. Moller,
Head of Investor Relations & Financial Manager
Nordic American Tankers Limited
Tel: +47 33 42 73 00 or +47 90 11 53 75
Turid M. Sørensen, CFO & EVP
Nordic American Tankers Limited
Tel: +47 33 42 73 00 or +47 90 57 29 27
Rolf Amundsen, Advisor
Nordic American Tankers Limited
Nordic American Tankers Limited
Tel: +1 800 601 9079 or + 47 908 26 906
Gary J. Wolfe
Seward & Kissel LLP, New York, USA
Tel: +1 212 574 1223
Web-site: www.nat.bm
7
Serious News for Serious Traders! Try StreetInsider.com Premium Free!
You May Also Be Interested In
- Korean Cultural Center New York presents a special exhibition Whanki in New York with the Whanki Museum and LG OLED
- AKRO INVESTOR ALERT: Robbins Geller Rudman & Dowd LLP Files Class Action Lawsuit Against Akero Therapeutics, Inc. and Announces Opportunity for Investors with Substantial Losses to Lead the Akero Clas
- Rakovina Therapeutics Inc. Announces 2023 Financial Results and Provides Corporate Update
Create E-mail Alert Related Categories
SEC FilingsSign up for StreetInsider Free!
Receive full access to all new and archived articles, unlimited portfolio tracking, e-mail alerts, custom newswires and RSS feeds - and more!
