

Form 6-K MEXICAN ECONOMIC DEVELOP For: Mar 04
 Tweet
Tweet Share
Share
SECURITIES AND EXCHANGE COMMISSION
WASHINGTON, DC 20549
FORM 6-K
REPORT OF FOREIGN PRIVATE ISSUER
PURSUANT TO RULE 13a-16 OR 15d-16
UNDER THE SECURITIES EXCHANGE ACT OF 1934
Date of Report: March 4, 2016
FOMENTO ECONÓMICO MEXICANO, S.A.B. DE C.V.
(Exact name of Registrant as specified in its charter)
Mexican Economic Development, Inc.
(Translation of Registrant’s name into English)
United Mexican States
(Jurisdiction of incorporation or organization)
General Anaya No. 601 Pte.
Colonia Bella Vista
Monterrey, Nuevo León 64410
México
(Address of principal executive offices)
Indicate by check mark whether the registrant files or will file annual reports under cover of Form 20-F or Form 40-F:
Form 20-F x Form 40-F ¨
Indicate by check mark if the registrant is submitting the Form 6-K in paper as permitted by Regulation S-T Rule 101(b)(1): ¨
Indicate by check mark if the registrant is submitting the Form 6-K in paper as permitted by Regulation S-T Rule 101(b)(7): ¨
Indicate by check mark whether by furnishing the information contained in this Form, the registrant is also thereby furnishing the information to the Commission pursuant to Rule 12g3-2(b) under the Securities Exchange Act of 1934.
Yes ¨ No x
If “Yes” is marked, indicate below the file number assigned to the registrant in connection with Rule 12g3-2(b): 82-
Contents
In connection with a proposed private placement of debt securities, Fomento Económico Mexicano, S.A.B. de C.V. (“FEMSA”) anticipates disclosing certain information that has not been previously publicly reported. This private placement is expected to be made under Section 4(a)(2) of the Securities Act of 1933, as amended (the “Securities Act”), and, to the extent any private placement of securities follows, the securities will be sold only outside the United States to persons other than U.S. persons in reliance on Regulation S under the Securities Act. No assurance can be made that any private placement of securities will be completed. FEMSA has elected to provide this information in this report on Form 6-K in the attached Exhibit 99.1 for informational purposes only.
This report does not constitute an offer to sell or a solicitation of an offer to buy any security and shall not constitute an offer to sell or a solicitation of an offer to buy any security in any jurisdiction where such an offer to sell or solicitation of an offer to buy would be unlawful.
| Exhibit No. |
Description | |
| 99.1. | Certain information with respect to FEMSA. |
SIGNATURE
Pursuant to the requirements of the Securities Exchange Act of 1934, the registrant has duly caused this report to be signed on its behalf by the undersigned hereunto duly authorized.
| FOMENTO ECONÓMICO MEXICANO, S.A.B. DE C.V. | ||||
| By: | /s/ Miguel Eduardo Padilla Silva | |||
| Miguel Eduardo Padilla Silva | ||||
| Chief Financial and Corporate Officer | ||||
Date: March 4, 2016
EXHIBIT INDEX
| Exhibit No. |
Description | |
| 99.1 | Certain information with respect to FEMSA. |
EXHIBIT 99.1
SUMMARY
Overview
We are a Mexican company headquartered in Monterrey, Mexico, leader in the non-alcoholic beverage, beer and retail industries. Additionally, through a strategic businesses unit, we provide logistics, point-of-sale, refrigeration and plastic packaging solutions to our other business units and third parties.
We conduct our operations through the following principal holding companies:
| • | Coca-Cola FEMSA, S.A.B. de C.V. (“Coca-Cola FEMSA”), which produces, distributes and sells beverages and is the largest franchise bottler of Coca-Cola products in the world; |
| • | FEMSA Comercio, S.A. de C.V. (“FEMSA Comercio”), comprising a Retail Division operating various small-format chain stores, including OXXO, the largest and fastest-growing chain in Latin America, and a Fuel Division operating the OXXO GAS chain of retail service stations for fuels, motor oils and other car care products. As of December 31, 2015, the Fuel Division is treated as a separate business segment; and |
| • | CB Equity LLP (“CB Equity”), which holds our equity investment in Heineken, one of the world’s leading brewers, with operations in over 70 countries. |
Coca-Cola FEMSA
Coca-Cola FEMSA is the largest franchise bottler of Coca-Cola trademark beverages in the world. It operates in territories in the following countries:
| • | Mexico – a substantial portion of central Mexico, the southeast and northeast of Mexico (including the Gulf region). |
| • | Central America – Guatemala (Guatemala City and surrounding areas), Nicaragua (nationwide), Costa Rica (nationwide) and Panama (nationwide). |
| • | Colombia – most of the country. |
| • | Venezuela – nationwide. |
| • | Brazil – a major part of the states of Sao Paulo and Minas Gerais, the states of Parana and Mato Grosso do Sul and part of the states of Rio de Janeiro and Goias. |
| • | Argentina – Buenos Aires and surrounding areas. |
| • | Philippines – nationwide (through a joint venture with The Coca-Cola Company). |
Coca-Cola FEMSA was incorporated on October 30, 1991, as a stock corporation with variable capital (sociedad anónima de capital variable) under the laws of Mexico. On December 5, 2006, as required by amendments to the Mexican Securities Market Law, Coca-Cola FEMSA became a publicly traded stock corporation with variable capital (sociedad anónima bursátil de capital variable).
FEMSA Comercio
FEMSA Comercio, through its Retail Division, operates the largest chain of small-format stores in Mexico, measured in terms of number of stores as of December 31, 2015, mainly under the trade name “OXXO.” As of December 31, 2015, FEMSA Comercio – Retail Division operated 14,061 OXXO stores, of which 14,015 were located throughout Mexico and the remaining 46 stores were located in Bogota, Colombia.
FEMSA Comercio – Retail Division was established by FEMSA in 1978 with the opening of two OXXO stores in Monterrey, Nuevo Leon, one store in Mexico City and another store in Guadalajara, Jalisco. The motivating factor behind FEMSA’s entrance into the retail industry was to enhance beer sales through company-owned retail outlets as well as to gather information on customer preferences. In 2015, a typical OXXO store carried 2,954 different stock keeping units (SKUs) in 31 main product categories.
In recent years, FEMSA Comercio – Retail Division has represented an effective distribution channel for our beverage products, as well as a rapidly growing point of contact with our consumers. Based on the belief that location plays a major role in the long-term success of a retail operation such as a small-format store, as well as a role in our ability to accelerate and streamline the new-store development process, FEMSA Comercio – Retail Division has focused on a strategy of rapid, profitable growth. FEMSA Comercio – Retail Division opened 1,208, 1,132 and 1,120 net new OXXO stores in 2015, 2014 and 2013, respectively. The accelerated expansion in the number of OXXO stores and the inorganic expansion in the drugstore markets in Mexico and Chile yielded total revenue growth of 21.2% to reach Ps. 132,891 million in 2015. OXXO same-store sales increased an average of 6.9%, driven by an increased average customer ticket and an increase in same-store traffic. FEMSA Comercio performed approximately 3.7 billion transactions in 2015 compared to 3.4 billion transactions in 2014.
FEMSA Comercio – Fuel Division operates retail service stations for fuels, motor oils and other car care products. As of December 31, 2015, FEMSA Comercio – Fuel Division operates 307 service stations, concentrated mainly in the northern part of the country with a presence in 14 different states throughout Mexico.
Since 1995, FEMSA Comercio has provided services and operated retail service stations for fuels, motor oils and other car care products through agreements with third parties that own PEMEX franchises, using the trade name “OXXO GAS.” Over time, this brand has become synonymous with quality service among our customers, and revenues per gas pump have consistently grown.
Historically, Mexican legislation precluded FEMSA Comercio from participating in the retail of gasoline, and therefore from owning PEMEX franchises, due to FEMSA’s foreign institutional investor base. In March 2015, following changes to the legal framework and considering the potential expansion and synergies arising from this business as part of Mexico’s energy reform, FEMSA Comercio began to acquire PEMEX’s service station franchises and to obtain permits from PEMEX to operate each of the franchises.
Equity Investment in the Heineken Group
As of December 31, 2015, we owned a non-controlling interest in the Heineken Group, one of the world’s leading brewers. As of December 31, 2015, our 20.0% economic interest in the Heineken Group comprised 43,018,320 shares of Heineken Holding N.V. and 72,182,203 shares of Heineken N.V. For 2015, we recognized equity income of Ps. 5,879 million regarding our 20.0% economic interest in the Heineken Group; see Note 10 to our audited consolidated financial statements.
As described above, FEMSA Comercio – Retail Division has a distribution agreement with subsidiaries of Cuauhtémoc Holding, S.A. de C.V. (“Cuauhtémoc Moctezuma”), now part of the Heineken Group, pursuant to which OXXO stores in Mexico only carry beer brands produced and distributed by Cuauhtémoc Moctezuma. OXXO stores will continue to benefit from the existing relationship under which Cuauhtémoc Moctezuma will continue to be the exclusive supplier of beer to OXXO until June 2020. As of April 30, 2010, Coca-Cola FEMSA has agreed with Cervejarias Kaiser (also now part of the Heineken Group) to continue to distribute and sell the Kaiser beer portfolio in Coca-Cola FEMSA’s Brazilian territories for a 20-year term beginning in 2003, consistent with the arrangement already in place. In addition, our logistic services subsidiary provides certain services to Cuauhtémoc Moctezuma and its subsidiaries.
2
Other Business
Our other business consists of the following smaller operations that support our core operations:
| • | Our logistics services subsidiary provides a broad range of logistics and vehicle maintenance services to Coca-Cola FEMSA, FEMSA Comercio and third-party clients in the beverages, consumer products and retail industries. It has operations in Mexico, Brazil, Colombia, Panama, Costa Rica, Nicaragua and Peru. |
| • | Our refrigeration business produces vertical and horizontal commercial refrigerators for the soft drink, beer and food industries, with an annual capacity of 546,934 units at December 31, 2015. In 2015, this business sold 429,464 refrigeration units, 31.1% of which were sold to Coca-Cola FEMSA, and the remainder of which were sold to third parties. |
The following table presents an overview of our operations by reportable segment and by geographic area:
Operations by Segment—Overview
Year Ended December 31, 2015 and % of growth (decrease) vs. previous year
| Coca-Cola FEMSA | FEMSA Comercio – Retail Division |
FEMSA Comercio – Fuel Division(4) |
CB Equity(1) | |||||||||||||||||||||||||||||
| (in millions of Mexican pesos, except for employees and percentages) | ||||||||||||||||||||||||||||||||
| Total revenues |
P | s. 152,360 | 3 | % | P | s. 132,891 | 21 | % | Ps. | 18,510 | NA | Ps. | — | — | ||||||||||||||||||
| Gross Profit |
72,030 | 5 | % | 47,291 | 20 | % | 1,420 | NA | — | — | ||||||||||||||||||||||
| Share of the profit (loss) of associates and joint ventures accounted for using the equity method, net of taxes |
155 | 224 | %(2) | (10 | ) | (127 | %)(3) | — | NA | 5,879 | 12 | % | ||||||||||||||||||||
| Total assets |
210,249 | (1 | %) | 67,211 | 54 | % | 3,230 | NA | 95,502 | 11 | % | |||||||||||||||||||||
| Employees |
83,712 | 0.4 | % | 133,748 | 21 | % | 4,551 | NA | — | — | ||||||||||||||||||||||
| (1) | CB Equity holds our Heineken N.V. and Heineken Holding N.V. shares. |
| (2) | Reflects the percentage increase between the gain of Ps. 155 million recorded in 2015 and the loss of Ps. 125 million recorded in 2014. |
| (3) | Reflects the percentage decrease between the loss of Ps. 10 million recorded in 2015 and the gain of Ps. 37 million recorded in 2014. |
| (4) | The operations that compose our FEMSA Comercio – Fuel Division were acquired and have been treated as a separate business segment since 2015. As such, no results of operations are available for this segment for periods prior to 2015. |
Total Revenues Summary by Segment and Other Financial Information (1)
| Year Ended December 31, | ||||||||||||
| 2015 | 2014 | 2013 | ||||||||||
| (in millions of Mexican pesos) | ||||||||||||
| Coca-Cola FEMSA |
Ps. | 152,360 | Ps. | 147,298 | Ps. | 156,011 | ||||||
| FEMSA Comercio – Retail Division |
132,891 | 109,624 | 97,572 | |||||||||
| FEMSA Comercio – Fuel Division |
18,510 | — | — | |||||||||
| Other |
22,774 | 20,069 | 17,254 | |||||||||
| Consolidated total revenues |
311,589 | 263,449 | 258,097 | |||||||||
| Total long-term debt |
85,969 | 82,935 | 72,921 | |||||||||
| Net debt(2) |
Ps. | 62,468 | Ps. | 48,991 | Ps. | 49,489 | ||||||
| (1) | The sum of the financial data for each of our segments differs from our consolidated financial information due to intercompany transactions, which are eliminated in consolidation, and certain assets and activities of FEMSA. |
| (2) | Represents the current and non-current portion of bank loans and notes payable in an amount of Ps. 91,864 million, net of cash and cash equivalents in an amount of Ps. 29,396 million. |
3
Total Revenues Summary by Geographic Area(1)
| Year Ended December 31, | ||||||||||||
| 2015 | 2014 | 2013 | ||||||||||
| (in millions of Mexican pesos) | ||||||||||||
| Mexico and Central America(2) |
Ps. 228,563 | Ps. 186,736 | Ps. 171,726 | |||||||||
| South America(3) |
74,928 | 69,172 | 55,157 | |||||||||
| Venezuela |
8,904 | 8,835 | 31,601 | |||||||||
| Consolidated total revenues |
Ps. 311,589 | Ps. 263,449 | Ps. 258,097 | |||||||||
| (1) | The sum of the financial data for each geographic area differs from our consolidated financial information due to intercompany transactions, which are eliminated in consolidation. |
| (2) | Central America includes Guatemala, Nicaragua, Costa Rica and Panama. Domestic (Mexico-only) revenues were Ps. 218,809 million, Ps. 178,125 million and Ps. 163,351 million for the years ended December 31, 2015, 2014 and 2013, respectively. |
| (3) | South America includes Brazil, Colombia, Argentina and Chile. South America revenues include revenues from our operations in Brazil of Ps. 39,749 million, Ps. 45,799 million and Ps. 31,138 million; revenues from our operations in Colombia of Ps. 14,283 million, Ps. 14,207 million and Ps. 13,354 million; revenues from our operations in Argentina of Ps. 14,004 million, Ps. 9,714 million and Ps. 10,729 million, for the years ended December 31, 2015, 2014 and 2013, respectively, and revenues from our operations in Chile of Ps. 7,586 million for the year ended December 31, 2015. |
Business Strategy
We understand the importance of connecting with our end consumers by interpreting their needs, and ultimately delivering the right products to them for the right occasions and the optimal value proposition. We strive to achieve this by developing brand value, expanding our significant distribution capabilities and improving the efficiency of our operations while aiming to reach our full potential. We continue to improve our information gathering and processing systems in order to better know and understand what our consumers want and need, and we are improving our production and distribution by more efficiently leveraging our asset base.
Our objective is to create economic, social and environmental value for our stakeholders—including our employees, our consumers, our shareholders and the enterprises and institutions within our society—now and into the future.
We believe that the competencies that our businesses have developed can be replicated in other geographic regions. This underlying principle guided our consolidation and growth efforts, which led to our current continental footprint. We have presence in Mexico, Central and South America and the Philippines including some of the most populous metropolitan areas in Latin America—which has provided us with opportunities to create value through both an improved ability to execute our strategies in complex markets and the use of superior marketing tools. We have also increased our capabilities to operate and succeed in other geographic regions by improving management skills in order to obtain a precise understanding of local consumer needs. Going forward, we intend to use those capabilities to continue our international expansion of both Coca-Cola FEMSA and FEMSA Comercio, expanding both our geographic footprint and our presence in the non-alcoholic beverage industry and small box retail formats, as well as taking advantage of potential opportunities across markets to leverage our skill set and key competencies. One such opportunity is our recent entry into the retail service stations for fuels, motor oils and other car care products business in Mexico, through FEMSA Comercio – Fuel Division, where we are applying our retail and operational capabilities to develop an attractive value proposition for consumers, while creating synergies with our OXXO stores.
4
RISK FACTORS
Risks Related to Our Company
Coca-Cola FEMSA
Coca-Cola FEMSA’s business depends on its relationship with The Coca-Cola Company, and changes in this relationship may adversely affect its business, financial condition, results of operations and prospects.
Substantially all of Coca-Cola FEMSA’s sales are derived from sales of Coca-Cola trademark beverages. Coca-Cola FEMSA produces, markets, sells and distributes Coca-Cola trademark beverages through standard bottler agreements in the territories where it operates. Coca-Cola FEMSA is required to purchase concentrate for all Coca-Cola trademark beverages from companies designated by The Coca-Cola Company, which price may be unilaterally determined from time to time by The Coca-Cola Company, in all such territories. Coca-Cola FEMSA is also required to purchase sweeteners and other raw materials only from companies authorized by The Coca-Cola Company. See “Information on the Company—Coca-Cola FEMSA—Coca-Cola FEMSA’s Territories.” Pursuant to Coca-Cola FEMSA’s bottler agreements and as a shareholder, The Coca-Cola Company has the right to participate in the process for making certain decisions related to Coca-Cola FEMSA’s business.
In addition, under Coca-Cola FEMSA’s bottler agreements, it is prohibited from bottling or distributing any other beverages without The Coca-Cola Company’s authorization or consent, and may not transfer control of the bottler rights of any of its territories without prior consent from The Coca-Cola Company.
The Coca-Cola Company also makes significant contributions to Coca-Cola FEMSA’s marketing expenses, although it is not required to contribute a particular amount. Accordingly, The Coca-Cola Company may discontinue or reduce such contributions at any time.
Coca-Cola FEMSA depends on The Coca-Cola Company to continue with its bottler agreements. Coca-Cola FEMSA’s bottler agreements are automatically renewable for ten-year terms, subject to the right of either party to give prior notice that it does not wish to renew the applicable agreement. In addition, these agreements generally may be terminated in the case of material breach. Termination of any such bottler agreement would prevent Coca-Cola FEMSA from selling Coca-Cola trademark beverages in the affected territory. The foregoing and any other adverse changes in the relationship with The Coca-Cola Company would have an adverse effect on Coca-Cola FEMSA’s business, financial condition, results of operations and prospects.
The Coca-Cola Company has substantial influence on the conduct of Coca-Cola FEMSA’s business, which may result in Coca-Cola FEMSA taking actions contrary to the interests of its shareholders other than The Coca-Cola Company, or its creditors.
The Coca-Cola Company has substantial influence on the conduct of Coca-Cola FEMSA’s business. As of March 4, 2016, The Coca-Cola Company indirectly owned 28.1% of Coca-Cola FEMSA’s outstanding capital stock, representing 37.0% of Coca-Cola FEMSA’s shares with full voting rights. The Coca-Cola Company is entitled to appoint five of Coca-Cola FEMSA’s maximum of 21 directors and the vote of at least two of them is required to approve certain actions by Coca-Cola FEMSA’s board of directors. As of March 4, 2016, we indirectly owned 47.9% of Coca-Cola FEMSA’s outstanding capital stock, representing 63.0% of Coca-Cola FEMSA’s capital stock with full voting rights. We are entitled to appoint 13 of Coca-Cola FEMSA’s maximum of 21 directors and all of its executive officers. We and The Coca-Cola Company together, or only we in certain circumstances, have the power to determine the outcome of all actions requiring the approval of Coca-Cola FEMSA’s board of directors, and we and The Coca-Cola Company together, or only we in certain circumstances, have the power to determine the outcome of all actions requiring the approval of Coca-Cola FEMSA’s shareholders. The interests of The Coca-Cola Company may be different from the interests of Coca-Cola FEMSA’s other shareholders or its creditors, which may result in Coca-Cola FEMSA taking actions contrary to the interests of such other shareholders or its creditors.
5
Changes in consumer preferences and public concern about health related issues could reduce demand for some of Coca-Cola FEMSA’s products.
The non-alcoholic beverage industry is evolving mainly as a result of changes in consumer preferences and regulatory actions. There have been different plans and actions adopted in recent years by governmental authorities in some of the countries where Coca-Cola FEMSA operates including an increase in taxes or the imposition of new taxes on the sale of beverages containing certain sweeteners and other regulatory measures, such as restrictions on advertising for some of Coca-Cola FEMSA’s products. Moreover, researchers, health advocates and dietary guidelines are encouraging consumers to reduce their consumption of certain types of beverages sweetened with sugar and High Fructose Corn Syrup, or “HFCS.” In addition, concerns over the environmental impact of plastic may reduce the consumption of Coca-Cola FEMSA’s products sold in plastic bottles or result in additional taxes that would adversely affect consumer demand. Increasing public concern about these issues, new or increased taxes, other regulatory measures or any failure of Coca-Cola FEMSA to meet consumers’ preferences could reduce demand for some of Coca-Cola FEMSA’s products which would adversely affect its business, financial condition, results of operations and prospects.
Reputation of Coca-Cola trademarks and trademark infringement could adversely affect Coca-Cola FEMSA’s business.
Substantially all of Coca-Cola FEMSA’s sales are derived from sales of Coca-Cola trademark beverages owned by The Coca-Cola Company. Maintenance of the reputation and intellectual property rights of these trademarks is essential to Coca-Cola FEMSA’s ability to attract and retain retailers and consumers and is essential for its success. Failure to maintain the reputation of Coca-Cola trademarks and/or to effectively protect its trademarks could have a material adverse effect on Coca-Cola FEMSA’s business, financial condition, results of operations, and prospects.
Competition could adversely affect Coca-Cola FEMSA’s business, financial condition, results of operations and prospects.
The beverage industry in the territories where Coca-Cola FEMSA operates is highly competitive. Coca-Cola FEMSA faces competition from other bottlers of sparkling beverages, such as Pepsi trademark products and other bottlers and distributors of local beverage brands, and from producers of low-cost beverages or “B brands.” Coca-Cola FEMSA also competes in beverage categories other than sparkling beverages, such as water, juice-based beverages, teas, sport drinks and value-added dairy products. Coca-Cola FEMSA expects that it will continue to face strong competition in its beverage categories in all of its territories and anticipates that existing or new competitors may broaden their product lines and extend their geographic scope.
Although competitive conditions are different in each of its territories, Coca-Cola FEMSA competes principally in terms of price, packaging, effective promotional activities, access to retail outlets and sufficient shelf space, customer service, product innovation and product alternatives and the ability to identify and satisfy consumer preferences. See “Information on the Company—Coca-Cola FEMSA—Competition.” Lower pricing and activities by competitors and changes in consumer preferences may have an adverse effect on Coca-Cola FEMSA’s business, financial condition, results of operations and prospects.
Water shortages or any failure to maintain existing concessions could adversely affect Coca-Cola FEMSA’s business, financial condition, results of operations and prospects.
Water is an essential component of all of Coca-Cola FEMSA’s products. Coca-Cola FEMSA obtains water from various sources in its territories, including springs, wells, rivers and municipal and state water companies pursuant to either concessions granted by governments in its various territories (including governments at the federal, state or municipal level) or pursuant to contracts.
Coca-Cola FEMSA obtains the vast majority of the water used in its production from municipal utility companies and pursuant to concessions to use wells, which are generally granted based on studies of the existing and projected groundwater supply. Coca-Cola FEMSA’s existing water concessions or contracts to obtain water may be
6
terminated by governmental authorities under certain circumstances and their renewal depends on several factors, including having paid fees in full, having complied with applicable obligations and receiving approval for renewal from local and/or federal water authorities. See “Information on the Company—Regulatory Matters—Water Supply.” In some of its other territories, Coca-Cola FEMSA’s existing water supply may not be sufficient to meet its future production needs, and the available water supply may be adversely affected by shortages or changes in governmental regulations and environmental changes.
Water supply in the Sao Paulo region in Brazil has been reduced in recent years by low rainfall, which has affected the main water reservoir that serves the greater Sao Paulo area (Cantareira). Although Coca-Cola FEMSA’s Jundiai plant does not obtain water from this water reservoir, water shortages or changes in governmental regulations aimed at rationalizing water in such region could affect Coca-Cola FEMSA’s water supply in its Jundiai plant.
We cannot assure you that water will be available in sufficient quantities to meet Coca-Cola FEMSA’s future production needs or will prove sufficient to meet its water supply needs. Continued water scarcity in the regions where Coca-Cola FEMSA operates may adversely affect its business, financial condition, results of operations and prospects.
Increases in the prices of raw materials would increase Coca-Cola FEMSA’s cost of goods sold and may adversely affect its business, financial condition, results of operations and prospects.
In addition to water, Coca-Cola FEMSA’s most significant raw materials are (i) concentrate, which is acquired from affiliates of The Coca-Cola Company, (ii) sweeteners and (iii) packaging materials.
Prices for Coca-Cola trademark beverages concentrate are determined by The Coca-Cola Company as a percentage of the weighted average retail price in local currency, net of applicable taxes. The Coca-Cola Company has the right to unilaterally change concentrate prices or change the manner in which such prices are calculated. In the past, The Coca-Cola Company has increased concentrate prices for Coca-Cola trademark beverages in some of the countries where Coca-Cola FEMSA operates. Coca-Cola FEMSA may not be successful in negotiating or implementing measures to mitigate the negative effect this may have in the pricing of its products or its results.
The prices for other Coca-Cola FEMSA’s raw materials are driven by market prices and local availability, the imposition of import duties and restrictions and fluctuations in exchange rates. Coca-Cola FEMSA is also required to meet all of its supply needs (including sweeteners and packaging materials) from suppliers approved by The Coca-Cola Company, which may limit the number of suppliers available to it. Coca-Cola FEMSA’s sales prices are denominated in the local currency in each country where it operates, while the prices of certain materials, including those used in the bottling of its products, mainly resin, preforms to make plastic bottles, finished plastic bottles, aluminum cans, HFCS and certain sweeteners, are paid in, or determined with reference to, the U.S. dollar, and therefore may increase if the U.S. dollar appreciates against the applicable local currency. We cannot anticipate whether the U.S. dollar will appreciate or depreciate with respect to such local currencies in the future. See “Information on the Company—Coca-Cola FEMSA—Raw Materials.”
Coca-Cola FEMSA’s most significant packaging raw material costs arise from the purchase of resin and plastic preforms to make plastic bottles and from the purchase of finished plastic bottles, the prices of which are related to crude oil prices and global resin supply. The average prices that Coca-Cola FEMSA paid for resin and plastic preforms in U.S. dollars in 2015, as compared to 2014 decreased in all Coca-Cola FEMSA’s territories; however, given that high currency volatility has affected and continues to affect most of Coca-Cola FEMSA’s territories, the average prices for resin and plastic preforms in local currencies were higher in 2015 in Mexico, Colombia, Venezuela and Brazil. In 2015, average sweetener prices were lower in Guatemala, and were higher in the rest of Coca-Cola FEMSA’s territories, in each case as compared to 2014. From 2010 through 2015, international sugar prices were volatile due to various factors, including shifting demand, availability and climate issues affecting production and distribution. In all of the countries where Coca-Cola FEMSA operates, other than Brazil, sugar prices are subject to local regulations and other barriers to market entry that cause Coca-Cola FEMSA to purchase sugar above international market prices. See “Information on the Company— Coca-Cola FEMSA —Raw Materials.” We cannot assure you that Coca-Cola FEMSA’s raw material prices will not further increase in the future. Increases in the prices of raw materials would increase Coca-Cola FEMSA’s cost of goods sold and adversely affect its business, financial condition, results of operations and prospects.
7
Taxes could adversely affect Coca-Cola FEMSA’s business, financial condition, results of operations and prospects.
The countries where Coca-Cola FEMSA operates may adopt new tax laws or modify existing tax laws to increase taxes applicable to Coca-Cola FEMSA’s business or products. Coca-Cola FEMSA’s products are subject to certain taxes in many of the countries where it operates, which impose taxes on sparkling beverages. See “Information on the Company—Regulatory Matters—Taxation of Beverages.” The imposition of new taxes, increases in existing taxes or changes in the interpretation of tax laws and regulation by tax authorities may have a material adverse effect on Coca-Cola FEMSA’s business, financial condition, prospects and results of operations.
Tax legislation in some of the countries where Coca-Cola FEMSA operates has recently been subject to major changes. See “Information on the Company—Regulatory Matters—Mexican Tax Reform” and “Information on the Company—Regulatory Matters—Other Recent Tax Reforms.” We cannot assure you that these reforms or other reforms adopted by governments in the countries where Coca-Cola FEMSA operates will not have a material adverse effect on its business, financial condition, results of operations and prospects.
Regulatory developments may adversely affect Coca-Cola FEMSA’s business, financial condition, results of operations and prospects.
Coca-Cola FEMSA is subject to several laws and regulations in each of the territories where it operates. The principal areas in which Coca-Cola FEMSA is subject to laws and regulations are water, environment, labor, taxation, health and antitrust. Laws and regulations can also affect Coca-Cola FEMSA’s ability to set prices for its products. See “Information on the Company—Regulatory Matters.” Changes in existing laws and regulations, the adoption of new laws or regulations or a stricter interpretation or enforcement thereof in the countries where Coca-Cola FEMSA operates may increase its operating and compliance costs or impose restrictions on its operations which, in turn, may adversely affect Coca-Cola FEMSA’s financial condition, business, prospects and results of operations. In particular, environmental standards are becoming more stringent in several of the countries where Coca-Cola FEMSA operates. There is no assurance that Coca-Cola FEMSA will be able to comply with changes in environmental laws and regulations within the timelines established by the relevant regulatory authorities. See “Information on the Company—Regulatory Matters—Environmental Matters.”
Voluntary price restraints or statutory price controls have been imposed historically in several of the countries where Coca-Cola FEMSA operates. Currently, there are no price controls on Coca-Cola FEMSA’s products in any of the territories where it has operations, except for those in Argentina, where authorities directly supervise five of Coca-Cola FEMSA’s products sold through supermarkets as a measure to control inflation, and Venezuela, where price controls have been imposed on certain of Coca-Cola FEMSA’s products, including bottled water, and a limit has been imposed on profits earned on the sale of goods, including Coca-Cola FEMSA’s products, in an effort to seek price stability of, and equal access to, goods and services. If Coca-Cola FEMSA exceeds such limit on profits, it may be forced to reduce the prices of its products in Venezuela, which would in turn adversely affect its business, financial condition, prospects, and results of operations. In addition, consumer protection laws in Venezuela are subject to continuing review and changes, and any such changes may have an adverse impact on Coca-Cola FEMSA. We cannot assure you that existing or future laws and regulations in the countries where Coca-Cola FEMSA operates relating to goods and services (in particular, laws and regulations imposing statutory price controls) will not affect Coca-Cola FEMSA’s products or that Coca-Cola FEMSA will not need to implement voluntary price restraints, which could have a negative effect on its business, financial condition, prospects and results of operations. See “Information on the Company—Regulatory Matters—Price Controls.”
Unfavorable results of legal proceedings could have an adverse effect on Coca-Cola FEMSA’s business, financial condition, results of operations and prospects.
Coca-Cola FEMSA’s operations have from time to time been and may continue to be subject to investigations and proceedings by antitrust authorities, and litigation relating to alleged anticompetitive practices. Coca-Cola FEMSA also has been subject to investigations and proceedings on tax, consumer protection, environmental and labor matters. We cannot assure you that these investigations and proceedings will not have an adverse effect on Coca-Cola FEMSA’s business, results of operations, prospects and financial condition.
8
Weather conditions may adversely affect Coca-Cola FEMSA’s business, financial condition, results of operations and prospects.
Lower temperatures, higher rainfall and other adverse weather conditions such as typhoons and hurricanes may negatively impact consumer patterns, which may result in reduced sales of Coca-Cola FEMSA’s beverage offerings. Additionally, such adverse weather conditions may affect plant installed capacity, road infrastructure and points of sale in the territories where Coca-Cola FEMSA operates and limit Coca-Cola FEMSA’s ability to produce, sell and distribute its products, thus affecting its business, financial condition, results of operations and prospects.
Coca-Cola FEMSA may not be able to successfully integrate its acquisitions and achieve the expected operational efficiencies and/or synergies.
Coca-Cola FEMSA has and may continue to acquire bottling operations and other businesses. Key elements to achieving the benefits and expected synergies of Coca-Cola FEMSA’s acquisitions and/or mergers are the integration of acquired or merged businesses’ operations into its own in a timely and effective manner and the retention of qualified and experienced key personnel. Coca-Cola FEMSA may incur unforeseen liabilities in connection with acquiring, taking control of, or managing bottling operations and other businesses and may encounter difficulties and unforeseen or additional costs in restructuring and integrating them into its operating structure. We cannot assure you that these efforts will be successful or completed as expected by Coca-Cola FEMSA, and Coca-Cola FEMSA’s business, financial condition, results of operations and prospects could be adversely affected if it is unable to do so.
Political and social events in the countries where Coca-Cola FEMSA operates and changes in governmental policies may have an adverse effect on Coca-Cola FEMSA’s business, financial condition, results of operations and prospects.
In recent years, some of the governments in the countries where Coca-Cola FEMSA operates have implemented and may continue to implement significant changes in laws, public policy and/or regulations that could affect the political and social conditions in these countries. Any such changes may have an adverse effect on Coca-Cola FEMSA’s business, results of operations, prospects and financial condition. We cannot assure you that political or social developments in any of the countries where Coca-Cola FEMSA operates, such as the election of new administrations, political disagreements, civil disturbances and the rise in violence and perception of violence, over which Coca-Cola FEMSA has no control, will not have a corresponding adverse effect on the local or global markets or on Coca-Cola FEMSA’s business, financial condition, results of operations and prospects.
FEMSA Comercio
Competition from other retailers in Mexico could adversely affect FEMSA Comercio – Retail Division’s business, financial condition, results of operations and prospects.
The Mexican retail sector is highly competitive. FEMSA participates in the retail sector primarily through FEMSA Comercio – Retail Division. FEMSA Comercio – Retail Division’s OXXO stores face competition from small-format stores like 7-Eleven, Extra, Super City, Círculo K stores and other numerous chains of retailers across Mexico, from other regional small-format retailers to small informal neighborhood stores. In particular, small informal neighborhood stores can sometimes avoid regulatory oversight and taxation, enabling them to sell certain products at prices below average market prices. In addition, these small informal neighborhood stores could improve their technological capabilities so as to enable credit card transactions and electronic payment of utility bills, which would diminish one of FEMSA Comercio – Retail Division’s competitive advantages. FEMSA Comercio – Retail Division may face additional competition from new market participants. Increased competition may limit the number of new store locations available and require FEMSA Comercio – Retail Division to modify its product offering or pricing structure. As a consequence, FEMSA Comercio – Retail Division’s business, financial condition, results of operations and prospects may be adversely affected by competition in the future.
9
Sales of OXXO small-format stores may be adversely affected by changes in economic conditions in Mexico.
Small-format stores often sell certain products at a premium. The small-format store market is thus highly sensitive to economic conditions, since an economic slowdown is often accompanied by a decline in consumer purchasing power, which in turn results in a decline in the overall consumption of FEMSA Comercio – Retail Division’s main product categories. During periods of economic slowdown, OXXO stores may experience a decline in traffic per store and average ticket per customer, which may result in a decline in FEMSA Comercio – Retail Division’s overall performance.
Regulatory changes may adversely affect FEMSA Comercio – Retail Division’s business.
In Mexico, FEMSA Comercio – Retail Division is subject to regulation in areas such as labor, taxation, zoning, operations and related local permits and health and safety regulations. Changes in existing laws and regulations, the adoption of new laws or regulations, or a stricter interpretation or enforcement thereof in the countries where FEMSA Comercio – Retail Division operates may increase its operating and compliance costs or impose restrictions on its operations which, in turn, may adversely affect FEMSA Comercio – Retail Division’s business, financial condition, results of operations and prospects. In addition, changes in current laws and regulations may negatively impact customer traffic, revenues, operational costs and commercial practices, which may have an adverse effect on FEMSA Comercio – Retail Division’s business, financial condition, results of operations and prospects.
FEMSA Comercio – Retail Division may not be able to maintain its historic growth rate.
FEMSA Comercio – Retail Division increased the number of OXXO stores at a compound annual growth rate of 10.1% from 2011 to 2015. The growth in the number of OXXO stores has driven growth in total revenue and results at FEMSA Comercio – Retail Division over the same period. As the overall number of stores increases, growth in the number of OXXO stores is likely to slow. In addition, as small-format store penetration in Mexico grows, the number of viable new store locations may decrease, and new store locations may be less favorable in terms of same-store sales, average ticket and store traffic. As a result, FEMSA Comercio – Retail Division’s future results and financial condition may not be consistent with prior periods and may be characterized by lower growth rates in terms of total revenue and results of operations. In Colombia, OXXO stores may not be able to maintain historic growth rates similar to those in Mexico. We cannot assure you that FEMSA Comercio – Retail Division’s future retail stores will generate revenues and cash flow comparable with those generated by its existing retail stores.
FEMSA Comercio – Retail Division’s business depends heavily on information technology and a failure, interruption, or breach of its IT systems could adversely affect it.
FEMSA Comercio – Retail Division’s business relies heavily on advanced information technology (which we refer to as IT) systems to effectively manage its data, communications, connectivity, and other business processes. FEMSA Comercio – Retail Division invests aggressively in IT to maximize its value generation potential. Given the rapid speed at which such division adds new services and products to its commercial offerings, the development of IT systems, hardware and software needs to keep pace with the growth of the business. If these systems become obsolete or if planning for future IT investments is inadequate, FEMSA Comercio – Retail Division’s business could be adversely affected.
Although FEMSA Comercio – Retail Division constantly improves its IT systems and protects them with advanced security measures, they may still be subject to defects, interruptions, or security breaches such as viruses or data theft. Such a defect, interruption, or breach could adversely affect FEMSA Comercio – Retail Division’s business, financial condition, results of operations and prospects.
10
FEMSA Comercio – Retail Division’s business may be adversely affected by an increase in the price of electricity.
The performance of FEMSA Comercio – Retail Division’s stores would be adversely affected by increases in the price of utilities on which the stores depend, such as electricity. In recent years the price of electricity in Mexico has remained stable, and particularly the price was reduced last year although, it could potentially increase as a result of inflation, shortages, interruptions in supply, or other reasons, and such an increase could adversely affect FEMSA Comercio – Retail Division’s business, financial condition, results of operations and prospects.
FEMSA Comercio – Retail Division’s expansion strategy and entry into new markets and retail formats may lead to decreased profit margins.
FEMSA Comercio – Retail Division has recently entered into new markets through the acquisition of other small-format retail businesses such as drugstores and pharmacies. FEMSA Comercio – Retail Division continued with this strategy in 2015 and may continue with it in the future. These new businesses are currently less profitable than OXXO, and might therefore marginally dilute FEMSA Comercio – Retail Division’s margins in the short to medium term.
Taxes could adversely affect FEMSA Comercio’s business.
The imposition of new taxes or increases in existing taxes, or changes in the interpretation of tax laws and regulations by tax authorities, may have a material adverse effect on FEMSA Comercio’s business, financial condition, results of operations and prospects.
Energy regulatory changes may adversely affect FEMSA Comercio – Fuel Division’s business.
FEMSA Comercio – Fuel Division sells mainly gasoline and diesel through owned or leased retail service stations. Currently, the prices of these products are regulated in Mexico by the Comisión Reguladora de Energía (Energy Regulatory Commission), a government agency. Changes in how these prices may be determined or controlled may adversely affect FEMSA Comercio – Fuel Division’s business, financial condition, results of operations and prospects. In the future and in accordance with what is envisioned by the current regulations in Mexico, prices will follow the dynamics of the international fuel market, which may also adversely affect FEMSA Comercio – Fuel Division’s business, financial condition, results of operations and prospects.
Uncertainty in Mexican legislation and regulation of the energy sector could affect FEMSA Comercio – Fuel Division’s business.
Mexican legislation and regulation of the energy sector in general, and of fuel distribution in particular, is in transition or has not been fully implemented (through secondary legislation and rules) given the recent passing of energy reforms. The authorities have certain discretion to implement the energy reform and, in the future, new rules, additional requirements or steps or interpretations could adversely affect FEMSA Comercio – Fuel Division’s business, financial condition, results of operations and prospects.
FEMSA Comercio – Fuel Division’s business could be affected by new safety regulations enforced by government, global environmental regulations and new energy technologies.
Federal, state and municipal laws and regulations for the installation of new service stations are becoming or may become more stringent; compliance with these laws and regulations is often difficult and costly. Global trends to reduce the consumption of fossil fuels through incentives and taxes could push sales of these fuels at service stations to slow or decrease in the future, and automotive technologies, including efficiency gains in traditional fuel vehicles and increased popularity of alternative fuel vehicles, such as electric and liquefied petroleum gas (LPG) vehicles, have caused a significant reduction in fuel consumption. Other new technologies could further reduce the sale of traditional fuels; all of which could adversely affect FEMSA Comercio – Fuel Division’s results or financial position.
11
Competition from new players in Mexico could adversely affect FEMSA Comercio – Fuel Division’s business.
The opening of the Mexican fuel distribution market is expected to alter the competitive dynamics of the industry. The Mexican fuel distribution market is expected to enter into a consolidation process as large companies and international competitors enter the market or gain market share at the expense of small, independently owned and operated service stations. Consolidation may occur rapidly and materially alter the market dynamics in Mexico which may affect our ability to take advantage of existing opportunities. Such changes could adversely affect FEMSA Comercio – Fuel Division’s business, financial condition, results of operations and prospects. We cannot assure you that any further market consolidation will not be detrimental to FEMSA Comercio – Fuel Division’s market position or competitiveness or will not materially and adversely affect its business, financial condition, results of operations and prospects.
Risks Related to Mexico and the Other Countries Where We Operate
Adverse economic conditions in Mexico may adversely affect our financial position and results.
We are a Mexican corporation, and our Mexican operations are our single most important geographic territory. For the year ended December 31, 2015, 70% of our consolidated total revenues were attributable to Mexico. During 2012, 2013 and 2014 the Mexican gross domestic product, or “GDP,” increased by approximately 4.0%, 1.4% and 2.1%, respectively, and in 2015 it increased by approximately 2.5% on an annualized basis compared to 2014, due to stronger performance in the services and primary sectors, which were partially offset by lower volumes and cheaper prices in the oil and gas industries. We cannot assure you that such conditions will not have a material adverse effect on our business, financial condition, results of operations and prospects going forward. The Mexican economy continues to be heavily influenced by the U.S. economy, and therefore, deterioration in economic conditions in, or delays in recovery of, the U.S. economy may hinder any recovery in Mexico. In the past, Mexico has experienced both prolonged periods of weak economic conditions and deteriorations in economic conditions that have had a negative impact on our results.
Our business may be significantly affected by the general condition of the Mexican economy, or by the rate of inflation in Mexico, interest rates in Mexico and exchange rates for, or exchange controls affecting, the Mexican peso. Decreases in the growth rate of the Mexican economy, periods of negative growth and/or increases in inflation or interest rates may result in lower demand for our products, lower real pricing of our products or a shift to lower margin products. Because a large percentage of our costs and expenses are fixed, we may not be able to reduce costs and expenses upon the occurrence of any of these events, and our profit margins may suffer as a result.
In addition, an increase in interest rates in Mexico would increase the cost of our debt and would cause an adverse effect on our financial position and results. Mexican peso-denominated debt (including currency hedges) constituted 39% of our total debt as of December 31, 2015.
Depreciation of the Mexican peso and of our other local currencies relative to the U.S. dollar could adversely affect our financial position and results.
Depreciation of the Mexican peso and of our other local currencies relative to the U.S. dollar increases the cost of a portion of the raw materials we acquire, the price of which is paid in or determined with reference to U.S. dollars, and of our debt obligations denominated in U.S. dollars, and thereby negatively affects our financial position and results. A severe devaluation or depreciation of the Mexican peso may result in disruption of the international foreign exchange markets and may limit our ability to transfer or to convert Mexican pesos into U.S. dollars and other currencies for the purpose of making timely payments of interest and principal on our U.S. dollar-denominated debt or obligations in other currencies. The Mexican peso is a free-floating currency and as such, it experiences exchange rate fluctuations relative to the U.S. dollar over time. During 2014, 2013 and 2012, the Mexican peso experienced fluctuations relative to the U.S. dollar consisting of 7.1% of recovery, 1.0% of depreciation and 12.6% of depreciation respectively, compared to the years of 2013, 2012 and 2011. During 2015, the Mexican peso depreciated relative to the U.S. dollar by approximately 16.6% compared to 2014. Through February 26, 2015, the Mexican peso has depreciated 5.8% since December 31, 2015.
12
While the Mexican government does not currently restrict, and since 1982 has not restricted, the right or ability of Mexican or foreign persons or entities to convert Mexican pesos into U.S. dollars or to transfer other currencies out of Mexico, the Mexican government could impose restrictive exchange rate policies in the future, as it has done in the past. Currency fluctuations may have an adverse effect on our financial position, results and cash flows in future periods.
When the financial markets are volatile, as they have been in recent periods, our results may be substantially affected by variations in exchange rates and commodity prices, and to a lesser degree, interest rates. These effects include foreign exchange gain and loss on assets and liabilities denominated in U.S. dollars, fair value gain and loss on derivative financial instruments, commodities prices and changes in interest income and interest expense. These effects can be much more volatile than our operating performance and our operating cash flows.
13
INFORMATION ON THE COMPANY
Overview
We are a Mexican company headquartered in Monterrey, Mexico, and our origin dates back to 1890. Our company was incorporated on May 30, 1936 and has a duration of 99 years. The duration can be extended indefinitely by resolution of our shareholders. Our legal name is Fomento Económico Mexicano, S.A.B. de C.V., and in commercial and business contexts we frequently refer to ourselves as FEMSA. Our principal executive offices are located at General Anaya No. 601 Pte., Colonia Bella Vista, Monterrey, Nuevo León 64410, Mexico. Our telephone number at this location is (+52-81) 8328-6000. Our website is www.femsa.com. We are organized as a sociedad anónima bursátil de capital variable under the laws of Mexico.
We conduct our operations through the following principal holding companies:
| • | Coca-Cola FEMSA, which produces, distributes and sells beverages, and is the largest franchise bottler of Coca-Cola products in the world; |
| • | FEMSA Comercio, comprising a Retail Division operating various small-format chain stores, including OXXO, the largest and fastest-growing chain in Latin America, and a Fuel Division operating the OXXO GAS chain of retail service stations for fuels, motor oils and other car care products. As of December 31, 2015, the Fuel Division is treated as a separate business segment; and |
| • | CB Equity, which holds our equity investment in Heineken, one of the world’s leading brewers, with operations in over 70 countries. |
Corporate Background
FEMSA traces its origins to the establishment of Mexico’s first brewery, Cervecería Cuauhtémoc, S.A., which we refer to as Cuauhtémoc Moctezuma, which was founded in 1890 by four Monterrey businessmen: Francisco G. Sada, José A. Muguerza, Isaac Garza and José M. Schneider. Descendants of certain of the founders of Cuauhtémoc Moctezuma are participants of the voting trust that controls the management of our company.
The strategic integration of our company dates back to 1936 when our packaging operations were established to supply crown caps to the brewery. During this period, these operations were part of what was known as the Monterrey Group, which also included interests in banking and steel businesses and other packaging operations.
In 1974, the Monterrey Group was split between two branches of the descendants of the founding families of Cuauhtémoc Moctezuma. The steel and other packaging operations formed the basis for the creation of Corporación Siderúrgica, S.A. (now Alfa, S.A.B. de C.V.), controlled by the Garza Sada family, and the beverage and banking operations were consolidated under the Valores Industriales, S.A. de C.V. (the corporate predecessor of FEMSA) corporate umbrella controlled by the Garza Lagüera family. FEMSA’s shares were first listed on what is now the Bolsa Mexicana de Valores, S.A.B. de C.V. (which we refer to as the Mexican Stock Exchange) on September 19, 1978. Between the decades of 1970 and 1980, FEMSA diversified its operations through acquisitions in the soft drinks and mineral water industries, the establishment of the first stores under the trade name “OXXO” and other investments in the hotel, construction, auto parts, food and fishing industries, which were considered non-core businesses and were subsequently divested.
In the 1990s, we began a series of strategic transactions to strengthen the competitive positions of our operating subsidiaries. These transactions included the sale of a 30% strategic interest in Coca-Cola FEMSA to a wholly-owned subsidiary of The Coca-Cola Company and a subsequent public offering of Coca-Cola FEMSA shares, both of which occurred in 1993. Coca-Cola FEMSA listed its L shares on the Mexican Stock Exchange and, in the form of American Depositary Shares, or ADSs, on the New York Stock Exchange, or NYSE.
14
In 1998, we completed a reorganization that changed our capital structure by converting our outstanding capital stock at the time of the reorganization into BD Units and B Units, and united the shareholders of FEMSA and the former shareholders of Grupo Industrial Emprex, S.A. de C.V. (which we refer to as Emprex) at the same corporate level through an exchange offer that was consummated on May 11, 1998. As part of the reorganization, FEMSA listed ADSs on the NYSE representing BD Units, and listed the BD Units and its B Units on the Mexican Stock Exchange.
In May 2003, our subsidiary Coca-Cola FEMSA expanded its operations throughout Latin America by acquiring 100% of Panamerican Beverages, Inc. (which we refer to as Panamco), then the largest soft drink bottler in Latin America in terms of sales volume in 2002. Through its acquisition of Panamco, Coca-Cola FEMSA began producing and distributing Coca-Cola trademark beverages in additional territories in Mexico, Central America, Colombia, Venezuela and Brazil, along with bottled water, beer and other beverages in some of these territories.
In January 2010, FEMSA announced that its board of directors unanimously approved a definitive agreement under which FEMSA would exchange its brewery business (Cuauhtémoc Moctezuma) for a 20% economic interest in Heineken N.V. and Heineken Holding N.V. (which, together with their respective subsidiaries, we refer to as Heineken or the Heineken Group), one of the world’s leading brewers. In April 2010, FEMSA announced the closing of the transaction, after Heineken N.V., Heineken Holding N.V. and FEMSA approved the transaction. Under the terms of the agreement, FEMSA received 43,018,320 shares of Heineken Holding N.V. and 43,009,699 shares of Heineken N.V., with an additional 29,172,504 shares of Heineken N.V. (which shares we refer to as the Allotted Shares) delivered pursuant to an allotted share delivery instrument, or the ASDI. Heineken also assumed US$ 2.1 billion of indebtedness, including Cuauhtémoc Moctezuma’s unfunded pension obligations. The Allotted Shares were delivered to FEMSA in several installments during 2010 and 2011, with the final installment delivered on October 5, 2011. As of December 31, 2015, FEMSA’s interest in Heineken N.V. represented 12.53% of Heineken N.V.’s outstanding capital and 14.94% of Heineken Holding N.V.’s outstanding capital, resulting in our 20% economic interest in the Heineken Group.
On January 25, 2013, as part of Coca- Cola FEMSA’s efforts to expand its geographic reach, it acquired a 51.0% non-controlling majority stake in CCFPI from The Coca-Cola Company. Coca- Cola FEMSA has an option to acquire the remaining 49.0% stake in CCFPI at any time during the seven years following the closing date. Coca-Cola FEMSA also has a put option to sell its ownership in CCFPI to The Coca-Cola Company commencing on the fifth anniversary of the closing date and ending on the sixth anniversary of the closing date. Coca- Cola FEMSA currently manages the day-to-day operations of the business; however, pursuant to its shareholders’ agreement with The Coca-Cola Company (a) during a four- year period ending January 25, 2017, all decisions must be approved jointly with The Coca-Cola Company, (b) following this four-year period, all decisions related to the annual normal operations plan and any other ordinary matters will be approved only by Coca- Cola FEMSA, (c) The Coca-Cola Company has the right to appoint (and may remove) CCFPI’s chief financial officer, and (d) Coca- Cola FEMSA has the right to appoint (and may remove) the chief executive officer and all other officers of CCFPI. Coca-Cola FEMSA currently records its investment in CCFPI and its operating results using the equity method.
In May 2013, Coca-Cola FEMSA closed its merger with Grupo Yoli, S.A. de C.V. or Grupo Yoli, a Mexican bottler operating mainly in the state of Guerrero as well as in parts of the state of Oaxaca.
On May 2, 2013, FEMSA Comercio through one of its subsidiaries, Cadena Comercial de Farmacias, S.A.P.I. de C.V. (which we refer to as CCF), closed the acquisition of Farmacias YZA, a leading drugstore operator in Southeast Mexico, headquartered in Merida, Yucatan. The founding shareholders of Farmacias YZA hold a 25% stake in CCF. In a separate transaction, on May 13, 2013, CCF acquired Farmacias FM Moderna, a leading drugstore operator in the western state of Sinaloa.
In August 2013, Coca-Cola FEMSA closed its acquisition of Companhia Fluminense de Refrigerantes (which we refer to as Companhia Fluminense), a franchise that operates in parts of the states of Sao Paulo, Minas Gerais and Rio de Janeiro in Brazil.
In October 2013, Coca-Cola FEMSA closed its acquisition of Spaipa S.A. Indústria Brasileira de Bebidas or Spaipa, a Brazilian bottler with operations in the state of Parana and in parts of the state of Sao Paulo. For more information on Coca-Cola FEMSA’s corporate history, see “Information on the Company – Coca-Cola FEMSA – Corporate History.”
15
In December 2013, FEMSA Comercio, through one of its subsidiaries, purchased the operating assets and trademarks of Doña Tota, a leading quick-service restaurant operator in Mexico. The founding shareholders of Doña Tota hold a 20% stake in the FEMSA Comercio subsidiary that now operates the Doña Tota business.
Since 1995, FEMSA Comercio has provided services and operated retail service stations for fuels, motor oils and other car care products through agreements with third parties that own Petróleos Mexicanos (“PEMEX”) franchises. In March 2015, following changes to the legal framework and considering the potential expansion and synergies arising from this business as part of Mexico’s energy reform, FEMSA Comercio began to acquire PEMEX’s service station franchises and to obtain permits from PEMEX to operate each of the franchises.
In June 2015, CCF acquired 100% of Farmacias Farmacon, a regional pharmacy chain consisting at that time of more than 200 stores in the northwestern Mexican states of Sinaloa, Sonora, Baja California and Baja California Sur.
In September 2015, FEMSA Comercio acquired 60% of Grupo Socofar (which we refer to as Socofar), a leading South American drugstore operator based in Santiago, Chile. Socofar operated at that time, directly and through franchises, more than 600 drugstores and 150 beauty stores throughout Chile and over 150 drugstores throughout Colombia. FEMSA Comercio has the right to appoint the majority of the members of Socofar’s board of directors and exercises day-to-day operating control over Socofar. The former controlling shareholders have the right to appoint two members of the board of directors of Socofar. FEMSA Comercio has the right to appoint the majority of the members of Socofar’s board of directors and exercises day to day operating control over Socofar. The former controlling shareholders have the right to appoint two members of the board of directors of Socofar. In connection with the acquisition of 60% of Socofar, FEMSA Comercio entered into option transactions regarding the remaining 40% non-controlling interest not held by FEMSA Comercio. The former controlling shareholders of Socofar may be able to put some or all of that interest to FEMSA Comercio beginning (i) 42-months after the initial acquisition, upon the occurrence of certain events, and (ii) 60 months after the initial acquisition, in any event. FEMSA Comercio can call the remaining 40% non-controlling interest beginning on the seventh anniversary of the initial acquisition date. Both of these options would be exercisable at the then fair value of the interest and shall remain indefinitely. As such, at the initial acquisition date and at December 31, 2015, their fair value is not significant.
16
Ownership Structure
We conduct our business through our principal sub-holding companies as shown in the following diagram and table:
Principal Sub-holding Companies—Ownership Structure
As of March 4, 2016
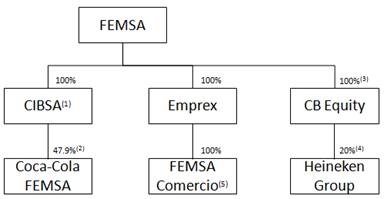
| (1) | Compañía Internacional de Bebidas, S.A. de C.V., which we refer to as CIBSA. |
| (2) | Percentage of issued and outstanding capital stock owned by CIBSA (representing 63.0% of Coca-Cola FEMSA’s capital stock with full voting rights). See “Information on the Company—Coca-Cola FEMSA—Capital Stock.” |
| (3) | Ownership in CB Equity held through various FEMSA subsidiaries. |
| (4) | Combined economic interest in Heineken N.V. and Heineken Holding N.V. |
| (5) | Includes 100% ownership of FEMSA Comercio – Retail Division and 99.96% ownership of FEMSA Comercio – Fuel Division. |
The following table presents an overview of our operations by reportable segment and by geographic area:
Operations by Segment—Overview
Year Ended December 31, 2015 and % of growth (decrease) vs. previous year
| Coca-Cola FEMSA | FEMSA Comercio – Retail Division |
FEMSA Comercio – Fuel Division(4) |
CB Equity(1) | |||||||||||||||||||||||||||||
| (in millions of Mexican pesos, except for employees and percentages) | ||||||||||||||||||||||||||||||||
| Total revenues |
Ps. | 152,360 | 3 | % | Ps. | 132,891 | 21 | % | Ps. | 18,510 | NA | Ps. | — | — | ||||||||||||||||||
| Gross Profit |
72,030 | 5 | % | 47,291 | 20 | % | 1,420 | NA | — | — | ||||||||||||||||||||||
| Share of the profit (loss) of associates and joint ventures accounted for using the equity method, net of taxes |
155 | 224 | %(2) | (10 | ) | (127 | %)(3) | — | NA | 5,879 | 12 | % | ||||||||||||||||||||
| Total assets |
210,249 | (1 | %) | 67,211 | 54 | % | 3,230 | NA | 95,502 | 11 | % | |||||||||||||||||||||
| Employees |
83,712 | 0.4 | % | 133,748 | 21 | % | 4,551 | NA | — | — | ||||||||||||||||||||||
| (1) | CB Equity holds our Heineken N.V. and Heineken Holding N.V. shares. |
| (2) | Reflects the percentage increase between the gain of Ps. 155 million recorded in 2015 and the loss of Ps. 125 million recorded in 2014. |
| (3) | Reflects the percentage decrease between the loss of Ps. 10 million recorded in 2015 and the gain of Ps. 37 million recorded in 2014. |
| (4) | The operations that compose our FEMSA Comercio – Fuel Division were acquired and have been treated as a separate business segment since 2015. As such, no results of operations are available for this segment for periods prior to 2015. |
17
Total Revenues Summary by Segment(1)
| Year Ended December 31, | ||||||||||||
| 2015 | 2014 | 2013 | ||||||||||
| (in millions of Mexican pesos) | ||||||||||||
| Coca-Cola FEMSA |
Ps.152,360 | Ps.147,298 | Ps.156,011 | |||||||||
| FEMSA Comercio – Retail Division |
132,891 | 109,624 | 97,572 | |||||||||
| FEMSA Comercio – Fuel Division |
18,510 | — | — | |||||||||
| Other |
22,774 | 20,069 | 17,254 | |||||||||
| Consolidated total revenues |
Ps. 311,589 | Ps. 263,449 | Ps. 258,097 | |||||||||
| (1) | The sum of the financial data for each of our segments differs from our consolidated financial information due to intercompany transactions, which are eliminated in consolidation, and certain assets and activities of FEMSA. |
Total Revenues Summary by Geographic Area(1)
| Year Ended December 31, | ||||||||||||
| 2015 | 2014 | 2013 | ||||||||||
| (in millions of Mexican pesos) | ||||||||||||
| Mexico and Central America(2) |
Ps. 228,563 | Ps. 186,736 | Ps. 171,726 | |||||||||
| South America(3) |
74,928 | 69,172 | 55,157 | |||||||||
| Venezuela |
8,904 | 8,835 | 31,601 | |||||||||
| Consolidated total revenues |
Ps. 311,589 | Ps. 263,449 | Ps. 258,097 | |||||||||
| (1) | The sum of the financial data for each geographic area differs from our consolidated financial information due to intercompany transactions, which are eliminated in consolidation. |
| (2) | Central America includes Guatemala, Nicaragua, Costa Rica and Panama. Domestic (Mexico-only) revenues were Ps. 218,809 million, Ps. 178,125 million and Ps. 163,351 million for the years ended December 31, 2015, 2014 and 2013, respectively. |
| (3) | South America includes Brazil, Colombia, Argentina and Chile. South America revenues include revenues from our operations in Brazil of Ps. 39,749 million, Ps. 45,799 million and Ps. 31,138 million; revenues from our operations in Colombia of Ps. 14,283 million, Ps. 14,207 million and Ps. 13,354 million; revenues from our operations in Argentina of Ps. 14,004 million, Ps. 9,714 million and Ps. 10,729 million, for the years ended December 31, 2015, 2014 and 2013, respectively, and revenues from our operations in Chile of Ps. 7,586 million for the year ended December 31, 2015. |
Significant Subsidiaries
The following table sets forth our significant subsidiaries as of December 31, 2015:
| Name of Company |
Jurisdiction of Establishment |
Percentage Owned |
||||
| CIBSA: |
Mexico | 100.0 | % | |||
| Coca-Cola FEMSA |
Mexico | 47.9 | %(1) | |||
| Emprex: |
Mexico | 100.0 | % | |||
| FEMSA Comercio(2) |
Mexico | 100.0 | % | |||
| CB Equity(3) |
United Kingdom | 100.0 | % | |||
| (1) | Percentage of capital stock. FEMSA, through CIBSA, owns 63.0% of the shares of Coca-Cola FEMSA with full voting rights. |
| (2) | Includes FEMSA Comercio – Retail Division and FEMSA Comercio – Fuel Division. |
| (3) | Ownership in CB Equity held through various FEMSA subsidiaries. CB Equity holds our Heineken N.V and Heineken Holding N.V. shares. |
Business Strategy
We understand the importance of connecting with our end consumers by interpreting their needs, and ultimately delivering the right products to them for the right occasions and the optimal value proposition. We strive to achieve this by developing brand value, expanding our significant distribution capabilities and improving the
18
efficiency of our operations while aiming to reach our full potential. We continue to improve our information gathering and processing systems in order to better know and understand what our consumers want and need, and we are improving our production and distribution by more efficiently leveraging our asset base.
Our objective is to create economic, social and environmental value for our stakeholders—including our employees, our consumers, our shareholders and the enterprises and institutions within our society—now and into the future.
We believe that the competencies that our businesses have developed can be replicated in other geographic regions. This underlying principle guided our consolidation and growth efforts, which led to our current continental footprint. We have presence in Mexico, Central and South America and the Philippines including some of the most populous metropolitan areas in Latin America—which has provided us with opportunities to create value through both an improved ability to execute our strategies in complex markets and the use of superior marketing tools. We have also increased our capabilities to operate and succeed in other geographic regions by improving management skills in order to obtain a precise understanding of local consumer needs. Going forward, we intend to use those capabilities to continue our international expansion of both Coca-Cola FEMSA and FEMSA Comercio, expanding both our geographic footprint and our presence in the non-alcoholic beverage industry and small box retail formats, as well as taking advantage of potential opportunities across markets to leverage our skill set and key competencies. One such opportunity is our recent entry into the retail service station business in Mexico, through FEMSA Comercio – Fuel Division, where we are applying our retail and operational capabilities to develop an attractive value proposition for consumers, while creating synergies with our OXXO stores.
Coca-Cola FEMSA
Overview
Coca-Cola FEMSA is the largest franchise bottler of Coca-Cola trademark beverages in the world. It operates in territories in the following countries:
| • | Mexico—a substantial portion of central Mexico, the southeast and northeast of Mexico (including the Gulf region). |
| • | Central America—Guatemala (Guatemala City and surrounding areas), Nicaragua (nationwide), Costa Rica (nationwide) and Panama (nationwide). |
| • | Colombia—most of the country. |
| • | Venezuela—nationwide. |
| • | Brazil—a major part of the states of Sao Paulo and Minas Gerais, the states of Parana and Mato Grosso do Sul and part of the states of Rio de Janeiro and Goias. |
| • | Argentina—Buenos Aires and surrounding areas. |
| • | Philippines—nationwide (through a joint venture with The Coca-Cola Company). |
Coca-Cola FEMSA was incorporated on October 30, 1991 as a stock corporation with variable capital (sociedad anónima de capital variable) under the laws of Mexico for a term of 99 years. On December 5, 2006, as required by amendments to the Mexican Securities Market Law, Coca-Cola FEMSA became a publicly traded stock corporation with variable capital (sociedad anónima bursátil de capital variable). Coca-Cola FEMSA’s legal name is Coca-Cola FEMSA, S.A.B. de C.V. Coca-Cola FEMSA’s principal executive offices are located at Calle Mario Pani No. 100, Colonia Santa Fe Cuajimalpa, Delegación Cuajimalpa de Morelos, 05348, Mexico City, Mexico. Coca-Cola FEMSA’s telephone number at this location is (52-55) 1519-5000. Coca-Cola FEMSA’s website is www.coca-colafemsa.com.
19
The following is an overview of Coca-Cola FEMSA’s operations by consolidated reporting segment in 2015.
Operations by Consolidated Reporting Segment—Overview
Year Ended December 31, 2015
| Revenues | Gross Profit | |||||||||||||||
| (in millions of Mexican pesos, except for percentages) | ||||||||||||||||
| Mexico and Central America(1) |
|
Ps. 78,709 |
|
51.7 | % | Ps. 40,130 | 55.7 | % | ||||||||
| South America(2) (excluding Venezuela) |
64,752 | 42.5 | % | 27,532 | 38.2 | % | ||||||||||
| Venezuela |
8,899 | 5.8 | % | 4,368 | 6.1 | % | ||||||||||
| Consolidated |
Ps. 152,360 | 100 | % | Ps. 72,030 | 100 | % | ||||||||||
| (1) | Includes Mexico, Guatemala, Nicaragua, Costa Rica and Panama. |
| (2) | Includes Colombia, Brazil and Argentina. |
Corporate History
Coca-Cola FEMSA commenced operations in 1979, when one of our subsidiaries acquired certain sparkling beverage bottlers in Mexico City and surrounding areas. In 1991, we transferred our ownership in the bottlers to FEMSA Refrescos, S.A. de C.V., the corporate predecessor to Coca-Cola FEMSA.
In June 1993, a subsidiary of The Coca-Cola Company subscribed for 30% of Coca-Cola FEMSA’s capital stock in the form of Series D shares. In September 1993, we sold Series L shares that represented 19.0% of Coca-Cola FEMSA’s capital stock to the public, and Coca-Cola FEMSA listed these shares on the Mexican Stock Exchange and, in the form of ADSs, on the NYSE.
In a series of transactions since 1994, Coca-Cola FEMSA has acquired new territories, brands and other businesses which today comprise Coca-Cola FEMSA’s business. In May 2003, Coca-Cola FEMSA acquired Panamco and began producing and distributing Coca-Cola trademark beverages in additional territories in the central and gulf regions of Mexico and in Central America (Guatemala, Nicaragua, Costa Rica and Panama), Colombia, Venezuela and Brazil, along with bottled water, beer and other beverages in some of these territories.
In November 2006, we acquired 148,000,000 of Coca-Cola FEMSA’s Series D shares from certain subsidiaries of The Coca-Cola Company, which increased our ownership of Coca-Cola FEMSA to 53.7%.
In November 2007, Coca-Cola FEMSA acquired together with The Coca-Cola Company 100% of the shares of capital stock of Jugos del Valle, S.A.P.I. de C.V., or Jugos del Valle. In 2008, Coca-Cola FEMSA, The Coca-Cola Company and all Mexican and Brazilian Coca-Cola bottlers entered into a joint business for the Mexican and Brazilian operations, respectively, of Jugos del Valle.
In December 2007 and May 2008, Coca-Cola FEMSA sold most of its proprietary brands to The Coca-Cola Company. The proprietary brands are now being licensed back to Coca-Cola FEMSA by The Coca-Cola Company pursuant to its bottler agreements.
In May 2008, Coca-Cola FEMSA entered into a transaction with The Coca-Cola Company to acquire its wholly owned bottling franchise Refrigerantes Minas Gerais, Ltda., located in the State of Minas Gerais in Brazil.
In July 2008, Coca-Cola FEMSA acquired the Agua de los Angeles bulk water business in Mexico City and surrounding areas from Grupo Embotellador CIMSA, S.A. de C.V., at the time one of the Coca-Cola bottling franchises in Mexico. The trademarks remain with The Coca-Cola Company. Coca-Cola FEMSA subsequently merged Agua de los Angeles into its bulk water business under the Ciel brand.
In February 2009, Coca-Cola FEMSA together with The Coca-Cola Company acquired the Brisa bottled water business in Colombia from Bavaria, S.A., a subsidiary of SABMiller plc. Coca-Cola FEMSA acquired the production assets and the distribution territory and The Coca-Cola Company acquired the Brisa brand.
20
In May 2009, Coca-Cola FEMSA entered into an agreement to manufacture, distribute and sell the Crystal trademark water products in Brazil jointly with The Coca-Cola Company.
In August 2010, Coca-Cola FEMSA acquired from The Coca-Cola Company along with other Brazilian Coca-Cola bottlers, Leão Alimentos e Bebidas, Ltda. or Leão Alimentos, manufacturer and distributor of the Matte Leão tea brand, which will later be integrated into the Brazilian operations of Jugos del Valle.
In March 2011, Coca-Cola FEMSA together with The Coca-Cola Company acquired Grupo Industrias Lacteas, S.A. (also known as Estrella Azul), a Panamanian conglomerate that participates in the dairy and juice-based beverage categories in Panama.
In October 2011, Coca-Cola FEMSA merged with Grupo Tampico, a Mexican bottler with operations in the states of Tamaulipas, San Luis Potosi and Veracruz, as well as in parts of the states of Hidalgo, Puebla and Queretaro.
In December 2011, Coca-Cola FEMSA merged with Grupo CIMSA, a Mexican Coca-Cola bottler with operations mainly in the states of Morelos and Mexico, as well as in parts of the states of Guerrero and Michoacan. As part of its merger with Grupo CIMSA, Coca-Cola FEMSA also acquired a 13.2% equity interest in Promotora Industrial Azucarera, S.A de C.V., or PIASA.
In May 2012, Coca-Cola FEMSA merged with Grupo Fomento Queretano, a Mexican bottler with operations mainly in the state of Queretaro, as well as in parts of the states of Mexico, Hidalgo and Guanajuato. As part of Coca-Cola FEMSA’s merger with Grupo Fomento Queretano it also acquired an additional 12.9% equity interest in PIASA.
In August 2012, Coca-Cola FEMSA acquired, through Jugos del Valle, an indirect participation in Santa Clara Mercantil de Pachuca, S.A. de C.V., a producer of milk and dairy products in Mexico.
In January 2013, Coca-Cola FEMSA acquired a 51% non-controlling majority stake in CCFPI from The Coca-Cola Company.
In May 2013, Coca-Cola FEMSA merged with Grupo Yoli, a Mexican bottler with operations mainly in the state of Guerrero as well as in parts of the state of Oaxaca. As part of its merger with Grupo Yoli, Coca-Cola FEMSA also acquired an additional 10.1% equity interest in PIASA for a total ownership as of March 4, 2016 of 36.3%.
In August 2013, Coca-Cola FEMSA acquired Companhia Fluminense, a franchise that operates in parts of the states of Sao Paulo, Minas Gerais and Rio de Janeiro in Brazil. As part of Coca-Cola FEMSA’s acquisition of Companhia Fluminense, Coca-Cola FEMSA also acquired an additional 1.2% equity interest in Leão Alimentos.
In October 2013, Coca-Cola FEMSA acquired Spaipa, a Brazilian bottler with operations in the state of Parana and in parts of the state of Sao Paulo. As part of its acquisition of Spaipa, Coca-Cola FEMSA also acquired an additional 5.8% equity interest in Leão Alimentos, for a total ownership as of March 4, 2016 of 24.4%, and a 50.0% stake in Fountain Água Mineral Ltda., a joint venture to develop the water category together with The Coca-Cola Company.
21
Capital Stock
As of March 4, 2016, we indirectly owned Series A shares equal to 47.9% of Coca-Cola FEMSA’s capital stock (63.0% of Coca-Cola FEMSA’s capital stock with full voting rights). As of March 4, 2016, The Coca-Cola Company indirectly owned Series D shares equal to 28.1% of the capital stock of Coca-Cola FEMSA (37.0% of the capital stock with full voting rights). Series L shares with limited voting rights, which trade on the Mexican Stock Exchange and in the form of ADSs on the NYSE, constitute the remaining 24.0% of Coca-Cola FEMSA’s capital stock.
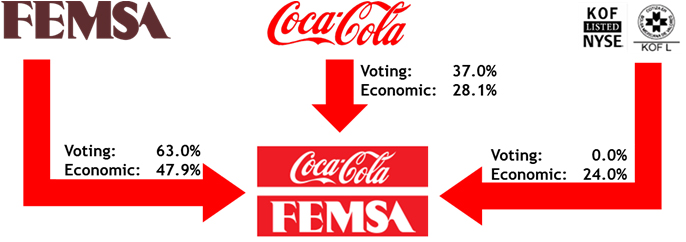
Business Strategy
Coca-Cola FEMSA operates with a large geographic footprint in Latin America. In January 2015, Coca-Cola FEMSA restructured the management of its operations as follows: (i) Mexico (covering certain territories in Mexico); (ii) Latin America (covering certain territories in Guatemala, and all of Nicaragua, Costa Rica and Panama, certain territories in Argentina, most of Colombia and all of Venezuela); (iii) Brazil (covering a major part of the states of Sao Paulo and Minas Gerais, the states of Parana and Mato Grosso do Sul and part of the states of Rio de Janeiro and Goias); and (iv) Asia (covering all of the Philippines through a joint venture with The Coca-Cola Company). Through this restructuring, Coca-Cola FEMSA created a more flexible organizational structure to execute its strategies and continue with its track record of growth. Coca-Cola FEMSA has also aligned its business strategies more efficiently, ensuring a faster introduction of new products and categories and a more rapid and effective design and deployment of commercial models.
To maximize growth and profitability and to create value for its shareholders and customers, Coca-Cola FEMSA plans on executing the following key strategies: (i) continue evolving its commercial and client segmentation models to capture the industry’s long-term value potential; (ii) implement multi-segmentation strategies to target customers by consumption occasion, competitive environment and income levels; (iii) implement well-planned product development, packaging, pricing and marketing strategies through different distribution channels; (iv) drive product innovation along its different product categories; (v) develop new businesses and distribution channels; and (vi) drive operational efficiencies throughout its organization to achieve the full operating potential of its commercial models and processes. In furtherance of these efforts, Coca-Cola FEMSA intends to continue to focus on, among other initiatives, the following:
| • | working with The Coca-Cola Company to develop a business model to continue exploring and participating in new lines of beverages, extending existing product lines and effectively advertising and marketing its products; |
| • | developing and expanding its still beverage portfolio through innovation, strategic acquisitions and by entering into agreements to acquire companies with The Coca-Cola Company; |
22
| • | expanding its bottled water strategy with The Coca-Cola Company through innovation and selective acquisitions to maximize profitability across its market territories; |
| • | strengthening its selling capabilities and go-to-market strategies, including pre-sale, conventional selling and hybrid routes, in order to get closer to its customers and help them satisfy the beverage needs of consumers; |
| • | implementing selective packaging strategies designed to increase consumer demand for its products and to build a strong returnable base for the Coca-Cola brand; |
| • | replicating its best practices throughout the value chain; |
| • | rationalizing and adapting its organizational and asset structure in order to be in a better position to anticipate and respond to industry changes and trends in a competitive environment; |
| • | building a multi-cultural collaborative team, from top to bottom; and |
| • | broadening its geographic footprint through organic growth and strategic joint ventures, mergers and acquisitions. |
Coca-Cola FEMSA seeks to increase sales of its products in the territories where it operates. To that end, Coca-Cola FEMSA’s marketing teams continuously develop sales strategies tailored to its different customers across its various territories and distribution channels. Coca-Cola FEMSA continues to develop its product portfolio to better meet market demand and maintain its overall profitability. To stimulate and respond to consumer demand, Coca-Cola FEMSA continues to introduce new categories, products and presentations. See “Information on the Company—Coca-Cola FEMSA—Product and Packaging Mix.” In addition, because Coca-Cola FEMSA views its relationship with The Coca-Cola Company as integral to its business, Coca-Cola FEMSA uses market information systems and strategies developed with The Coca-Cola Company to improve its business and marketing strategies. See “Information on the Company—Coca-Cola FEMSA—Marketing.”
Coca-Cola FEMSA also continuously seeks to increase productivity in its facilities through infrastructure and process reengineering for improved asset utilization. Coca-Cola FEMSA’s capital expenditure program includes investments in production and distribution facilities, bottles, cases, coolers and information systems. Coca-Cola FEMSA believes that this program will allow it to maintain its capacity and flexibility to innovate and to anticipate and respond to consumer demand for its products.
As mentioned above, in 2015, Coca-Cola FEMSA redesigned its corporate structure to strengthen the core functions of its organization. Through this restructuring, Coca-Cola FEMSA created specialized departments (centers of excellence) focused on manufacturing, distribution and logistics, commercial, and IT innovation areas. These departments not only enable centralized collaboration and knowledge sharing, but also drive standards of excellence and best practices in Coca-Cola FEMSA’s key strategic capabilities. Coca-Cola FEMSA’s priorities include enhanced manufacturing efficiency, improved distribution and logistics, and cutting-edge IT-enabled commercial innovation.
Coca-Cola FEMSA focuses on management quality as a key element of its growth strategy and remains committed to fostering the development of quality management at all levels. Coca-Cola FEMSA’s Strategic Talent Management Model is designed to enable it to reach its full potential by developing the capabilities of its employees and executives. This holistic model works to build the skills necessary for Coca-Cola FEMSA’s employees and executives to reach their maximum potential, while contributing to the achievement of its short- and long-term objectives. To support this capability development model, Coca-Cola FEMSA’s board of directors allocates a portion of its yearly operating budget to fund these management training programs.
Sustainable development is a comprehensive part of Coca-Cola FEMSA’s strategic framework for business operation and growth. Coca-Cola FEMSA bases its efforts in its core foundation, its ethics and values. Coca-Cola FEMSA focuses on three main areas, (i) its people, by encouraging the comprehensive development of its
23
employees and their families; (ii) its communities, by promoting the generation of sustainable communities in which it serves, an attitude of health, self-care, adequate nutrition and physical activity, and evaluating the impact of its value chain; and (iii) the planet, by establishing guidelines that it believes will result in efficient use of natural resources to minimize the impact that its operations might have on the environment and create a broader awareness of caring for the environment.
CCFPI Joint Venture
On January 25, 2013, as part of Coca- Cola FEMSA’s efforts to expand its geographic reach, it acquired a 51.0% non-controlling majority stake in CCFPI from The Coca-Cola Company. Coca- Cola FEMSA has an option to acquire the remaining 49.0% stake in CCFPI at any time during the seven years following the closing date. Coca-Cola FEMSA also has a put option to sell its ownership in CCFPI to The Coca-Cola Company commencing on the fifth anniversary of the closing date and ending on the sixth anniversary of the closing date. Coca- Cola FEMSA currently manages the day-to-day operations of the business; however, pursuant to its shareholders’ agreement with The Coca-Cola Company (a) during a four- year period ending January 25, 2017, all decisions must be approved jointly with The Coca-Cola Company, (b) following this four-year period, all decisions related to the annual normal operations plan and any other ordinary matters will be approved only by Coca- Cola FEMSA, (c) The Coca-Cola Company has the right to appoint (and may remove) CCFPI’s chief financial officer, and (d) Coca- Cola FEMSA has the right to appoint (and may remove) the chief executive officer and all other officers of CCFPI.
As of December 31, 2015, Coca- Cola FEMSA’s investment under the equity method in CCFPI was Ps.9,996 million. See Notes 10 and 26 to our audited consolidated financial statements. Coca- Cola FEMSA’s product portfolio in the Philippines consists of Coca-Cola trademark beverages and its total sales volume in 2015 reached 522.5 million unit cases. The operations of CCFPI are comprised of 19 production plants and serve close to 806,369 customers.
The Philippines presents significant opportunities for further growth. Coca-Cola has been present in the Philippines since the start of the 20th century and since 1912 it has been locally producing Coca-Cola products. The Philippines received the first Coca-Cola bottling and distribution franchise in Asia. Coca-Cola FEMSA’s strategic framework for growth in the Philippines is based on three pillars: portfolio, route to market and supply chain.
24
Coca-Cola FEMSA’s Territories
The following map shows Coca-Cola FEMSA’s territories, including CCFPI, our joint venture in the Philippines with The Coca-Cola Company, giving estimates in each case of the population to which it offers products and the number of retailers of its beverages as of December 31, 2015:
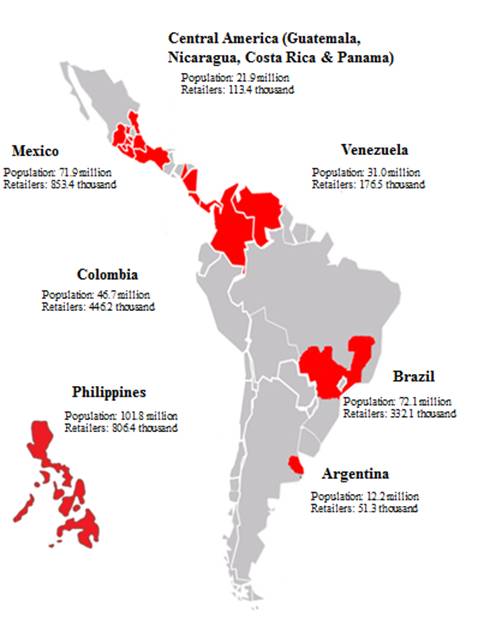
25
Coca-Cola FEMSA’s Products
Coca-Cola FEMSA produces, markets, sells and distributes Coca-Cola trademark beverages. The Coca-Cola trademark beverages include: sparkling beverages (colas and flavored sparkling beverages), waters and still beverages (including juice drinks, coffee, teas, milk, value-added dairy and isotonic drinks). The following table sets forth Coca-Cola FEMSA’s main products as of December 31, 2015:
| Colas: | Mexico and Central America(1) |
South America(2) |
Venezuela | |||
| Coca-Cola |
ü | ü | ü | |||
| Coca-Cola Light |
ü | ü | ü | |||
| Coca-Cola Zero |
ü | ü | ||||
| Coca-Cola Life |
ü | ü |
| Flavored Sparkling Beverages: | Mexico and Central America(1) |
South America(2) |
Venezuela | |||
| Ameyal |
ü | |||||
| Canada Dry |
ü | |||||
| Chinotto |
ü | |||||
| Crush |
ü | |||||
| Escuis |
ü | |||||
| Fanta |
ü | ü | ||||
| Fresca |
ü | |||||
| Frescolita |
ü | ü | ||||
| Hit |
ü | |||||
| Kist |
ü | |||||
| Kuat |
ü | |||||
| Lift |
ü | |||||
| Limon&Nada |
ü | |||||
| Mundet |
ü | |||||
| Naranja&Nada |
ü | |||||
| Quatro |
ü | |||||
| Schweppes |
ü | ü | ü | |||
| Simba |
ü | |||||
| Sprite |
ü | ü | ||||
| Victoria |
ü | |||||
| Yoli |
ü |
| Water: | Mexico and Central America(1) |
South America(2) |
Venezuela | |||
| Alpina |
ü | |||||
| Aquarius(3) |
ü | |||||
| Bonaqua |
ü | |||||
| Brisa |
ü | |||||
| Ciel |
ü | |||||
| Crystal |
ü | |||||
| Dasani |
ü | |||||
| Manantial |
ü | |||||
| Nevada |
ü |
26
| Other Categories: | Mexico and Central America(1) |
South America(2) |
Venezuela | |||
| Cepita(4) |
ü | |||||
| Del Prado(5) |
ü | |||||
| Estrella Azul(6) |
ü | |||||
| FUZE Tea |
ü | ü | ||||
| Hi-C(7) |
ü | ü | ||||
| Santa Clara(8) |
ü | |||||
| Jugos del Valle(4) |
ü | ü | ü | |||
| Matte Leão(9) |
ü | |||||
| Powerade(10) |
ü | ü | ü | |||
| Valle Frut(11) |
ü | ü | ü |
| (1) | Includes Mexico, Guatemala, Nicaragua, Costa Rica and Panama. |
| (2) | Includes Colombia, Brazil and Argentina. |
| (3) | Flavored water. In Brazil, also a flavored sparkling beverage. |
| (4) | Juice-based beverage. |
| (5) | Juice-based beverage in Central America. |
| (6) | Milk and value-added dairy and juices. |
| (7) | Juice-based beverage. Includes Hi-C Orangeade in Argentina. |
| (8) | Milk, value-added dairy and coffee. |
| (9) | Ready to drink tea. |
| (10) | Isotonic drinks. |
| (11) | Orangeade (includes Del Valle Fresh in Costa Rica, Nicaragua, Panama, Colombia and Venezuela). |
Sales Overview
Coca-Cola FEMSA measures total sales volume in terms of unit cases and number of transactions. “Unit case” refers to 192 ounces of finished beverage product (24 eight-ounce servings) and, when applied to soda fountains, refers to the volume of syrup, powders and concentrate that is required to produce 192 ounces of finished beverage product. “Transactions” refers to the number of single units (e.g. a can or a bottle) sold, regardless of their size or volume or whether they are sold individually or in multipacks, except for fountain which represents multiple transactions based on a standard 12 oz. serving. Except when specifically indicated, “sales volume” refers to sales volume in terms of unit cases.
The following table illustrates Coca-Cola FEMSA’s historical sales volume for each of its consolidated territories.
| Year Ended December 31, | ||||||||||||
| 2015 | 2014 | 2013(1) | ||||||||||
| (millions of unit cases) | ||||||||||||
| Mexico and Central America |
||||||||||||
| Mexico |
1,784.5 | 1,754.9 | 1,798.0 | |||||||||
| Central America(2) |
167.8 | 163.6 | 155.6 | |||||||||
| South America (excluding Venezuela) |
||||||||||||
| Colombia |
320.0 | 298.4 | 275.7 | |||||||||
| Brazil(3) |
693.6 | 733.5 | 525.2 | |||||||||
| Argentina |
233.9 | 225.8 | 227.1 | |||||||||
| Venezuela |
235.6 | 241.1 | 222.9 | |||||||||
| Consolidated Volume |
3,435.6 | 3,417.3 | 3,204.5 | |||||||||
| (1) | Includes volume from the operations of Grupo Yoli from June 2013, Companhia Fluminense from September 2013 and Spaipa from November 2013. |
| (2) | Includes Guatemala, Nicaragua, Costa Rica and Panama. |
| (3) | Excludes beer sales volume. |
27
The number of transactions reported by Coca-Cola FEMSA grew 0.7% to 20,279.6 million in 2015 as compared to 2014. Excluding Coca-Cola FEMSA’s Venezuelan operations, the number of transactions reported by Coca-Cola FEMSA in 2015 would have grown 1.1% to 18,961.5 million as compared to 2014. On the same basis, transactions reported by Coca-Cola FEMSA’s sparkling beverage portfolio in 2015 would have grown 0.4% as compared to 2014, mainly driven by the positive performance in Mexico, Colombia, Argentina and Central America; transactions reported for Coca-Cola FEMSA’s still beverage category would have grown 6.0% as compared to 2014, mainly driven by Colombia, Mexico and Argentina; and transactions reported for bottled water, including bulk water, would have grown 1.6% as compared to 2014, driven by the performance of Colombia and Argentina.
Product and Packaging Mix
From the more than 113 brands and line extensions of beverages that Coca-Cola FEMSA sells and distributes, Coca-Cola FEMSA’s most important brand, Coca-Cola, together with its line extensions, Coca-Cola Light, Coca-Cola Life and Coca-Cola Zero, accounted for 60.8% of total sales volume in 2015. Coca-Cola FEMSA’s next largest brands, Ciel (a water brand from Mexico and its line extensions), Fanta (and its line extensions), Sprite (and its line extensions) and ValleFrut (and its line extensions) accounted for 11.1%, 4.7%, 2.9% and 2.9%, respectively, of total sales volume in 2015. Coca-Cola FEMSA uses the term line extensions to refer to the different flavors and low-calorie versions in which it offers its brands. Coca-Cola FEMSA produces, markets, sells and distributes Coca-Cola trademark beverages in each of its territories in containers authorized by The Coca-Cola Company, which consist of a variety of returnable and non-returnable presentations in the form of glass bottles, cans and plastic bottles mainly made of polyethylene terephthalate, which we refer to as PET.
Coca-Cola FEMSA uses the term presentation to refer to the packaging unit in which it sells its products. Presentation sizes for Coca-Cola FEMSA’s Coca-Cola trademark beverages range from a 6.5-ounce personal size to a 3-liter multiple serving size. For all of Coca-Cola FEMSA’s products excluding water, Coca-Cola FEMSA considers a multiple serving size as equal to, or larger than, 1.0 liter. In general, personal sizes have a higher price per unit case as compared to multiple serving sizes. Coca-Cola FEMSA offers both returnable and non-returnable presentations, which allow it to offer portfolio alternatives based on convenience and affordability to implement revenue management strategies and to target specific distribution channels and population segments in its territories. In addition, Coca-Cola FEMSA sells some Coca-Cola trademark beverage syrups in containers designed for soda fountain use, which we refer to as fountain. Coca-Cola FEMSA also sells bottled water products in bulk sizes, which refer to presentations equal to or larger than 5.0 liters, which have a much lower average price per unit case than its other beverage products.
The characteristics of Coca-Cola FEMSA’s territories are very diverse. Central Mexico and Coca-Cola FEMSA’s territories in Argentina are densely populated and have a large number of competing beverage brands as compared to the rest of its territories. Coca-Cola FEMSA’s territories in Brazil are densely populated but have lower consumption of beverage products as compared to Mexico. Portions of southern Mexico, Central America and Colombia are large and mountainous areas with lower population density, lower per capita income and lower consumption of beverages. In Venezuela, Coca-Cola FEMSA faces operational disruptions from time to time, which may have an effect on its volumes sold, and consequently, may result in lower consumption.
The following discussion analyzes Coca-Cola FEMSA’s product and packaging mix by its consolidated reporting segments. The volume data presented is for the years 2015, 2014 and 2013.
Mexico and Central America. Coca-Cola FEMSA’s product portfolio consists of Coca-Cola trademark beverages, including the Jugos del Valle line of juice-based beverages.
28
The following table highlights historical sales volume and mix in Mexico and Central America for Coca-Cola FEMSA’s products:
| Year Ended December 31, | ||||||||||||
| 2015 | 2014 | 2013(1) | ||||||||||
| (in percentages, except for total sales volumes) | ||||||||||||
| Total Sales Volume |
||||||||||||
| Total (millions of unit cases) |
1,952.4 | 1,918.5 | 1,953.6 | |||||||||
| Growth |
1.8 | (1.8 | ) | 4.4 | ||||||||
| Unit Case Volume Mix by Category |
||||||||||||
| Sparkling beverages |
74.0 | 73.2 | 73.1 | |||||||||
| Water(2) |
20.2 | 21.3 | 21.2 | |||||||||
| Still beverages |
5.8 | 5.5 | 5.7 | |||||||||
| Total |
100.0 | 100.0 | 100.0 | |||||||||
| (1) | Includes volume from the operations of Grupo Yoli from June 2013. |
| (2) | Includes bulk water volumes. |
In 2015, multiple serving presentations represented 64.6% of total sparkling beverages sales volume in Mexico, a 10 basis points increase compared to 2014; and 55.0% of total sparkling beverages sales volume in Central America, a 30 basis points decrease compared to 2014. Coca-Cola FEMSA’s strategy is to foster consumption of single serve presentations while maintaining multiple serving volumes. In 2015, returnable packaging, as a percentage of total sparkling beverage sales volume accounted for 36.5% in Mexico, a 140 basis points decrease as compared to 2014; and 37.6% in Central America, a 280 basis points increase as compared to 2014.
In 2015, Coca-Cola FEMSA’s sparkling beverages volume as a percentage of total sales volume in its Mexico and Central America division increased marginally to 74.0% as compared with 2014.
Total sales volume in Coca-Cola FEMSA’s Mexico and Central America division reached 1,952.4 million unit cases in 2015, an increase of 1.8% compared to 1,918.5 million unit cases in 2014. The sales volume for Coca-Cola FEMSA’s sparkling beverage category increased 3.0%, mainly driven by the performance of Coca-Cola brand products. Coca-Cola FEMSA’s bottled water portfolio, including bulk water, decreased 3.5% mainly driven by a contraction of the Ciel brand in Mexico. Coca-Cola FEMSA’s still beverage category grew 5.8% mainly due to the performance of the Jugos del Valle portfolio, the Powerade brand and our Santa Clara dairy business in Mexico.
In 2014, multiple serving presentations represented 64.5% of total sparkling beverages sales volume in Mexico, a 170 basis points decrease compared to 2013; and 54.7% of total sparkling beverages sales volume in Central America, a 16 basis points decrease compared to 2013. Coca-Cola FEMSA’s strategy is to foster consumption of single serve presentations while maintaining multiple serving volumes. In 2014, returnable packaging, as a percentage of total sparkling beverage sales volume accounted for 37.9% in Mexico, a 290 basis points increase as compared to 2013; and 34.8% in Central America, a 150 basis points increase as compared to 2013.
In 2014, Coca-Cola FEMSA’s sparkling beverages volume as a percentage of total sales volume in its Mexico and Central America division increased marginally to 73.2% as compared with 2013.
Total sales volume in Coca-Cola FEMSA’s Mexico and Central America division (including Grupo Yoli) reached 1,918.5 million unit cases in 2014, a decrease of 1.8% compared to 1,953.6 million unit cases in 2013. The sales volume for Coca-Cola FEMSA’s sparkling beverage category decreased 1.6%, mainly driven by the impact of price increase to compensate the excise tax to sweetened beverages. Coca-Cola FEMSA’s bottled water portfolio, excluding bulk water, grew 4.2%, mainly driven by the performance of the Ciel brand in Mexico. Coca-Cola FEMSA’s still beverage category decreased 5.5% mainly due to the performance of the Jugos del Valle portfolio in the division. Organically, excluding the non-comparable effect of Grupo Yoli in 2014, total sales volume for Mexico and Central America division reached 1,878.9 million unit cases in 2014, a decrease of 3.8% as compared to 2013. On the same basis, Coca-Cola FEMSA’s sparkling beverage category decreased 3.9%, its bottled water portfolio, excluding bulk water, remained flat, and its still beverage category decreased 7.1%.
29
In 2013, multiple serving presentations represented 66.2% of total sparkling beverages sales volume in Mexico (including Grupo Fomento Queretano and Grupo Yoli), a 10 basis points decrease compared to 2012; and 56.3% of total sparkling beverages sales volume in Central America, a 50 basis points increase compared to 2012. In 2013, returnable packaging, as a percentage of total sparkling beverage sales volume, accounted for 35.0% in Mexico (including Grupo Fomento Queretano and Grupo Yoli), a 160 basis points increase compared to 2012; and 33.3% in Central America, a 30 basis points decrease compared to 2012.
In 2013, Coca-Cola FEMSA’s sparkling beverages volume as a percentage of total sales volume in its Mexico and Central America division (including Grupo Fomento Queretano and Grupo Yoli) increased marginally to 73.1% as compared with 2012.
Total sales volume in Coca-Cola FEMSA’s Mexico and Central America division (including Grupo Fomento Queretano and Grupo Yoli) reached 1,953.6 million unit cases in 2013, an increase of 4.4% compared to 1,871.5 million unit cases in 2012. The integration of Grupo Fomento Queretano and Grupo Yoli in Mexico contributed 89.3 million unit cases in 2013 of which sparkling beverages were 72.2%, water was 9.9%, bulk water was 13.4% and still beverages were 4.5%. Excluding the integration of these territories, volume decreased 0.4% to 1,864.2 million unit cases. Organically, Coca-Cola FEMSA’s bottled water portfolio grew 5.1%, mainly driven by the performance of the Ciel brand in Mexico. On the same basis, Coca-Cola FEMSA’s still beverage category grew 3.7% mainly due to the performance of the Jugos del Valle portfolio in the division. These increases partially compensated for the flat volumes in sparkling beverages and a 3.5% decline in the bulk water business.
South America (Excluding Venezuela). Coca-Cola FEMSA’s product portfolio in South America consists mainly of Coca-Cola trademark beverages, including the Jugos del Valle line of juice-based beverages in Colombia and Brazil, and the Heineken beer brands, including Kaiser beer brands, in Brazil, which Coca-Cola FEMSA sells and distributes.
During 2013, as part of Coca-Cola FEMSA’s efforts to foster sparkling beverage consumption in Brazil, Coca-Cola FEMSA reinforced the 2.0-liter returnable plastic bottle for the Coca-Cola brand and introduced two single-serve 0.2 and 0.3 liter presentations. During 2014, in an effort to increase sales in its still beverage portfolio in the region, Coca-Cola FEMSA reinforced its Jugos del Valle line of business and Powerade brand.
The following table highlights historical total sales volume and sales volume mix in South America (excluding Venezuela), not including beer:
| Year Ended December 31, | ||||||||||||
| 2015 | 2014 | 2013(1) | ||||||||||
| (in percentages, except for total sales volumes) | ||||||||||||
| Total Sales Volume |
||||||||||||
| Total (millions of unit cases) |
1,247.6 | 1,257.7 | 1,028.1 | |||||||||
| Growth |
(0.8 | ) | 22.6 | 6.3 | ||||||||
| Unit Case Volume Mix by Category |
||||||||||||
| Sparkling beverages |
82.8 | 84.1 | 84.1 | |||||||||
| Water(2) |
10.4 | 9.7 | 10.1 | |||||||||
| Still beverages |
6.8 | 6.2 | 5.8 | |||||||||
|
|
|
|
|
|
|
|||||||
| Total |
100.0 | 100.0 | 100.0 | |||||||||
| (1) | Includes volume from the operations of Companhia Fluminense from September 2013 and Spaipa from November 2013. |
| (2) | Includes bulk water volumes. |
Total sales volume in Coca-Cola FEMSA’s South America division, excluding Venezuela, decreased 0.8% to 1,247.6 million unit cases in 2015 as compared to 2014, as a result of a volume contraction in Brazil which was partially compensated by volume growth in Colombia and Argentina. The still beverage category grew 7.5%,
30
mainly driven by the Jugos del Valle line of business in Colombia and the Cepita and Hi-C brands in Argentina. Coca-Cola FEMSA’s sparkling portfolio decreased 2.3% mainly driven by the volume contraction in Brazil. Coca-Cola FEMSA’s bottled water portfolio, including bulk water, increased 7.5% driven by the performance of the Aquarius, Kin and Bonaqua brands in Argentina, the Manantial and Brisa brands in Colombia, and the Crystal brand in Brazil.
In 2015, returnable packaging, as a percentage of total sparkling beverage sales volume, accounted for 29.1% in Colombia, a decrease of 290 basis points as compared to 2014; 22.4% in Argentina, an increase of 270 basis points and 16.9% in Brazil a 140 basis points increase as compared to 2014. In 2015, multiple serving presentations represented 70.6%, 84.5% and 75.7% of total sparkling beverages sales volume in Colombia, Argentina and Brazil, respectively.
Total sales volume in Coca-Cola FEMSA’s South America division, excluding Venezuela, increased 22.6% to 1,257.7 million unit cases in 2014 as compared to 2013, as a result of stronger sales volumes in its recently integrated territories in Brazil and better volume performance in Colombia. The still beverage category grew 31.8%, mainly driven by the Jugos del Valle line of business in Colombia and Brazil and the performance of FUZE tea and Leão tea in the division. Coca-Cola FEMSA’s sparkling portfolio increased 22.6% mainly driven by the performance of the Coca-Cola brand and other core products in its operations. Coca-Cola FEMSA’s bottled water portfolio, including bulk water, increased 16.9% driven by performance of the Bonaqua brand in Argentina and the Crystal brand in Brazil. Organically, excluding the non-comparable effect of Companhia Fluminense and Spaipa in 2014, total sales volume in South America division excluding Venezuela, increased 3.7% as compared to 2013. On the same basis, Coca-Cola FEMSA’s still beverage category grew 15.3% mainly driven by the Jugos del Valle line of business in the region, its bottled water portfolio, including bulk water, increased 6.9% mainly driven by the performance of the Crystal brand in Brazil, and its sparkling beverage category increased 2.5%.
In 2014, returnable packaging, as a percentage of total sparkling beverage sales volume, accounted for 32.0% in Colombia, a decrease of 520 basis points as compared to 2013; 19.7% in Argentina, a decrease of 230 basis points; and 15.5% in Brazil, a 50 basis points decrease compared to 2013. In 2014, multiple serving presentations represented 69.8%, 85.3% and 75.0% of total sparkling beverages sales volume in Colombia, Argentina and Brazil, respectively.
Total sales volume in Coca-Cola FEMSA’s South America division, excluding Venezuela, increased 6.3% to 1,028.1 million unit cases in 2013 as compared to 2012, as a result of growth in Colombia and Argentina and the integration of Companhia Fluminense and Spaipa in its Brazilian territories. These effects compensated for an organic volume decline in Brazil. Organically, excluding the non-comparable effect of Companhia Fluminense and Spaipa, volumes remained flat as compared with the previous year. On the same basis, the still beverage category grew 14.3%, mainly driven by the Jugos del Valle line of business in Colombia and Brazil and the performance of FUZE tea in the division. Coca-Cola FEMSA’s bottled water portfolio, including bulk water, increased 3.8% mainly driven by the Bonaqua brand in Argentina and the Brisa brand in Colombia. These increases compensated for a 1.2% decline in the sparkling beverage portfolio.
In 2013, returnable packaging, as a percentage of total sparkling beverage sales volume, accounted for 37.2% in Colombia, a decrease of 320 basis points as compared to 2012; 22.0% in Argentina, a decrease of 690 basis points; and 16.0% in Brazil, excluding the non-comparable effect of Companhia Fluminense and Spaipa, a 170 basis points increase compared to 2012. In 2013, multiple serving presentations represented 66.7%, 85.2% and 72.9% of total sparkling beverages sales volume in Colombia, Argentina and Brazil on an organic basis, respectively.
Coca-Cola FEMSA continues to distribute and sell the Heineken beer portfolio, including Kaiser beer brands, in its Brazilian territories through the 20-year term, consistent with the arrangements in place since 2003 with Cervejarias Kaiser, a subsidiary of the Heineken Group. Beginning in the second quarter of 2005, Coca-Cola FEMSA ceased including beer that it distributes in Brazil in its reported sales volumes.
31
Venezuela. Coca-Cola FEMSA’s product portfolio in Venezuela consists of Coca-Cola trademark beverages. The following table highlights historical total sales volume and sales volume mix in Venezuela:
| Year Ended December 31, | ||||||||||||
| 2015 | 2014 | 2013 | ||||||||||
| (in percentages, except for total sales volumes) | ||||||||||||
| Total Sales Volume |
||||||||||||
| Total (millions of unit cases) |
235.6 | 241.1 | 222.9 | |||||||||
| Growth |
(2.3 | ) | 8.2 | 7.3 | ||||||||
| Unit Case Volume Mix by Category |
||||||||||||
| Sparkling beverages |
86.2 | 85.7 | 85.6 | |||||||||
| Water(1) |
6.8 | 6.5 | 6.9 | |||||||||
| Still beverages |
7.0 | 7.8 | 7.5 | |||||||||
|
|
|
|
|
|
|
|||||||
| Total |
100.0 | 100.0 | 100.0 | |||||||||
| (1) | Includes bulk water volumes. |
Coca-Cola FEMSA has implemented a product portfolio rationalization strategy that allows it to minimize the impact of certain operating disruptions that have been recurrent in Venezuela over the last several years related to difficulties in accessing raw materials due to the delay in obtaining the corresponding import authorizations and the Venezuelan exchange controls. In addition, from time to time, Coca-Cola FEMSA experiences operating disruptions due to prolonged negotiations of collective bargaining agreements.
Total sales volume decreased 2.3% to 235.6 million unit cases in 2015, as compared to 241.1 million unit cases in 2014. The sales volume in the sparkling beverage category decreased 2.1%, driven by a contraction in our flavored sparkling beverage portfolio, which was partially compensated by the positive performance of the Coca-Cola brand, which grew 3.4%. The bottled water business, including bulk water, grew 6.1% mainly driven by the Nevada brand. The still beverage category decreased 11.3%.
In 2015, multiple serving presentations represented 82.4% of total sparkling beverages sales volume in Venezuela, a 50 basis points increase as compared to 2014. In 2015, returnable presentations represented 6.9% of total sparkling beverages sales volume in Venezuela, which remained flat as compared to 2014.
Total sales volume increased 8.2% to 241.1 million unit cases in 2014, as compared to 222.9 million unit cases in 2013. The sales volume in the sparkling beverage category grew 8.3%, driven by the strong performance of the Coca-Cola brand, which grew 15.3%. The bottled water business, including bulk water, grew 1.6% mainly driven by the Nevada brand. The still beverage category increased 10.8%, due to the performance of the Del Valle Fresh orangeade and Powerade brand.
In 2014, multiple serving presentations represented 81.9% of total sparkling beverages sales volume in Venezuela, a 100 basis points increase as compared to 2013. In 2014, returnable presentations represented 6.9% of total sparkling beverages sales volume in Venezuela, a 20 basis points increase as compared to 2013.
Total sales volume increased 7.3% to 222.9 million unit cases in 2013, as compared to 207.7 million unit cases in 2012. The sales volume in the sparkling beverage category grew 4.5%, driven by the strong performance of the Coca-Cola brand, which grew 10.0%. The bottled water business, including bulk water, grew 33.2% mainly driven by the Nevada brand. The still beverage category increased 23.5%, due to the performance of the Del Valle Fresh orangeade and Kapo.
In 2013, multiple serving presentations represented 80.9% of total sparkling beverages sales volume in Venezuela, a 100 basis points increase compared to 2012. In 2013, returnable presentations represented 6.8% of total sparkling beverages sales volume in Venezuela, an 80 basis points decrease compared to 2012.
32
Seasonality
Sales of Coca-Cola FEMSA’s products are seasonal, as its sales volumes generally increase during the summer of each country and during the year-end holiday season. In Mexico, Central America, Colombia and Venezuela, Coca-Cola FEMSA typically achieves its highest sales during the summer months of April through September as well as during the year-end holidays in December. In Brazil and Argentina, Coca-Cola FEMSA’s highest sales levels occur during the summer months of October through March and the year-end holidays in December.
Marketing
Coca-Cola FEMSA, in conjunction with The Coca-Cola Company, has developed a marketing strategy to promote the sale and consumption of its products. Coca-Cola FEMSA relies extensively on advertising, sales promotions and retailer support programs to target the particular preferences of its consumers. Coca-Cola FEMSA’s consolidated marketing expenses in 2015, net of contributions by The Coca-Cola Company, were Ps. 3,447 million. The Coca-Cola Company contributed an additional Ps. 3,749 million in 2015, which mainly includes contributions for coolers, bottles and cases. Through the use of advanced information technology, Coca-Cola FEMSA has collected customer and consumer information that allow it to tailor its marketing strategies to target different types of customers located in each of its territories and to meet the specific needs of the various markets it serves.
Retailer Support Programs. Support programs include providing retailers with point-of-sale display materials and consumer sales promotions, such as contests, sweepstakes and the giveaway of product samples.
Coolers. Coolers play an integral role in Coca-Cola FEMSA’s clients’ plans for success. Increasing both cooler coverage and the number of cooler doors among its retailers is important to ensure that Coca-Cola FEMSA’s wide variety of products are properly displayed, while strengthening its merchandising capacity in the traditional sales channel to significantly improve its point-of-sale execution.
Advertising. Coca-Cola FEMSA advertises in all major communications media. Coca-Cola FEMSA focuses its advertising efforts on increasing brand recognition by consumers and improving its customer relations. National advertising campaigns are designed and proposed by The Coca-Cola Company’s local affiliates in the countries where Coca-Cola FEMSA operates, with Coca-Cola FEMSA’s input at the local or regional level. Point-of-sale merchandising and advertising efforts are proposed and implemented by Coca-Cola FEMSA, with a focus on increasing its connection with customers and consumers.
Channel Marketing. In order to provide more dynamic and specialized marketing of its products, Coca-Cola FEMSA’s strategy is to classify its markets and develop targeted efforts for each consumer segment or distribution channel. Coca-Cola FEMSA’s principal channels are small retailers, “on-premise” consumption such as restaurants and bars, supermarkets and third party distributors. Presence in these channels entails a comprehensive and detailed analysis of the purchasing patterns and preferences of various groups of beverage consumers in each of the different types of locations or distribution channels. In response to this analysis, Coca-Cola FEMSA tailors its product, price, packaging and distribution strategies to meet the particular needs of and exploit the potential of each channel.
Multi-Segmentation. Coca-Cola FEMSA has implemented a multi-segmentation strategy in all of its markets. These strategies consist of the implementation of different product/price/package portfolios by market cluster or group. These clusters are defined based on consumption occasion, competitive environment and income level, rather than solely on the types of distribution channels.
Client Value Management. Coca-Cola FEMSA continues transforming its commercial models to focus on its customers’ value potential using a value-based segmentation approach to capture the industry’s potential. Coca-Cola FEMSA started the rollout of this new model in its Mexico, Central America, Colombia and Brazil operations in 2009. At the end of 2015, Coca-Cola FEMSA had successfully transformed the commercial models in all of its territories.
Coca-Cola FEMSA believes that the implementation of these strategies described above also enables it to respond to competitive initiatives with channel-specific responses as opposed to market-wide responses.
33
In addition, it allows Coca-Cola FEMSA to be more efficient in the way it goes to market and invests its marketing resources in those segments that could provide a higher return. Coca-Cola FEMSA’s marketing, segmentation and distribution activities are facilitated by its management information systems and are all incorporated within its recently created centers of excellence.
Centers of Excellence. Coca-Cola FEMSA’s centers of excellence focus on manufacturing, distribution and logistics, commercial, and IT innovation areas. These centers not only enable centralized collaboration and knowledge sharing, but also drive standards of excellence and best practices in its key strategic capabilities.
Manufacturing Center of Excellence. This center focuses on developing industry-leading operating models, practices and processes mainly by reducing operating costs, increasing efficiency and productivity of Coca-Cola FEMSA’s manufacturing assets, minimizing waste disposal by optimizing the materials used in Coca-Cola FEMSA’s manufacturing processes, and promoting high industrial quality and product safety. We are in the process of developing a Manufacturing Execution System, a new digital platform that will enable us to map and monitor performance at Coca-Cola FEMSA’s plants, including critical data from Coca-Cola FEMSA’s production equipment and processes.
Distribution and Logistics Center of Excellence. This center seeks to ensure best-in-class customer service by optimizing performance in Coca-Cola FEMSA’s supply chain, transport engineering and equipment design, warehouse management and secondary distribution.
Commercial Center of Excellence. This center is designed to develop expertise and promote excellence across key commercial areas. The center establishes and aligns Coca-Cola FEMSA’s commercial views across key functional areas; identifies and replicates best commercial practices and processes, develops and enforces commercial performance standards; and drives innovation across Coca-Cola FEMSA’s commercial activities.
IT Innovation Center of Excellence. This center is established to support Coca-Cola FEMSA’s other centers of excellence by developing a comprehensive technological platform to create and foster innovative processes, technologies and capabilities to centralize information and promote knowledge sharing across Coca-Cola FEMSA’s strategic areas.
Product Sales and Distribution
The following table provides an overview of Coca-Cola FEMSA’s distribution centers and the retailers to which it sells its products:
| As of December 31, 2015 | ||||||||||||
| Mexico and Central America(1) |
South America(2) | Venezuela | ||||||||||
| Distribution centers |
174 | 67 | 33 | |||||||||
| Retailers(3) |
966,773 | 829,703 | 176,503 | |||||||||
| (1) | Includes Mexico, Guatemala, Nicaragua, Costa Rica and Panama. |
| (2) | Includes Colombia, Brazil and Argentina. |
| (3) | Estimated. |
Coca-Cola FEMSA continuously evaluates its distribution model in order to fit with the local dynamics of the marketplace and analyze the way it goes to market, recognizing different service needs from its customers, while looking for a more efficient distribution model. As part of this strategy, Coca-Cola FEMSA is rolling out a variety of new distribution models throughout its territories looking for improvements in its distribution network.
Coca-Cola FEMSA uses several sales and distribution models depending on market, geographic conditions and the customer’s profile: (i) the pre-sale system, which separates the sales and delivery functions, permitting trucks to be loaded with the mix of products that retailers have previously ordered, thereby increasing both sales and distribution efficiency; (ii) the conventional truck route system, in which the person in charge of the delivery makes immediate sales from inventory available on the truck; (iii) a hybrid distribution system, where the same truck carries product available for immediate sale and product previously ordered through the pre-sale system; (iv) the telemarketing system, which could be combined with pre-sales visits; and (v) sales through third-party wholesalers of Coca-Cola FEMSA’s products.
As part of the pre-sale system, sales personnel also provide merchandising services during retailer visits, which Coca-Cola FEMSA believes enhance the shopper experience at the point of sale. Coca-Cola FEMSA believes that an adequate number of service visits to retailers and frequency of deliveries are essential elements in an effective selling and distribution system for its products.
Coca-Cola FEMSA’s distribution centers range from large warehousing facilities and re-loading centers to small deposit centers. In addition to Coca-Cola FEMSA’s fleet of trucks, Coca-Cola FEMSA distributes its products in certain locations through electric carts and hand-trucks in order to comply with local environmental and traffic regulations. In some of Coca-Cola FEMSA’s territories, it retains third parties to transport its finished products from the bottling plants to the distribution centers.
Mexico. Coca-Cola FEMSA contracts with one of our subsidiaries for the transportation of finished products to its distribution centers from its production facilities. From the distribution centers, Coca-Cola FEMSA then distributes its finished products to retailers through its own fleet of trucks.
In Mexico, Coca-Cola FEMSA sells a majority of its beverages at small retail stores to consumers who may take the beverages for consumption at home or elsewhere. Coca-Cola FEMSA also sells products through the “on-premise” consumption segment, supermarkets and other locations. The “on-premise” consumption segment consists of sales through sidewalk stands, restaurants, bars and various types of dispensing machines as well as sales through point-of-sale programs in stadiums, concert halls, auditoriums and theaters.
34
Brazil. In Brazil, Coca-Cola FEMSA sold 33.4% of its total sales volume through modern distribution channels in 2015. Also in Brazil, Coca-Cola FEMSA distributes its finished products to retailers through a combination of its own fleet of trucks and third party distributors, while Coca-Cola FEMSA maintains control over the selling function. In designated zones in Brazil, third-party distributors purchase its products at a discount from the wholesale price and resell the products to retailers.
Territories other than Mexico and Brazil. Coca-Cola FEMSA distributes its finished products to retailers through a combination of its own fleet of trucks and third party distributors. In most of Coca-Cola FEMSA’s territories, an important part of its total sales volume is sold through small retailers, with low supermarket penetration.
Competition
Although Coca-Cola FEMSA believes that its products enjoy wider recognition and greater consumer loyalty than those of its principal competitors, the markets in the territories where Coca-Cola FEMSA operates are highly competitive. Coca-Cola FEMSA’s principal competitors are local Pepsi bottlers and other bottlers and distributors of local beverage brands. Coca-Cola FEMSA faces increased competition in many of its territories from producers of low price beverages, commonly referred to as “B brands.” A number of Coca-Cola FEMSA’s competitors in Central America, Venezuela, Brazil and Argentina offer beer in addition to sparkling beverages, still beverages, and water, which may enable them to achieve distribution efficiencies.
Although competitive conditions are different in each of its territories, Coca-Cola FEMSA competes principally in terms of price, packaging, effective promotional activities, access to retail outlets and sufficient shelf space, customer service, product innovation and product alternatives and the ability to identify and satisfy consumer preferences. Coca-Cola FEMSA competes by seeking to offer products at an attractive price in the different segments in its markets and by building on the value of its brands. Coca-Cola FEMSA believes that the introduction of new products and new presentations has been a significant competitive technique that allows it to increase demand for its products, provide different options to consumers and increase new consumption opportunities. See “Information on the Company—Coca-Cola FEMSA—Product and Packaging Mix.”
Mexico and Central America. Coca-Cola FEMSA’s principal competitors in Mexico are bottlers of Pepsi products, whose territories overlap but are not co-extensive with its own. Coca-Cola FEMSA competes with Organización Cultiba, S.A.B. de C.V., a joint venture formed by Grupo Embotelladoras Unidas, S.A.B. de C.V., the former Pepsi bottler in central and southeast Mexico, a subsidiary of PepsiCo, and Empresas Polar, S.A., the leading beer distributor and Pepsi bottler in Venezuela. Coca-Cola FEMSA’s main competition in the juice category in Mexico is Grupo Jumex. In the water category, Bonafont, a water brand owned by Grupo Danone, is Coca-Cola FEMSA’s main competition. In addition, Coca-Cola FEMSA competes with Cadbury Schweppes in sparkling beverages and with other national and regional brands in its Mexican territories, as well as “B brand” producers, such as Ajemex, S.A. de C.V. and Consorcio AGA, S.A. de C.V., that offer various presentations of sparkling and still beverages.
In the countries that comprise Coca-Cola FEMSA’s Central America region, its main competitors are Pepsi and Big Cola bottlers. In Guatemala and Nicaragua, Coca-Cola FEMSA competes with a joint venture between AmBev and The Central American Bottler Corporation. In Costa Rica, Coca-Cola FEMSA’s principal competitor is Florida Bebidas S.A., subsidiary of Florida Ice and Farm Co. In Panama, Coca-Cola FEMSA’s main competitor is Cervecería Nacional, S.A. Coca-Cola FEMSA also faces competition from “B brands” offering multiple serving size presentations in some Central American countries.
South America (excluding Venezuela). Coca-Cola FEMSA’s principal competitor in Colombia is Postobón, a well-established local bottler that sells flavored sparkling beverages (under the brands Postobón and Colombiana), some of which have a wide consumption preference, such as manzana Postobón (apple Postobón), which is the second most popular flavor in the Colombian sparkling beverage industry in terms of total sales volume. Postobón also sells Pepsi products. Postobón is a vertically integrated producer, the owners of which hold other significant commercial interests in Colombia. Coca-Cola FEMSA also competes with low-price producers, such as the producers of Big Cola, which principally offer multiple serving size presentations in the sparkling and still beverage industry.
35
In Brazil, Coca-Cola FEMSA competes against AmBev, a Brazilian company with a portfolio of brands that includes Pepsi, local brands with flavors such as guarana, and proprietary beer brands. Coca-Cola FEMSA also competes against “B brands” or “Tubainas,” which are small, local producers of low-cost flavored sparkling beverages that represent a significant portion of the sparkling beverage market.
In Argentina, Coca-Cola FEMSA’s main competitor is Buenos Aires Embotellador S.A., or BAESA, a Pepsi bottler, which is owned by Argentina’s principal brewery, Quilmes Industrial S.A., and indirectly controlled by AmBev. In addition, Coca-Cola FEMSA competes with a number of competitors offering generic, low-priced sparkling beverages as well as many other generic products and private label proprietary supermarket brands.
Venezuela. In Venezuela, Coca-Cola FEMSA’s main competitor is Pepsi-Cola Venezuela, C.A., a joint venture formed between PepsiCo and Empresas Polar, S.A., the leading beer distributor in the country. Coca-Cola FEMSA also competes with the producers of Big Cola in part of this country.
Raw Materials
Pursuant to its bottler agreements, Coca-Cola FEMSA is authorized to manufacture, sell and distribute Coca-Cola trademark beverages within specific geographic areas, and Coca-Cola FEMSA is required to purchase concentrate for all Coca-Cola trademark beverages in all of its territories from companies designated by The Coca-Cola Company and sweeteners and other raw materials from companies authorized by The Coca-Cola Company. Concentrate prices for Coca-Cola trademark beverages are determined as a percentage of the weighted average retail price in local currency net of applicable taxes. Although The Coca-Cola Company has the right to unilaterally set the price of concentrates, in practice this percentage has historically been set pursuant to periodic negotiations with The Coca-Cola Company.
In the past, The Coca-Cola Company has increased concentrate prices for Coca-Cola trademark beverages in some of the countries where Coca-Cola FEMSA operates. In 2014, The Coca-Cola Company informed Coca-Cola FEMSA that it will gradually increase concentrate prices for certain Coca-Cola trademark beverages over a five-year period in Costa Rica and Panama beginning in 2014. In 2015, The Coca-Cola Company informed Coca-Cola FEMSA that it will gradually increase concentrate prices for flavored water over a four-year period in Mexico beginning in April 2015. Most recently, The Coca-Cola Company also informed Coca-Cola FEMSA that it will gradually increase concentrate prices for certain Coca-Cola trademark beverages over a two-year period in Colombia beginning in 2016. Based on Coca-Cola FEMSA’s estimates, it currently does not expect these increases to have a material adverse effect on its results of operation. The Coca-Cola Company may unilaterally increase concentrate prices again in the future and Coca-Cola FEMSA may not be successful in negotiating or implementing measures to mitigate the negative effect this may have in the prices of its products or its results.
In addition to concentrate, Coca-Cola FEMSA purchases sweeteners, carbon dioxide, resin and preforms to make plastic bottles, finished plastic and glass bottles, cans, caps and fountain containers, as well as other packaging materials and raw materials. Sweeteners are combined with water to produce basic syrup, which is added to the concentrate as the sweetener for most of Coca-Cola FEMSA’s beverages. Coca-Cola FEMSA’s bottler agreements provide that, with respect to Coca-Cola trademark beverages, these materials may be purchased only from suppliers approved by The Coca-Cola Company, including certain of our affiliates. Prices for certain raw materials, including those used in the bottling of Coca-Cola FEMSA’s products, mainly resin, preforms to make plastic bottles, finished plastic bottles, aluminum cans, HFCS and certain sweeteners, are paid in or determined with reference to the U.S. dollar, and therefore local prices in a particular country may increase based on changes in the applicable exchange rates. Coca-Cola FEMSA’s most significant packaging raw material costs arise from the purchase of resin and plastic preforms to make plastic bottles and from the purchase of finished plastic bottles, the prices of which are related to crude oil prices and global resin supply. The average prices that Coca-Cola FEMSA paid for resin and plastic preforms in U.S. dollars in 2015, as compared to 2014 decreased in all its territories; however, given that high currency volatility has affected and continues to affect most of Coca-Cola FEMSA’s territories, the average prices for resin and plastic preforms in local currencies were higher in 2015 in Mexico, Colombia, Venezuela and Brazil. Across Coca-Cola FEMSA’s territories, its average price for resin in U.S. dollars decreased 24.0% in 2015 as compared to 2014.
36
Under Coca-Cola FEMSA’s agreements with The Coca-Cola Company, it may use raw or refined sugar or HFCS as sweeteners in its products. Sugar prices in all of the countries where Coca-Cola FEMSA operates, other than Brazil, are subject to local regulations and other barriers to market entry that cause Coca-Cola FEMSA to pay in excess of international market prices for sugar in certain countries. In recent years, international sugar prices experienced significant volatility. Across Coca-Cola FEMSA’s territories, its average price for sugar in U.S. dollars decreased approximately 28% (12% excluding Venezuela) in 2015 as compared to 2014; however, the average price for sugar in local currency was higher in all of Coca-Cola FEMSA’s operations, except for Guatemala.
Coca-Cola FEMSA categorizes water as a raw material in its business. Coca-Cola FEMSA obtains water for the production of some of its natural spring water products, such as Manantial in Colombia and Crystal in Brazil, from spring water pursuant to concessions granted.
None of the materials or supplies that Coca-Cola FEMSA uses is presently in short supply, although the supply of specific materials could be adversely affected by strikes, weather conditions, governmental controls, national emergency situations, water shortages or the failure to maintain its existing water concessions.
Mexico and Central America. In Mexico, Coca-Cola FEMSA purchases its returnable plastic bottles from Graham Packaging México, S.A. de C.V., known as Graham, which is the exclusive supplier of returnable plastic bottles for The Coca-Cola Company and its bottlers in Mexico. Coca-Cola FEMSA mainly purchases resin from Indorama Ventures Polymers México, S. de R.L. de C.V. (formerly Arteva Specialties, S. de R.L. de C.V.), M&G Polímeros México, S.A. de C.V. and DAK Resinas Americas Mexico, S.A. de C.V., which Alpla México, S.A. de C.V., known as Alpla, and Envases Universales de México, S.A.P.I. de C.V. manufacture into non-returnable plastic bottles for Coca-Cola FEMSA. Also, Coca-Cola FEMSA has introduced into its business Asian global suppliers, such as Far Eastern New Century Corp., or FENC, which supports Coca-Cola FEMSA’s PET strategy mainly for Central America and is known as one of the top five PET global suppliers.
Coca-Cola FEMSA purchases all its cans from Fábricas de Monterrey, S.A. de C.V. and Envases Universales de México, S.A.P.I. de C.V., through Promotora Mexicana de Embotelladoras, S.A. de C.V., known as PROMESA, a cooperative of Coca-Cola bottlers, in which, as of March 4, 2016, Coca-Cola FEMSA held a 35.0% equity interest. Coca-Cola FEMSA mainly purchases its glass bottles from Vitro America, S. de R.L. de C.V. (formerly Compañía Vidriera, S.A. de C.V.), FEVISA Industrial, S.A. de C.V., and Glass & Silice, S.A. de C.V or SIVESA.
Coca-Cola FEMSA purchases sugar from, among other suppliers, PIASA and Beta San Miguel, S.A. de C.V., both sugar cane producers in which, as of March 4, 2016, Coca-Cola FEMSA held a 36.3% and 2.7% equity interest, respectively. Coca-Cola FEMSA purchases HFCS from Ingredion México, S.A. de C.V., Almidones Mexicanos, S.A. de C.V. and Cargill de México, S.A. de C.V.
Sugar prices in Mexico are subject to local regulations and other barriers to market entry that cause Coca-Cola FEMSA to pay higher prices than those paid in the international market. As a result, prices in Mexico have no correlation to international market prices. In 2015, sugar prices in local currency in Mexico increased approximately 9.0% as compared to 2014.
In Central America, the majority of Coca-Cola FEMSA’s raw materials such as glass and plastic bottles are purchased from several local suppliers. Coca-Cola FEMSA purchases all of its cans from PROMESA. Sugar is available from suppliers that represent several local producers. In Costa Rica, Coca-Cola FEMSA acquires plastic non-returnable bottles from Alpla C.R. S.A., and in Nicaragua Coca-Cola FEMSA acquires such plastic bottles from Alpla Nicaragua, S.A.
South America (excluding Venezuela). In Colombia, Coca-Cola FEMSA uses sugar as a sweetener in most of its products, which it buys from several domestic sources. Coca-Cola FEMSA purchases plastic bottles from Amcor Rigid Plastics de Colombia, S.A. and Tapón Corona de Colombia S.A. (affiliate of Envases Universales de México, S.A.P.I. de C.V.), and has historically purchased all of its glass bottles from Peldar O-I; however, it has engaged new suppliers and has recently acquired glass bottles from Al Tajir and Frigoglass in both cases from the United Arab Emirates. Coca-Cola FEMSA purchases all of its cans from Crown Colombiana, S.A., which are only available through this local supplier. Grupo Ardila Lulle, owners of Coca-Cola FEMSA’s competitor Postobón, own a minority equity interest in Peldar O-I and Crown Colombiana, S.A.
37
Sugar is available in Brazil at local market prices, which historically have been similar to international prices. Sugar prices in Brazil decreased approximately 12.0% in U.S. dollars and increased 26.0% in local currency, each as compared to 2014. Coca-Cola FEMSA purchases glass bottles, plastic bottles and cans from several domestic and international suppliers.
In Argentina, Coca-Cola FEMSA mainly uses HFCS that it purchases from several different local suppliers as a sweetener in its products. Coca-Cola FEMSA purchases glass bottles, plastic cases and other raw materials from several domestic sources. Coca-Cola FEMSA purchases plastic preforms, as well as returnable plastic bottles, at competitive prices from Andina Empaques S.A., a local subsidiary of Embotelladora Andina S.A., a Coca-Cola bottler with operations in Chile, Argentina, Brazil and Paraguay, and other local suppliers. Coca-Cola FEMSA also acquires plastic preforms from Alpla Avellaneda, S.A. and other suppliers, such as AMCOR Argentina.
Venezuela. In Venezuela, Coca-Cola FEMSA uses sugar as a sweetener in most of its products, which it purchase mainly from the local market. Since 2003, from time to time, Coca-Cola FEMSA has experienced a sugar shortage due to lower domestic production and the inability of the predominant sugar importers to obtain permission to import in a timely manner. While sugar distribution to the food and beverages industry and to retailers is controlled by the government, Coca-Cola FEMSA did not experience any material disruptions during 2015 with respect to access to sufficient sugar supply. However, we cannot assure you that Coca-Cola FEMSA will not experience disruptions in its ability to meet its sugar requirements in the future should the Venezuelan government impose restrictive measures. Coca-Cola FEMSA buys glass bottles from one local supplier, Productos de Vidrio, C.A., the only supplier authorized by The Coca-Cola Company. Coca-Cola FEMSA acquires most of its plastic non-returnable bottles from Alpla de Venezuela, S.A. and most of its aluminum cans from a local producer, Dominguez Continental, C.A.
Under current regulations promulgated by the Venezuelan authorities, Coca-Cola FEMSA’s ability and that of its suppliers to import some of the raw materials and other supplies used in its production could be limited, and access to the official exchange rate for these items, including, among others, concentrate, resin, aluminum, plastic caps, distribution trucks and vehicles is only achieved by obtaining proper approvals from the relevant authorities.
FEMSA Comercio
Overview and Background
FEMSA Comercio, through its Retail Division, operates the largest chain of small-format stores in Mexico, measured in terms of number of stores as of December 31, 2015, mainly under the trade name “OXXO.” As of December 31, 2015, FEMSA Comercio – Retail Division operated 14,061 OXXO stores, of which 14,015 are located throughout Mexico and the remaining 46 stores are located in Bogota, Colombia.
FEMSA Comercio – Retail Division was established by FEMSA in 1978 with the opening of two OXXO stores in Monterrey, Nuevo Leon, one store in Mexico City and another store in Guadalajara, Jalisco. The motivating factor behind FEMSA’s entrance into the retail industry was to enhance beer sales through company-owned retail outlets as well as to gather information on customer preferences. In 2015, a typical OXXO store carried 2,954 different stock keeping units (SKUs) in 31 main product categories.
In recent years, FEMSA Comercio – Retail Division has represented an effective distribution channel for our beverage products, as well as a rapidly growing point of contact with our consumers. Based on the belief that location plays a major role in the long-term success of a retail operation such as a small-format store, as well as a role in our ability to accelerate and streamline the new-store development process, FEMSA Comercio – Retail Division has focused on a strategy of rapid, profitable growth. FEMSA Comercio – Retail Division opened 1,208, 1,132 and 1,120 net new OXXO stores in 2015, 2014 and 2013, respectively. The accelerated expansion in the number of OXXO stores and the inorganic expansion in the drugstore markets in Mexico and Chile yielded total revenue growth of 21.2% to reach Ps. 132,891 million in 2015. OXXO same-store sales increased an average of 6.9%, driven by an increased average customer ticket and an increase in same-store traffic. OXXO stores performed approximately 3.7 billion transactions in 2015 compared to 3.4 billion transactions in 2014.
38
FEMSA Comercio – Fuel Division operates retail service stations for fuels, motor oils and other car care products. As of December 31, 2015, FEMSA Comercio – Fuel Division operates 307 service stations, concentrating mainly in the northern part of the country but with a presence in 14 different states throughout Mexico.
Since 1995, FEMSA Comercio has provided services and operated retail service stations for fuel, motor oils and other car care products through agreements with third parties that own PEMEX franchises, using the trade name “OXXO GAS.” Over time, this brand has become synonymous with quality service among our customers, and revenues per gas pump have consistently grown above those of the industry.
Historically, Mexican legislation precluded FEMSA Comercio from participating in the retail of gasoline, and therefore from owning PEMEX franchises, due to FEMSA’s foreign institutional investor base. In March 2015, following changes to the legal framework and considering the potential expansion and synergies arising from this business as part of Mexico’s energy reform, FEMSA Comercio began to acquire PEMEX’s service station franchises and to obtain permits from PEMEX to operate each of the franchises.
FEMSA Comercio – Retail Division
Business Strategy
FEMSA Comercio – Retail Division intends to continue increasing its store base while capitalizing on the retail business and market knowledge gained at existing stores. We intend to open new stores in locations where we believe there is high growth potential or unsatisfied demand, while also increasing customer traffic and average ticket per customer in existing stores. Our expansion strategy focuses on both entering new markets and strengthening our presence nationwide and across the different income levels of the population. A fundamental element of FEMSA Comercio – Retail Division’s business strategy is to leverage its retail store formats, know-how, technology and operational practices to continue growing in a cost-effective and profitable manner. This scalable business platform is expected to provide a strong foundation for continued organic growth, improving traffic and average ticket sales at our existing stores and facilitating entry into new small-format retail industries.
FEMSA Comercio – Retail Division has developed proprietary models to assist in identifying appropriate store locations, store formats and product categories. These models utilize location-specific demographic data and FEMSA Comercio – Retail Division’s experience in similar locations to fine-tune store formats, product price ranges and product offerings to the target market. Market segmentation is becoming an important strategic tool that is expected to allow FEMSA Comercio – Retail Division to improve the operating efficiency of each location, cover a wider array of consumption occasions and increase its overall profitability.
FEMSA Comercio – Retail Division continues to improve its information gathering and processing systems to allow it to connect with its customers at all levels and anticipate and respond efficiently to their changing demands and preferences. Most of the products carried through OXXO stores are bar-coded, and all OXXO stores are equipped with point-of-sale systems integrated into a company-wide computer network. To implement more effective business strategies, FEMSA Comercio – Retail Division created a department in charge of product category management, for products such as beverages, fast food and perishables, responsible for analyzing data gathered to better understand our customers, develop integrated marketing plans and allocate resources more efficiently. This department utilizes a technology platform supported by an enterprise resource planning (“ERP”) system, as well as other technological solutions such as merchandising and point-of-sale systems, which allow FEMSA Comercio – Retail Division to redesign and adjust its key operating processes and certain related business decisions. Our IT system also allows us to manage each store’s working capital, inventories and investments in a cost-effective way while maintaining high sales volume and store quality. Supported by continued investments in IT, our supply chain network allows us to optimize working capital requirements through inventory rotation and reduction, reducing out-of-stock days and other inventory costs.
39
FEMSA Comercio – Retail Division has adopted innovative promotional strategies in order to increase store traffic and sales. In particular, the OXXO stores sell high-frequency items such as beverages, snacks and cigarettes at competitive prices. FEMSA Comercio – Retail Division’s ability to implement this strategy profitably is partly attributable to the size of the OXXO stores chain, as such division is able to work together with its suppliers to implement their revenue-management strategies through differentiated promotions. OXXO stores’ national and local marketing and promotional strategies are an effective revenue driver and a means of reaching new segments of the population while strengthening the OXXO brand. For example, the organization has refined its expertise in executing cross promotions (discounts on multi-packs or sales of complementary products at a special price) and targeted promotions to attract new customer segments, by expanding the offerings in the grocery product category in certain stores.
Another fundamental element of our strategy consists of leveraging our reputation for quality and the position of our brand in the minds of our customers to expand our offering of private-label products. Our private-label products represent an alternative for value-conscious consumers, which, combined with our market position, allows FEMSA Comercio – Retail Division to increase sales and margins, strengthen customer loyalty and bolster its bargaining position with suppliers.
Finally, to further increase customer traffic into our stores, FEMSA Comercio – Retail Division is incorporating additional services, such as utility bill payment, remittances and prepayment of mobile phone fees and charges.
40
Store Locations
With 14,015 OXXO stores in Mexico and 46 OXXO stores in Colombia as of December 31, 2015, FEMSA Comercio – Retail Division operates the largest small-format store chain in Latin America measured by number of stores. FEMSA Comercio – Retail Division has expanded its operations by opening five net new OXXO stores in Bogota, Colombia in 2015.
OXXO Stores
Regional Allocation in Mexico and Latin America(*)
as of December 31, 2015
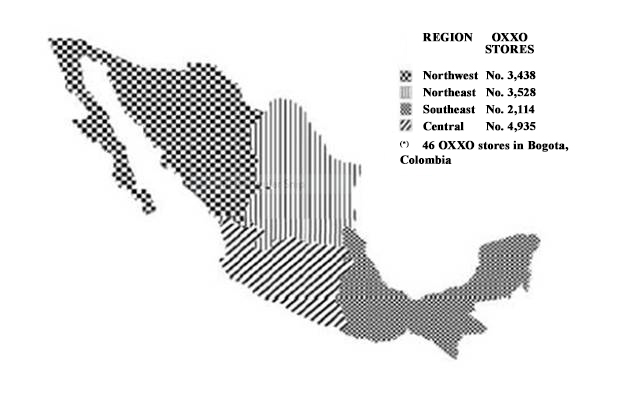
FEMSA Comercio – Retail Division has aggressively expanded its number of OXXO stores over the past several years. The average investment required to open a new OXXO store varies, depending on location and format and whether the store is opened in an existing retail location or requires construction of a new store. FEMSA Comercio – Retail Division is generally able to use supplier credit to fund the initial inventory of new OXXO stores.
OXXO Stores
Total Growth
| Year Ended December 31, | ||||||||||||||||||||
| 2015 | 2014 | 2013 | 2012 | 2011 | ||||||||||||||||
| Total OXXO stores |
14,061 | 12,853 | 11,721 | 10,601 | 9,561 | |||||||||||||||
| Store growth (% change over previous year) |
9.4 | % | 9.7 | % | 10.6 | % | 10.9 | % | 13.5 | % | ||||||||||
FEMSA Comercio – Retail Division currently expects to continue implementing its expansion strategy by emphasizing growth in areas of high economic potential in existing markets and by expanding in underserved and unexploited markets.
41
Most of the OXXO stores are operated under lease agreements, which are denominated in Mexican peso and adjusted annually to an inflation index. This approach provides FEMSA Comercio – Retail Division the flexibility to adjust locations as cities grow and to effectively adjust its footprint based on stores’ performance.
The identification of locations and pre-opening planning in order to optimize the results of new OXXO stores are important elements in FEMSA Comercio – Retail Division’s growth plan. FEMSA Comercio – Retail Division continuously reviews store performance against certain operating and financial benchmarks to optimize the overall performance of the chain. FEMSA Comercio – Retail Division stores unable to maintain benchmark standards are generally closed. Between December 31, 2011 and 2015, the total number of OXXO stores increased by 4,500, which resulted from the opening of 4,638 new stores and the closing of 138 stores.
Competition
FEMSA Comercio – Retail Division, mainly through OXXO stores, competes in the overall retail market, which we believe is highly competitive. OXXO stores face competition from small-format stores like 7-Eleven, Extra, Super City, Círculo K stores and other numerous chains of retailers across Mexico, from other regional small-format retailers to small informal neighborhood stores. OXXO competes both for consumers and for new locations for stores and human resources to operate those stores. FEMSA Comercio – Retail Division operates in each state in Mexico and has much broader geographic coverage than any of its competitors in Mexico.
Market and Store Characteristics
Market Characteristics
FEMSA Comercio – Retail Division is placing increased emphasis on market segmentation and differentiation of store formats to more appropriately serve the needs of customers on a location-by-location basis. The principal segments include residential neighborhoods, commercial and office locations and stores near schools and universities, along with other types of specialized locations.
Approximately 65.6% of OXXO stores’ customers are between the ages of 15 and 35. FEMSA Comercio – Retail Division also segments the market according to demographic criteria, including income level.
OXXO Store Characteristics
The average size of an OXXO store is approximately 104 square meters of selling space, excluding space dedicated to refrigeration, storage or parking. The average constructed area of a store is approximately 187 square meters and, when parking areas are included, the average store size is approximately 418 square meters.
FEMSA Comercio – Retail Division—Operating Indicators
| Year Ended December 31, | ||||||||||||||||||||
| 2015 | 2014 | 2013 | 2012 | 2011 | ||||||||||||||||
| (percentage increase compared to previous year) | ||||||||||||||||||||
| Total FEMSA Comercio – Retail Division revenues(1) |
21.2 | % | 12.4 | % | 12.9 | % | 16.6 | % | 19.0 | % | ||||||||||
| OXXO same-store sales(2) |
6.9 | % | 2.7 | % | 2.4 | % | 7.7 | % | 9.2 | % | ||||||||||
| (1) | Includes revenues of Farmacias Farmacon S.A. from June 2015, and Socofar from October 2015. See “Information on the Company—Corporate Background” and Note 4 to our audited consolidated financial statements. |
| (2) | Same-store sales growth is calculated by comparing the sales of stores for each year that have been in operation for more than 12 months with the sales of those same stores during the previous year. |
Beer, cigarettes, soft drinks and other beverages and snacks represent the main product categories for OXXO stores. FEMSA Comercio – Retail Division has a distribution agreement with Cuauhtémoc Moctezuma, pursuant to which OXXO stores only carry beer brands produced and distributed by Cuauhtémoc Moctezuma. OXXO stores will continue to benefit from the existing relationship under which Cuauhtémoc Moctezuma will continue to be the exclusive supplier of beer to OXXO until June 2020.
42
Approximately 58% of OXXO stores are operated by independent managers responsible for all aspects of store operations. The store managers are commission agents and are not employees of FEMSA Comercio – Retail Division. Each store manager is the legal employer of the store’s staff, which typically numbers six people per store. FEMSA Comercio – Retail Division continually invests in on-site operating personnel, with the objective of promoting loyalty, customer service and low personnel turnover in the stores.
Advertising and Promotion
FEMSA Comercio – Retail Division’s marketing efforts for OXXO stores include both specific product promotions and image advertising campaigns. These strategies seek to increase store traffic and sales, and to reinforce the OXXO name and market position.
FEMSA Comercio – Retail Division manages its advertising for OXXO stores on three levels depending on the nature and scope of the specific campaign: local or store-specific, regional and national. Store-specific and regional campaigns are closely monitored to ensure consistency with the overall corporate image of OXXO stores and to avoid conflicts with national campaigns. FEMSA Comercio – Retail Division primarily uses point of purchase materials, flyers, handbills and print and radio media for promotional campaigns, although television is used occasionally for the introduction of new products and services. The OXXO store chain’s image and brand name are presented consistently across all stores, irrespective of location.
Inventory and Purchasing
FEMSA Comercio – Retail Division has placed considerable emphasis on improving operating performance. As part of these efforts, FEMSA Comercio – Retail Division continues to invest in extensive information management systems to improve inventory management. Electronic data collection has enabled this division to reduce average inventory levels. Inventory replenishment decisions are carried out on a store-by-store basis.
Management believes that the OXXO store chain’s scale of operations provides FEMSA Comercio – Retail Division with a competitive advantage in its ability to realize strategic alliances with suppliers. General category offerings are determined on a national level, although purchasing decisions are implemented on a local, regional or national level, depending on the nature of the product category. Given the fragmented nature of the retail industry in Mexico in general, Mexican producers of beer, soft drinks, bread, dairy products, snacks, cigarettes and other high-frequency products have established proprietary distribution systems with extensive direct distribution routes. As a result, approximately 62% of the OXXO store chain’s total sales consist of products that are delivered directly to the stores by suppliers. Other products with longer shelf lives are distributed to stores by FEMSA Comercio – Retail Division’s distribution system, which includes 16 regional warehouses located in Monterrey, Guadalajara, Mexicali, Merida, León, Obregon, Puebla, Queretaro, Chihuahua, Reynosa, Saltillo, Tijuana, Toluca, Villahermosa and two in Mexico City. The distribution centers operate a fleet of approximately 897 trucks that make deliveries to each store approximately twice per week.
Seasonality
OXXO stores experience periods of high demand in December, as a result of the holidays, and in July and August, as a result of increased consumption of beer and soft drinks during the hot summer months. The months of November and February are generally the weakest sales months for OXXO stores. In general, colder weather during these months reduces store traffic and consumption of cold beverages.
43
Drugstore Market
During 2013, FEMSA Comercio – Retail Division entered the drugstore market in Mexico through two transactions. FEMSA Comercio – Retail Division through CCF, closed the acquisition of Farmacias YZA, a leading drugstore operator in Southeast Mexico, headquartered in Merida, Yucatan. The founding shareholders of Farmacias YZA hold a 25% stake in CCF. Following this transaction, on May 13, 2013, CCF acquired Farmacias Moderna, a leading drugstore operator in the western state of Sinaloa.
In June 2015, CCF acquired 100% of Farmacias Farmacon, a regional pharmacy chain consisting at the time of more than 200 stores in the northwestern Mexican states of Sinaloa, Sonora, Baja California and Baja California Sur.
In September 2015, FEMSA Comercio – Retail Division acquired 60% of Socofar, a leading South American drugstore operator based in Santiago, Chile. Socofar operated, directly and through franchises, at that time more than 600 drugstores and 150 beauty stores throughout Chile and 150 drugstores throughout Colombia.
The rationale for entering this new market is anchored in our belief that FEMSA Comercio – Retail Division has developed certain capabilities and skills that should be applicable and useful in the operation of other small retail formats. These capabilities include site selection, logistics, business processes, human resources, inventory and supplier management. The drugstore market in Mexico is very fragmented and FEMSA Comercio – Retail Division believes it is well equipped to create value by entering this market and pursuing a growth strategy that maximizes the opportunity. Furthermore, the acquisition in South America gives FEMSA Comercio the opportunity to pursue a regional strategy from a solid platform anchored in the Chilean market and with compelling growth opportunities in Colombia and beyond.
Quick Service Restaurant Market
Following the same rationale that its capabilities and skills are well suited to different types of small-format retail, during 2013 FEMSA Comercio – Retail Division also entered the quick service restaurant market in Mexico through the 80% acquisition of Doña Tota. This is a leading regional chain specializing in Mexican food with a particularly strong presence in the northeast of the country. This acquisition presented FEMSA Comercio – Retail Division with the opportunity to grow Doña Tota’s stand-alone store base across the country, as well as the possibility to acquire prepared food capabilities and expertise.
Other Stores
FEMSA Comercio – Retail Division also operates other small-format stores, which include soft discount stores with a focus on perishables and liquor stores.
FEMSA Comercio – Fuel Division
Business Strategy
A fundamental element of FEMSA Comercio – Fuel Division’s business strategy is to increase at an accelerated rate its offering of service stations, in previously identified Mexican regions, by way of leases, procurement or construction of stations.
FEMSA Comercio – Fuel Division’s business strategy aims to strengthen its services in its retail gas stations in Mexico to fulfill consumers’ needs and increase traffic in those retail service stations it operates while developing and maintaining an attractive value proposition to draw potential customers and face the future entry of new competitors in the industry.
FEMSA Comercio – Fuel Division’s business strategy includes the development of new businesses in the fuel value chain, such as the final distribution and wholesale of fuel to its own service stations and to third parties.
Service Station Locations and Characteristics
As of December 31, 2015, FEMSA Comercio – Fuel Division operates 307 service stations, concentrated mainly in the northern part of the country but with a presence in 14 different states throughout Mexico.
44
Since March 2015, FEMSA Comercio – Fuel Division has leased 76 additional service stations and built four brand new service stations.
Each service station under the “OXXO GAS” trade name comprises offices, parking lots, maneuvering vehicles area, a fuel service dispatch area and an area for storage of gasoline in underground tanks. The average size of the fuel service dispatch area is 250 square meters. On average each service station has 15 employees.
Products and Services
Gasoline, diesel, oil and additives are the main products sold at OXXO GAS’ service stations.
Past law restrictions prevented FEMSA Comercio – Fuel Division as a franchisee of PEMEX, to have a different supplier of gasoline. However, the current law foresees other suppliers being allowed to operate in Mexico in the medium term.
Market Characteristics
The retail service station market in Mexico is highly fragmented. There are currently more than 11,000 service stations; however, with less than 3% of the total number of stations, FEMSA Comercio – Fuel Division is the largest participant in this market. The majority of retail service stations in the country are owned by small regional family businesses.
Seasonality
FEMSA Comercio – Fuel Division experiences especially high demand during May and August. The lowest demand is in January and December due to the rainy season and the year-end holiday period, because many service stations are not located in local holiday destinations.
Marketing
Through promotional activities, FEMSA Comercio – Fuel Division seeks to provide additional value to customers by offering, along with gasoline, oils and additives, quality products and services at affordable prices. The best tool for communicating these promotions has been coupon promotions in partnership with third parties, a form of advertising now also used by FEMSA Comercio – Fuel Division’s competitors.
Competition
Despite the existence of other groups competing in this sector, FEMSA Comercio – Fuel Division’s competitors are small retail service stations owned by regional family businesses, which compete in the aggregate with FEMSA Comercio – Fuel Division in total sales, new station locations and labor. The conglomerates competing with FEMSA Comercio – Fuel Division in terms of number of retail service stations are Petro-7, operated by 7-Eleven; Corpo Gas; Hidrosina and Orsan.
Equity Investment in the Heineken Group
As of December 31, 2015, FEMSA owned a non-controlling interest in the Heineken Group, one of the world’s leading brewers. As of December 31, 2015, our 20% economic interest in the Heineken Group comprised 43,018,320 shares of Heineken Holding N.V. and 72,182,203 shares of Heineken N.V. For 2015, FEMSA recognized equity income of Ps. 5,879 million regarding its 20% economic interest in the Heineken Group; see Note 10 to our audited consolidated financial statements.
As described above, FEMSA Comercio – Retail Division has a distribution agreement with Cuauhtémoc Moctezuma (now a part of the Heineken Group), pursuant to which OXXO stores only carry beer brands produced and distributed by Cuauhtémoc Moctezuma. OXXO stores will continue to benefit from the existing relationship under which Cuauhtémoc Moctezuma will continue to be the exclusive supplier of beer to OXXO until June 2020. As of April 30, 2010,
45
Coca-Cola FEMSA has agreed with Cervejarias Kaiser (also now part of the Heineken Group) to continue to distribute and sell the Kaiser beer portfolio in Coca-Cola FEMSA’s Brazilian territories for a 20-year term beginning in 2003, consistent with the arrangement already in place. In addition, our logistic services subsidiary provides certain services to Cuauhtémoc Moctezuma and its subsidiaries.
Other Business
Our other business consists of the following smaller operations that support our core operations:
| • | Our logistics services subsidiary provides a broad range of logistics and vehicle maintenance services to Coca-Cola FEMSA, FEMSA Comercio and third-party clients in the beverages, consumer products and retail industries. It has operations in Mexico, Brazil, Colombia, Panama, Costa Rica, Nicaragua and Peru. |
| • | Our refrigeration business produces vertical and horizontal commercial refrigerators for the soft drink, beer and food industries, with an annual capacity of 546,934 units at December 31, 2015. In 2015, this business sold 429,464 refrigeration units, 31.1% of which were sold to Coca-Cola FEMSA, and the remainder of which were sold to third parties. |
Description of Property, Plant and Equipment
As of December 31, 2015, we owned all of our manufacturing facilities and substantially all of our warehouses and distribution centers. Our properties primarily consisted of production and distribution facilities for our soft drink operations and office space. In addition, FEMSA Comercio – Retail Division owns approximately 12% of the OXXO store locations, while the other stores are located in properties that are rented under long-term lease arrangements with third parties.
The table below summarizes by country the installed capacity and percentage utilization of Coca-Cola FEMSA’s production facilities:
Bottling Facility Summary
As of December 31, 2015
| Country |
Installed Capacity | Utilization(1) | ||||||
| (thousands of unit cases) | (%) | |||||||
| Mexico |
2,786,295 | 62 | % | |||||
| Guatemala |
37,931 | 77 | % | |||||
| Nicaragua |
66,847 | 71 | % | |||||
| Costa Rica |
70,587 | 66 | % | |||||
| Panama |
49,646 | 69 | % | |||||
| Colombia |
572,978 | 57 | % | |||||
| Venezuela |
290,391 | 81 | % | |||||
| Brazil |
1,228,126 | 55 | % | |||||
| Argentina |
328,441 | 71 | % | |||||
| (1) | Annualized rate. |
46
The table below summarizes by country the location and facility area of each of Coca-Cola FEMSA’s production facilities.
Bottling Facility by Location
As of December 31, 2015
| Country |
Plant |
Facility Area | ||
| (thousands of sq. meters) | ||||
| Mexico | San Cristobal de las Casas, Chiapas | 45 | ||
| Cuautitlan, Estado de Mexico | 35 | |||
| Los Reyes la Paz, Estado de Mexico | 50 | |||
| Toluca, Estado de Mexico | 317 | |||
| Leon, Guanajuato | 124 | |||
| Morelia, Michoacan | 50 | |||
| Ixtacomitan, Tabasco | 117 | |||
| Apizaco, Tlaxcala | 80 | |||
| Coatepec, Veracruz | 142 | |||
| La Pureza Altamira, Tamaulipas | 300 | |||
| Poza Rica, Veracruz | 42 | |||
| Pacifico, Estado de Mexico | 89 | |||
| Cuernavaca, Morelos | 37 | |||
| Toluca, Estado de Mexico (Ojuelos) | 41 | |||
| San Juan del Rio, Queretaro | 84 | |||
| Queretaro, Queretaro | 80 | |||
| Cayaco, Acapulco | 104 | |||
| Guatemala | Guatemala City | 46 | ||
| Nicaragua | Managua | 54 | ||
| Costa Rica | Calle Blancos, San Jose | 52 | ||
| Coronado, San Jose | 14 | |||
| Panama | Panama City | 29 | ||
| Colombia | Barranquilla | 37 | ||
| Bogota, DC | 105 | |||
| Bucaramanga | 26 | |||
| Cali | 76 | |||
| Manantial, Cundinamarca | 67 | |||
| Tocancipa | 298 | |||
| Medellin | 47 | |||
| Venezuela | Antimano | 15 | ||
| Barcelona | 141 | |||
| Maracaibo | 68 | |||
| Valencia | 100 | |||
| Brazil | Campo Grande | 36 | ||
| Jundiai | 191 | |||
| Mogi das Cruzes | 119 | |||
| Porto Real | 108 | |||
| Maringa | 160 | |||
| Marilia | 159 | |||
| Curitiba | 119 | |||
| Bauru | 39 | |||
| Itabirito | 320 | |||
| Argentina | Alcorta, Buenos Aires | 73 | ||
| Monte Grande, Buenos Aires | 32 |
47
Insurance
We maintain an “all risk” insurance policy covering our properties (owned and leased), machinery and equipment and inventories as well as losses due to business interruptions. The policy covers damages caused by natural disaster, including hurricane, hail, earthquake and damages caused by human acts, including explosion, fire, vandalism and riot. We also maintain a freight transport insurance policy that covers damages to goods in transit. In addition, we maintain a liability insurance policy that covers product liability. We purchase our insurance coverage through an insurance broker. In 2015, the policies for “all risk” property insurance and liability insurance were issued by Mapfre Seguros, S.A., and freight transportation insurance was issued by ACE Seguros, S.A. Our “all risk” coverage was partially reinsured in the international reinsurance market. We believe that our coverage is consistent with the coverage maintained by similar companies.
Capital Expenditures and Divestitures
Our consolidated capital expenditures, net of disposals, for the years ended December 31, 2015, 2014 and 2013 were Ps. 18,885 million, Ps. 18,163 million and Ps. 17,882 million, respectively, and were for the most part financed from cash from operations generated by our subsidiaries. These amounts were invested in the following manner:
| Year Ended December 31, | ||||||||||||
| 2015 | 2014 | 2013 | ||||||||||
| (in millions of Mexican pesos) | ||||||||||||
| Coca-Cola FEMSA |
Ps. 11,484 | Ps. 11,313 | Ps. 11,703 | |||||||||
| FEMSA Comercio – Retail Division |
6,048 | 5,191 | 5,683 | |||||||||
| FEMSA Comercio – Fuel Division |
228 | — | — | |||||||||
| Other |
1,125 | 1,659 | 496 | |||||||||
| Total |
Ps. 18,885 | Ps. 18,163 | Ps. 17,882 | |||||||||
Coca-Cola FEMSA
In 2015, Coca-Cola FEMSA focused its capital expenditures on investments in (i) increasing production capacity, (ii) placing coolers with retailers, (iii) returnable bottles and cases, (iv) improving the efficiency of its distribution infrastructure and (v) information technology. Through these measures, Coca-Cola FEMSA continuously seeks to improve its profit margins and overall profitability.
FEMSA Comercio – Retail Division
FEMSA Comercio – Retail Division’s principal investment activity is the construction and opening of new stores, which are mostly OXXO stores. During 2015, FEMSA Comercio opened 1,208 net new OXXO stores. FEMSA Comercio – Retail Division invested Ps. 6,048 million in 2015 in the addition of new stores, warehouses and improvements to leased properties.
48
FEMSA Comercio – Fuel Division
In 2015, FEMSA Comercio – Fuel Division’s business addressed its investments on capital expenditure mainly to the addition of new retail service stations. Since March 2015, FEMSA Comercio – Fuel Division has leased and enhanced 76 additional retail stations and built four brand new stations, investing Ps. 228 million during 2015.
Regulatory Matters
Antitrust Legislation
The Ley Federal de Competencia Económica (Federal Antitrust Law) became effective on June 22, 1993, regulating monopolistic practices and requiring Mexican government approval of certain mergers and acquisitions. The Federal Antitrust Law subjects the activities of certain Mexican companies, including us, to regulatory scrutiny.
In June 2013, following a comprehensive reform to the Mexican Constitution, a new antitrust authority with autonomy was created: the Comisión Federal de Competencia Económica (Federal Antitrust Commission, or the CFCE). As a result of these amendments, new antitrust and telecommunications specialized courts were created and commenced hearing cases in August 2013. In July 2014, a new Federal Antitrust Law came into effect based on the amended constitutional provisions.
These amendments granted more power to the CFCE, including the ability to regulate essential facilities, order the divestment of assets and eliminate barriers to competition, set higher fines for violations of the Federal Antitrust Law, implement important changes to rules governing mergers and anti-competitive behavior and limit the availability of legal defenses against the application of the law. Management believes that we are currently in compliance in all material respects with Mexican antitrust legislation.
In Mexico and in some of the other countries where we operate, we are involved in different ongoing competition related proceedings. We believe that the outcome of these proceedings will not have a material adverse effect on our financial position or results.
Mexican Tax Reform
In December of 2013, the Mexican government enacted a package of tax reforms (the “2014 Tax Reform”) which includes several significant changes to tax laws, discussed in further detail below, that entered into effect on January 1, 2014. The most significant changes are as follows:
| • | The introduction of a new withholding tax at the rate of 10% for dividends and/or distributions of earnings generated in 2014 and beyond; |
| • | The elimination of the exemption on gains from the sale of shares through a stock exchange recognized under applicable Mexican tax law. The gain will be taxable at the rate of 10% and will be paid by the shareholder based on the information provided by the financial intermediary. Transferors that are residents of a country with which Mexico has entered into a tax treaty for the avoidance of double taxation will be exempt; |
| • | A fee of one Mexican peso per liter on the sale and import of flavored beverages with added sugar, and an excise tax of 8% on food with caloric content equal to, or greater than 275 kilocalories per 100 grams of product; |
| • | The prior 11% value added tax (VAT) rate that applied to transaction in the border region was raised to 16%, matching the general VAT rate applicable in the rest of Mexico; |
| • | The elimination of the tax on cash deposits (IDE) and the business flat tax (IETU); |
49
| • | Deductions on exempt payroll items for workers are limited to 53%; |
| • | The income tax rate in 2013 and 2012 was 30%. Scheduled decreases to the income tax rate that would have reduced the rate to 29% in 2014 and 28% in 2015 and thereafter, were canceled in connection with the 2014 Tax Reform; |
| • | The repeal of the existing tax consolidation regime, which is effective as of January 1, 2014, modified the payment term of a tax on assets payable of Ps. 180, which will be paid over the following five years instead of an indefinite term; and |
| • | The introduction of a new optional tax integration regime (a modified form of tax consolidation), which replaces the previous tax consolidation regime. The new optional tax integration regime requires an equity ownership of at least 80% for qualifying subsidiaries and would allow us to defer the annual tax payment of our profitable participating subsidiaries for a period equivalent to 3 years to the extent their individual tax expense exceeds the integrated tax expense of the Company. |
Other Recent Tax Reforms
On January 1, 2015, a general tax reform became effective in Colombia. This reform included the imposition of a new temporary tax on net equity through 2017 to Colombian residents and non-residents who own property in Colombia directly or indirectly through branches or permanent establishments. The relevant taxable base will be determined annually based on a formula. For net equity that exceeds 5.0 billion Colombian pesos (approximately US$ 2.1 million) the rate will be 1.15% in 2015, 1.00% in 2016 and 0.40% in 2017. In addition, the tax reform in Colombia imposed that the supplementary income tax at a rate of 9% as contributions to social programs, which was previously scheduled to decrease to 8% by 2015, will remain indefinitely. Additionally, this tax reform included the imposition of a temporary contribution to social programs at a rate of 5%, 6%, 8% and 9% for the years 2015, 2016, 2017 and 2018, respectively. Finally, this reform establishes an income tax deduction of 2% of value-added tax paid in the acquisition or import of hard assets, such as tangible and amortizable assets that are not sold or transferred in the ordinary course of business and that are used for the production of goods or services.
In Guatemala, the income tax rate for 2014 was 28% and it decreased for 2015 to 25%, as scheduled.
On November 18, 2014, a tax reform became effective in Venezuela. This reform included changes on how the carrying value of operating losses is reported. The reform established that operating losses carried forward year over year (but limited to three fiscal years) may not exceed 25% of the taxable income in the relevant period. The reform also eliminated the possibility to carry over losses relating to inflationary adjustments and included changes that grant Venezuelan tax authorities broader powers and authority in connection with their ability to enact administrative rulings related to income tax withholding and to collect taxes and increase fines and penalties for tax-related violations, including the ability to confiscate assets without a court order.
On December 30, 2015, the Venezuelan government enacted a package of tax reforms that became effective in January 2016. This reform, among other things, (i) eliminates the inflationary adjustments for the calculation of income tax as well as the new investment tax deduction and (ii) imposes a new tax on financial transactions effective as of February 1, 2016, for those identified as “special taxpayers” at a rate of 0.75% over certain financial transactions, such as bank withdrawals, transfer of bonds and securities, payment of debts without intervention of the financial system and debits on bank accounts for cross-border payments, which will be immediately withheld by the banks.
On April 1, 2015, the Brazilian government issued Decree No. 8.426/15 to impose, as of July 2015, PIS/COFINS (Social Contributions on Gross Revenues) of 4.65% on financial income (except for foreign exchange variations).
50
Starting in 2016, the Brazilian rates of value-added tax in certain states will change as follows: Mato Grosso do Sul from 17% to 20%; Minas Gerais, 18% and an additional 2% will be charged on sales to non-taxpayers, as a contribution to a poverty eradication fund; Rio de Janeiro, the contribution to poverty eradication will increase from 1% to 2% as of April 2016; and Parana, 16% and an additional 2% will be charged on sales to non-taxpayers, as a contribution to a poverty eradication fund. In addition and specifically for sales of beer, the value-tax added tax rate will increase to a maximum of 25%.
In addition, as of January 1, 2016, the Brazilian federal production tax rates will be reduced and the rates of the federal sales tax will increase. We expect the average of these taxes will range between 14.4% and 15.5% over net sales.
Taxation of Beverages
All the countries where Coca-Cola FEMSA operates, except for Panama, impose a value-added tax on the sale of sparkling beverages, with a rate of 16% in Mexico, 12% in Guatemala, 15% in Nicaragua, an average percentage of 15.8% in Costa Rica, 16% in Colombia (applied only to the first sale in the supply chain), 12% in Venezuela, 21% in Argentina, and in Brazil 17% in the states of Mato Grosso do Sul and Goias and 18% in the states of Sao Paulo, Minas Gerais, Parana and Rio de Janeiro. The state of Rio de Janeiro also charges an additional 1% as a contribution to a poverty eradication fund. In Brazil the value-added tax is grossed-up and added, along with federal sales tax, at the taxable basis. In addition, Coca-Cola FEMSA is responsible for charging and collecting the value-added tax from each of its retailers in Brazil, based on average retail prices for each state where it operates, defined primarily through a survey conducted by the government of each state, which in 2015 represented an average taxation of approximately 9.7% over net sales.
In addition, several of the countries where Coca-Cola FEMSA operates impose the following excise or other taxes:
| • | Mexico imposes an excise tax of Ps. 1.00 per liter on the production, sale and importation of beverages with added sugar and HFCS as of January 1, 2014. This tax is applied only to the first sale and Coca-Cola FEMSA is responsible for charging and collecting this excise tax. |
| • | Guatemala imposes an excise tax of 0.18 cents in local currency (Ps. 0.41 as of December 31, 2015) per liter of sparkling beverage. |
| • | Costa Rica imposes a specific tax on non-alcoholic bottled beverages based on the combination of packaging and flavor, currently assessed at 18.11 colones (Ps. 0.57 as of December 31, 2015) per 250 ml, and an excise tax currently assessed at 6.313 colones (approximately Ps. 0.20 as of December 31, 2015) per 250 ml. |
| • | Nicaragua imposes a 9.0% tax on consumption, and municipalities impose a 1.0% tax on our Nicaraguan gross income. |
| • | Panama imposes a 5.0% tax based on the cost of goods produced and a 10.0% selective consumption tax on syrups, powders and concentrates. |
| • | Argentina imposes an excise tax of 8.7% on sparkling beverages containing less than 5.0% lemon juice or less than 10.0% fruit juice, and an excise tax of 4.2% on sparkling water and flavored sparkling beverages with 10.0% or more fruit juice, although this excise tax is not applicable to some of Coca-Cola FEMSA’s products. |
| • | Brazil assesses an average production tax of approximately 4.2% and an average sales tax of approximately 10.2% over net sales. Until April 30, 2015, these taxes were fixed by the federal government based on national average retail prices obtained through surveys. The national average retail price of each product and presentation was multiplied by a fixed rate combined with specific multipliers for each presentation, to obtain a fixed tax per liter, per product and presentation. |
51
| These taxes were applied only to the first sale and Coca-Cola FEMSA was responsible for charging and collecting these taxes from each of its retailers. Beginning on May 1, 2015, these federal taxes were applied based on the price sold, as detailed in Coca-Cola FEMSA’s invoices, instead of an average retail price combined with a fixed tax rate and multiplier per presentation. Except for sales to wholesalers, these production and sales taxes apply only to the first sale and Coca-Cola FEMSA is responsible for charging and collecting these taxes from each of its retailers. For sales to wholesalers, they are entitled to recover the sales tax and charge this tax again upon the resale of Coca-Cola FEMSA’s products to retailers. |
| • | Colombia’s municipalities impose a sales tax that varies between 0.35% and 1.2% of net sales. |
| • | Venezuela’s municipalities impose a variable excise tax applied only to the first sale that varies between 0.6% and 2.5% of net sales. |
Price Controls
Voluntary price restraints or statutory price controls have been imposed historically in several of the countries where Coca-Cola FEMSA operates. Currently, there are no price controls on Coca-Cola FEMSA’s products in any of the territories where it has operations, except for those in Argentina, where authorities directly supervise five products sold through supermarkets as a measure to control inflation, and Venezuela, where the government has imposed price controls on certain products, including bottled water. In addition, in January 2014, the Venezuelan government passed the Ley Orgánica de Precios Justos (Fair Prices Law), which was amended in November 2014 and once again in November 2015, mainly to increase applicable fines and penalties. The purpose of this law is to establish regulations and administrative proceedings to impose a limit on profits earned on the sale of goods, including Coca-Cola FEMSA’s products, seeking to maintain price stability of, and equal access to, goods and services. A ruling derived from this law imposes an obligation to manufacturing companies to label products with the fair or maximum sales’ price for each product. This law also creates the National Office of Costs and Prices, whose main role is to oversee price controls and set maximum retail prices on certain consumer goods and services. We cannot assure you that Coca-Cola FEMSA will be in compliance at all times with these laws based on changes, market dynamics in these two countries and the lack of clarity of certain basic aspects of the applicable law in Venezuela. Any such changes and potential violations may have an adverse impact on Coca-Cola FEMSA. See “Risk Factors—Risks Related to Our Company – Coca-Cola FEMSA - Regulatory developments may adversely affect Coca-Cola FEMSA’s business.”
Environmental Matters
In all of our territories, our operations are subject to federal and state laws and regulations relating to the protection of the environment.
Mexico
The Mexican federal authority in charge of overseeing compliance with the federal environmental laws is the Secretaria del Medio Ambiente y Recursos Naturales or Secretary of Environment and Natural Resources, which we refer to as “SEMARNAT”. An agency of SEMARNAT, the Procuraduría Federal de Protección al Ambiente or Federal Environmental Protection Agency, which we refer to as “PROFEPA”, has the authority to enforce the Mexican federal environmental laws. As part of its enforcement powers, PROFEPA can bring administrative, civil and criminal proceedings against companies and individuals that violate environmental laws, regulations and Mexican Official Standards and has the authority to impose a variety of sanctions. These sanctions may include, among other things, monetary fines, revocation of authorizations, concessions, licenses, permits or registrations, administrative arrests, seizure of contaminating equipment, and in certain cases, temporary or permanent closure of facilities. Additionally, as part of its inspection authority, PROFEPA is entitled to periodically inspect the facilities of companies whose activities are regulated by the Mexican environmental legislation and verify compliance therewith. Furthermore, in special situations or certain areas where federal jurisdiction is not applicable or appropriate, the state and municipal authorities can administer and enforce certain environmental regulations of their respective jurisdictions.
52
In Mexico, the principal legislation relating to environmental matters is the Ley General de Equilibrio Ecológico y Protección al Ambiente (Federal General Law for Ecological Equilibrium and Environmental Protection, or the Mexican Environmental Law) and the Ley General para la Prevención y Gestión Integral de los Residuos (General Law for the Prevention and Integral Management of Waste). Under the Mexican Environmental Law, rules have been promulgated concerning water, air and noise pollution and hazardous substances. In particular, Mexican environmental laws and regulations require that we file periodic reports with respect to air and water emissions and hazardous wastes and set forth standards for waste water discharge that apply to our operations. We are also subject to certain minimal restrictions on the operation of delivery trucks in Mexico City. We have implemented several programs designed to facilitate compliance with air, waste, noise and energy standards established by current Mexican federal and state environmental laws, including a program that installs catalytic converters and liquid petroleum gas in delivery trucks for our operations in Mexico City.
In March 2015, the Ley General de Cambio Climático (General Law of Climate Change), its regulation and certain decrees related to such law became effective, imposing upon different industries (including the food and beverage industry) the obligation to report direct or indirect gas emissions exceeding 25,000 tons of carbon dioxide. Currently Coca-Cola FEMSA is not required to report these emissions, since it does not exceed this threshold. We cannot assure you that we will not be required to comply with this reporting requirement in the future.
In Coca-Cola FEMSA’s Mexican operations, Coca-Cola FEMSA established a partnership with The Coca-Cola Company and ALPLA, a supplier of plastic bottles to Coca-Cola FEMSA in Mexico, to create Industria Mexicana de Reciclaje (IMER), a PET recycling facility located in Toluca, Mexico. This facility started operations in 2005 and has a recycling capacity of approximately 25,000 metric tons per year, from which 15,000 metric tons can be reused in PET bottles for food packaging purposes. Coca-Cola FEMSA has also continued contributing funds to ECOCE, A.C., a nationwide collecter of containers and packing materials. In addition, Coca-Cola FEMSA’s plants located in Toluca, Reyes, Cuautitlán, Apizaco, San Cristóbal, Morelia, Ixtacomitan, Coatepec, Poza Rica, Ojuelos, Pacífico and Cuernavaca have received or are in the process of receiving a Certificado de Industria Limpia (Certificate of Clean Industry). In addition, seven of Coca-Cola FEMSA’s distribution centers located in the State of Mexico, Mexico have received or are in the process of receiving a Certificate of Clean Industry.
Additionally, several of our subsidiaries have entered into long-term wind power purchase agreements with wind park developers in Mexico to receive electrical energy for use at production and distribution facilities of FEMSA and Coca-Cola FEMSA throughout Mexico, as well as for a significant number of OXXO stores.
Central America
Coca-Cola FEMSA’s Central American operations are subject to several federal and state laws and regulations relating to the protection of the environment, which have been enacted in the last ten years, as awareness has increased in this region about the protection of the environment and the disposal of hazardous and toxic materials as well as water usage. Coca-Cola FEMSA’s Costa Rica and Panama operations have participated in a joint effort along with the local division of The Coca-Cola Company called Misión Planeta (Mission Planet) for the collection and recycling of non-returnable plastic bottles.
Colombia
Coca-Cola FEMSA’s Colombian operations are subject to several Colombian federal and state laws and regulations related to the protection of the environment and the disposal of treated water and toxic and hazardous materials. These laws include the control of atmospheric emissions, noise emissions, disposal of treated water and strict limitations on the use of chlorofluorocarbons. In addition, on February 6, 2012, Colombia promulgated Decree No. 303, which requires Coca-Cola FEMSA to apply for an authorization to discharge its water into public waterways. Coca-Cola FEMSA is engaged in nationwide reforestation programs and campaigns for the collection and recycling of glass and plastic bottles, among other programs with positive environmental impacts. Coca-Cola FEMSA has also obtained and maintained the ISO 9001, ISO 14001, OHSAS 18001, FSSC 22000 and PAS 220 certifications for its plants located in Medellin, Cali, Bogota, Barranquilla, Bucaramanga and La Calera, as recognition for the highest quality and food harmlessness in its production processes, which is evidence of its strict level of compliance with relevant Colombian regulations. Coca-Cola FEMSA’s six plants joined a small group of companies that have obtained these certifications. Coca-Cola FEMSA’s new plant located in Tocancipá commenced operations in February 2015 and Coca-Cola FEMSA expects that it will obtain the Leadership in Energy and Environmental Design (LEED) certification in 2017.
53
Venezuela
Coca-Cola FEMSA’s Venezuelan operations are subject to several Venezuelan federal, state and municipal laws and regulations related to the protection of the environment. The most relevant of these laws are the Ley Orgánica del Ambiente (Organic Environmental Law), the Ley Sobre Sustancias, Materiales y Desechos Peligrosos (Substance, Material and Dangerous Waste Law), the Ley Penal del Ambiente (Criminal Environmental Law) and the Ley de Aguas (Water Law). Since the enactment of the Organic Environmental Law in 1995, Coca-Cola FEMSA’s Venezuelan subsidiary has presented the proper authorities with plans to bring their production facilities and distribution centers into compliance with applicable laws, which mainly consist of building or expanding the capacity of water treatment plants in Coca-Cola FEMSA’s bottling facilities. Coca-Cola FEMSA currently has water treatment plants in its bottling facilities located in the city of Barcelona, Valencia and in its Antimano bottling plant in Caracas and Coca-Cola FEMSA is still under construction and expansion of its current water treatment plant in its bottling facility in Maracaibo.
Brazil
Coca-Cola FEMSA’s Brazilian operations are subject to several federal, state and municipal laws and regulations related to the protection of the environment. Among the most relevant laws and regulations are those dealing with the emission of toxic and hazardous gases, disposal of wastewater and solid waste, and soil contamination by hazardous chemicals, which impose penalties, such as fines, facility closures or criminal charges depending upon the level of non-compliance.
Coca-Cola FEMSA’s production plant located in Jundiai has been recognized by the Brazilian authorities for its compliance with environmental regulations and for having standards well above those imposed by the law. The plant of Jundiai has been certified for GAO-Q and GAO-E. In addition, the plants of Jundiai, Mogi das Cruzes, Campo Grande, Marilia, Maringa, Curitiba and Bauru have been certified for (i) ISO 9001: 2008, (ii) ISO 14001: 2004 and (iii) norm OHSAS 18001: 2007. In 2012, the Jundiai, Campo Grande, Bauru, Marilia, Curitiba, Maringa, Porto Real and Mogi das Cruzes plants were certified in standard FSSC22000.
In Brazil, a municipal regulation of the City of Sao Paulo, implemented pursuant to Law 13.316/2002, came into effect in May 2008. This regulation requires Coca-Cola FEMSA to collect for recycling a specified annual percentage of plastic bottles made from PET sold in the City of Sao Paulo; such percentage increased each year up to 2011, in which Coca-Cola FEMSA was required to collect 90% of the PET bottles sold in the city of Sao Paulo for recycling. Currently, Coca-Cola FEMSA is not able to collect the entire required volume of PET bottles it has sold in the City of Sao Paulo for recycling. Since Coca-Cola FEMSA does not meet the requirements of this regulation, which we believe to be more onerous than those imposed by the countries with the highest recycling standards, it could be fined and be subject to other sanctions, such as the suspension of operations in any of its plants and/or distribution centers located in the City of Sao Paulo. In May 2008, Coca-Cola FEMSA, together with other bottlers in the city of Sao Paulo, through the Associação Brasileira das Indústrias de Refrigerantes e de Bebidas Não-alcoólicas (Brazilian Soft Drink and Non-Alcoholic Beverage Association, or ABIR), filed a motion requesting a court to overturn this regulation due to the impossibility of compliance. In addition, in November 2009, in response to a municipal authority request for Coca-Cola FEMSA to demonstrate the destination of the PET bottles sold by it in the City of Sao Paulo, Coca-Cola FEMSA filed a motion showing all of its recycling programs and requesting a more practical timeline to comply with the requirements of the law. In October 2010, the municipal authority of the City of Sao Paulo levied a fine on Coca-Cola FEMSA’s Brazilian operating subsidiary of 250,000 Brazilian reais (approximately Ps. 91,202 as of December 31, 2015), on the grounds that the report submitted by Coca-Cola FEMSA’s Brazilian operating subsidiary did not comply with the 75% proper disposal requirement for the period from May 2008 to May 2010. Coca-Cola FEMSA filed an appeal against this fine, which was denied by the municipal authority in May 2013, and the administrative stage is therefore closed. Coca-Cola FEMSA is currently evaluating next steps. In July 2012, the State Appellate Court of Sao Paulo rendered a decision admitting an interlocutory appeal filed on behalf of ABIR suspending the fines and other sanctions to ABIR’s associated companies, including Coca-Cola FEMSA’s Brazilian subsidiary, for alleged noncompliance with the recycling municipal regulation up to the final resolution of the lawsuit. Coca-Cola FEMSA is still awaiting final resolution of the lawsuit filed on behalf of ABIR. We cannot assure you that these measures will have the desired effect or that Coca-Cola FEMSA will prevail in its judicial challenge.
54
In August 2010, Law No. 12.305/2010 established the Brazilian National Solid Waste Policy. This policy is based on the principle of shared responsibility between the government, companies and the public, and provides for the post-consumption return of products to companies and requires public authorities to implement waste management programs. This law is regulated by Federal Decree No. 7.404/2010, and was published in December 2010. In response to the Brazilian National Solid Waste Policy, in December 2012, a proposal of agreement was provided to the Ministry of the Environment by almost 30 associations involved in the packaging sector, including ABIR in its capacity as representative for The Coca-Cola Company, Coca-Cola FEMSA’s Brazilian subsidiary, and other bottlers. This agreement proposed the creation of a “coalition” to implement systems for reverse logistics packaging non-dangerous waste that makes up the dry portion of municipal solid waste or its equivalent. The goal of the proposal is to create methodologies for sustainable development, and protect the environment, society, and the economy. The Ministry of Environment approved and signed this agreement in November 2015.
Argentina
Coca-Cola FEMSA’s Argentine operations are subject to federal and municipal laws and regulations relating to the protection of the environment. The most significant of these are regulations concerning waste water discharge, which are enforced by the Secretaría de Ambiente y Desarrollo Sustentable (Ministry of Natural Resources and Sustainable Development) and the Organismo Provincial para el Desarrollo Sostenible (Provincial Organization for Sustainable Development) for the province of Buenos Aires. Coca-Cola FEMSA’s Alcorta plant is in compliance with environmental standards and Coca-Cola FEMSA has been certified for ISO 14001:2004 for its plants and operative units in Buenos Aires.
For all of Coca-Cola FEMSA’s plant operations, it employs an environmental management system: Sistema de Administración Ambiental (Environmental Administration System, or EKOSYSTEM) that is contained within Sistema Integral de Calidad (Integral Quality System).
Coca-Cola FEMSA has expended, and may be required to expend in the future, funds for compliance with and remediation under local environmental laws and regulations. Currently, we do not believe that such costs will have a material adverse effect on Coca-Cola FEMSA’s results or financial condition. However, since environmental laws and regulations and their enforcement are becoming increasingly more stringent in Coca-Cola FEMSA’s territories, and there is increased recognition by local authorities of the need for higher environmental standards in the countries where it operates, changes in current regulations may result in an increase in costs, which may have an adverse effect on Coca-Cola FEMSA’s future results or financial condition. Coca-Cola FEMSA is not aware of any significant pending regulatory changes that would require a significant amount of additional remedial capital expenditures.
We do not believe that Coca-Cola FEMSA’s business activities pose a material risk to the environment, and we believe that Coca-Cola FEMSA is in material compliance with all applicable environmental laws and regulations.
Water Supply
In Mexico, Coca-Cola FEMSA obtains water directly from municipal utility companies and pumps water from its own wells pursuant to concessions obtained from the Mexican government on a plant-by-plant basis. Water use in Mexico is regulated primarily by the Ley de Aguas Nacionales de 1992 (as amended, the 1992 Water Law), and regulations issued thereunder, which created the Comisión Nacional del Agua (National Water Commission). The National Water Commission is in charge of overseeing the national system of water use. Under the 1992 Water Law, concessions for the use of a specific volume of ground or surface water generally run from five to fifty-year terms, depending on the supply of groundwater in each region as projected by the National Water Commission. Concessionaires may request that concession terms be extended before they expire. The Mexican government is authorized to reduce the volume of ground or surface water granted for use by a concession by whatever volume of
55
water that is not used by the concessionaire for two consecutive years. However, because the current concessions for each of Coca-Cola FEMSA’s plants in Mexico do not match each plant’s projected needs for water in future years, we successfully negotiated with the Mexican government the right to transfer the unused volume under concessions from certain plants to other plants anticipating greater water usage in the future. These concessions may be terminated if, among other things, we use more water than permitted or we fail to pay required concession-related fees and do not cure such situations in a timely manner. Although we have not undertaken independent studies to confirm the sufficiency of the existing groundwater supply, we believe that our existing concessions satisfy our current water requirements in Mexico.
In addition, the 1992 Water Law provides that plants located in Mexico that use deep water wells to supply their water requirements must pay a fee to the local governments for the discharge of residual waste water to drainage. Pursuant to this law, certain local authorities test the quality of the waste water discharge and charge plants an additional fee for measurements that exceed certain standards published by the National Water Commission. In the case of non-compliance with the law, penalties, including closures, may be imposed. All of Coca-Cola FEMSA’s bottling plants located in Mexico meet these standards. In addition, Coca-Cola FEMSA’s plants in Apizaco and San Cristóbal are certified with ISO 14001.
In Brazil, Coca-Cola FEMSA obtains water and mineral water from wells pursuant to concessions granted by the Brazilian government for each plant. According to the Brazilian Constitution, water is considered an asset of common use and can only be exploited for the national interest by Brazilians or companies formed under Brazilian law. Concessionaires and users have the responsibility for any damage to the environment. The exploitation and use of water is regulated by the Código de Mineração (Code of Mining, Decree Law No. 227/67), the Código de Águas Minerais (Mineral Water Code, Decree Law No. 7841/45), the National Water Resources Policy (Law No. 9433/97) and by regulations issued thereunder. The companies that exploit water are supervised by the Departamento Nacional de Produção Mineiral – DNPM (National Department of Mineral Production) and the National Water Agency (Agência Nacional de Águas) in connection with federal health agencies, as well as state and municipal authorities. In Coca-Cola FEMSA’s Jundiai, Marilia, Curitiba, Maringa, Porto Real and Itabirito plants, it does not exploit spring water. In its Mogi das Cruzes, Bauru and Campo Grande plants, it has all the necessary permits for the exploitation of spring water.
In Argentina, a state water company provides water to Coca-Cola FEMSA’s Alcorta plant on a limited basis; however, we believe the authorized amount meets Coca-Cola FEMSA’s requirements for this plant. In Coca-Cola FEMSA’s Monte Grande plant in Argentina, it pumps water from its own wells, in accordance with Law 25.688.
In Colombia, in addition to natural spring water for Manantial, Coca-Cola FEMSA obtains water directly from its own wells and from utility companies. Coca-Cola FEMSA is required to have a specific concession to exploit water from natural sources. Water use in Colombia is regulated by Law No. 9 of 1979 and Decrees 2811 of 1974 and No. 3930 of 2010. In addition, Decree No. 303 requires Coca-Cola FEMSA to apply for water concessions and for authorization to discharge its water into public waterways. The National Institute of National Resources supervises companies that use water as a raw material for their business.
In Nicaragua, the use of water is regulated by the Ley General de Aguas Nacionales (National Water Law), and Coca-Cola FEMSA obtains water directly from its own wells. In Costa Rica, the use of water is regulated by the Ley de Aguas (Water Law). In both of these countries, Coca-Cola FEMSA owns and exploits its own water wells granted to it through governmental concessions. In Guatemala, no license or permits are required to exploit water from the private wells in Coca-Cola FEMSA’s own plants. In Panama, Coca-Cola FEMSA acquires water from a state water company, and the use of water is regulated by the Reglamento de Uso de Aguas de Panamá (Panama Use of Water Regulation). In Venezuela, Coca-Cola FEMSA uses private wells in addition to water provided by the municipalities, and it has taken the appropriate actions, including actions to comply with water regulations, to have water supply available from these sources, regulated by the Ley de Aguas (Water Law).
In addition, Coca-Cola FEMSA obtains water for the production of some of its natural spring water products, such as Manantial in Colombia and Crystal in Brazil, from spring water pursuant to concessions granted.
56
We cannot assure you that water will be available in sufficient quantities to meet Coca-Cola FEMSA’s future production needs, that it will be able to maintain its current concessions or that additional regulations relating to water use will not be adopted in the future in its territories. We believe that we are in material compliance with the terms of our existing water concessions and that we are in compliance with all relevant water regulations.
Other Regulations
In December 2009, the Venezuelan government issued a decree requiring a reduction in energy consumption by at least 20% for industrial companies whose consumption is greater than two megawatts per hour and to submit an energy-usage reduction plan. Some of Coca-Cola FEMSA’s bottling operations in Venezuela outside of Caracas met this threshold and submitted a plan, which included the purchase of generators for its plants. Since then, Coca-Cola FEMSA has installed electrical generators in its Antimano, Barcelona, Maracaibo and Valencia bottling facilities to mitigate any such risks and filed the respective energy usage reduction plans with the authorities. In addition, since January 2010, the Venezuelan government has implemented and continues to implement power cuts and other measures for all industries in Caracas whose consumption is above 35 kilowatts per hour.
In August 2013, the current Mexican president, Enrique Peña Nieto, proposed a constitutional reform to provide for modernization and growth of the Mexican energy sector (the “Mexican Energy Reform”). Following intense review of and debate on the proposal, in December 2013 the Mexican government approved a decree containing amendments and additions to the Mexican Constitution in matters of energy. The Mexican Energy Reform provides for the opening of the Mexican energy market to the participation of private parties, including companies with foreign investment, allowing for FEMSA Comercio to participate directly in the retail of fuel products. However, secondary legislation and regulation of the approved Mexican Energy Reform is in transition, and deregulation of fuel prices will be conducted gradually: starting January 1, 2015, until December 31, 2017, gasoline and diesel prices shall be established by the Mexican executive power by decree, taking into account transportation cost differences between regions and other factors, and starting January 1, 2018, retail prices for gasoline and diesel will be freely determined by market conditions.
In May 2014, the Mexican government approved a decree that established mandatory guidelines applicable to the entire national education system (from elementary school through college). According to the decree, the sale of specific sparkling beverages and still beverages that contain sugar or HFCS by schools is prohibited. Schools are still allowed to sell water and certain still beverages such as juices and juice-based beverages that comply with the guidelines established in such decree. We cannot assure you that the Mexican government will not further restrict sales of other of Coca-Cola FEMSA’s products by such schools. These restrictions and any further restrictions could have an adverse impact on Coca-Cola FEMSA’s results of operations.
In January 2012, the Costa Rican government approved a decree which regulates the sale of food and beverages in public schools. According to the decree, the sale of all sparkling beverages and certain still beverages that contain sugar, syrup or HFCS in any type of presentation in schools is prohibited. Coca-Cola FEMSA is still allowed to sell water and certain still beverages in schools. Although Coca-Cola FEMSA is in compliance with this law, we cannot assure you that the Costa Rican government will not further restrict sales of other of Coca-Cola FEMSA’s products in schools in the future; these restrictions and any further restrictions could have an adverse impact on Coca-Cola FEMSA’s results of operations.
In May 2012, the Venezuelan government adopted significant changes to labor regulations that had a negative impact on Coca-Cola FEMSA’s business and operations. The principal changes that impacted Coca-Cola FEMSA’s operations were and still are: (i) the requirement that employee terminations are now subject to governmental authorization; (ii) retroactive assessments for any modifications to Coca-Cola FEMSA’s severance payment system; (iii) a reduction in the maximum daily and weekly working hours (from 44 to 40 weekly); (iv) an increase in mandatory weekly breaks, prohibiting a reduction in salaries as a result of such increase; and (v) the requirement that all third party contractors participating in the manufacturing and sales processes of Coca-Cola FEMSA’s products be included in its payroll. Coca-Cola FEMSA is currently in compliance with these labor regulations.
57
In November 2014, the Venezuelan government amended the Foreign Investment Law. As part of the amendments made, the law now provides that at least 75% of the value of foreign investment must be composed of assets located in Venezuela, which may include equipment, supplies or other goods or tangible assets required at the early stages of operations. By the end of the first fiscal year after commencement of operations in Venezuela, investors will be authorized to repatriate up to 80% of the profits derived from their investment. Any profits not otherwise repatriated in a fiscal year, may be accumulated and be repatriated the following fiscal year, together with profits generated during such year. In the event of liquidation, a company may repatriate up to 85% of the value of the foreign investment. Currently, the scope of this law is not entirely clear with respect to the liquidation process.
In December 2015, the Venezuelan Ministry of Health issued a resolution which imposes an obligation to label certain products, including sparkling beverages and still beverages that contain sugar with health warnings. This resolution was issued without previous consultation to the interested parties in disregard of Venezuelan law. Recently, the Venezuelan Ministry of Health granted a nine-month extension for the enforcement of this resolution. We, together with other companies in the industry and the corresponding authorities, are currently discussing a new resolution with a different scope, which would amend or supersede the resolution issued in December 2015.
In September 2012, the Brazilian government issued Law No. 12,619 (Law of Professional Drivers), which regulates the working hours of professional drivers who distribute Coca-Cola FEMSA’s products from its plants to the distribution centers and to retailers and points of sale. Pursuant to this law, employers must keep a record of working hours, including overtime hours, of professional drivers in a reliable manner, such as electronic logbooks or worksheets. Coca-Cola FEMSA is currently in compliance with this law.
In June 2014, the Brazilian government issued Law No. 12,997 (Law of Motorcycle Drivers) which imposes a risk premium of 30% of the base salary payable to all employees who drive motorcycles in their job. This risk premium became enforceable in October 2014, when the related rules and regulations were issued by the Ministry of Labor and Employment. Coca-Cola FEMSA believes that these rules and regulations (Decree No. 1.565/2014) were unduly issued by such Ministry since it did not comply with all the essential requirements established in Decree No. 1.127/2003. In November 2014, Coca-Cola FEMSA, in conjunction with other bottlers of the Coca-Cola system in Brazil and through the ABIR, filed an action against the Ministry of Labor and Employment to suspend the effects of such decree. ABIR’s associated companies, including Coca-Cola FEMSA’s Brazilian subsidiary, were issued a preliminary injunction suspending the effects of the decree and exempting Coca-Cola FEMSA from paying the risk premium. The Ministry of Labor and Employment filed an interlocutory appeal against the preliminary injunction in order to restore the effects of Decree No. 1.565/2014, which was denied. Coca-Cola FEMSA is currently awaiting final resolution of the lawsuit filed on behalf of ABIR. In the meantime, the Ministry of Labor and Employment in December 2015 started a new discussion with the participation of all interested parties seeking to reissue Decree No. 1.565/2014, in order to comply with the essential requirements.
In January 2014, a new Anti-Corruption Law in Brazil came into effect, which regulates bribery, corruption practices and fraud in connection with agreements entered into with governmental agencies. The main purpose of this law is to impose liability on companies carrying out such practices, establishing fines that can reach up to 20% of a company’s gross revenues in the previous fiscal year. Although Coca-Cola FEMSA believes it is in compliance with this law, if it was found liable for any of these practices, this law would have an adverse effect on Coca-Cola FEMSA’s business.
OPERATING AND FINANCIAL REVIEW AND PROSPECTS
The following discussion should be read in conjunction with, and is entirely qualified by reference to, our audited consolidated financial statements and the notes to those financial statements. Our consolidated financial statements were prepared in accordance with International Financial Reporting Standards (“IFRS”) as issued by the International Accounting Standards Board (“IASB”). Our consolidated financial statements will be presented for approval at our shareholders meeting, which is scheduled to take place on March 8, 2016.
58
Overview of Events, Trends and Uncertainties
Management currently considers the following events, trends and uncertainties to be important to understanding its results and financial position during the periods discussed in this section:
| • | Coca-Cola FEMSA has continued to grow organic volumes at a steady but moderate pace, highlighting Mexico where operative results are strong. However, in the short term there is some pressure from macroeconomic uncertainty in certain South American markets, including currency volatility. Volume growth is mainly driven by the Coca-Cola brand across markets, together with the solid performance of Coca-Cola FEMSA’s still beverage portfolio. |
| • | FEMSA Comercio – Retail Division has maintained high rates of store openings across formats and continues to grow at solid rates in terms of total revenues. FEMSA Comercio – Retail Division has lower operating margins than our beverage business. Given that FEMSA Comercio – Retail Division has lower operating margins and given its fixed cost structure, it is more sensitive to changes in sales which could negatively affect operating margins. In addition, the integration of the new small-format retail businesses could also affect margins at the FEMSA Comercio – Retail Division level, given that these businesses have lower margins than the OXXO stores. |
| • | FEMSA Comercio – Fuel Division has expanded its retail service stations since March 2015. Such division has the lowest operating margins in FEMSA Comercio business portfolio. |
| • | Our consolidated results of operations are also significantly affected by the performance of the Heineken Group, as a result of our 20% economic interest. Our consolidated net income for 2015 included Ps. 5,879 million related to our non-controlling interest in the Heineken Group, as compared to Ps. 5,244 million for 2014. |
Our results and financial position are affected by the economic and market conditions in the countries where our subsidiaries conduct their operations, particularly in Mexico. Changes in these conditions are influenced by a number of factors, including those discussed in “Risk Factors.”
Recent Developments
Effective January 18, 2016, Eduardo Padilla Silva replaced Daniel Rodriguez Cofré as our Chief Financial and Corporate Officer, and Mr. Rodriguez Cofré replaced Mr. Padilla Silva as Chief Executive Officer of FEMSA Comercio.
In February 2016, the Venezuelan government announced a 37.0% devaluation of the official exchange and changed the existing three-tier exchange rate system into a dual system. The official exchange rate (6.30 bolivars per U.S. dollar as of December 31, 2015) and the SICAD exchange rate (13.50 bolivars per U.S. dollar as of December 31, 2015), were merged into a single official exchange rate of 10.00 bolivars per U.S. dollar. The official exchange rate will continue to be determined by the Venezuelan government, while SIMADI will continue to be determined based on supply and demand of U.S. dollars, in which participation does not require authorization by the Venezuelan government. The decision is part of a package of economic policies intended to mitigate the economic crisis of the countries members of the Organization of the Petroleum Exporting Countries (OPEC).
As of this date, there is no specific guidance with respect to the use of the exchange rates available in Venezuela. Coca-Cola FEMSA will closely monitor any further developments, which may affect the exchange rates used by Coca-Cola FEMSA to translate the financial statements of its Venezuelan subsidiary in the future.
Effects of Changes in Economic Conditions
Our results are affected by changes in economic conditions in Mexico, Brazil and in the other countries in which we operate. For the years ended December 31, 2015, 2014, and 2013, 70%, 68% and 63%, respectively, of our total sales were attributable to Mexico. As a result, we have significant exposure to the economic conditions of certain countries, particularly those in Central America, Colombia, Venezuela, Brazil and Argentina, although we continue to generate a substantial portion of our total sales from Mexico. Other than Venezuela, the participation of these other countries as a percentage of our total sales has not changed significantly during the last five years.
59
The Mexican economy is gradually recovering from a downturn as a result of the impact of the global financial crisis on many emerging economies in 2009. According to the Instituto Nacional de Estadística y Geografía of Mexico (National Institute of Statistics and Geography, which we refer to as INEGI), Mexican GDP expanded by 2.5% in 2015 and by approximately 2.1% and 1.4% in 2014 and 2013, respectively. According to the Banco Nacional de México survey regarding the economic expectations of specialists, Mexican GDP is expected to increase by 2.45% in 2016, as of the latest estimate, published on March 2, 2016. The Mexican economy continues to be heavily influenced by the U.S. economy, and therefore, deterioration in economic conditions in, or delays in the recovery of, the U.S. economy may hinder any recovery in Mexico.
Our results are affected by the economic conditions in the countries where we conduct operations. Most of these economies continue to be heavily influenced by the U.S. economy, and therefore, deterioration in economic conditions in the U.S. economy may affect these economies. Deterioration or prolonged periods of weak economic conditions in the countries where we conduct operations may have, and in the past have had, a negative effect on our company and a material adverse effect on our results and financial condition. Our business may also be significantly affected by the interest rates, inflation rates and exchange rates of the currencies of the countries in which we operate. Decreases in growth rates, periods of negative growth and/or increases in inflation or interest rates may result in lower demand for our products, lower real pricing of our products or a shift to lower margin products. In addition, an increase in interest rates would increase the cost to us of variable rate funding, which would have an adverse effect on our financial position.
Beginning in the fourth quarter of 2013 and through 2015, the exchange rate between the Mexican peso and the U.S. dollar fluctuated from a low of Ps. 12.77 per U.S. dollar, to a high of Ps. 17.36 per U.S. dollar. At December 31, 2015, the exchange rate (noon buying rate) was Ps. 17.20 to US$ 1.00. On February 26, 2016, the exchange rate was Ps. 18.1850 to US$ 1.00. A depreciation of the Mexican peso or local currencies in the countries in which we operate relative to the U.S. dollar increases our cost of raw materials priced in U.S. dollars, including raw materials whose prices are set with reference to the U.S. dollar. In addition, a depreciation of the Mexican peso or local currencies in the countries in which we operate relative to the U.S. dollar will increase our U.S. dollar-denominated debt obligations, which could negatively affect our financial position and results. However, this effect could be offset by a corresponding appreciation of our U.S. dollar denominated cash position.
Operating Leverage
Companies with structural characteristics that result in margin expansion in excess of sales growth are referred to as having high “operating leverage.”
The operating subsidiaries of Coca-Cola FEMSA are engaged, to varying degrees, in capital-intensive activities. The high utilization of the installed capacity of the production facilities results in better fixed cost absorption, as increased output results in higher revenues without additional fixed costs. Absent significant increases in variable costs, gross profit margins will expand when production facilities are operated at higher utilization rates. Alternatively, higher fixed costs will result in lower gross profit margins in periods of lower output.
In addition, the commercial operations of Coca-Cola FEMSA are carried out through extensive distribution networks, the principal fixed assets of which are warehouses and trucks and are designed to handle large volumes of beverages. Fixed costs represent an important proportion of the total distribution expense of Coca-Cola FEMSA. Generally, the higher the volume that passes through the distribution system, the lower the fixed distribution cost as a percentage of the corresponding revenues. As a result, operating margins improve when the distribution capacity is operated at higher utilization rates. Alternatively, periods of decreased utilization because of lower volumes will negatively affect our operating margins.
FEMSA Comercio’s operations are characterized by low margin and relatively high fixed costs. These two characteristics make FEMSA Comercio a business with an operating margin that might be affected more easily by a change in sales levels.
60
Critical Accounting Judgments and Estimates
In the application of our accounting policies, which are described in Note 2.3 to our audited consolidated financial statements, management is required to make judgments, estimates and assumptions about the carrying amounts of assets and liabilities that are not readily apparent from other sources. The estimates and associated assumptions are based on historical experience and other factors that are considered to be relevant. Actual results may differ from these estimates. The estimates and underlying assumptions are reviewed on an ongoing basis. Revisions to accounting estimates are recognized in the period in which the estimate is revised if the revision affects only that period or in the period of the revision and future periods if the revision affects both current and future periods.
The following are the key assumptions concerning the future and other key sources of estimation uncertainty at the end of the reporting period that have a significant risk of causing a material adjustment to the carrying amounts of assets and liabilities within the next financial year. Existing circumstances and assumptions about future developments, however, may change due to market changes or circumstances arising beyond our control. Such changes are reflected in the assumptions when they occur.
Impairment of indefinite lived intangible assets, goodwill and depreciable long-lived assets
Intangible assets with indefinite lives including goodwill are subject to annual impairment tests. Impairment exists when the carrying value of an asset or cash generating unit (CGU) exceeds its recoverable amount, which is the higher of its fair value less costs to sell and its value in use. The fair value less costs to sell calculation is based on available data from binding sales transactions in arm’s length transactions of similar assets or observable market prices less incremental costs for disposing of the asset. In order to determine whether such assets are impaired, we initially calculate an estimation of the value in use of the cash-generating units to which such assets have been allocated. The value in use calculation requires management to estimate the future cash flows expected to arise from the cash-generating unit and a suitable discount rate in order to calculate present value. We review annually the carrying value of our intangible assets with indefinite lives and goodwill for impairment based on recognized valuation techniques. While we believe that our estimates are reasonable, different assumptions regarding such estimates could materially affect our evaluations. Impairment losses are recognized in current earnings in the period the related impairment is determined. The key assumptions used to determine the recoverable amount for our CGUs, including a sensitivity analysis, are further explained in Notes 3.16 and 12 to our audited consolidated financial statements.
We assess at each reporting date whether there is an indication that an asset may be impaired. If any indication exists, or when annual impairment testing for an asset is required, we estimate the asset’s recoverable amount. When the carrying amount of an asset or CGU exceeds its recoverable amount, the asset is considered impaired and is written down to its recoverable amount. In assessing value in use, the estimated future cash flows are discounted to their present value using a pre-tax discount rate that reflects current market assessments of the time value of money and the risks specific to the asset. In determining fair value less costs to sell, recent market transactions are taken into account, if available. If no such transactions can be identified, an appropriate valuation model is used. These calculations are corroborated by valuation multiples, quoted share prices for publicly traded subsidiaries or other available fair value indicators.
Useful lives of property, plant and equipment and intangible assets with defined useful lives
Property, plant and equipment, including returnable bottles as they are expected to provide benefits over a period of more than one year, as well as intangible assets with defined useful lives are depreciated/amortized over their estimated useful lives. We base our estimates on the experience of our technical personnel as well as based on our experience in the industry for similar assets, see Notes 3.12, 3.14, 11 and 12 to our audited consolidated financial statements.
61
Post-employment and other long-term employee benefits
We regularly evaluate the reasonableness of the assumptions used in our post-employment and other long-term employee benefit computations. Information about such assumptions is described in Note 16 to our audited consolidated financial statements.
Income taxes
Deferred income tax assets and liabilities are determined based on the differences between the financial statement carrying amounts and the tax basis of assets and liabilities. We regularly review our deferred tax assets for recoverability, and record a deferred tax asset based on our judgment regarding the probability of historical taxable income continuing in the future, projected future taxable income and the expected timing of the reversals of existing temporary differences, see Note 24 to our audited consolidated financial statements.
Tax, labor and legal contingencies and provisions
We are subject to various claims and contingencies, related to tax, labor and legal proceedings as described in Note 25 to our audited consolidated financial statements. Due to their nature, such legal proceedings involve inherent uncertainties including, but not limited to, court rulings, negotiations between affected parties and governmental actions. Management periodically assesses the probability of loss for such contingencies and accrues a provision and/or discloses the relevant circumstances, as appropriate. If the potential loss of any claim or legal proceeding is considered probable and the amount can be reasonably estimated, we accrue a provision for the estimated loss. Management’s judgment must be exercised to determine the likelihood of such a loss and an estimate of the amount, due to the subjective nature of the loss.
Valuation of financial instruments
We are required to measure all derivative financial instruments at fair value. The fair values of derivative financial instruments are determined considering quoted prices in recognized markets. If such instruments are not traded, fair value is determined by applying techniques based upon technical models supported by sufficient reliable and verifiable data, recognized in the financial sector. We base our forward price curves upon market price quotations. Management believes that the chosen valuation techniques and assumptions used are appropriate in determining the fair value of financial instruments, see Note 20 to our audited consolidated financial statements.
Business combinations
Acquisitions of businesses are accounted for using the acquisition method. The consideration transferred in a business combination is measured at fair value, which is calculated as the sum of the acquisition-date fair values of the assets transferred by us, liabilities assumed by us to the former owners of the acquiree and the equity interests issued by us in exchange for control of the acquiree.
At the acquisition date, the identifiable assets acquired and the liabilities assumed are recognized at their fair value, except that:
| • | Deferred tax assets or liabilities, and assets or liabilities related to employee benefit arrangements are recognized and measured in accordance with IAS 12, “Income Taxes” and IAS 19, “Employee Benefits,” respectively; |
| • | Liabilities or equity instruments related to share-based payment arrangements of the acquiree or to our share-based payment arrangements entered into to replace share-based payment arrangements of the acquiree are measured in accordance with IFRS 2, “Share-based Payment” at the acquisition date, see Note 3.24 to our audited consolidated financial statements; and |
| • | Assets (or disposal groups) that are classified as held for sale in accordance with IFRS 5, “Non-current Assets Held for Sale and Discontinued Operations” are measured in accordance with that standard. |
62
Management’s judgment must be exercised to determine the fair value of assets acquired and liabilities assumed.
Goodwill is measured as the excess of the sum of the consideration transferred, the amount of any non-controlling interests in the acquiree, and the fair value of our previously held equity interest in the acquiree (if any) over the net of the acquisition-date amounts of the identifiable assets acquired and the liabilities assumed. If, after reassessment, the net of the acquisition-date amounts of the identifiable assets acquired and liabilities assumed exceeds the sum of the consideration transferred, the amount of any non-controlling interests in the acquiree and the fair value of our previously held interest in the acquiree (if any), the excess is recognized immediately in profit or loss as a bargain purchase gain.
For each business combination, with respect to the non-controlling present ownership interests in the acquiree that entitle their holders to a proportionate share of net assets in liquidation, we elect whether to measure such interests at fair value or at the proportionate share of the acquiree’s identifiable net assets.
Investments in associates
If we hold, directly or indirectly, 20 percent or more of the voting power of the investee, it is presumed that we have significant influence, unless it can be clearly demonstrated that this is not the case. If we hold, directly or indirectly, less than 20 percent of the voting power of the investee, it is presumed that we do not have significant influence, unless such influence can be clearly demonstrated. Decisions regarding the propriety of utilizing the equity method of accounting for a less than 20 percent-owned corporate investee require a careful evaluation of voting rights and their impact on our ability to exercise significant influence. Management considers the existence of the following circumstances which may indicate that we are in a position to exercise significant influence over a less than 20 percent-owned corporate investee:
| • | Representation on the board of directors or equivalent governing body of the investee; |
| • | Participation in policy-making processes, including participation in decisions about dividends or other distributions; |
| • | Material transactions between us and the investee; |
| • | Interchange of managerial personnel; or |
| • | Provision of essential technical information. |
Management also considers the existence and effect of potential voting rights that are currently exercisable or currently convertible when assessing whether we have significant influence.
In addition, we evaluate certain indicators that provide evidence of significant influence, such as:
| • | Whether the extent of our ownership is significant relative to other shareholders (i.e. a lack of concentration of other shareholders); |
| • | Whether our significant shareholders, fellow subsidiaries or officers hold additional investment in the investee; and |
| • | Whether we are part of significant investee committees, such as the executive committee or the finance committee. |
63
Joint arrangements
An arrangement can be a joint arrangement even though not all of its parties have joint control of the arrangement. When we are a party to an arrangement we shall assess whether the contractual arrangement gives all the parties or a group of the parties, control of the arrangement collectively; joint control exists only when decisions about the relevant activities require the unanimous consent of the parties that control the arrangement collectively. Management needs to apply judgment when assessing whether all the parties, or a group of the parties, have joint control of an arrangement. When assessing joint control, management considers the following facts and circumstances:
| • | Whether all the parties, or a group of the parties, control the arrangement, considering the definition of joint control, as described in Note 3.11.2 to our audited consolidated financial statements; and |
| • | Whether decisions about the relevant activities require the unanimous consent of all the parties, or of a group of the parties. |
As mentioned in Note 10 to our audited consolidated financial statements, Coca-Cola FEMSA accounts for its 51% investment at CCFPI as a joint venture using the equity method based on the facts that (i) during a four-year period ending January 25, 2017, all decisions must be approved jointly with The Coca-Cola Company, (ii) following this four-year period, all decisions related to the annual normal operations plan and any other ordinary matters will be approved only by Coca-Cola FEMSA, and (iii) potential voting rights to acquire the remaining 49% of CCFPI are not probable to be executed in the foreseeable future due to the fact the call option was “out of the money” as of December 31, 2015 and 2014.
Venezuela exchange rates and consolidation
As is further explained in Note 3.3 to our audited consolidated financial statements, the exchange rate used to account for foreign currency denominated monetary items arising in Venezuela, and also the exchange rate used to translate the financial statements of our Venezuelan subsidiary for group reporting purposes are both key sources of estimation uncertainty in preparing the accompanying consolidated financial statements.
As is also explained in Note 3.3 to our audited consolidated financial statements, the Company believes that it currently controls its subsidiary operations in Venezuela but recognizes the challenging economic and political environment in Venezuela. Should the Company in the future conclude that it no longer controls such operations, its consolidated financial statements would change by material amounts.
Future Impact of Recently Issued Accounting Standards not yet in Effect
We have not applied the following new and revised IFRS and IAS that have been issued but were not yet effective up to the date of issuance of our consolidated financial statements. We intend to adopt these standards, if applicable, when they become effective:
IFRS 9, Financial Instruments
In July 2014, the IASB issued the final version of IFRS 9 Financial Instruments which reflects all phases of the financial instruments project and replaces IAS 39 Financial Instruments: Recognition and Measurement and all previous versions of IFRS 9. The standard introduces new requirements for classification and measurement, impairment, and hedge accounting. IFRS 9 is effective for annual periods beginning on or after January 1, 2018, with early application permitted. The transition to IFRS 9 differs by requirements and is partly retrospective and partly prospective. We have not early adopted this IFRS, and we have yet to complete our evaluation of whether it will have a material impact on our consolidated financial statements.
IFRS 15, Revenue from Contracts with Customers
IFRS 15, “Revenue from Contracts with Customers,” was originally issued in May 2014, and applies to annual reporting periods beginning on or after January 1, 2018, earlier application is permitted. Revenue is recognized as control is passed, either over time or at a point in time.
64
The standard outlines a single comprehensive model for entities to use in accounting for revenue arising from contracts with customers and supersedes most current revenue recognition guidance, including industry-specific guidance. In applying the revenue model to contracts within its scope, an entity will: 1) identify the contract(s) with a customer; 2) identify the performance obligations in the contract; 3) determine the transaction price; 4) allocate the transaction price to the performance obligations in the contract; and 5) recognize revenue when (or as) the entity satisfies a performance obligation. Also, an entity needs to disclose sufficient information to enable users of financial statements to understand the nature, amount, timing and uncertainty of revenue and cash flows arising from contracts with customers. We have yet to complete our evaluation of whether there will be a significant impact as a consequence of this standard’s adoption; nonetheless most of our operations would recognize revenue at a single point in time, which is when we transfer goods or services to a customer. We do not expect a potential significant impact on our consolidated financial statements and we expect to complete our evaluation during 2017.
IFRS 16, Leases
IFRS 16 “Leases” was issued in January 2016 and supersedes IAS 17 “Leases” and related interpretations. The new standard brings most leases on-balance sheet for lessees under a single model, eliminating the distinction between operating and finance leases. Lessor accounting, however, remains largely unchanged and the distinction between operating and finance leases is retained. IFRS 16 is effective for periods beginning on or after January 1, 2019, with earlier adoption permitted if IFRS 15 ‘Revenue from Contracts with Customers’ has also been applied.
Under IFRS 16 a lessee recognizes a right-of-use asset and a lease liability. The right-of-use asset is treated similarly to other non-financial assets and depreciated accordingly and the liability accrues interest. This will typically produce a front-loaded expense profile (whereas operating leases under IAS 17 would typically have had straight-line expenses) as an assumed linear depreciation of the right-of-use asset and the decreasing interest on the liability will lead to an overall decrease of expense over the life of the lease.
The lease liability is initially measured at the present value of the lease payments payable over the lease term, discounted at the rate implicit in the lease if that can be readily determined. If that rate cannot be readily determined, the lessee shall use their incremental borrowing rate. However, a lessee may elect to account for lease payments as an expense on a straight-line basis over the lease term for leases with a lease term of 12 months or less and containing no purchase options (this election is made by class of underlying asset); and leases where the underlying asset has a low value when new, such as personal computers or small items of office furniture (this election can be made on a lease-by-lease basis). We have yet to complete our evaluation of whether we will have a potential impact as a consequence of this standard’s adoption, although given the nature of the Company’s operations, we will expect a significant impact on our consolidated financial statements.
Amendments to IAS 7, Disclosure Initiative
The amendments to IAS 7 Statement of Cash Flows require that the following changes in liabilities arising from financing activities are disclosed separately from changes in other assets and liabilities: (i) changes from financing cash flows; (ii) changes arising from obtaining or losing control of subsidiaries or other businesses; (iii) the effect of changes in foreign exchange rates; (iv) changes in fair values; and (v) other changes. One way to fulfill the new disclosure requirement is to provide a reconciliation between the opening and closing balances in the statement of financial position for liabilities arising from financing activities.
Liabilities arising from financing activities are those for which cash flows were, or future cash flows will be, classified in the statement of cash flows as cash flows from financing activities. The new disclosure requirements also relate to changes in financial assets if they meet the same definition. These amendments are effective for annual periods beginning on or after January 1, 2017 with earlier application permitted, and entities need not provide comparative information when they first apply them. We are in the process of assessing the potential impacts from the adoption of these amendments in our financial statements.
65
Operating Results
The following table sets forth our consolidated income statement under IFRS for the years ended December 31, 2015, 2014, and 2013:
|
|
Year Ended December 31, | |||||||||||||||
| 2015(1) | 2015 | 2014 | 2013 | |||||||||||||
| (in millions of U.S. dollars and Mexican pesos) | ||||||||||||||||
| Net sales |
$ | 18,078 | Ps. 310,849 | Ps. 262,779 | Ps. 256,804 | |||||||||||
| Other operating revenues |
43 | 740 | 670 | 1,293 | ||||||||||||
|
|
|
|
|
|
|
|
|
|||||||||
| Total revenues |
18,121 | 311,589 | 263,449 | 258,097 | ||||||||||||
| Cost of goods sold |
10,957 | 188,410 | 153,278 | 148,443 | ||||||||||||
|
|
|
|
|
|
|
|
|
|||||||||
| Gross profit |
7,164 | 123,179 | 110,171 | 109,654 | ||||||||||||
| Administrative expenses |
681 | 11,705 | 10,244 | 9,963 | ||||||||||||
| Selling expenses |
4,442 | 76,375 | 69,016 | 69,574 | ||||||||||||
| Other income |
24 | 423 | 1,098 | 651 | ||||||||||||
| Other expenses |
(159 | ) | (2,741 | ) | (1,277 | ) | (1,439 | ) | ||||||||
| Interest expense |
(452 | ) | (7,777 | ) | (6,701 | ) | (4,331 | ) | ||||||||
| Interest income |
59 | 1,024 | 862 | 1,225 | ||||||||||||
| Foreign exchange loss, net |
(69 | ) | (1,193 | ) | (903 | ) | (724 | ) | ||||||||
| Monetary position loss, net |
(2 | ) | (36 | ) | (319 | ) | (427 | ) | ||||||||
| Market value gain on financial instruments |
21 | 364 | 73 | 8 | ||||||||||||
|
|
|
|
|
|
|
|
|
|||||||||
| Income before income taxes and share of the profit of associates and joint ventures accounted for using the equity method |
1,463 | 25,163 | 23,744 | 25,080 | ||||||||||||
| Income taxes |
461 | 7,932 | 6,253 | 7,756 | ||||||||||||
| Share of the profit of associates and joint ventures accounted for using the equity method, net of taxes |
352 | 6,045 | 5,139 | 4,831 | ||||||||||||
|
|
|
|
|
|
|
|
|
|||||||||
| Consolidated net income |
$ | 1,354 | Ps. 23,276 | Ps. 22,630 | Ps. 22,155 | |||||||||||
|
|
|
|
|
|
|
|
|
|||||||||
| Controlling interest net income |
1,029 | 17,683 | 16,701 | 15,922 | ||||||||||||
| Non-controlling interest net income |
325 | 5,593 | 5,929 | 6,233 | ||||||||||||
|
|
|
|
|
|
|
|
|
|||||||||
| Consolidated net income |
$ | 1,354 | Ps. 23,276 | Ps. 22,630 | Ps. 22,155 | |||||||||||
|
|
|
|
|
|
|
|
|
|||||||||
| (1) | Translation to U.S. dollar amounts at an exchange rate of Ps. 17.1950 to US$ 1.00, provided solely for the convenience of the reader. |
66
The following table sets forth certain operating results by reportable segment under IFRS for each of our segments for the years ended December 31, 2015, 2014 and 2013.
| Year Ended December 31, | ||||||||||||||||||||
| 2015 | 2014 | 2013 | 2015 vs. 2014 | 2014 vs. 2013 | ||||||||||||||||
| (in millions of Mexican pesos, except margins) | Percentage Growth (Decrease) | |||||||||||||||||||
| Net sales |
||||||||||||||||||||
| Coca-Cola FEMSA |
Ps. 151,914 | Ps. 146,948 | Ps. 155,175 | 3.4 | % | (5.3 | %) | |||||||||||||
| FEMSA Comercio – Retail Division |
132,891 | 109,624 | 97,572 | 21.2 | % | 12.4 | % | |||||||||||||
| FEMSA Comercio – Fuel Division |
18,510 | — | — | — | — | |||||||||||||||
| Total revenues |
||||||||||||||||||||
| Coca-Cola FEMSA |
152,360 | 147,298 | 156,011 | 3.4 | % | (5.6 | %) | |||||||||||||
| FEMSA Comercio – Retail Division |
132,891 | 109,624 | 97,572 | 21.2 | % | 12.4 | % | |||||||||||||
| FEMSA Comercio – Fuel Division |
18,510 | — | — | — | — | |||||||||||||||
| Cost of goods sold |
||||||||||||||||||||
| Coca-Cola FEMSA |
80,330 | 78,916 | 83,076 | 1.8 | % | (5.0 | %) | |||||||||||||
| FEMSA Comercio – Retail Division |
85,600 | 70,238 | 62,986 | 21.9 | % | 11.5 | % | |||||||||||||
| FEMSA Comercio – Fuel Division |
17,090 | — | — | — | — | |||||||||||||||
| Gross profit |
||||||||||||||||||||
| Coca-Cola FEMSA |
72,030 | 68,382 | 72,935 | 5.3 | % | (6.2 | %) | |||||||||||||
| FEMSA Comercio – Retail Division |
47,291 | 39,386 | 34,586 | 20.1 | % | 13.9 | % | |||||||||||||
| FEMSA Comercio – Fuel Division |
1,420 | — | — | — | — | |||||||||||||||
| Administrative expenses |
||||||||||||||||||||
| Coca-Cola FEMSA |
6,405 | 6,385 | 6,487 | 0.3 | % | (1.6 | %) | |||||||||||||
| FEMSA Comercio – Retail Division |
2,868 | 2,042 | 1,883 | 40.5 | % | 8.4 | % | |||||||||||||
| FEMSA Comercio – Fuel Division |
88 | — | — | — | — | |||||||||||||||
| Selling expenses |
||||||||||||||||||||
| Coca-Cola FEMSA |
41,879 | 40,465 | 44,828 | 3.5 | % | (9.7 | %) | |||||||||||||
| FEMSA Comercio – Retail Division |
33,305 | 28,492 | 24,707 | 16.9 | % | 15.3 | % | |||||||||||||
| FEMSA Comercio – Fuel Division |
1,124 | — | — | — | — | |||||||||||||||
| Depreciation |
||||||||||||||||||||
| Coca-Cola FEMSA |
6,310 | 6,072 | 6,371 | 3.9 | % | (4.7 | %) | |||||||||||||
| FEMSA Comercio – Retail Division |
3,182 | 2,779 | 2,328 | 14.5 | % | 19.4 | % | |||||||||||||
| FEMSA Comercio – Fuel Division |
56 | — | — | — | — | |||||||||||||||
| Gross margin(1)(2) |
||||||||||||||||||||
| Coca-Cola FEMSA |
47.3 | % | 46.4 | % | 46.7 | % | 0.9p.p. | (0.3p.p. | ) | |||||||||||
| FEMSA Comercio – Retail Division |
35.6 | % | 35.9 | % | 35.4 | % | (0.3 | )p.p. | 0.5p.p. | |||||||||||
| FEMSA Comercio – Fuel Division |
7.7 | % | — | — | — | — | ||||||||||||||
| Share of the profit of associates and joint ventures accounted for using the equity method, net of taxes |
||||||||||||||||||||
| Coca-Cola FEMSA |
155 | (125 | ) | 289 | 224 | %(5) | (143.3 | %)(4) | ||||||||||||
| FEMSA Comercio – Retail Division |
(10 | ) | 37 | 11 | (127 | %)(6) | 236.4 | % | ||||||||||||
| FEMSA Comercio – Fuel Division |
— | — | — | — | — | |||||||||||||||
| CB Equity(3) |
5,879 | 5,244 | 4,587 | 12.1 | % | 14.3 | % | |||||||||||||
| (1) | Gross margin is calculated with reference to total revenues. |
| (2) | As used herein, p.p. refers to a percentage point increase (or decrease) contrasted with a straight percentage increase (or decrease). |
| (3) | CB Equity holds Heineken N.V. and Heineken Holding N.V. shares. |
| (4) | Reflects the percentage decrease between the gain of Ps. 289 million recorded in 2013 and the loss of Ps. 125 million recorded in 2014. |
| (5) | Reflects the percentage increase between the loss of Ps. 125 million recorded in 2014 and the gain of Ps. 155 million recorded in 2015. |
| (6) | Reflects the percentage decrease between the gain of Ps. 37 million recorded in 2014 and the loss of Ps. 10 million recorded in 2015. |
67
Results from our Operations for the Year Ended December 31, 2015 Compared to the Year Ended December 31, 2014
FEMSA Consolidated
FEMSA’s consolidated total revenues increased 18.3% to Ps. 311,589 million in 2015 compared to Ps. 263,449 million in 2014. Coca-Cola FEMSA’s total revenues increased 3.4% to Ps. 152,360 million, driven by the local currency average price per unit case growth in all of their operations and volume growth in Mexico, Central America, Colombia and Argentina. FEMSA Comercio – Retail Division’s revenues increased 21.2% to Ps. 132,891 million, driven by the integration of Socofar and the opening of 1,208 net new OXXO stores combined with an average increase of 6.9% in same-store sales. FEMSA Comercio – Fuel Division’s revenues amounted Ps. 18,510 million in 2015.
Consolidated gross profit increased 11.8% to Ps. 123,179 million in 2015 compared to Ps. 110,171 million in 2014. Gross margin decreased 230 basis points to 39.5% of consolidated total revenues compared to 2014, reflecting the creation of FEMSA Comercio – Fuel Division, which has a lower margin than the rest of FEMSA’s business units, and a margin contraction at FEMSA Comercio – Retail Division driven by the integration of Socofar.
Consolidated administrative expenses increased 14.3% to Ps. 11,705 million in 2015 compared to Ps. 10,244 million in 2014, driven by higher expenses related to the integration of Socofar into FEMSA Comercio – Retail Division. As a percentage of total revenues, consolidated administrative expenses decreased 10 basis points, from 3.9% in 2014 to 3.8% in 2015.
Consolidated selling expenses increased 10.7% to Ps. 76,375 million in 2015 as compared to Ps. 69,016 million in 2014, mainly driven by incremental expenses at FEMSA Comercio – Retail Division, in particular the integration of Socofar into FEMSA Comercio – Retail Division’s business. As a percentage of total revenues, selling expenses decreased 160 basis points, from 26.1% in 2014 to 24.5% in 2015.
Some of our subsidiaries pay management fees to us in consideration for corporate services we provide to them. These fees are recorded as administrative expenses in the respective business segments. Our subsidiaries’ payments of management fees are eliminated in consolidation and, therefore, have no effect on our consolidated operating expenses.
Other income mainly includes gains on sales of property, plant and equipment. During 2015, other income decreased to Ps. 682 million from Ps. 1,098 million in 2014, reflecting a difficult comparable base in 2014, when we registered the write-off of certain contingencies.
Other expenses mainly include disposal and impairment of long-lived assets, contingencies, as well as their subsequent interest and penalties, severance payments derived from restructuring programs and donations. During 2015, other expenses increased to Ps. 3,000 million from Ps. 1,277 million in 2014 driven by operative currency fluctuation effects at Coca-Cola FEMSA and, to a lesser extent, by incremental disposals of certain fixed assets at FEMSA Comercio – Retail Division.
Net financing expenses increased to Ps. 7,618 million from Ps. 6,988 million in 2014, driven by an interest expense of Ps. 7,777 million in 2015 compared to Ps. 6,701 million in 2014, resulting mainly from higher interest expenses at Coca-Cola FEMSA Brazil following the reset of terms of certain cross-currency swaps related to the acquisitions of Spaipa and Fluminense in 2013.
Our accounting provision for income taxes in 2015 was Ps. 7,932 million, as compared to Ps. 6,253 million in 2014, resulting in an effective tax rate of 31.5% in 2015, as compared to 26.3% in 2014, in line with our expected medium-term range of low 30’s. The lower effective tax rate registered during 2014 is mainly related to a one-time benefit resulting from the settlement of certain contingent tax liabilities under the tax amnesty program offered by the Brazilian tax authorities, which was registered during 2014.
Share of the profit of associates and joint ventures accounted for using the equity method, net of taxes, increased 17.6% to Ps. 6,045 million in 2015 compared with Ps. 5,139 million in 2014, mainly driven by an increase in FEMSA’s 20% participation in Heineken’s results.
Consolidated net income was Ps. 23,276 million in 2015 compared to Ps. 22,630 million in 2014, mainly as a result of growth in FEMSA’s income before income taxes combined with an increase in FEMSA’s 20% participation in Heineken’s results, which more than compensated for higher interest expenses. Controlling interest amounted to Ps. 17,683 million in 2015 compared to Ps. 16,701 million in 2014. Controlling interest in 2015 per FEMSA BD Unit was Ps. 4.94 (US$ 2.87 per ADS).
68
Coca-Cola FEMSA
The comparability of Coca-Cola FEMSA’s underlying financial and operating performance in 2015 as compared to 2014 was affected by the following factors: (1) translation effects from fluctuations in exchange rates and (2) results of operations in territories that are considered hyperinflationary economies (currently, the only operation that is considered a hyperinflationary economy is Venezuela). To translate the full-year 2015 reported results of Venezuela, we used the SIMADI exchange rate of 198.70 bolivars per U.S. dollar, as compared to 49.99 bolivars per U.S. dollar used to translate our 2014 reported results. In addition, the average depreciations to the U.S. dollar of currencies used in Coca-Cola FEMSA’s main operations during 2015, as compared to 2014, were: 41.6% for the Brazilian real, 37.0% for the Colombian peso, 19.2% for the Mexican peso and 14.1% for the Argentine peso.
Coca-Cola FEMSA’s reported consolidated total revenues increased 3.4% to Ps.152,360 million in 2015 despite the negative translation effect resulting from using the SIMADI exchange rate to translate the results of Coca-Cola FEMSA’s Venezuelan operations and the depreciation of the Brazilian real, the Colombian peso, the Mexican peso and the Argentine peso. Excluding the effect of currency fluctuations and the results of Coca-Cola FEMSA’s Venezuelan operations, total revenues would have grown 8.6%, driven by the growth of the average price per unit case in all of Coca-Cola FEMSA’s operations and volume growth in Mexico, Central America, Colombia and Argentina.
Total reported sales volume increased 0.5% to 3,435.6 million unit cases in 2015, as compared to 2014. Excluding the results of Coca-Cola FEMSA’s Venezuelan operations, total volume would have grown 0.7% in 2015, as compared to 2014. Coca-Cola FEMSA’s sparkling beverage portfolio grew 0.5% as compared to 2014. Excluding the results of Coca-Cola FEMSA’s Venezuelan operations, the sparkling beverage portfolio would have grown 0.7% as a result of positive performance of the Coca-Cola brand in Mexico, Colombia and Central America, and Coca-Cola FEMSA’s flavored sparkling beverage portfolio in Mexico, Colombia, Argentina and Central America. The still beverage category grew 4.9% as compared to 2014. Excluding the results of Coca-Cola FEMSA’s Venezuelan operations, the still beverage category would have grown 6.5% driven by the positive performance of Jugos del Valle juice in Colombia, Mexico and Central America; ValleFrut orangeade in Mexico and Brazil; the Powerade brand across most of Coca-Cola FEMSA’s territories and the Santa Clara dairy business in Mexico. Bottled water, excluding bulk water, grew 2.3% as compared to 2014. Excluding the results of Coca-Cola FEMSA’s Venezuelan operations, bottled water, excluding bulk water, would have grown 1.8%, driven by growth in Colombia, Argentina, Brazil and Central America. Bulk water decreased 2.9% as compared to 2014, mainly driven by a contraction of the Ciel brand in Mexico.
Consolidated reported average price per unit case grew 3.5% reaching Ps.42.34 in 2015, as compared to Ps.40.92 in 2014, despite the negative translation effect resulting from using the SIMADI exchange rate to translate the results of Coca-Cola FEMSA’s Venezuelan operations and the depreciation of the Brazilian real, the Colombian peso and the Argentine peso. Excluding the effect of currency fluctuations and the results of Coca-Cola FEMSA’s Venezuelan operations, average price per unit case would have grown 8.8% in 2015, driven by average price per unit case increases in local currency in each of Coca-Cola FEMSA’s operations.
Coca-Cola FEMSA’s reported gross profit increased 5.3% to Ps.72,030 million in 2015, with a gross margin expansion of 90 basis points. Excluding the effect of currency fluctuations and Coca-Cola FEMSA’s Venezuelan operations described above, gross profit would have grown 10.3%, with a gross margin expansion of 70 basis points. In local currency, the benefit of lower sweetener and PET prices, in combination with Coca-Cola FEMSA’s currency hedging strategy, was partially offset by the depreciation of the average exchange rate of the Brazilian real, the Colombian peso, the Mexican peso and the Argentine peso as applied to U.S. dollar-denominated raw material costs.
For Coca-Cola FEMSA, components of cost of goods sold include raw materials (principally concentrate, sweeteners and packaging materials), depreciation costs attributable to Coca-Cola FEMSA’s production facilities, wages and other labor costs at Coca-Cola FEMSA’s production facilities and certain overhead costs. Concentrate prices are determined as a percentage of the retail price of Coca-Cola FEMSA’s products in the local currency, net of applicable taxes. Packaging materials, mainly PET and aluminum, and HFCS, used as a sweetener in some countries, are denominated in U.S. dollars.
69
Reported administrative and selling expenses as a percentage of total revenues decreased 10 basis points to 31.7% in 2015 as compared to 2014. Reported administrative and selling expenses in absolute terms increased 3.1% as compared to 2014. Excluding the effect of currency fluctuations and the results of Coca-Cola FEMSA’s Venezuelan operations, administrative and selling expenses as a percentage of total revenues would have remained flat and absolute administrative and selling expenses would have grown 8.7% as compared to 2014. In local currency, operating expenses decreased, as a percentage of revenues in Mexico, Venezuela and Argentina. In 2015, we continued investing across Coca-Cola FEMSA’s territories to support marketplace execution, increase cooler coverage and bolster returnable presentation base.
During 2015, Coca-Cola FEMSA’s other operative expenses recorded a net expense of Ps.1,748 million, mainly due to certain restructuring charges and the negative operating currency fluctuation effects across Coca-Cola FEMSA’s territories.
In 2015, Coca-Cola FEMSA reported a gain of Ps.155 million in the share of the profits of associates and joint ventures line, mainly due to an equity method gain from Coca-Cola FEMSA’s participation in associated companies and in CCFPI.
As used by Coca-Cola FEMSA, the term “comprehensive financing result” refers to the combined financial effects of net interest expenses, net financial foreign exchange gains or losses, and net gains or losses on the monetary position of hyperinflationary countries where Coca-Cola FEMSA operates. Net financial foreign exchange gains or losses represent the impact of changes in foreign exchange rates on financial assets or liabilities denominated in currencies other than local currencies, and gains or losses resulting from derivative financial instruments. A financial foreign exchange loss arises if a liability is denominated in a foreign currency that appreciates relative to the local currency between the date the liability is incurred or the beginning of the period, whichever occurs first, and the date it is repaid or the end of the period, whichever occurs first, as the appreciation of the foreign currency results in an increase in the amount of local currency, which must be exchanged to repay the specified amount of the foreign currency liability.
Reported comprehensive financing result in 2015 recorded an expense of Ps.7,273 million as compared to an expense of Ps.6,422 million in 2014. This increase was mainly driven by a foreign exchange loss as a result of the depreciation of the end-of-period exchange rate of the Mexican peso during the year, as applied to Coca-Cola FEMSA’s U.S. dollar-denominated net debt position.
During 2015, reported income tax, as a percentage of income before taxes, was 30.6% as compared to 26.0% in 2014. The lower effective tax rate registered during 2014 is mainly related to a one-time benefit resulting from the settlement of certain contingent tax liabilities under the tax amnesty program offered by the Brazilian tax authorities, which was not repeated in 2015.
Coca-Cola FEMSA’s reported consolidated net controlling interest income reached Ps. 10,235 million in 2015 as compared to Ps. 10,542 million in 2014. Earnings per share in 2015 were Ps. 4.94 (Ps. 49.37 per ADS) computed on the basis of 2,072.9 million shares outstanding (each ADS represents 10 Series L shares).
FEMSA Comercio – Retail Division
FEMSA Comercio – Retail Division total revenues increased 21.2% to Ps. 132,891 million in 2015 compared to Ps. 109,624 million in 2014, primarily as a result of the opening of 1,208 net new OXXO stores during 2015, together with an average increase in same-store sales of 6.9%, as well as the additional revenues from the acquisitions of Socofar and Farmacias Farmacon drugstores in Chile and Mexico, respectively. As of December 31, 2015, there were a total of 14,061 OXXO stores. As referenced above, FEMSA Comercio – Retail Division’s same-store sales increased an average of 6.9% compared to 2014, driven by a 5.1% increase in average customer ticket while store traffic increased 1.7%.
70
Cost of goods sold increased 21.9% to Ps. 85,600 million in 2015, compared with Ps. 70,238 million in 2014. Gross margin contracted 30 basis points to reach 35.6% of total revenues. This decrease was mainly driven by the integration of the Farmacias Farmacon and Socofar drugstores, both of which have lower gross margins than the OXXO operations.
Administrative expenses increased 40.5% to Ps. 2,868 million in 2015, compared with Ps. 2,042 million in 2014, reaching 2.2% of sales. Selling expenses increased 16.9% to Ps. 33,305 million in 2015 compared with Ps. 28,492 million in 2014. The increase in operating expenses was driven by (i) expenses related to the incorporation of the Socofar and Farmacias Farmacon drugstore operations, (ii) the strong organic growth in new stores across formats and (iii) the strengthening of FEMSA Comercio’s business and organizational structure in preparation for the growth of new operations, particularly drugstores.
FEMSA Comercio – Fuel Division
The operations that comprise the FEMSA Comercio – Fuel Division were integrated in 2015. As such, no results of operation are available for this segment for periods prior to 2015.
FEMSA Comercio – Fuel Division total revenues amounted to Ps. 18,510 million in 2015. Cost of goods sold reached Ps. 17,090 million in 2015 and administrative expenses amounted to Ps. 88 million in 2015. Selling expenses reached Ps. 1,124 million in 2015.
Results from our Operations for the Year Ended December 31, 2014 Compared to the Year Ended December 31, 2013
FEMSA Consolidated
FEMSA’s consolidated total revenues increased 2.1% to Ps. 263,449 million in 2014 compared to Ps. 258,097 million in 2013. Coca-Cola FEMSA’s total revenues decreased 5.6% to Ps. 147,298 million, driven by the negative translation effect resulting from using the system known as the Sistema Complementario de Administración de Divisas II, or SICAD II exchange rate to translate the Venezuelan operations. FEMSA Comercio’s revenues increased 12.4% to Ps. 109,624 million, mainly driven by the opening of 1,132 net new stores combined with an average increase of 2.7% in same-store sales.
Consolidated gross profit increased 0.5% to Ps. 110,171 million in 2014 compared to Ps. 109,654 million in 2013. Gross margin decreased 70 basis points to 41.8% of consolidated total revenues compared to 2013, reflecting margin contraction at Coca-Cola FEMSA.
Consolidated administrative expenses increased 2.8% to Ps. 10,244 million in 2014 compared to Ps. 9,963 million in 2013. As a percentage of total revenues, consolidated administrative expenses remained stable at 3.9% in 2014.
Consolidated selling expenses decreased 0.8% to Ps. 69,016 million in 2014 as compared to Ps. 69,574 million in 2013. As a percentage of total revenues, selling expenses decreased 80 basis points, from 26.9% in 2013 to 26.1% in 2014.
Some of our subsidiaries pay management fees to us in consideration for corporate services we provide to them. These fees are recorded as administrative expenses in the respective business segments. Our subsidiaries’ payments of management fees are eliminated in consolidation and, therefore, have no effect on our consolidated operating expenses.
Other income mainly includes gains on sales of shares and long-lived assets and the write-off of certain contingencies. During 2014, other income increased to Ps. 1,098 million from Ps. 651 million in 2013, primarily driven by the write-off of certain contingencies.
Other expenses mainly include disposal and impairment of long-lived assets, contingencies, as well as their subsequent interest and penalties, severance payments derived from restructuring programs and donations. During 2014, other expenses decreased to Ps. 1,277 million from Ps. 1,439 million in 2013.
71
Net financing expenses increased to Ps. 6,988 million from Ps. 4,249 million in 2013, driven by an interest expense of Ps. 6,701 million in 2014 compared to Ps. 4,331 million in 2013 resulting from higher financing expenses related to bonds issued in 2014 by FEMSA and Coca-Cola FEMSA.
Our accounting provision for income taxes in 2014 was Ps. 6,253 million, as compared to Ps. 7,756 million in 2013, resulting in an effective tax rate of 26.3% in 2014, as compared to 30.9% in 2013, mainly driven by a lower effective tax rate registered during 2014 in Coca-Cola FEMSA.
Share of the profit of associates and joint ventures accounted for using the equity method, net of taxes, increased 6.4% to Ps. 5,139 million in 2014 compared with Ps. 4,831 million in 2013, mainly driven by an increase in FEMSA’s participation in Heineken results.
Consolidated net income was Ps. 22,630 million in 2014 compared to Ps. 22,155 million in 2013, resulting from a lower tax rate combined with an increase in FEMSA’s 20% participation in Heineken’s results, which more than compensated for higher financing expenses related to bonds issued in 2014 by Coca-Cola FEMSA and FEMSA. Controlling interest amounted to Ps. 16,701 million in 2014 compared to Ps. 15,922 million in 2013. Controlling interest in 2014 per FEMSA Unit was Ps. 4.67 (US$ 3.16 per ADS).
Coca-Cola FEMSA
Coca-Cola FEMSA’s reported consolidated total revenues decreased 5.6% to Ps. 147,298 million in 2014 driven by the negative translation effect resulting from using the SICAD II exchange rate to translate the results of its Venezuelan operations. Excluding the recently integrated territories of Companhia Fluminense and Spaipa in Brazil and the integration of Grupo Yoli in Mexico, total revenues were Ps. 134,088. On a currency neutral basis and excluding the non-comparable effect of Fluminense and Spaipa in Brazil, and Grupo Yoli in Mexico, total revenues grew 24.7%, driven by average price per unit case growth in most of our territories and volume growth in Brazil, Colombia, Venezuela and Central America.
Total sales volume increased 6.6% to 3,417.3 million unit cases in 2014, as compared to 2013. Excluding the integration of Grupo Yoli in Mexico and Fluminense and Spaipa in Brazil, volumes declined 0.7% to 3,182.8 million unit cases, mainly due to the volume contraction originated by the price increases implemented due to the excise tax in Mexico. On the same basis, the bottled water portfolio grew 5.0%, driven by Crystal in Brazil, Aquarius and Bonaqua in Argentina, Nevada in Venezuela and Manantial in Colombia. The still beverage category grew 1.9%, mainly driven by the performance of the Jugos del Valle line of business in Colombia, Venezuela and Brazil, and Powerade across most of Coca-Cola FEMSA’s territories. These increases partially compensated the performance of Coca-Cola FEMSA’s sparkling beverage category which declined 0.9% driven by the volume contraction in Mexico and a 3.5% volume decline in its bulk water business.
Consolidated average price per unit case decreased 13.2% reaching Ps. 40.92 in 2014, as compared to Ps. 47.15 in 2013. This decline was driven by the previously mentioned negative translation effect in Venezuela. In local currency, average price per unit case increased in all of Coca-Cola FEMSA’s territories, with the exception of Colombia.
Gross profit decreased 6.2% to Ps. 68,382 million in 2014. This decline was driven by the previously mentioned negative translation effect in Venezuela. In local currency, lower sweetener and PET prices in most of Coca-Cola FEMSA’s operations were offset by the depreciation of the average exchange rate of the Argentine peso, the Brazilian reais, the Colombian peso and the Mexican peso as applied to Coca-Cola FEMSA’s U.S. dollar-denominated raw material costs. Reported gross margin reached 46.4% in 2014.
For Coca-Cola FEMSA the component of cost of goods sold include raw materials (principally concentrate, sweeteners and packaging materials), depreciation costs attributable to Coca-Cola FEMSA’s production facilities, wages and other employment costs associated with labor force employed at its production facilities and certain overhead costs. Concentrate prices are determined as a percentage of the retail price of Coca-Cola FEMSA’s products in the local currency, net of applicable taxes. Packaging materials, mainly PET and aluminum, and HFCS, used as a sweetener in some countries, are denominated in U.S. dollars.
72
Administrative and selling expenses as a percentage of total revenues decreased 110 basis points to 31.8% in 2014 as compared to 2013. Administrative and selling expenses in absolute terms decreased 8.7% mainly as a result of the lower contribution of Venezuela, which was driven by the previously mentioned negative translation effect. In local currency, operating expenses decreased as a percentage of revenues in most of Coca-Cola FEMSA’s operations, despite of continued marketing investments across its territories to support Coca-Cola FEMSA’s marketplace execution and bolster its returnable presentation base, higher labor costs in Venezuela and Argentina, and higher freight costs in Brazil and Venezuela.
As used by Coca-Cola FEMSA, the term “comprehensive financing result” refers to the combined financial effects of net interest expenses, net financial foreign exchange gains or losses, and net gains or losses on monetary position from the hyperinflationary countries in which Coca-Cola FEMSA operates. Net financial foreign exchange gains or losses represent the impact of changes in foreign-exchange rates on financial assets or liabilities denominated in currencies other than local currencies and gains or losses resulting from derivative financial instruments. A financial foreign exchange loss arises if a liability is denominated in a foreign currency that appreciates relative to the local currency between the date the liability is incurred or the beginning of the period, whichever comes first, and the date it is repaid or the end of the period, whichever comes first, as the appreciation of the foreign currency results in an increase in the amount of local currency, which must be exchanged to repay the specified amount of the foreign currency liability.
Comprehensive financing result in 2014 recorded an expense of Ps. 6,422 million as compared to an expense of Ps. 3,773 million in 2013. This increase was mainly driven by (i) higher interest expenses due to a larger debt position and (ii) a foreign exchange loss mainly as a result of the depreciation of the end-of-period exchange rate of the Mexican peso during the year, as applied to a higher US dollar-denominated net debt position.
During 2014, income tax, as a percentage of income before taxes, was 25.8% as compared to 33.3% in 2013. The lower effective tax rate registered during 2014 is mainly related to (i) a smaller contribution from our Venezuelan subsidiary (resulting from the use of the SICAD II rate for translation purposes) which carries a higher effective tax rate, (ii) the inflationary tax effects in Venezuela, and (iii) a one-time benefit resulting from the settlement of certain contingent tax liabilities under the tax amnesty program offered by the Brazilian tax authorities, which was registered during the third quarter of 2014.
Coca-Cola FEMSA’s consolidated net controlling interest income reached Ps. 10,542 million in 2014 as compared to Ps. 11,543 million in 2013. Earnings per share in the full year of 2014 were 5.09 (Ps. 50.86 per ADS) computed on the basis of 2,072.9 million shares outstanding (each ADS represents 10 Series L shares).
FEMSA Comercio
FEMSA Comercio total revenues increased 12.4% to Ps. 109,624 million in 2014 compared to Ps. 97,572 million in 2013, primarily as a result of the opening of 1,132 net new stores during 2014, together with an average increase in same-store sales of 2.7%. As of December 31, 2014, there were a total of 12,853 stores. FEMSA Comercio same-store sales increased an average of 2.7% compared to 2013, driven by a 2.7% increase in average customer ticket while store traffic remained stable.
Cost of goods sold increased 11.5% to Ps. 70,238 million in 2014, below total revenue growth, compared with Ps. 62,986 million in 2013. Gross margin expanded 50 basis points to reach 35.9% of total revenues. This increase reflects a more effective collaboration and execution with our key supplier partners, including higher and more efficient joint use of promotion-related resources, as well as objective-based incentives.
Administrative expenses increased 8.4% to Ps. 2,042 million in 2014, compared with Ps. 1,883 million in 2013; however, as a percentage of sales, they remained stable at 1.9%. Selling expenses increased 15.3% to Ps. 28,492 million in 2014 compared with Ps. 24,707 million in 2013. The increase in operating expenses was driven by (i) the strong growth in new stores, (ii) expenses related to the incorporation of the drugstore and quick-service restaurant operations and (iii) the strengthening of FEMSA Comercio’s business and organizational structure in preparation for the growth of new operations, particularly drugstores.
73
Liquidity and Capital Resources
Liquidity
Each of our sub-holding companies generally finances its operational and capital requirements on an independent basis. As of December 31, 2015, 78% of our outstanding consolidated total indebtedness was at the level of our sub-holding companies. This structure is attributable, in part, to the inclusion of third parties in the capital structure of Coca-Cola FEMSA. Anticipating liquidity needs for general corporate purposes, in May 2013 we issued US$ 300 million aggregate principal amount of 2.875% Senior Notes due 2023 and US$ 700 million aggregate principal amount of 4.375% Senior Notes due 2043. In May 2013, Coca-Cola FEMSA issued Ps. 7,500 million aggregate principal amount of 10-year fixed rate Mexican peso-denominated bonds (certificados bursatiles) bearing a 5.46% coupon. In April 2011, Coca-Cola FEMSA issued (i) Ps. 2,500 million in aggregate principal amount of 5-year floating rate certificados bursatiles priced at the 28-day TIIE plus 13 basis points and (ii) Ps. 2,500 million of 10-year fixed rate certificados bursatiles bearing an 8.27% coupon.
In addition, in November 2013 and January 2014, Coca-Cola FEMSA issued US$ 1.0 billion aggregate principal amount of 2.375% Senior Notes due 2018, US$ 750 million aggregate principal amount of 3.875% Senior Notes due 2023 and US$ 400 million aggregate principal amount of 5.250% Senior Notes due 2043. Also in January 2014, Coca-Cola FEMSA issued US$ 150 million aggregate principal amount of 3.875% Senior Notes due 2023 and US$ 200 million in aggregate principal amount of 5.250% Senior Notes due 2043. In February 2010, Coca-Cola FEMSA issued US$ 500 million aggregate principal amount of 4.625% Senior Notes due 2020. We may decide to incur additional indebtedness at our holding company in the future to finance the operations and capital requirements of our subsidiaries or significant acquisitions, investments or capital expenditures. As a holding company, we depend on dividends and other distributions from our subsidiaries to service our indebtedness and to finance our operations and capital requirements.
We continuously evaluate opportunities to pursue acquisitions or engage in joint ventures or other transactions. We would expect to finance any significant future transactions with a combination of cash from operations, long-term indebtedness and capital stock.
Our principal source of liquidity has generally been cash generated from our operations. We have traditionally been able to rely on cash generated from operations because a significant majority of the sales of Coca-Cola FEMSA and FEMSA Comercio are on a cash or short-term credit basis. OXXO stores are able to finance a significant portion of their initial and ongoing inventories with supplier credit. Our principal use of cash has generally been for capital expenditure programs, debt repayment and dividend payments. In our opinion, our working capital is sufficient for our present requirements.
Our sub-holding companies generally incur short-term indebtedness in the event that they are temporarily unable to finance operations or meet capital requirements with cash from operations. A significant decline in the business of any of our sub-holding companies may affect the sub-holding company’s ability to fund its capital requirements. A significant and prolonged deterioration in the economies in which we operate or in our businesses may affect our ability to obtain short-term and long-term credit or to refinance existing indebtedness on terms satisfactory to us.
The following is a summary of the principal sources and uses of cash for the years ended December 31, 2015, 2014 and 2013, from our consolidated statement of cash flows:
Principal Sources and Uses of Cash
Years ended December 31, 2015, 2014 and 2013
(in millions of Mexican pesos)
| 2015 | 2014 | 2013 | ||||||||||
| Net cash flows provided by operating activities |
Ps. 36,742 | Ps. 37,364 | Ps. 28,758 | |||||||||
| Net cash flows (used in) investing activities |
(28,359 | ) | (15,608 | ) | (55,231 | ) | ||||||
| Net cash flows (used in) provided by financing activities |
(13,741 | ) | (9,288 | ) | 20,584 | |||||||
| Dividends paid |
(10,701 | ) | (3,152 | ) | (16,493 | ) | ||||||
74
Principal Sources and Uses of Cash for the Year ended December 31, 2015 Compared to the Year Ended December 31, 2014
Our net cash generated by operating activities was Ps. 36,742 million for the year ended December 31, 2015 compared to Ps. 37,364 million generated by operating activities for the year ended December 31, 2014, a decrease of Ps. 622 million. This decrease was the result of a decrease in the cash provided by the changes in other current financial assets of Ps. 1,418 million due to restricted cash payments compared to last year, which was partially offset by a net increase in cash provided by accounts receivable and other current assets of Ps. 583 million compared to last year. Also, there was an increase in the amount of cash provided because of the changes in other long-term liabilities of Ps. 3,130 million due to a decrease in contingencies payments over the prior year, which was offset by a decrease in cash provided of Ps. 3,208 because of the changes in inventories. Finally, there was a decrease in cash provided by changes in suppliers and other accounts payable and other current financial liabilities of Ps. 2,717 million, besides which there was a decrease in cash provided in income taxes paid of Ps. 2,833 million due to the increase of taxable income over the prior year, which were offset by an increase of Ps. 5,611 million in our cash flow from operating activities before changes in operating accounts due to our increased sales on a cash basis.
Our net cash used in investing activities was Ps. 28,359 million for the year ended December 31, 2015 compared to Ps. 15,608 million for the year ended December 31, 2014, an increase of Ps. 12,751 million. This was primarily the result of an increase in acquisition-related costs in the amount of Ps. 12,711 million, given by FEMSA Comercio and our other business acquisitions.
Our net cash used in financing activities was Ps. 13,741 million for the year ended December 31, 2015 compared to Ps. 9,288 million generated by financing activities for the year ended December 31, 2014, an increase of Ps. 4,453 million. This increase was primarily due to higher payments of bank loans in 2015 of Ps. 15,520 million as compared to Ps. 5,721 million in 2014, offset by proceeds from bank borrowings of Ps. 8,442 million in 2015 compared to Ps. 5,354 million in 2014, as well as higher dividend payments of Ps. 10,701 million compared to Ps. 3,152 million in 2014 and finally, all these payments were partially offset by a net increase in cash provided by derivative financial instruments of Ps. 10,612 million due to the liquidation of cross currency swaps.
Principal Sources and Uses of Cash for the Year ended December 31, 2014 Compared to the Year Ended December 31, 2013
Our net cash generated by operating activities was Ps. 37,364 million for the year ended December 31, 2014 compared to Ps. 28,758 million generated by operating activities for the year ended December 31, 2013, an increase of Ps. 8,606 million. This increase was mainly the result of increased financing from suppliers in the amount of Ps. 6,393 million, which was partially offset by increased other long-term liabilities of Ps. 2,199 million due to contingencies payments. Also, there was a decrease of income taxes paid of Ps. 3,039 million due to the decline of taxable income over the prior year, a decrease of Ps. 419 in inventories, and finally, there was an increase in accounts receivable of Ps. 3,014 which was offset by other current financial assets in the amount of Ps. 3,244 million. The increase was also partially driven by an increase of Ps. 604 million in our cash flow from operating activities before changes in operating accounts due to our increased sales on a cash basis.
Our net cash used in investing activities was Ps. 15,608 million for the year ended December 31, 2014 compared to Ps. 55,231 million used in investing activities for the year ended December 31, 2013, a decrease of Ps. 39,623 million. This was primarily the result of a decrease in acquisition-related costs in the amount of Ps. 40,675 million, given that Coca-Cola FEMSA did not allocate a significant part of its cash to acquire bottling operations as compared to the prior year. This was partially offset by a decrease of Ps. 1,388 million in 2014 of cash inflows, because of fewer cash inflows from our held to maturity investments.
Our net cash used in financing activities was Ps. 9,288 million for the year ended December 31, 2014 compared to Ps. 20,584 million generated by financing activities for the year ended December 31, 2013, a decrease of Ps. 29,872 million. This decrease was primarily due to lower proceeds from bank borrowings in 2014 of Ps. 5,354 million as compared to Ps. 78,907 million in 2013, offset by payments on bank loans of Ps. 5,721 million in 2014 compared to Ps. 39,962 million in 2013 as well as lower dividend payments of Ps. 3,152 million compared to Ps. 16,493 million in 2013. Finally, this was partially offset by an increase of derivative financial instruments costs of Ps. 2,964 million.
75
Consolidated Total Indebtedness
Our consolidated total indebtedness as of December 31, 2015 was Ps. 91,864 million compared to Ps. 84,488 million in 2014 and Ps. 76,748 million as of December 31, 2013. Short-term debt (including maturities of long-term debt) and long-term debt were Ps. 5,895 million and Ps. 85,969 million, respectively, as of December 31, 2015, as compared to Ps. 1,553 million and Ps. 82,935 million, respectively, as of December 31, 2014, and Ps. 3,827 million and Ps. 72,921 million, respectively, as of December 31, 2013. Cash and cash equivalents were Ps. 29,396 million as of December 31, 2015, as compared to Ps. 35,497 million as of December 31, 2014 and Ps. 27,259 million as of December 31, 2013.
Off-Balance Sheet Arrangements
We do not have any material off-balance sheet arrangements.
Contractual Obligations
The table below sets forth our contractual obligations as of December 31, 2015.
| Maturity | ||||||||||||||||||||
| Less than 1 year |
1 - 3 years | 3 - 5 years | In excess of 5 years |
Total | ||||||||||||||||
| (in millions of Mexican pesos) | ||||||||||||||||||||
| Long-Term Debt |
||||||||||||||||||||
| Mexican pesos |
Ps. 2,496 | Ps. 3,385 | — | Ps. 9,989 | Ps. 15,870 | |||||||||||||||
| Brazilian reais |
363 | 552 | 377 | 111 | 1,403 | |||||||||||||||
| Colombian pesos |
280 | 738 | 106 | 52 | 1,176 | |||||||||||||||
| U.S. dollars |
— | 17,158 | 8,566 | 42,352 | 68,076 | |||||||||||||||
| Argentine pesos |
100 | 41 | — | — | 141 | |||||||||||||||
| Chilean pesos |
336 | 769 | 907 | 395 | 2,407 | |||||||||||||||
| Capital Leases |
||||||||||||||||||||
| Brazilian reais |
67 | 131 | 113 | 149 | 460 | |||||||||||||||
| Chilean pesos |
14 | 31 | 35 | 12 | 92 | |||||||||||||||
| Interest payments(1) |
||||||||||||||||||||
| Mexican pesos |
783 | 1,359 | 1,231 | 1,021 | 4,394 | |||||||||||||||
| Brazilian reais |
126 | 228 | 184 | 112 | 650 | |||||||||||||||
| Colombian pesos |
105 | 64 | 47 | 19 | 235 | |||||||||||||||
| U.S. dollars |
2,595 | 5,151 | 4,026 | 25,905 | 37,677 | |||||||||||||||
| Argentine pesos |
47 | 18 | — | — | 65 | |||||||||||||||
| Chilean pesos |
161 | 282 | 260 | 76 | 779 | |||||||||||||||
| Interest Rate Swaps and Cross Currency Swaps (2) |
||||||||||||||||||||
| Mexican pesos |
1,861 | 4,112 | 2,891 | 16,046 | 24,910 | |||||||||||||||
| Brazilian reais |
5,978 | 10,368 | 1,513 | 16,946 | 34,805 | |||||||||||||||
| Colombian pesos |
73 | 17 | — | — | 90 | |||||||||||||||
| U.S. dollars |
1,138 | 3,916 | 2,050 | 9,583 | 16,686 | |||||||||||||||
| Argentine pesos |
50 | 6 | — | — | 56 | |||||||||||||||
| Chilean pesos |
2 | 3 | 3 | 1 | 9 | |||||||||||||||
| Operating leases |
||||||||||||||||||||
| Mexican pesos |
3,768 | 7,030 | 6,232 | 16,742 | 33,772 | |||||||||||||||
| U.S. dollars |
200 | 387 | 395 | 330 | 1,312 | |||||||||||||||
| Others |
1 | 8 | 5 | 2 | 16 | |||||||||||||||
| Commodity price contracts |
||||||||||||||||||||
| Sugar(3) |
1,497 | — | — | — | 1,497 | |||||||||||||||
| Aluminum(3) |
436 | — | — | — | 436 | |||||||||||||||
| Expected benefits to be paid for pension and retirement plans, seniority premiums, post-retirement medical services and post-employment |
534 | 739 | 863 | 2,197 | 4,333 | |||||||||||||||
| Other long-term liabilities(4) |
— | — | — | 5,795 | 5,795 | |||||||||||||||
| (1) | Interest was calculated using long-term debt as of and interest rate amounts in effect on December 31, 2015 without considering interest rate swap agreements. The debt and applicable interest rates in effect are shown in Note 18 to our audited consolidated financial statements. Liabilities denominated in U.S. dollars were translated to Mexican pesos at an exchange rate of Ps. 17.2065 per US$ 1.00, the exchange rate quoted to us by Banco de México for the settlement of obligations in foreign currencies on December 31, 2015. |
| (2) | Reflects the amount of future payments that we would be required to make. The amounts were calculated by applying the rates giving effect to interest rate swaps and cross currency swaps applied to long-term debt as of December 31, 2015, and the market value of the unhedged cross currency swaps (the amount of debt used in the calculation of the interest was obtained by converting only the units of investment debt for the related cross currency swap, and it also includes the effect of related interest rate swaps). |
| (3) | Reflects the notional amount of the futures and forward contracts used to hedge sugar and aluminum cost with a fair value liability of Ps. 274 million; see Note 20.6 to our audited consolidated financial statements. |
| (4) | Other long-term liabilities include provisions and others, but not deferred taxes. Other long-term liabilities additionally reflects those liabilities whose maturity date is undefined and depends on a series of circumstances out of our control, therefore these liabilities have been considered to have a maturity of more than five years. |
76
As of December 31, 2015, Ps. 5,895 million of our total consolidated indebtedness was short-term debt (including maturities of long-term debt).
As of December 31, 2015, our consolidated average cost of borrowing, after giving effect to the cross currency and interest rate swaps, was approximately 7.5% (the total amount of debt used in the calculation of this percentage was obtained by converting only the units of investment debt for the related cross currency swap, and it also includes the effect of related interest rate swaps). As of December 31, 2014 our consolidated average cost of borrowing, after giving effect to the cross currency swaps, was 7.7%. As of December 31, 2015, after giving effect to cross currency swaps, approximately 39.4% of our total consolidated indebtedness was denominated and payable in Mexican pesos, 24.6% in U.S. dollars, 1.9% in Colombian pesos, 0.4% in Argentine pesos, 29.1% in Brazilian reais and the remaining 4.6% in Chilean pesos.
Overview of Debt Instruments
The following table shows the allocations of total debt of our company as of December 31, 2015:
| Total Debt Profile of the Company | ||||||||||||||||
| FEMSA and Others |
Coca-Cola FEMSA |
FEMSA Comercio Retail Division |
Total Debt | |||||||||||||
| (in millions of Mexican pesos) | ||||||||||||||||
| Short-term Debt |
||||||||||||||||
| Argentine pesos: |
||||||||||||||||
| Notes payable |
Ps. — | Ps. 165 | — | Ps. 165 | ||||||||||||
| Brazilian reais: |
||||||||||||||||
| Bank loans |
168 | — | — | 168 | ||||||||||||
| Colombian pesos: |
||||||||||||||||
| Bank loans |
219 | 235 | 454 | |||||||||||||
| Chilean pesos: |
||||||||||||||||
| Bank loans |
1,442 | 1,442 | ||||||||||||||
| Capital leases |
10 | 10 | ||||||||||||||
| Long-term Debt(1) |
||||||||||||||||
| Mexican pesos: |
||||||||||||||||
| Units of Investment (UDIs) |
3,385 | — | — | 3,385 | ||||||||||||
| Domestic Senior notes |
— | 12,485 | — | 12,485 | ||||||||||||
| U.S. dollars: |
||||||||||||||||
| Senior Notes |
16,743 | 51,333 | — | 68,076 | ||||||||||||
| Brazilian reais: |
||||||||||||||||
| Bank loans |
350 | 1,053 | — | 1,403 | ||||||||||||
| Capital leases |
— | 460 | — | 460 | ||||||||||||
| Colombian pesos: |
||||||||||||||||
| Bank loans |
— | 874 | 302 | 1,176 | ||||||||||||
| Argentine pesos: |
||||||||||||||||
| Bank loans |
— | 141 | — | 141 | ||||||||||||
| Chilean pesos: |
||||||||||||||||
| Bank loans |
— | — | 2,407 | 2,407 | ||||||||||||
| Capital leases |
— | — | 92 | 92 | ||||||||||||
| Total Debt |
20,646 | 66,730 | 4,488 | 91,864 | ||||||||||||
| Average Cost (2) |
||||||||||||||||
| Mexican pesos |
6.6 | % | 5.0 | % | — | 5.7 | % | |||||||||
| U.S. dollars |
— | 4.7 | % | — | 4.7 | % | ||||||||||
| Brazilian reais |
9.7 | % | 13.4 | % | — | 13.3 | % | |||||||||
| Argentine pesos |
— | 28.0 | % | — | 28.0 | % | ||||||||||
| Colombian pesos |
— | 6.5 | % | 4.9 | % | 6.0 | % | |||||||||
| Chilean pesos |
— | — | 5.9 | % | 5.9 | % | ||||||||||
| Total |
6.7 | % | 8.2 | % | 5.7 | % | 7.5 | % | ||||||||
| (1) | Includes the Ps. 3,656 million current portion of long-term debt. |
| (2) | Includes the effect of cross currency and interest rate swaps (the total amount of the debt used in the calculation of this percentage considers converting only the units of investments debt for the related cross currency swap, and it also includes the effect of related interest rate swaps). Average cost is determined based on interest rates as of December 31, 2015. |
77
Restrictions Imposed by Debt Instruments
Generally, the covenants contained in the credit agreements and other instruments governing indebtedness entered into by us or our sub-holding companies include limitations on the incurrence of any additional debt based on debt service coverage ratios or leverage tests. These credit agreements also generally include restrictive covenants applicable to the Company, our sub-holding companies and their subsidiaries.
We and Coca-Cola FEMSA are in compliance with all our covenants. A significant and prolonged deterioration in our consolidated results could cause us to cease to be in compliance under certain indebtedness in the future. We can provide no assurances that we will be able to incur indebtedness or to refinance existing indebtedness on similar terms in the future.
Summary of Debt
The following is a summary of our indebtedness by sub-holding company and for FEMSA as of December 31, 2015:
Coca-Cola FEMSA
| • | Coca-Cola FEMSA’s total indebtedness was Ps. 64,516 million as of December 31, 2015. Short-term debt (including the current portion of long-term debt) and long-term debt were Ps. 3,470 million and Ps. 61,046 million, respectively. As of December 31, 2015, cash and cash equivalents were Ps. 15,989 million and consisted of 66.4% U.S. dollars, 21.2% Mexican pesos, 6.4% Brazilian reais, 2.3% Venezuelan bolivars, 1.1% Argentine pesos, 1.3% Colombian pesos, 0.7% Costa Rican colones and 0.6% other legal currencies. |
78
| • | As part of Coca-Cola FEMSA’s financing policy, it expects to continue to finance its liquidity needs with cash from operations. Nonetheless, as a result of regulations in certain countries in which it operates, it may not be beneficial or, as the case of exchange controls in Venezuela, practicable for Coca-Cola FEMSA to remit cash generated in local operations to fund cash requirements in other countries. Exchange controls like those in Venezuela may also increase the real price of remitting cash from operations to fund debt requirements in other countries. In addition, in the event that cash from operations in these countries is not sufficient to fund future working capital requirements and capital expenditures, Coca-Cola FEMSA may decide, or be required, to fund cash requirements in these countries through local borrowings rather than remitting funds from another country. Coca-Cola FEMSA’s liquidity in Venezuela could be affected by changes in the rules applicable to exchange rates as well as other regulations, such as exchange controls. In addition, in the future Coca-Cola FEMSA may finance its working capital and capital expenditure needs with short-term or other borrowings. |
| • | Any further changes in the Venezuelan exchange control regime, and future currency devaluations or the imposition of exchange controls in any of the countries in which Coca-Cola FEMSA has operations could have an adverse effect on Coca-Cola FEMSA’s financial position and liquidity. |
FEMSA Comercio – Retail Division
| • | As of December 31, 2015, FEMSA Comercio – Retail Division had total outstanding debt of Ps. 4,488 million. Short-term debt (including the current portion of long-term debt) and long-term debt were Ps. 1,687 million and Ps. 2,801 million, respectively. As of December 31, 2015, cash and cash equivalents were Ps. 4,030 million. |
FEMSA and others
| • | As of December 31, 2015, FEMSA and others had total outstanding debt of Ps. 20,646 million, which is composed of Ps. 3,385 million of unidades de inversión (inflation indexed units, or UDIs), which mature in November 2017, Ps. 518 million of bank debt (of which Ps. 277 million is held by our logistics services subsidiary and Ps. 241 million is held by our refrigeration business) in other legal currencies, and Ps. 5,068 million of Senior Notes due 2023 and Ps. 11,675 million of Senior Notes due 2043 that we issued in May 2013. See “Operating and Financial Review and Prospects—Liquidity and Capital Resources—Liquidity.” FEMSA and others’ average cost of debt, after giving effect to interest rate swaps and cross currency swaps, as of December 31, 2015, was 6.6% in Mexican pesos (the amount of debt used in the calculation of this percentage was obtained by converting only the units of investments debt for the related cross currency swap, and it also includes the effect of related interest rate swaps). |
Contingencies
We have various loss contingencies, for which reserves have been recorded in those cases where we believe an unfavorable resolution is probable and can be reasonably quantified. Any amounts required to be paid in connection with these loss contingencies would be required to be paid from available cash.
79
The following table presents the nature and amount of loss contingencies recorded as of December 31, 2015:
| Loss Contingencies As of December 31, 2015 (in millions of Mexican pesos) |
||||
| Taxes, primarily indirect taxes |
Ps. 1,725 | |||
| Legal |
318 | |||
| Labor |
1,372 | |||
|
|
|
|||
| Total |
Ps. 3,415 | |||
|
|
|
|||
As is customary in Brazil, we have been asked by the tax authorities to collateralize tax contingencies currently in litigation amounting to Ps. 3,569 million, Ps. 3,026 and Ps. 2,248 million as of December 31, 2015, 2014 and 2013, respectively, by pledging fixed assets or providing bank guarantees.
We have other contingencies that, based on a legal assessment of their risk of loss, have been classified by our legal counsel as more than remote but less than probable. These contingencies have a financial impact that is disclosed as loss contingencies in the notes of the consolidated financial statements. These contingencies, or our assessment of them, may change in the future, and we may record reserves or be required to pay amounts in respect of these contingencies. As of December 31, 2015, the aggregate amount of such contingencies for which we had not recorded a reserve was Ps. 29,502 million.
Capital Expenditures
For the past five years, we have had significant capital expenditure programs, which for the most part were financed with cash from operations. Capital expenditures reached Ps. 18,885 million in 2015 compared to Ps. 18,163 million in 2014, an increase of 4.0%. This was driven by additional investments at FEMSA Comercio, mainly related to expansion of the Retail Division and Fuel Division through the opening of new stores and retail service stations. The principal components of our capital expenditures have been investments in equipment, market-related investments, investments in production capacity and distribution network expansion at Coca-Cola FEMSA and expansion of the Retail Division and Fuel Division at FEMSA Comercio, as mentioned above. See “Information on the Company—Capital Expenditures and Divestitures.”
Expected Capital Expenditures for 2016
Our capital expenditure budget for 2016 is expected to be approximately US$ 1,284 (Ps. 22,277) million. The following discussion is based on each of our sub-holding companies’ internal 2015 budgets. The capital expenditure plan for 2016 is subject to change based on market and other conditions and the subsidiaries’ results and financial resources.
Coca-Cola FEMSA’s capital expenditures in 2016 are expected to reach US$690 million, approximately. Coca-Cola FEMSA’s capital expenditures in 2016 are primarily intended for:
| • | investments in production capacity; |
| • | market investments; |
| • | returnable bottles and cases; |
| • | improvements throughout its distribution network; and |
| • | investments in information technology. |
80
Coca-Cola FEMSA estimates that of its projected capital expenditures for 2016, approximately 36% will be for its Mexican territories and the remainder will be for its non-Mexican territories. Coca-Cola FEMSA believes that internally generated funds will be sufficient to meet its budgeted capital expenditures for 2016. Coca-Cola FEMSA’s capital expenditure plan for 2016 may change based on market and other conditions and on its results and financial resources.
FEMSA Comercio – Retail Division’s capital expenditures budget in 2016 is expected to total approximately US$ 460 million, and will be allocated to the opening of new OXXO stores and to a lesser extent to the refurbishing of existing OXXO stores. In addition, investments are planned in FEMSA Comercio’s IT, ERP software updates and transportation equipment.
FEMSA Comercio – Fuel Division’s capital expenditures budget in 2016 is expected to total approximately US$ 20 million, and will be allocated to the opening of new service stations and, to a lesser extent, to the refurbishing of existing OXXO GAS service stations.
Hedging Activities
Our business activities require the holding or issuing of derivative instruments to hedge our exposure to market risks related to changes in interest rates, foreign currency exchange rates and commodity price risk.
The following table provides a summary of the fair value of derivative financial instruments as of December 31, 2015. If such instruments are not traded in a formal market, fair value is determined by applying techniques based upon technical models we believe are supported by sufficient, reliable and verifiable market data, recognized in the financial sector.
| Fair Value At December 31, 2015 | ||||||||||||||||||||
| Maturity less than 1 year |
Maturity 1 - 3 years |
Maturity 3 - 5 years |
Maturity in excess of 5 years |
Fair Value Asset |
||||||||||||||||
| (in millions of Mexican pesos) | ||||||||||||||||||||
| Derivative financial instruments position |
Ps. 166 | Ps. 3,340 | Ps. | (119) | Ps. 4,876 | Ps. 8,263 | ||||||||||||||
81
FOMENTO ECONÓMICO MEXICANO, S.A.B. DE C.V. AND SUBSIDIARIES
MONTERREY, N.L., MÉXICO
INDEX TO FINANCIAL STATEMENTS
| Audited consolidated financial statements of Fomento Económico Mexicano, S.A.B. de C.V. |
||||
| Report of Mancera S.C., A Member Practice of Ernst & Young Global |
F-1 | |||
| Consolidated statements of financial position as of December 31, 2015 and 2014 |
F-2 | |||
| Consolidated income statements for the years ended December 31, 2015, 2014 and 2013 |
F-3 | |||
| Consolidated statements of comprehensive income for the years ended December 31, 2015, 2014 and 2013 |
F-4 | |||
| Consolidated statements of changes in equity for the years ended December 31, 2015, 2014 and 2013 |
F-5 | |||
| Consolidated statements of cash flows for the years ended December 31, 2015, 2014 and 2013 |
F-6 | |||
| Notes to the audited consolidated financial statements |
F-7 | |||
[FINANCIAL STATEMENTS TO FOLLOW]
82
INDEPENDENT AUDITOR’S REPORT
The Board of Directors and Shareholders of
Fomento Económico Mexicano, S.A.B. de C.V.
Report on the Consolidated Financial Statements
We have audited the accompanying consolidated financial statements of Fomento Económico Mexicano, S.A.B. de C.V. and its subsidiaries, which comprise the consolidated statements of financial position as at December 31, 2015 and 2014, and the consolidated income statements, consolidated statements of comprehensive income, consolidated statements of changes in equity and consolidated statements of cash flows for each of the three years in the period ended December 31, 2015, and a summary of significant accounting policies and other explanatory information.
Management’s Responsibility for the Consolidated Financial Statements
Management is responsible for the preparation and fair presentation of these consolidated financial statements in accordance with International Financial Reporting Standards, and for such internal control as management determines is necessary to enable the preparation of consolidated financial statements that are free from material misstatement, whether due to fraud or error.
Auditor’s Responsibility
Our responsibility is to express an opinion on these consolidated financial statements based on our audits. We conducted our audits in accordance with International Standards on Auditing. Those standards require that we comply with ethical requirements and plan and perform the audit to obtain reasonable assurance about whether the consolidated financial statements are free from material misstatement.
An audit involves performing procedures to obtain audit evidence about the amounts and disclosures in the consolidated financial statements. The procedures selected depend on the auditor’s judgment, including the assessment of the risks of material misstatement of the consolidated financial statements, whether due to fraud or error. In making those risk assessments, the auditor considers internal control relevant to the entity’s preparation and fair presentation of the consolidated financial statements in order to design audit procedures that are appropriate in the circumstances, but not for the purpose of expressing an opinion on the effectiveness of the entity’s internal control. An audit also includes evaluating the appropriateness of accounting policies used and the reasonableness of accounting estimates made by management, as well as evaluating the overall presentation of the consolidated financial statements.
We believe that the audit evidence we have obtained is sufficient and appropriate to provide a basis for our audit opinion.
Opinion
In our opinion, the consolidated financial statements present fairly, in all material respects, the financial position of Fomento Económico Mexicano, S.A.B. de C.V. and its subsidiaries as at December 31, 2015 and 2014, and their financial performance and cash flows for each of the three years in the period ended December 31, 2015, in accordance with International Financial Reporting Standards as issued by the International Accounting Standards Board.
| Mancera, S.C. |
| A member practice of |
| Ernst & Young Global Limited |
| /s/ Agustín Aguilar Laurents |
| Agustín Aguilar Laurents |
February 29, 2016
Monterrey, N.L. México.
F-1
FOMENTO ECONÓMICO MEXICANO, S.A.B. DE C.V. AND SUBSIDIARIES
MONTERREY, N.L., MEXICO
Consolidated Statements of Financial Position
As of December 31, 2015 and 2014.
Amounts expressed in millions of U.S. dollars ($) and in millions of Mexican pesos (Ps.)
| Note | December 2015 (*) |
December 2015 |
December 2014 |
|||||||||||
| ASSETS |
||||||||||||||
| Current Assets: |
||||||||||||||
| Cash and cash equivalents |
5 | $ | 1,710 | Ps. | 29,396 | Ps. | 35,497 | |||||||
| Investments |
6 | 1 | 19 | 144 | ||||||||||
| Accounts receivable, net |
7 | 1,047 | 18,012 | 13,842 | ||||||||||
| Inventories |
8 | 1,435 | 24,680 | 17,214 | ||||||||||
| Recoverable taxes |
497 | 8,544 | 8,030 | |||||||||||
| Other current financial assets |
9 | 141 | 2,418 | 2,597 | ||||||||||
| Other current assets |
9 | 213 | 3,654 | 1,788 | ||||||||||
|
|
|
|
|
|
|
|||||||||
| Total current assets |
5,044 | 86,723 | 79,112 | |||||||||||
|
|
|
|
|
|
|
|||||||||
| Investments in associates and joint ventures |
10 | 6,498 | 111,731 | 102,159 | ||||||||||
| Property, plant and equipment, net |
11 | 4,670 | 80,296 | 75,629 | ||||||||||
| Intangible assets, net |
12 | 6,301 | 108,341 | 101,527 | ||||||||||
| Deferred tax assets |
24 | 482 | 8,293 | 6,278 | ||||||||||
| Other financial assets |
13 | 521 | 8,955 | 6,551 | ||||||||||
| Other assets, net |
13 | 289 | 4,993 | 4,917 | ||||||||||
|
|
|
|
|
|
|
|||||||||
| TOTAL ASSETS |
$ | 23,805 | Ps. | 409,332 | Ps. | 376,173 | ||||||||
|
|
|
|
|
|
|
|||||||||
| LIABILITIES AND EQUITY |
||||||||||||||
| Current Liabilities: |
||||||||||||||
| Bank loans and notes payable |
18 | $ | 130 | Ps. | 2,239 | Ps. | 449 | |||||||
| Current portion of long-term debt |
18 | 213 | 3,656 | 1,104 | ||||||||||
| Interest payable |
35 | 597 | 482 | |||||||||||
| Suppliers |
2,080 | 35,773 | 26,467 | |||||||||||
| Accounts payable |
537 | 9,236 | 7,778 | |||||||||||
| Taxes payable |
531 | 9,136 | 8,177 | |||||||||||
| Other current financial liabilities |
25 | 274 | 4,709 | 4,862 | ||||||||||
|
|
|
|
|
|
|
|||||||||
| Total current liabilities |
3,800 | 65,346 | 49,319 | |||||||||||
|
|
|
|
|
|
|
|||||||||
| Long-Term Liabilities: |
||||||||||||||
| Bank loans and notes payable |
18 | 5,000 | 85,969 | 82,935 | ||||||||||
| Post-employment and other long-term employee benefits |
16 | 246 | 4,229 | 4,207 | ||||||||||
| Deferred tax liabilities |
24 | 362 | 6,230 | 3,643 | ||||||||||
| Other financial liabilities |
25 | 29 | 495 | 328 | ||||||||||
| Provisions and other long-term liabilities |
25 | 303 | 5,207 | 5,619 | ||||||||||
|
|
|
|
|
|
|
|||||||||
| Total long-term liabilities |
5,940 | 102,130 | 96,732 | |||||||||||
|
|
|
|
|
|
|
|||||||||
| Total liabilities |
9,740 | 167,476 | 146,051 | |||||||||||
|
|
|
|
|
|
|
|||||||||
| Equity: |
||||||||||||||
| Controlling interest: |
||||||||||||||
| Capital stock |
195 | 3,348 | 3,347 | |||||||||||
| Additional paid-in capital |
1,501 | 25,807 | 25,649 | |||||||||||
| Retained earnings |
9,103 | 156,532 | 147,122 | |||||||||||
| Cumulative other comprehensive (loss) |
(243 | ) | (4,163 | ) | (5,645 | ) | ||||||||
|
|
|
|
|
|
|
|||||||||
| Total controlling interest |
10,556 | 181,524 | 170,473 | |||||||||||
|
|
|
|
|
|
|
|||||||||
| Non-controlling interest in consolidated subsidiaries |
21 | 3,509 | 60,332 | 59,649 | ||||||||||
|
|
|
|
|
|
|
|||||||||
| Total equity |
14,065 | 241,856 | 230,122 | |||||||||||
|
|
|
|
|
|
|
|||||||||
| TOTAL LIABILITIES AND EQUITY |
$ | 23,805 | Ps. | 409,332 | Ps. | 376,173 | ||||||||
|
|
|
|
|
|
|
|||||||||
| (*) | Convenience translation to U.S. dollars ($) – See Note 2.2.3 |
The accompanying notes are an integral part of these consolidated statements of financial position.
F-2
FOMENTO ECONÓMICO MEXICANO, S.A.B. DE C.V. AND SUBSIDIARIES
MONTERREY, N.L., MEXICO
Consolidated Income Statements
For the years ended December 31, 2015, 2014 and 2013.
Amounts expressed in millions of U.S. dollars ($) and in millions of Mexican pesos (Ps.), except per share amounts.
| Note | 2015 (*) | 2015 | 2014 | 2013 | ||||||||||||||
| Net sales |
$ | 18,078 | Ps. | 310,849 | Ps. | 262,779 | Ps. | 256,804 | ||||||||||
| Other operating revenues |
43 | 740 | 670 | 1,293 | ||||||||||||||
|
|
|
|
|
|
|
|
|
|||||||||||
| Total revenues |
18,121 | 311,589 | 263,449 | 258,097 | ||||||||||||||
| Cost of goods sold |
10,957 | 188,410 | 153,278 | 148,443 | ||||||||||||||
|
|
|
|
|
|
|
|
|
|||||||||||
| Gross profit |
7,164 | 123,179 | 110,171 | 109,654 | ||||||||||||||
|
|
|
|
|
|
|
|
|
|||||||||||
| Administrative expenses |
681 | 11,705 | 10,244 | 9,963 | ||||||||||||||
| Selling expenses |
4,442 | 76,375 | 69,016 | 69,574 | ||||||||||||||
| Other income |
19 | 24 | 423 | 1,098 | 651 | |||||||||||||
| Other expenses |
19 | (159 | ) | (2,741 | ) | (1,277 | ) | (1,439 | ) | |||||||||
| Interest expense |
18 | (452 | ) | (7,777 | ) | (6,701 | ) | (4,331 | ) | |||||||||
| Interest income |
59 | 1,024 | 862 | 1,225 | ||||||||||||||
| Foreign exchange loss, net |
(69 | ) | (1,193 | ) | (903 | ) | (724 | ) | ||||||||||
| Monetary position loss, net |
(2 | ) | (36 | ) | (319 | ) | (427 | ) | ||||||||||
| Market value gain on financial instruments |
21 | 364 | 73 | 8 | ||||||||||||||
|
|
|
|
|
|
|
|
|
|||||||||||
| Income before income taxes and share of the profit of associates and joint ventures accounted for using the equity method |
1,463 | 25,163 | 23,744 | 25,080 | ||||||||||||||
| Income taxes |
24 | 461 | 7,932 | 6,253 | 7,756 | |||||||||||||
| Share of the profit of associates and joint ventures accounted for using the equity method, net of taxes |
10 | 352 | 6,045 | 5,139 | 4,831 | |||||||||||||
|
|
|
|
|
|
|
|
|
|||||||||||
| Consolidated net income |
$ | 1,354 | Ps. | 23,276 | Ps. | 22,630 | Ps. | 22,155 | ||||||||||
|
|
|
|
|
|
|
|
|
|||||||||||
| Attributable to: |
||||||||||||||||||
| Controlling interest |
1,029 | 17,683 | 16,701 | 15,922 | ||||||||||||||
| Non-controlling interest |
325 | 5,593 | 5,929 | 6,233 | ||||||||||||||
|
|
|
|
|
|
|
|
|
|||||||||||
| Consolidated net income |
$ | 1,354 | Ps. | 23,276 | Ps. | 22,630 | Ps. | 22,155 | ||||||||||
|
|
|
|
|
|
|
|
|
|||||||||||
| Basic net controlling interest income: |
||||||||||||||||||
| Per series “B” share |
23 | $ | 0.05 | Ps. | 0.88 | Ps. | 0.83 | Ps. | 0.79 | |||||||||
| Per series “D” share |
23 | 0.06 | 1.10 | 1.04 | 1.00 | |||||||||||||
| Diluted net controlling interest income: |
||||||||||||||||||
| Per series “B” share |
23 | 0.05 | 0.88 | 0.83 | 0.79 | |||||||||||||
| Per series “D” share |
23 | 0.06 | 1.10 | 1.04 | 0.99 | |||||||||||||
|
|
|
|
|
|
|
|
|
|||||||||||
| (*) | Convenience translation to U.S. dollars ($) – See Note 2.2.3 |
The accompanying notes are an integral part of these consolidated income statements.
F-3
FOMENTO ECONÓMICO MEXICANO, S.A.B. DE C.V. AND SUBSIDIARIES
MONTERREY, N.L., MEXICO
Consolidated Statements of Comprehensive Income
For the years ended December 31, 2015, 2014 and 2013.
Amounts expressed in millions of U.S. dollars ($) and in millions of Mexican pesos (Ps.)
| Note | 2015 (*) | 2015 | 2014 | 2013 | ||||||||||||||
| Consolidated net income |
$ | 1,354 | Ps. | 23,276 | Ps. | 22,630 | Ps. | 22,155 | ||||||||||
|
|
|
|
|
|
|
|
|
|||||||||||
| Other comprehensive income: |
||||||||||||||||||
| Items that may be reclassified to consolidated net income, net of tax: |
||||||||||||||||||
| Unrealized loss on available for sale securities |
— | — | — | (2 | ) | |||||||||||||
| Valuation of the effective portion of derivative financial instruments |
7 | 122 | 493 | (246 | ) | |||||||||||||
| Exchange differences on the translation of foreign operations and associates |
(129 | ) | (2,234 | ) | (12,256 | ) | 1,151 | |||||||||||
| Share of other comprehensive income (loss) of associates and joint ventures |
10 | 16 | 282 | 1,322 | (3,120 | ) | ||||||||||||
|
|
|
|
|
|
|
|
|
|||||||||||
| Total items that may be reclassified |
(106 | ) | (1,830 | ) | (10,441 | ) | (2,217 | ) | ||||||||||
|
|
|
|
|
|
|
|
|
|||||||||||
| Items that will not to be reclassified to consolidated net income in subsequent periods, net of tax: |
||||||||||||||||||
| Remeasurements of the net defined benefit share of other comprehensive income (loss) of associates and joint ventures |
10 | 169 | (881 | ) | 491 | |||||||||||||
| Remeasurements of the net defined benefit liability |
8 | 144 | (361 | ) | (112 | ) | ||||||||||||
|
|
|
|
|
|
|
|
|
|||||||||||
| Total items that will not be reclassified |
18 | 313 | (1,242 | ) | 379 | |||||||||||||
|
|
|
|
|
|
|
|
|
|||||||||||
| Total other comprehensive loss, net of tax |
(88 | ) | (1,517 | ) | (11,683 | ) | (1,838 | ) | ||||||||||
|
|
|
|
|
|
|
|
|
|||||||||||
| Consolidated comprehensive income, net of tax |
$ | 1,266 | Ps. | 21,759 | Ps. | 10,947 | Ps. | 20,317 | ||||||||||
|
|
|
|
|
|
|
|
|
|||||||||||
| Controlling interest comprehensive income |
1,115 | 19,165 | 11,283 | 15,030 | ||||||||||||||
| Reattribution to non-controlling interest of other comprehensive income by acquisition of Grupo YOLI |
— | — | — | (36 | ) | |||||||||||||
|
|
|
|
|
|
|
|
|
|||||||||||
| Controlling interest, net of reattribution |
$ | 1,115 | Ps. | 19,165 | Ps. | 11,283 | Ps. | 14,994 | ||||||||||
|
|
|
|
|
|
|
|
|
|||||||||||
| Non-controlling interest comprehensive income |
151 | 2,594 | (336 | ) | 5,287 | |||||||||||||
| Reattribution from controlling interest of other comprehensive income by acquisition of Grupo YOLI |
— | — | — | 36 | ||||||||||||||
|
|
|
|
|
|
|
|
|
|||||||||||
| Non-controlling interest, net of reatribution |
$ | 151 | Ps. | 2,594 | Ps. | (336 | ) | Ps. | 5,323 | |||||||||
|
|
|
|
|
|
|
|
|
|||||||||||
| Consolidated comprehensive income, net of tax |
$ | 1,266 | Ps. | 21,759 | Ps. | 10,947 | Ps. | 20,317 | ||||||||||
|
|
|
|
|
|
|
|
|
|||||||||||
| (*) | Convenience translation to U.S. dollars ($) – See Note 2.2.3 |
The accompanying notes are an integral part of these consolidated statements of comprehensive income.
F-4
FOMENTO ECONÓMICO MEXICANO, S.A.B. DE C.V. AND SUBSIDIARIES
MONTERREY, N.L., MEXICO
Consolidated Statements of Changes in Equity
For the years ended December 31, 2015, 2014 and 2013.
Amounts expressed in millions of Mexican pesos (Ps.)
| Capital Stock |
Additional Paid-in Capital |
Retained Earnings |
Unrealized Gain (Loss) on Available for sale Securities |
Valuation of the Effective Portion of Derivative Financial Instrument |
Exchange Differences on the Translation of Foreign Operations and Associates |
Remeasurements of the Net Defined Benefit Liability |
Total Controlling Interest |
Non-Controlling Interest |
Total Equity |
|||||||||||||||||||||||||||||||
| Balances at January 1, 2013 |
Ps. | 3,346 | Ps. | 22,740 | Ps. | 128,508 | Ps. | 2 | Ps. | 349 | Ps. | 1,961 | Ps. | (1,647 | ) | Ps. | 155,259 | Ps. | 54,902 | Ps. | 210,161 | |||||||||||||||||||
|
|
|
|
|
|
|
|
|
|
|
|
|
|
|
|
|
|
|
|
|
|||||||||||||||||||||
| Net income |
15,922 | 15,922 | 6,233 | 22,155 | ||||||||||||||||||||||||||||||||||||
| Other comprehensive income, net of tax |
(2 | ) | (170 | ) | (1,214 | ) | 458 | (928 | ) | (910 | ) | (1,838 | ) | |||||||||||||||||||||||||||
|
|
|
|
|
|
|
|
|
|
|
|
|
|
|
|
|
|||||||||||||||||||||||||
| Comprehensive income |
15,922 | (2 | ) | (170 | ) | (1,214 | ) | 458 | 14,994 | 5,323 | 20,317 | |||||||||||||||||||||||||||||
| Dividends declared |
(13,368 | ) | (13,368 | ) | (3,125 | ) | (16,493 | ) | ||||||||||||||||||||||||||||||||
| Repurchase of shares associated with share-based payment plans |
(172 | ) | (172 | ) | (7 | ) | (179 | ) | ||||||||||||||||||||||||||||||||
| Acquisition of Grupo Yoli through issuance of Coca-Cola FEMSA shares (see Note 4) |
2,865 | 2 | 32 | 2 | 2,901 | 5,120 | 8,021 | |||||||||||||||||||||||||||||||||
| Other acquisitions (see Note 4) |
— | 430 | 430 | |||||||||||||||||||||||||||||||||||||
| Increase in share of non-controlling interest |
— | 515 | 515 | |||||||||||||||||||||||||||||||||||||
| Other movements of equity method of associates, net of taxes |
(222 | ) | (222 | ) | — | (222 | ) | |||||||||||||||||||||||||||||||||
|
|
|
|
|
|
|
|
|
|
|
|
|
|
|
|
|
|
|
|
|
|||||||||||||||||||||
| Balances at December 31, 2013 |
3,346 | 25,433 | 130,840 | — | 181 | 779 | (1,187 | ) | 159,392 | 63,158 | 222,550 | |||||||||||||||||||||||||||||
|
|
|
|
|
|
|
|
|
|
|
|
|
|
|
|
|
|
|
|
|
|||||||||||||||||||||
| Net income |
16,701 | 16,701 | 5,929 | 22,630 | ||||||||||||||||||||||||||||||||||||
| Other comprehensive income, net of tax |
126 | (4,412 | ) | (1,132 | ) | (5,418 | ) | (6,265 | ) | (11,683 | ) | |||||||||||||||||||||||||||||
|
|
|
|
|
|
|
|
|
|
|
|
|
|
|
|||||||||||||||||||||||||||
| Comprehensive income |
16,701 | 126 | (4,412 | ) | (1,132 | ) | 11,283 | (336 | ) | 10,947 | ||||||||||||||||||||||||||||||
| Dividends declared |
— | (3,152 | ) | (3,152 | ) | |||||||||||||||||||||||||||||||||||
| Issuance (repurchase) of shares associated with share-based payment plans |
1 | 216 | 217 | (21 | ) | 196 | ||||||||||||||||||||||||||||||||||
| Other movements of equity method of associates, net of taxes |
(419 | ) | (419 | ) | — | (419 | ) | |||||||||||||||||||||||||||||||||
|
|
|
|
|
|
|
|
|
|
|
|
|
|
|
|
|
|
|
|
|
|||||||||||||||||||||
| Balances at December 31, 2014 |
3,347 | 25,649 | 147,122 | — | 307 | (3,633 | ) | (2,319 | ) | 170,473 | 59,649 | 230,122 | ||||||||||||||||||||||||||||
|
|
|
|
|
|
|
|
|
|
|
|
|
|
|
|
|
|
|
|
|
|||||||||||||||||||||
| Net income |
17,683 | 17,683 | 5,593 | 23,276 | ||||||||||||||||||||||||||||||||||||
| Other comprehensive income, net of tax |
299 | 945 | 238 | 1,482 | (2,999 | ) | (1,517 | ) | ||||||||||||||||||||||||||||||||
|
|
|
|
|
|
|
|
|
|
|
|
|
|
|
|||||||||||||||||||||||||||
| Comprehensive income |
17,683 | 299 | 945 | 238 | 19,165 | 2,594 | 21,759 | |||||||||||||||||||||||||||||||||
| Dividends declared |
(7,350 | ) | (7,350 | ) | (3,351 | ) | (10,701 | ) | ||||||||||||||||||||||||||||||||
| Issuance of shares associated with share-based payment plans |
1 | 158 | 159 | 57 | 216 | |||||||||||||||||||||||||||||||||||
| Acquisition of Grupo Socofar (see Note 4) |
— | 1,133 | 1,133 | |||||||||||||||||||||||||||||||||||||
| Contributions from non-controlling interest |
— | — | — | — | 250 | 250 | ||||||||||||||||||||||||||||||||||
| Other movements of equity method of associates, net of taxes |
(923 | ) | (923 | ) | — | (923 | ) | |||||||||||||||||||||||||||||||||
|
|
|
|
|
|
|
|
|
|
|
|
|
|
|
|
|
|
|
|
|
|||||||||||||||||||||
| Balances at December 31, 2015 |
Ps.3,348 | Ps.25,807 | Ps. | 156,532 | Ps. | — | Ps. | 606 | Ps. | (2,688) | Ps. | (2,081) | Ps. | 181,524 | Ps. | 60,332 | Ps. | 241,856 | ||||||||||||||||||||||
|
|
|
|
|
|
|
|
|
|
|
|
|
|
|
|
|
|
|
|
|
|||||||||||||||||||||
The accompanying notes are an integral part of these consolidated statements of changes in equity.
F-5
FOMENTO ECONÓMICO MEXICANO, S.A.B. DE C.V. AND SUBSIDIARIES
MONTERREY, N.L., MEXICO
Consolidated Statements of Cash Flows
For the years ended December 31, 2015, 2014 and 2013.
Amounts expressed in millions of U.S. dollars ($) and in millions of Mexican pesos (Ps.)
| 2015 (*) | 2015 | 2014 | 2013 | |||||||||||||
| Cash flows from operating activities: |
||||||||||||||||
| Income before income taxes |
$ | 1,815 | Ps. | 31,208 | Ps. | 28,883 | Ps. | 29,911 | ||||||||
| Adjustments for: |
||||||||||||||||
| Non-cash operating expenses |
167 | 2,873 | 209 | 752 | ||||||||||||
| Employee profit sharing |
72 | 1,243 | 1,138 | 1,936 | ||||||||||||
| Depreciation |
568 | 9,761 | 9,029 | 8,805 | ||||||||||||
| Amortization |
62 | 1,064 | 985 | 891 | ||||||||||||
| (Gain) loss on sale of long-lived assets |
(14 | ) | (249 | ) | 7 | (41 | ) | |||||||||
| (Gain) on sale of shares |
(1 | ) | (14 | ) | — | — | ||||||||||
| Disposal of long-lived assets |
24 | 416 | 153 | 122 | ||||||||||||
| Impairment of long-lived assets |
8 | 134 | 145 | — | ||||||||||||
| Share of the profit of associates and joint ventures accounted for using the equity method, net of taxes |
(352 | ) | (6,045 | ) | (5,139 | ) | (4,831 | ) | ||||||||
| Interest income |
(59 | ) | (1,024 | ) | (862 | ) | (1,225 | ) | ||||||||
| Interest expense |
452 | 7,777 | 6,701 | 4,331 | ||||||||||||
| Foreign exchange loss, net |
69 | 1,193 | 903 | 724 | ||||||||||||
| Monetary position loss, net |
2 | 36 | 319 | 427 | ||||||||||||
| Market value (gain) on financial instruments |
(21 | ) | (364 | ) | (73 | ) | (8 | ) | ||||||||
|
|
|
|
|
|
|
|
|
|||||||||
| Cash flow from operating activities before changes in operating accounts and employee profit sharing |
2,792 | 48,009 | 42,398 | 41,794 | ||||||||||||
| Accounts receivable and other current assets |
(255 | ) | (4,379 | ) | (4,962 | ) | (1,948 | ) | ||||||||
| Other current financial assets |
18 | 318 | 1,736 | (1,508 | ) | |||||||||||
| Inventories |
(252 | ) | (4,330 | ) | (1,122 | ) | (1,541 | ) | ||||||||
| Derivative financial instruments |
26 | 441 | 245 | 402 | ||||||||||||
| Suppliers and other accounts payable |
323 | 5,556 | 6,910 | 517 | ||||||||||||
| Other long-term liabilities |
48 | 822 | (2,308 | ) | (109 | ) | ||||||||||
| Other current financial liabilities |
(33 | ) | (570 | ) | 793 | 417 | ||||||||||
| Post-employment and other long-term employee benefits |
(22 | ) | (382 | ) | (416 | ) | (317 | ) | ||||||||
|
|
|
|
|
|
|
|
|
|||||||||
| Cash generated from operations |
2,645 | 45,485 | 43,274 | 37,707 | ||||||||||||
| Income taxes paid |
(508 | ) | (8,743 | ) | (5,910 | ) | (8,949 | ) | ||||||||
|
|
|
|
|
|
|
|
|
|||||||||
| Net cash generated by operating activities |
2,137 | 36,742 | 37,364 | 28,758 | ||||||||||||
|
|
|
|
|
|
|
|
|
|||||||||
| Cash flows from investing activities: |
||||||||||||||||
| Acquisition of Grupo Socofar, net of cash acquired (see Note 4) |
(401 | ) | (6,890 | ) | — | — | ||||||||||
| Acquisition of Grupo Yoli, net of cash acquired (see Note 4) |
— | — | — | (1,046 | ) | |||||||||||
| Acquisition of Companhia Fluminense de Refrigerantes, net of cash acquired (see Note 4) |
— | — | — | (4,648 | ) | |||||||||||
| Acquisition of Spaipa S.A. Industria Brasileira de Bebidas, net of cash acquired (see Note 4) |
— | — | — | (23,056 | ) | |||||||||||
| Other acquisitions, net of cash acquired (see Note 4) |
(339 | ) | (5,821 | ) | — | (3,021 | ) | |||||||||
| Investment in shares of Coca-Cola FEMSA Philippines, Inc. CCFPI (see Note 10) |
— | — | — | (8,904 | ) | |||||||||||
| Other investments in associates and joint ventures |
(17 | ) | (291 | ) | 90 | (335 | ) | |||||||||
| Purchase of investments |
— | — | (607 | ) | (118 | ) | ||||||||||
| Proceeds from investments |
7 | 126 | 589 | 1,488 | ||||||||||||
| Interest received |
60 | 1,024 | 863 | 1,224 | ||||||||||||
| Derivative financial instruments |
13 | 232 | (25 | ) | 119 | |||||||||||
| Dividends received from associates and joint ventures |
139 | 2,394 | 1,801 | 1,759 | ||||||||||||
| Property, plant and equipment acquisitions |
(1,017 | ) | (17,485 | ) | (16,985 | ) | (16,380 | ) | ||||||||
| Proceeds from the sale of property, plant and equipment |
37 | 630 | 209 | 252 | ||||||||||||
| Acquisition of intangible assets |
(56 | ) | (971 | ) | (706 | ) | (1,077 | ) | ||||||||
| Investment in other assets |
(87 | ) | (1,502 | ) | (796 | ) | (1,436 | ) | ||||||||
| Collections of other assets |
13 | 223 | — | — | ||||||||||||
| Investment in other financial assets |
(2 | ) | (28 | ) | (41 | ) | (52 | ) | ||||||||
|
|
|
|
|
|
|
|
|
|||||||||
| Net cash used in investing activities |
(1,650 | ) | (28,359 | ) | (15,608 | ) | (55,231 | ) | ||||||||
|
|
|
|
|
|
|
|
|
|||||||||
| Cash flows from financing activities: |
||||||||||||||||
| Proceeds from borrowings |
490 | 8,422 | 5,354 | 78,907 | ||||||||||||
| Payments of bank loans |
(903 | ) | (15,520 | ) | (5,721 | ) | (39,962 | ) | ||||||||
| Interest paid |
(265 | ) | (4,563 | ) | (3,984 | ) | (3,064 | ) | ||||||||
| Derivative financial instruments |
485 | 8,345 | (2,267 | ) | 697 | |||||||||||
| Dividends paid |
(622 | ) | (10,701 | ) | (3,152 | ) | (16,493 | ) | ||||||||
| Contributions from non-controlling interest |
15 | 250 | — | — | ||||||||||||
| Increase in shares of non-controlling interest |
— | — | — | 515 | ||||||||||||
| Other financing activities |
2 | 26 | 482 | (16 | ) | |||||||||||
|
|
|
|
|
|
|
|
|
|||||||||
| Net cash (used in) generated by financing activities |
(798 | ) | (13,741 | ) | (9,288 | ) | 20,584 | |||||||||
|
|
|
|
|
|
|
|
|
|||||||||
| (Decrease) increase in cash and cash equivalents |
(311 | ) | (5,358 | ) | 12,468 | (5,889 | ) | |||||||||
|
|
|
|
|
|
|
|
|
|||||||||
| Initial balance of cash and cash equivalents |
2,064 | 35,497 | 27,259 | 36,521 | ||||||||||||
|
|
|
|
|
|
|
|
|
|||||||||
| Effects of exchange rate changes and inflation effects on cash and cash equivalents held in foreign currencies |
(43 | ) | (743 | ) | (4,230 | ) | (3,373 | ) | ||||||||
|
|
|
|
|
|
|
|
|
|||||||||
| Ending balance of cash and cash equivalents |
$ | 1,710 | Ps. | 29,396 | Ps. | 35,497 | Ps. | 27,259 | ||||||||
|
|
|
|
|
|
|
|
|
|||||||||
| (*) | Convenience translation to U.S. dollars ($) – see Note 2.2.3 |
The accompanying notes are an integral part of these consolidated statements of cash flow.
F-6
FOMENTO ECONÓMICO MEXICANO, S.A.B. DE C.V. AND SUBSIDIARIES
MONTERREY, N.L., MEXICO
Notes to the Consolidated Financial Statements
As of December 31, 2015, 2014 and 2013.
Amounts expressed in millions of U.S. dollars ($) and in millions of Mexican pesos (Ps.)
Note 1. Activities of the Company
Fomento Económico Mexicano, S.A.B. de C.V. (“FEMSA”) is a Mexican holding company. The principal activities of FEMSA and its subsidiaries (the “Company”), as a business unit, are carried out by operating subsidiaries and companies under direct and indirect holding company subsidiaries of FEMSA.
The following is a description of the Company’s activities as of the date of the issuance of these consolidated financial statements, together with the ownership interest in each subholding company or business unit:
| % Ownership | ||||||
| Subholding Company |
December 31, |
December 31, |
Activities | |||
| Coca-Cola FEMSA, S.A.B. de C.V. and subsidiaries (“Coca-Cola FEMSA”) |
47.9%(1) (63.0% of the voting shares) |
47.9%(1) (63.0% of the voting shares) |
Production, distribution and marketing of certain Coca-Cola trademark beverages in Mexico, Guatemala, Nicaragua, Costa Rica, Panama, Colombia, Venezuela, Brazil, Argentina and Philippines (see Note 10). At December 31, 2015, The Coca-Cola Company (TCCC) indirectly owns 28.1% of Coca-Cola FEMSA’s capital stock. In addition, shares representing 24.0% of Coca-Cola FEMSA’s capital stock are traded on the Bolsa Mexicana de Valores (Mexican Stock Exchange “BMV”) and on the New York Stock Exchange, Inc (NYSE) in the form of American Depositary Shares (“ADS”) . | |||
| FEMSA Comercio, S.A. de C.V. and subsidiaries (“FEMSA Comercio – Retail Division”) |
100% | 100% | Small-box retail chain format operations in Mexico, Colombia and the United States, mainly under the trade name “OXXO”; drugstore operations in Chile and Colombia, mainly under the trademark “Cruz Verde” and Mexico under different brands such as Farmacon, YZA and Moderna. | |||
| FEMSA Comercio, S.A. de C.V. and subsidiaries (“FEMSA Comercio – Fuel Division”) |
100% | — | Retail service stations for fuels, motor oils, lubricants and car care products under the trade name “OXXO GAS” with operations in Mexico. | |||
| CB Equity, LLP (“CB Equity”) | 100% | 100% | This Company holds Heineken N.V. and Heineken Holding N.V. shares, which represents in the aggregate a 20% economic interest in both entities (“Heineken Company”). | |||
| Other companies | 100% | 100% | Companies engaged in the production and distribution of coolers, commercial refrigeration equipment and plastic cases; as well as transportation logistics and maintenance services to FEMSA’s subsidiaries and to third parties. | |||
| (1) | The Company controls Coca-Cola FEMSA’s relevant activities. |
F-7
Note 2. Basis of Preparation
2.1 Statement of compliance
The consolidated financial statements have been prepared in accordance with International Financial Reporting Standards (“IFRS”) as issued by the International Accounting Standards Board (“IASB”).
The Company’s consolidated financial statements and notes were authorized for issuance by the Company’s Chief Executive Officer Carlos Salazar Lomelín and Chief Financial and Corporate Officer Eduardo Padilla Silva on February 19, 2016. These consolidated financial statements and notes were then approved by the Company’s Board of Directors on February 23, 2016 and subsequent events have been considered through that date (see Note 28). These consolidated financial statements and their accompanying notes will be presented at the Company’s shareholders meeting in March 8, 2016. The Company’s shareholders have the faculty to approve or modify the Company’s consolidated financial statements.
2.2 Basis of measurement and presentation
The consolidated financial statements have been prepared on the historical cost basis, except for the following:
| • | Available-for-sale investments. |
| • | Derivative financial instruments. |
| • | Long-term notes payable on which fair value hedge accounting is applied. |
| • | Trust assets of post-employment and other long-term employee benefit plans. |
The financial statements of subsidiaries whose functional currency is the currency of a hyperinflationary economy are stated in terms of the measuring unit current at the end of the reporting period.
2.2.1 Presentation of consolidated income statement
The Company classifies its costs and expenses by function in the consolidated income statement, in order to conform to the industry practices where the Company operates.
2.2.2 Presentation of consolidated statements of cash flows
The Company’s consolidated statement of cash flows is presented using the indirect method.
2.2.3 Convenience translation to U.S. dollars ($)
The consolidated financial statements are stated in millions of Mexican pesos (“Ps.”) and rounded to the nearest million unless stated otherwise. However, solely for the convenience of the readers, the consolidated statement of financial position as of December 31, 2015, the consolidated income statement, the consolidated statement of comprehensive income and consolidated statement of cash flows for the year ended December 31, 2015 were converted into U.S. dollars at the exchange rate of 17.1950 Mexican pesos per U.S. dollar as published by the U.S. Federal Reserve Board in its H.10 Weekly Release of Foreign Exchange Rates as of that date. This arithmetic conversion should not be construed as representation that the amounts expressed in Mexican pesos may be converted into U.S. dollars at that or any other exchange rate. As explained in Note 2.1 above, as of February 23, 2016 (the issuance date of these financial statements) such exchange rate was Ps. 18.2762 per U.S. dollar, a devaluation of 6.2% since December 31, 2015.
2.3 Critical accounting judgments and estimates
In the application of the Company’s accounting policies, which are described in Note 3, management is required to make judgments, estimates and assumptions about the carrying amounts of assets and liabilities that are not readily apparent from other sources. The estimates and associated assumptions are based on historical experience and other factors that are considered to be relevant. Actual results may differ from these estimates.
F-8
The estimates and underlying assumptions are reviewed on an ongoing basis. Revisions to accounting estimates are recognized in the period in which the estimate is revised if the revision affects only that period or in the period of the revision and future periods if the revision affects both current and future periods.
2.3.1 Key sources of estimation uncertainty
The following are the key assumptions concerning the future and other key sources of estimation uncertainty at the end of the reporting period that have a significant risk of causing a material adjustment to the carrying amounts of assets and liabilities within the next financial year. Existing circumstances and assumptions about future developments, however, may change due to market changes or circumstances arising beyond the control of the Company. Such changes are reflected in the assumptions when they occur.
2.3.1.1 Impairment of indefinite lived intangible assets, goodwill and depreciable long-lived assets
Intangible assets with indefinite lives including goodwill are subject to annual impairment tests. An impairment exists when the carrying value of an asset or cash generating unit (CGU) exceeds its recoverable amount, which is the higher of its fair value less costs to sell and its value in use. The fair value less costs to sell calculation is based on available data from binding sales transactions in arm’s length transactions of similar assets or observable market prices less incremental costs for disposing of the asset. In order to determine whether such assets are impaired, the Company initially calculates an estimation of the value in use of the cash-generating units to which such assets have been allocated. The value in use calculation requires management to estimate the future cash flows expected to arise from the cash-generating unit and a suitable discount rate in order to calculate present value. The Company reviews annually the carrying value of its intangible assets with indefinite lives and goodwill for impairment based on recognized valuation techniques. While the Company believes that its estimates are reasonable, different assumptions regarding such estimates could materially affect its evaluations. Impairment losses are recognized in current earnings in the period the related impairment is determined. The key assumptions used to determine the recoverable amount for the Company’s CGUs, including a sensitivity analysis, are further explained in Notes 3.16 and 12.
The Company assesses at each reporting date whether there is an indication that an asset may be impaired. If any indication exists, or when annual impairment testing for an asset is required, the Company estimates the asset’s recoverable amount. When the carrying amount of an asset or CGU exceeds its recoverable amount, the asset is considered impaired and is written down to its recoverable amount. In assessing value in use, the estimated future cash flows are discounted to their present value using a pre-tax discount rate that reflects current market assessments of the time value of money and the risks specific to the asset. In determining fair value less costs to sell, recent market transactions are taken into account, if available. If no such transactions can be identified, an appropriate valuation model is used. These calculations are corroborated by valuation multiples, quoted share prices for publicly traded subsidiaries or other available fair value indicators.
2.3.1.2 Useful lives of property, plant and equipment and intangible assets with defined useful lives
Property, plant and equipment, including returnable bottles as they are expected to provide benefits over a period of more than one year, as well as intangible assets with defined useful lives are depreciated/amortized over their estimated useful lives. The Company bases its estimates on the experience of its technical personnel as well as based on its experience in the industry for similar assets, see Notes 3.12, 3.14, 11 and 12.
2.3.1.3 Post-employment and other long-term employee benefits
The Company regularly evaluates the reasonableness of the assumptions used in its post-employment and other long-term employee benefit computations. Information about such assumptions is described in Note 16.
F-9
2.3.1.4 Income taxes
Deferred income tax assets and liabilities are determined based on the differences between the financial statement carrying amounts and the tax basis of assets and liabilities. The Company regularly reviews its deferred tax assets for recoverability, and records a deferred tax asset based on its judgment regarding the probability of historical taxable income continuing in the future, projected future taxable income and the expected timing of the reversals of existing temporary differences, see Note 24.
2.3.1.5 Tax, labor and legal contingencies and provisions
The Company is subject to various claims and contingencies related to tax, labor and legal proceedings as described in Note 25. Due to their nature, such legal proceedings involve inherent uncertainties including, but not limited to, court rulings, negotiations between affected parties and governmental actions. Management periodically assesses the probability of loss for such contingencies and accrues a provision and/or discloses the relevant circumstances, as appropriate. If the potential loss of any claim or legal proceeding is considered probable and the amount can be reasonably estimated, the Company accrues a provision for the estimated loss. Management’s judgment must be exercised to determine the likelihood of such a loss and an estimate of the amount, due to the subjective nature of the loss.
2.3.1.6 Valuation of financial instruments
The Company is required to measure all derivative financial instruments at fair value.
The fair values of derivative financial instruments are determined considering quoted prices in recognized markets. If such instruments are not traded, fair value is determined by applying techniques based upon technical models supported by sufficient reliable and verifiable data, recognized in the financial sector. The Company bases its forward price curves upon market price quotations. Management believes that the chosen valuation techniques and assumptions used are appropriate in determining the fair value of financial instruments, see Note 20.
2.3.1.7 Business combinations
Acquisitions of businesses are accounted for using the acquisition method. The consideration transferred in a business combination is measured at fair value, which is calculated as the sum of the acquisition-date fair values of the assets transferred by the Company, liabilities assumed by the Company to the former owners of the acquiree and the equity interests issued by the Company in exchange for control of the acquiree.
At the acquisition date, the identifiable assets acquired and the liabilities assumed are recognized at their fair value, except that:
| • | Deferred tax assets or liabilities, and assets or liabilities related to employee benefit arrangements are recognized and measured in accordance with IAS 12, Income Taxes and IAS 19, Employee Benefits, respectively; |
| • | Liabilities or equity instruments related to share-based payment arrangements of the acquiree or share-based payment arrangements of the Company entered into to replace share-based payment arrangements of the acquiree are measured in accordance with IFRS 2, Share-based Payment at the acquisition date, see Note 3.24; and |
| • | Assets (or disposal groups) that are classified as held for sale in accordance with IFRS 5, Non-current Assets Held for Sale and Discontinued Operations are measured in accordance with that Standard. |
Management’s judgment must be exercised to determine the fair value of assets acquired and liabilities assumed.
Goodwill is measured as the excess of the sum of the consideration transferred, the amount of any non-controlling interests in the acquiree, and the fair value of the Company previously held equity interest in the acquiree (if any) over the net of the acquisition-date amounts of the identifiable assets acquired and the liabilities assumed. If, after reassessment, the net of the acquisition-date amounts of the identifiable assets acquired and liabilities assumed exceeds the sum of the consideration transferred, the amount of any non-controlling interests in the acquiree and the fair value of the Company previously held interest in the acquiree (if any), the excess is recognized immediately in profit or loss as a bargain purchase gain.
F-10
For each business combination, with respect to the non-controlling present ownership interests in the acquiree that entitle their holders to a proportionate share of net assets in liquidation, the Company elects whether to measure such interests at fair value or at the proportionate share of the acquiree’s identifiable net assets.
2.3.1.8 Investments in associates
If the Company holds, directly or indirectly, 20 per cent or more of the voting power of the investee, it is presumed that it has significant influence, unless it can be clearly demonstrated that this is not the case. If the Company holds, directly or indirectly, less than 20 per cent of the voting power of the investee, it is presumed that the Company does not have significant influence, unless such influence can be clearly demonstrated. Decisions regarding the propriety of utilizing the equity method of accounting for a less than 20 per cent-owned corporate investee requires a careful evaluation of voting rights and their impact on the Company’s ability to exercise significant influence. Management considers the existence of the following circumstances which may indicate that the Company is in a position to exercise significant influence over a less than 20 per cent-owned corporate investee:
| • | Representation on the board of directors or equivalent governing body of the investee; |
| • | Participation in policy-making processes, including participation in decisions about dividends or other distributions; |
| • | Material transactions between the Company and the investee; |
| • | Interchange of managerial personnel; or |
| • | Provision of essential technical information. |
Management also considers the existence and effect of potential voting rights that are currently exercisable or currently convertible when assessing whether the Company has significant influence.
In addition, the Company evaluates certain indicators that provide evidence of significant influence, such as:
| • | Whether the extent of the Company’s ownership is significant relative to other shareholders (i.e., a lack of concentration of other shareholders); |
| • | Whether the Company’s significant shareholders, fellow subsidiaries, or officers hold additional investment in the investee; and |
| • | Whether the Company is a part of significant investee committees, such as the executive committee or the finance committee. |
2.3.1.9 Joint arrangements
An arrangement can be a joint arrangement even though not all of its parties have joint control of the arrangement. When the Company is a party to an arrangement it shall assess whether the contractual arrangement gives all the parties, or a group of the parties, control of the arrangement collectively; joint control exists only when decisions about the relevant activities require the unanimous consent of the parties that control the arrangement collectively. Management needs to apply judgment when assessing whether all the parties, or a group of the parties, have joint control of an arrangement. When assessing joint control, management considers the following facts and circumstances:
| a) | Whether all the parties or a group of the parties, control the arrangement, considering definition of joint control, as described in Note 3.11.2; and |
| b) | Whether decisions about the relevant activities require the unanimous consent of all the parties, or of a group of the parties. |
F-11
As mentioned in Note 10, Coca-Cola FEMSA accounts for its 51% investment at Coca-Cola FEMSA Philippines, Inc. (CCFPI) as a joint venture. This is based on the facts that Coca-Cola FEMSA and TCCC: (i) during the initial four-year period all decisions are taken jointly by Coca-Cola FEMSA and TCCC; and (ii) potential voting rights to acquire the remaining 49% of CCFPI are not probable to be executed in the foreseeable future due to the fact the call option was “out of the money” as of December 31, 2015 and 2014.
2.3.1.10 Venezuela exchange rates and consolidation
As is further explained in Note 3.3 below, the exchange rate used to account for foreign currency denominated monetary items arising in Venezuela, and also the exchange rate used to translate the financial statements of the Company’s Venezuelan subsidiary for group reporting purposes are both key sources of estimation uncertainty in preparing the accompanying consolidated financial statements.
As is also explained in Note 3.3 below, the Company believes that it currently controls its subsidiary operations in Venezuela but recognizes the challenging economic and political environment in Venezuela. Should the Company in the future conclude that it no longer controls such operations, its consolidated financial statements would change by material amounts as further explained below.
2.4 Changes in accounting policies
The Company has adopted the following amendments to IFRS, during 2015:
Amendments to IAS 1 Disclosure Initiative
The amendments to IAS 1 “Presentation of Financial Statements” clarify, rather than significantly change, existing IAS 1 requirements, such as:
| • | The materiality requirements in IAS 1; |
| • | That specific line items in the statement(s) of profit or loss and OCI and the statement of financial position may be disaggregated; |
| • | That entities have flexibility as to the order in which they present the notes to financial statements; and |
| • | That the share of OCI of associates and joint ventures accounted for using the equity method must be classified as either those items that will be subsequently reclassified to profit or loss and those that will not, and be presented as a single line item within each of those categories. |
Furthermore, the amendments clarify the requirements that apply when additional subtotals are presented in the statement of financial position and the statement(s) of profit or loss and OCI. These amendments are effective for annual periods beginning on or after January 1, 2016, with early adoption permitted. The Company adopted these amendments and the only impact on the Company’s consolidated financial statements was presentation and disclosure.
Note 3. Significant Accounting Policies
3.1 Basis of consolidation
The consolidated financial statements comprise the financial statements of the Company. Control is achieved when the Company is exposed, or has rights, to variable returns from its involvement with the investee and has the ability to affect those returns through its power over the investee.
F-12
Specifically, the Company controls an investee if and only if the Company has:
| • | Power over the investee (i.e. existing rights that give it the current ability to direct the relevant activities of the investee); |
| • | Exposure, or rights, to variable returns from its involvement with the investee; and |
| • | The ability to use its power over the investee to affect its returns. |
When the Company has less than a majority of the voting or similar rights of an investee, the Company considers all relevant facts and circumstances in assessing whether it has power over an investee, including:
| • | The contractual arrangements with the other vote holders of the investee; |
| • | Rights arising from other contractual arrangements; and |
| • | The Company’s voting rights and potential voting rights. |
The Company re-assesses whether or not it controls an investee if facts and circumstances indicate that there are changes to one or more of the three elements of control. Consolidation of a subsidiary begins when the Company obtains control over the subsidiary and ceases when the Company loses control of the subsidiary. Assets, liabilities, income and expenses of a subsidiary acquired or disposed of during the year are included in the consolidated financial statements of income and comprehensive income from the date the Company gains control until the date the Company ceases to control the subsidiary.
Consolidated net income and each component of other comprehensive income (OCI) are attributed to the equity holders of the parent of the Company and to the non-controlling interests, even if this results in the non-controlling interests having a deficit balance. When necessary, adjustments are made to the financial statements of subsidiaries to bring their accounting policies into line with the Company’s accounting policies. All intercompany assets and liabilities, equity, income, expenses and cash flows have been eliminated in full on consolidation.
3.1.1 Acquisitions of non-controlling interests
Acquisitions of non-controlling interests are accounted for as transactions with owners in their capacity as owners and therefore no goodwill is recognized as a result. Adjustments to non-controlling interests arising from transactions that do not involve the loss of control are measured at carrying amount and reflected in shareholders’ equity as part of additional paid-in capital.
3.2 Business combinations
Business combinations are accounted for using the acquisition method at the acquisition date, which is the date on which control is transferred to the Company. In assessing control, the Company takes into consideration substantive potential voting rights.
The Company measures goodwill at the acquisition date as the fair value of the consideration transferred plus the fair value of any previously-held equity interest in the acquiree and the recognized amount of any non-controlling interests in the acquiree (if any), less the net recognized amount of the identifiable assets acquired and liabilities assumed. If after reassessment, the excess is negative, a bargain purchase gain is recognized in consolidated net income at the time of the acquisition.
The consideration transferred does not include amounts related to the settlement of pre-existing relationships. Such amounts that differ from amounts previously recognized are recognized in consolidated net income of the Company.
Costs related to the acquisition, other than those associated with the issuance of debt or equity securities, that the Company incurs in connection with a business combination are expensed as incurred.
F-13
Any contingent consideration payable is recognized at fair value at the acquisition date. If the contingent consideration is classified as equity, it is not remeasured and settlement is accounted for within equity. Otherwise, if after reassessment, subsequent changes to the fair value of the contingent considerations are recognized in consolidated net income.
If the initial accounting for a business combination is incomplete by the end of the reporting period in which the combination occurs, the Company reports provisional amounts for the items for which the accounting is incomplete, and discloses that its allocation is preliminary in nature. Those provisional amounts are adjusted retrospectively during the measurement period (not greater than 12 months), or additional assets or liabilities are recognized, to reflect new information obtained about facts and circumstances that existed at the acquisition date that, if known, would have affected the amounts recognized at that date.
3.3 Foreign currencies, consolidation of foreign subsidiaries and accounting for investments in associates and joint ventures
In preparing the financial statements of each individual subsidiary and accounting for investments in associates and joint ventures, transactions in currencies other than the individual entity’s functional currency (foreign currencies) are recognized at the rates of exchange prevailing at the dates of the transactions. At the end of each reporting period, monetary items denominated in foreign currencies are retranslated at the rates prevailing at that date. Non-monetary items that are measured in terms of historical cost in a foreign currency are not remeasured.
Exchange differences on monetary items are recognized in consolidated net income in the period in which they arise except for:
| • | The variations in the net investment in foreign subsidiaries generated by exchange rate fluctuation which are included as part of the exchange differences on translation of foreign operations within the cumulative other comprehensive income (loss) item, which is recorded in equity. |
| • | Intercompany financing balances with foreign subsidiaries are considered as long-term investments when there is no plan to pay such financing in the foreseeable future. Monetary position and exchange rate fluctuation regarding this financing is recorded in the exchange differences on translation of foreign operations within the cumulative other comprehensive income (loss) item, which is recorded in equity. |
| • | Exchange differences on transactions entered into in order to hedge certain foreign currency risks. |
Foreign exchange differences on monetary items are recognized in profit or loss. Their classification in the income statement depends on their nature. Differences arising from fluctuations related to operating activities are presented in the “other expenses” line (see Note 19) while fluctuations related to non-operating activities such as financing activities are presented as part of “foreign exchange gain (loss)” line in the income statement.
For incorporation into the Company’s consolidated financial statements, each foreign subsidiary, associates or joint venture’s individual financial statements are translated into Mexican pesos, as described as follows:
| • | For hyperinflationary economic environments, the inflation effects of the origin country are recognized, and subsequently translated into Mexican pesos using the year-end exchange rate for the consolidated statements of financial position and consolidated income statement and comprehensive income; and |
| • | For non-hyperinflationary economic environments, assets and liabilities are translated into Mexican pesos using the year-end exchange rate, equity is translated into Mexican pesos using the historical exchange rate, and the income statement and comprehensive income is translated using the exchange rate at the date of each transaction. The Company uses the average exchange rate of each month only if the exchange rate does not fluctuate significantly. |
F-14
| Exchange Rates of Local Currencies Translated to Mexican Pesos | ||||||||||||||||||||||
| Country or Zone |
Functional / | Average Exchange Rate for | Exchange Rate as of | |||||||||||||||||||
| Recording Currency |
2015 | 2014 | 2013 | December 31, 2015 |
December 31, 2014 |
|||||||||||||||||
| Guatemala |
Quetzal |
2.07 | 1.72 | 1.62 | 2.25 | 1.94 | ||||||||||||||||
| Costa Rica |
Colon |
0.03 | 0.02 | 0.03 | 0.03 | 0.03 | ||||||||||||||||
| Panama |
U.S. dollar |
15.85 | 13.30 | 12.77 | 17.21 | 14.72 | ||||||||||||||||
| Colombia |
Colombian peso |
0.01 | 0.01 | 0.01 | 0.01 | 0.01 | ||||||||||||||||
| Nicaragua |
Cordoba |
0.58 | 0.51 | 0.52 | 0.62 | 0.55 | ||||||||||||||||
| Argentina b) |
Argentine peso |
1.71 | 1.64 | 2.34 | 1.32 | 1.72 | ||||||||||||||||
| Venezuela a) |
Bolivar |
a | ) | a | ) | a | ) | a | ) | a | ) | |||||||||||
| Brazil |
Real |
4.81 | 5.66 | 5.94 | 4.41 | 5.54 | ||||||||||||||||
| Chile |
Chilean peso |
0.02 | 0.02 | 0.03 | 0.02 | 0.02 | ||||||||||||||||
| Euro Zone |
Euro (€) |
17.60 | 17.66 | 16.95 | 18.94 | 17.93 | ||||||||||||||||
| Philippines |
Philippine peso |
0.35 | 0.30 | 0.30 | 0.36 | 0.33 | ||||||||||||||||
| a) | Venezuela |
The Company has operated under exchange controls in Venezuela since 2003, which limit its ability to remit dividends abroad or make payments other than in local currency and that may increase the real price paid for raw materials and services purchased in local currency. Cash balances of the Company’s Venezuela subsidiary which are not available for use at the time the Company prepares its consolidated financial statements are disclosed in Note 5.
The exchange rate used by the Company for its Venezuela operations depends on the type of the transaction as explained below.
As of December 31, 2015 and 2014, the companies in Venezuela were able to convert bolivars to U.S. dollars at one of the following legal exchange rates:
| i) | The official exchange rate. Used for transactions involving what the Venezuelan government considers to be “essential goods and services”. Certain of Coca-Cola FEMSA concentrate purchases from The Coca-Cola Company and other strategic suppliers qualify for such treatment. As of December 31, 2015 and 2014, the official exchange rate was 6.30 bolivars per U.S. dollar. |
| ii) | SICAD. Used for certain transactions, including payment of services and payments related to foreign investments in Venezuela, determined by the state-run system known as Sistema Complementario de Administración de Divisas or SICAD exchange rate. The SICAD determined this alternative exchange rate based on limited periodic sales of U.S. dollars through auctions. As of December 31, 2015 the SICAD exchange rate was 13.50 bolivars per U.S. dollar (1.27 mexican peso per bolivar) and as of December 31, 2014 the SICAD exchange rate was 12.00 bolivars per U.S. dollar (1.23 mexican peso per bolivar). |
| iii) | SICAD II. The Venezuelan government enacted a new law in 2014 that authorized an additional method of exchanging Venezuelan bolivars to U.S. dollars. During 2014 and part of 2015 SICAD-II was used for certain types of transactions not covered by the official exchange rate or the SICAD exchange rate. The SICAD-II exchange rate as of December 31, 2014 was 49.99 bolivars per U.S. dollar (0.29 mexican peso per bolivar). In February 2015, this exchange rate was eliminated. |
F-15
| iv) | SIMADI. In February 2015, the Venezuelan government enacted a new market-based exchange rate determined by the system known as the Sistema Marginal de Divisas, or SIMADI. The SIMADI determines the exchange rates based on supply and demand of U.S. dollars. The SIMADI exchange rate as of December 31, 2015 was 198.70 bolivars per U.S. dollar (0.09 mexican peso per bolivar). |
The Company’s recognition of its Venezuelan operations [in Venezuela] involves a two-step accounting process in order to translate into bolivars all transactions in a different currency than bolivars and then to translate them to Mexican Pesos.
Step-one.- Transactions are first recorded in the stand-alone accounts of the Venezuelan subsidiary in its functional currency, which are bolivars. Any non-bolivar denominated monetary assets or liabilities are translated into bolivars at each balance sheet date using the exchange rate at which the Company expects them to be settled, with the corresponding effect of such translation being recorded in the income statement.
As of December 31, 2014, Coca-Cola FEMSA had U.S. $449 million in monetary liabilities recorded using the official exchange rate, as Coca-Cola FEMSA believes that such items qualify as essential goods and services as explained above. As of December 31, 2015, Coca-Cola FEMSA had U.S. $418.5 million in monetary liabilities recorded using the official exchange rate and U.S. $138.7 recorded at SICAD at the moment this exchange rate was determined by the government, of which U.S. $44.9 million were recorded at 12.00 bolivars, U.S. $35.9 were recorded at 12.80 bolivars and U.S. $57.9 at 13.50 bolivars.
Coca-Cola FEMSA believes that these payables for imports of essential goods should continue to qualify for settlement at the official exchange rate they were recorded, but also recognizes the current illiquidity of the U.S. dollar market in Venezuela. If there is a change in the official exchange rate used in the future, or should Coca-Cola FEMSA determine these amounts no longer qualify, the Coca-Cola FEMSA might need to will recognize a portion of such impact of this change in the income statement.
Step-two.- In order to integrate the results of the Venezuelan operations into the consolidated figures of Coca-Cola FEMSA, such Venezuelan results are translated from Venezuelan bolivars into Mexican pesos. During 2015, Coca-Cola FEMSA used SIMADI exchange rate based on the expectations that this would have been the exchange rate to what dividends will be settled. During 2014, the Company decided to use the SICAD II exchange rate to better reflect the economic conditions in Venezuela at the time. Prior to 2014, the Company used the official exchange rate (6.30 bolivars per U.S. dollar).
| b) | Argentina |
Official exchange rates for Argentina are published by the Argentine Central Bank. The Argentine peso has experienced significant devaluation over the past several years and the government has adopted various rules and regulations since late 2011 that established new restrictive controls on capital flows into the country. These enhanced exchange controls have practically closed the foreign exchange market to retail transactions. It is widely reported that the Argentine peso/U.S. dollar exchange rate in the unofficial market substantially differs from the official foreign exchange rate. The Argentine government could impose further exchange controls or restrictions on the movement of capital and take other measures in the future in response to capital flight or a significant depreciation of the Argentine peso.
On the disposal of a foreign operation (i.e., a disposal of the Company’s entire interest in a foreign operation, or a disposal involving loss of control over a subsidiary that includes a foreign operation, a disposal involving loss of joint control over a joint venture that includes a foreign operation, or a disposal involving loss of significant influence over an associate that includes a foreign operation), all of the exchange differences accumulated in other comprehensive income in respect of that operation attributable to the owners of the Company are recognized in the consolidated income statement. The Company continues to monitor all of its foreign operations, but most notably its Venezuela operations for the reasons explained herein. Over the past few years, the Company has accumulated significant amounts of accumulated other comprehensive loss (approximating Ps. 15,536 million) related to such Venezuela operations. To the extent that economic and or operational conditions were to worsen in the future resulting in a conclusion that the Company no longer controls such operations, such would involve both deconsolidation and an income statement charge for accumulated amounts. There can be no assurances that such might not happen in the future.
F-16
In addition, in relation to a partial disposal of a subsidiary that does not result in the Company losing control over the subsidiary, the proportionate share of accumulated exchange differences are re-attributed to non-controlling interests and are not recognized in profit or loss. For all other partial disposals (i.e., partial disposals of associates or joint ventures that do not result in the Company losing significant influence or joint control), the proportionate share of the accumulated exchange differences is reclassified to profit or loss.
Goodwill and fair value adjustments on identifiable assets and liabilities acquired arising on the acquisition of a foreign operation are treated as assets and liabilities of the foreign operation and translated at the rate of exchange prevailing at the end of each reporting period. Foreign exchange differences arising are recognized in equity as part of the cumulative translation adjustment.
The translation of assets and liabilities denominated in foreign currencies into Mexican pesos is for consolidation purposes and does not indicate that the Company could realize or settle the reported value of those assets and liabilities in Mexican pesos. Additionally, this does not indicate that the Company could return or distribute the reported Mexican peso value equity to its shareholders.
3.4 Recognition of the effects of inflation in countries with hyperinflationary economic environments
The Company recognizes the effects of inflation on the financial information of its Venezuelan subsidiary that operates in hyperinflationary economic environments (when cumulative inflation of the three preceding years is approaching, or exceeds, 100% or more in addition to other qualitative factors), which consists of:
| • | Using inflation factors to restate non-monetary assets, such as inventories, property, plant and equipment, intangible assets, including related costs and expenses when such assets are consumed or depreciated; |
| • | Applying the appropriate inflation factors to restate capital stock, additional paid-in capital, net income, retained earnings and items of other comprehensive income by the necessary amount to maintain the purchasing power equivalent in the currency of Venezuela on the dates such capital was contributed or income was generated up to the date of these consolidated financial statements are presented; and |
| • | Including the monetary position gain or loss in consolidated net income. |
The Company restates the financial information of subsidiaries that operate in a hyperinflationary economic environment (Venezuela) using the consumer price index of that country. The Venezuelan economy’s cumulative inflation rate for the period 2013-2015, 2012-2014 and 2011-2013 was 562.9%, 210.2% and 139.3%; respectively.
During 2014, the International Monetary Fund (IMF) issued a declaration of censure and called on Argentina to adopt remedial measures to address the quality of its official inflation data. The IMF noted that alternative data sources have shown considerably higher inflation rates than the official data since 2008. Consumer price data reported by Argentina from January 2014 onwards reflect the new national Consumer Price Index (CPI) which means Indice de Precios al Consumidor Nacional Urbano (IPCNu), which differs substantively from the preceding CPI. Because of the differences in geographical coverage, weights, sampling, and methodology, the IPCNu data cannot be directly compared to the earlier CPI-GBA data.
F-17
3.5 Cash and cash equivalents and restricted cash
Cash is measured at nominal value and consists of non-interest bearing bank deposits. Cash equivalents consist principally of short-term bank deposits and fixed rate investments, both with maturities of three months or less at the acquisition date and are recorded at acquisition cost plus interest income not yet received, which is similar to market prices.
The Company also maintains restricted cash held as collateral to meet certain contractual obligations (see Note 9.2). Restricted cash is presented within other current financial assets given that the restrictions are short-term in nature.
3.6 Financial assets
Financial assets are classified into the following specified categories: “fair value through profit or loss (FVTPL) ,” “held-to-maturity investments,” “available-for-sale” and “loans and receivables” or as derivatives designated as hedging instruments in an effective hedge, as appropriate. The classification depends on the nature and purpose of holding the financial assets and is determined at the time of initial recognition.
When a financial asset is recognized initially, the Company measures it at its fair value plus, in the case of a financial asset not at fair value through profit or loss, transaction costs that are directly attributable to the acquisition of the financial asset.
The fair value of an asset or a liability is measured using the assumptions that market participants would use when pricing the asset or liability, assuming that market participants act in their economic best interest.
The Company’s financial assets include cash, cash equivalents and restricted cash, investments with maturities of greater than three months, loans and receivables, derivative financial instruments and other financial assets.
3.6.1 Effective interest rate method
The effective interest rate method is a method of calculating the amortized cost of loans and receivables and other financial assets (designated as held to-maturity) and of allocating interest income/expense over the relevant period. The effective interest rate is the rate that exactly discounts estimated future cash receipts (including all fees on points paid or received that form an integral part of the effective interest rate, transaction costs and other premiums or discounts) through the expected life of the financial asset, or (where appropriate) a shorter period, to the net carrying amount on initial recognition.
3.6.2 Investments
Investments consist of debt securities and bank deposits with maturities of more than three months at the acquisition date. Management determines the appropriate classification of investments at the time of purchase and assesses such designation as of each reporting date (see Note 6).
3.6.2.1 Available-for-sale investments are those non-derivative financial assets that are designated as available for sale or are not classified as loans and receivables, held to maturity investments or financial assets at fair value through profit or loss. These investments are carried at fair value, with the unrealized gains and losses, net of tax, reported in other comprehensive income. Interest and dividends on investments classified as available-for-sale are included in interest income. The fair values of the investments are readily available based on quoted market prices. The exchange effects of securities available for sale are recognized in the consolidated income statement in the period in which they arise.
3.6.2.2 Held-to maturity investments are those that the Company has the positive intent and ability to hold to maturity, and after initial measurement, such financial assets are subsequently measured at amortized cost, which includes any cost of purchase and premium or discount related to the investment. Subsequently, the premium/discount is amortized over the life of the investment based on its outstanding balance utilizing the effective interest method less any impairment. Interest and dividends on investments classified as held-to maturity are included in interest income.
F-18
3.6.3 Loans and receivables
Loans and receivables are non-derivative financial instruments with fixed or determinable payments that are not quoted in an active market. Loans and receivables with a stated term (including trade and other receivables) are measured at amortized cost using the effective interest method, less any impairment.
Interest income is recognized by applying the effective interest rate, except for short-term receivables when the recognition of interest would be immaterial. For the years ended December 31, 2015, 2014 and 2013 the interest income on loans and receivables recognized in the interest income line item within the consolidated income statements is Ps. 53, Ps. 47 and Ps. 127, respectively.
3.6.4 Other financial assets
Other financial assets include long term accounts receivable and derivative financial instruments. Long term accounts receivable with a stated term are measured at amortized cost using the effective interest method, less any impairment.
3.6.5 Impairment of financial assets
Financial assets, other than those at FVTPL, are assessed for indicators of impairment at the end of each reporting period. Financial assets are considered to be impaired when there is objective evidence that, as a result of one or more events that occurred after the initial recognition of the financial asset, (an incurred “loss event”) and that loss event has an impact on the estimated future cash flows of the financial assets that can be reliably estimated.
Evidence of impairment may include indicators as follows:
| • | Significant financial difficulty of the issuer or counterparty; or |
| • | Default or delinquent in interest or principal payments; or |
| • | It becoming probable that the borrower will enter bankruptcy or financial re-organization; or |
| • | The disappearance of an active market for that financial asset because of financial difficulties. |
For financial assets carried at amortized cost, the amount of the impairment loss recognized is the difference between the asset’s carrying amount and the present value of estimated future cash flows, discounted at the financial asset’s original effective interest rate.
The carrying amount of the financial asset is reduced by the impairment loss directly for all financial assets with the exception of trade receivables, where the carrying amount is reduced through the use of an allowance for doubtful accounts. When a trade receivable is considered uncollectible, it is written off against the allowance account. Subsequent recoveries of amounts previously written off are credited against the allowance account. Changes in the carrying amount of the allowance account are recognized in consolidated net income.
No impairment was recognized for the years ended December 31, 2015, 2014 and 2013.
3.6.6 Derecognition
A financial asset (or, where applicable, a part of a financial asset or part of a group of similar financial assets) is derecognized when:
| • | The rights to receive cash flows from the financial asset have expired, or |
F-19
| • | The Company has transferred its rights to receive cash flows from the asset or has assumed an obligation to pay the received cash flows in full without material delay to a third party under a ‘pass-through’ arrangement; and either (a) the Company has transferred substantially all the risks and rewards of the asset, or (b) the Company has neither transferred nor retained substantially all the risks and rewards of the asset, but has transferred control of the asset. |
3.6.7 Offsetting of financial instruments
Financial assets are required to be offset against financial liabilities and the net amount reported in the consolidated statement of financial position if, and only when the Company:
| • | Currently has an enforceable legal right to offset the recognized amounts; and |
| • | Intends to settle on a net basis, or to realize the assets and settle the liabilities simultaneously. |
3.7 Derivative financial instruments
The Company is exposed to different risks related to cash flows, liquidity, market and third party credit. As a result, the Company contracts different derivative financial instruments in order to reduce its exposure to the risk of exchange rate fluctuations between the Mexican peso and other currencies, and interest rate fluctuations associated with its borrowings denominated in foreign currencies and the exposure to the risk of fluctuation in the costs of certain raw materials.
The Company values and records all derivative financial instruments and hedging activities, in the consolidated statement of financial position as either an asset or liability measured at fair value, considering quoted prices in recognized markets. If such instruments are not traded in a formal market, fair value is determined by applying techniques based upon technical models supported by sufficient, reliable and verifiable market data. Changes in the fair value of derivative financial instruments are recorded each year in current earnings or as a component of cumulative other comprehensive income based on the item being hedged and the effectiveness of the hedge.
3.7.1 Hedge accounting
The Company designates certain hedging instruments, which include derivatives to cover foreign currency risk, as either fair value hedges or cash flow hedges. Hedges of foreign exchange risk on firm commitments are accounted for as cash flow hedges.
At the inception of the hedge relationship, the Company documents the relationship between the hedging instrument and the hedged item, along with its risk management objectives and its strategy for undertaking various hedge transactions. Furthermore, at the inception of the hedge and on an ongoing basis, the Company documents whether the hedging instrument is highly effective in offsetting changes in fair values or cash flows of the hedged item attributable to the hedged risk.
3.7.2 Cash flow hedges
The effective portion of changes in the fair value of derivatives that are designated and qualify as cash flow hedges is recognized in other comprehensive income and accumulated under the heading valuation of the effective portion of derivative financial instruments. The gain or loss relating to the ineffective portion is recognized immediately in consolidated net income, and is included in the market value (gain) loss on financial instruments line item within the consolidated income statements.
Amounts previously recognized in other comprehensive income and accumulated in equity are reclassified to consolidated net income in the periods when the hedged item is recognized in consolidated net income, in the same line of the consolidated income statement as the recognized hedged item. However, when the hedged forecast transaction results in the recognition of a non-financial asset or a non-financial liability, the gains and losses previously recognized in other comprehensive income and accumulated in equity are transferred from equity and included in the initial measurement of the cost of the non-financial asset or non-financial liability.
F-20
Hedge accounting is discontinued when the Company revokes the hedging relationship, when the hedging instrument expires or is sold, terminated, or exercised, or when it no longer qualifies for hedge accounting. Any gain or loss recognized in cumulative other comprehensive income in equity at that time remains in equity and is recognized when the forecast transaction is ultimately recognized in consolidated net income. When a forecast transaction is no longer expected to occur, the gain or loss accumulated in equity is recognized immediately in consolidated net income.
3.7.3 Fair value hedges
The change in the fair value of a hedging derivative is recognized in the consolidated income statement as foreign exchange gain or loss. The change in the fair value of the hedged item attributable to the risk hedged is recorded as part of the carrying value of the hedged item and is also recognized in the consolidated income statement as foreign exchange gain or loss.
For items which had been accounted for as fair value hedges, and subsequently accounted for as a cash flow hedge and now carried at amortized cost, the adjustment to carrying value to its principal amount is amortized through profit or loss over the remaining term of the hedge using the EIR method. EIR amortization may begin as soon as an adjustment exists and no later than when the hedged item ceases to be adjusted for changes in its fair value attributable to the risk being hedged. If the hedged item is derecognized, the unamortized fair value is recognized immediately in profit or loss.
When an unrecognized firm commitment is designated as a hedged item, the subsequent cumulative change in the fair value of the firm commitment attributable to the hedged risk is recognized as an asset or liability with a corresponding gain or loss recognized in the consolidated net income.
3.8 Fair value measurement
The Company measures financial instruments, such as derivatives, and non-financial assets, at fair value at each balance sheet date. Also, fair values of financial instruments measured at amortized cost are disclosed in Notes 13 and 18.
Fair value is the price that would be received to sell an asset or paid to transfer a liability in an orderly transaction between market participants at the measurement date. The fair value measurement is based on the presumption that the transaction to sell the asset or transfer the liability takes place either:
| • | In the principal market for the asset or liability; or |
| • | In the absence of a principal market, in the most advantageous market for the asset or liability. |
A fair value measurement of a non-financial asset takes into account a market participant’s ability to generate economic benefits by using the asset in its highest and best use or by selling it to another market participant that would use the asset in its highest and best use.
The Company uses valuation techniques that are appropriate in the circumstances and for which sufficient data are available to measure fair value, maximizing the use of relevant observable inputs and minimizing the use of unobservable inputs.
All assets and liabilities for which fair value is measured or disclosed in the financial statements are categorized within the fair value hierarchy, described as follows, based on the lowest level input that is significant to the fair value measurement as a whole:
| • | Level 1 — Quoted prices (unadjusted) in active markets for identical assets or liabilities that the reporting entity has the ability to access at the measurement date. |
F-21
| • | Level 2 — Inputs other than quoted prices included within level 1 that are observable for the asset or liability, either directly or indirectly. |
| • | Level 3 — Are unobservable inputs for the asset or liability. Unobservable inputs shall be used to measure fair value to the extent that observable inputs are not available, thereby allowing for situations in which there is little, if any, market activity for the asset or liability at the measurement date. |
For assets and liabilities that are recognized in the financial statements on a recurring basis, the Company determines whether transfers have occurred between Levels in the hierarchy by re-assessing categorization (based on the lowest level input that is significant to the fair value measurement as a whole) at the end of each reporting period.
The Company determines the policies and procedures for both recurring fair value measurements, such as those described in Note 20 and unquoted liabilities such as debt described in Note 18.
For the purpose of fair value disclosures, the Company has determined classes of assets and liabilities on the basis of the nature, characteristics and risks of the asset or liability and the level of the fair value hierarchy as explained above.
3.9 Inventories and cost of goods sold
Inventories are measured at the lower of cost and net realizable value. Net realizable value represents the estimated selling price for inventories less all estimated costs of completion and costs necessary to make the sale.
Inventories represent the acquisition or production cost which is incurred when purchasing or producing a product, and are based on the weighted average cost formula. The operating segments of the Company use inventory costing methodologies to value their inventories, such as the weighted average cost method in Coca-Cola FEMSA and retail method in FEMSA Comercio – Retail Division and FEMSA Comercio – Fuel Division.
Cost of goods sold is based on average cost of the inventories at the time of sale.
Cost of goods sold in Coca-Cola FEMSA includes expenses related to the purchase of raw materials used in the production process, as well as labor costs (wages and other benefits), depreciation of production facilities, equipment and other costs, including fuel, electricity, equipment maintenanceand inspection.
Cost of goods sold in FEMSA Comercio – Retail Division includes expenses related to the purchase of goods and services used in the sale process of the Company´s products.
Cost of goods sold in FEMSA Comercio – Fuel Division includes expenses related to the purchase of gasoline, diesel and all engine lubricants used in the sale process of the Company.
3.10 Other current assets
Other current assets, which will be realized within a period of less than one year from the reporting date, are comprised of prepaid assets and agreements with customers.
Prepaid assets principally consist of advances to suppliers of raw materials, advertising, promotional, leasing and insurance costs, and are recognized as other current assets at the time of the cash disbursement. Prepaid assets are carried to the appropriate caption in the income statement when inherent benefits and risks have already been transferred to the Company or services have been received.
The Company has prepaid advertising costs which consist of television and radio advertising airtime paid in advance. These expenses are generally amortized over the period based on the transmission of the television and radio spots. The related production costs are recognized in consolidated net income as incurred.
F-22
Coca-Cola FEMSA has agreements with customers for the right to sell and promote Coca-Cola FEMSA’s products over a certain period. The majority of these agreements have terms of more than one year, and the related costs are amortized using the straight-line method over the term of the contract, with amortization presented as a reduction of net sales. During the years ended December 31, 2015, 2014 and 2013, such amortization aggregated to Ps. 317, Ps. 338 and Ps. 696, respectively.
3.11 Investments in associates and joint arrangements
3.11.1 Investments in associates
Associates are those entities over which the Company has significant influence. Significant influence is the power to participate in the financial and operating policy decisions of the investee, but is not control over those policies.
Investments in associates are accounted for using the equity method and initial recognition comprises the investment’s purchase price and any directly attributable expenditure necessary to acquire it.
The consolidated financial statements include the Company’s share of the consolidated net income and other comprehensive income, after adjustments to align the accounting policies with those of the Company, from the date that significant influence commences until the date that significant influence ceases.
Profits and losses resulting from ‘upstream’ and ‘downstream’ transactions between the Company (including its consolidated subsidiaries) and an associate are recognized in the consolidated financial statements only to the extent of unrelated investors’ interests in the associate. ‘Upstream’ transactions are, for example, sales of assets from an associate to the Company. ‘Downstream’ transactions are, for example, sales of assets from the Company to an associate. The Company’s share in the associate’s profits and losses resulting from these transactions is eliminated.
When the Company’s share of losses exceeds the carrying amount of the associate, including any long-term investments, the carrying amount is reduced to nil and recognition of further losses is discontinued except to the extent that the Company has a legal or constructive obligation to pay the associate or has to make payments on behalf of the associate.
Goodwill identified at the acquisition date is presented as part of the investment in shares of the associate in the consolidated statement of financial position. Any goodwill arising on the acquisition of the Company’s interest in an associate is measured in accordance with the Company’s accounting policy for goodwill arising in a business combination, see Note 3.2.
After application of the equity method, the Company determines whether it is necessary to recognize an additional impairment loss on its investment in its associate. The Company determines at each reporting date whether there is any objective evidence that the investment in the associates is impaired. If this is the case, the Company calculates the amount of impairment as the difference between the recoverable amount of the associate and its carrying value, and recognizes the amount in the share of the profit or loss of associates and joint ventures accounted for using the equity method in the consolidated income statements.
3.11.2 Joint arrangements
A joint arrangement is an arrangement of which two or more parties have joint control. Joint control is the contractually agreed sharing of control of an arrangement, which exists only when decisions about the relevant activities require the unanimous consent of the parties sharing control. The Company classifies its interests in joint arrangements as either joint operations or joint ventures depending on the Company’s rights to the assets and obligations for the liabilities of the arrangements.
F-23
Joint venture is a joint arrangement whereby the parties that have joint control of the arrangement have rights to the net assets of the arrangement. The Company recognizes its interest in the joint ventures as an investment and accounts for that investment using the equity method, as described in Note 3.11.1. As of December 31, 2015 and 2014 the Company does not have an interest in joint operations.
After application of the equity method, the Company determines whether it is necessary to recognize an impairment loss on its investment in its joint venture. The Company determines at each reporting date whether there is any objective evidence that the investment in the joint ventures is impaired. If this is the case, the Company calculates the amount of impairment as the difference between the recoverable amount of the joint venture and its carrying value and recognizes the amount in the share of the profit or loss of joint ventures accounted for using the equity method in the consolidated statements of income.
3.12 Property, plant and equipment
Property, plant and equipment are initially recorded at their cost of acquisition and/or construction, and are presented net of accumulated depreciation and/or accumulated impairment losses, if any. The borrowing costs related to the acquisition or construction of qualifying asset is capitalized as part of the cost of that asset, if material.
Major maintenance costs are capitalized as part of total acquisition cost. Routine maintenance and repair costs are expensed as incurred.
Investments in progress consist of long-lived assets not yet in service, in other words, that are not yet used for the purpose that they were bought, built or developed. The Company expects to complete those investments during the following 12 months.
Depreciation is computed using the straight-line method over the asset’s estimated useful life. Where an item of property, plant and equipment comprises major components having different useful lives, they are accounted and depreciated for as separate items (major components) of property, plant and equipment. The Company estimates depreciation rates, considering the estimated useful lives of the assets.
The estimated useful lives of the Company’s principal assets are as follows:
| Years | ||||
| Buildings |
15-50 | |||
| Machinery and equipment |
10-20 | |||
| Distribution equipment |
7-15 | |||
| Refrigeration equipment |
5-7 | |||
| Returnable bottles |
1.5-4 | |||
| Leasehold improvements |
The shorter of lease term or 15 years | |||
| Information technology equipment |
3-5 | |||
| Other equipment |
3-10 | |||
F-24
The estimated useful lives, residual values and depreciation method are reviewed at the end of each reporting period, with the effect of any changes in estimate accounted for on a prospective basis.
An item of property, plant and equipment is derecognized upon disposal or when no future economic benefits are expected to arise from the continued use of the asset. Any gain or loss arising on the disposal or retirement of an item of property, plant and equipment is determined as the difference between the sales proceeds (if any) and the carrying amount of the asset and is recognized in consolidated net income.
Returnable and non-returnable bottles:
Coca-Cola FEMSA has two types of bottles: returnable and non-returnable.
| • | Non returnable: Are recorded in consolidated net income at the time of the sale of the product. |
| • | Returnable: Are classified as long-lived assets as a component of property, plant and equipment. Returnable bottles are recorded at acquisition cost; and for countries with hyperinflationary economies, restated according to IAS 29, “Financial Reporting in Hyperinflationary Economies.” Depreciation of returnable bottles is computed using the straight-line method considering their estimated useful lives. |
There are two types of returnable bottles:
| • | Those that are in Coca-Cola FEMSA’s control within its facilities, plants and distribution centers; and |
| • | Those that have been placed in the hands of customers, and still belong to Coca-Cola FEMSA. |
Returnable bottles that have been placed in the hands of customers are subject to an agreement with a retailer pursuant to which Coca-Cola FEMSA retains ownership. These bottles are monitored by sales personnel during periodic visits to retailers and Coca-Cola FEMSA has the right to charge any breakage identified to the retailer. Bottles that are not subject to such agreements are expensed when placed in the hands of retailers.
Coca-Cola FEMSA’s returnable bottles are depreciated according to their estimated useful lives (3 years for glass bottles and 1.5 years for PET bottles). Deposits received from customers are amortized over the same useful estimated lives of the bottles.
3.13 Borrowing costs
Borrowing costs directly attributable to the acquisition, construction or production of qualifying assets, which are assets that necessarily take a substantial period of time to get ready for their intended use or sale, are added to the cost of those assets, until such time as the assets are substantially ready for their intended use or sale. Borrowing costs may include:
| • | Interest expense; and |
| • | Exchange differences arising from foreign currency borrowings to the extent that they are regarded as an adjustment to interest costs. |
Interest income earned on the temporary investment of specific borrowings pending their expenditure on qualifying assets is deducted from the borrowing costs eligible for capitalization.
All other borrowing costs are recognized in consolidated net income in the period in which they are incurred.
F-25
3.14 Intangible assets
Intangible assets are identifiable non monetary assets without physical substance and represent payments whose benefits will be received in future years. Intangible assets acquired separately are measured on initial recognition at cost. The cost of intangible assets acquired in a business combination is their fair value as at the date of acquisition (see Note 3.2). Following initial recognition, intangible assets are carried at cost less any accumulated amortization and accumulated impairment losses. The useful lives of intangible assets are assessed as either finite or indefinite, in accordance with the period over which the Company expects to receive the benefits.
Intangible assets with finite useful lives are amortized and mainly consist of:
| • | Information technology and management system costs incurred during the development stage which are currently in use. Such amounts are capitalized and then amortized using the straight-line method over their expected useful lives, with a range in useful lives from 3 to 10 years. Expenses that do not fulfill the requirements for capitalization are expensed as incurred. |
| • | Long-term alcohol licenses are amortized using the straight-line method over their estimated useful lives, which range between 12 and 15 years, and are presented as part of intangible assets with finite useful lives. |
Amortized intangible assets, such as finite lived intangible assets are reviewed for impairment whenever events or changes in circumstances indicate that the carrying amount of an asset or group of assets may not be recoverable through its expected future cash flows.
Intangible assets with an indefinite life are not amortized and are subject to impairment tests on an annual basis as well as whenever certain circumstances indicate that the carrying amount of those intangible assets exceeds their recoverable value.
The Company’s intangible assets with an indefinite life mainly consist of rights to produce and distribute Coca-Cola trademark products in the Company’s territories. These rights are contained in agreements that are standard contracts that The Coca-Cola Company has with its bottlers.
As of December 31, 2015, Coca-Cola FEMSA had nine bottler agreements in Mexico: (i) the agreements for the Valley of Mexico territory, which are up for renewal in May 2016 and June 2023, (ii) the agreement for the Southeast territory, which is up for renewal in June 2023, (iii) three agreements for the Central territory, which are up for renewal in May 2016, July 2016 and May 2025, (iv) the agreement for the Northeast territory, which is up for renewal in May 2016, and (v) two agreements for the Bajio territory, which are up for renewal in May 2016 and May 2025.
As of December 31, 2015, Coca-Cola FEMSA had four bottler agreements in Brazil, which are up for renewal in October 2017 (two agreements) and April 2024 (two agreements); and one bottler agreement in each of Argentina, which is up for renewal in September 2024; Colombia, which is up for renewal in June 2024; Venezuela, which is up for renewal in August 2016; Guatemala, which is up for renewal in March 2025; Costa Rica, which is up for renewal in September 2017; Nicaragua, which is up for renewal in May 2016 and Panama, which is up for renewal in November 2024.
The bottler agreements are automatically renewable for ten-year terms, subject to the right of either party to give prior notice that it does not wish to renew a specific agreement. In addition, these agreements generally may be terminated in the case of material breach. Termination would prevent the Company from selling Coca-Cola trademark beverages in the affected territory and would have an adverse effect on the Company’s business, financial conditions, results from operations and prospects.
F-26
3.15 Non-current assets held for sale
Non-current assets and disposal groups are classified as held for sale if their carrying amount will be recovered principally through a sale transaction rather than through continuing use. This condition is regarded as met only when the sale is highly probable and the non-current asset (or disposal group) is available for immediate sale in its present condition. Management must be committed to the sale, which should be expected to qualify for recognition as a completed sale within one year from the date of classification.
When the Company is committed to a sale plan involving loss of control of a subsidiary, all of the assets and liabilities of that subsidiary are classified as held for sale when the criteria described above are met, regardless of whether the Company will retain a non-controlling interest in its former subsidiary after the sale.
Non-current assets (and disposal groups) classified as held for sale are measured at the lower of their previous carrying amount and fair value less costs to sell.
3.16 Impairment of non financial assets
At the end of each reporting period, the Company reviews the carrying amounts of its tangible and intangible assets to determine whether there is any indication that those assets have suffered an impairment loss. If any such indication exists, the recoverable amount of the asset is estimated in order to determine the extent of the impairment loss (if any). Where it is not possible to estimate the recoverable amount of an individual asset, the Company estimates the recoverable amount of the cash-generating unit to which the asset belongs. Where a reasonable and consistent basis of allocation can be identified, corporate assets are also allocated to individual CGUs, or otherwise they are allocated to the smallest CGUs for which a reasonable and consistent allocation basis can be identified.
For goodwill and other indefinite lived intangible assets, the Company tests for impairment on an annual basis and whenever certain circumstances indicate that the carrying amount of the cash generating unit might exceed its recoverable amount.
Recoverable amount is the higher of fair value less costs to sell and value in use. In assessing value in use, the estimated future cash flows are discounted to their present value using a pre-tax discount rate that reflects current market assessments of the time value of money and the risks specific to the asset for which the estimates of future cash flows have not been adjusted.
If the recoverable amount of an asset (or CGU) is estimated to be less than its carrying amount, the carrying amount of the asset (or CGU) is reduced to its recoverable amount. An impairment loss is recognized immediately in consolidated net income.
Where an impairment loss subsequently reverses, the carrying amount of the asset (or CGU) is increased to the revised estimate of its recoverable amount, but so that the increased carrying amount does not exceed the carrying amount that would have been determined had no impairment loss been recognized for the asset (or CGU) in prior years. A reversal of an impairment loss is recognized immediately in consolidated net income. Impairment losses related to goodwill are not reversible.
For the year ended December 31, 2015 and 2014, the Company recognized impairment of Ps. 134 and Ps. 145, respectively (see Note 19). No impairment was recognized for the year ended December 31, 2013.
F-27
3.17 Leases
The determination of whether an arrangement is, or contains, a lease is based on the substance of the arrangement at inception date, whether fulfillment of the arrangement is dependent on the use of a specific asset or assets or the arrangement conveys a right to use the asset, even if that right is not explicitly specified in an arrangement.
Leases are classified as finance leases whenever the terms of the lease transfer substantially all the risks and rewards of ownership to the lessee. All other leases are classified as operating leases.
Assets held under finance leases are initially recognized as assets of the Company at their fair value at the inception of the lease or, if lower, at the present value of the minimum lease payments. The corresponding liability to the lessor is included in the consolidated statement of financial position as a finance lease obligation. Lease payments are apportioned between finance expenses and reduction of the lease obligation so as to achieve a constant rate of interest on the remaining balance of the liability. Interest expenses are recognized immediately in consolidated net income, unless they are directly attributable to qualifying assets, in which case they are capitalized in accordance with the Company’s general policy on borrowing costs. Contingent rentals are recognized as expenses in the periods in which they are incurred. Assets held under finance leases are depreciated over their expected useful lives on the same basis as owned assets or, where shorter, the term of the relevant lease.
Operating lease payments are recognized as an expense on a straight-line basis over the lease term, except where another systematic basis is more representative of the time pattern in which economic benefits from the leased asset are consumed. Contingent rentals arising under operating leases are recognized as an expense in the period in which they are incurred. In the event that lease incentives are received to enter into operating leases, such incentives are recognized as a liability. The aggregate benefit of incentives is recognized as a reduction of rental expense on a straight-line basis, except where another systematic basis is more representative of the time pattern in which economic benefits from the leased asset are consumed. Leasehold improvements on operating leases are amortized using the straight-line method over the shorter of either the useful life of the assets or the related lease term.
3.18 Financial liabilities and equity instruments
3.18.1 Classification as debt or equity
Debt and equity instruments issued by the Company are classified as either financial liabilities or as equity in accordance with the substance of the contractual arrangements and the definitions of a financial liability and an equity instrument.
3.18.2 Equity instruments
An equity instrument is any contract that evidences a residual interest in the assets of an entity after deducting all of its liabilities. Equity instruments issued by the Company are recognized at the proceeds received, net of direct issue costs.
Repurchase of the Company’s own equity instruments is recognized and deducted directly in equity. No gain or loss is recognized in profit or loss on the purchase, sale, issue or cancellation of the Company’s own equity instruments.
3.18.3 Financial liabilities
Initial recognition and measurement
Financial liabilities within the scope of IAS 39 are classified as financial liabilities at FVTPL, loans and borrowings, or as derivatives designated as hedging instruments in an effective hedge, as appropriate. The Company determines the classification of its financial liabilities at initial recognition.
F-28
All financial liabilities are recognized initially at fair value less, in the case of loans and borrowings, directly attributable transaction costs.
The Company financial liabilities include trade and other payables, loans and borrowings, and derivative financial instruments, see Note 3.7.
Subsequent measurement
The measurement of financial liabilities depends on their classification as described below.
3.18.4 Loans and borrowings
After initial recognition, interest bearing loans and borrowings are subsequently measured at amortized cost using the effective interest method. Gains and losses are recognized in the consolidated income statements when the liabilities are derecognized as well as through the effective interest method amortization process.
Amortized cost is calculated by taking into account any discount or premium on acquisition and fees or costs that are an integral part of the effective interest method. The effective interest method amortization is included in interest expense in the consolidated income statements, see Note 18.
3.18.5 Derecognition
A financial liability is derecognized when the obligation under the liability is discharged or cancelled or expires. When an existing financial liability is replaced by another from the same lender on substantially different terms, or the terms of an existing liability are substantially modified, such an exchange or modification is treated as the derecognition of the original liability and the recognition of a new liability. The difference in the respective carrying amounts is recognized in the consolidated income statements.
3.19 Provisions
Provisions are recognized when the Company has a present obligation (legal or constructive) as a result of a past event, it is probable that the Company will be required to settle the obligation, and a reliable estimate can be made of the amount of the obligation.
The amount recognized as a provision is the best estimate of the consideration required to settle the present obligation at the end of the reporting period, taking into account the risks and uncertainties surrounding the obligation. When a provision is measured using the cash flows estimated to settle the present obligation, its carrying amount is the present value of those cash flows (where the effect of the time value of money is material).
When some or all of the economic benefits required to settle a provision are expected to be recovered from a third party, a receivable is recognized as an asset if it is virtually certain that reimbursement will be received and the amount of the receivable can be measured reliably.
The Company recognizes a provision for a loss contingency when it is probable (i.e., the probability that the event will occur is greater than the probability that it will not) that certain effects related to past events, would materialize and can be reasonably quantified. These events and their financial impact are also disclosed as loss contingencies in the consolidated financial statements when the risk of loss is deemed to be other than remote. The Company does not recognize an asset for a gain contingency until the gain is realized, see Note 25.
Restructuring provisions are recognized only when the recognition criteria for provisions are fulfilled. The Company has a constructive obligation when a detailed formal plan identifies the business or part of the business concerned, the location and number of employees affected, a detailed estimate of the associated costs, and an appropriate timeline. Furthermore, the employees affected must have been notified of the plan’s main features.
F-29
3.20 Post-employment and other long-term employee benefits
Post-employment and other long-term employee benefits, which are considered to be monetary items, include obligations for pension and retirement plans, seniority premiums and postretirement medical services, are all based on actuarial calculations, using the projected unit credit method.
In Mexico, the economic benefits from employee benefits and retirement pensions are granted to employees with 10 years of service and minimum age of 60. In accordance with Mexican Labor Law, the Company provides seniority premium benefits to its employees under certain circumstances. These benefits consist of a one-time payment equivalent to 12 days wages for each year of service (at the employee’s most recent salary, but not to exceed twice the legal minimum wage), payable to all employees with 15 or more years of service, as well as to certain employees terminated involuntarily prior to the vesting of their seniority premium benefit. For qualifying employees, the Company also provides certain post-employment healthcare benefits such as the medical-surgical services, pharmaceuticals and hospital.
For defined benefit retirement plans and other long-term employee benefits, such as the Company’s sponsored pension and retirement plans, seniority premiums and postretirement medical service plans, the cost of providing benefits is determined using the projected unit credit method, with actuarial valuations being carried out at the end of each reporting period. All remeasurements of the Company’s defined benefit obligation such as actuarial gains and losses are recognized directly in other comprehensive income (“OCI”). The Company presents service costs within cost of goods sold, administrative and selling expenses in the consolidated income statements. The Company presents net interest cost within interest expense in the consolidated income statements. The projected benefit obligation recognized in the consolidated statement of financial position represents the present value of the defined benefit obligation as of the end of each reporting period. Certain subsidiaries of the Company have established plan assets for the payment of pension benefits, seniority premiums and postretirement medical services through irrevocable trusts of which the employees are named as beneficiaries, which serve to increase the funded status of such plans’ related obligations.
Costs related to compensated absences, such as vacations and vacation premiums, are recognized on an accrual basis. Cost for mandatory severance benefits are recorded as incurred.
The Company recognizes a liability and expense for termination benefits at the earlier of the following dates:
| a) | When it can no longer withdraw the offer of those benefits; or |
| b) | When it recognizes costs for a restructuring that is within the scope of IAS 37 “Provisions, Contingent Liabilities and Contingent Assets,” and involves the payment of termination benefits. |
The Company is demonstrably committed to a termination when, and only when, the entity has a detailed formal plan for the termination and is without realistic possibility of withdrawal.
A settlement occurs when an employer enters into a transaction that eliminates all further legal of constructive obligations for part or all of the benefits provided under a defined benefit plan. A curtailment arises from an isolated event such as closing of a plant, discontinuance of an operation or termination or suspension of a plan. Gains or losses on the settlement or curtailment of a defined benefit plan are recognized when the settlement or curtailment occurs.
F-30
During 2014, the Company settled its pension plan in Brazil and consequently recognized the corresponding effects of the settlement on the results of the current period, refer to Note 16.
3.21 Revenue recognition
Sales of products are recognized as revenue upon delivery to the customer, and once all the following conditions are satisfied:
| • | The Company has transferred to the buyer the significant risks and rewards of ownership of the goods; |
| • | The Company retains neither continuing managerial involvement to the degree usually associated with ownership nor effective control over the goods sold; |
| • | The amount of revenue can be measured reliably; |
| • | It is probable that the economic benefits associated with the transaction will flow to the Company; and |
| • | The costs incurred or to be incurred in respect of the transaction can be measured reliably. |
All of the above conditions are typically met at the point in time that goods are delivered to the customer at the customers’ facilities. Net sales reflect units delivered at list prices reduced by promotional allowances, discounts and the amortization of the agreements with customers to obtain the rights to sell and promote the Company’s products.
Rendering of services and other
Revenue arising from services of sales of waste material and packing of raw materials are recognized in the other operating revenues caption in the consolidated income statement.
The Company recognized these transactions as revenues in accordance with the requirements established in the IAS 18 “Revenue” for delivery of goods and rendering of services, which are:
| a) | The amount of revenue can be measured reliably; |
| b) | It is probable that the economic benefits associated with the transaction will flow to the entity. |
Interest income
Revenue arising from the use by others of entity assets yielding interest is recognized once all the following conditions are satisfied:
| • | The amount of the revenue can be measured reliably; and |
| • | It is probable that the economic benefits associated with the transaction will flow to the entity. |
For all financial instruments measured at amortized cost and interest bearing financial assets classified as held to maturity, interest income is recorded using the effective interest rate (“EIR”), which is the rate that exactly discounts the estimated future cash or receipts through the expected life of the financial instrument or a shorter period, where appropriate, to the net carrying amount of the financial asset. The related interest income is included in the consolidated income statements.
3.22 Administrative and selling expenses
Administrative expenses include labor costs (salaries and other benefits, including employee profit sharing “PTU”) of employees not directly involved in the sale or production of the Company’s products, as well as professional service fees, the depreciation of office facilities, amortization of capitalized information technology system implementation costs and any other similar costs.
F-31
Selling expenses include:
| • | Distribution: labor costs (salaries and other related benefits), outbound freight costs, warehousing costs of finished products, write off of returnable bottles in the distribution process, depreciation and maintenance of trucks and other distribution facilities and equipment. For the years ended December 31, 2015, 2014 and 2013, these distribution costs amounted to Ps. 20,205, Ps. 19,236 and Ps. 17,971, respectively; |
| • | Sales: labor costs (salaries and other benefits, including PTU) and sales commissions paid to sales personnel; and |
| • | Marketing: promotional expenses and advertising costs. |
PTU is paid by the Company’s Mexican subsidiaries to its eligible employees. In Mexico, employee profit sharing is computed at the rate of 10% of the individual company taxable income, except for considering cumulative dividends received from resident legal persons in Mexico, depreciation of historical rather tax restated values, foreign exchange gains and losses, which are not included until the asset is disposed of or the liability is due and other effects of inflation are also excluded. As of January 1, 2014, PTU in Mexico will be calculated from the same taxable income for income tax, except for the following: a) neither tax losses from prior years nor the PTU paid during the year are deductible; and b) payments exempt from taxes for the employees are fully deductible in the PTU computation.
3.23 Income taxes
Income tax expense represents the sum of the tax currently payable and deferred tax. Income taxes are charged to consolidated net income as they are incurred, except when they relate to items that are recognized in other comprehensive income or directly in equity, in which case, the current and deferred tax are also recognized in other comprehensive income or directly in equity, respectively.
3.23.1 Current income taxes
Income taxes are recorded in the results of the year they are incurred.
3.23.2 Deferred income taxes
Deferred tax is recognized on temporary differences between the carrying amounts of assets and liabilities in the consolidated financial statements and the corresponding tax bases used in the computation of taxable profit. Deferred tax liabilities are generally recognized for all taxable temporary differences. Deferred tax assets are generally recognized for all deductible temporary differences to the extent that it is probable that taxable profits will be available against which those deductible temporary differences can be utilized and if any, future benefits from tax loss carry forwards and certain tax credits. Such deferred tax assets and liabilities are not recognized if the temporary difference arises from initial recognition of goodwill (no recognition of deferred tax liabilities) or from the initial recognition (other than in a business combination) of other assets and liabilities in a transaction that affects neither the taxable profit nor the accounting profit, except in the case of Brazil, where certain goodwill amounts are at times deductible for tax purposes.
Deferred tax assets are recognized for all deductible temporary differences, the carry forward of unused tax credits and any unused tax losses. Deferred tax assets are recognized to the extent that it is probable that taxable profit will be available against which the deductible temporary differences, and the carry forward of unused tax credits and unused tax losses can be utilized. The carrying amount of deferred tax assets is reviewed at each reporting date and reduced to the extent that it is no longer probable that sufficient taxable profit will be available to allow all or part of the deferred tax asset to be utilized. Unrecognized deferred tax assets are re-assessed at each reporting date and are recognized to the extent that it has become probable that future taxable profits will allow the deferred tax asset to be recovered.
F-32
Deferred tax liabilities are recognized for taxable temporary differences associated with investments in subsidiaries, associates, and interests in joint ventures, except where the Company is able to control the reversal of the temporary difference and it is probable that the temporary difference will not reverse in the foreseeable future. Deferred tax assets arising from deductible temporary differences associated with such investments and interests are only recognized to the extent that it is probable that there will be sufficient taxable profits against which to utilize the benefits of the temporary differences and they are expected to reverse in the foreseeable future.
Deferred income taxes are classified as a long-term asset or liability, regardless of when the temporary differences are expected to reverse.
The carrying amount of deferred tax assets is reviewed at the end of each reporting period and reduced to the extent that it is no longer probable that sufficient taxable profits will be available to allow all or part of the asset to be recovered.
Deferred tax relating to items recognized in the other comprehensive income are recognized in correlation to the underlying transaction in OCI.
Deferred tax assets and liabilities are measured at the tax rates that are expected to apply in the period in which the liability is settled or the asset realized, based on tax rates (and tax laws) that have been enacted or substantively enacted by the end of the reporting period. The measurement of deferred tax liabilities and assets reflects the tax consequences that would follow from the manner in which the Company expects, at the end of the reporting period, to recover or settle the carrying amount of its assets and liabilities.
In Mexico, the income tax rate is 30% for 2013, 2014 and 2015, and as result of Mexican Tax Reform for 2014, it will remain at 30% for the following years (see Note 24).
3.24 Share-based payments arrangements
Senior executives of the Company receive remuneration in the form of share-based payment transactions, whereby employees render services as consideration for equity instruments. The equity instruments are granted and then held by a trust controlled by the Company until vesting. They are accounted for as equity settled transactions. The award of equity instruments is a fixed monetary value on grant date.
Equity-settled share-based payments to employees are measured at the fair value of the equity instruments at the grant date. The fair value determined at the grant date of the equity-settled share-based payments is expensed and recognized based on the graded vesting method over the vesting period, based on the Company’s estimate of equity instruments that will eventually vest. At the end of each reporting period, the Company revises its estimate of the number of equity instruments expected to vest. The impact of the revision of the original estimates, if any, is recognized in consolidated net income such that the cumulative expense reflects the revised estimate.
3.25 Earnings per share
The Company presents basic and diluted earnings per share (EPS) data for its shares. Basic EPS is calculated by dividing the net income attributable to controlling interest by the weighted average number of shares outstanding during the period adjusted for the weighted average of own shares purchased in the year. Diluted EPS is determined by adjusting the weighted average number of shares outstanding including the weighted average of own shares purchased in the year for the effects of all potentially dilutive securities, which comprise share rights granted to employees described above.
F-33
3.26 Issuance of subsidiary stock
The Company recognizes the issuance of a subsidiary’s stock as an equity transaction. The difference between the book value of the shares issued and the amount contributed by the non-controlling interest holder or third party is recorded as additional paid-in capital.
Note 4. Mergers and Acquisitions
4.1 Mergers and acquisitions
The Company has had certain mergers and acquisitions for the years 2015, 2014 and 2013; which were recorded using the acquisition method of accounting. The results of the acquired operations have been included in the consolidated financial statements since the date on which the Company obtained control of the business, as disclosed below. Therefore, the consolidated income statements and the consolidated statements of financial position in the years of such acquisitions are not comparable with previous periods. The consolidated statements of cash flows for the years ended December 31, 2015 and 2013 show the cash outflow for the merged and acquired operations net of the cash acquired related to those mergers and acquisitions. For the year ended December 31, 2014, the Company did not have any acquisitions or mergers.
While the acquired companies disclosed below, from Note 4.1.2 to Note 4.1.4, represent bottlers of Coca-Cola trademarked beverages, such entities were not under common ownership control prior to their acquisition.
4.1.1 Acquisition of Grupo Socofar
On September 30, 2015, FEMSA Comercio – Retail Division completed the acquisition of 60% of Grupo Socofar. Grupo Socofar is an operator of pharmacies in South America which operated, directly and through franchises, 643 pharmacies and 154 beauty supply stores in Chile, and over 150 pharmacies in Colombia. Grupo Socofar was acquired for Ps. 7,685 in an all cash transaction. Transaction related costs of Ps. 116 were expensed by FEMSA Comercio – Retail Division as incurred, and recorded as a component of administrative expenses in the accompanying consolidated income statements. Socofar was included in operating results from the closing in September 2015.
FEMSA Comercio – Retail Division is currently in the process of allocating to all assets acquired and liabilities assumed in the acquisition the consideration transferred as the sum of the acquisition-date fair values of the net assets acquired because it is conducting a detailed review process. FEMSA Comercio – Retail Division expects to finish the allocation during the following year but before the measurement period allowed by IFRS; preliminary estimate of fair value of Socofar’s net assets acquired is as follows.
| 2015 | ||||
| Total current assets (including cash acquired of Ps. 795) |
Ps. | 10,499 | ||
| Total non-current assets |
3,875 | |||
|
|
|
|||
| Total assets |
14,374 | |||
|
|
|
|||
| Total liabilities |
(11,555 | ) | ||
|
|
|
|||
| Net assets acquired |
2,819 | |||
|
|
|
|||
| Goodwill |
5,994 | |||
|
|
|
|||
| Non-controlling interest (1) |
(1,128 | ) | ||
|
|
|
|||
| Total consideration transferred |
Ps. | 7,685 | ||
|
|
|
|||
| (1) | Measured at the proportionate share of the acquiree’s identificable net assets. |
FEMSA Comercio – Retail Division expects to recover the amount recorded as goodwill through synergies related to the implementation of successful practices from its existing Mexican operations such as speed and quality in execution of the customer’s value proposition and growth. Goodwill has been allocated to FEMSA Comercio’s Pharma & Beauty cash generating unit.
F-34
Selected income statement information of Socofar for the period from the acquisition date through December 31, 2015 is as follows:
| Income Statement |
2015 | |||
| Total revenues |
Ps. | 7,583 | ||
| Income before income taxes |
394 | |||
| Net income |
Ps. | 354 | ||
4.1.2 Acquisition of Grupo Spaipa
On October 29, 2013, Coca-Cola FEMSA through its Brazilian subsidiary Spal Industria Brasileira de Bebidas, S.A. completed the acquisition of 100% of Grupo Spaipa and three holding companies (collectively “Spaipa”) and was acquired for Ps. 26,856 in an all cash transaction. Spaipa was a bottler of Coca-Cola trademark products which operated mainly in Sao Paulo and Paraná, Brazil. This acquisition was made to reinforce Coca-Cola FEMSA’s leadership position in Brazil. Transaction related costs of Ps. 8 were expensed by the Company as incurred, and recorded as a component of administrative expenses in the accompanying consolidated income statements. Spaipa was included in operating results from November 2013.
The fair value of Spaipa’s net assets acquired is as follows:
| 2013 | ||||
| Total current assets (including cash acquired of Ps. 3,800) |
Ps. | 5,918 | ||
| Total non-current assets |
5,090 | |||
| Distribution rights |
11,872 | |||
|
|
|
|||
| Total assets |
22,880 | |||
|
|
|
|||
| Total liabilities |
(6,807 | ) | ||
|
|
|
|||
| Net assets acquired |
16,073 | |||
|
|
|
|||
| Goodwill |
10,783 | |||
|
|
|
|||
| Total consideration transferred |
Ps. | 26,856 | ||
|
|
|
|||
Coca-Cola FEMSA expects to recover the amount recorded as goodwill through synergies related to the available production capacity. Goodwill has been allocated to Coca-Cola FEMSA’s cash generating unit in Brazil. The goodwill recognized and expected to be deductible for income tax purposes according to Brazil tax law is Ps. 22,202.
Selected income statement information of Spaipa for the period from the acquisition date through December 31, 2013 is as follows:
| Income Statement |
2013 | |||
| Total revenues |
Ps. | 2,466 | ||
| Income before income taxes |
354 | |||
| Net income |
Ps. | 311 | ||
F-35
4.1.3 Acquisition of Companhia Fluminense de Refrigerantes
On August 22, 2013, Coca-Cola FEMSA through its Brazilian subsidiary Spal Industria Brasileira de Bebidas, S.A. completed the acquisition of 100% of Companhia Fluminense de Refrigerantes (“Companhia Fluminense”) for Ps. 4,657 in an all cash transaction. Companhia Fluminense was a bottler of Coca-Cola trademark products which operated in the states of Minas Gerais, Rio de Janeiro and Sao Paulo, Brazil. This acquisition was made to reinforce Coca-Cola FEMSA’s leadership position in Brazil. Transaction related costs of Ps. 11 were expensed by Coca-Cola FEMSA as incurred, and recorded as a component of administrative expenses in the accompanying consolidated income statements. Companhia Fluminense was included in operating results from September 2013.
The fair value of Companhia Fluminense’s net assets acquired is as follows:
| 2013 | ||||
| Total current assets (including cash acquired of Ps. 9) |
Ps. | 515 | ||
| Total non-current assets |
1,721 | |||
| Distribution rights |
2,077 | |||
|
|
|
|||
| Total assets |
4,313 | |||
|
|
|
|||
| Total liabilities |
(1,963 | ) | ||
|
|
|
|||
| Net assets acquired |
2,350 | |||
|
|
|
|||
| Goodwill |
2,307 | |||
|
|
|
|||
| Total consideration transferred |
Ps. | 4,657 | ||
|
|
|
|||
Coca-Cola FEMSA expects to recover the amount recorded as goodwill through synergies related to the available production capacity. Goodwill has been allocated to Coca-Cola FEMSA’s cash generating unit in Brazil. The goodwill recognized and expected to be deductible for income tax purposes according to Brazil tax law is Ps. 4,581.
Selected income statement information of Companhia Fluminense for the period from the acquisition date through December 31, 2013 is as follows:
| Income Statement |
2013 | |||
| Total revenues |
Ps. | 981 | ||
| Loss before taxes |
(39 | ) | ||
| Net loss |
Ps. | (34 | ) | |
4.1.4 Merger with Grupo YOLI
On May 24, 2013, Coca-Cola FEMSA completed the merger of 100% of Grupo Yoli. Grupo Yoli comprised the bottler entity YOLI de Acapulco, S.A. de C.V. and other nine entities. Grupo Yoli was a bottler of Coca-Cola trademark products which operated mainly in the state of Guerrero, as well as in parts of the state of Oaxaca in Mexico. This merger was made to reinforce Coca-Cola FEMSA’s leadership position in Mexico. The transaction involved the issuance of 42,377,925 new L shares of Coca-Cola FEMSA, along with a cash payment immediately prior to closing of Ps. 1,109, in exchange for 100% share ownership of Grupo YOLI, which was accomplished through a merger. The total purchase price was Ps. 9,130 based on a share price of Ps. 189.27 per share on May 24, 2013. Transaction related costs of Ps. 82 were expensed by Coca-Cola FEMSA as incurred, and recorded as a component of administrative expenses in the accompanying consolidated income statements. Grupo YOLI was included in operating results from June 2013.
F-36
The fair value of Grupo Yoli net assets acquired is as follows:
| 2013 | ||||
| Total current assets (including cash acquired of Ps. 63) |
Ps. | 837 | ||
| Total non-current assets |
2,144 | |||
| Distribution rights |
3,503 | |||
|
|
|
|||
| Total assets |
6,484 | |||
|
|
|
|||
| Total liabilities |
(1,487 | ) | ||
|
|
|
|||
| Net assets acquired |
4,997 | |||
|
|
|
|||
| Goodwill |
4,133 | |||
|
|
|
|||
| Total consideration transferred |
Ps. | 9,130 | ||
|
|
|
|||
Coca-Cola FEMSA expects to recover the amount recorded as goodwill through synergies related to the available production capacity. Goodwill has been allocated to Coca-Cola FEMSA’s cash generating unit in Mexico. The entire amount of goodwill will not be tax deductible.
Selected income statement information of Grupo YOLI for the period from the acquisition date through December 31, 2013 is as follows:
| Income Statement |
2013 | |||
| Total revenues |
Ps. | 2,240 | ||
| Income before taxes |
70 | |||
| Net income |
Ps. | 44 | ||
4.1.5 Other acquisitions
During 2015, other cash payments, related to the Company’s smaller acquisitions which in the aggregate amounted to Ps. 5,892. These payments were primarily related to the following: acquisition of 100% Farmacias Farmacon, a regional drugstore operator in the western Mexican states of Sinaloa, Sonora, Baja California and Baja California Sur with headquarters in the city of Culiacan, Sinaloa, at the acquisition date Farmacias Farmacon operated 215 stores; merger of 100% of PEMEX franchises in which FEMSA Comercio – Fuel Division has been providing operation services for gasoline service stations through agreements with third parties, using the commercial brand name “OXXO GAS”, at the acquisition date there were 227 OXXO GAS stations; acquisition of 100% of “Zimag”, supplier of logistics services in Mexico, with experience in warehousing, distribution and value added services over twelve cities in Mexico mainly in Mexico City, Monterrey, Guanajuato, Chihuahua, Merida and Tijuana; acquisition of 100% of Atlas Transportes e Logistica, supplier of logistics services in Brazil, with experience in the service industry breakbulk logistics with a network of 49 operative centers and over 1,200 freight units through all regions in Brazil. Transactions related costs in the aggregate amounted of Ps. 39 were expensed as incurred, and recorded as a component of administrative expenses in the accompanying consolidated income statements.
F-37
The preliminary estimation of fair value about these net assets acquired in the aggregate is as follows:
| 2015 | ||||
| Total current assets (including cash acquired of Ps. 71) |
Ps. | 1,411 | ||
| Total non-current assets |
859 | |||
|
|
|
|||
| Total assets |
2,270 | |||
|
|
|
|||
| Total liabilities |
(1,753 | ) | ||
|
|
|
|||
| Net assets acquired |
517 | |||
|
|
|
|||
| Goodwill |
5,375 | |||
|
|
|
|||
| Total consideration transferred |
Ps. | 5,892 | ||
|
|
|
|||
FEMSA Comercio – Retail Division and the logistic services business expect to recover the amount recorded as goodwill through synergies related to the ability to apply the operational processes of these business units. Farmacias Farmacon goodwill have been allocated to FEMSA Comercio’s Pharma & Beauty cash generating unit and merger of PEMEX franchises goodwill have been allocated to FEMSA Comercio – Fuel Division cash generating unit in Mexico. Zimag and Atlas Transportes e Logistica goodwill has been allocated to FEMSA Logistic Services business’s cash generating unit in Mexico and Brazil, respectively.
Selected income statement information of these acquisitions for the period from the acquisition date through December 31, 2015 is as follows:
| Income Statement |
2015 | |||
| Total revenues |
Ps. | 20,262 | ||
| Income before income taxes |
107 | |||
| Net income |
Ps. | 51 | ||
During 2013, other cash payments, net of cash acquired, related to the Company’s smaller acquisitions amounted to
Ps. 3,021. These payments were primarily related to the following: acquisition of Expresso Jundiaí, supplier of logistics services in Brazil, with experience in the service industry breakbulk logistics, warehousing and value added services. Expresso Jundiaí operated a network of 42 operating bases as of the date of the agreement, and has presence in six states in South and Southeast Brazil; acquisition of 80% of Doña Tota, brand leader in quick service restaurants in Notheast Mexico, originated in the state of Tamaulipas, Mexico, which operated 204 restaurants in Mexico and 11 in the state of Texas, United States, as of the date of the agreement. This transaction resulted in the acquistion of assets and rights for the production, processing, marketing and distribution of its fast food products, which was treated as business combination according to IFRS 3 “Business Combinations;” acquisition of Farmacias Moderna, leading pharmacy in the state of Sinaloa, Mexico which operated 100 stores in Mazatlan, Sinaloa as of the date of the agreement; and acquisition of 75% of Farmacias YZA, a leading pharmacy in Southeast Mexico, in the state of Yucatan, which operated 330 stores, as of the date of the agreement.
Unaudited Pro Forma Financial Data
The following unaudited consolidated pro forma financial data represent the Company’s historical financial statements, adjusted to give effect to (i) the acquisition of Grupo Socofar, Farmacias Farmacon, Zimag, Atlas Transportes e Logística and merger of PEMEX franchises, mentioned in the preceding paragraphs as if they occurred on January 1, 2015; and (ii) certain accounting adjustments mainly related to the pro forma depreciation of fixed assets of the acquired companies. Unaudited pro forma financial data for all acquisitions and merger included, are as follow.
F-38
| Unaudited pro forma financial information for the year ended December 31, |
||||
| 2015 | ||||
| Total revenues |
Ps. | 368,446 | ||
| Income before income taxes and share of the profit of associates and joint ventures accounting for using the equity method |
28,053 | |||
| Net income |
26,389 | |||
|
|
|
|||
| Basic net controlling interest income per share Series “B” |
Ps. | 1.04 | ||
| Basic net controlling interest income per share Series “D” |
1.30 | |||
|
|
|
|||
Below are pro forma 2013 results as if Spaipa, Companhia Fluminense and Grupo Yoli were acquired on January 1, 2013:
| Unaudited pro forma financial information for the year ended December 31, |
||||
| 2013 | ||||
| Total revenues |
Ps. | 270,705 | ||
| Income before income taxes and share of the profit of associates and joint ventures accounting for using the equity method |
23,814 | |||
| Net income |
20,730 | |||
|
|
|
|||
| Basic net controlling interest income per share Series “B” |
Ps. | 0.76 | ||
| Basic net controlling interest income per share Series “D” |
0.95 | |||
|
|
|
|||
Note 5. Cash and Cash Equivalents
For the purposes of the statement of cash flows, cash includes cash on hand and in banks and cash equivalents, which are short-term, highly liquid investments that are readily convertible to known amounts of cash and which are subject to an insignificant risk of changes in value, with a maturity date of three months or less at their acquisition date. Cash at the end of the reporting period as shown in the consolidated statement of cash flows is comprised of the following:
| December 31, 2015 |
December 31, 2014 |
|||||||
| Cash and bank balances |
Ps. | 12,530 | Ps. | 12,654 | ||||
| Cash equivalents (see Note 3.5) |
16,866 | 22,843 | ||||||
|
|
|
|
|
|||||
| Ps. | 29,396 | Ps. | 35,497 | |||||
|
|
|
|
|
|||||
F-39
As explained in Note 3.3 above, the Company operates in Venezuela, which has a certain level of exchange control restrictions, which might prevent cash and cash equivalent balances from being available for use elsewhere in the group. At December 31, 2015 and 2014, cash and cash equivalent balances of the Company’s Venezuela subsidiaries were Ps. 1,267 and Ps. 1,954, respectively.
Note 6. Investments
As of December 31, 2015 and 2014 investments are classified as held-to maturity, the carrying value of the investments is similar to their fair value. The following is a detail of held-to maturity investments:
| Held-to Maturity (1) Bank Deposits |
2015 | 2014 | ||||||
| Acquisition cost |
Ps. | 19 | Ps. | 143 | ||||
| Accrued interest |
— | 1 | ||||||
|
|
|
|
|
|||||
| Amortized cost |
Ps. | 19 | Ps. | 144 | ||||
|
|
|
|
|
|||||
| Ps. | 19 | Ps. | 144 | |||||
|
|
|
|
|
|||||
| (1) | Denominated in euros at a fixed interest rate. Investments as of December 31, 2015 mature during 2016. |
For the years ended December 31, 2015, 2014 and 2013, the effect of the investments in the consolidated income statements under the interest income item is Ps. 1, Ps. 3 and Ps. 3, respectively.
Note 7. Accounts Receivable, Net
| December 31, 2015 |
December 31, 2014 |
|||||||
| Trade receivables |
Ps. | 14,696 | Ps. | 9,312 | ||||
| Allowance for doubtful accounts |
(849 | ) | (456 | ) | ||||
| The Coca-Cola Company (see Note 14) |
1,559 | 1,584 | ||||||
| Loans to employees |
151 | 241 | ||||||
| Other related parties (see Note 14) |
243 | 273 | ||||||
| Heineken Company (see Note 14) |
754 | 811 | ||||||
| Others |
1,458 | 2,077 | ||||||
|
|
|
|
|
|||||
| Ps. | 18,012 | Ps. | 13,842 | |||||
|
|
|
|
|
|||||
7.1 Trade receivables
Accounts receivable representing rights arising from sales and loans to employees or any other similar concept, are presented net of discounts and the allowance for doubtful accounts.
Coca-Cola FEMSA has accounts receivable from The Coca-Cola Company arising from the latter’s participation in advertising and promotional programs and investment in refrigeration equipment and returnable bottles made by Coca-Cola FEMSA.
F-40
The carrying value of accounts receivable approximates its fair value as of December 31, 2015 and 2014.
Aging of past due but not impaired (days outstanding)
| December 31, 2015 |
December 31, 2014 |
|||||||
| 60-90 days |
Ps. | 178 | Ps. | 65 | ||||
| 90-120 days |
161 | 24 | ||||||
| 120+ days |
588 | 182 | ||||||
|
|
|
|
|
|||||
| Total |
Ps. | 927 | Ps. | 271 | ||||
|
|
|
|
|
|||||
7.2 Changes in the allowance for doubtful accounts
| 2015 | 2014 | 2013 | ||||||||||
| Opening balance |
Ps. | 456 | Ps. | 489 | Ps. | 413 | ||||||
| Allowance for the year |
167 | 94 | 154 | |||||||||
| Charges and write-offs of uncollectible accounts |
(99 | ) | (90 | ) | (34 | ) | ||||||
| Effects of changes in foreign exchange rates |
325 | (37 | ) | (44 | ) | |||||||
|
|
|
|
|
|
|
|||||||
| Ending balance |
Ps. | 849 | Ps. | 456 | Ps. | 489 | ||||||
|
|
|
|
|
|
|
|||||||
In determining the recoverability of trade receivables, the Company considers any change in the credit quality of the trade receivable from the date credit was initially granted up to the end of the reporting period. The concentration of credit risk is limited due to the customer base being large and unrelated.
Aging of impaired trade receivables (days outstanding)
| December 31, 2015 |
December 31, 2014 |
|||||||
| 60-90 days |
Ps. | 4 | Ps. | 13 | ||||
| 90-120 days |
13 | 10 | ||||||
| 120+ days |
832 | 433 | ||||||
|
|
|
|
|
|||||
| Total |
Ps. | 849 | Ps. | 456 | ||||
|
|
|
|
|
|||||
7.3 Payments from The Coca-Cola Company
The Coca-Cola Company participates in certain advertising and promotional programs as well as in the Coca-Cola FEMSA’s refrigeration equipment and returnable bottles investment program. Contributions received by Coca-Cola FEMSA for advertising and promotional incentives are recognized as a reduction in selling expenses and contributions received for the refrigeration equipment and returnable bottles investment program are recorded as a reduction in the investment in refrigeration equipment and returnable bottles items. For the years ended December 31, 2015, 2014 and 2013 contributions received were Ps. 3,749, Ps. 4,118 and Ps. 4,206, respectively.
F-41
Note 8. Inventories
| December 31, 2015 |
December 31, 2014 |
|||||||
| Finished products |
Ps. | 17,631 | Ps. | 10,989 | ||||
| Raw materials |
3,629 | 3,493 | ||||||
| Spare parts |
1,661 | 1,353 | ||||||
| Work in process |
108 | 279 | ||||||
| Inventories in transit |
1,534 | 929 | ||||||
| Other |
117 | 171 | ||||||
|
|
|
|
|
|||||
| Ps. | 24,680 | Ps. | 17,214 | |||||
|
|
|
|
|
|||||
For the years ended at 2015, 2014 and 2013, the Company recognized write-downs of its inventories for Ps. 1,290, Ps. 1,028 and Ps. 1,322 to net realizable value, respectively.
For the years ended at 2015, 2014 and 2013, changes in inventories are comprised as follows and included in the consolidated income statement under the cost of goods sold caption:
| 2015 | 2014 | 2013 | ||||||||||
| Changes in inventories of finished goods and work in progress |
Ps. | 132,835 | Ps. | 92,390 | Ps. | 76,163 | ||||||
| Raw materials and consumables used |
53,514 | 55,038 | 49,740 | |||||||||
|
|
|
|
|
|
|
|||||||
| Total |
Ps. | 186,349 | Ps. | 147,428 | Ps. | 125,903 | ||||||
|
|
|
|
|
|
|
|||||||
Note 9. Other Current Assets and Other Current Financial Assets
9.1 Other current assets
| December 31, 2015 |
December 31, 2014 |
|||||||
| Prepaid expenses |
Ps. | 3,363 | Ps.1,375 | |||||
| Agreements with customers |
168 | 161 | ||||||
| Short-term licenses |
86 | 68 | ||||||
| Other |
37 | 184 | ||||||
|
|
|
|
|
|||||
| Ps. | 3,654 | Ps. | 1,788 | |||||
|
|
|
|
|
|||||
F-42
Prepaid expenses as of December 31, 2015 and 2014 are as follows:
| December 31, 2015 |
December 31, 2014 |
|||||||
| Advances for inventories |
Ps. | 2,291 | Ps. | 380 | ||||
| Advertising and promotional expenses paid in advance |
58 | 156 | ||||||
| Advances to service suppliers |
601 | 517 | ||||||
| Prepaid leases |
115 | 80 | ||||||
| Prepaid insurance |
58 | 29 | ||||||
| Others |
240 | 213 | ||||||
|
|
|
|
|
|||||
| Ps. | 3,363 | Ps. | 1,375 | |||||
|
|
|
|
|
|||||
Advertising and promotional expenses paid in advance recorded in the consolidated income statement for the years ended December 31, 2015, 2014 and 2013 amounted to Ps. 4,613, Ps. 4,460 and Ps. 6,232, respectively.
9.2 Other current financial assets
| December 31, 2015 |
December 31, 2014 |
|||||||
| Restricted cash |
Ps. | 704 | Ps. | 1,213 | ||||
| Derivative financial instruments (see Note 20) |
523 | 384 | ||||||
| Short term note receivable (1) |
1,191 | 1,000 | ||||||
|
|
|
|
|
|||||
| Ps. | 2,418 | Ps. | 2,597 | |||||
|
|
|
|
|
|||||
| (1) | The carrying value approximates its fair value as of December 31, 2015 and 2014. |
The Company has pledged part of its short-term deposits in order to fulfill the collateral requirements for the accounts payable in different currencies. As of December 31, 2015 and 2014, the fair value of the short-term deposit pledged were:
| December 31, 2015 |
December 31, 2014 |
|||||||
| Venezuelan bolivars |
Ps. | 344 | Ps. | 550 | ||||
| Brazilian reais |
360 | 640 | ||||||
| Colombian pesos |
— | 23 | ||||||
|
|
|
|
|
|||||
| Ps. | 704 | Ps. | 1,213 | |||||
|
|
|
|
|
|||||
F-43
Note 10. Investments in Associates and Joint Ventures
Details of the Company’s associates and joint ventures accounted for under the equity method at the end of the reporting period are as follows:
| Ownership Percentage | Carrying Amount | |||||||||||||||
| Investee |
Principal Activity |
Place of Incorporation |
December 31, 2015 |
December 31, 2014 |
December 31, 2015 |
December 31, 2014 |
||||||||||
| Heineken Company (1) (2) |
Beverages | The Netherlands | 20.0% | 20.0% | Ps. | 92,694 | Ps. | 83,710 | ||||||||
| Coca-Cola FEMSA: |
||||||||||||||||
| Joint ventures: |
||||||||||||||||
| Grupo Panameño de Bebidas |
Beverages | Panama | 50.0% | 50.0% | 1,573 | 1,740 | ||||||||||
| Dispensadoras de Café, S.A.P.I. de C.V. |
Services | Mexico | 50.0% | 50.0% | 161 | 190 | ||||||||||
| Estancia Hidromineral Itabirito, L.T.D.A |
Bottling and distribution |
Brazil | 50.0% | 50.0% | 160 | 164 | ||||||||||
| Coca-Cola FEMSA Philippines, Inc. (“CCFPI”) |
Bottling | Philippines | 51.0% | 51.0% | 9,996 | 9,021 | ||||||||||
| Fountain Água Mineral, L.T.D.A |
Beverages | Brazil | 50.0% | 50.0% | 491 | 573 | ||||||||||
| Associates: |
||||||||||||||||
| Promotora Industrial Azucarera, S.A. de C.V. (“PIASA”) |
Sugar production |
Mexico | 36.3% | 36.3% | 2,187 | 2,082 | ||||||||||
| Industria Envasadora de Queretaro, S.A. de C.V. (“IEQSA”) |
Canned bottling |
Mexico | 26.5% | 32.8% | 172 | 194 | ||||||||||
| Industria Mexicana de Reciclaje, S.A. de C.V. (“IMER”) |
Recycling | Mexico | 35.0% | 35.0% | 100 | 98 | ||||||||||
| Jugos del Valle, S.A.P.I. de C.V. |
Beverages | Mexico | 26.3% | 26.3% | 1,531 | 1,470 | ||||||||||
| KSP Participações, L.T.D.A. |
Beverages | Brazil | 38.7% | 38.7% | 80 | 91 | ||||||||||
| Leao Alimentos e Bebidas, L.T.D.A. |
Beverages | Brazil | 24.4% | 24.4% | 1,363 | 1,670 | ||||||||||
| Other investments in Coca-Cola FEMSA’s companies |
Various | Various | Various | Various | 60 | 33 | ||||||||||
| FEMSA Comercio: |
||||||||||||||||
| Café del Pacifico, S.A.P.I. de C.V. (Caffenio) (1) |
Coffee | Mexico | 40.0% | 40.0% | 467 | 467 | ||||||||||
| Other investments (1) (3) |
Various | Various | Various | Various | 696 | 656 | ||||||||||
|
|
|
|
|
|||||||||||||
| Ps. | 111,731 | Ps. | 102,159 | |||||||||||||
|
|
|
|
|
|||||||||||||
| (1) | Associate. |
| (2) | As of December 31, 2015, comprised of 12.53% of Heineken, N.V. and 14.94% of Heineken Holding, N.V., which represents an economic interest of 20% in Heineken. The Company has significant influence, mainly, due to the fact that it participates in the Board of Directors of Heineken Holding, N.V. and the Supervisory Board of Heineken N.V.; and for the material transactions between the Company and Heineken Company. |
| (3) | Joint ventures. |
During 2015, Coca-Cola FEMSA received dividends from Industria Envasadora de Queretaro, S.A. de C.V., in the amount of Ps. 13 and subsequently sold shares for an amount of Ps. 22.
During 2015, Coca-Cola FEMSA made capital contributions to Compañía Panameña de Bebidas, S.A.P.I. de C.V. in the amount of Ps. 7.
During 2015, Coca-Cola FEMSA made capital contributions to Leão Alimentos e Bebidas, L.T.D.A. in the amount of Ps. 71.
During 2014, Coca-Cola FEMSA converted its account receivable from Compañía Panameña de Bebidas, S.A.P.I. de C.V. in the amount of Ps. 814 into an additional capital contribution in the investee.
During 2014, Coca-Cola FEMSA made capital contributions to Jugos del Valle, S.A.P.I. de C.V. in the amount of Ps. 25.
F-44
During 2014, Coca-Cola FEMSA received dividends from Jugos del Valle, S.A.P.I. de C.V., Estancia Hidromineral Itabirito, L.T.D.A., and Fountain Água Mineral, L.T.D.A., in the amount of Ps. 48, Ps. 50 and Ps. 50, respectively.
On January 25, 2013, Coca-Cola FEMSA closed the acquisition of 51% of CCFPI for an amount of $688.5 U.S. dollars
(Ps. 8,904) in an all-cash transaction. As part of the agreement, Coca-Cola FEMSA obtained a call option to acquire the remaining 49% of CCFPI at any time during the seven years following the closing. Coca-Cola FEMSA also has a put option to sell its 51% ownership to The Coca-Cola Company at any time from the fifth anniversary of the date of acquisition until the sixth anniversary, at a price which is based in part on the fair value of CCFPI at the date of acquisition (see Note 20.7).
As mentioned in Note 4, on May 24, 2013, Coca-Cola FEMSA completed the acquisition of 100% of Grupo Yoli. As part of these acquisition, Coca-Cola FEMSA increased its equity interest to 36.3% in Promotora Industrial Azucarera, S.A de C.V. Coca-Cola FEMSA has recorded the incremental interest acquired at its estimated fair value.
Although Coca-Cola FEMSA currently owns 51% of CCFPI, when considering (i) the terms of the shareholders’ agreements (specifically the fact that during the initial four year period the joint approval of both Coca-Cola FEMSA and TCCC is required to approve CCFPI’s annual business plan, which is the key documents pursuant to which CCFPI’s business is operated and any other matters); and (ii) potential voting rights to acquire the remaining 49% of CCFPI are not probable to be executed in the foreseeable future and the fact that the call option remains “out of the money”, the Company has concluded that Coca-Cola FEMSA did not control CCFPI during any of the periods presented in the consolidated financial statements and consequently the Company has accounted for this investment as joint venture using the equity method.
On April 30, 2010, the Company acquired an economic interest of 20% of Heineken Group. Heineken’s main activities are the production, distribution and marketing of beer worldwide. The Company recognized an equity income of Ps. 5,879,
Ps. 5,244 and Ps. 4,587, net of taxes regarding its interest in Heineken for the years ended December 31, 2015, 2014 and 2013, respectively. The Company’s equity method in the net income attributable to equity holders of Heineken exclusive of amortization of adjustments amounted to Ps. 6,567 (€. 378 million), Ps. 5,362 (€. 303 million), and Ps. 4,680 (€. 273 million), for the years ended December 31, 2015, 2014 and 2013, respectively.
Summarized financial information in respect of the associate Heineken accounted for under the equity method is set out below.
| December 31, 2015 | December 31, 2014 | |||||||||||||||
| Million of | Million of | |||||||||||||||
| Peso | Euro | Peso | Euro | |||||||||||||
| Total current assets |
Ps. | 111,997 | €. | 5,914 | Ps. | 109,101 | €. | 6,086 | ||||||||
| Total non-current assets |
602,217 | 31,800 | 515,282 | 28,744 | ||||||||||||
| Total current liabilities |
161,273 | 8,516 | 152,950 | 8,532 | ||||||||||||
| Total non-current liabilities |
267,551 | 14,128 | 230,285 | 12,846 | ||||||||||||
| Total equity |
285,390 | 15,070 | 241,148 | 13,452 | ||||||||||||
| Equity attributable to equity holders of Heineken |
256,323 | 13,535 | 222,453 | 12,409 | ||||||||||||
| Total revenue and other income |
Ps. | 363,191 | €. | 20,922 | Ps. | 342,313 | €. | 19,350 | ||||||||
| Total cost and expenses |
309,812 | 17,847 | 293,134 | 16,570 | ||||||||||||
| Net income |
Ps. | 37,166 | €. | 2,141 | Ps. | 30,216 | €. | 1,708 | ||||||||
| Net income attributable to equity holders of the company |
32,844 | 1,892 | 26,819 | 1,516 | ||||||||||||
| Other comprehensive income |
4,809 | 277 | 4,210 | 238 | ||||||||||||
| Total comprehensive income |
Ps. | 41,975 | €. | 2,418 | Ps. | 34,426 | €. | 1,946 | ||||||||
| Total comprehensive income attributable to equity holders of the company |
37,323 | 2,150 | 29,826 | 1,686 | ||||||||||||
F-45
Reconciliation from the equity of the associate Heineken to the investment of the Company.
| December 31, 2015 | December 31, 2014 | |||||||||||||||
| Million of | Million of | |||||||||||||||
| Peso | Euro | Peso | Euro | |||||||||||||
| Equity attributable to equity holders of Heineken |
Ps. | 256,323 | €. | 13,535 | Ps. | 222,453 | €. | 12,409 | ||||||||
| Economic ownership percentage |
20 | % | 20 | % | 20 | % | 20 | % | ||||||||
|
|
|
|
|
|
|
|
|
|||||||||
| Investment in Heineken Company exclusive of goodwill and others adjustments |
Ps. | 51,265 | €. | 2,707 | Ps. | 44,491 | €. | 2,482 | ||||||||
| Effects of fair value determined by Purchase Price Allocation |
18,704 | 988 | 17,707 | 988 | ||||||||||||
| Goodwill |
22,725 | 1,200 | 21,512 | 1,200 | ||||||||||||
|
|
|
|
|
|
|
|
|
|||||||||
| Investment in Heineken Company |
Ps. | 92,694 | €. | 4,895 | Ps. | 83,710 | €. | 4,670 | ||||||||
|
|
|
|
|
|
|
|
|
|||||||||
As of December 31, 2015 and 2014 fair value of Company’s investment in Heineken N.V. Holding and Heineken N.V. represented by shares equivalent to 20% of its outstanding shares amounted to Ps. 165,517 (€. 8,740 million) and
Ps. 116,327 (€. 6,489 million) based on quoted market prices of those dates. As of February 23, 2016, issuance date of these consolidated financial statements, fair value amounted to €. 8,252 million.
During the years ended December 31, 2015, 2014 and 2013, the Company received dividends distributions from Heineken, amounting to Ps. 2,343, Ps. 1,795 and Ps. 1,752, respectively.
As of December 31, 2015, 2014 and 2013 the total net income corresponding to the inmaterial associates of Coca-Cola FEMSA was Ps. 185, Ps. 195 and Ps. 138, respectively.
As of December 31, 2015, 2014 and 2013 the total net (loss) income corresponding to the inmaterial joint ventures of
Coca-Cola FEMSA was Ps. (30), Ps. (320) and Ps. 151, respectively.
The Company’s share of other comprehensive income from equity investees, net of taxes for the year ended December 31, 2015, 2014 and 2013 are as follows:
| 2015 | 2014 | 2013 | ||||||||||
| Items that may be reclassified to consolidated net income: |
||||||||||||
| Valuation of the effective portion of derivative financial instruments |
Ps. | 213 | Ps. | (257 | ) | Ps. | (91 | ) | ||||
| Exchange differences on translating foreign operations |
69 | 1,579 | (3,029 | ) | ||||||||
|
|
|
|
|
|
|
|||||||
| Total |
Ps. | 282 | Ps. | 1,322 | Ps. | (3,120 | ) | |||||
|
|
|
|
|
|
|
|||||||
| Items that may not be reclassified to consolidated net income in subsequent periods: |
||||||||||||
| Remeasurements of the net defined benefit liability |
Ps. | 169 | Ps. | (881 | ) | Ps. | 491 | |||||
|
|
|
|
|
|
|
|||||||
F-46
Note 11. Property, Plant and Equipment, Net
| Cost |
Land | Buildings | Machinery and Equipment |
Refrigeration Equipment |
Returnable Bottles |
Investments in Fixed Assets in Progress |
Leasehold Improvements |
Other | Total | |||||||||||||||||||||||||||
| Cost as of January 1, 2013 |
Ps. | 5,769 | Ps. | 14,377 | Ps. | 45,082 | Ps. | 11,991 | Ps. | 5,814 | Ps. | 5,357 | Ps. | 9,618 | Ps. | 754 | Ps. | 98,762 | ||||||||||||||||||
| Additions |
433 | 167 | 4,648 | 1,107 | 1,435 | 8,238 | 11 | 341 | 16,380 | |||||||||||||||||||||||||||
| Additions from business combinations |
536 | 2,278 | 2,814 | 428 | 96 | 614 | 36 | 264 | 7,066 | |||||||||||||||||||||||||||
| Transfer of completed projects in progress |
389 | 1,158 | 992 | 1,144 | 785 | (6,296 | ) | 1,828 | — | — | ||||||||||||||||||||||||||
| Transfer to/(from) assets classified as held for sale |
— | — | (216 | ) | — | — | — | — | — | (216 | ) | |||||||||||||||||||||||||
| Disposals |
(11 | ) | (291 | ) | (2,049 | ) | (749 | ) | (324 | ) | (748 | ) | (697 | ) | (15 | ) | (4,884 | ) | ||||||||||||||||||
| Effects of changes in foreign exchange rates |
(250 | ) | (1,336 | ) | (3,678 | ) | (1,135 | ) | (466 | ) | (291 | ) | (103 | ) | (55 | ) | (7,314 | ) | ||||||||||||||||||
| Changes in value on the recognition of inflation effects |
228 | 1,191 | 2,252 | 603 | 46 | 165 | — | 277 | 4,762 | |||||||||||||||||||||||||||
| Capitalization of borrowing costs |
— | — | 32 | — | — | — | — | — | 32 | |||||||||||||||||||||||||||
|
|
|
|
|
|
|
|
|
|
|
|
|
|
|
|
|
|
|
|||||||||||||||||||
| Cost as of December 31, 2013 |
Ps. | 7,094 | Ps. | 17,544 | Ps. | 49,877 | Ps. | 13,389 | Ps. | 7,386 | Ps. | 7,039 | Ps. | 10,693 | Ps. | 1,566 | Ps. | 114,588 | ||||||||||||||||||
|
|
|
|
|
|
|
|
|
|
|
|
|
|
|
|
|
|
|
|||||||||||||||||||
| Cost |
Land | Buildings | Machinery and Equipment |
Refrigeration Equipment |
Returnable Bottles |
Investments in Fixed Assets in Progress |
Leasehold Improvements |
Other | Total | |||||||||||||||||||||||||||
| Cost as of January 1, 2014 |
Ps. | 7,094 | Ps. | 17,544 | Ps. | 49,877 | Ps. | 13,389 | Ps. | 7,386 | Ps. | 7,039 | Ps. | 10,693 | Ps. | 1,566 | Ps. | 114,588 | ||||||||||||||||||
| Additions |
803 | 54 | 4,156 | 32 | 398 | 11,209 | 99 | 234 | 16,985 | |||||||||||||||||||||||||||
| Changes in fair value of past acquisitions |
(115 | ) | (610 | ) | 891 | (57 | ) | — | (68 | ) | 99 | (253 | ) | (113 | ) | |||||||||||||||||||||
| Transfer of completed projects in progress |
— | 1,717 | 2,823 | 1,523 | 1,994 | (10,050 | ) | 1,990 | 3 | — | ||||||||||||||||||||||||||
| Transfer to/(from) assets classified as held for sale |
— | — | (134 | ) | — | — | — | — | — | (134 | ) | |||||||||||||||||||||||||
| Disposals |
(17 | ) | (144 | ) | (2,243 | ) | (632 | ) | (60 | ) | (5 | ) | (587 | ) | (79 | ) | (3,767 | ) | ||||||||||||||||||
| Effects of changes in foreign exchange rates |
(664 | ) | (3,125 | ) | (5,415 | ) | (1,975 | ) | (323 | ) | (545 | ) | (44 | ) | (506 | ) | (12,597 | ) | ||||||||||||||||||
| Changes in value on the recognition of inflation effects |
110 | 355 | 531 | 186 | 7 | 29 | — | 110 | 1,328 | |||||||||||||||||||||||||||
| Capitalization of borrowing costs |
— | — | 33 | — | — | 263 | — | — | 296 | |||||||||||||||||||||||||||
|
|
|
|
|
|
|
|
|
|
|
|
|
|
|
|
|
|
|
|||||||||||||||||||
| Cost as of December 31, 2014 |
Ps. | 7,211 | Ps. | 15,791 | Ps. | 50,519 | Ps. | 12,466 | Ps. | 9,402 | Ps. | 7,872 | Ps. | 12,250 | Ps. | 1,075 | Ps. | 116,586 | ||||||||||||||||||
|
|
|
|
|
|
|
|
|
|
|
|
|
|
|
|
|
|
|
|||||||||||||||||||
F-47
| Cost |
Land | Buildings | Machinery and Equipment |
Refrigeration Equipment |
Returnable Bottles |
Investments in Fixed Assets in Progress |
Leasehold Improvements |
Other | Total | |||||||||||||||||||||||||||
| Cost as of January 1, 2015 |
Ps. | 7,211 | Ps. | 15,791 | Ps. | 50,519 | Ps. | 12,466 | Ps. | 9,402 | Ps. | 7,872 | Ps. | 12,250 | Ps. | 1,075 | Ps. | 116,586 | ||||||||||||||||||
| Additions |
675 | 1,688 | 5,122 | 851 | 1,655 | 6,942 | 41 | 511 | 17,485 | |||||||||||||||||||||||||||
| Additions from business acquisitions |
30 | 251 | 870 | — | — | — | 862 | — | 2,013 | |||||||||||||||||||||||||||
| Transfer of completed projects in progress |
59 | 1,289 | 3,251 | 1,168 | 662 | (8,143 | ) | 1,714 | — | — | ||||||||||||||||||||||||||
| Transfer to/(from) assets classified as held for sale |
— | — | (10 | ) | — | — | — | — | — | (10 | ) | |||||||||||||||||||||||||
| Disposals |
(56 | ) | (219 | ) | (2,694 | ) | (972 | ) | (103 | ) | — | (356 | ) | (40 | ) | (4,440 | ) | |||||||||||||||||||
| Effects of changes in foreign exchange rates |
(595 | ) | (1,352 | ) | (4,330 | ) | (1,216 | ) | (266 | ) | (1,004 | ) | (23 | ) | (848 | ) | (9,634 | ) | ||||||||||||||||||
| Changes in value on the recognition of inflation effects |
245 | 503 | 957 | 295 | 301 | 91 | — | 229 | 2,621 | |||||||||||||||||||||||||||
| Capitalization of borrowing costs |
— | — | — | — | — | 57 | — | — | 57 | |||||||||||||||||||||||||||
|
|
|
|
|
|
|
|
|
|
|
|
|
|
|
|
|
|
|
|||||||||||||||||||
| Cost as of December 31, 2015 |
Ps. | 7,569 | Ps. | 17,951 | Ps. | 53,685 | Ps. | 12,592 | Ps. | 11,651 | Ps. | 5,815 | Ps. | 14,488 | Ps. | 927 | Ps. | 124,678 | ||||||||||||||||||
|
|
|
|
|
|
|
|
|
|
|
|
|
|
|
|
|
|
|
|||||||||||||||||||
| Accumulated Depreciation |
Land | Buildings | Machinery and Equipment |
Refrigeration Equipment |
Returnable Bottles |
Investments in Fixed Assets in Progress |
Leasehold Improvements |
Other | Total | |||||||||||||||||||||||||||
| Accumulated Depreciation as of January 1, 2013 |
Ps. | — | Ps. | (4,451 | ) | Ps. | (20,561 | ) | Ps. | (6,622 | ) | Ps. | (1,988 | ) | Ps. | — | Ps. | (3,176 | ) | Ps. | (315 | ) | Ps. | (37,113 | ) | |||||||||||
| Depreciation for the year |
— | (431 | ) | (4,380 | ) | (1,452 | ) | (1,662 | ) | — | (784 | ) | (96 | ) | (8,805 | ) | ||||||||||||||||||||
| Transfer (to)/from assets classified as held for sale |
— | — | 105 | — | — | — | — | — | 105 | |||||||||||||||||||||||||||
| Disposals |
— | 200 | 1,992 | 785 | 33 | — | 682 | 6 | 3,698 | |||||||||||||||||||||||||||
| Effects of changes in foreign exchange rates |
— | 591 | 2,061 | 755 | 143 | — | 8 | 73 | 3,631 | |||||||||||||||||||||||||||
| Changes in value on the recognition of inflation effects |
— | (583 | ) | (996 | ) | (442 | ) | (6 | ) | — | — | (122 | ) | (2,149 | ) | |||||||||||||||||||||
|
|
|
|
|
|
|
|
|
|
|
|
|
|
|
|
|
|
|
|||||||||||||||||||
| Accumulated Depreciation as of December 31, 2013 |
Ps. | — | Ps. | (4,674 | ) | Ps. | (21,779 | ) | Ps. | (6,976 | ) | Ps. | (3,480 | ) | Ps. | — | Ps. | (3,270 | ) | Ps. | (454 | ) | Ps. | (40,633 | ) | |||||||||||
|
|
|
|
|
|
|
|
|
|
|
|
|
|
|
|
|
|
|
|||||||||||||||||||
F-48
| Accumulated Depreciation |
Land | Buildings | Machinery and Equipment |
Refrigeration Equipment |
Returnable Bottles |
Investments in Fixed Assets in Progress |
Leasehold Improvements |
Other | Total | |||||||||||||||||||||||||||
| Accumulated Depreciation as of January 1, 2014 |
Ps. | — | Ps. | (4,674 | ) | Ps. | (21,779 | ) | Ps. | (6,976 | ) | Ps. | (3,480 | ) | Ps. | — | Ps. | (3,270 | ) | Ps.(454 | ) | Ps. | (40,633 | ) | ||||||||||||
| Depreciation for the year |
— | (466 | ) | (4,525 | ) | (1,181 | ) | (1,879 | ) | — | (863 | ) | (115 | ) | (9,029 | ) | ||||||||||||||||||||
| Transfer (to)/from assets classified as held for sale |
— | — | 62 | — | — | — | — | — | 62 | |||||||||||||||||||||||||||
| Disposals |
— | 77 | 2,086 | 602 | 57 | — | 517 | 1 | 3,340 | |||||||||||||||||||||||||||
| Effects of changes in foreign exchange rates |
— | 1,512 | 3,481 | 1,046 | 105 | — | 2 | 236 | 6,382 | |||||||||||||||||||||||||||
| Changes in value on the recognition of inflation effects |
— | (175 | ) | (707 | ) | (135 | ) | (8 | ) | — | — | (54 | ) | (1,079 | ) | |||||||||||||||||||||
|
|
|
|
|
|
|
|
|
|
|
|
|
|
|
|
|
|
|
|||||||||||||||||||
| Accumulated Depreciation as of December 31, 2014 |
Ps. | — | Ps. | (3,726 | ) | Ps. | (21,382 | ) | Ps. | (6,644 | ) | Ps. | (5,205 | ) | Ps. | — | Ps. | (3,614 | ) | Ps. | (386 | ) | Ps. | (40,957 | ) | |||||||||||
|
|
|
|
|
|
|
|
|
|
|
|
|
|
|
|
|
|
|
|||||||||||||||||||
| Accumulated Depreciation |
Land | Buildings | Machinery and Equipment |
Refrigeration Equipment |
Returnable Bottles |
Investments in Fixed Assets in Progress |
Leasehold Improvements |
Other | Total | |||||||||||||||||||||||||||
| Accumulated Depreciation as of January 1, 2015 |
Ps. | — | Ps. | (3,726 | ) | Ps. | (21,382 | ) | Ps. | (6,644 | ) | Ps. | (5,205 | ) | Ps. | — | Ps. | (3,614 | ) | Ps. | (386 | ) | Ps. | (40,957 | ) | |||||||||||
| Depreciation for the year |
— | (515 | ) | (4,864 | ) | (1,184 | ) | (1,984 | ) | (1,071 | ) | (143 | ) | (9,761 | ) | |||||||||||||||||||||
| Disposals |
— | 172 | 2,001 | 946 | 80 | — | 270 | 2 | 3,471 | |||||||||||||||||||||||||||
| Effects of changes in foreign exchange rates |
— | 498 | 2,222 | 1,044 | 167 | — | 22 | 212 | 4,165 | |||||||||||||||||||||||||||
| Changes in value on the recognition of inflation effects |
— | (187 | ) | (426 | ) | (166 | ) | (436 | ) | — | 1 | (86 | ) | (1,300 | ) | |||||||||||||||||||||
|
|
|
|
|
|
|
|
|
|
|
|
|
|
|
|
|
|
|
|||||||||||||||||||
| Accumulated Depreciation as of December 31, 2015 |
Ps. | — | Ps. | (3,758 | ) | Ps. | (22,449 | ) | Ps. | (6,004 | ) | Ps. | (7,378 | ) | Ps. | — | Ps. | (4,392 | ) | Ps. | (401 | ) | Ps. | (44,382 | ) | |||||||||||
|
|
|
|
|
|
|
|
|
|
|
|
|
|
|
|
|
|
|
|||||||||||||||||||
F-49
| Carrying Amount |
Land | Buildings | Machinery and Equipment |
Refrigeration Equipment |
Returnable Bottles |
Investments in Fixed Assets in Progress |
Leasehold Improvements |
Other | Total | |||||||||||||||||||||||||||
| As of December 31, 2013 |
Ps. | 7,094 | Ps. | 12,870 | Ps. | 28,098 | Ps. | 6,413 | Ps. | 3,906 | Ps. | 7,039 | Ps. | 7,423 | Ps. | 1,112 | Ps. | 73,955 | ||||||||||||||||||
|
|
|
|
|
|
|
|
|
|
|
|
|
|
|
|
|
|
|
|||||||||||||||||||
| As of December 31, 2014 |
Ps. | 7,211 | Ps. | 12,065 | Ps. | 29,137 | Ps. | 5,822 | Ps. | 4,197 | Ps. | 7,872 | Ps. | 8,636 | Ps. | 689 | Ps. | 75,629 | ||||||||||||||||||
|
|
|
|
|
|
|
|
|
|
|
|
|
|
|
|
|
|
|
|||||||||||||||||||
| As of December 31, 2015 |
Ps. | 7,569 | Ps. | 14,193 | Ps. | 31,236 | Ps. | 6,588 | Ps. | 4,273 | Ps. | 5,815 | Ps. | 10,096 | Ps. | 526 | Ps. | 80,296 | ||||||||||||||||||
|
|
|
|
|
|
|
|
|
|
|
|
|
|
|
|
|
|
|
|||||||||||||||||||
During the years ended December 31, 2015, 2014 and 2013 the Company capitalized Ps. 57, Ps. 296 and Ps. 32, respectively of borrowing costs in relation to Ps. 993, Ps. 1,915 and Ps. 790 in qualifying assets. The effective interest rates used to determine the amount of borrowing costs eligible for capitalization were 4.1%, 4.8% and 4.1%, respectively.
For the years ended December 31, 2015, 2014 and 2013 interest expense, interest income and net foreign exchange losses (gains) are analyzed as follows:
| 2015 | 2014 | 2013 | ||||||||||
| Interest expense, interest income and foreign exchange losses (gains) |
Ps. | 8,031 | Ps. | 7,080 | Ps. | 3,887 | ||||||
| Amount capitalized (1) |
85 | 338 | 57 | |||||||||
|
|
|
|
|
|
|
|||||||
| Net amount in consolidated income statements |
Ps. | 7,946 | Ps. | 6,742 | Ps. | 3,830 | ||||||
|
|
|
|
|
|
|
|||||||
| (1) | Amount of interest capitalized in property, plant and equipment and amortized intangible assets. |
Commitments related to acquisitions of property, plant and equipment are disclosed in Note 25.
F-50
Note 12. Intangible Assets
| Cost |
Rights to Produce and Distribute Coca-Cola Trademark Products |
Goodwill | Other Indefinite Lived Intangible Assets |
Total Unamortized Intangible Assets |
Technology Costs and Management Systems |
Systems inDevelopment |
Alcohol Licenses |
Other | Total Amortized Intangible Assets |
Total Intangible Assets |
||||||||||||||||||||||||||||||
| Cost as of January 1, 2013 |
Ps. | 57,270 | Ps. | 6,972 | Ps. | 339 | Ps. | 64,581 | Ps. | 2,863 | Ps. | 1,019 | Ps. | 726 | Ps. | 384 | Ps. | 4,992 | Ps. | 69,573 | ||||||||||||||||||||
| Purchases |
— | — | — | — | 164 | 644 | 179 | 123 | 1,110 | 1,110 | ||||||||||||||||||||||||||||||
| Acquisition from business combinations |
19,868 | 14,692 | 1,621 | 36,181 | 70 | — | — | 196 | 266 | 36,447 | ||||||||||||||||||||||||||||||
| Transfer of completed development systems |
— | — | — | — | 172 | (172 | ) | — | — | — | — | |||||||||||||||||||||||||||||
| Disposals |
— | — | (163 | ) | (163 | ) | — | — | (46 | ) | — | (46 | ) | (209 | ) | |||||||||||||||||||||||||
| Effect of movements in exchange rates |
(1,828 | ) | (356 | ) | (10 | ) | (2,194 | ) | (75 | ) | — | — | (13 | ) | (88 | ) | (2,282 | ) | ||||||||||||||||||||||
| Changes in value on the recognition of inflation effects |
417 | — | — | 417 | — | 113 | — | — | 113 | 530 | ||||||||||||||||||||||||||||||
| Capitalization of borrowing costs |
— | — | — | — | 25 | — | — | — | 25 | 25 | ||||||||||||||||||||||||||||||
|
|
|
|
|
|
|
|
|
|
|
|
|
|
|
|
|
|
|
|
|
|||||||||||||||||||||
| Cost as of December 31, 2013 |
Ps. | 75,727 | Ps. | 21,308 | Ps. | 1,787 | Ps. | 98,822 | Ps. | 3,219 | Ps. | 1,604 | Ps. | 859 | Ps. | 690 | Ps. | 6,372 | Ps. | 105,194 | ||||||||||||||||||||
|
|
|
|
|
|
|
|
|
|
|
|
|
|
|
|
|
|
|
|
|
|||||||||||||||||||||
| Cost as of January 1, 2014 |
Ps. | 75,727 | Ps. | 21,308 | Ps. | 1,787 | Ps. | 98,822 | Ps. | 3,219 | Ps. | 1,604 | Ps. | 859 | Ps. | 690 | Ps. | 6,372 | Ps. | 105,194 | ||||||||||||||||||||
| Purchases |
— | — | 13 | 13 | 227 | 229 | 168 | 44 | 668 | 681 | ||||||||||||||||||||||||||||||
| Change in fair value of past acquisitions |
(2,416 | ) | 4,117 | (205 | ) | 1,496 | — | — | — | (17 | ) | (17 | ) | 1,479 | ||||||||||||||||||||||||||
| Transfer of completed development systems |
— | — | — | — | 278 | (278 | ) | — | — | — | — | |||||||||||||||||||||||||||||
| Disposals |
— | — | (8 | ) | (8 | ) | (387 | ) | — | — | (33 | ) | (420 | ) | (428 | ) | ||||||||||||||||||||||||
| Effect of movements in exchange rates |
(5,343 | ) | (251 | ) | (10 | ) | (5,604 | ) | (152 | ) | (1 | ) | — | (13 | ) | (166 | ) | (5,770 | ) | |||||||||||||||||||||
| Changes in value on the recognition of inflation effects |
2,295 | — | — | 2,295 | (2 | ) | — | — | — | (2 | ) | 2,293 | ||||||||||||||||||||||||||||
| Capitalization of borrowing costs |
— | — | — | — | 42 | — | — | — | 42 | 42 | ||||||||||||||||||||||||||||||
|
|
|
|
|
|
|
|
|
|
|
|
|
|
|
|
|
|
|
|
|
|||||||||||||||||||||
| Cost as of December 31, 2014 |
Ps. | 70,263 | Ps. | 25,174 | Ps. | 1,577 | Ps. | 97,014 | Ps. | 3,225 | Ps. | 1,554 | Ps. | 1,027 | Ps. | 671 | Ps. | 6,477 | Ps. | 103,491 | ||||||||||||||||||||
|
|
|
|
|
|
|
|
|
|
|
|
|
|
|
|
|
|
|
|
|
|||||||||||||||||||||
F-51
| Cost |
Rights to Produce and Distribute Coca-Cola Trademark Products |
Goodwill | Other Indefinite Lived Intangible Assets |
Total Unamortized Intangible Assets |
Technology Costs and Management Systems |
Systems in Development |
Alcohol Licenses |
Other | Total Amortized Intangible Assets |
Total Intangible Assets |
||||||||||||||||||||||||||||||
| Cost as of January 1, 2015 |
Ps. | 70,263 | Ps. | 25,174 | Ps. | 1,577 | Ps. | 97,014 | Ps. | 3,225 | Ps. | 1,554 | Ps. | 1,027 | Ps. | 671 | Ps. | 6,477 | Ps. | 103,491 | ||||||||||||||||||||
| Purchases |
— | — | — | — | 480 | 458 | 198 | 83 | 1,219 | 1,219 | ||||||||||||||||||||||||||||||
| Acquisitions from business combinations |
— | 11,369 | 1,238 | 12,607 | 328 | — | — | 199 | 527 | 13,134 | ||||||||||||||||||||||||||||||
| Transfer of completed development systems |
— | — | — | — | 1,085 | (1,085 | ) | — | — | — | — | |||||||||||||||||||||||||||||
| Disposals |
— | — | — | — | (150 | ) | (242 | ) | — | (77 | ) | (469 | ) | (469 | ) | |||||||||||||||||||||||||
| Effect of movements in exchange rates |
(4,992 | ) | (2,693 | ) | (52 | ) | (7,737 | ) | (94 | ) | (2 | ) | — | (16 | ) | (112 | ) | (7,849 | ) | |||||||||||||||||||||
| Changes in value on the recognition of inflation effects |
1,121 | — | — | 1,121 | (12 | ) | — | — | — | (12 | ) | 1,109 | ||||||||||||||||||||||||||||
| Capitalization of borrowing costs |
— | — | — | — | 28 | — | — | 28 | 28 | |||||||||||||||||||||||||||||||
|
|
|
|
|
|
|
|
|
|
|
|
|
|
|
|
|
|
|
|
|
|||||||||||||||||||||
| Cost as of December 31, 2015 |
Ps. | 66,392 | Ps. | 33,850 | Ps. | 2,763 | Ps. | 103,005 | Ps. | 4,890 | Ps. | 683 | Ps. | 1,225 | Ps. | 860 | Ps. | 7,658 | Ps. | 110,663 | ||||||||||||||||||||
|
|
|
|
|
|
|
|
|
|
|
|
|
|
|
|
|
|
|
|
|
|||||||||||||||||||||
| Amortization and |
||||||||||||||||||||||||||||||||||||||||
| Amortization as of January 1, 2013 |
Ps. | — | Ps. | — | Ps. | (103 | ) | Ps. | (103 | ) | Ps. | (1,228 | ) | Ps. | — | Ps. | (150 | ) | Ps. | (199 | ) | Ps. | (1,577 | ) | Ps. | (1,680 | ) | |||||||||||||
| Amortization expense |
— | — | — | — | (271 | ) | — | (73 | ) | (72 | ) | (416 | ) | (416 | ) | |||||||||||||||||||||||||
| Disposals |
— | — | 103 | 103 | 2 | — | 46 | — | 48 | 151 | ||||||||||||||||||||||||||||||
| Effect of movements in exchange rates |
— | — | — | — | 35 | — | — | 9 | 44 | 44 | ||||||||||||||||||||||||||||||
|
|
|
|
|
|
|
|
|
|
|
|
|
|
|
|
|
|
|
|
|
|||||||||||||||||||||
| Amortization as of December 31, 2013 |
Ps. | — | Ps. | — | Ps. | — | Ps. | — | Ps. | (1,462 | ) | Ps. | — | Ps. | (177 | ) | Ps. | (262 | ) | Ps. | (1,901 | ) | Ps. | (1,901 | ) | |||||||||||||||
|
|
|
|
|
|
|
|
|
|
|
|
|
|
|
|
|
|
|
|
|
|||||||||||||||||||||
| Amortization as of January 1, 2014 |
Ps. | — | Ps. | — | Ps. | — | Ps. | — | Ps. | (1,462 | ) | Ps. | — | Ps. | (177 | ) | Ps. | (262 | ) | Ps. | (1,901 | ) | Ps. | (1,901 | ) | |||||||||||||||
| Amortization expense |
— | — | — | — | (268 | ) | — | (58 | ) | (97 | ) | (423 | ) | (423 | ) | |||||||||||||||||||||||||
| Impairment losses |
— | — | (36 | ) | (36 | ) | — | — | — | — | — | (36 | ) | |||||||||||||||||||||||||||
| Disposals |
— | — | — | — | 387 | — | — | — | 387 | 387 | ||||||||||||||||||||||||||||||
| Effect of movements in exchange rates |
— | — | — | — | — | — | — | 9 | 9 | 9 | ||||||||||||||||||||||||||||||
|
|
|
|
|
|
|
|
|
|
|
|
|
|
|
|
|
|
|
|
|
|||||||||||||||||||||
| Amortization as of December 31, 2014 |
Ps. | — | Ps. | — | Ps. | (36 | ) | Ps. | (36 | ) | Ps. | (1,343 | ) | Ps. | — | Ps. | (235 | ) | Ps. | (350 | ) | Ps. | (1,928 | ) | Ps. | (1,964 | ) | |||||||||||||
|
|
|
|
|
|
|
|
|
|
|
|
|
|
|
|
|
|
|
|
|
|||||||||||||||||||||
F-52
| Amortization and impairment losses |
Rights to Produce and Distribute Coca-Cola Trademark Products |
Goodwill | Other Indefinite Lived Intangible Assets |
Total Unamortized Intangible Assets |
Technology Costs and Management Systems |
Systems in Development |
Alcohol Licenses |
Other | Total Amortized Intangible Assets |
Total Intangible Assets |
||||||||||||||||||||||||||||||
| Amortization as of January 1, 2015 |
Ps. | — | Ps. | — | Ps. | (36 | ) | Ps. | (36 | ) | Ps. | (1,343 | ) | Ps. | — | Ps.(235 | ) | Ps. | (350 | ) | Ps. | (1,928 | ) | Ps. | (1,964 | ) | ||||||||||||||
| Amortization expense |
— | — | — | — | (461 | ) | — | (67 | ) | (76 | ) | (604 | ) | (604 | ) | |||||||||||||||||||||||||
| Disposals |
— | — | — | — | 126 | — | — | 42 | 168 | 168 | ||||||||||||||||||||||||||||||
| Effect of movements in exchange rates |
— | — | — | — | 59 | — | — | 19 | 78 | 78 | ||||||||||||||||||||||||||||||
|
|
|
|
|
|
|
|
|
|
|
|
|
|
|
|
|
|
|
|
|
|||||||||||||||||||||
| Amortization as of December 31, 2015 |
Ps. | — | Ps. | — | Ps. | (36 | ) | Ps. | (36 | ) | Ps. | (1,619 | ) | Ps. | — | Ps. | (302 | ) | Ps. | (365 | ) | Ps. | (2,286 | ) | Ps. | (2,322 | ) | |||||||||||||
|
|
|
|
|
|
|
|
|
|
|
|
|
|
|
|
|
|
|
|
|
|||||||||||||||||||||
| Carrying Amount |
||||||||||||||||||||||||||||||||||||||||
| As of December 31, 2013 |
Ps. | 75,727 | Ps. | 21,308 | Ps. | 1,787 | Ps. | 98,822 | Ps. | 1,757 | Ps. | 1,604 | Ps. | 682 | Ps. | 428 | Ps. | 4,471 | Ps. | 103,293 | ||||||||||||||||||||
| As of December 31, 2014 |
Ps. | 70,263 | Ps. | 25,174 | Ps. | 1,541 | Ps. | 96,978 | Ps. | 1,882 | Ps. | 1,554 | Ps. | 792 | Ps. | 321 | Ps. | 4,549 | Ps. | 101,527 | ||||||||||||||||||||
| As of December 31, 2015 |
Ps. | 66,392 | Ps. | 33,850 | Ps. | 2,727 | Ps. | 102,969 | Ps. | 3,271 | Ps. | 683 | Ps. | 923 | Ps. | 495 | Ps. | 5,372 | Ps. | 108,341 | ||||||||||||||||||||
F-53
During the years ended December 31, 2015, 2014 and 2013 the Company capitalized Ps. 28, Ps. 42 and Ps. 25, respectively of borrowing costs in relation to Ps. 410, Ps. 600 and Ps. 630 in qualifying assets, respectively. The effective interest rates used to determine the amount of borrowing costs eligible for capitalization were 4.1%, 4.2% and 4.1%, respectively.
For the years ended 2015, 2014 and 2013, allocation for amortization expense is as follows:
| 2015 | 2014 | 2013 | ||||||||||
| Cost of goods sold |
Ps. | 61 | Ps. | 12 | Ps. | 10 | ||||||
| Administrative expenses |
407 | 156 | 249 | |||||||||
| Selling expenses |
136 | 255 | 157 | |||||||||
|
|
|
|
|
|
|
|||||||
| Ps. | 604 | Ps. | 423 | Ps. | 416 | |||||||
|
|
|
|
|
|
|
|||||||
The average remaining period for the Company’s intangible assets that are subject to amortization is as follows:
| Years | ||||
| Technology Costs and Management Systems |
3-10 | |||
| Alcohol Licenses |
6 | |||
Coca-Cola FEMSA Impairment Tests for Cash-Generating Units Containing Goodwill and Distribution Rights
For the purpose of impairment testing, goodwill and distribution rights are allocated and monitored on an individual country basis, which is considered to be the CGU.
The aggregate carrying amounts of goodwill and distribution rights allocated to each CGU are as follows:
| December 31, 2015 |
December 31, 2014 |
|||||||
| Mexico |
Ps. | 55,137 | Ps. | 55,137 | ||||
| Guatemala |
410 | 352 | ||||||
| Nicaragua |
465 | 418 | ||||||
| Costa Rica |
1,391 | 1,188 | ||||||
| Panama |
1,033 | 884 | ||||||
| Colombia |
4,746 | 5,344 | ||||||
| Venezuela |
621 | 823 | ||||||
| Brazil |
23,557 | 29,622 | ||||||
| Argentina |
69 | 88 | ||||||
|
|
|
|
|
|||||
| Total |
Ps. | 87,429 | Ps. | 93,856 | ||||
|
|
|
|
|
|||||
Goodwill and distribution rights are tested for impairments annually. The recoverable amounts of the CGUs are based on value-in-use calculations. Value in use was determined by discounting the future cash flows generated from the continuing use of the CGU.
The foregoing forecasts could differ from the results obtained over time; however, Coca-Cola FEMSA prepares its estimates based on the current situation of each of the CGUs.
F-54
The recoverable amounts are based on value in use. The value in use of CGUs is determined based on the method of discounted cash flows. The key assumptions used in projecting cash flows are: volume, expected annual long-term inflation, and the weighted average cost of capital (“WACC”) used to discount the projected flows.
To determine the discount rate, Coca-Cola FEMSA uses the WACC as determined for each of the cash generating units in real terms and as described in following paragraphs.
The estimated discount rates to perform the IAS 36 “Impairment of assets”, impairment test for each CGU consider market participants’ assumptions. Market participants were selected taking into consideration the size, operations and characteristics of the business that are similar to those of Coca-Cola FEMSA.
The discount rates represent the current market assessment of the risks specific to each CGU, taking into consideration the time value of money and individual risks of the underlying assets that have not been incorporated in the cash flow estimates. The discount rate calculation is based on the specific circumstances of Coca-Cola FEMSA and its operating segments and is derived from its WACC. The WACC takes into account both debt and equity. The cost of equity is derived from the expected return on investment by Company’s investors. The cost of debt is based on the interest bearing borrowings Coca-Cola FEMSA is obliged to service. Segment-specific risk is incorporated by applying individual beta factors. The beta factors are evaluated annually based on publicly available market data.
Market participant assumptions are important because, not only do they include industry data for growth rates, management also assesses how the CGU’s position, relative to its competitors, might change over the forecasted period.
The key assumptions used for the value-in-use calculations are as follows:
| • | Cash flows were projected based on actual operating results and the five-year business plan. Cash flows for a further five-year were forecasted maintaining the same stable growth and margins per country of the last year base. Coca-Cola FEMSA believes that this forecasted period is justified due to the non-current nature of the business and past experiences. |
| • | Cash flows after the first ten-year period were extrapolated using a perpetual growth rate equal to the expected annual population growth, in order to calculate the terminal recoverable amount. |
| • | A per CGU-specific Weighted Average Cost of Capital (“WACC”) was applied as a hurdle rate to discount cash flows to get the recoverable amount of the units; the calculation assumes, size premium adjusting. |
The key assumptions by CGU for impairment test as of December 31, 2015 were as follows:
| CGU |
Pre-tax WACC | Post-tax WACC |
Expected Annual Long-Term Inflation 2016-2025 |
Expected Volume Growth Rates 2016-2025 | ||||
| Mexico |
6.7% | 6.1% | 3.4% | 2.1% | ||||
| Colombia |
7.6% | 6.8% | 3.0% | 4.4% | ||||
| Venezuela |
17.8% | 17.1% | 72.5% | 3.9% | ||||
| Costa Rica |
8.2% | 7.9% | 4.7% | 3.9% | ||||
| Guatemala |
10.6% | 10.0% | 3.7% | 4.7% | ||||
| Nicaragua |
13.4% | 12.8% | 5.3% | 6.4% | ||||
| Panama |
7.4% | 6.8% | 3.1% | 5.2% | ||||
| Argentina |
9.8% | 9.1% | 22.8% | 3.4% | ||||
| Brazil |
8.0% | 7.4% | 4.9% | 4.0% |
F-55
The key assumptions by CGU for impairment test as of December 31, 2014 were as follows:
| CGU |
Pre-tax WACC | Post-tax WACC |
Expected Annual Long-Term Inflation 2015-2024 |
Expected Volume Growth Rates 2015-2024 | ||||
| Mexico |
5.5% | 5.0% | 3.5% | 2.3% | ||||
| Colombia |
6.4% | 5.9% | 3.0% | 5.3% | ||||
| Venezuela |
12.9% | 12.3% | 51.1% | 3.9% | ||||
| Costa Rica |
7.7% | 7.6% | 4.7% | 2.7% | ||||
| Guatemala |
10.0% | 9.4% | 5.0% | 4.3% | ||||
| Nicaragua |
12.7% | 12.2% | 6.0% | 2.7% | ||||
| Panama |
7.6% | 7.2% | 3.8% | 4.1% | ||||
| Argentina |
9.9% | 9.3% | 22.3% | 2.5% | ||||
| Brazil |
6.2% | 5.6% | 6.0% | 3.8% |
The values assigned to the key assumptions represent management’s assessment of future trends in the industry and are based on both external sources and internal sources (historical data). Coca-Cola FEMSA consistently applied its methodology to determine CGU specific WACC’s to perform its annual impairment testing.
Sensitivity to Changes in Assumptions
At December 31, 2015, Coca-Cola FEMSA performed an additional impairment sensitivity calculation, taking into account an adverse change in post-tax WACC, according to the country risk premium, using for each country the relative standard deviation between equity and sovereign bonds and an additional sensitivity to the volume of 100 basis points and concluded that no impairment would be recorded.
| CGU |
Change in WACC | Change in Volume Growth CAGR(1) |
Effect on Valuation | |||
| Mexico |
+0.7% | -1.0% | Passes by 7.53x | |||
| Colombia |
+0.9% | -1.0% | Passes by 5.16x | |||
| Venezuela |
+5.8% | -1.0% | Passes by 7.08x | |||
| Costa Rica |
+2.4% | -1.0% | Passes by 2.27x | |||
| Guatemala |
+1.2% | -1.0% | Passes by 6.41x | |||
| Nicaragua |
+2.6% | -1.0% | Passes by 3.53x | |||
| Panama |
+0.6% | -1.0% | Passes by 11.89x | |||
| Argentina |
+5.6% | -1.0% | Passes by 137.35x | |||
| Brazil |
+1.1% | -1.0% | Passes by 2.29x |
| (1) | Compound Annual Growth Rate (CAGR). |
F-56
Note 13. Other Assets, Net and Other Financial Assets
13.1 Other assets, net
| December 31, 2015 |
December 31, 2014 |
|||||||
| Agreement with customers, net |
Ps. | 238 | Ps. | 239 | ||||
| Long term prepaid advertising expenses |
52 | 87 | ||||||
| Guarantee deposits (1) |
1,870 | 1,400 | ||||||
| Prepaid bonuses |
122 | 92 | ||||||
| Advances to acquire property, plant and equipment |
370 | 988 | ||||||
| Recoverable taxes |
1,181 | 1,329 | ||||||
| Others |
1,160 | 782 | ||||||
|
|
|
|
|
|||||
| Ps. | 4,993 | Ps. | 4,917 | |||||
|
|
|
|
|
|||||
| (1) | As it is customary in Brazil, the Company is required to collaterize tax, legal and labor contingencies by guarantee deposits (see Note 25.7). |
13.2 Other financial assets
| December 31, 2015 |
December 31, 2014 |
|||||||
| Non-current accounts receivable |
Ps. | 478 | Ps. | 155 | ||||
| Derivative financial instruments (see Note 20) |
8,377 | 6,299 | ||||||
| Other non-current financial assets |
100 | 97 | ||||||
|
|
|
|
|
|||||
| Ps. | 8,955 | Ps. | 6,551 | |||||
|
|
|
|
|
|||||
As of December 31, 2015 and 2014, the fair value of long term accounts receivable amounted to Ps. 452 and Ps. 69, respectively. The fair value is calculated based on the discounted value of contractual cash flows whereby the discount rate is estimated using rates currently offered for receivable of similar amounts and maturities, which is considered to be level 2 in the fair value hierarchy.
F-57
Note 14. Balances and Transactions with Related Parties and Affiliated Companies
Balances and transactions between the Company and its subsidiaries have been eliminated on consolidation and are not disclosed in this note.
The consolidated statements of financial positions and consolidated income statements include the following balances and transactions with related parties and affiliated companies:
| December 31, 2015 |
December 31, 2014 |
|||||||
| Balances |
||||||||
| Due from The Coca-Cola Company (see Note 7) (1) (8) |
Ps. | 1,559 | Ps. | 1,584 | ||||
| Balance with BBVA Bancomer, S.A. de C.V. (2) |
2,683 | 4,083 | ||||||
| Balance with Grupo Financiero Banorte, S.A. de C.V. (2) |
1,178 | 3,653 | ||||||
| Instituto Tecnológicoy de Estudios Superiores de Monterrey, A.C. (3) |
79 | 126 | ||||||
| Due from Heineken Company (1) (7) |
754 | 811 | ||||||
| Due from Grupo Estrella Azul (3) |
69 | 59 | ||||||
| Other receivables (1) (4) |
1,352 | 1,209 | ||||||
|
|
|
|
|
|||||
| Due to The Coca-Cola Company (5) (6) (8) |
Ps. | 3,140 | Ps. | 4,343 | ||||
| Due to BBVA Bancomer, S.A. de C.V. (5) |
292 | 149 | ||||||
| Due to Caffenio (6) (7) |
108 | 111 | ||||||
| Due to Heineken Company (6) (7) |
2,588 | 2,408 | ||||||
| Other payables (6) |
981 | 1,206 | ||||||
|
|
|
|
|
|||||
| (1) | Presented within accounts receivable. |
| (2) | Presented within cash and cash equivalents. |
| (3) | Presented within other financial assets. |
| (4) | Presented within other current financial assets. |
| (5) | Recorded within bank loans. |
| (6) | Recorded within accounts payable. |
| (7) | Associates. |
| (8) | Non controlling interest. |
Balances due from related parties are considered to be recoverable. Accordingly, for the years ended December 31, 2015 and 2014, there was no expense resulting from the uncollectibility of balances due from related parties.
F-58
| Transactions |
2015 | 2014 | 2013 | |||||||||
| Income: |
||||||||||||
| Services to Heineken Company (1) |
Ps. | 3,396 | Ps. | 3,544 | Ps. | 2,412 | ||||||
| Logistic services to Grupo Industrial Saltillo, S.A. de C.V. (3) |
407 | 313 | 287 | |||||||||
| Logistic services to Jugos del Valle (1) |
564 | 513 | 471 | |||||||||
| Other revenues from related parties |
644 | 670 | 399 | |||||||||
|
|
|
|
|
|
|
|||||||
| Expenses: |
||||||||||||
| Purchase of concentrate from The Coca-Cola Company (2) |
Ps. | 27,330 | Ps. | 28,084 | Ps. | 25,985 | ||||||
| Purchases of raw material and beer from Heineken Company (1) |
14,467 | 15,133 | 11,865 | |||||||||
| Purchase of coffee from Caffenio (1) |
1,774 | 1,404 | 1,383 | |||||||||
| Purchase of baked goods and snacks from Grupo Bimbo, S.A.B. de C.V.(3) |
3,740 | 3,674 | 2,860 | |||||||||
| Purchase of cigarettes from British American Tobacco Mexico (3) |
— | — | 2,460 | |||||||||
| Advertisement expense paid to The Coca-Cola Company (2) (4) |
1,316 | 1,167 | 1,291 | |||||||||
| Purchase of juices from Jugos del Valle, S.A.P.I. de C.V. (1) |
3,082 | 2,592 | 2,628 | |||||||||
| Purchase of sugar from Promotora Industrial Azucarera, S.A. de C.V. (1) |
1,236 | 1,020 | 956 | |||||||||
| Interest expense and fees paid to BBVA Bancomer, S.A. de C.V. (3) |
68 | 99 | 77 | |||||||||
| Purchase of sugar from Beta San Miguel (3) |
1,264 | 1,389 | 1,557 | |||||||||
| Purchase of sugar, cans and aluminum lids from Promotora Mexicana de Embotelladores, S.A. de C.V. (3) |
587 | 567 | 670 | |||||||||
| Purchase of canned products from IEQSA (1) |
731 | 591 | 615 | |||||||||
| Purchase of inventories to Leão Alimentos e Bebidas, L.T.D.A. (1) |
3,359 | 2,891 | 2,123 | |||||||||
| Advertising paid to Grupo Televisa, S.A.B. (3) |
175 | 158 | 92 | |||||||||
| Interest expense paid to Grupo Financiero Banamex, S.A. de C.V. (3) |
— | 2 | 19 | |||||||||
| Insurance premiums for policies with Grupo Nacional Provincial, S.A.B.(3) |
58 | 140 | 67 | |||||||||
| Donations to Instituto Tecnológicoy de Estudios Superiores de Monterrey, A.C.(3) |
— | 42 | 78 | |||||||||
| Donations to Fundación FEMSA, A.C. (3) |
30 | — | 27 | |||||||||
| Donations to Difusión y Fomento Cultural, A.C. (3) |
59 | 73 | — | |||||||||
| Interest expense paid to The Coca-Cola Company (2) |
1 | 4 | 60 | |||||||||
| Other expenses with related parties |
470 | 321 | 299 | |||||||||
| (1) | Associates. |
| (2) | Non controlling interest. |
| (3) | Members of the board of directors in FEMSA participate in board of directors of this entity. |
| (4) | Net of the contributions from The Coca-Cola Company of Ps. 3,749, Ps. 4,118 and Ps. 4,206, for the years ended in 2015, 2014 and 2013, respectively. |
Also as disclosed in Note 10, during January 2013, Coca-Cola FEMSA purchased its 51% interest in CCFPI from The
Coca-Cola Company. The remainder of CCFPI is owned by The Coca-Cola Company and Coca-Cola FEMSA has currently outstanding certain call and put options related to CCFPI’s equity interests.
F-59
Commitments with related parties
| Related Party |
Commitment |
Conditions | ||
| Heineken Company |
Supply | Supply of all beer products in Mexico’s OXXO stores. The contract may be renewed for five years or additional periods. At the end of the contract OXXO will not hold exclusive contract with another supplier of beer for the next 3 years. Commitment term, Jan 1st, 2010 to Jun 30, 2020. |
The benefits and aggregate compensation paid to executive officers and senior management of the Company were as follows:
| 2015 | 2014 | 2013 | ||||||||||
| Short-term employee benefits paid |
Ps. | 1,162 | Ps. | 964 | Ps. | 1,268 | ||||||
| Postemployment benefits |
42 | 45 | 37 | |||||||||
| Termination benefits |
63 | 114 | 25 | |||||||||
| Share based payments |
463 | 283 | 306 | |||||||||
Note 15. Balances and Transactions in Foreign Currencies
Assets, liabilities and transactions denominated in foreign currencies are those realized in a currency different than the functional currency of the Company. As of the end and for the years ended on December 31, 2015, 2014 and 2013, assets, liabilities and transactions denominated in foreign currencies, expressed in Mexican pesos (contractual amounts) are as follows:
| Assets | Liabilities | |||||||||||||||
| Balances |
Short-Term | Long-Term | Short-Term | Long-Term | ||||||||||||
| As of December 31, 2015 |
||||||||||||||||
| U.S. dollars |
Ps. | 10,939 | Ps. | 630 | Ps. | 1,672 | Ps. | 71,123 | ||||||||
| Euros |
3 | — | 23 | — | ||||||||||||
| Other currencies |
— | 1,173 | 152 | 41 | ||||||||||||
|
|
|
|
|
|
|
|
|
|||||||||
| Total |
Ps. | 10,942 | Ps. | 1,803 | Ps. | 1,847 | Ps. | 71,164 | ||||||||
|
|
|
|
|
|
|
|
|
|||||||||
| As of December 31, 2014 |
||||||||||||||||
| U.S. dollars |
Ps. | 5,890 | Ps. | 989 | Ps. | 7,218 | Ps. | 66,140 | ||||||||
| Euros |
32 | — | 27 | — | ||||||||||||
| Other currencies |
27 | 1,214 | 50 | 31 | ||||||||||||
|
|
|
|
|
|
|
|
|
|||||||||
| Total |
Ps. | 5,949 | Ps. | 2,203 | Ps. | 7,295 | Ps. | 66,171 | ||||||||
|
|
|
|
|
|
|
|
|
|||||||||
F-60
| Transactions |
Revenues | Other Revenues |
Purchases of Raw Materials |
Interest Expense |
Consulting Fees |
Assets Acquisitions |
Other | |||||||||||||||||||||
| For the year ended December 31, 2015 |
||||||||||||||||||||||||||||
| U.S. dollars |
Ps. | 1,891 | Ps. | 472 | Ps. | 11,710 | Ps. | 1,973 | Ps. | 34 | Ps. | 75 | Ps. | 2,035 | ||||||||||||||
| Euros |
— | 1 | 2 | — | 2 | — | 37 | |||||||||||||||||||||
| Other currencies |
20 | — | — | — | — | — | 204 | |||||||||||||||||||||
|
|
|
|
|
|
|
|
|
|
|
|
|
|
|
|||||||||||||||
| Total |
Ps. | 1,911 | Ps. | 473 | Ps. | 11,712 | Ps. | 1,973 | Ps. | 36 | Ps. | 75 | Ps. | 2,276 | ||||||||||||||
|
|
|
|
|
|
|
|
|
|
|
|
|
|
|
|||||||||||||||
| For the year ended December 31, 2014 |
||||||||||||||||||||||||||||
| U.S. dollars |
Ps. | 2,817 | Ps. | 641 | Ps. | 15,006 | Ps. | 1,669 | Ps. | 14 | Ps. | 478 | Ps. | 2,068 | ||||||||||||||
| Euros |
7 | — | 80 | 15 | — | 5 | 13 | |||||||||||||||||||||
| Other currencies |
178 | — | 10 | — | — | — | 4 | |||||||||||||||||||||
|
|
|
|
|
|
|
|
|
|
|
|
|
|
|
|||||||||||||||
| Total |
Ps. | 3,002 | Ps. | 641 | Ps. | 15,096 | Ps. | 1,684 | Ps. | 14 | Ps. | 483 | Ps. | 2,085 | ||||||||||||||
|
|
|
|
|
|
|
|
|
|
|
|
|
|
|
|||||||||||||||
| For the year ended December 31, 2013 |
||||||||||||||||||||||||||||
| U.S. dollars |
Ps. | 2,013 | Ps. | 605 | Ps. | 15,017 | Ps. | 435 | Ps. | 11 | Ps. | 80 | Ps. | 1,348 | ||||||||||||||
| Euros |
1 | 3 | 55 | 9 | — | 2 | 15 | |||||||||||||||||||||
| Other currencies |
— | — | — | — | — | — | 3 | |||||||||||||||||||||
|
|
|
|
|
|
|
|
|
|
|
|
|
|
|
|||||||||||||||
| Total |
Ps. | 2,014 | Ps. | 608 | Ps. | 15,072 | Ps. | 444 | Ps. | 11 | Ps. | 82 | Ps. | 1,366 | ||||||||||||||
|
|
|
|
|
|
|
|
|
|
|
|
|
|
|
|||||||||||||||
Mexican peso exchange rates effective at the dates of the consolidated statements of financial position and at the issuance date of the Company’s consolidated financial statements were as follows:
| December 31, 2015 |
2014 | February 23, 2016 |
||||||||||
| U.S. dollar |
17.2065 | 14.7180 | 18.2762 | |||||||||
| Euro |
18.7873 | 17.9182 | 19.9997 | |||||||||
Note 16. Post-Employment and Other Long-Term Employee Benefits
The Company has various labor liabilities for employee benefits in connection with pension, seniority and post-retirement medical benefits. Benefits vary depending upon the country where the individual employees are located. Presented below is a discussion of the Company’s labor liabilities in Mexico, which comprise the substantial majority of those recorded in the consolidated financial statements.
During 2014, Coca-Cola FEMSA settled its pension plan in Brazil and consequently Coca-Cola FEMSA recognized the corresponding effects of the settlement as disclosed below.
16.1 Assumptions
The Company annually evaluates the reasonableness of the assumptions used in its labor liability for post-employment and other non-current employee benefits computations.
F-61
Actuarial calculations for pension and retirement plans, seniority premiums and post-retirement medical benefits, as well as the associated cost for the period, were determined using the following long-term assumptions for non-hyperinflationary Mexico:
| Mexico |
December 31, 2015 |
December 31, 2014 |
December 31, 2013 |
|||||||||
| Financial: |
||||||||||||
| Discount rate used to calculate the defined benefit obligation |
7.00 | % | 7.00 | % | 7.50 | % | ||||||
| Salary increase |
4.50 | % | 4.50 | % | 4.79 | % | ||||||
| Future pension increases |
3.50 | % | 3.50 | % | 3.50 | % | ||||||
| Healthcare cost increase rate |
5.10 | % | 5.10 | % | 5.10 | % | ||||||
| Biometric: |
||||||||||||
| Mortality (1) |
EMSSA 2009 | EMSSA 2009 | EMSSA 82-89 | |||||||||
| Disability (2) |
IMSS-97 | IMSS-97 | IMSS-97 | |||||||||
| Normal retirement age |
60 years | 60 years | 60 years | |||||||||
| Employee turnover table (3) |
BMAR 2007 | BMAR 2007 | BMAR 2007 | |||||||||
Measurement date December:
| (1) | EMSSA. Mexican Experience of social security. Updated due to lower mortality rates. |
| (2) | IMSS. Mexican Experience of Instituto Mexicano del Seguro Social. |
| (3) | BMAR. Actuary experience. |
In Mexico the methodology used to determine the discount rate was the Yield or Internal Rate of Return (“IRR”) which involves a yield curve. In this case, the expected rates of each period were taken from a yield curve of Mexican Federal Government Treasury Bond (known as CETES in Mexico).
In Mexico upon retirement, the Company purchases an annuity for the employee, which will be paid according to the option chosen by the employee.
Based on these assumptions, the amounts of benefits expected to be paid out in the following years are as follows:
| Pension and Retirement Plans |
Seniority Premiums |
Post Retirement Medical Services |
Total | |||||||||||||
| 2016 |
Ps. | 489 | Ps. | 33 | Ps. | 12 | Ps. | 534 | ||||||||
| 2017 |
347 | 31 | 17 | 395 | ||||||||||||
| 2018 |
293 | 33 | 18 | 344 | ||||||||||||
| 2019 |
336 | 36 | 18 | 390 | ||||||||||||
| 2020 |
413 | 41 | 19 | 473 | ||||||||||||
| 2021 to 2025 |
1,809 | 287 | 101 | 2,197 | ||||||||||||
F-62
16.2 Balances of the liabilities for post-employment and other long-term employee benefits
| December 31, 2015 |
December 31, 2014 |
|||||||
| Pension and Retirement Plans: |
||||||||
| Defined benefit obligation |
Ps. | 5,308 | Ps. | 5,270 | ||||
| Pension plan funds at fair value |
(2,068 | ) | (2,015 | ) | ||||
|
|
|
|
|
|||||
| Net defined benefit liability |
Ps. | 3,240 | Ps. | 3,255 | ||||
|
|
|
|
|
|||||
| Seniority Premiums: |
||||||||
| Defined benefit obligation |
Ps. | 610 | Ps. | 563 | ||||
| Seniority premium plan funds at fair value |
(103 | ) | (87 | ) | ||||
|
|
|
|
|
|||||
| Net defined benefit liability |
Ps. | 507 | Ps. | 476 | ||||
|
|
|
|
|
|||||
| Postretirement Medical Services: |
||||||||
| Defined benefit obligation |
Ps. | 404 | Ps. | 338 | ||||
| Medical services funds at fair value |
(57 | ) | (56 | ) | ||||
|
|
|
|
|
|||||
| Net defined benefit liability |
Ps. | 347 | Ps. | 282 | ||||
|
|
|
|
|
|||||
| Post-employment: |
||||||||
| Defined benefit obligation |
Ps. | 135 | Ps. | 194 | ||||
| Post-employment plan funds at fair value |
— | — | ||||||
|
|
|
|
|
|||||
| Net defined benefit liability |
Ps. | 135 | Ps.194 | |||||
|
|
|
|
|
|||||
| Total post-employment and other long-term employee benefits |
Ps. | 4,229 | Ps. | 4,207 | ||||
|
|
|
|
|
|||||
16.3 Trust assets
Trust assets consist of fixed and variable return financial instruments recorded at market value, which are invested as follows:
| Type of Instrument |
December 31, 2015 |
December 31, 2014 |
||||||
| Fixed return: |
||||||||
| Traded securities |
13 | % | 19 | % | ||||
| Bank instruments |
6 | % | 8 | % | ||||
| Federal government instruments of the respective countries |
63 | % | 57 | % | ||||
| Variable return: |
||||||||
| Publicly traded shares |
18 | % | 16 | % | ||||
|
|
|
|
|
|||||
| 100 | % | 100 | % | |||||
|
|
|
|
|
|||||
In Mexico, the regulatory framework for pension plans is established in the Income Tax Law and its Regulations, the Federal Labor Law and the Mexican Social Security Institute Law. None of these laws establish minimum funding levels or a minimum required level of contributions.
In Mexico, the Income Tax Law requires that, in the case of private plans, certain notifications must be submitted to the authorities and a certain level of instruments must be invested in Federal Government securities among others.
The Company’s various pension plans have a technical committee that is responsible for verifying the correct operation of the plan with regard to the payment of benefits, actuarial valuations of the plan, and supervise the trustee. The committee is
F-63
responsible for determining the investment portfolio and the types of instruments the fund will be invested in. This technical committee is also responsible for reviewing the correct operation of the plans in all of the countries in which the Company has these benefits.
The risks related to the Company’s employee benefit plans are primarily attributable to the plan assets. The Company’s plan assets are invested in a diversified portfolio, which considers the term of the plan so as to invest in assets whose expected return coincides with the estimated future payments.
Since the Mexican Tax Law limits the plan asset investment to 10% for related parties, this risk is not considered to be significant for purposes of the Company’s Mexican subsidiaries.
In Mexico, the Company’s policy is to invest at least 30% of the fund assets in Mexican Federal Government instruments. Guidelines for the target portfolio have been established for the remaining percentage and investment decisions are made to comply with these guidelines insofar as the market conditions and available funds allow.
In Mexico, the amounts and types of securities of the Company in related parties included in portfolio fund are as follows:
| December 31, 2015 |
December 31, 2014 |
|||||||
| Debt: |
||||||||
| Cementos Mexicanos. S.A.B. de C.V. |
Ps. | 7 | Ps. | 7 | ||||
| Grupo Televisa, S.A.B. de C.V. |
45 | 45 | ||||||
| Grupo Financiero Banorte, S.A.B. de C.V. |
12 | 12 | ||||||
| El Puerto de Liverpool, S.A.B. de C.V. |
5 | 5 | ||||||
| Grupo Industrial Bimbo, S.A.B. de C. V. |
3 | 3 | ||||||
| Gentera, S.A.B. de C.V. |
8 | — | ||||||
| Capital: |
||||||||
| Fomento Económico Mexicano, S.A.B. de C.V. |
113 | 96 | ||||||
| Coca-Cola FEMSA, S.A.B. de C.V. |
— | 12 | ||||||
| Alfa, S.A.B. de C.V. |
13 | 8 | ||||||
| Gruma, S.A.B. de C.V. |
5 | — | ||||||
| Grupo Industrial Bimbo, S.A.B. de C.V. |
3 | — | ||||||
| The Coca-Cola Company |
— | 11 | ||||||
| Gentera, S.A.B. de C.V. |
— | 7 | ||||||
During the years ended December 31, 2015, 2014 and 2013, the Company did not make significant contributions to the plan assets and does not expect to make material contributions to the plan assets during the following fiscal year.
F-64
16.4 Amounts recognized in the consolidated income statements and the consolidated statement of comprehensive income
| Income Statement | OCI(2) | |||||||||||||||||||
| December 31, 2015 |
Current Service Cost |
Past Service Cost |
Gain or Loss on Settlement or Curtailment |
Net Interest on the Net Defined Benefit Liability |
Remeasurements of the Net Defined Benefit Liability |
|||||||||||||||
| Pension and retirement plans |
Ps. | 233 | Ps. | 3 | Ps. | (120 | ) | Ps. | 212 | Ps. | 913 | |||||||||
| Seniority premiums |
88 | — | (9 | ) | 32 | 39 | ||||||||||||||
| Postretirement medical services |
16 | — | — | 23 | 119 | |||||||||||||||
| Post-employment Venezuela |
6 | — | — | 9 | — | |||||||||||||||
|
|
|
|
|
|
|
|
|
|
|
|||||||||||
| Total |
Ps. | 343 | Ps. | 3 | Ps. | (129 | ) | Ps. | 276 | Ps. | 1,071 | |||||||||
|
|
|
|
|
|
|
|
|
|
|
|||||||||||
| December 31, 2014 |
Current Service Cost |
Past Service Cost |
Gain or Loss on Settlement |
Net Interest on the Net Defined Benefit Liability |
Remeasurements of the Net Defined Benefit Liability |
|||||||||||||||
| Pension and retirement plans |
Ps. | 221 | Ps. | 54 | Ps. | (193 | ) | Ps. | 279 | Ps. | 998 | |||||||||
| Seniority premiums |
75 | 9 | (27 | ) | 28 | 76 | ||||||||||||||
| Postretirement medical services |
10 | — | — | 16 | 74 | |||||||||||||||
| Post-employment Venezuela |
24 | — | — | 18 | 99 | |||||||||||||||
|
|
|
|
|
|
|
|
|
|
|
|||||||||||
| Total |
Ps. | 330 | Ps. | 63 | Ps. | (220 | ) | Ps. | 341 | Ps. | 1,247 | |||||||||
|
|
|
|
|
|
|
|
|
|
|
|||||||||||
| December 31, 2013 |
Current Service Cost |
Past Service Cost |
Gain or Loss on Settlement |
Net Interest on the Net Defined Benefit Liability(1) |
Remeasurements of the Net Defined Benefit Liability |
|||||||||||||||
| Pension and retirement plans |
Ps. | 220 | Ps. | 12 | Ps. | (7 | ) | Ps. | 164 | Ps. | 470 | |||||||||
| Seniority premiums |
55 | — | — | 22 | 44 | |||||||||||||||
| Postretirement medical services |
11 | — | — | 15 | 14 | |||||||||||||||
| Post-employment Venezuela |
48 | — | — | 67 | 312 | |||||||||||||||
|
|
|
|
|
|
|
|
|
|
|
|||||||||||
| Total |
Ps. | 334 | Ps. | 12 | Ps. | (7 | ) | Ps. | 268 | Ps. | 840 | |||||||||
|
|
|
|
|
|
|
|
|
|
|
|||||||||||
| (1) | Interest due to asset ceiling amounted to Ps. 8 in 2013. |
| (2) | Amounts accumulated in other comprehensive income as of the end of the period. |
For the years ended December 31, 2015, 2014 and 2013, current service cost of Ps. 343, Ps. 330 and Ps. 334 has been included in the consolidated income statement as cost of goods sold, administration and selling expenses.
Remeasurements of the net defined benefit liability recognized in other comprehensive income are as follows:
| December 31, 2015 |
December 31, 2014 |
December 31, 2013 |
||||||||||
| Amount accumulated in other comprehensive income as of the beginning of the period, net of tax |
Ps. | 951 | Ps. | 585 | Ps. | 469 | ||||||
| Actuarial losses arising from exchange rates |
(12 | ) | (173 | ) | (26 | ) | ||||||
| Remeasurements during the year, net of tax |
(46 | ) | 318 | 251 | ||||||||
| Actuarial gains arising from changes in demographic assumptions |
— | 41 | — | |||||||||
| Actuarial gains and (losses) arising from changes in financial assumptions |
(77 | ) | 171 | (109 | ) | |||||||
|
|
|
|
|
|
|
|||||||
| Amount accumulated in other comprehensive income as of the end of the period, net of tax |
Ps. | 816 | Ps. | 942 | Ps. | 585 | ||||||
|
|
|
|
|
|
|
|||||||
F-65
Remeasurements of the net defined benefit liability include the following:
| • | The return on plan assets, excluding amounts included in interest expense. |
| • | Actuarial gains and losses arising from changes in demographic assumptions. |
| • | Actuarial gains and losses arising from changes in financial assumptions. |
16.5 Changes in the balance of the defined benefit obligation for post-employment
| December 31, 2015 |
December 31, 2014 |
December 31, 2013 |
||||||||||
| Pension and Retirement Plans: |
||||||||||||
| Initial balance |
Ps. | 5,270 | Ps. | 4,866 | Ps. | 4,495 | ||||||
| Current service cost |
233 | 221 | 220 | |||||||||
| Past service cost |
3 | 54 | — | |||||||||
| Interest expense |
353 | 353 | 311 | |||||||||
| Settlement |
— | (482 | ) | (7 | ) | |||||||
| Effect on curtailment |
(120 | ) | — | — | ||||||||
| Remeasurements of the net defined benefit obligation |
(154 | ) | 378 | (143 | ) | |||||||
| Foreign exchange loss (gain) |
39 | 42 | (60 | ) | ||||||||
| Benefits paid |
(316 | ) | (162 | ) | (152 | ) | ||||||
| Plan amendments |
— | — | 28 | |||||||||
| Acquisitions |
— | — | 174 | |||||||||
|
|
|
|
|
|
|
|||||||
| Ending balance |
Ps. | 5,308 | Ps. | 5,270 | Ps. | 4,866 | ||||||
|
|
|
|
|
|
|
|||||||
| Seniority Premiums: |
||||||||||||
| Initial balance |
Ps. | 563 | Ps. | 475 | Ps. | 324 | ||||||
| Current service cost |
88 | 75 | 55 | |||||||||
| Past service cost |
— | 9 | — | |||||||||
| Interest expense |
38 | 33 | 24 | |||||||||
| Settlement |
— | (27 | ) | — | ||||||||
| Effect on curtailment |
(9 | ) | — | — | ||||||||
| Remeasurements of the net defined benefit obligation |
(34 | ) | 29 | 2 | ||||||||
| Benefits paid |
(45 | ) | (37 | ) | (36 | ) | ||||||
| Acquisitions |
9 | 6 | 106 | |||||||||
|
|
|
|
|
|
|
|||||||
| Ending balance |
Ps. | 610 | Ps. | 563 | Ps. | 475 | ||||||
|
|
|
|
|
|
|
|||||||
| Postretirement Medical Services: |
||||||||||||
| Initial balance |
Ps. | 338 | Ps. | 267 | Ps. | 267 | ||||||
| Current service cost |
16 | 10 | 11 | |||||||||
| Interest expense |
26 | 20 | 17 | |||||||||
| Remeasurements of the net defined benefit obligation |
44 | 60 | (11 | ) | ||||||||
| Benefits paid |
(20 | ) | (19 | ) | (17 | ) | ||||||
|
|
|
|
|
|
|
|||||||
| Ending balance |
Ps. | 404 | Ps. | 338 | Ps. | 267 | ||||||
|
|
|
|
|
|
|
|||||||
| Post-employment: |
||||||||||||
| Initial balance |
Ps. | 194 | Ps. | 743 | Ps. | 594 | ||||||
| Current service cost |
5 | 24 | 48 | |||||||||
| Certain liability cost |
73 | — | — | |||||||||
| Interest expense |
— | 18 | 67 | |||||||||
| Remeasurements of the net defined benefit obligation |
— | 54 | 238 | |||||||||
| Foreign exchange (gain) |
(137 | ) | (638 | ) | (187 | ) | ||||||
| Benefits paid |
— | (7 | ) | (17 | ) | |||||||
|
|
|
|
|
|
|
|||||||
| Ending balance |
Ps. | 135 | Ps. | 194 | Ps. | 743 | ||||||
|
|
|
|
|
|
|
|||||||
F-66
16.6 Changes in the balance of plan assets
| December 31, 2015 |
December 31, 2014 |
December 31, 2013 |
||||||||||
| Total Plan Assets: |
||||||||||||
| Initial balance |
Ps. | 2,158 | Ps. | 2,371 | Ps. | 2,110 | ||||||
| Actual return on trust assets |
65 | 133 | 29 | |||||||||
| Foreign exchange loss (gain) |
7 | (8 | ) | (73 | ) | |||||||
| Life annuities |
61 | 197 | 88 | |||||||||
| Benefits paid |
(63 | ) | — | — | ||||||||
| Acquisitions |
— | — | 201 | |||||||||
| Plan amendments |
— | — | 16 | |||||||||
| Effect due to settlement |
— | (535 | ) | — | ||||||||
|
|
|
|
|
|
|
|||||||
| Ending balance |
Ps. | 2,228 | Ps. | 2,158 | Ps. | 2,371 | ||||||
|
|
|
|
|
|
|
|||||||
As a result of the Company’s investments in life annuities plan, management does not expect it will need to make material contributions to plan assets in order to meet its future obligations.
16.7 Variation in assumptions
The Company decided that the relevant actuarial assumptions that are subject to sensitivity and valuated through the projected unit credit method, are the discount rate, the salary increase rate and healthcare cost increase rate. The reasons for choosing these assumptions are as follows:
| • | Discount rate: The rate that determines the value of the obligations over time. |
| • | Salary increase rate: The rate that considers the salary increase which implies an increase in the benefit payable. |
| • | Healthcare cost increase rate: The rate that considers the trends of health care costs which implies an impact on the postretirement medical service obligations and the cost for the year. |
F-67
The following table presents the amount of defined benefit plan expense and OCI impact in absolute terms of a variation of 0.5% in the assumptions on the net defined benefit liability associated with the Company’s defined benefit plans. The sensitivity of this 0.5% on the significant actuarial assumptions is based on a projected long-term discount rates to Mexico and a yield curve projections of long-term sovereign bonds:
| +0.5%: |
Income Statement | OCI (1) | ||||||||||||||||||
| Discount rate used to calculate the defined benefit obligation and the net interest on the net defined benefit liability |
Current Service Cost |
Past Service Cost |
Gain or Loss on Settlement or Curtailment |
Effect of Net Interest on the Net Defined Benefit Liability (Asset) |
Remeasurements of the Net Defined Benefit Liability (Asset) |
|||||||||||||||
| Pension and retirement plans |
Ps. | 218 | Ps. | 3 | Ps. | (111 | ) | Ps. | 208 | Ps. | 588 | |||||||||
| Seniority premiums |
82 | — | (9 | ) | 31 | 11 | ||||||||||||||
| Postretirement medical services |
14 | — | — | 19 | 105 | |||||||||||||||
| Post-employment |
— | — | — | — | — | |||||||||||||||
|
|
|
|
|
|
|
|
|
|
|
|||||||||||
| Total |
Ps. | 314 | Ps. | 3 | Ps. | (120 | ) | Ps. | 258 | Ps. | 704 | |||||||||
|
|
|
|
|
|
|
|
|
|
|
|||||||||||
| Expected salary increase |
||||||||||||||||||||
| Pension and retirement plans |
Ps. | 249 | Ps. | 3 | Ps. | (130 | ) | Ps. | 232 | Ps. | 951 | |||||||||
| Seniority premiums |
90 | — | (10 | ) | 33 | 82 | ||||||||||||||
| Postretirement medical services |
16 | — | — | 23 | 119 | |||||||||||||||
| Post-employment |
— | — | — | — | — | |||||||||||||||
|
|
|
|
|
|
|
|
|
|
|
|||||||||||
| Total |
Ps. | 355 | Ps. | 3 | Ps. | (140 | ) | Ps. | 288 | Ps. | 1,152 | |||||||||
|
|
|
|
|
|
|
|
|
|
|
|||||||||||
| Assumed rate of increase in healthcare costs |
||||||||||||||||||||
| Postretirement medical services |
Ps. | 17 | Ps. | — | Ps. | — | Ps. | 23 | Ps. | 134 | ||||||||||
|
|
|
|
|
|
|
|
|
|
|
|||||||||||
| -0.5%: |
||||||||||||||||||||
| Discount rate used to calculate the defined benefit obligation and the net interest on the net defined benefit liability |
Current Service Cost |
Past Service Cost |
Gain or Loss on Settlement or Curtailment |
Effect of Net Interest on the Net Defined Benefit Liability (Asset) |
Remeasurements of the Net Defined Benefit Liability (Asset) |
|||||||||||||||
| Pension and retirement plans |
Ps. | 249 | Ps. | 3 | Ps. | (130 | ) | Ps. | 216 | Ps. | 1,001 | |||||||||
| Seniority premiums |
94 | — | (10 | ) | 32 | 80 | ||||||||||||||
| Postretirement medical services |
17 | — | — | 24 | 136 | |||||||||||||||
| Post-employment |
— | — | — | — | — | |||||||||||||||
|
|
|
|
|
|
|
|
|
|
|
|||||||||||
| Total |
Ps. | 360 | Ps. | 3 | Ps. | (140 | ) | Ps. | 272 | Ps. | 1,217 | |||||||||
|
|
|
|
|
|
|
|
|
|
|
|||||||||||
| Expected salary increase |
||||||||||||||||||||
| Pension and retirement plans |
Ps. | 218 | Ps. | 3 | Ps. | (111 | ) | Ps. | 195 | Ps. | 609 | |||||||||
| Seniority premiums |
87 | — | (9 | ) | 31 | 10 | ||||||||||||||
| Postretirement medical services |
16 | — | — | 23 | 119 | |||||||||||||||
| Post-employment |
— | — | — | — | — | |||||||||||||||
|
|
|
|
|
|
|
|
|
|
|
|||||||||||
| Total |
Ps. | 321 | Ps. | 3 | Ps. | (120 | ) | Ps. | 249 | Ps. | 738 | |||||||||
|
|
|
|
|
|
|
|
|
|
|
|||||||||||
| Assumed rate of increase in healthcare costs |
||||||||||||||||||||
| Postretirement medical services |
Ps. | 14 | Ps. | — | Ps. | — | Ps. | 20 | Ps. | 105 | ||||||||||
| (1) | Amounts accumulated in other comprehensive income as of the end of the period. |
F-68
16.8 Employee benefits expense
For the years ended December 31, 2015, 2014 and 2013, employee benefits expenses recognized in the consolidated income statements are as follows:
| 2015 | 2014 | 2013 | ||||||||||
| Wages and salaries |
Ps | .39,459 | Ps. | 35,659 | Ps. | 36,995 | ||||||
| Social security costs |
6,114 | 5,872 | 5,741 | |||||||||
| Employee profit sharing |
1,243 | 1,138 | 1,936 | |||||||||
| Post employment benefits |
493 | 514 | 607 | |||||||||
| Share-based payments |
463 | 283 | 306 | |||||||||
| Termination benefits |
503 | 431 | 480 | |||||||||
|
|
|
|
|
|
|
|||||||
| Ps. | 48,275 | Ps. | 43,897 | Ps. | 46,065 | |||||||
|
|
|
|
|
|
|
|||||||
Note 17. Bonus Programs
17.1 Quantitative and qualitative objectives
The bonus program for executives is based on complying with certain goals established annually by management, which include quantitative and qualitative objectives, and special projects.
The quantitative objectives represent approximately 50% of the bonus, and are based on the Economic Value Added (“EVA”) methodology. The objective established for the executives at each entity is based on a combination of the EVA generated per entity and the EVA generated by the Company, calculated at approximately 70% and 30%, respectively. The qualitative objectives and special projects represent the remaining 50% of the annual bonus and are based on the critical success factors established at the beginning of the year for each executive.
The bonus amount is determined based on each eligible participant’s level of responsibility and based on the EVA generated by the applicable business unit the employee works for. This formula is established by considering the level of responsibility within the organization, the employees’ evaluation and competitive compensation in the market. The bonus is granted to the eligible employee on an annual basis and after withholding applicable taxes.
17.2 Share-based payment bonus plan
The Company has implemented a stock incentive plan for the benefit of its senior executives. As discussed above, this plan uses as its main evaluation metric the EVA. Under the EVA stock incentive plan, eligible employees are entitled to receive a special annual bonus (fixed amount), to be paid in shares of FEMSA or Coca-Cola FEMSA, as applicable or stock options (the plan considers providing stock options to employees; however, since inception only shares of FEMSA or Coca-Cola FEMSA have been granted).
The plan is managed by FEMSA’s chief executive officer (CEO), with the support of the board of directors, together with the CEO of the respective sub-holding company. FEMSA’s Board of Directors is responsible for approving the plan’s structure, and the annual amount of the bonus. Each year, FEMSA’s CEO in conjunction with the Evaluation and Compensation Committee of the board of directors and the CEO of the respective sub-holding company determine the employees eligible to
F-69
participate in the plan and the bonus formula to determine the number of shares to be received. Until 2015 the shares were vested ratably over a six year period, beginning with January 01, 2016 onwards they will ratably vest over a four year period, with retrospective effects. Early December 31, 2015, the Company and the eligible employee agree to the share-based payment arrangement, being when it and the counterparty have a shared understanding of the terms and conditions of the arrangement. FEMSA accounts for its share-based payment bonus plan as an equity-settled share based payment transaction as it will ultimately settle its obligations with its employees by issuing its own shares or those of its subsidiary Coca-Cola FEMSA.
The Company contributes the individual employee’s special bonus (after taxes) in cash to the Administrative Trust (which is controlled and consolidated by FEMSA), who then uses the funds to purchase FEMSA or Coca-Cola FEMSA shares (as instructed by the Administrative Trust’s Technical Committee), which are then allocated to such employee. The Administrative Trust tracks the individual employees’ account balance. FEMSA created the Administrative Trust with the objective of administering the purchase of FEMSA and Coca-Cola FEMSA shares by each of its subsidiaries with eligible executives participating in the stock incentive plan. The Administrative Trust’s objectives are to acquire FEMSA shares, or shares of Coca-Cola FEMSA and to manage the shares granted to the individual employees based on instructions set forth by the Technical Committee. Once the shares are acquired following the Technical Committee’s instructions, the Administrative Trust assigns to each participant their respective rights. As the trust is controlled and therefore consolidated by FEMSA, shares purchased in the market and held within the Administrative Trust are presented as treasury stock (as it relates to FEMSA’s shares) or as a reduction of the noncontrolling interest (as it relates to Coca-Cola FEMSA’s shares) in the consolidated statement of changes in equity, on the line issuance (repurchase) of shares associated with share-based payment plans. Should an employee leave prior to their shares vesting, they would lose the rights to such shares, which would then remain within the Administrative Trust and be able to be reallocated to other eligible employees as determined by the Company. The incentive plan target is expressed in months of salary, and the final amount payable is computed based on a percentage of compliance with the goals established every year. For the years ended December 31, 2015, 2014 and 2013, the compensation expense recorded in the consolidated income statement amounted to Ps. 463, Ps. 283 and Ps. 306, respectively.
All shares held in the Administrative Trust are considered outstanding for diluted earnings per share purposes and dividends on shares held by the trust are charged to retained earnings.
As of December 31, 2015 and 2014, the number of shares held by the trust associated with the Company’s share based payment plans is as follows:
| Number of Shares | ||||||||||||||||
| FEMSA UBD | KOFL | |||||||||||||||
| 2015 | 2014 | 2015 | 2014 | |||||||||||||
| Beginning balance |
4,763,755 | 7,001,428 | 1,298,533 | 1,780,064 | ||||||||||||
|
|
|
|
|
|
|
|
|
|||||||||
| Shares acquired by the administrative trust to employees |
1,491,330 | 517,855 | 466,036 | 330,730 | ||||||||||||
|
|
|
|
|
|
|
|
|
|||||||||
| Shares released from administrative trust to employees upon vesting |
(2,008,293 | ) | (2,755,528 | ) | (604,258 | ) | (812,261 | ) | ||||||||
|
|
|
|
|
|
|
|
|
|||||||||
| Forfeitures |
— | — | — | — | ||||||||||||
|
|
|
|
|
|
|
|
|
|||||||||
| Ending balance |
4,246,792 | 4,763,755 | 1,160,311 | 1,298,533 | ||||||||||||
|
|
|
|
|
|
|
|
|
|||||||||
The fair value of the shares held by the trust as of the end of December 31, 2015 and 2014 was Ps. 830 and Ps. 788, respectively, based on quoted market prices of those dates.
F-70
Note 18. Bank Loans and Notes Payables
| (in millions of Mexican pesos) |
At December 31,(1) | 2021 and Thereafter |
Carrying Value at December 31, 2015 |
Fair Value at December 31, 2015 |
Carrying Value at December 31, 2014(1) |
|||||||||||||||||||||||||||||||
| 2016 | 2017 | 2018 | 2019 | 2020 | ||||||||||||||||||||||||||||||||
| Short-term debt: |
||||||||||||||||||||||||||||||||||||
| Fixed rate debt: |
||||||||||||||||||||||||||||||||||||
| Colombian pesos |
||||||||||||||||||||||||||||||||||||
| Bank loans |
Ps. | 219 | Ps. | — | Ps. | — | Ps. | — | Ps. | — | Ps. | — | Ps. | 219 | Ps. | 220 | Ps. | — | ||||||||||||||||||
| Interest rate |
6.5 | % | — | — | — | — | — | 6.5 | % | — | — | |||||||||||||||||||||||||
| Argentine pesos |
||||||||||||||||||||||||||||||||||||
| Notes payable |
165 | — | — | — | — | — | 165 | 164 | 301 | |||||||||||||||||||||||||||
| Interest rate |
26.2 | % | — | — | — | — | — | 26.2 | % | — | 30.9 | % | ||||||||||||||||||||||||
| Chilean pesos |
||||||||||||||||||||||||||||||||||||
| Bank loans |
1,442 | — | — | — | — | — | 1,442 | 1,442 | — | |||||||||||||||||||||||||||
| Interest rate |
4.2 | % | — | — | — | — | — | 4.2 | % | — | — | |||||||||||||||||||||||||
| Finance leases |
10 | — | — | — | — | — | 10 | 10 | — | |||||||||||||||||||||||||||
| Interest rate |
2.4 | % | — | — | — | — | — | 2.4 | % | — | — | |||||||||||||||||||||||||
| Variable rate debt: |
||||||||||||||||||||||||||||||||||||
| Colombian pesos |
||||||||||||||||||||||||||||||||||||
| Bank loans |
235 | — | — | — | — | — | 235 | 235 | — | |||||||||||||||||||||||||||
| Interest rate |
8.2 | % | — | — | — | — | — | 8.2 | % | — | — | |||||||||||||||||||||||||
| Brazilian Reais |
||||||||||||||||||||||||||||||||||||
| Bank loans |
168 | — | — | — | — | — | 168 | 168 | 148 | |||||||||||||||||||||||||||
| Interest rate |
14.8 | % | — | — | — | — | — | 14.8 | % | — | 12.6 | % | ||||||||||||||||||||||||
|
|
|
|
|
|
|
|
|
|
|
|
|
|
|
|
|
|
|
|||||||||||||||||||
| Total short-term debt |
Ps. | 2,239 | Ps. | — | Ps. | — | Ps. | — | Ps. | — | Ps. | — | Ps. | 2,239 | Ps. | 2,239 | Ps. | 449 | ||||||||||||||||||
|
|
|
|
|
|
|
|
|
|
|
|
|
|
|
|
|
|
|
|||||||||||||||||||
| Long-term debt: |
||||||||||||||||||||||||||||||||||||
| Fixed rate debt: |
||||||||||||||||||||||||||||||||||||
| U.S. dollars |
||||||||||||||||||||||||||||||||||||
| Yankee bond |
Ps. | — | Ps. | — | Ps. | 17,158 | Ps. | — | Ps. | 8,566 | Ps. | 25,609 | Ps. | 51,333 | Ps. | 52,990 | Ps. | 43,893 | ||||||||||||||||||
| Interest rate |
— | — | 2.4 | % | — | 4.6 | % | 4.4 | % | 3.8 | % | — | 3.8 | % | ||||||||||||||||||||||
| Bank of NY (FEMSA USD 2023) |
— | — | — | — | 5,068 | 5,068 | 4,852 | 4,308 | ||||||||||||||||||||||||||||
| Interest rate |
— | — | — | — | — | 2.9 | % | 2.9 | % | — | 2.9 | % | ||||||||||||||||||||||||
| Bank of NY (FEMSA USD 2043) |
— | — | — | — | 11,675 | 11,675 | 10,737 | 9,900 | ||||||||||||||||||||||||||||
| Interest rate |
— | — | — | — | — | 4.4 | % | 4.4 | % | — | 4.4 | % | ||||||||||||||||||||||||
| Bank loans |
— | — | — | — | — | — | — | — | 30 | |||||||||||||||||||||||||||
| Interest rate |
— | — | — | — | — | — | — | — | 3.9 | % | ||||||||||||||||||||||||||
| Mexican pesos |
||||||||||||||||||||||||||||||||||||
| Units of investment (UDIs) |
— | 3,385 | — | — | — | — | 3,385 | 3,385 | 3,599 | |||||||||||||||||||||||||||
| Interest rate |
— | 4.2 | % | — | — | — | — | 4.2 | % | — | 4.2 | % | ||||||||||||||||||||||||
| Domestic senior notes |
— | — | — | — | — | 9,989 | 9,989 | 9,527 | 9,988 | |||||||||||||||||||||||||||
| Interest rate |
— | — | — | — | — | 6.2 | % | 6.2 | % | — | 6.2 | % | ||||||||||||||||||||||||
| Brazilian reais |
||||||||||||||||||||||||||||||||||||
| Bank loans |
174 | 187 | 151 | 116 | 80 | 111 | 819 | 653 | 601 | |||||||||||||||||||||||||||
| Interest rate |
5.4 | % | 5.7 | % | 6.3 | % | 6.6 | % | 6.7 | % | 5.6 | % | 6.0 | % | — | 4.6 | % | |||||||||||||||||||
| Finance leases |
67 | 66 | 65 | 62 | 51 | 149 | 460 | 356 | 762 | |||||||||||||||||||||||||||
| Interest rate |
4.6 | % | 4.6 | % | 4.6 | % | 4.6 | % | 4.6 | % | 4.6 | % | 4.6 | % | — | 4.6 | % | |||||||||||||||||||
| Argentine pesos |
||||||||||||||||||||||||||||||||||||
| Bank loans |
18 | — | — | — | — | — | 18 | 17 | 309 | |||||||||||||||||||||||||||
| Interest rate |
15.3 | % | — | — | — | — | — | 15.3 | % | — | 26.8 | % | ||||||||||||||||||||||||
| Chilean pesos |
||||||||||||||||||||||||||||||||||||
| Bank loans |
120 | 82 | 30 | — | — | — | 232 | 232 | — | |||||||||||||||||||||||||||
| Interest rate |
7.3 | % | 7.6 | % | 7.9 | % | — | — | — | 7.5 | % | — | — | |||||||||||||||||||||||
| Finance leases |
14 | 15 | 16 | 17 | 18 | 12 | 92 | 92 | — | |||||||||||||||||||||||||||
| Interest rate |
3.6 | % | 3.6 | % | 3.5 | % | 3.5 | % | 3.3 | % | 3.2 | % | 3.4 | % | — | — | ||||||||||||||||||||
|
|
|
|
|
|
|
|
|
|
|
|
|
|
|
|
|
|
|
|||||||||||||||||||
| Subtotal |
Ps. | 393 | Ps. | 3,735 | Ps. | 17,420 | Ps. | 195 | Ps. | 8,715 | Ps. | 52,613 | Ps. | 83,071 | Ps. | 82,841 | Ps. | 73,390 | ||||||||||||||||||
|
|
|
|
|
|
|
|
|
|
|
|
|
|
|
|
|
|
|
|||||||||||||||||||
| (1) | All interest rates shown in this table are weighted average contractual annual rates. |
F-71
| (in millions of Mexican pesos) |
At December 31,(1) | 2021 and Thereafter |
Carrying Value at December 31, 2015 |
Fair Value at December 31, 2015 |
Carrying Value at December 31, 2014(1) |
|||||||||||||||||||||||||||||||
| 2016 | 2017 | 2018 | 2019 | 2020 | ||||||||||||||||||||||||||||||||
| Variable rate debt: |
||||||||||||||||||||||||||||||||||||
| U.S. dollars |
||||||||||||||||||||||||||||||||||||
| Bank loans |
Ps. | — | Ps. | — | Ps. | — | Ps. | — | Ps. | — | Ps. | — | Ps. | — | Ps. | — | Ps. | 6,956 | ||||||||||||||||||
| Interest rate |
— | — | — | — | — | — | — | — | 0.9 | % | ||||||||||||||||||||||||||
| Mexican pesos |
||||||||||||||||||||||||||||||||||||
| Domestic senior notes |
2,496 | — | — | — | — | — | 2,496 | 2,500 | 2,473 | |||||||||||||||||||||||||||
| Interest rate |
3.6 | % | — | — | — | — | — | 3.6 | % | — | 3.4 | % | ||||||||||||||||||||||||
| Argentine pesos |
||||||||||||||||||||||||||||||||||||
| Bank loans |
82 | 41 | — | — | — | — | 123 | 120 | 232 | |||||||||||||||||||||||||||
| Interest rate |
32.2 | % | 32.2 | % | — | — | — | — | 32.2 | % | — | 21.5 | % | |||||||||||||||||||||||
| Brazilian reais |
||||||||||||||||||||||||||||||||||||
| Bank loans |
189 | 107 | 107 | 107 | 74 | — | 584 | 511 | 156 | |||||||||||||||||||||||||||
| Interest rate |
11.9 | % | 9.2 | % | 9.2 | % | 9.2 | % | 9.2 | % | — | 10.1 | % | — | 6.7 | % | ||||||||||||||||||||
| Finance leases |
— | — | — | — | — | — | — | — | 63 | |||||||||||||||||||||||||||
| Interest rate |
— | — | — | — | — | — | — | — | 10.0 | % | ||||||||||||||||||||||||||
| Colombian pesos |
||||||||||||||||||||||||||||||||||||
| Bank loans |
280 | 684 | 54 | 53 | 53 | 52 | 1,176 | 1,165 | 769 | |||||||||||||||||||||||||||
| Interest rate |
6.9 | % | 6.5 | % | 8.0 | % | 8.0 | % | 8.0 | % | 8.2 | % | 6.9 | % | — | 5.9 | % | |||||||||||||||||||
| Finance leases |
0.04 | 0.04 | 0.05 | 0.05 | 0.01 | — | 0.19 | 0.19 | — | |||||||||||||||||||||||||||
| Interest rate |
8.4 | % | 8.4 | % | 8.4 | % | 8.4 | % | 8.4 | % | — | 8.4 | % | — | — | |||||||||||||||||||||
| Chilean pesos |
||||||||||||||||||||||||||||||||||||
| Bank loans |
216 | 283 | 374 | 358 | 549 | 395 | 2,175 | 2,175 | — | |||||||||||||||||||||||||||
| Interest rate |
6.2 | % | 6.3 | % | 6.2 | % | 6.2 | % | 5.7 | % | 5.9 | % | 6.0 | % | — | — | ||||||||||||||||||||
|
|
|
|
|
|
|
|
|
|
|
|
|
|
|
|
|
|
|
|||||||||||||||||||
| Subtotal |
Ps. | 3,263 | Ps. | 1,115 | Ps. | 535 | Ps. | 518 | Ps. | 676 | Ps. | 447 | Ps. | 6,554 | Ps. | 6,471 | Ps. | 10,649 | ||||||||||||||||||
|
|
|
|
|
|
|
|
|
|
|
|
|
|
|
|
|
|
|
|||||||||||||||||||
| Total long-term debt |
Ps. | 3,656 | Ps. | 4,850 | Ps. | 17,955 | Ps. | 713 | Ps. | 9,391 | Ps. | 53,060 | Ps. | 89,625 | Ps. | 89,312 | Ps. | 84,039 | ||||||||||||||||||
|
|
|
|
|
|
|
|
|
|
|
|
|
|
|
|
|
|
|
|||||||||||||||||||
| Current portion of long term debt |
(3,656 | ) | (1,104 | ) | ||||||||||||||||||||||||||||||||
|
|
|
|
|
|||||||||||||||||||||||||||||||||
| Ps. | 85,969 | Ps. | 82,935 | |||||||||||||||||||||||||||||||||
|
|
|
|
|
|||||||||||||||||||||||||||||||||
| (1) | All interest rates shown in this table are weighted average contractual annual rates. |
F-72
| Hedging Derivative Financial Instruments (1) |
2016 | 2017 | 2018 | 2019 | 2020 | 2021 and Thereafter |
Total 2015 |
Total 2014 |
||||||||||||||||||||||||
| (notional amounts in millions of Mexican pesos) | ||||||||||||||||||||||||||||||||
| Cross currency swaps: |
||||||||||||||||||||||||||||||||
| Units of investments to Mexican pesos and variable rate: |
||||||||||||||||||||||||||||||||
| Fixed to variable(2) |
Ps. | — | Ps. | 2,500 | Ps. | — | Ps. | — | Ps. | — | Ps. | — | Ps. | 2,500 | Ps. | 2,500 | ||||||||||||||||
| Interest pay rate |
— | 3.4 | % | — | — | — | — | 3.4 | % | 3.1 | % | |||||||||||||||||||||
| Interest receive rate |
— | 4.2 | % | — | — | — | — | 4.2 | % | 4.2 | % | |||||||||||||||||||||
| U.S. dollars to Mexican pesos |
||||||||||||||||||||||||||||||||
| Fixed to variable(3) |
— | — | — | — | — | 11,403 | 11,403 | 11,403 | ||||||||||||||||||||||||
| Interest pay rate |
— | — | — | — | — | 4.8 | % | 4.8 | % | 4.6 | % | |||||||||||||||||||||
| Interest receive rate |
— | — | — | — | — | 4.0 | % | 4.0 | % | 4.0 | % | |||||||||||||||||||||
| Variable to fixed |
— | — | 7,571 | — | — | — | 7,571 | 6,476 | ||||||||||||||||||||||||
| Interest pay rate |
— | — | 3.5 | % | — | — | — | 3.5 | % | 3.2 | % | |||||||||||||||||||||
| Interest receive rate |
— | — | 2.4 | % | — | — | — | 2.4 | % | 2.4 | % | |||||||||||||||||||||
| Fixed to fixed |
— | — | — | — | — | 1,267 | 1,267 | 1,267 | ||||||||||||||||||||||||
| Interest pay rate |
— | — | — | — | — | 5.7 | % | 5.7 | % | 5.7 | % | |||||||||||||||||||||
| Interest receive rate |
— | — | — | — | — | 2.9 | % | 2.9 | % | 2.9 | % | |||||||||||||||||||||
| U.S. dollars to Brazilian reais |
||||||||||||||||||||||||||||||||
| Fixed to variable |
— | — | 5,592 | — | — | — | 5,592 | 6,653 | ||||||||||||||||||||||||
| Interest pay rate |
— | — | 12.7 | % | — | — | — | 12.7 | % | 11.3 | % | |||||||||||||||||||||
| Interest receive rate |
— | — | 2.7 | % | — | — | — | 2.7 | % | 2.7 | % | |||||||||||||||||||||
| Variable to variable |
— | — | 17,551 | — | — | — | 17,551 | 20,311 | ||||||||||||||||||||||||
| Interest pay rate |
— | — | 12.6 | % | — | — | — | 12.6 | % | 11.3 | % | |||||||||||||||||||||
| Interest receive rate |
— | — | 2.1 | % | — | — | — | 2.1 | % | 1.5 | % | |||||||||||||||||||||
| Chilean pesos |
||||||||||||||||||||||||||||||||
| Variable to fixed |
— | — | — | — | 1,097 | — | 1,097 | — | ||||||||||||||||||||||||
| Interest pay rate |
— | — | — | — | 6.9 | % | — | 6.9 | % | — | ||||||||||||||||||||||
| Interest receive rate |
— | — | — | — | 6.8 | % | — | 6.8 | % | — | ||||||||||||||||||||||
|
|
|
|
|
|
|
|
|
|
|
|
|
|
|
|
|
|||||||||||||||||
| Interest rate swap: |
||||||||||||||||||||||||||||||||
| Mexican pesos |
||||||||||||||||||||||||||||||||
| Variable to fixed rate: |
— | — | — | 76 | — | 1,197 | 1,273 | — | ||||||||||||||||||||||||
| Interest pay rate |
— | — | — | 6.5 | % | — | 7.1 | % | 7.0 | % | — | |||||||||||||||||||||
| Interest receive rate |
— | — | — | 4.5 | % | — | 5.5 | % | 5.5 | % | — | |||||||||||||||||||||
| Variable to fixed rate(2): |
||||||||||||||||||||||||||||||||
| Interest pay rate |
— | 5.2 | % | — | — | — | — | 5.2 | % | 5.0 | % | |||||||||||||||||||||
| Interest receive rate |
— | 3.4 | % | — | — | — | — | 3.4 | % | 3.2 | % | |||||||||||||||||||||
| Variable to fixed rate(3): |
||||||||||||||||||||||||||||||||
| Interest pay rate |
— | — | — | — | — | 7.2 | % | 7.2 | % | 7.2 | % | |||||||||||||||||||||
| Interest receive rate |
— | — | — | — | — | 4.8 | % | 4.8 | % | 4.6 | % | |||||||||||||||||||||
| (1) | All interest rates shown in this table are weighted average contractual annual rates. |
| (2) | Interest rate swaps with a notional amount of Ps. 1,250 that receive a variable rate of 3.4% and pay a fixed rate of 5.2%; joined with a cross currency swap of the same notional amount, which covers units of investments to Mexican pesos, that receives a fixed rate of 4.2% and pays a variable rate of 3.4%. |
| (3) | Interest rate swaps with a notional amount of Ps. 11,403 that receive a variable rate of 4.8% and pay a fixed rate of 7.2%; joined with a cross currency swap of the same notional amount, which covers U.S. dollars to Mexican pesos, that receives a fixed rate of 4.0% and pay a variable rate of 4.8%. |
F-73
For the years ended December 31, 2015, 2014 and 2013, the interest expense is comprised as follows:
| 2015 | 2014 | 2013 | ||||||||||
| Interest on debts and borrowings |
Ps. | 4,586 | Ps. | 3,992 | Ps. | 3,055 | ||||||
| Finance charges payable under capitalized interest |
(60 | ) | (117 | ) | (59 | ) | ||||||
| Finance charges for employee benefits |
276 | 341 | 268 | |||||||||
| Derivative instruments |
2,894 | 2,413 | 825 | |||||||||
| Finance operating charges |
79 | 66 | 225 | |||||||||
| Finance charges payable under finance leases |
2 | 6 | 17 | |||||||||
|
|
|
|
|
|
|
|||||||
| Ps. | 7,777 | Ps. | 6,701 | Ps. | 4,331 | |||||||
|
|
|
|
|
|
|
|||||||
On May 7, 2013, the Company issued long-term debt on the NYSE in the amount of $1,000, which was made up of senior notes of $300 with a maturity of 10 years and a fixed interest rate of 2.875%; and senior notes of $700 with a maturity of 30 years and a fixed interest rate of 4.375%. After the issuance, the Company contracted cross-currency swaps to reduce its exposure to risk of exchange rate and interest rate fluctuations associated with this issuance, see Note 20.
In November, 2013, Coca-Cola FEMSA issued U.S. $1,000 in aggregate principal amount of 2.375% senior notes due 2018, U.S. $750 in aggregate principal amount of 3.875% senior notes due 2023 and U.S. $400 in aggregate principal amount of 5.250% senior notes due 2043, in an SEC registered offering. These notes are guaranteed by its subsidiaries: Propimex, S. de R.L. de C.V., Comercializadora La Pureza de Bebidas, S. de R.L. de C.V., Controladora Interamericana de Bebidas, S. de R.L. de C.V., Grupo Embotellador Cimsa, S. de R.L. de C.V., Refrescos Victoria del Centro, S. de R.L. de C.V., Servicios Integrados Inmuebles del Golfo, S. de R.L. de C.V. and Yoli de Acapulco, S.A. de C.V. (“Guarantors”).
On December 4, 2007, the Company obtained the approval from the National Banking and Securities Commission (Comisión Nacional Bancaria y de Valores or “CNBV”) for the issuance of long-term domestic senior notes (“Certificados Bursátiles”) in the amount of Ps. 10,000 (nominal amount) or its equivalent in investment units. As of December 31, 2014 the Company has issued the following domestic senior notes: i) on December 7, 2007, the Company issued domestic senior notes composed of Ps. 3,500 (nominal amount) with a maturity date on November 29, 2013 and a floating interest rate, which was paid at maturiry; ii) on December 7, 2007, the Company issued domestic senior notes in the amount of 637,587,000 investment units (Ps. 2,500 nominal amount), with a maturity date on November 24, 2017 and a fixed interest rate.
Coca-Cola FEMSA has the following debt bonds: a) registered with the Mexican stock exchange: i) Ps. 2,500 (nominal amount) with a maturity date in 2016 and a variable interest rate, ii) Ps. 2,500 (nominal amount) with a maturity date in 2021 and fixed interest rate of 8.27% and iii) Ps. 7,500 (nominal amount) with a maturity date in 2023 and fixed interest rate of 5.46%; and b) registered with the SEC: i) Senior notes of U.S. $500 with interest at a fixed rate of 4.63% and maturity date on February 15, 2020, ii) Senior notes of U.S. $1,000 with interest at a fixed rate of 2.38% and maturity date on November 26, 2018, iii) Senior notes of U.S. $900 with interest at a fixed rate of 3.88% and maturity date on November 26, 2023 and iv) Senior notes of U.S. $600 with interest at a fixed rate of 5.25% and maturity date on November 26, 2043 all of which are guaranteed by Coca-Cola FEMSA subsidiaries: Propimex, S. de R.L. de C.V., Comercializadora La Pureza de Bebidas, S. de R.L. de C.V., Controladora Interamericana de Bebidas, S. de R.L. de C.V., Grupo Embotellador Cimsa, S. de R.L. de C.V., Refrescos Victoria del Centro, S. de R.L. de C.V., Distribuidora y Manufacturera del Valle de Mexico, S. de R.L. de C.V (as successor guarantor of Servicios Integrados Inmuebles del Golfo, S. de R.L. de C.V.) and Yoli de Acapulco, S. de R.L. de C.V. (“Guarantors”).
F-74
The Company has financing from different institutions under agreements that stipulate different restrictions and covenants, which mainly consist of maximum levels of leverage and capitalization as well as minimum consolidated net worth and debt and interest coverage ratios. As of the date of these consolidated financial statements, the Company was in compliance with all restrictions and covenants contained in its financing agreements.
In January 13, 2014, Coca-Cola FEMSA issued an additional U.S. $350 million of senior notes comprised of 10 year and 30 year bonds. The interest rates and maturity dates of the new notes are the same as those of the initial 2013 notes offering. These notes are also guaranteed by the same Guarantors.
In February 2014, Coca-Cola FEMSA prepaid in full outstanding Bank loans denominated in pesos for a total amount of Ps. 4,175 (nominal amount).
In December 2015, Coca-Cola FEMSA prepaid in full outstanding Bank loans denominated in U.S. million dolars for a total amount of $450 (nominal amount).
Note 19. Other Income and Expenses
| 2015 | 2014 | 2013 | ||||||||||
| Gain on sale of shares (see Note 4) |
Ps. | 14 | Ps. | — | Ps. | — | ||||||
| Gain on sale of long-lived assets |
249 | — | 41 | |||||||||
| Gain on sale of other assets |
— | 276 | 170 | |||||||||
| Sale of waste material |
41 | 44 | 43 | |||||||||
| Write off-contingencies (see Note 25.5) |
— | 475 | 120 | |||||||||
| Recoveries from previous years |
16 | 89 | — | |||||||||
| Insurance rebates |
17 | 18 | — | |||||||||
| Others |
86 | 196 | 277 | |||||||||
|
|
|
|
|
|
|
|||||||
| Other income |
Ps. | 423 | Ps. | 1,098 | Ps. | 651 | ||||||
|
|
|
|
|
|
|
|||||||
| Contingencies associated with prior acquisitions or disposals |
Ps. | 93 | Ps. | — | Ps. | 385 | ||||||
| Loss on sale of long-lived assets |
— | 7 | — | |||||||||
| Impairment of long-lived assets |
134 | 145 | — | |||||||||
| Disposal of long-lived assets (1) |
416 | 153 | 122 | |||||||||
| Foreign exchange losses related to operating activities |
917 | 147 | 99 | |||||||||
| Securities taxes from Colombia |
30 | 69 | 51 | |||||||||
| Severance payments |
285 | 277 | 190 | |||||||||
| Donations |
362 | 172 | 119 | |||||||||
| Legal fees and other expenses from past acquisitions |
223 | 31 | 110 | |||||||||
| Other |
281 | 276 | 363 | |||||||||
|
|
|
|
|
|
|
|||||||
| Other expenses |
Ps. | 2,741 | Ps. | 1,277 | Ps. | 1,439 | ||||||
|
|
|
|
|
|
|
|||||||
| (1) | Charges related to fixed assets retirement from ordinary operations and other long-lived assets. |
F-75
Note 20. Financial Instruments
Fair Value of Financial Instruments
The Company measures the fair value of its financial assets and liabilities classified as level 2 applying the income approach method, which estimates the fair value based on expected cash flows discounted to net present value. The following table summarizes the Company’s financial assets and liabilities measured at fair value, as of December 31, 2015 and 2014:
| December 31, 2015 | December 31, 2014 | |||||||||||||||
| Level 1 | Level 2 | Level 1 | Level 2 | |||||||||||||
| Derivative financial instrument (current asset) |
— | 523 | — | 384 | ||||||||||||
| Derivative financial instrument (non-current asset) |
— | 8,377 | — | 6,299 | ||||||||||||
| Derivative financial instrument (current liability) |
270 | 89 | 313 | 34 | ||||||||||||
| Derivative financial instrument (non-current liability) |
— | 277 | 112 | 39 | ||||||||||||
20.1 Total debt
The fair value of bank and syndicated loans is calculated based on the discounted value of contractual cash flows whereby the discount rate is estimated using rates currently offered for debt of similar amounts and maturities, which is considered to be level 2 in the fair value hierarchy. The fair value of the Company’s publicly traded debt is based on quoted market prices as of December 31, 2015 and 2014, which is considered to be level 1 in the fair value hierarchy.
| 2015 | 2014 | |||||||
| Carrying value |
Ps. | 91,864 | Ps. | 84,488 | ||||
| Fair value |
91,551 | 86,595 | ||||||
20.2 Interest rate swaps
The Company uses interest rate swaps to offset the interest rate risk associated with its borrowings, pursuant to which it pays amounts based on a fixed rate and receives amounts based on a floating rate. These instruments have been designated as cash flow hedges and are recognized in the consolidated statement of financial position at their estimated fair value. The fair value is estimated using formal technical models. The valuation method involves discounting to present value the expected cash flows of interest, calculated from the rate curve of the cash flow currency, and expresses the net result in the reporting currency. Changes in fair value are recorded in cumulative other comprehensive income, net of taxes until such time as the hedged amount is recorded in the consolidated income statements.
F-76
At December 31, 2015, the Company has the following outstanding interest rate swap agreements:
| Maturity Date |
Notional Amount |
Fair Value Liability December 31, 2015 |
Fair Value Asset December 31, 2015 |
|||||||||
| 2017 |
Ps. | 1,250 | Ps. | (36 | ) | Ps. | — | |||||
| 2019 |
76 | (3 | ) | — | ||||||||
| 2021 |
623 | (62 | ) | — | ||||||||
| 2022 |
574 | (9 | ) | — | ||||||||
| 2023 |
11,403 | — | 89 | |||||||||
At December 31, 2014 the Company has the following outstanding interest rate swap agreements:
| Maturity Date |
Notional Amount |
Fair Value Liability December 31, 2014 |
Fair Value Asset December 31, 2014 |
|||||||||
| 2017 |
Ps. | 1,250 | Ps. | (35 | ) | Ps. | — | |||||
| 2023 |
11,403 | (4 | ) | 12 | ||||||||
The net effect of expired contracts treated as hedges are recognized as interest expense within the consolidated income statements.
20.3 Forward agreements to purchase foreign currency
The Company has entered into forward agreements to reduce its exposure to the risk of exchange rate fluctuations between the Mexican peso and other currencies. Foreign exchange forward contracts measured at fair value are designated hedging instruments in cash flow hedges of forecast inflows in Euros and forecast purchases of raw materials in U.S. dollars. These forecast transactions are highly probable.
These instruments have been designated as cash flow hedges and are recognized in the consolidated statement of financial position at their estimated fair value which is determined based on prevailing market exchange rates to terminate the contracts at the end of the period. The price agreed in the instrument is compared to the current price of the market forward currency and is discounted to present value of the rate curve of the relevant currency. Changes in the fair value of these forwards are recorded as part of cumulative other comprehensive income, net of taxes. Net gain/loss on expired contracts is recognized as part of cost of goods sold when the raw material is included in sale transaction, and as a part of foreign exchange when the inflow in Euros are received.
At December 31, 2015, the Company had the following outstanding forward agreements to purchase foreign currency:
| Maturity Date |
Notional Amount |
Fair Value Liability December 31, 2015 |
Fair Value Asset December 31, 2015 |
|||||||||
| 2016 |
Ps. | 6,735 | Ps. | (84 | ) | Ps. | 383 | |||||
At December 31, 2014, the Company had the following outstanding forward agreements to purchase foreign currency:
| Maturity Date |
Notional Amount |
Fair Value Liability December 31, 2014 |
Fair Value Asset December 31, 2014 |
|||||||||
| 2015 |
Ps. | 4,411 | Ps. | — | Ps. | 298 | ||||||
| 2016 |
1,192 | (26 | ) | — | ||||||||
F-77
20.4 Options to purchase foreign currency
The Company has executed call option and collar strategies to reduce its exposure to the risk of exchange rate fluctuations. A call option is an instrument that limits the loss in case of foreign currency depreciation. A collar is a strategy that combines call and put options, limiting the exposure to the risk of exchange rate fluctuations in a similar way as a forward agreement.
These instruments have been designated as cash flow hedges and are recognized in the consolidated statement of financial position at their estimated fair value which is determined based on prevailing market exchange rates to terminate the contracts at the end of the period. Changes in the fair value of these options, corresponding to the intrinsic value, are initially recorded as part of “cumulative other comprehensive income”. Changes in the fair value, corresponding to the extrinsic value, are recorded in the consolidated income statements under the caption “market value gain/ (loss) on financial instruments,” as part of the consolidated net income. Net gain/(loss) on expired contracts including the net premium paid, is recognized as part of cost of goods sold when the hedged item is recorded in the consolidated income statements.
At December 31, 2015, the Company paid a net premium of Ps. 75 millions for the following outstanding call options to purchase foreign currency:
| Maturity Date |
Notional Amount |
Fair Value Liability December 31, 2015 |
Fair Value Asset December 31, 2015 |
|||||||||
| 2016 |
Ps. | 1,612 | Ps. | — | Ps. | 65 | ||||||
At December 31, 2014, the Company had the following outstanding collars agreements to purchase foreign currency:
| Maturity Date |
Notional Amount |
Fair Value Liability December 31, 2014 |
Fair Value Asset December 31, 2014 |
|||||||||
| 2015 |
Ps. | 402 | Ps. | — | Ps. | 56 | ||||||
20.5 Cross-currency swaps
The Company has contracted for a number of cross-currency swaps to reduce its exposure to risks of exchange rate and interest rate fluctuations associated with its borrowings denominated in U.S. dollars and other foreign currencies. Cross-Currency swaps contracts are designated as hedging instruments through which the Company changes the debt profile to its functional currency to reduce exchange exposure.
These instruments are recognized in the consolidated statement of financial position at their estimated fair value which is estimated using formal technical models. The valuation method involves discounting to present value the expected cash flows of interest, calculated from the rate curve of the cash foreign currency, and expresses the net result in the reporting currency. These contracts are designated as financial instuments at fair valuethrough profit or loss. The fair values changes related to those cross currency swaps are recorded under the caption “market value gain (loss) on financial instruments,” net of changes related to the long-term liability, within the consolidated income statements.
The Company has cross-currency contracts designated as cash flow hedges and are recognized in the consolidated statement of financial position at their estimated fair value. Changes in fair value are recorded in cumulative other comprehensive income, net of taxes until such time as the hedge amount is recorded in the consolidated income statement.
F-78
At December 31, 2015, the Company had the following outstanding cross currency swap agreements:
| Maturity Date |
Notional Amount |
Fair Value Liability 2015 |
Fair Value Asset December 31, 2015 |
|||||||||
| 2017 |
Ps. | 2,711 | Ps. | — | Ps. | 1,159 | ||||||
| 2018 |
30,714 | — | 2,216 | |||||||||
| 2020 |
4,034 | (116 | ) | — | ||||||||
| 2023 |
12,670 | — | 4,859 | |||||||||
At December 31, 2014, the Company had the following outstanding cross currency swap agreements:
| Maturity Date |
Notional Amount |
Fair Value Liability December 31, 2014 |
Fair Value Asset December 31, 2014 |
|||||||||
| 2015 |
Ps. | 30 | Ps. | — | Ps. | 6 | ||||||
| 2017 |
2,711 | — | 1,209 | |||||||||
| 2018 |
33,410 | — | 3,002 | |||||||||
| 2019 |
369 | — | 15 | |||||||||
| 2023 |
12,670 | — | 2,060 | |||||||||
20.6 Commodity price contracts
The Company has entered into various commodity price contracts to reduce its exposure to the risk of fluctuation in the costs of certain raw material. The fair value is estimated based on the market valuations to terminate the contracts at the end of the period. These instruments are designated as Cash Flow Hedges and the changes in the fair value are recorded as part of “cumulative other comprehensive income.”
The fair value of expired commodity price contract was recorded in cost of goods sold where the hedged item was recorded.
At December 31, 2015, Coca-Cola FEMSA had the following sugar price contracts:
| Maturity Date |
Notional Amount |
Fair Value Liability December 31 2015 |
||||||
| 2016 |
Ps. | 1,497 | Ps. | (190 | ) | |||
At December 31, 2015, Coca-Cola FEMSA had the following aluminum price contracts:
| Maturity Date |
Notional Amount |
Fair Value Liability December 31, 2015 |
||||||
| 2016 |
Ps. | 436 | Ps. | (84 | ) | |||
F-79
At December 31, 2014, Coca-Cola FEMSA had the following sugar price contracts:
| Maturity Date |
Notional Amount |
Fair Value Liability December 31, 2014 |
||||||
| 2015 |
Ps. | 1,341 | Ps. | (285 | ) | |||
| 2016 |
952 | (101 | ) | |||||
| 2017 |
37 | (2 | ) | |||||
At December 31, 2014, Coca-Cola FEMSA had the following aluminum price contracts:
| Maturity Date |
Notional Amount |
Fair Value Liability December 31, 2014 |
||||||
| 2015 |
Ps. | 361 | Ps. | (12 | ) | |||
| 2016 |
177 | (9 | ) | |||||
20.7 Financial Instruments for CCFPI acquisition:
The Company’s call option related to the remaining 49% ownership interest in CCFPI is measured at fair value in its financial statements using a Level 3 concept. The call option had an estimated fair value of approximately Ps. 859 million at inception of the option, and approximately Ps. 456 million and Ps. 755 million as of December 31, 2015 and 2014, respectively. Significant observable inputs into that Level 3 estimate include the call option’s expected term (7 years at inception), risk free rate as expected return (LIBOR), a volatility (14.17%) and the underlying enterprise value of the CCFPI. The enterprise value of CCFPI for the purpose of this estimate was based on CCFPI’s long-term business plan. The Company uses Black & Scholes valuation technique to measure call option value. The Company acquired its 51% ownership interest in CCFPI in January 2013 and continues to integrate CCFPI into its global operations using the equity method of accounting, and currently believes that the underlying exercise price of the call option is “out of the money”. The Level 3 fair value of the Company’s put option related to its 51% ownership interest approximates zero as its exercise price as defined in the contract adjusts proportionately to the underlying fair value of CCFPI.
The Company estimates that the call option is “out of the money” as of December 31, 2015 and 2014. As of December 31, 2015 and 2014, the call option is “out of the money” by approximately 13.89% and 17.71% or U.S. $90 million and U.S. $107 million, respectively, with respect to the strike price.
20.8 Net effects of expired contracts that met hedging criteria
| Type of Derivatives |
Impact in Consolidated Income Statement |
2015 | 2014 | 2013 | ||||||||||
| Interest rate swaps |
Interest expense | Ps. | — | Ps. | 337 | Ps. | 214 | |||||||
| Cross currency swap (1) |
Interest expense | 2,595 | — | — | ||||||||||
| Cross currency swap (1) |
Foreign exchange | (10,911 | ) | — | — | |||||||||
| Forward agreements to purchase foreign currency |
Foreign exchange | (180 | ) | 38 | (1,710 | ) | ||||||||
| Commodity price contracts |
Cost of goods sold | 619 | 291 | 362 | ||||||||||
| Options to purchase foreign currency |
Cost of goods sold | (21 | ) | — | — | |||||||||
| Forward agreements to purchase foreign currency |
Cost of goods sold | (523 | ) | 22 | — | |||||||||
| (1) | This amount corresponds to the settlement of cross currency swaps portfolio in Brazil presented as part of the other financial activities in the consolidated statements of cash flow. |
F-80
20.9 Net effect of changes in fair value of derivative financial instruments that did not meet the hedging criteria for accounting purposes
| Type of Derivatives |
Impact in Consolidated |
2015 | 2014 | 2013 | ||||||||||
| Interest rate swaps |
Market value | Ps. | — | Ps. | 10 | Ps. | (7 | ) | ||||||
| Cross currency swaps |
gain (loss) on | (20 | ) | 59 | 33 | |||||||||
| Others |
financial instruments | 56 | 3 | (19 | ) | |||||||||
20.10 Net effect of expired contracts that did not meet the hedging criteria for accounting purposes
| Type of Derivatives |
Impact in Consolidated |
2015 | 2014 | 2013 | ||||||||||
| Cross-currency swaps |
Market value | Ps. | 204 | Ps. | — | Ps. | — | |||||||
20.11 Market risk
Market risk is the risk that the fair value of future cash flow of a financial instrument will fluctuate because of changes in market prices. Market prices include currency risk and commodity price risk.
The Company’s activities expose it primarily to the financial risks of changes in foreign currency exchange rates and commodity prices. The Company enters into a variety of derivative financial instruments to manage its exposure to foreign currency risk, and commodity prices risk including:
| • | Forward Agreements to Purchase Foreign Currency in order to reduce its exposure to the risk of exchange rate fluctuations. |
| • | Cross-Currency Swaps in order to reduce its exposure to the risk of exchange rate fluctuations. |
| • | Commodity price contracts in order to reduce its exposure to the risk of fluctuation in the costs of certain raw materials. |
The Company tracks the fair value (mark to market) of its derivative financial instruments and its possible changes using scenario analyses.
F-81
The following disclosures provide a sensitivity analysis of the market risks management considered to be reasonably possible at the end of the reporting period, which the Company is exposed to as it relates to foreign exchange rates and commodity prices, which it considers in its existing hedging strategy:
| Foreign Currency Risk |
Change in Exchange Rate |
Effect on Equity |
Effect on Profit or Loss |
|||||||||
| 2015 |
||||||||||||
| FEMSA (1) |
+14% MXN/EUR | Ps. | (319 | ) | Ps. | — | ||||||
| +10% CLP/USD | (9 | ) | — | |||||||||
| -10% CLP/USD | 9 | — | ||||||||||
| -14% MXN/EUR | 319 | — | ||||||||||
| Coca-Cola FEMSA |
+11% MXN/USD | (197 | ) | — | ||||||||
| +21% BRL/USD | (387 | ) | — | |||||||||
| +17% COP/USD | (113 | ) | — | |||||||||
| +36% ARS/USD | (231 | ) | — | |||||||||
| -11% MXN/USD | 197 | — | ||||||||||
| -21% BRL/USD | 387 | — | ||||||||||
| -17% COP/USD | 113 | — | ||||||||||
| -36% ARS/USD | 231 | — | ||||||||||
| 2014 |
||||||||||||
| FEMSA (1) |
+9% MXN/EUR | Ps. | (278 | ) | Ps. | — | ||||||
| -9% MXN/EUR | 278 | — | ||||||||||
| Coca-Cola FEMSA |
+7% MXN/USD | 119 | — | |||||||||
| +14% BRL/USD | 96 | — | ||||||||||
| +9% COP/USD | 42 | — | ||||||||||
| +11% ARS/USD | 22 | — | ||||||||||
| -7% MXN/USD | (119 | ) | — | |||||||||
| -14% BRL/USD | (96 | ) | — | |||||||||
| -9% COP/USD | (42 | ) | — | |||||||||
| -11% ARS/USD | (22 | ) | — | |||||||||
| 2013 |
||||||||||||
| FEMSA (1) |
+7% MXN/EUR | Ps. | (157 | ) | Ps. | — | ||||||
| -7%MXN/EUR | 157 | — | ||||||||||
| Coca-Cola FEMSA |
+11% MXN/USD | 67 | — | |||||||||
| +13% BRL/USD | 86 | — | ||||||||||
| +6% COP/USD | 19 | — | ||||||||||
| -11% MXN/USD | (67 | ) | — | |||||||||
| -13% BRL/USD | (86 | ) | — | |||||||||
| -6% COP/USD | (19 | ) | — | |||||||||
| (1) | Does not include Coca-Cola FEMSA. |
F-82
| Cross Currency Swaps (1) (2) |
Change in Exchange Rate |
Effect on Equity |
Effect on Profit or Loss |
|||||||||
| 2015 |
||||||||||||
| FEMSA (3) |
-11% MXN/USD | Ps. | — | Ps. | (2,043 | ) | ||||||
| +11% MXN/USD | — | 2,043 | ||||||||||
| Coca-Cola FEMSA |
-11% MXN/USD | — | (938 | ) | ||||||||
| -21% BRL/USD | (4,517 | ) | (1,086 | ) | ||||||||
| +11% MXN/USD | — | 938 | ||||||||||
| +21% BRL/USD | 4,517 | 1,086 | ||||||||||
| 2014 |
||||||||||||
| FEMSA (3) |
-7% MXN/USD | Ps. | — | Ps. | (1,100 | ) | ||||||
| +7% MXN/USD | — | 1,100 | ||||||||||
| Coca-Cola FEMSA |
-7% MXN/USD | — | (481 | ) | ||||||||
| -14% BRL/USD | — | (3,935 | ) | |||||||||
| +7% MXN/USD | — | 415 | ||||||||||
| +14% BRL/USD | — | 2,990 | ||||||||||
| 2013 |
||||||||||||
| FEMSA (3) |
-11% MXN/USD | Ps. | — | Ps. | (1,581 | ) | ||||||
| Coca-Cola FEMSA |
-11% MXN/USD | — | (392 | ) | ||||||||
| -13% BRL/USD | — | (3,719 | ) | |||||||||
| Net Cash in Foreign Currency (1) |
Change in Exchange Rate |
Effect on Profit or Loss |
||||||
| 2015 |
||||||||
| FEMSA (3) |
+14% EUR/+11%USD | Ps. | 504 | |||||
| -14% EUR/ -11%USD | (504 | ) | ||||||
| Coca-Cola FEMSA |
+11%USD | (1,112 | ) | |||||
| -11%USD | 1,112 | |||||||
| 2014 |
||||||||
| FEMSA (3) |
+9% EUR/+7%USD | Ps. | 233 | |||||
| -9% EUR/-7%USD | (233 | ) | ||||||
| Coca-Cola FEMSA |
+7%USD | (747 | ) | |||||
| -7%USD | 747 | |||||||
| 2013 |
||||||||
| FEMSA (3) |
+7% EUR/+11% USD | Ps. | 335 | |||||
| -7% EUR/-11% USD | (335 | ) | ||||||
| Coca-Cola FEMSA |
+11% USD | (1,090 | ) | |||||
| -11% USD | 1,090 | |||||||
| (1) | The sensitivity analysis effects include all subsidiaries of the Company. |
| (2) | Includes the sensitivity analysis effects of all derivative financial instruments related to foreign exchange risk. |
| (3) | Does not include Coca-Cola FEMSA. |
F-83
| Commodity Price Contracts (1) |
Change in U.S.$ Rate |
Effect on Equity |
||||||
| 2015 |
||||||||
| Coca-Cola FEMSA |
Sugar - 31 | % | Ps. | (406 | ) | |||
| Aluminum - 18 | % | (58 | ) | |||||
| 2014 |
||||||||
| Coca-Cola FEMSA |
Sugar - 27 | % | Ps. | (528 | ) | |||
| Aluminum - 17 | % | (87 | ) | |||||
| 2013 |
||||||||
| Coca-Cola FEMSA |
Sugar - 18 | % | Ps. | (298 | ) | |||
| Aluminum - 19 | % | (36 | ) | |||||
| (1) | Effects on commoditie price contracts are only in Coca-Cola FEMSA. |
20.12 Interest rate risk
Interest rate risk is the risk that the fair value or future cash flow of a financial instrument will fluctuate because of changes in market interest rates.
The Company is exposed to interest rate risk because it and its subsidiaries borrow funds at both fixed and variable interest rates. The risk is managed by the Company by maintaining an appropriate mix between fixed and variable rate borrowings, and by the use of the different derivative financial instruments. Hedging activities are evaluated regularly to align with interest rate views and defined risk appetite, ensuring the most cost-effective hedging strategies are applied.
The following disclosures provide a sensitivity analysis of the interest rate risks management considered to be reasonably possible at the end of the reporting period, which the Company is exposed to as it relates to its fixed and floating rate borrowings, which it considers in its existing hedging strategy:
| Interest Rate Swap (1) |
Change in Bps. |
Effect on Equity |
||||||
| 2015 |
||||||||
| FEMSA(2) |
(100 Bps. | ) | Ps. | (542 | ) | |||
| Coca-Cola FEMSA |
— | — | ||||||
| 2014 |
||||||||
| FEMSA(2) |
(100 Bps. | ) | Ps. | (528 | ) | |||
| Coca-Cola FEMSA |
— | — | ||||||
| 2013 |
||||||||
| FEMSA(2) |
— | — | ||||||
| Coca-Cola FEMSA |
(100 Bps. | ) | Ps. | (32 | ) | |||
| (1) | The sensitivity analysis effects include all subsidiaries of the Company. |
| (2) | Does not include Coca-Cola FEMSA. |
F-84
| Interest Effect of Unhedged Portion Bank Loans |
2015 | 2014 | 2013 | |||||||||
| Change in interest rate |
+100 Bps. | +100 Bps. | +100 Bps. | |||||||||
| Effect on profit loss |
Ps. | (192 | ) | Ps. | (244 | ) | Ps. | (332 | ) | |||
20.13 Liquidity risk
Each of the Company’s sub-holding companies generally finances its operational and capital requirements on an independent basis. As of December 31, 2015 and 2014, 82.66% and 80.66%, respectively of the Company’s outstanding consolidated total indebtedness was at the level of its sub-holding companies. This structure is attributable, in part, to the inclusion of third parties in the capital structure of Coca-Cola FEMSA. Currently, the Company’s management expects to continue financing its operations and capital requirements when it is considering domestic funding at the level of its sub-holding companies, otherwise; it is generally more convenient that its foreign operations would be financed directly through the Company because of better market conditions obtained by itself. Nonetheless, sub-holdings companies may decide to incur indebtedness in the future to finance their own operations and capital requirements of the Company’s subsidiaries or significant acquisitions, investments or capital expenditures. As a holding company, the Company depends on dividends and other distributions from its subsidiaries to service the Company’s indebtedness.
The Company’s principal source of liquidity has generally been cash generated from its operations. The Company has traditionally been able to rely on cash generated from operations because a significant majority of the sales of Coca-Cola FEMSA and FEMSA Comercio are on a cash or short-term credit basis, and FEMSA Comercio’s OXXO stores are able to finance a significant portion of their initial and ongoing inventories with supplier credit. The Company’s principal use of cash has generally been for capital expenditure programs, acquisitions, debt repayment and dividend payments.
Ultimate responsibility for liquidity risk management rests with the Company’s board of directors, which has established an appropriate liquidity risk management framework for the management of the Company’s short-, medium- and long-term funding and liquidity requirements. The Company manages liquidity risk by maintaining adequate cash reserves and continuously monitoring forecast and actual cash flows, and with a low concentration of maturities per year.
The Company has access to credit from national and international bank institutions in order to meet treasury needs; besides, the Company has the highest rating for Mexican companies (AAA) given by independent rating agencies, allowing the Company to evaluate capital markets in case it needs resources.
As part of the Company’s financing policy, management expects to continue financing its liquidity needs with cash from operations. Nonetheless, as a result of regulations in certain countries in which the Company operates, it may not be
F-85
beneficial or, as in the case of exchange controls in Venezuela, practicable to remit cash generated in local operations to fund cash requirements in other countries. Exchange controls like those in Venezuela may also increase the real price of remitting cash from operations to fund debt requirements in other countries. In the event that cash from operations in these countries is not sufficient to fund future working capital requirements and capital expenditures, management may decide, or be required, to fund cash requirements in these countries through local borrowings rather than remitting funds another country. In addition, the Company’s liquidity in Venezuela could be affected by changes in the rules applicable to exchange rates as well as other regulations, such as exchange controls. In the future the Company management may finance its working capital and capital expenditure needs with short-term or other borrowings.
The Company’s management continuously evaluates opportunities to pursue acquisitions or engage in joint ventures or other transactions. We would expect to finance any significant future transactions with a combination of cash from operations, long-term indebtedness and capital stock.
The Company’s sub-holding companies generally incur short-term indebtedness in the event that they are temporarily unable to finance operations or meet any capital requirements with cash from operations. A significant decline in the business of any of the Company’s sub-holding companies may affect the sub-holding company’s ability to fund its capital requirements. A significant and prolonged deterioration in the economies in which we operate or in the Company’s businesses may affect the Company’s ability to obtain short-term and long-term credit or to refinance existing indebtedness on terms satisfactory to the Company’s management.
The Company presents the maturity dates associated with its long-term financial liabilities as of December 31, 2015, see Note 18. The Company generally makes payments associated with its long-term financial liabilities with cash generated from its operations.
The following table reflects all contractually fixed pay-offs for settlement, repayments and interest resulting from recognized financial liabilities. It includes expected net cash outflows from derivative financial liabilities that are in place as of December 31, 2015. Such expected net cash outflows are determined based on each particular settlement date of an instrument. The amounts disclosed are undiscounted net cash outflows for the respective upcoming fiscal years, based on the earliest date on which the Company could be required to pay. Cash outflows for financial liabilities (including interest) without fixed amount or timing are based on economic conditions (like interest rates and foreign exchange rates) existing at December 31, 2015.
| 2016 | 2017 | 2018 | 2019 | 2020 | 2021 and thereafter |
|||||||||||||||||||
| Non-derivative financial liabilities: |
||||||||||||||||||||||||
| Notes and bonds |
Ps. | 5,929 | Ps. | 6,760 | Ps. | 20,286 | Ps. | 2,763 | Ps. | 11,024 | Ps. | 81,339 | ||||||||||||
| Loans from banks |
3,522 | 1,763 | 964 | 818 | 869 | 627 | ||||||||||||||||||
| Obligations under finance leases |
112 | 100 | 96 | 92 | 77 | 172 | ||||||||||||||||||
| Derivative financial liabilities |
2,615 | 1,757 | (55 | ) | 318 | 292 | (4,294 | ) | ||||||||||||||||
The Company generally makes payments associated with its non-current financial liabilities with cash generated from its operations.
20.14 Credit risk
Credit risk refers to the risk that a counterparty will default on its contractual obligations resulting in financial loss to the Company. The Company has adopted a policy of only dealing with creditworthy counterparties, where appropriate, as a
F-86
means of mitigating the risk of financial loss from defaults. The Company only transacts with entities that are rated the equivalent of investment grade and above. This information is supplied by independent rating agencies where available and, if not available, the Company uses other publicly available financial information and its own trading records to rate its major customers. The Company’s exposure and the credit ratings of its counterparties are continuously monitored and the aggregate value of transactions concluded is spread amongst approved counterparties. Credit exposure is controlled by counterparty limits that are reviewed and approved by the risk management committee.
The Company has a high receivable turnover; hence management believes credit risk is minimal due to the nature of its businesses, which have a large portion of their sales settled in cash. The Company’s maximum exposure to credit risk for the components of the statement of financial position at 31 December 2015 and 2014 is the carrying amounts (see Note 7).
The credit risk on derivative financial instruments is limited because the counterparties are banks with high credit-ratings assigned by international credit-rating agencies.
The Company manages the credit risk related to its derivative portfolio by only entering into transactions with reputable and credit-worthy counterparties as well as by maintaining in some cases a Credit Support Annex (CSA) that establishes margin requirements, which could change upon changes to the credit ratings given to the Company by independent rating agencies. As of December 31, 2015, the Company concluded that the maximum exposure to credit risk related with derivative financial instruments is not significant given the high credit rating of its counterparties.
Note 21. Non-Controlling Interest in Consolidated Subsidiaries
An analysis of FEMSA’s non-controlling interest in its consolidated subsidiaries for the years ended December 31, 2015 and 2014 is as follows:
| December 31, 2015 |
December 31, 2014 |
|||||||
| Coca-Cola FEMSA |
Ps. | 58,340 | Ps. | 59,202 | ||||
| Other |
1,992 | 447 | ||||||
|
|
|
|
|
|||||
| Ps. | 60,332 | Ps. | 59,649 | |||||
|
|
|
|
|
|||||
The changes in the FEMSA’s non-controlling interest were as follows:
| 2015 | 2014 | 2013 | ||||||||||
| Balance at beginning of the year |
Ps. | 59,649 | Ps. | 63,158 | Ps. | 54,902 | ||||||
| Net income of non controlling interest (1) |
5,593 | 5,929 | 6,233 | |||||||||
| Other comprehensive loss: |
(2,999 | ) | (6,265 | ) | (910 | ) | ||||||
| Exchange differences on translation of foreign operation |
(3,110 | ) | (6,264 | ) | (664 | ) | ||||||
| Remeasurements of the net defined benefits liability |
75 | (110 | ) | (80 | ) | |||||||
| Valuation of the effective portion of derivative financial instruments |
36 | 109 | (166 | ) | ||||||||
| Increase in capital stock |
— | — | 515 | |||||||||
| Acquisitions effects |
1,133 | — | 5,550 | |||||||||
| Contribution from non-controlling interest |
250 | — | — | |||||||||
| Dividends |
(3,351 | ) | (3,152 | ) | (3,125 | ) | ||||||
| Share based payment |
57 | (21 | ) | (7 | ) | |||||||
|
|
|
|
|
|
|
|||||||
| Balance at end of the year |
Ps. | 60,332 | Ps. | 59,649 | Ps. | 63,158 | ||||||
|
|
|
|
|
|
|
|||||||
| (1) | For the years ended at 2015, 2014 and 2013, Coca-Cola FEMSA’s net income allocated to non-controlling interest was Ps. 94, Ps. 424 and Ps. 239, respectively. |
F-87
Non controlling cumulative other comprehensive loss is comprised as follows:
| December 31, 2015 |
December 31, 2014 |
|||||||
| Exchange differences on translation foreign operation |
Ps. | (9,436 | ) | Ps. | (6,326 | ) | ||
| Remeasurements of the net defined benefits liability |
(241 | ) | (316 | ) | ||||
| Valuation of the effective portion of derivative financial instruments |
(93 | ) | (129 | ) | ||||
|
|
|
|
|
|||||
| Cumulative other comprehensive loss |
Ps. | (9,770 | ) | Ps. | (6,771 | ) | ||
|
|
|
|
|
|||||
Coca-Cola FEMSA shareholders, especially the Coca-Cola Company which hold Series D shares, have some protective rights about investing in or disposing of significant businesses. However, these rights do not limit the continued normal operations of Coca-Cola FEMSA.
Summarized financial information in respect of Coca-Cola FEMSA is set out below.
| December 31, 2015 |
December 31, 2014 |
|||||||
| Total current assets |
Ps. | 40,717 | Ps. | 38,128 | ||||
| Total non-current assets |
168,536 | 174,238 | ||||||
| Total current liabilities |
29,484 | 28,403 | ||||||
| Total non-current liabilities |
71,034 | 73,845 | ||||||
| Total revenue |
Ps. | 152,360 | Ps. | 147,298 | ||||
| Total consolidated net income |
10,329 | 10,966 | ||||||
| Total consolidated comprehensive income |
Ps. | 5,033 | Ps. | (1,005 | ) | |||
| Net cash flow from operating activities |
23,519 | 24,406 | ||||||
| Net cash flow from used in investing activities |
(10,945 | ) | (11,137 | ) | ||||
| Net cash flow from financing activities |
(8,567 | ) | (11,350 | ) | ||||
Note 22. Equity
22.1 Equity accounts
The capital stock of FEMSA is comprised of 2,161,177,770 BD units and 1,417,048,500 B units.
As of December 31, 2015 and 2014, the capital stock of FEMSA was comprised 17,891,131,350 common shares, without par value and with no foreign ownership restrictions. Fixed capital stock amounts to Ps. 300 (nominal value) and the variable capital may not exceed 10 times the minimum fixed capital stock amount.
The characteristics of the common shares are as follows:
| • | Series “B” shares, with unlimited voting rights, which at all times must represent a minimum of 51% of total capital stock; |
| • | Series “L” shares, with limited voting rights, which may represent up to 25% of total capital stock; and |
F-88
| • | Series “D” shares, with limited voting rights, which individually or jointly with series “L” shares may represent up to 49% of total capital stock. |
The Series “D” shares are comprised as follows:
| • | Subseries “D-L” shares may represent up to 25% of the series “D” shares; |
| • | Subseries “D-B” shares may comprise the remainder of outstanding series “D” shares; and |
| • | The non-cumulative premium dividend to be paid to series “D” shareholders will be 125% of any dividend paid to series “B” shareholders. |
The Series “B” and “D” shares are linked together in related units as follows:
| • | “B units” each of which represents five series “B” shares and which are traded on the BMV; and |
| • | “BD units” each of which represents one series “B” share, two subseries “D-B” shares and two subseries “D-L” shares, and which are traded both on the BMV and the NYSE. |
As of December 31, 2015 and 2014, FEMSA’s capital stock is comprised as follows:
| “B” Units | “BD” Units | Total | ||||||||||
| Units |
1,417,048,500 | 2,161,177,770 | 3,578,226,270 | |||||||||
|
|
|
|
|
|
|
|||||||
| Shares: |
||||||||||||
| Series “B” |
7,085,242,500 | 2,161,177,770 | 9,246,420,270 | |||||||||
| Series “D” |
— | 8,644,711,080 | 8,644,711,080 | |||||||||
| Subseries “D-B” |
— | 4,322,355,540 | 4,322,355,540 | |||||||||
| Subseries “D-L” |
— | 4,322,355,540 | 4,322,355,540 | |||||||||
|
|
|
|
|
|
|
|||||||
| Total shares |
7,085,242,500 | 10,805,888,850 | 17,891,131,350 | |||||||||
|
|
|
|
|
|
|
|||||||
The net income of the Company is subject to the legal requirement that 5% thereof be transferred to a legal reserve until such reserve equals 20% of capital stock at nominal value. This reserve may not be distributed to shareholders during the existence of the Company, except as a stock dividend. As of December 31, 2015 and 2014, this reserve amounted to Ps. 596.
Retained earnings and other reserves distributed as dividends, as well as the effects derived from capital reductions, are subject to income tax at the rate in effect at the date of distribution, except when capital reductions come from restated shareholder contributions and when the distributions of dividends come from net taxable income, denominated “Cuenta de Utilidad Fiscal Neta” (“CUFIN”).
Dividends paid in excess of CUFIN are subject to income tax at a grossed-up rate based on the current statutory rate. Since 2003, this tax may be credited against the income tax of the year in which the dividends are paid, and in the following two years against the income tax and estimated tax payments. Due to the Mexican Tax Reform, a new Income Tax Law (LISR) went into effect on January 1, 2014. Such law no longer includes the tax consolidation regime which allowed calculating the CUFIN on a consolidated basis; therefore, beginning in 2014, distributed dividends must be taken from the individual CUFIN balance of FEMSA, which can be increased with the subsidiary companies’ individual CUFINES through the transfers of dividends. The sum of the individual CUFIN balances of FEMSA and its subsidiaries as of December 31, 2015 amounted to Ps. 91,248.
In addition, the new LISR sets forth that entities that distribute dividends to its stockholders who are individuals and foreign residents must withhold 10% thereof for ISR purposes, which will be paid in Mexico. The foregoing will not be applicable when distributed dividends arise from the accumulated CUFIN balances as December 31, 2013.
F-89
At an ordinary shareholders’ meeting of FEMSA held on March 15, 2013, the shareholders approved a dividend of Ps. 6,684 that was paid 50% on May 7, 2013 and other 50% on November 7, 2013; and a reserve for share repurchase of a maximum of Ps. 3,000. As of December 31, 2014, the Company has not repurchased shares. Treasury shares resulted from share-based payment bonus plan are disclosed in Note 17.
At an ordinary shareholders’ meeting of FEMSA held on December 6, 2013, the shareholders approved a dividend of
Ps. 6,684 that was paid on December 18, 2013.
At an ordinary shareholders’ meeting of Coca-Cola FEMSA held on March 5, 2013, the shareholders approved a dividend of Ps. 5,950 that was paid 50% on May 2, 2013 and other 50% on November 5, 2013. The corresponding payment to the non-controlling interest was Ps. 3,073.
At an ordinary shareholders’ meeting of Coca-Cola FEMSA held on March 6, 2014, the shareholders approved a dividend of Ps. 6,012 that was paid 50% on May 4, 2014 and other 50% on November 5, 2014. The corresponding payment to the non-controlling interest was Ps. 3,134.
At an ordinary shareholders’ meeting of FEMSA held on March 19, 2015, the shareholders approved a dividend of
Ps. 7,350 that was paid 50% on May 7, 2015 and other 50% on November 5, 2015; and a reserve for share repurchase of a maximum of Ps. 3,000. As of December 31, 2015, the Company has not repurchased shares. Treasury shares resulted from share-based payment bonus plan are disclosed in Note 17.
At an ordinary shareholders’ meeting of Coca-Cola FEMSA held on March 12, 2015, the shareholders approved a dividend of Ps. 6,405 that was paid 50% on May 5, 2015 and other 50% on November 3, 2015. The corresponding payment to the non-controlling interest was Ps. 3,340.
For the years ended December 31, 2015, 2014 and 2013 the dividends declared and paid by the Company and Coca-Cola FEMSA were as follows:
| 2015 | 2014 | 2013 | ||||||||||
| FEMSA |
Ps. | 7,350 | Ps. | — | Ps. | 13,368 | ||||||
| Coca-Cola FEMSA (100% of dividend) |
6,405 | 6,012 | 5,950 | |||||||||
For the years ended December 31, 2015 and 2014 the dividends declared and paid per share by the Company are as follows:
| Series of Shares |
2015 | 2014 | ||||||
| “B” |
Ps.0.36649 | Ps. | — | |||||
| “D” |
0.45811 | — | ||||||
22.2 Capital management
The Company manages its capital to ensure that its subsidiaries will be able to continue as going concerns while maximizing the return to shareholders through the optimization of its debt and equity balance in order to obtain the lowest cost of capital available. The Company manages its capital structure and makes adjustments to it in light of changes in economic conditions. To maintain or adjust the capital structure, the Company may adjust the dividend payment to shareholders, return capital to shareholders or issue new shares. No changes were made in the objectives, policies or processes for managing capital during the years ended December 31, 2015 and 2014.
F-90
The Company is not subject to any externally imposed capital requirements, other than the legal reserve (see Note 22.1) and debt covenants (see Note 18).
The Company’s finance committee reviews the capital structure of the Company on a quarterly basis. As part of this review, the committee considers the cost of capital and the risks associated with each class of capital. In conjunction with this objective, the Company seeks to maintain the highest credit rating both nationally and internationally and is currently rated AAA in Mexico and BBB+ in the United States, which requires it to have a debt to earnings before interest, taxes, depreciation and amortization (“EBITDA”) ratio lower than 2. As a result, prior to entering into new business ventures, acquisitions or divestures, management evaluates the optimal ratio of debt to EBITDA in order to maintain its credit rating.
Note 23. Earnings per Share
Basic earnings per share amounts are calculated by dividing consolidated net income for the year attributable to controlling interest by the weighted average number of shares outstanding during the period adjusted for the weighted average of own shares purchased in the period.
Diluted earnings per share amounts are calculated by dividing consolidated net income for the year attributable to controlling interest by the weighted average number of shares outstanding during the period plus the weighted average number of shares for the effects of dilutive potential shares (originated by the Company’s share based payment program).
| 2015 | 2014 | 2013 | ||||||||||||||||||||||
| Per Series “B” Shares |
Per Series “D” Shares |
Per Series “B” Shares |
Per Series “D” Shares |
Per Series “B” Shares |
Per Series “D” Shares |
|||||||||||||||||||
| Shares expressed in millions: |
||||||||||||||||||||||||
| Weighted average number of shares for basic earnings per share |
9,241.91 | 8,626.69 | 9,240.54 | 8,621.18 | 9,238.69 | 8,613.80 | ||||||||||||||||||
| Effect of dilution associated with non-vested shares for share based payment plans |
4.51 | 18.02 | 5.88 | 23.53 | 7.73 | 30.91 | ||||||||||||||||||
|
|
|
|
|
|
|
|
|
|
|
|
|
|||||||||||||
| Weighted average number of shares adjusted for the effect of dilution (Shares outstanding) |
9,246.42 | 8,644.71 | 9,246.42 | 8,644.71 | 9,246.42 | 8,644.71 | ||||||||||||||||||
| Dividend rights per series |
100 | % | 125 | % | 100 | % | 125 | % | 100 | % | 125 | % | ||||||||||||
|
|
|
|
|
|
|
|
|
|
|
|
|
|||||||||||||
| Weighted average number of shares further adjusted to reflect dividend rights |
9,246.42 | 10,805.89 | 9,246.42 | 10,805.89 | 9,246.42 | 10,805.89 | ||||||||||||||||||
|
|
|
|
|
|
|
|
|
|
|
|
|
|||||||||||||
| Allocation of earnings, weighted |
46.11 | % | 53.89 | % | 46.11 | % | 53.89 | % | 46.11 | % | 53.89 | % | ||||||||||||
|
|
|
|
|
|
|
|
|
|
|
|
|
|||||||||||||
| Net Controlling Interest Income Allocated |
Ps. | 8,153.84 | Ps. | 9,529.04 | Ps. | 7,701.08 | Ps. | 8,999.92 | Ps. | 7,341.74 | Ps. | 8,579.98 | ||||||||||||
|
|
|
|
|
|
|
|
|
|
|
|
|
|||||||||||||
F-91
Note 24. Income Taxes
In December of 2013, the Mexican government enacted a package of tax reforms (the “2014 Tax Reform”) which includes several significant changes to tax laws, discussed in further detail below, entering into effect on January 1, 2014. The following changes are expected to most significantly impact the Company’s financial position and results of operations:
| • | The introduction of a new withholding tax at the rate of 10% for dividends and/or distributions of earnings generated in 2014 and beyond; |
| • | A fee of one Mexican peso per liter on the sale and import of flavored beverages with added sugar, and an excise tax of 8% on food with caloric content equal to, or greater than 275 kilocalories per 100 grams of product; |
| • | The prior 11% value added tax (VAT) rate that applied to transaction in the border region was raised to 16%, matching the general VAT rate applicable in the rest of Mexico; |
| • | The elimination of the tax on cash deposits (IDE) and the business flat tax (IETU); |
| • | Deductions on exempt payroll items for workers are limited to 53%; |
| • | The income tax rate in 2013 was 30%. Scheduled decreases to the income tax rate that would have reduced the rate to 29% in 2014 and 28% in 2015 and thereafter, were canceled in connection with the 2014 Tax Reform; |
| • | The repeal of the existing tax consolidation regime, which was effective as of January 1, 2014, modified the payment term of a tax on assets payable of Ps. 180, which will be paid over the following 5 years instead of an indefinite term. Additionally, deferred tax assets and liabilities associated with the Company’s subsidiaries in Mexico are no longer offset as of December 31, 2015 and 2014, as the future income tax balances are expected to reverse in periods where the Company is no longer consolidating these entities for tax purposes and the right of offset does not exist; and |
| • | The introduction of an new optional tax integration regime (a modified form of tax consolidation), which replaces the previous tax consolidation regime. The new optional tax integration regime requires an equity ownership of at least 80% for qualifying subsidiaries and would allow the Company to defer the annual tax payment of its profitable participating subsidiaries for a period equivalent to 3 years to the extent their individual tax expense exceeds the integrated tax expense of the Company. |
The impacts of the 2014 Tax Reform on the Company’s financial position and results of operations as of and for the year ended December 31, 2013, resulted from the repeal of the tax consolidation regime as described above regarding the payable of Ps. 180 and the effects of the changes in tax rates on deferred tax assets and liabilities as disclosed below, which was recognized in earnings in 2013.
On November 18, 2014, a tax reform became effective in Venezuela. This reform included changes on how the carrying value of operating losses is reported. The reform established that operating losses carried forward year over year (but limited to three fiscal years) may not exceed 25% of the taxable income in the relevant period. The reform also eliminated the possibility to carry over losses relating to inflationary adjustments and included changes that grant Venezuelan tax authorities broader powers and authority in connection with their ability to enact administrative rulings related to income tax withholding and to collect taxes and increase fines and penalties for tax-related violations, including the ability to confiscate assets without a court order.
On December 30, 2015, the Venezuelan government published a tax reform for 2016 which establishes: (i) a new tax on financial transactions that will be effective beginning February 1, 2016, for those identified as “special taxpayers” at a rate of 0.75% over certain financial transactions, including bank withdraws, transfers of bonds and securities, payments of debts not utilizing a bank account and forgiveness of debt; and (ii) elimination of inflationary effects on calculations of income tax.
In Guatemala, the income tax rate for 2014 was 28.0% and it decreased for 2015 to 25.0%, as scheduled.
In 2009, Nicaragua established rules related with transfer pricing. This obligation originally would be effective on January 1, 2016, but the National Assembly passed an amendment to postpone the measure until June 30, 2017.
F-92
In Brazil, since July 2015, all the financial revenues (except exchange variance) have been subjected to Federal Social Contributions at the rate of 4.65%.
Also in Brazil, starting 2016 the rates of value-added tax in certain states will be changed as follows: Mato Grosso do Sul – from 17% to 20%; Minas Gerais - the tax rate will remain at 18% but there will be an additional 2% as a contribution to poverty eradication just for the sales to non-taxpayer (final consumers); Rio de Janeiro - the contribution related to poverty eradication fund will be increased from 1% to 2% effectively in April; Paraná - the rate will be reduced to 16% but a rate of 2% as a contribution to poverty eradication will be charged on sales to non-taxpayers.
Additionally in Brazil, starting on January 1st, 2016, the rates of federal production tax will be reduced and the rates of the federal sales tax will be increased. Coca-Cola FEMSA estimates the average of these taxes over the net sales would move from 14.4% in 2015 to 15.5% in 2016.
24.1 Income Tax
The major components of income tax expense for the years ended December 31, 2015, 2014 and 2013 are:
| 2015 | 2014 | 2013 | ||||||||||
| Current tax expense |
Ps. | 9,879 | Ps. | 7,810 | Ps. | 7,855 | ||||||
| Deferred tax expense: |
||||||||||||
| Origination and reversal of temporary differences |
826 | 1,303 | 257 | |||||||||
| (Recognition) application of tax losses |
(2,789 | ) | (2,874 | ) | (212 | ) | ||||||
|
|
|
|
|
|
|
|||||||
| Total deferred tax (income) expense |
(1,963 | ) | (1,571 | ) | 45 | |||||||
| Change in the statutory rate (1) |
16 | 14 | (144 | ) | ||||||||
|
|
|
|
|
|
|
|||||||
| Ps. | 7,932 | Ps. | 6,253 | Ps. | 7,756 | |||||||
|
|
|
|
|
|
|
|||||||
| (1) | Effect in 2013 because of 2014 Mexican Tax Reform. |
Recognized in Consolidated Statement of Other Comprehensive Income (OCI)
| Income tax related to items charged or recognized directly in OCI during the year: |
2015 | 2014 | 2013 | |||||||||
| Unrealized loss (gain) on cash flow hedges |
Ps. | 93 | Ps. | 219 | Ps. | (128 | ) | |||||
| Unrealized gain on available for sale securities |
— | — | (1 | ) | ||||||||
| Exchange differences on translation of foreign operations |
1,699 | (60 | ) | 1,384 | ||||||||
| Remeasurements of the net defined benefit liability |
49 | (49 | ) | (56 | ) | |||||||
| Share of the other comprehensive income of associates and joint ventures |
193 | 189 | (1,203 | ) | ||||||||
|
|
|
|
|
|
|
|||||||
| Total income tax cost (benefit) recognized in OCI |
Ps. | 2,034 | Ps. | 299 | Ps. | (4 | ) | |||||
|
|
|
|
|
|
|
|||||||
F-93
A reconciliation between tax expense and income before income taxes and share of the profit or loss of associates and joint ventures accounted for using the equity method multiplied by the Mexican domestic tax rate for the years ended December 31, 2015, 2014 and 2013 is as follows:
| 2015 | 2014 | 2013 | ||||||||||
| Mexican statutory income tax rate |
30.0 | % | 30.0 | % | 30.0 | % | ||||||
| Difference between book and tax inflationary values and translation effects |
(1.3 | %) | (3.1 | %) | (0.2 | %) | ||||||
| Annual inflation tax adjustment |
(1.5 | %) | (4.4 | %) | (1.2 | %) | ||||||
| Difference between statutory income tax rates |
0.4 | % | 0.9 | % | 1.2 | % | ||||||
| Non-deductible expenses |
3.3 | % | 3.7 | % | 1.0 | % | ||||||
| Taxable (non-taxable) income, net |
(0.3 | %) | (1.1 | %) | 0.7 | % | ||||||
| Change in the statutory Mexican tax rate |
0.1 | % | 0.1 | % | (0.6 | %) | ||||||
| Others |
0.8 | % | 0.2 | % | — | |||||||
|
|
|
|
|
|
|
|||||||
| 31.5 | % | 26.3 | % | 30.9 | % | |||||||
|
|
|
|
|
|
|
|||||||
Deferred Income Tax Related to:
| Consolidated Statement of Financial Position as of |
Consolidated Statement of Income |
|||||||||||||||||||
| December 31, 2015 |
December 31, 2014 |
2015 | 2014 | 2013 | ||||||||||||||||
| Allowance for doubtful accounts |
Ps. | (128 | ) | Ps. | (242 | ) | Ps.93 | Ps. | (106 | ) | Ps. | (24 | ) | |||||||
| Inventories |
66 | 132 | (14 | ) | 77 | (2 | ) | |||||||||||||
| Other current assets |
120 | 114 | 21 | (18 | ) | 109 | ||||||||||||||
| Property, plant and equipment, net |
(1,858 | ) | (1,654 | ) | (314 | ) | (968 | ) | (630 | ) | ||||||||||
| Investments in associates and joint ventures |
307 | (176 | ) | 684 | 87 | 115 | ||||||||||||||
| Other assets |
99 | 226 | (52 | ) | 422 | (2 | ) | |||||||||||||
| Finite useful lived intangible assets |
419 | 246 | 201 | (133 | ) | 236 | ||||||||||||||
| Indefinite lived intangible assets |
146 | 75 | 84 | (195 | ) | 88 | ||||||||||||||
| Post-employment and other long-term employee benefits |
(672 | ) | (753 | ) | 86 | (92 | ) | 30 | ||||||||||||
| Derivative financial instruments |
127 | (38 | ) | 165 | (99 | ) | 62 | |||||||||||||
| Provisions |
(1,209 | ) | (1,318 | ) | (8 | ) | (477 | ) | (164 | ) | ||||||||||
| Temporary non-deductible provision |
2,486 | 2,534 | 735 | 2,450 | 562 | |||||||||||||||
| Employee profit sharing payable |
(311 | ) | (268 | ) | (43 | ) | (13 | ) | (27 | ) | ||||||||||
| Tax loss carryforwards |
(5,272 | ) | (3,249 | ) | (2,789 | ) | (2,874 | ) | (212 | ) | ||||||||||
| Cumulative other comprehensive income(1) |
(171 | ) | (303 | ) | — | — | — | |||||||||||||
| Exchange differences on translation of foreign operations in OCI |
3,834 | 2,135 | — | — | — | |||||||||||||||
| Other liabilities |
(46 | ) | (96 | ) | (113 | ) | 475 | (131 | ) | |||||||||||
|
|
|
|
|
|
|
|
|
|
|
|||||||||||
| Deferred tax (income) expense |
Ps. | (1,264 | ) | Ps. | (1,464 | ) | Ps. | 10 | ||||||||||||
| Deferred tax income net recorded in share of the profit of associates and joint ventures accounted for using the equity method |
(683 | ) | (93 | ) | (109 | ) | ||||||||||||||
|
|
|
|
|
|
|
|||||||||||||||
| Deferred tax (income) expense, net |
Ps. | (1,947 | ) | Ps. | (1,557 | ) | Ps. | (99 | ) | |||||||||||
|
|
|
|
|
|
|
|
|
|
|
|||||||||||
| Deferred income taxes, net |
(2,063 | ) | (2,635 | ) | ||||||||||||||||
| Deferred tax asset |
(8,293 | ) | (6,278 | ) | ||||||||||||||||
| Deferred tax liability |
Ps. | 6,230 | Ps. | 3,643 | ||||||||||||||||
|
|
|
|
|
|||||||||||||||||
| (1) | Deferred tax related to derivative financial instruments and remeasurements of the ned defined benefit liability. |
F-94
Deferred tax related to Other Comprehensive Income (OCI)
| Income tax related to items charged or recognized directly in OCI as of the year: |
2015 | 2014 | ||||||
| Unrealized loss (gain) on derivative financial instruments |
Ps. | 105 | Ps. | 12 | ||||
| Remeasurements of the net defined benefit liability |
(275 | ) | (315 | ) | ||||
|
|
|
|
|
|||||
| Total deferred tax income related to OCI |
Ps. | (170 | ) | Ps. | (303 | ) | ||
|
|
|
|
|
|||||
The changes in the balance of the net deferred income tax asset are as follows:
| 2015 | 2014 | 2013 | ||||||||||
| Initial balance |
Ps. | (2,635 | ) | Ps. | (799 | ) | Ps. | (1,328 | ) | |||
| Deferred tax provision for the year |
(1,963 | ) | (1,571 | ) | 45 | |||||||
| Change in the statutory rate |
16 | 14 | (144 | ) | ||||||||
| Deferred tax income net recorded in share of the profit of associates and joint ventures accounted for using the equity method |
683 | 93 | 109 | |||||||||
| Acquisition of subsidiaries (see Note 4) |
(161 | ) | (516 | ) | 647 | |||||||
| Effects in equity: |
||||||||||||
| Unrealized loss (gain) on cash flow hedges |
184 | 109 | (149 | ) | ||||||||
| Unrealized gain on available for sale securities |
— | — | (1 | ) | ||||||||
| Exchange differences on translation of foreign operations |
1,729 | 617 | 2 | |||||||||
| Remeasurements of the net defined benefit liability |
121 | (427 | ) | 102 | ||||||||
| Retained earnings of associates |
(396 | ) | (180 | ) | (121 | ) | ||||||
| Restatement effect of beginning balances associated with hyperinflationary economies |
359 | 25 | 39 | |||||||||
|
|
|
|
|
|
|
|||||||
| Ending balance |
Ps. | (2,063 | ) | Ps. | (2,635 | ) | Ps. | (799 | ) | |||
|
|
|
|
|
|
|
|||||||
The Company offsets tax assets and liabilities if and only if it has a legally enforceable right to set off current tax assets and current tax liabilities and the deferred tax assets and deferred tax liabilities related to income taxes are levied by the same tax authority.
F-95
Tax Loss Carryforwards
The subsidiaries in Mexico and South America have tax loss carryforwards. The tax losses carryforwards and their years of expiration are as follows:
| Year |
Tax Loss Carryforwards |
|||
| 2020 |
Ps. | 23 | ||
| 2021 |
8 | |||
| 2022 |
13 | |||
| 2023 and thereafter |
5,529 | |||
| No expiration (South America) |
10,890 | |||
|
|
|
|||
| Ps. | 16,463 | |||
|
|
|
|||
During 2013 Coca-Cola FEMSA completed certain acquisitions in Brazil as disclosed in Note 4. In connection with those acquisition Coca-Cola FEMSA recorded certain goodwill balances that are deductible for Brazilian income tax reporting purposes. The deduction of such goodwill amortization has resulted in the creation of NOLs in Brazil. NOLs in Brazil have no expiration, but their usage is limited to 30% of Brazilian taxable income in any given year. As of December 31, 2015, Coca-Cola FEMSA believes that it is more likely than not that it will ultimately recover such NOLs through the reversal of temporary differences and future taxable income. Accordingly no valuation allowance has been provided.
The changes in the balance of tax loss carryforwards are as follows:
| 2015 | 2014 | |||||||
| Balance at beginning of the year |
Ps. | 8,734 | Ps. | 558 | ||||
| Additions |
8,545 | 8,199 | ||||||
| Additions from acquisitions |
825 | — | ||||||
| Usage of tax losses |
(215 | ) | (45 | ) | ||||
| Translation effect of beginning balances |
(1,426 | ) | 22 | |||||
|
|
|
|
|
|||||
| Balance at end of the year |
Ps. | 16,463 | Ps. | 8,734 | ||||
|
|
|
|
|
|||||
There were no withholding taxes associated with the payment of dividends in either 2015, 2014 or 2013 by the Company to its shareholders.
The Company has determined that undistributed profits of its subsidiaries, joint ventures or associates will not be distributed in the foreseeable future. The temporary differences associated with investments in subsidiaries, associates and joint ventures, for which a deferred tax liability has not been recognized, aggregate to Ps. 44,082 (December 31, 2014: Ps. 43,394 and December 31, 2013: Ps. 44,920).
24.2 Other taxes
The operations in Guatemala, Nicaragua, Colombia and Argentina are subject to a minimum tax, which is based primary on a percentage of assets. Any payments are recoverable in future years, under certain conditions.
F-96
Note 25. Other Liabilities, Provisions, Contingencies and Commitments
25.1 Other current financial liabilities
| December 31, 2015 |
December 31, 2014 |
|||||||
| Sundry creditors |
Ps. | 4,336 | Ps. | 4,515 | ||||
| Derivative financial instruments |
358 | 347 | ||||||
| Others |
15 | — | ||||||
|
|
|
|
|
|||||
| Total |
Ps. | 4,709 | Ps. | 4,862 | ||||
|
|
|
|
|
|||||
The carrying value of short-term payables approximates its fair value as of December 31, 2015 and 2014.
25.2 Provisions and other long term liabilities
| December 31, 2015 |
December 31, 2014 |
|||||||
| Provisions |
Ps. | 3,415 | Ps. | 4,285 | ||||
| Taxes payable |
458 | 444 | ||||||
| Others |
1,334 | 890 | ||||||
|
|
|
|
|
|||||
| Total |
Ps. | 5,207 | Ps. | 5,619 | ||||
|
|
|
|
|
|||||
25.3 Other financial liabilities
| December 31, 2015 |
December 31, 2014 |
|||||||
| Derivative financial instruments |
Ps. | 277 | Ps. | 151 | ||||
| Security deposits |
218 | 177 | ||||||
|
|
|
|
|
|||||
| Total |
Ps. | 495 | Ps. | 328 | ||||
|
|
|
|
|
|||||
F-97
25.4 Provisions recorded in the consolidated statement of financial position
The Company has various loss contingencies, and has recorded reserves as other liabilities for those legal proceedings for which it believes an unfavorable resolution is probable. Most of these loss contingencies are the result of the Company’s business acquisitions. The following table presents the nature and amount of the loss contingencies recorded as of December 31, 2015 and 2014:
| December 31, 2015 |
December 31, 2014 |
|||||||
| Indirect taxes |
Ps. | 1,725 | Ps. | 2,271 | ||||
| Labor |
1,372 | 1,587 | ||||||
| Legal |
318 | 427 | ||||||
|
|
|
|
|
|||||
| Total |
Ps. | 3,415 | Ps. | 4,285 | ||||
|
|
|
|
|
|||||
25.5 Changes in the balance of provisions recorded
25.5.1 Indirect taxes
| December 31, 2015 |
December 31, 2014 |
December 31, 2013 |
||||||||||
| Balance at beginning of the year |
Ps. | 2,271 | Ps. | 3,300 | Ps. | 1,263 | ||||||
| Penalties and other charges |
21 | 220 | 1 | |||||||||
| New contingencies |
84 | 38 | 263 | |||||||||
| Reclasification in tax contingencies with Heineken |
— | 1,349 | — | |||||||||
| Contingencies added in business combination |
— | 1,190 | 2,143 | |||||||||
| Cancellation and expiration |
(205 | ) | (798 | ) | (5 | ) | ||||||
| Payments |
(214 | ) | (2,517 | ) | (303 | ) | ||||||
| Current portion |
— | — | (163 | ) | ||||||||
| Brazil amnesty adoption |
— | (599 | ) | — | ||||||||
| Effects of changes in foreign exchange rates |
(232 | ) | 88 | 101 | ||||||||
|
|
|
|
|
|
|
|||||||
| Balance at end of the year |
Ps. | 1,725 | Ps. | 2,271 | Ps. | 3,300 | ||||||
|
|
|
|
|
|
|
|||||||
During 2014, Coca-Cola FEMSA took advantage of a Brazilian tax amnesty program. The settlement of certain outstanding matters under that amnesty program generated a benefit Ps. 455 which is reflected in other income during the year ended December 31, 2014 (see Note 19).
25.5.2 Labor
| December 31, 2015 |
December 31, 2014 |
December 31, 2013 |
||||||||||
| Balance at beginning of the year |
Ps. | 1,587 | Ps. | 1,063 | Ps. | 934 | ||||||
| Penalties and other charges |
210 | 107 | 139 | |||||||||
| New contingencies |
44 | 145 | 187 | |||||||||
| Contingencies added in business combination |
— | 442 | 157 | |||||||||
| Cancellation and expiration |
(102 | ) | (53 | ) | (226 | ) | ||||||
| Payments |
(114 | ) | (57 | ) | (69 | ) | ||||||
| Effects of changes in foreign exchange rates |
(253 | ) | (60 | ) | (59 | ) | ||||||
|
|
|
|
|
|
|
|||||||
| Balance at end of the year |
Ps. | 1,372 | Ps. | 1,587 | Ps. | 1,063 | ||||||
|
|
|
|
|
|
|
|||||||
A roll forward for legal contingencies is not disclosed because the amounts are not considered to be material.
While provision for all claims has already been made, the actual outcome of the disputes and the timing of the resolution cannot be estimated by the Company at this time.
F-98
25.6 Unsettled lawsuits
The Company has entered into several proceedings with its labor unions, tax authorities and other parties that primarily involve Coca-Cola FEMSA and its subsidiaries. These proceedings have resulted in the ordinary course of business and are common to the industry in which the Company operates. The aggregate amount being claimed against the Company resulting from such proceedings as of December 31, 2015 is Ps. 29,502. Such contingencies were classified by legal counsel as less than probable but more than remote of being settled against the Company. However, the Company believes that the ultimate resolution of such several proceedings will not have a material effect on its consolidated financial position or result of operations.
Included in this amount Coca-Cola FEMSA has tax contingencies, amounting to approximately Ps. 19,133, with loss expectations assessed by management and supported by the analysis of legal counsel which it considers possible. Among these possible contingencies, are Ps. 5,770 in various tax disputes related primarily to credits for ICMS (VAT) and Tax credits over raw materials acquired from Free Trade Zone Manaus (IPI). Possible claims also include Ps. 11,613 related to the disallowance of IPI credits on the acquisition of inputs from the Manaus Free Trade Zone. Cases related to these matters are pending final decision at the administrative level. Possible claims also include Ps. 1,348 related to compensation of federal taxes not approved by the IRS (Tax authorities). Cases related to these matters are pending final decision in the administrative and judicial spheres. Finally, possible claims include Ps. 402 related to the requirement by the Tax Authorities of State of São Paulo for ICMS (VAT), interest and penalty due to the alleged underpayment of tax arrears for the period 1994-1996. Coca-Cola FEMSA is defending its position in these matters and final decision is pending in court. In addition, the Company has Ps. 4,586 in unsettled indirect tax contingencies regarding indemnification accorded with Heineken over FEMSA Cerveza. These matters are related to different Brazilian federal taxes which are pending final decision.
In recent years in its Mexican and Brazilian territories, Coca-Cola FEMSA has been requested to present certain information regarding possible monopolistic practices. These requests are commonly generated in the ordinary course of business in the soft drink industry where this subsidiary operates. The Company does not expect any material liability to arise from these contingencies.
25.7 Collateralized contingencies
As is customary in Brazil, the Company has been required by the tax authorities there to collateralize tax contingencies currently in litigation amounting to Ps. 3,569 and Ps. 3,026 as of December 31, 2015 and 2014, respectively, by pledging fixed assets and entering into available lines of credit covering the contingencies (see Note 13).
25.8 Commitments
As of December 31, 2015, the Company has contractual commitments for finance leases for machinery and transport equipment and operating lease for the rental of production machinery and equipment, distribution and computer equipment, and land for FEMSA Comercio’s operations.
The contractual maturities of the operating lease commitments by currency, expressed in Mexican pesos as of December 31, 2015, are as follows:
| Mexican Pesos |
U.S. Dollars |
Others | ||||||||||
| Not later than 1 year |
Ps. | 3,768 | Ps. | 200 | Ps. | 1 | ||||||
| Later than 1 year and not later than 5 years |
13,262 | 782 | 13 | |||||||||
| Later than 5 years |
16,742 | 330 | 2 | |||||||||
|
|
|
|
|
|
|
|||||||
| Total |
Ps. | 33,772 | Ps. | 1,312 | Ps. | 16 | ||||||
|
|
|
|
|
|
|
|||||||
F-99
Rental expense charged to consolidated net income was Ps. 6,088, Ps. 4,988 and Ps. 4,345 for the years ended December 31, 2015, 2014 and 2013, respectively.
Future minimum lease payments under finance leases with the present value of the net minimum lease payments are as follows:
| 2015 Minimum Payments |
Present Value of Payments |
2014 Minimum Payments |
Present Value of Payments |
|||||||||||||
| Not later than 1 year |
Ps. | 109 | Ps. | 91 | Ps. | 299 | Ps. | 263 | ||||||||
| Later than 1 year and not later than 5 years |
359 | 327 | 533 | 504 | ||||||||||||
| Later than 5 years |
166 | 149 | 63 | 64 | ||||||||||||
|
|
|
|
|
|
|
|
|
|||||||||
| Total mínimum lease payments |
634 | 567 | 895 | 831 | ||||||||||||
| Less amount representing finance charges |
67 | — | 64 | — | ||||||||||||
| Present value of minimum lease payments |
567 | 567 | 831 | 831 | ||||||||||||
|
|
|
|
|
|
|
|
|
|||||||||
The Company through its subsidiary Coca-Cola FEMSA has firm commitments for the purchase of property, plant and equipment of Ps. 92 as December 31, 2015.
Note 26. Information by Segment
The analytical information by segment is presented considering the Company’s business units (as defined in Note 1) based on its products and services, which is consistent with the internal reporting presented to the Chief Operating Decision Maker. A segment is a component of the Company that engages in business activities from which it earns revenues, and incurs the related costs and expenses, including revenues, costs and expenses that relate to transactions with any of Company’s other components. All segments’ operating results are reviewed regularly by the Chief Operating Decision Maker, which makes decisions about the resources that would be allocated to the segment and to assess its performance, and for which financial information is available.
F-100
Inter-segment transfers or transactions are entered into and presented under accounting policies of each segment, which are the same to those applied by the Company. Intercompany operations are eliminated and presented within the consolidation adjustment column included in the tables below.
| a) | By Business Unit: |
| 2015 |
Coca-Cola FEMSA |
FEMSA Comercio- Retail Division |
FEMSA Comercio- Fuel Division |
CB Equity |
Other (1) | Consolidation Adjustments |
Consolidated | |||||||||||||||||||||
| Total revenues |
Ps. | 152,360 | Ps. | 132,891 | Ps. | 18,510 | Ps. | — | Ps. | 22,774 | Ps. | (14,946 | ) | Ps. | 311,589 | |||||||||||||
| Intercompany revenue |
3,794 | — | — | — | 11,152 | (14,946 | ) | — | ||||||||||||||||||||
| Gross profit |
72,030 | 47,291 | 1,420 | — | 5,334 | (2,896 | ) | 123,179 | ||||||||||||||||||||
| Administrative expenses |
— | — | — | — | — | — | 11,705 | |||||||||||||||||||||
| Selling expenses |
— | — | — | — | — | — | 76,375 | |||||||||||||||||||||
| Other income |
— | — | — | — | — | — | 423 | |||||||||||||||||||||
| Other expenses |
— | — | — | — | — | — | (2,741 | ) | ||||||||||||||||||||
| Interest expense |
(6,337 | ) | (634 | ) | (78 | ) | — | (1,269 | ) | 541 | (7,777 | ) | ||||||||||||||||
| Interest income |
414 | 31 | 35 | 18 | 1,067 | (541 | ) | 1,024 | ||||||||||||||||||||
| Other net finance expenses (3) |
— | — | — | — | — | — | (865 | ) | ||||||||||||||||||||
| Income before income taxes and share of the profit of associates and joint ventures accounted for using the equity method |
14,725 | 10,130 | 164 | 8 | 208 | (72 | ) | 25,163 | ||||||||||||||||||||
| Income taxes |
4,551 | 956 | 28 | 2 | 2,395 | — | 7,932 | |||||||||||||||||||||
| Share of the profit of associates and joint ventures accounted for using the equity method, net of taxes |
155 | (10 | ) | — | 5,879 | 21 | — | 6,045 | ||||||||||||||||||||
|
|
|
|
|
|
|
|
|
|
|
|
|
|
|
|||||||||||||||
| Consolidated net income |
— | — | — | — | — | — | 23,276 | |||||||||||||||||||||
|
|
|
|
|
|
|
|
|
|
|
|
|
|
|
|||||||||||||||
| Depreciation and amortization (2) |
7,144 | 3,336 | 63 | — | 282 | — | 10,825 | |||||||||||||||||||||
| Non-cash items other than depreciation and amortization |
1,443 | 280 | 17 | — | 326 | — | 2,066 | |||||||||||||||||||||
|
|
|
|
|
|
|
|
|
|
|
|
|
|
|
|||||||||||||||
| Investments in associates and joint ventures |
17,873 | 744 | 19 | 92,694 | 401 | — | 111,731 | |||||||||||||||||||||
| Total assets |
210,249 | 67,211 | 3,230 | 95,502 | 49,213 | (16,073 | ) | 409,332 | ||||||||||||||||||||
| Total liabilities |
101,514 | 44,783 | 2,752 | 4,202 | 30,298 | (16,073 | ) | 167,476 | ||||||||||||||||||||
| Investments in fixed assets (4) |
11,484 | 6,048 | 228 | — | 1,448 | (323 | ) | 18,885 | ||||||||||||||||||||
| (1) | Includes other companies (see Note 1) and corporate. |
| (2) | Includes bottle breakage. |
| (3) | Includes foreign exchange loss, net; loss on monetary position for subsidiaries in hyperinflationary economies; and market value gain on financial instruments. |
| (4) | Includes acquisitions and disposals of property, plant and equipment, intangible assets and other long-lived assets. |
F-101
| 2014 |
Coca-Cola FEMSA |
FEMSA Comercio- Retail Division |
CB Equity |
Other (1) | Consolidation Adjustments |
Consolidated | ||||||||||||||||||
| Total revenues |
Ps. | 147,298 | Ps. | 109,624 | Ps. | — | Ps. | 20,069 | Ps. | (13,542 | ) | Ps. | 263,449 | |||||||||||
| Intercompany revenue |
3,475 | — | — | 10,067 | (13,542 | ) | — | |||||||||||||||||
| Gross profit |
68,382 | 39,386 | — | 4,871 | (2,468 | ) | 110,171 | |||||||||||||||||
| Administrative expenses |
— | — | — | — | — | 10,244 | ||||||||||||||||||
| Selling expenses |
— | — | — | — | — | 69,016 | ||||||||||||||||||
| Other income |
— | — | — | — | — | 1,098 | ||||||||||||||||||
| Other expenses |
— | — | — | — | — | (1,277 | ) | |||||||||||||||||
| Interest expense |
(5,546 | ) | (686 | ) | — | (1,093 | ) | 624 | (6,701 | ) | ||||||||||||||
| Interest income |
379 | 23 | 16 | 1,068 | (624 | ) | 862 | |||||||||||||||||
| Other net finance expenses (3) |
— | — | — | — | — | (1,149 | ) | |||||||||||||||||
| Income before income taxes and share of the profit of associates and joint ventures accounted for using the equity method |
14,952 | 7,959 | 8 | 905 | (80 | ) | 23,744 | |||||||||||||||||
| Income taxes |
3,861 | 541 | 2 | 1,849 | — | 6,253 | ||||||||||||||||||
| Share of the profit of associates and joint ventures accounted for using the equity method, net of taxes |
(125 | ) | 37 | 5,244 | (17 | ) | — | 5,139 | ||||||||||||||||
|
|
|
|
|
|
|
|
|
|
|
|
|
|||||||||||||
| Consolidated net income |
— | — | — | — | — | 22,630 | ||||||||||||||||||
|
|
|
|
|
|
|
|
|
|
|
|
|
|||||||||||||
| Depreciation and amortization (2) |
6,949 | 2,872 | — | 193 | — | 10,014 | ||||||||||||||||||
| Non-cash items other than depreciation and amortization |
693 | 204 | — | 87 | — | 984 | ||||||||||||||||||
|
|
|
|
|
|
|
|
|
|
|
|
|
|||||||||||||
| Investments in associates and joint ventures |
17,326 | 742 | 83,710 | 381 | — | 102,159 | ||||||||||||||||||
| Total assets |
212,366 | 43,722 | 85,742 | 51,251 | (16,908 | ) | 376,173 | |||||||||||||||||
| Total liabilities |
102,248 | 31,860 | 2,005 | 26,846 | (16,908 | ) | 146,051 | |||||||||||||||||
| Investments in fixed assets (4) |
11,313 | 5,191 | — | 1,955 | (296 | ) | 18,163 | |||||||||||||||||
| (1) | Includes other companies (see Note 1) and corporate. |
| (2) | Includes bottle breakage. |
| (3) | Includes foreign exchange loss, net; loss on monetary position for subsidiaries in hyperinflationary economies; and market value gain on financial instruments. |
| (4) | Includes acquisitions and disposals of property, plant and equipment, intangible assets and other long-lived assets. |
F-102
| 2013 |
Coca-Cola FEMSA |
FEMSA Comercio- Retail Division |
CB Equity |
Other (1) | Consolidation Adjustments |
Consolidated | ||||||||||||||||||
| Total revenues |
Ps. | 156,011 | Ps. | 97,572 | Ps. | — | Ps. | 17,254 | Ps. | (12,740 | ) | Ps. | 258,097 | |||||||||||
| Intercompany revenue |
3,116 | — | — | 9,624 | (12,740 | ) | — | |||||||||||||||||
| Gross profit |
72,935 | 34,586 | — | 4,670 | (2,537 | ) | 109,654 | |||||||||||||||||
| Administrative expenses |
— | — | — | — | — | 9,963 | ||||||||||||||||||
| Selling expenses |
— | — | — | — | — | 69,574 | ||||||||||||||||||
| Other income |
— | — | — | — | — | 651 | ||||||||||||||||||
| Other expenses |
— | — | — | — | — | (1,439 | ) | |||||||||||||||||
| Interest expense |
(3,341 | ) | (601 | ) | — | (865 | ) | 476 | (4,331 | ) | ||||||||||||||
| Interest income |
654 | 5 | 12 | 1,030 | (476 | ) | 1,225 | |||||||||||||||||
| Other net finance expenses (3) |
— | — | — | — | — | (1,143 | ) | |||||||||||||||||
| Income before income taxes and share of the profit of associate and joint ventures accounted for using the equity method |
17,224 | 2,890 | 4 | 5,120 | (158 | ) | 25,080 | |||||||||||||||||
| Income taxes |
5,731 | 339 | 1 | 1,685 | — | 7,756 | ||||||||||||||||||
| Share of the profit of associates and joint ventures accounted for using the equity method, net of taxes |
289 | 11 | 4,587 | (56 | ) | — | 4,831 | |||||||||||||||||
|
|
|
|
|
|
|
|
|
|
|
|
|
|||||||||||||
| Consolidated net income |
— | — | — | — | — | 22,155 | ||||||||||||||||||
|
|
|
|
|
|
|
|
|
|
|
|
|
|||||||||||||
| Depreciation and amortization (2) |
7,132 | 2,443 | — | 121 | — | 9,696 | ||||||||||||||||||
| Non-cash items other than depreciation and amortization |
12 | 197 | — | 108 | — | 317 | ||||||||||||||||||
|
|
|
|
|
|
|
|
|
|
|
|
|
|||||||||||||
| Investments in associates and joint ventures |
16,767 | 734 | 80,351 | 478 | — | 98,330 | ||||||||||||||||||
| Total assets |
216,665 | 39,617 | 82,576 | 45,487 | (25,153 | ) | 359,192 | |||||||||||||||||
| Total liabilities |
99,512 | 37,858 | 1,933 | 21,807 | (24,468 | ) | 136,642 | |||||||||||||||||
| Investments in fixed assets (4) |
11,703 | 5,683 | — | 831 | (335 | ) | 17,882 | |||||||||||||||||
| (1) | Includes other companies (see Note 1) and corporate. |
| (2) | Includes bottle breakage. |
| (3) | Includes foreign exchange loss, net; loss on monetary position for subsidiaries in hyperinflationary economies; and market value gain on financial instruments. |
| (4) | Includes acquisitions and disposals of property, plant and equipment, intangible assets and other long-lived assets. |
| b) | By Geographic Area: |
The Company aggregates geographic areas into the following for the purposes of its consolidated financial statements: (i) Mexico and Central America division (comprising the following countries: Mexico, Guatemala, Nicaragua, Costa Rica and Panama) and (ii) the South America division (comprising the following countries: Brazil, Argentina, Colombia, Chile and Venezuela). Venezuela operates in an economy with exchange controls and hyper-inflation; and as a result,it is not aggregated into the South America area, (iii) Europe (comprised of the Company’s equity method investment in Heineken) and (iv) the Asian division comprised of the Coca Cola FEMSA’s equity method investment in CCFPI (Philippines) which was acquired in January 2013.
F-103
Geographic disclosure for the Company is as follow:
| 2015 |
Total Revenues |
Total Non Current Assets |
||||||
| Mexico and Central America (1) (2) |
Ps. | 228,563 | Ps. | 158,506 | ||||
| South America (3) |
74,928 | 67,568 | ||||||
| Venezuela |
8,904 | 3,841 | ||||||
| Europe |
— | 92,694 | ||||||
| Consolidation adjustments |
(806 | ) | — | |||||
|
|
|
|
|
|||||
| Consolidated |
Ps. | 311,589 | Ps. | 322,609 | ||||
|
|
|
|
|
|||||
| 2014 |
Total Revenues |
Total Non Current Assets |
||||||
| Mexico and Central America (1) (2) |
Ps. | 186,736 | Ps. | 139,899 | ||||
| South America (3) |
69,172 | 67,078 | ||||||
| Venezuela |
8,835 | 6,374 | ||||||
| Europe |
— | 83,710 | ||||||
| Consolidation adjustments |
(1,294 | ) | — | |||||
|
|
|
|
|
|||||
| Consolidated |
Ps. | 263,449 | Ps. | 297,061 | ||||
|
|
|
|
|
|||||
| 2013 |
Total Revenues |
|||
| Mexico and Central America (1) (2) |
Ps. | 171,726 | ||
| South America (3) |
55,157 | |||
| Venezuela |
31,601 | |||
| Europe |
— | |||
| Consolidation adjustments |
(387 | ) | ||
|
|
|
|||
| Consolidated |
Ps. | 258,097 | ||
|
|
|
|||
| (1) | Central America includes Guatemala, Nicaragua, Costa Rica and Panama. Domestic (Mexico only) revenues were Ps. 218,809, Ps. 178,125 and Ps. 163,351 during the years ended December 31, 2015, 2014 and 2013, respectively. Domestic (Mexico only) non-current assets were Ps. 157,080 and Ps. 138,662, as of December 31, 2015, and December 31, 2014, respectively. |
| (2) | Coca-Cola FEMSA’s Asian division consists of the 51% equity investment in CCFPI (Philippines) which was acquired in 2013, and is accounted for using the equity method of accounting (see Note 10). The equity in earnings of the Asian division were Ps. 86, Ps. (334) and Ps. 108 in 2015, 2014 and 2013, respectively as is the equity method investment in CCFPI was Ps. 9,996, Ps. 9,021 and Ps. 9,398 this is presented as part of the Company’s corporate operations in 2015, 2014 and 2013, respectively and thus disclosed net in the table above as part of the “Total Non Current assets” in the Mexico & Central America division. However, the Asian division is represented by the following investee level amounts, prior to reflection of the Company’s 51% equity interest in the accompanying consolidated financial statements: revenues Ps. 19,576, Ps. 16,548 and Ps. 13,438, gross profit Ps. 5,325, Ps. 4,913 and Ps. 4,285, income before income taxes Ps. 334, Ps. 664 and Ps. 310, depreciation and amortization Ps. 2,369, Ps. 643 and Ps. 1,229, total assets Ps. 22,002 Ps. 19,877 and Ps. 17,232, total liabilities Ps. 6,493, Ps. 6,614 and Ps. 4,488, capital expenditures Ps. 1,778, Ps. 2,215 and Ps. 1,889, as of December 31, 2015, 2104 and 2013, respectively. |
| (3) | South America includes Brazil, Argentina, Colombia, Chile and Venezuela, although Venezuela is shown separately above. South America |
F-104
| revenues include Brazilian revenues of Ps. 39,749, Ps. 45,799 and Ps. 31,138 during the years ended December 31, 2015, 2014 and 2013, respectively. Brazilian non-current assets were Ps. 44,851 and Ps. 51,587, as of December 31, 2015 and December 31, 2014, respectively. South America revenues include Colombia revenues of Ps. 14,283, Ps. 14,207 and Ps. 13,354 during the years ended December 31, 2015, 2014 and 2013, respectively. Colombia non-current assets were Ps. 12,755 and Ps. 12,933, as of December 31, 2015 and December 31, 2014, respectively. South America revenues include Argentina revenues of Ps. 14,004, Ps. 9,714 and Ps. 10,729 during the years ended December 31, 2015, 2014 and 2013, respectively. Argentina non-current assets were Ps. 2,861 and Ps. 2,470, as of December 31, 2015 and December 31, 2014, respectively. South America revenues include Chile revenues of Ps. 7,586 during the year ended December 31, 2015. Chile non-current assets were Ps. 7,031, as of December 31, 2015. |
Note 27. Future Impact of Recently Issued Accounting Standards not yet in Effect
The Company has not applied the following standards and interpretations that are issued, but not yet effective, up to the date of issuance of the Company’s financial statements are disclosed below. The Company intends to adopt these standards, if applicable, when they become effective.
IFRS 9, Financial Instruments
In July 2014, the IASB issued the final version of IFRS 9 Financial Instruments which reflects all phases of the financial instruments project and replaces IAS 39 Financial Instruments: Recognition and Measurement and all previous versions of IFRS 9. The standard introduces new requirements for classification and measurement, impairment, and hedge accounting. IFRS 9 is effective for annual periods beginning on or after January 1, 2018, with early application permitted. The transition to IFRS 9 differs by requirements and is partly retrospective and partly prospective. The Company has not early adopted this IFRS, and the Company has yet to complete its evaluation of whether it will have a material impact on its consolidated financial statements.
IFRS 15, Revenue from Contracts with Customers
IFRS 15, “Revenue from Contracts with Customers”, was originally issued in May 2014 and applies to annual reporting periods beginning on or after January 1, 2018, earlier application is permitted. Revenue is recognized as control is passed, either over time or at a point in time.
The standard outlines a single comprehensive model for entities to use in accounting for revenue arising from contracts with customers and supersedes most current revenue recognition guidance, including industry specific guidance. In applying the revenue model to contracts within its scope, an entity will: 1) Identify the contract(s) with a customer; 2) Identify the performance obligations in the contract; 3) Determine the transaction price; 4) Allocate the transaction price to the performance obligations in the contract; 5) Recognize revenue when (or as) the entity satisfies a performance obligation. Also, an entity needs to disclose sufficient information to enable users of financial statements to understand the nature, amount, timing and uncertainty of revenue and cash flows arising from contracts with customers. The Company has yet to complete its evaluation of whether there will be a significant impact as a consequence of this standard’s adoption; nonetheless most of the Company’s operations are at a single point in time, which is when the Company transfers goods or services to a customer. The Company does not expect a potential impact on its consolidated financial statements and the Company expects to complete its evaluation during 2017.
IFRS 16, Leases
IFRS 16 “Leases” was issued in January 2016 and supersedes IAS 17 “Leases” and related interpretations. The new standard brings most leases on-balance sheet for lessees under a single model, eliminating the distinction between operating and finance leases. Lessor accounting, however, remains largely unchanged and the distinction between operating and finance leases is retained. IFRS 16 is effective for periods beginning on or after 1 January 2019, with earlier adoption permitted if IFRS 15 ‘Revenue from Contracts with Customers’ has also been applied.
Under IFRS 16 a lessee recognizes a right-of-use asset and a lease liability. The right-of-use asset is treated similarly to other non-financial assets and depreciated accordingly and the liability accrues interest. This will typically produce a front-loaded expense profile (whereas operating leases under IAS 17 would typically have had straight-line expenses) as an assumed linear depreciation of the right-of-use asset and the decreasing interest on the liability will lead to an overall decrease of expense over the life of the lease.
F-105
The lease liability is initially measured at the present value of the lease payments payable over the lease term, discounted at the rate implicit in the lease if that can be readily determined. If that rate cannot be readily determined, the lessee shall use their incremental borrowing rate. However, a lessee may elect to account for lease payments as an expense on a straight-line basis over the lease term for leases with a lease term of 12 months or less and containing no purchase options (this election is made by class of underlying asset); and leases where the underlying asset has a low value when new, such as personal computers or small items of office furniture (this election can be made on a lease-by-lease basis). The Company has yet to complete its evaluation whether there will be a potential impact as a consequence of this standard’s adoption, although given the nature of the Company’s operations, it will expect a significant impact on its consolidated financial statements.
Amendments to IAS 7, Disclosure Initiative
The amendments to IAS 7 Statement of Cash Flows, require that the following changes in liabilities arising from financing activities be disclosed separately from changes in other assets and liabilities: (i) changes from financing cash flows; (ii) changes arising from obtaining or losing control of subsidiaries or other businesses; (iii) the effect of changes in foreign exchange rates; (iv) changes in fair values; and (v) other changes. One way to fulfill the new disclosure requirement is to provide a reconciliation between the opening and closing balances in the statement of financial position for liabilities arising from financing activities.
Liabilities arising from financing activities are those for which cash flows were, or future cash flows will be, classified in the statement of cash flows as cash flows from financing activities. The new disclosure requirements also relate to changes in financial assets if they meet the same definition.
These amendments are effective for annual periods beginning on or after 1 January 2017 with earlier application permitted, and entities need not provide comparative information when they first apply them. The Company is in the process of assessing the potential impacts from the adoption of these amendments in its financial statements.
Note 28. Subsequent Events
In January 18, 2016, Eduardo Padilla Silva replaced Daniel Rodriguez Cofré as our Chief Financial and Corporate Officer, and Mr. Rodriguez Cofré replaced Mr. Padilla Silva as Chief Executive Officer of FEMSA Comercio.
In February 17, 2016, the president of Venezuela announced a devaluation of the official exchange rate of 37% and moved the existing three-tier exchange rates system into dual system as part of a package of economic policies aimed to face the economic crisis from the OPEC member-countries. The official exchange rate (6.30 bolivars per U.S. dollar as of December 31, 2015) and the SICAD exchange rate (13.50 bolivars per U.S. dollar as of December 31, 2015), were merged into a new official exchange rate at 10 bolivars per U.S. dollar. The SIMADI exchange rate was maintained in the same conditions it operated before this date. At the date of this report, no specific guidance has been defined with respect to the use of each exchange rate available. The Company will closely monitor developments in this area, which may affect the exchange rate(s) used prospectively.
F-106
Serious News for Serious Traders! Try StreetInsider.com Premium Free!
You May Also Be Interested In
- Valstybės investicinis kapitalas UAB audited Annual information for the year 2023
- International Horticultural Exhibition 2024 Chengdu Opens
- Akanda Appoints Cooper to the Board of Directors
Create E-mail Alert Related Categories
SEC FilingsSign up for StreetInsider Free!
Receive full access to all new and archived articles, unlimited portfolio tracking, e-mail alerts, custom newswires and RSS feeds - and more!
