

Form 6-K CaesarStone Sdot-Yam For: Sep 09
 Tweet
Tweet Share
ShareUNITED STATES
SECURITIES AND EXCHANGE COMMISSION
Washington, D.C. 20549
______________________
FORM 6-K
REPORT OF FOREIGN PRIVATE ISSUER
Pursuant to Rule 13a-16 or 15d-16 of the
Securities Exchange Act of 1934
For the month of September 2015
Commission File Number: 001-35464
Caesarstone Sdot-Yam Ltd.
(Translation of registrant’s name into English)
Kibbutz Sdot Yam
MP Menashe
Israel 3780400
(Address of principal executive offices)
Indicate by check mark whether the registrant files or will file annual reports under cover Form 20-F or Form 40-F.
Form 20-F x Form 40-F o
Indicate by check mark if the registrant is submitting the Form 6-K in paper as permitted by Regulation S-T Rule 101(b)(1): __
Indicate by check mark if the registrant is submitting the Form 6-K in paper as permitted by Regulation S-T Rule 101(b)(7): __
EXPLANATORY NOTE
On September 9, 2015, Caesarstone Sdot-Yam Ltd. released a report titled “Caesarstone’s Response to Spruce Point.” A copy of the report is attached hereto as Exhibit 99.1.
The information on this Form 6-K, including the exhibit attached hereto, shall not be deemed ‘filed’ for purposes of Section 18 of the Securities Exchange Act of 1934 or otherwise subject to the liabilities of that section, nor shall it be deemed incorporated by reference in any filing under the Securities Act of 1933 or the Securities Exchange Act of 1934.
2
SIGNATURE
Pursuant to the requirements of the Securities Exchange Act of 1934, the registrant has duly caused this report to be signed on its behalf by the undersigned, thereunto duly authorized.
|
CAESARSTONE SDOT-YAM LTD.
|
|||
|
Date: September 9, 2015
|
By: |
/s/ Michal Baumwald Oron
|
|
|
Name: Michal Baumwald Oron
|
|||
|
|
Title: VP Business Development & General Counsel
|
||
3
EXHIBIT INDEX
|
Exhibit
|
Description
|
|
99.1
|
Report dated September 9, 2015, titled “Caesarstone’s Response to Spruce Point”.
|
4
Exhibit 99.1

1
September 9, 2015
Caesarstone’s Response to Spruce Point

2
Written and oral statements made in and in connection with the following presentation that reflect management’s views about the Company’s future performance,
financial position, business strategy and plans and objectives for future operations constitute “forward-looking statements” under the Private Securities Litigation Reform
Act of 1995.
financial position, business strategy and plans and objectives for future operations constitute “forward-looking statements” under the Private Securities Litigation Reform
Act of 1995.
These statements, which contain words such as "believe,” “expect,” “anticipate,” “intend,” “estimate,” “forecast,” “project,” “will,” “may,” “should”, “plan”, “seek” and
similar expressions or references to future periods, reflect the beliefs and expectations of the Company and are subject to risks and uncertainties, including those described
under “Risk factors” in the Company’s annual report on Form 20-F for the year ended December 31, 2014 and other documents filed with the U.S. Securities and Exchange
Commission (the “SEC”), that may cause actual results to differ materially from the results discussed in our forward-looking statements. This presentation should be read in
conjunction with our annual report on Form 20-F for the year ended December 31, 2014 and our other documents filed with the SEC. These risks and uncertainties include,
among other factors, the strength of the home renovation and construction sectors; economic conditions within any of our key existing markets; actions by our
competitors; changes in raw material prices; unpredictability of seasonal fluctuations in revenues; the outcome of silicosis claims; the outcome of the claim by our former
quartz processor; fluctuations in currency exchange rates; delays in manufacturing if our suppliers are unable to supply raw materials; and other factors discussed under the
heading “Risk Factors” in the annual report on Form 20-F and other documents filed with the U.S. Securities and Exchange Commission. These and other factors could
adversely affect the outcome and financial effects of the plans and events described herein.
These forward-looking statements are made only as of the date hereof, and neither the Company nor any of its respective agents, employees or advisors intend, undertake
or have any duty or obligation to supplement, amend, update or revise any of the forward-looking statements contained in this presentation, whether as a result of new
information, future events or otherwise.
or have any duty or obligation to supplement, amend, update or revise any of the forward-looking statements contained in this presentation, whether as a result of new
information, future events or otherwise.
This presentation includes certain non-GAAP measures, which should all be considered in addition to, and not as a substitute for, comparable GAAP measures. A
reconciliation of GAAP net income to adjusted net income is provided below. The Company provides these non-GAAP financial measures because it believes that they
present a better measure of the Company’s core business and management uses the non-GAAP measures internally to evaluate the Company’s ongoing performance.
Accordingly, the Company believes that they are useful to investors in enhancing an understanding of the Company’s operating performance. However, these measures
should not be considered as substitutes for GAAP measures and may be inconsistent with similar measures presented by other companies.
Disclaimer

3
Executive Summary
§ This presentation is a direct response to the Spruce Point report
published on August 19, 2015, which is a misleading and otherwise
factually inaccurate description of Caesarstone
published on August 19, 2015, which is a misleading and otherwise
factually inaccurate description of Caesarstone
§ This presentation generally relies upon Caesarstone’s prior statements
and disclosures and other publicly available data to reiterate:
and disclosures and other publicly available data to reiterate:
§ Caesarstone’s global leadership in the quartz surface market
§ Caesarstone’s innovation in product development
§ The quality of Caesarstone’s products and the strength of its brand
§ The integrity of Caesarstone’s financial statements and reports
§ Caesarstone’s strengthening position in its markets

4
Caesarstone
Global Leader in the Quartz Surface Market
5
§ Pioneered the quartz surfaces 28 years ago and has led the category since then
§ Strong premium brand known for high quality, innovation, inspiring design and excellent service
§ 12% global market share as of December 2014¹
§ Distribution network across more than 50 countries
§ Diversified revenue with approximately 60% of H1’15 revenue from North America
¹Based on market size data, Freedonia report, Feb. 2015
Company Overview
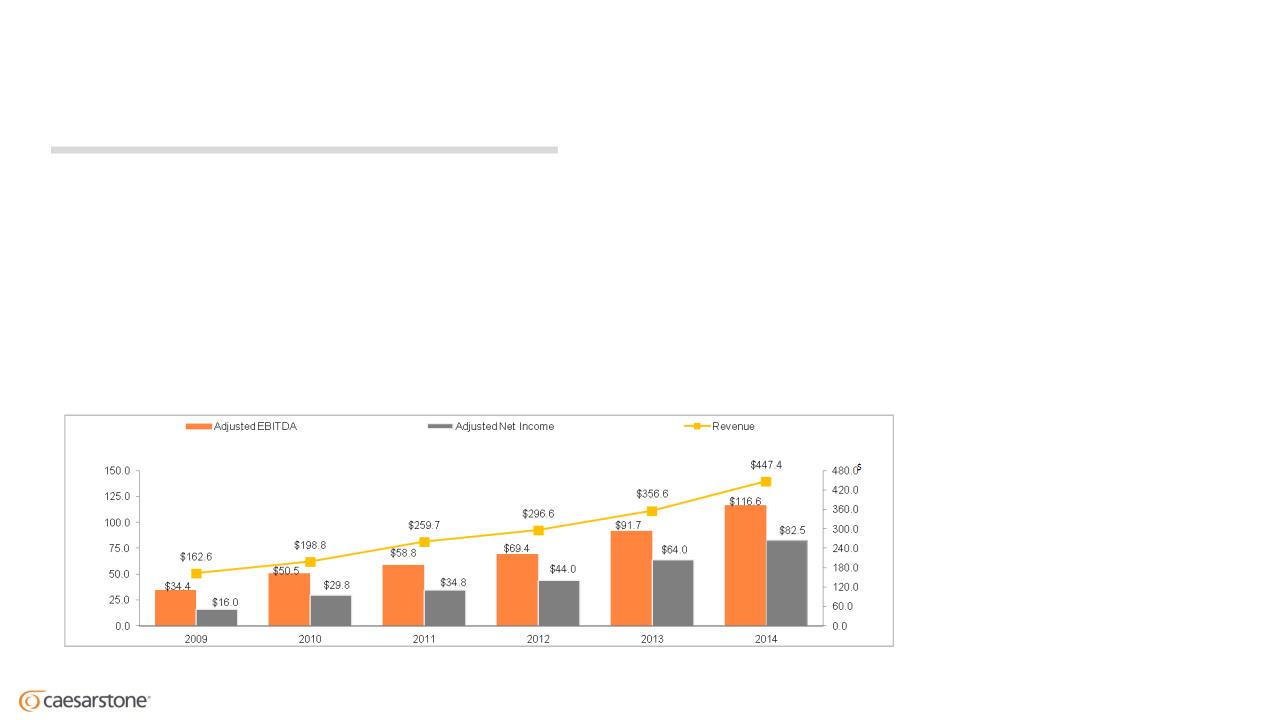
Best in Class - Strong Performance Through the Cycle ($mm)

6
2014 Quartz Share of Countertop Market by Region (by volume)
§ 2014 market penetration - 10% by sales²
§ Fastest growing surfaces category (’99 - ’14)
§ Grew at 15.7% CAGR
§ From 2% penetration in 1999
§ Capturing high % market share in key markets
Quartz Market Opportunity — Quartz is the
Fastest Growing Category in an $81bn¹ Market
Fastest Growing Category in an $81bn¹ Market
$81B Global Countertop Market Material Segmentation (2014 sales)
¹ Freedonia report, Feb. 2015; Sales to end-consumers in 2014 based on average installed price, which includes installation and other related costs;
the Company estimates that 40-50% of the total sales represents sales by manufacturers
² Based on market size data, Freedonia report, Feb. 2015

7
The U.S. Remains a Significant Opportunity
1 Source: Freedonia report February 2015; Company estimates
Calculation applies 1% increase in quartz penetration (by volume) based on 2014 total market volume and 2014 quartz prices as provided by Freedonia February 2015 report
2 HousingEconomics.com - Feb’15
3 Home Improvement Research Institute, March 2015
1,001k
2014
2016E
1,400k
U.S. New Housing Starts2
U.S. Home Improvement Product Sales3
Caesarstone U.S. Revenue Performance ($mm)
U.S. Market Penetration (by volume)
1% increase in
penetration ≈ $350mm1
penetration ≈ $350mm1
21%
9%
42%
50%
186
23%
YoY organic growth

8
Successful Innovative Products

9
Statuario Nuvo 5111

10
Vanilla Noir 5100

11
Bianco Drift 6131

12
Tommy Hilfiger chose Caesarstone
for his countertop and flooring
(Published in Architectural Digest)
Designer Trace Lehnhoff chose
Caesarstone Pure White for Neil Patrick
Harris’ new kitchen (Published in
Architectural Digest)
Caesarstone Pure White for Neil Patrick
Harris’ new kitchen (Published in
Architectural Digest)
A Leading Brand
Ty Pennington, Television Host
“You walk into a home and you
see the kitchen has Caesarstone in
it? It changes the way you look at
the value of that house.”
see the kitchen has Caesarstone in
it? It changes the way you look at
the value of that house.”

13
Caesarstone was ranked #63 in FORTUNE’s
Fastest-Growing Companies list for 2015
Fastest-Growing Companies list for 2015
Fast Growing Company
(Published 2015)

14
Spruce Point Capital Management published on August 19, 2015 a so-called “Investment Research Report”
while identifying itself as having a short position in Caesarstone’s shares and stating that it therefore stands
to realize significant gains if the price of Caesarstone’s shares declines.
while identifying itself as having a short position in Caesarstone’s shares and stating that it therefore stands
to realize significant gains if the price of Caesarstone’s shares declines.
Spruce Point’s report misrepresents Caesarstone’s business. The report is disturbing because of the nature
and extent of its misstatements, omissions and errors.
and extent of its misstatements, omissions and errors.
In our view, the report should not be relied upon by shareholders and potential investors in Caesarstone.
Spruce Point’s report, again, is false and misleading. As we stated after the publication of the Spruce Point
report, we stand by all of our previous public statements, regulatory filings and presentations. This includes
those statements that Spruce Point’s report seeks to call into question.
report, we stand by all of our previous public statements, regulatory filings and presentations. This includes
those statements that Spruce Point’s report seeks to call into question.
Spruce Point Report

15
Spruce Point misrepresents Caesarstone’s business, and stands to profit from any negative view
created in the minds of investors relying on its misrepresentations and its “short agenda”.
created in the minds of investors relying on its misrepresentations and its “short agenda”.
Spruce Point’s claims refer to the following:
- Caesarstone’s products and brand
- Caesarstone’s financials and reports
- Market trends and Caesarstone’s premium position
We will refer in this presentation to the principal misrepresentations in the Spruce Point report and
explain how Spruce Point has misled shareholders and potential investors.
explain how Spruce Point has misled shareholders and potential investors.
We believe given the nature and extent of the misstatements, omissions and errors in the Spruce Point
report that they may be intentional and we reserve our rights to take appropriate legal action.
report that they may be intentional and we reserve our rights to take appropriate legal action.
Spruce Point Report

16
Caesarstone Products and Brand
17
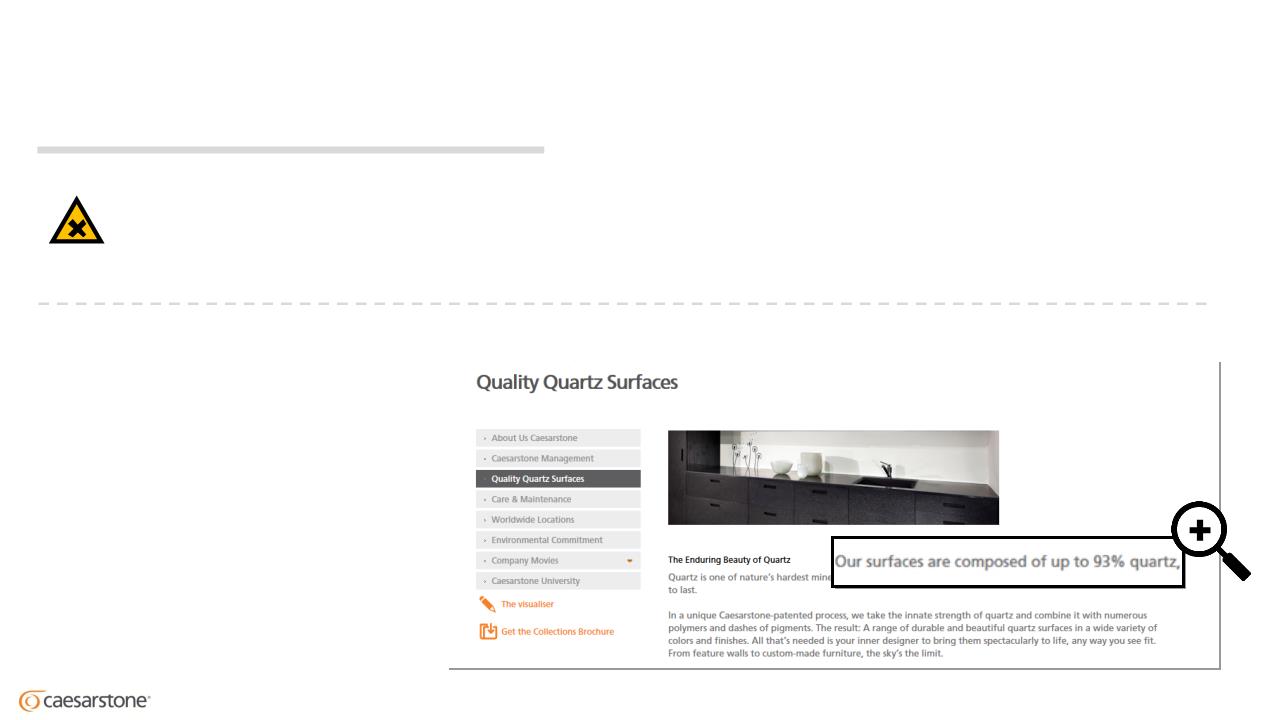
§ Caesarstone states very clearly
that its products contain “up to”
93% quartz - see, for example, the
company’s web site
that its products contain “up to”
93% quartz - see, for example, the
company’s web site
§ According to the Company’s
annual report on Form 20-F for
2014, Caesarstone’s products
contain “approximately 90%”
quartz.
annual report on Form 20-F for
2014, Caesarstone’s products
contain “approximately 90%”
quartz.
Spruce Point’s misrepresentation:
Caesarstone advertises that its products
contain 93% quartz, but they may contain
less quartz
contain 93% quartz, but they may contain
less quartz
FACT:
Caesarstone states clearly that its products
contain up to 93% quartz
contain up to 93% quartz
From Caesarstone’s web site
Stated Quartz Content
!

18
§ The percentage of quartz in a quartz surface differs slightly between different models, as a result of the
different size of the quartz grains used
different size of the quartz grains used
§ Delicate designed colors that have smaller quartz grains contain more binder material
§ Spruce Point misleadingly chose to compare Caesarstone models with delicate designs to competitors’
models with bigger quartz grains
models with bigger quartz grains
§ Product quality is achieved by the optimal combination of all ingredients. Quartz percentage alone is not the
relevant parameter for determining the product quality
relevant parameter for determining the product quality
§ We are proud of, and known for our high quality premium products
FACT:
Caesarstone’s products contain optimal quartz
content compared to competitors’ products;
content compared to competitors’ products;
Product quality relative to competing products
cannot be simply measured by quartz content
cannot be simply measured by quartz content
Quartz Content Comparison
!
Spruce Point’s misrepresentation :
Caesarstone’s products contain less quartz
than competitors’ products
than competitors’ products

19
Spruce Point’s misrepresentation:
Cautionary reviews amplify concerns about
product quality
product quality
FACT:
Very high level of consumer satisfaction with
Caesarstone products’ quality
Caesarstone products’ quality
Quality — Consumer Satisfaction
!
§ Caesarstone faces less than 0.5% warranty claims out of sold
products annually
products annually
§ A lifetime warranty is granted in the U.S. for all products
§ Warranty complaints are submitted to our customer service
department, and are handled to the full satisfaction of the
customer
department, and are handled to the full satisfaction of the
customer
§ A few individual complaints that appear on the internet and were
selectively picked by Spruce Point are not indicative of our
customer service level
selectively picked by Spruce Point are not indicative of our
customer service level
§ Spruce Point selectively quoted a few complaints about
Caesarstone from Countertop Investigator. But Countertop
Investigator’s review on Caesarstone makes clear the opposite:
Caesarstone from Countertop Investigator. But Countertop
Investigator’s review on Caesarstone makes clear the opposite:
§ Customers are extremely happy with Caesarstone countertops
§ Caesarstone’s service level is excellent
From countertop investigator web site

20
Spruce Point’s misrepresentation:
Since 1987 the company has introduced three
additional product collections. Caesarstone
has introduced only a few new collections in
the past few years
additional product collections. Caesarstone
has introduced only a few new collections in
the past few years
FACT:
Since 2012 Caesarstone has successfully
launched 20 new colors in the U.S. market.
Caesarstone continues to expand its
differentiated product offerings worldwide
launched 20 new colors in the U.S. market.
Caesarstone continues to expand its
differentiated product offerings worldwide
Innovation Pace
!
Clamshell
Dreamy Marfil
Emperadoro
London Grey
Organic White
Piatra Grey
Wild Rice
Red shimmer
Alpine Mist
Bianco Drift
Calacatta Nuvo
Coastal Grey
Frosty Carrina
Ocean foam
sleek concrete
Vanilla Noir
Woodlands
fresh concrete
raw concrte
Buttermilk

21
Caesarstone Financials and Reports

22
Spruce Point’s misrepresentation:
Quartz prices increased by 20% as opposed
to 4% represented by the Company
to 4% represented by the Company
FACT:
Our cost of quartz increased by approximately
4% from 2013 to 2014 as stated in our Form
4% from 2013 to 2014 as stated in our Form
20-F for 2014
Quartz Prices Increase
!
Spruce Point presented two letters entered into between Caesarstone and Mikroman, one of its Turkish suppliers,
stating that quartz prices increased 20%. But Spruce Point fails to mention that:
stating that quartz prices increased 20%. But Spruce Point fails to mention that:
A.One of the letters, dated February 6, 2012, sets forth the prices for the year 2012 and the other letter, dated
December 19, 2013, sets forth the prices for the year 2014. That means that the 20% increase of Mikroman prices
reflects changes over two years and not one year, as stated by Spruce Point; and
December 19, 2013, sets forth the prices for the year 2014. That means that the 20% increase of Mikroman prices
reflects changes over two years and not one year, as stated by Spruce Point; and
B.Four Turkish quartzite suppliers supplied approximately 67% of our total quartz consumption in 2014, and
Mikroman was only one of them. The overall quartz price mix has increased by approximately 4%, as we stated.
Mikroman was only one of them. The overall quartz price mix has increased by approximately 4%, as we stated.

23
Spruce Point’s misrepresentation:
In light of the rising Quartz prices, it is possible
that Caesarstone is mitigating price increases
by including less quartz
that Caesarstone is mitigating price increases
by including less quartz
FACT:
As stated in our 20-F, polyester is significantly more
expensive than quartz. The company’s cost incentive
will thus always be to maximize quartz content and
minimize polyester
expensive than quartz. The company’s cost incentive
will thus always be to maximize quartz content and
minimize polyester
Quartz Content and Cost Saving
!
§ Resin (polyester) is the key ingredient in our products in addition to quartz. As resin is much more expensive than
quartz, the company’s cost incentive will always be to maximize quartz content and minimize resin content.
quartz, the company’s cost incentive will always be to maximize quartz content and minimize resin content.
§ As stated in our Form 20-F for 2014, despite the fact that our products contain ~90% quartz, the cost of quartz
was only 31% of our total raw material costs in 2014 while polyester was 43% of such costs.
was only 31% of our total raw material costs in 2014 while polyester was 43% of such costs.

24
Spruce Point’s misrepresentation:
Caesarstone’s reported gross margin is in
question because of the gross margins of
Australia and Singapore subsidiaries
question because of the gross margins of
Australia and Singapore subsidiaries
FACT:
Subsidiary-level gross margins reflect transfer pricing
adjustments and are not relevant to the consolidated
result
adjustments and are not relevant to the consolidated
result
and Singaporean Subsidiaries
!
§ Caesarstone distribution subsidiaries’ margins reflect transfer prices between the parent company and
the distribution subsidiaries - which do not impact the Company’s consolidated results (except tax
expense)
the distribution subsidiaries - which do not impact the Company’s consolidated results (except tax
expense)
§ Those transfer prices are based on transfer pricing studies
§ In no way do those transfer prices impact the consolidated results of the company (except its net income
due to the impact on tax expenses)
due to the impact on tax expenses)
Gross Margins of the Australian

25
Spruce Point’s misrepresentation:
Significant margin erosion appears to be
masked by FX benefits; a pro-forma analysis
for Q2 2015 prepared by Spruce Point suggests
that real margins would be 3.7% - 5% lower
than reported, without FX impact
masked by FX benefits; a pro-forma analysis
for Q2 2015 prepared by Spruce Point suggests
that real margins would be 3.7% - 5% lower
than reported, without FX impact
FACT:
Q2’15 gross margin was impacted negatively by
approximately 200 basis points compared to Q2’14 as
stated in our Q2’15 earnings call
approximately 200 basis points compared to Q2’14 as
stated in our Q2’15 earnings call
Impact of Foreign Exchange Rates
!
§ Spruce Point pro-forma analysis is misleading and erroneous:
§ Spruce Point inserted incorrect numbers for our Q2'14 (COGS, Gross Profit and Gross Margin are wrong)
§ In analyzing revenue on a constant currency basis, Spruce Point failed to give effect to the Australian dollar
devaluation, which is the most sensitive currency for us and which devalued significantly year over year
devaluation, which is the most sensitive currency for us and which devalued significantly year over year
§ Spruce Point did not give nearly enough effect to the euro on revenue on a constant currency basis
§ As a result, Spruce Point’s pro-forma revenue is $8.2M too low and misrepresents the impact of different
currencies on the company’s results
currencies on the company’s results
§ For COGS Spruce Point gave an exaggerated effect to a weakened NIS, whereas NIS represents much less than
50% of company’s COGS (Raw Material, which is ~50% of COGS, is almost all in U.S. dollars and euros)
50% of company’s COGS (Raw Material, which is ~50% of COGS, is almost all in U.S. dollars and euros)

26
Spruce Point’s misrepresentation :
Caesarstone’s Cash Flow not reconciling with
Balance Sheet changes
Balance Sheet changes
FACT:
Cash Flow and Balance Sheet changes are aligned
subject to standard accounting rule requirements
subject to standard accounting rule requirements
Cash Flow vs. Balance Sheet
!
§ All year over year changes reflected in our BS are fully aligned with our CF, with respect to all years referred to by
Spruce Point. Spruce Point’s claim otherwise is false
Spruce Point. Spruce Point’s claim otherwise is false
§ In accordance with applicable accounting standards, the BS and CF structure and items’ classifications are different.
For example, the $8,806K increase in Account Payables in 2014 as appears in the BS, is included in the CF, divided
into 2 different lines: $1,811K account payables related to non-Fixed Asset and $6,992K related to Fixed Assets AP
(all numbers are rounded to the closest number)
For example, the $8,806K increase in Account Payables in 2014 as appears in the BS, is included in the CF, divided
into 2 different lines: $1,811K account payables related to non-Fixed Asset and $6,992K related to Fixed Assets AP
(all numbers are rounded to the closest number)
§ Spruce Point used wrong numbers in the table included in slide 28 to their report, and thus created a
misrepresentation with respect to changes to Inventories and Trade Receivables in 2014; all such changes are
reflected appropriately in Caesarstone’s CF
misrepresentation with respect to changes to Inventories and Trade Receivables in 2014; all such changes are
reflected appropriately in Caesarstone’s CF
§ Our reports are made in accordance with the applicable accounting standards

27
Spruce Point’s misrepresentation:
PCAOB 2013 inspection reports show significant
deficiencies
deficiencies
FACT:
PCAOB reports referred to by Spruce Point are not
related to Caesarstone, and Spruce Point had no
reason to assume otherwise
related to Caesarstone, and Spruce Point had no
reason to assume otherwise
!
PCAOB Comments
§ Spruce Point wrongly suggests that Caesarstone’s financials are of low integrity, suggesting that this is evidenced by
PCAOB inspections published in 2013 and 2010
PCAOB inspections published in 2013 and 2010
§ PCAOB comments on E&Y audits presented by Spruce Point refer to other companies and have nothing to do with
Caesarstone’s Financial Statements:
Caesarstone’s Financial Statements:
§ PCAOB inspection of the audit of Caesarstone financials was conducted for the first time in 2014 on our 2012
financials
financials
§ The 2013 PCAOB report quoted by Spruce Point refers to an inspection conducted in 2012 in relation to the
financial statements of 2011
financial statements of 2011
§ The 2010 report refers to an inspection conducted in 2006 in relation to the financial statements of 2004.
Caesarstone was not even public company in these years
Caesarstone was not even public company in these years
§ Searching PCAOB’s inspection results in Israel for the largest auditors (including E&Y which is considered as one
of the “Big Four”) shows that E&Y’s comment rate was the lowest
of the “Big Four”) shows that E&Y’s comment rate was the lowest

28
Spruce Point’s misrepresentation:
§ Unusual significant spread between CSTE’s DSO and
DPO - “The spread of 30 at year end 2014 was the
widest in the past 4 years ... CSTE is trying to stretch
out its payable … to generate temporary cash flow
from operations and may be having trouble collecting
from its customers”
DPO - “The spread of 30 at year end 2014 was the
widest in the past 4 years ... CSTE is trying to stretch
out its payable … to generate temporary cash flow
from operations and may be having trouble collecting
from its customers”
FACT:
Spruce Point drew a misleading graph with two
separate bars and scales for DSO and DPO, thereby
creating the wrong impression of an increasing gap
between DSO and DPO in 2014 vs. all previous years.
separate bars and scales for DSO and DPO, thereby
creating the wrong impression of an increasing gap
between DSO and DPO in 2014 vs. all previous years.
!
Gap Between Payables and Receivables Days
§ In 2011 and 2012, the gaps between DSO and DPO were approximately 22 and 23 days respectively, and
in 2013 and 2014, approximately 30 and 31 days, respectively
in 2013 and 2014, approximately 30 and 31 days, respectively
§ The gap between DSO and DPO increased to 30 days since moving to direct distribution in the U.S. and
Canada and with increasing capital expenditures in 2013 and 2014, which carry longer payment terms
Canada and with increasing capital expenditures in 2013 and 2014, which carry longer payment terms
§ See graphs which speak for themselves on the next slide

29
Gap Between Payables and Receivables Days (cnt’d)
Spruce Point chart with misleading scales
Chart with single scale

30
Market Trends and Caesarstone Premium Position
31
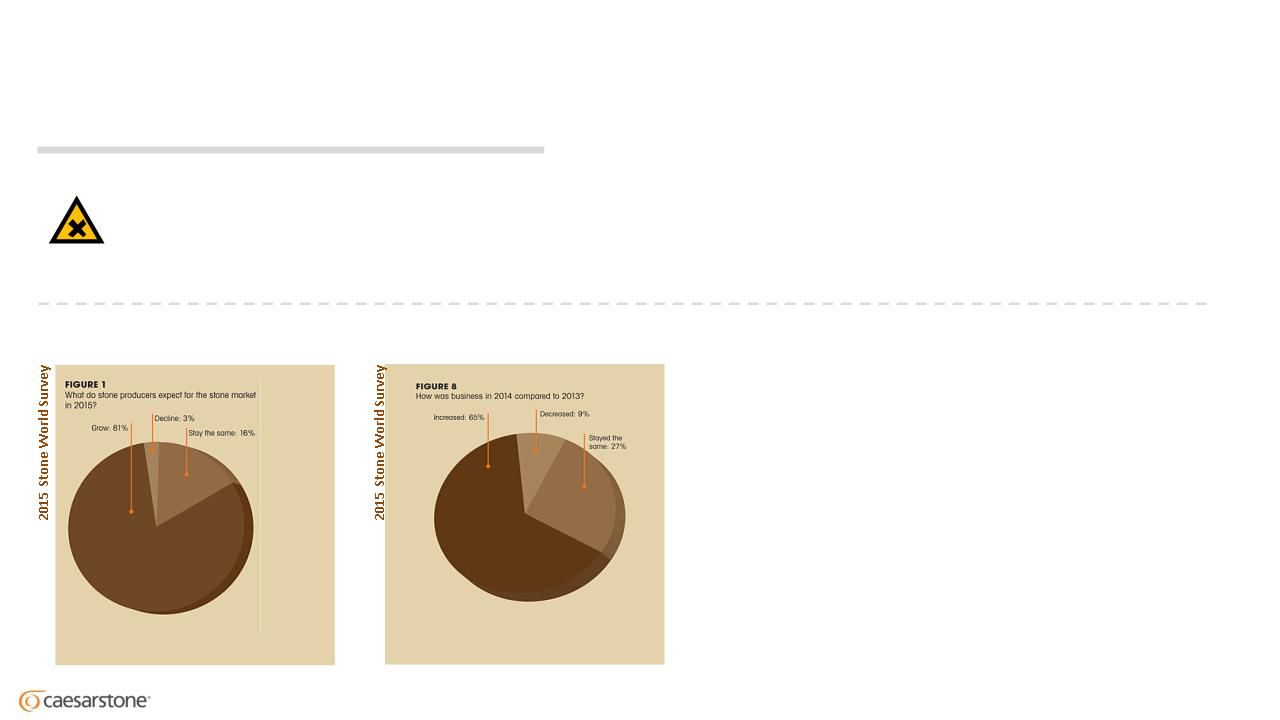
81% of fabricators said they expected sales
revenue to increase in 2015
revenue to increase in 2015
65% of fabricators watched their
business grow during 2014
business grow during 2014
§ Spruce Point selectively mentioned certain findings in
the Stone World 2015 Fabricator Survey, stating that
37% of the fabricators identified margin as their
challenge
the Stone World 2015 Fabricator Survey, stating that
37% of the fabricators identified margin as their
challenge
§ What is new about that? Usually one of the
common business challenges is maintaining
margins
common business challenges is maintaining
margins
§ Spruce Point failed to mention that the same report
found that in 2014 and 2015 65% and 81% of the
fabricators, respectively, were optimistic about their
business growth and expected the stone market to
grow
found that in 2014 and 2015 65% and 81% of the
fabricators, respectively, were optimistic about their
business growth and expected the stone market to
grow
1
2
Spruce Point’s misrepresentation:
Stone fabricators are worried about margin
contraction
contraction
!
Fabricators’ Business Insights
FACT:
A minority of fabricators (naturally) see margins
as a challenge and the majority are reporting
growth in their business at the same time and
expecting the stone market to grow
as a challenge and the majority are reporting
growth in their business at the same time and
expecting the stone market to grow

32
§ R&D expenses grew at 31% year over year in 2014 while revenue grew 25%
§ In 2012 we realigned functions between our R&D department and our operations department. This change
improved our innovation related efficiency, although part of the expense and headcount that was classified
as R&D expense has been shifted to COGS
improved our innovation related efficiency, although part of the expense and headcount that was classified
as R&D expense has been shifted to COGS
Spruce Point’s misrepresentation:
Caesarstone portrays itself as a premium
product but its R&D margins and headcount
are shrinking
product but its R&D margins and headcount
are shrinking
!
R&D Expenses
FACT:
We have a strong and high performing R&D
team, responsible for our continuing
successful offering of innovative products.
R&D expenses and headcount grew in line
with our business growth
team, responsible for our continuing
successful offering of innovative products.
R&D expenses and headcount grew in line
with our business growth

33
§ We grew our M&S to build strong direct distribution operation in the U.S. and Canada by 112% and 38% in
2011 and 2012, respectively - well above revenue growth
2011 and 2012, respectively - well above revenue growth
§ In the last 2 years we were able to leverage a lower percentage of M&S expenses while increasing revenues
by approximately 28% on a constant currency basis
by approximately 28% on a constant currency basis
§ We believe we invest appropriately to grow our business, while capturing the benefit of scale
Spruce Point’s misrepresentation:
Caesarstone Marketing and Sales margins have fallen
sharply
sharply
§ If Caesarstone doesn’t spend more - sales growth
will decline
will decline
§ If Caesarstone spends more on marketing - EBITDA
margins will be lower
margins will be lower
!
M&S Expenses
FACT:
We have strong marketing and sales
resources, as reflected in our strong brand
and top line growth
resources, as reflected in our strong brand
and top line growth

34
§ Since 2014 we added production lines to answer growing global demand for our products (line 5 in Israel and line 6 in
the U.S.; line 7 in the U.S. is expected to be operational in Q4’15)
the U.S.; line 7 in the U.S. is expected to be operational in Q4’15)
§ Adding manufacturing capacity in the U.S. is aimed at even better serving our main market, a key growth engine
§ The U.S. market presents a strong opportunity for us and cannot be described as "saturated“:
§ Quartz penetration is increasing at a quicker rate replacing natural stone and other materials¹
§ Quartz penetration was 5% in 2010, 6% in 2012 and 8% in 2014; yet it is well below Canada (18%) or Australia
(39%)
(39%)
§ The housing market is trending up and the forecast is that this trend will continue²
§ Caesarstone has been demonstrating double digit growth in this market quarter after quarter
§ See next slide addressing the U.S. opportunity
Manufacturing Expansion in the U.S.
Spruce Point’s misrepresentation:
Caesarstone is expanding its manufacturing into
a rapidly saturated market
a rapidly saturated market
!
FACT:
We believe the quartz revolution is gaining
momentum in the U.S. market and there is much
potential for growth. We have added additional
capacity in the U.S. to address growing demand
momentum in the U.S. market and there is much
potential for growth. We have added additional
capacity in the U.S. to address growing demand
¹Source: Freedonia February 2015; Company estimates
2 HousingEconomics.com - Feb’15; Home Improvement Research Institute, March 2015

35
§ There is no basis for any claim regarding the objectivity or integrity of Freedonia group, which has been
researching and analyzing the global and U.S. countertop industries since 2002, publishing more than 20 multi-
client countertop studies
researching and analyzing the global and U.S. countertop industries since 2002, publishing more than 20 multi-
client countertop studies
§ The data source utilized by Spruce Point is applied incorrectly to determine market share without any degree of
precision - page 46 of the Spruce Point report shows quantity of bills of lading without indicating how many
containers each of them represents
precision - page 46 of the Spruce Point report shows quantity of bills of lading without indicating how many
containers each of them represents
§ If we had used the import data presented by Spruce Point, Caesarstone’s implied market share giving effect to
North America suppliers would have been over 25% - which is above the market share derived by Freedonia
North America suppliers would have been over 25% - which is above the market share derived by Freedonia
Caesarstone’s Market Share in the U.S. Market
Spruce Point’s misrepresentation:
Caesarstone is using Freedonia paid-for
research to provide market data, therefore the
data can’t be considered as unbiased; Import
data call into question Caesarstone market
share gains in the U.S.
research to provide market data, therefore the
data can’t be considered as unbiased; Import
data call into question Caesarstone market
share gains in the U.S.
!
FACT:
Import data presented by Spruce Point is
misleading and not indicative as to actual
market share, nor does it show lower market
share for Caesarstone
misleading and not indicative as to actual
market share, nor does it show lower market
share for Caesarstone

36
Thank you

37
(1) Consists of our portion of the results of operations of Caesarstone USA prior to its acquisition by us in May 2011.
(2) Consists of charges to cost of goods sold for the difference between the higher carrying cost of the inventory of two of the Company's subsidiaries- Caesarstone USA's inventory at the time of its acquisition and inventory that was
purchased from its distributor and Caesarstone Australia Pty Limited's inventory that was purchased from its distributor, and the standard cost of the Company's inventory-which adversely impacts the Company's gross margins
until such inventory is sold. The majority of the inventory acquired from Caesarstone USA was sold in 2011, and the majority of the inventory acquired from the Australian distributor was sold in 2012.
(3) In 2013, share-based compensation consists of expenses related to the stock options granted to employees of the Company. In 2014, share-based compensation consists primarily of expenses related to the stock options granted to
employees of the Company, as well as expenses related to share-based rights granted during the period.
employees of the Company, as well as expenses related to share-based rights granted during the period.
(4) Relates to a change in estimate for the value of inventory following the implementation of the Company's new ERP system in April 2013.
(5) In 2013, consists of direct expenses related to a follow-on offering that closed in April 2013, including a bonus paid by the Company' former shareholder, Tene, to certain of its employees that under US GAAP the Company is
required to expense against paid-in capital. In 2014, consists of direct expenses related to a follow-on offering that closed in June 2014.
required to expense against paid-in capital. In 2014, consists of direct expenses related to a follow-on offering that closed in June 2014.
(6) Consists of the payment of $1.72 million to certain employees of the Company and $0.25 million to the Company's Chairman for their contribution to the completion of the Company's initial public offering, or IPO.
(7) Relates to the change in fair value of the contingent consideration that was part of the consideration transferred in connection with the acquisition of Caesarstone USA.
(8) In 2011, litigation gain consists of a mediation award in the Company's favor pursuant to two trademark infringement cases brought by Caesarstone Australia Pty Limited. In 2012, litigation gain resulted from a settlement
agreement with the former chief excecutive officer of Caesarstone Australia Pty Limited related to litigation that had been commenced in 2010. Pursuant to the settlement, he transferred to the Company the ownership of all his
shares in Caesarstone Australia Pty Limited received in connection with his employment. The Company did not make any payments in connection with such transfer or other payments to the former chief executive officer. As a
result of the settlement, the Company reversed the liability provision in connection with the litigation and the adjustment is presented net of the related litigation expenses incurred in connection with the settlement.
(9) Relates to our writing down to zero the cost of inventory provided to Microgil, our former third-party quartz processor in Israel, in 2011 in the amount of $1.8 million and our writing down to zero our $1.1 million loan to Microgil, in
each case, in connection with a dispute.
each case, in connection with a dispute.
(10) Relates to an adjustment of provision for taxable employee fringe benefits as a result of a settlement with the Israel Tax Authority and with the National Insurance Intitute of Israel.
(11) Relates to a refund of Israeli value added tax (VAT) associated with a bad debt from 2007

38
(1) Consists of charges to cost of goods sold for the difference between the higher carrying cost of the inventory of two of the Company's subsidiaries- Caesarstone USA's inventory at the time of its acquisition and inventory that was
purchased from its distributor and Caesarstone Australia Pty Limited's inventory that was purchased from its distributor, and the standard cost of the Company's inventory-which adversely impacts the Company's gross margins until
such inventory is sold. The majority of the inventory acquired from Caesarstone USA was sold in 2011, and the majority of the inventory acquired from the Australian distributor was sold in 2012.
(2) In 2013, share-based compensation consists of expenses related to the stock options granted to employees of the Company. In 2014, share-based compensation consists primarily of expenses related to the stock options granted to
employees of the Company, as well as expenses related to share-based rights granted during the period.
employees of the Company, as well as expenses related to share-based rights granted during the period.
(3) Consists of the payment of $1.72 million to certain employees of the Company and $0.25 million to the Company's Chairman for their contribution to the completion of the Company's IPO.
(4) Relates to the change in fair value of the contingent consideration that was part of the consideration transferred in connection with the acquisition of Caesarstone USA.
(5) Relates to a change in estimate for the value of inventory following the implementation of the Company's new ERP system in April 2013.
(6) In 2013, consists of direct expenses related to a follow on-offering that closed in April 2013, including a bonus paid by the Company' former shareholder, Tene, to certain of its employees that under US GAAP the Company is required to
expense against paid-in capital. In 2014, consists of direct expenses related to a follow on offering that closed in June 2014.
expense against paid-in capital. In 2014, consists of direct expenses related to a follow on offering that closed in June 2014.
(7) In 2011, litigation gain consists of a mediation award in the Company's favor pursuant to two trademark infringement cases brought by Caesarstone Australia Pty Limited. In 2012, litigation gain resulted from a settlement agreement
with the former chief excecutive officer of Caesarstone Australia Pty Limited related to litigation that had been commenced in 2010. Pursuant to the settlement, he transferred to the Company the ownership of all his shares in
Caesarstone Australia Pty Limited received in connection with his employment. The Company did not make any payments in connection with such transfer or other payments to the former chief executive officer. As a result of the
settlement, the Company reversed the liability provision in connection with the litigation and the adjustment is presented net of the related litigation expenses incurred in connection with the settlement.
(8) Relates to our writing down to zero the cost of inventory provided to Microgil, our former third-party quartz processor in Israel, in 2011 in the amount of $1.8 million and our writing down to zero our $1.1 million loan to Microgil, in each
case, in connection with a dispute.
case, in connection with a dispute.
(9) Relates to an adjustment of provision for taxable employee fringe benefits as a result of a settlement with the Israel Tax Authority and with the National Insurance Intitute of Israel.
(10) Relates to a refund of Israeli value added tax (VAT) associated with a bad debt from 2007
(11) Tax adjustment as a result of tax settlement with the Israeli tax authorities.
(12) The tax adjustments for the three and Twelve months ended December 31, 2014 and 2013 were based on the effective tax rate (excluding adjustments to the tax line item) for these periods, respectively.
Serious News for Serious Traders! Try StreetInsider.com Premium Free!
You May Also Be Interested In
- Caesarstone Announces Date for First Quarter 2024 Results
- Vinhomes, Vietnam largest property developer, unveils a series of new entertainment and shopping destinations
- Man Group PLC : Form 8.3 - Tyman plc
Create E-mail Alert Related Categories
SEC FilingsSign up for StreetInsider Free!
Receive full access to all new and archived articles, unlimited portfolio tracking, e-mail alerts, custom newswires and RSS feeds - and more!
