

Form 6-K BANK BRADESCO For: Mar 31
 Tweet
Tweet Share
ShareSECURITIES AND EXCHANGE COMMISSION
06029-900 - Osasco - SP
Federative Republic of Brazil
Indicate by check mark whether the registrant by furnishing the information contained in this Form is also thereby furnishing the information to the Commission pursuant to Rule 12g3-2(b) under the Securities Exchange Act of 1934.
Yes _______ No ___X____.

Press Release
 |
Highlights
The main figures obtained by Bradesco in the first quarter of 2016 are presented below: 1. Adjusted Net Income(1) for the first quarter of 2016 stood at R$4.113 billion (a 3.8% decrease compared to the R$4.274 billion recorded in the same period of 2015), corresponding to earnings per share of R$3.52 and Return on Average Adjusted Equity(2) of 17.5%(2). 2. As for the source, the Adjusted Net Income is composed of R$2.733 billion from financial activities, representing 66.4% of the total, and of R$1.380 billion from insurance, pension plans and capitalization bonds operations, which together account for 33.6%. 3. In March 2016, Bradesco’s market capitalization stood at R$143.720 billion(3). 4. Total Assets, in March 2016, stood at R$1.102 trillion, an increase of 6.5% over the March 2015 balance. The return on Average Total Assets was 1.5%. 5. In March 2016, the Expanded Loan Portfolio(4) reached R$463.208 billion, remaining almost stable over March 2015. Operations with individuals totaled R$147.759 billion (an increase of 4.0% over March 2015), while corporate segment operations totaled R$315.449 billion (1.8% decrease over March 2015). 6. Assets under Management stood at R$1.589 trillion, an 11.1% increase over 7. Shareholders’ Equity totaled R$93.330 billion in March 2016, 11.2% higher than in March 2015. Basel III Ratio, calculated based on the Prudential Conglomerate stood at 16.9% in March 2016, 12.9% of which was classified as Common Equity / Tier I. 8. A total of R$1.451 billion was paid to shareholders as Interest on Shareholders’ Equity and Dividends for the profit generated in the first quarter of 2016, of which R$273.240 million were paid monthly in the period and R$1.178 billion provisioned. 9. The Interest Earning Portion of the Net Interest Income stood at R$14.734 billion, an increase of 11.0% compared to the first quarter of 2015. 10. The Delinquency Ratio over 90 days stood at 4.2% in March 2016 (3.6% in March 2015). 11. The Operating Efficiency Ratio (ER)(5) in March 2016 was 37.2% (38.3% in March 2015), while in the “risk-adjusted” concept, it stood at 47.1% (46.9% in March 2015). 12. Insurance Written Premiums, Pension Plan Contributions and Capitalization Bond Income totaled R$15.186 billion in the first quarter of 2016, up 11.4% when compared to the same period of 2015. Technical Reserves stood at R$182.973 billion, an increase of 16.3% compared to the balance in March 2015. 13. Investments in infrastructure, information technology and telecommunications amounted to R$1.390 billion in the first quarter of 2016, up 5.9% over the same period in the previous year. 14. Taxes and contributions paid or recorded in provision, including social security, totaled R$10.039 billion, of which R$2.675 billion were related to taxes withheld and collected from third parties, and R$7.364 billion were calculated based on activities developed by Organização Bradesco, equivalent to 179.0% of the Adjusted Net Income(1). 15. Bradesco has an extensive Customer Service Network in Brazil, with 4,509 Branches and 3,535 Service Points (PAs). Customers of Bradesco can also count on 739 ATMs located on a company’s premises (PAEs), 41,953 Bradesco Expresso service points, 31,668 Bradesco ATMs, and 18,767 Banco24Horas Network ATMs.
March 2015.
4 Economic and Financial Analysis Report – March 2016
Press Release
|
|
Highlights
|
16. Payroll, plus charges and benefits totaled R$3.216 billion. Social benefits provided to all 91,395 employees of Organização Bradesco and their dependents amounted R$820.601 million, while investments in education, training and development programs totaled R$18.870 million. 17. In January 2016, Bradesco informed the market that Bacen approved the acquisition of 100% of the share capital of HSBC Bank Brasil S.A. – Banco Múltiplo and HSBC Serviços e Participações Ltda. ("HSBC"). The completion of the operation is subject to the approval of the other competent regulatory authorities and compliance with legal formalities. 18. In January 2016, Bradesco signed a non-binding Memorandum of Understanding with Banco do Brasil S.A., Banco Santander (Brasil) S.A., Caixa Econômica Federal and Itaú Unibanco S.A., in order to create a holding company of credit intelligence ("GIC"), which will develop a database with the goal of adding, reconciling and handling database and credit-related information, of individuals and legal entities, which expressly authorize their inclusion in the database, as required by the applicable rules. 19. Major Awards and Acknowledgments in the period: · Most valuable brand in Brazil in the last 10 years, according to the ranking promoted by IstoÉ Dinheiro magazine in partnership with consultancy firm Kantar Vermeer, linked to the British group WPP; · Bradesco BBI was awarded “The best investment bank of Brazil” in 2016 in the 17th edition of "Best Investment Banks of the world" (Global Finance magazine); · Considered the best Manager in short-term fund and shares (Fundação Getúlio Vargas (FGV)); and · Leads the ranking for large companies most featured in editions of the yearbook "Valor Carreira", considered, 12 times out of the 14 editions on the workplace, the best in people management (Jornal Valor Econômico newspaper in partnership with Aon-Hewitt). |
Organização Bradesco is fully committed to internationally recognized sustainability and corporate governance initiatives, particularly: Global Compact, PRI (Principles for Responsible Investment), and Equator Principles. We set our guidelines and strategies with a view to incorporating the best sustainability practices into our businesses, considering the context and the potential of each region, thus contributing to the generation of value in the Organization. Our management process adopts economic and socio-environmental indexes developed in Brazil and abroad, such as the Dow Jones Sustainability Index (DJSI), the Corporate Sustainability Index (ISE, of BM&FBovespa), and the Carbon Efficient Index (ICO2, also of BM&FBovespa), as well as the guidelines and indexes of the Global Reporting Initiative (GRI) and the Carbon Disclosure Project (CDP). With a broad social and educational program in place for 59 years, Fundação Bradesco operates 40 schools across Brazil. In 2016, an estimated |
(1) According to the non-recurring events described on page 8 of this Economic and Financial Analysis Report; (2) As of the first quarter of 2016, the annualized profitability has been calculated on a linear basis, (ROAE of 18.7% in the previous criterion, in the first quarter of 2016), and also, it excludes mark-to-market effect of Available-for-Sale Securities recorded under Shareholders’ Equity; (3) Number of shares (excluding treasury shares) multiplied by the closing price for common and preferred shares on the last trading day of the period; (4) Includes sureties and guarantees, letters of credit, advances of credit card receivables, co-obligations in loan assignments (receivables-backed investment funds and mortgage-backed receivables), co-obligations in rural loan assignments and operations bearing credit risk – commercial portfolio, which includes debentures and promissory notes; and (5) In the last 12 months.
Bradesco 5
Press Release
|
|
Main Information
|
1Q16 |
4Q15 |
3Q15 |
2Q15 |
1Q15 |
4Q14 |
3Q14 |
2Q14 |
Variation % | ||
|
1Q16 x 4Q15 |
1Q16 x 1Q15 | |||||||||
|
Income Statement for the Period | ||||||||||
|
Book Net Income |
4,121 |
4,353 |
4,120 |
4,473 |
4,244 |
3,993 |
3,875 |
3,778 |
(5.3) |
(2.9) |
|
Adjusted Net Income |
4,113 |
4,562 |
4,533 |
4,504 |
4,274 |
4,132 |
3,950 |
3,804 |
(9.8) |
(3.8) |
|
Total Net Interest Income |
14,892 |
14,512 |
13,735 |
13,541 |
13,599 |
12,986 |
12,281 |
12,066 |
2.6 |
9.5 |
|
Gross Credit Intermediation Margin |
11,486 |
11,313 |
10,806 |
10,427 |
10,242 |
10,061 |
9,798 |
9,460 |
1.5 |
12.1 |
|
Net Credit Intermediation Margin |
6,038 |
7,121 |
6,954 |
6,877 |
6,662 |
6,754 |
6,450 |
6,319 |
(15.2) |
(9.4) |
|
Allowance for Loan Losses (ALL) Expenses |
(5,448) |
(4,192) |
(3,852) |
(3,550) |
(3,580) |
(3,307) |
(3,348) |
(3,141) |
30.0 |
52.2 |
|
Fee and Commission Income |
6,405 |
6,597 |
6,380 |
6,118 |
5,744 |
5,839 |
5,639 |
5,328 |
(2.9) |
11.5 |
|
Administrative and Personnel Expenses |
(7,870) |
(8,413) |
(7,997) |
(7,544) |
(7,084) |
(7,835) |
(7,192) |
(7,023) |
(6.5) |
11.1 |
|
Insurance Written Premiums, Pension Plan Contributions and Capitalization Bond Income |
15,186 |
19,130 |
15,125 |
16,723 |
13,634 |
17,806 |
12,904 |
13,992 |
(20.6) |
11.4 |
|
Statement of Financial Position | ||||||||||
|
Total Assets (1) |
1,101,763 |
1,079,755 |
1,050,983 |
1,029,762 |
1,034,815 |
1,032,040 |
987,364 |
931,132 |
2.0 |
6.5 |
|
Securities |
414,926 |
407,584 |
364,472 |
356,115 |
344,430 |
346,358 |
343,445 |
333,200 |
1.8 |
20.5 |
|
Loan Operations (2) |
463,208 |
474,027 |
474,488 |
463,406 |
463,305 |
455,127 |
444,195 |
435,231 |
(2.3) |
- |
|
- Individuals |
147,759 |
147,749 |
145,234 |
143,461 |
142,051 |
141,432 |
138,028 |
135,068 |
- |
4.0 |
|
- Corporate |
315,449 |
326,278 |
329,253 |
319,945 |
321,254 |
313,695 |
306,167 |
300,163 |
(3.3) |
(1.8) |
|
Allowance for Loan Losses (ALL) (3) |
(30,497) |
(29,499) |
(28,670) |
(23,801) |
(23,618) |
(23,146) |
(22,623) |
(21,791) |
3.4 |
29.1 |
|
Total Deposits |
189,192 |
195,760 |
203,637 |
195,926 |
211,702 |
211,612 |
211,882 |
213,270 |
(3.4) |
(10.6) |
|
Technical Reserves |
182,973 |
177,835 |
168,629 |
164,566 |
157,295 |
153,267 |
145,969 |
142,731 |
2.9 |
16.3 |
|
Shareholders' Equity |
93,330 |
88,907 |
86,233 |
86,972 |
83,937 |
81,508 |
79,242 |
76,800 |
5.0 |
11.2 |
|
Assets under Management |
1,589,307 |
1,510,396 |
1,452,528 |
1,443,989 |
1,431,090 |
1,426,099 |
1,385,135 |
1,304,690 |
5.2 |
11.1 |
|
Performance Indicators (%) | ||||||||||
|
Adjusted Net Income per Share - R$ (4) (5) |
3.52 |
3.55 |
3.47 |
3.35 |
3.21 |
3.05 |
2.87 |
2.69 |
(0.8) |
9.7 |
|
Book Value per Common and Preferred Share - R$ (5) |
18.56 |
17.68 |
17.14 |
17.28 |
16.67 |
16.19 |
15.74 |
15.25 |
5.0 |
11.3 |
|
Annualized Return on Average Equity (6) (7) |
17.5 |
20.5 |
20.7 |
20.8 |
20.6 |
20.1 |
19.9 |
19.7 |
(3.0) p.p. |
(3.1) p.p. |
|
Annualized Return on Average Assets (7) |
1.5 |
1.7 |
1.7 |
1.7 |
1.7 |
1.6 |
1.6 |
1.6 |
(0.2) p.p. |
(0.2) p.p. |
|
Average Rates - 12 months = (Adjusted Net Interest Income / Total Average Assets - Repos - Permanent Assets) (NIM) |
7.5 |
7.5 |
7.6 |
7.6 |
7.5 |
7.3 |
7.1 |
7.0 |
- |
- |
|
Fixed Asset Ratio (13) |
34.0 |
35.2 |
38.6 |
39.6 |
47.9 |
47.2 |
46.8 |
46.7 |
(1.2) p.p. |
(13.9) p.p. |
|
Combined Ratio - Insurance (8) |
86.1 |
86.5 |
86.9 |
86.5 |
86.8 |
85.9 |
86.5 |
86.3 |
(0.4) p.p. |
(0.7) p.p. |
|
Efficiency Ratio (ER) (4) |
37.2 |
37.5 |
37.9 |
37.9 |
38.3 |
39.2 |
39.9 |
40.9 |
(0.3) p.p. |
(1.1) p.p. |
|
Coverage Ratio (Fee and Commission Income/Administrative and Personnel Expenses) (4) |
80.1 |
80.0 |
79.1 |
78.7 |
77.4 |
76.7 |
75.9 |
74.1 |
0.1 p.p. |
2.7 p.p. |
|
Market Capitalization - R$ million (9) |
143,720 |
100,044 |
113,288 |
142,098 |
150,532 |
145,536 |
146,504 |
134,861 |
43.7 |
(4.5) |
|
Loan Portfolio Quality % (10) |
|
|
|
|
|
|
|
|
|
|
|
ALL / Loan Portfolio (3) |
8.6 |
8.0 |
7.8 |
6.7 |
6.7 |
6.7 |
6.7 |
6.6 |
0.6 p.p. |
1.9 p.p. |
|
Non-performing Loans (> 60 days (11) / Loan Portfolio) |
5.3 |
5.0 |
4.7 |
4.6 |
4.5 |
4.3 |
4.4 |
4.4 |
0.3 p.p. |
0.8 p.p. |
|
Delinquency Ratio (> 90 days (11) / Loan Portfolio) |
4.2 |
4.1 |
3.8 |
3.7 |
3.6 |
3.5 |
3.6 |
3.5 |
0.1 p.p. |
0.6 p.p. |
|
Coverage Ratio (> 90 days (11)) (3) |
204.2 |
198.0 |
205.7 |
180.4 |
187.0 |
189.0 |
187.2 |
186.9 |
6.2 p.p. |
17.2 p.p. |
|
Coverage Ratio (> 60 days (11)) (3) |
162.9 |
161.7 |
168.4 |
146.5 |
149.8 |
156.6 |
154.2 |
149.9 |
1.2 p.p. |
13.1 p.p. |
|
Operating Limits % |
|
|
|
|
|
|
|
|
|
|
|
Basel Ratio - Total (12) (13) |
16.9 |
16.8 |
14.5 |
16.0 |
15.2 |
16.5 |
16.3 |
15.8 |
0.1 p.p. |
1.7 p.p. |
|
Tier I Capital |
12.9 |
12.7 |
11.4 |
12.8 |
12.1 |
12.9 |
12.6 |
12.1 |
0.2 p.p. |
0.8 p.p. |
|
- Common Equity |
12.9 |
12.7 |
11.4 |
12.8 |
12.1 |
12.9 |
12.6 |
12.1 |
0.2 p.p. |
0.8 p.p. |
|
Tier II Capital |
4.0 |
4.1 |
3.0 |
3.2 |
3.1 |
3.6 |
3.7 |
3.7 |
(0.1) p.p. |
0.9 p.p. |
6 Economic and Financial Analysis Report – March 2016
Press Release
|
|
Main Information
|
|
Mar16 |
Dec15 |
Sept15 |
Jun15 |
Mar15 |
Dec14 |
Sept14 |
Jun14 |
Variation % | |
|
Mar16 x Dec15 |
Mar16 x Mar15 | |||||||||
|
Structural Information - Units | ||||||||||
|
Service Points (14) |
63,552 |
65,851 |
71,738 |
74,270 |
74,917 |
75,176 |
74,028 |
73,208 |
(3.5) |
(15.2) |
|
- Branches |
4,509 |
4,507 |
4,593 |
4,628 |
4,661 |
4,659 |
4,659 |
4,680 |
0.0 |
(3.3) |
|
- PAs (15) |
3,535 |
3,511 |
3,496 |
3,463 |
3,502 |
3,486 |
3,497 |
3,497 |
0.7 |
0.9 |
|
- PAEs (15) |
739 |
736 |
845 |
980 |
1,135 |
1,145 |
1,159 |
1,175 |
0.4 |
(34.9) |
|
- External ATM Network - Bradesco (16) (17) |
435 |
627 |
874 |
1,112 |
1,243 |
1,344 |
1,398 |
1,684 |
(30.6) |
(65.0) |
|
- Banco24Horas Network (16) |
11,298 |
11,721 |
11,917 |
12,127 |
12,268 |
12,450 |
12,213 |
12,023 |
(3.6) |
(7.9) |
|
- Bradesco Expresso (Correspondent Banks) |
41,953 |
43,560 |
48,175 |
50,042 |
50,043 |
50,006 |
49,020 |
48,186 |
(3.7) |
(16.2) |
|
- Bradesco Promotora de Vendas |
1,069 |
1,175 |
1,824 |
1,904 |
2,051 |
2,073 |
2,068 |
1,949 |
(9.0) |
(47.9) |
|
- Branches / Subsidiaries Abroad |
14 |
14 |
14 |
14 |
14 |
13 |
14 |
14 |
- |
- |
|
ATMs |
50,435 |
50,467 |
50,113 |
49,410 |
48,941 |
48,682 |
48,053 |
47,612 |
(0.1) |
3.1 |
|
- Bradesco Network |
31,668 |
31,527 |
31,495 |
31,132 |
31,091 |
31,089 |
31,107 |
31,509 |
0.4 |
1.9 |
|
- Banco24Horas Network |
18,767 |
18,940 |
18,618 |
18,278 |
17,850 |
17,593 |
16,946 |
16,103 |
(0.9) |
5.1 |
|
Employees (18) |
91,395 |
92,861 |
93,696 |
93,902 |
94,976 |
95,520 |
98,849 |
99,027 |
(1.6) |
(3.8) |
|
Outsourced Employees and Interns |
13,009 |
13,223 |
13,333 |
13,111 |
12,977 |
12,916 |
12,896 |
12,790 |
(1.6) |
0.2 |
|
Customers - in millions | ||||||||||
|
Active Account Holders (19) (20) |
25.6 |
26.0 |
26.4 |
26.5 |
26.6 |
26.5 |
26.6 |
26.5 |
(1.5) |
(3.8) |
|
Savings Accounts (21) |
55.7 |
60.1 |
57.0 |
57.6 |
58.1 |
59.1 |
52.9 |
51.8 |
(7.3) |
(4.1) |
|
Insurance Group |
50.6 |
49.8 |
48.2 |
47.8 |
47.8 |
46.9 |
46.3 |
45.5 |
1.6 |
5.9 |
|
- Policyholders |
45.1 |
44.2 |
42.5 |
42.0 |
42.0 |
41.1 |
40.5 |
39.6 |
2.0 |
7.4 |
|
- Pension Plan Participants |
2.4 |
2.4 |
2.4 |
2.4 |
2.4 |
2.4 |
2.4 |
2.4 |
- |
- |
|
- Capitalization Bond Customers |
3.1 |
3.2 |
3.3 |
3.4 |
3.4 |
3.4 |
3.4 |
3.5 |
(3.1) |
(8.8) |
|
Bradesco Financiamentos (19) |
2.7 |
2.8 |
2.8 |
2.9 |
3.0 |
3.1 |
3.1 |
3.2 |
(3.6) |
(10.0) |
(1) For more information, please check note 4 – Statement of Financial Position and Statement of Managerial Income, in chapter 6 of this report;
(2) Expanded Loan Portfolio: includes sureties and guarantees, letters of credit, advances of credit card receivables, co-obligations in loan assignments (receivables-backed investment funds and mortgage-backed receivables), co-obligations in rural loan assignments and operations bearing credit risk – commercial portfolio, covering debentures and promissory notes;
(3) Includes provision for guarantees provided, encompassing sureties, guarantees, letters of credit, and standby letter of credit, which comprises the concept of “excess” ALL. In the third quarter of 2015, includes an excess ALL/Worsening of Ratings, considered as an extraordinary event, totaling R$3,704 million; This way, the balance of the excess ALL went from R$4,004 million in June 2015 to R$6,409 million in September 2015;
(4) In the last 12 months;
(5) For comparison purposes, shares were adjusted in accordance with bonuses and stock splits;
(6) Excluding mark-to-market effect of Available-for-Sale Securities recorded under Shareholders’ Equity;
(7) Year-to-Date Adjusted Net Income. As of the first quarter of 2016, the Annualized Returns have been calculated on a linear basis and for the best effect of comparability, the previous periods have been readjusted;
(8) Excludes additional reserves;
(9) Number of shares (excluding treasury shares) multiplied by the closing price for common and preferred shares on the period’s last trading day;
(10) As defined by the Brazilian Central Bank (Bacen);
(11) Overdue loans;
(12) Since October 2013, the Basel Ratio calculation has followed regulatory guidelines set forth in CMN Resolutions No. 4,192/13 and No. 4,193/13 (Basel III);
(13) As of March 2015, the ratio calculated based on the Prudential Conglomerate is included, as set forth in CMN Resolution No. 4,192/13. It is important to note that the Prudential Conglomerate is calculated in accordance with the regulatory guidelines set forth in CMN Resolution No. 4,280/13;
(14) The decrease as of March 2015 is related to (i) the migration of “External ATM Network– Bradesco” to “Banco24Horas Network”; (ii) the deactivation of ATMs from “Banco24Horas Network”; and (iii) the reduction of Bradesco Expresso correspondents;
(15) PA (Service Branch): a result of the consolidation of PAB (Banking Service Branch), PAA (Advanced Service Branch) and Exchange Branches, according to CMN Resolution No. 4,072/12; and PAEs – ATMs located on a company’s premises;
(16) Including overlapping ATMs within the Bank’s own network and the Banco24Horas Network;
(17) This decrease is related to the sharing of external network ATMs by the Banco24Horas Network ATMs;
(18) The decrease in the fourth quarter of 2014 includes, primarily, the transfer of 2,431 employees from Scopus Tecnologia to IBM Brasil;
(19) Number of individual clients (National Registry of Legal Entities (CNPJ) and Individual Taxpayer Registry (CPF));
(20) Refers to first and second checking account holders; and
(21) Number of accounts.
Bradesco 7
Press Release
|
|
Book Net Income vs. Adjusted Net Income
The main non-recurring events that affected Book Net Income in the periods below are presented in the following comparative chart:
|
R$ million |
1Q16 |
4Q15 |
1Q15 |
|
Book Net Income |
4,121 |
4,353 |
4,244 |
|
Non-recurring events (net of tax effects) |
(8) |
209 |
30 |
|
- Gains in the Partial Sale of Investments |
(90) |
- |
- |
|
- Reversal of technical reserves |
- |
(276) |
- |
|
- Contingent Liabilities |
25 |
13 |
30 |
|
- Impairment of assets (1) |
57 |
472 |
- |
|
Adjusted Net Income |
4,113 |
4,562 |
4,274 |
(1) In the first quarter of 2016, it refers to the impairment of Shares, in the amount of R$57 million; and in the fourth quarter of 2015, it refers to the impairment of: (i) Permanent/Intangible Assets, in the amount of R$234 million; and (ii) Shares, in the amount of R$238 million.
Summarized Analysis of Adjusted Income
To provide for better understanding for and comparison purposes, in chapters 1 and 2 of this report we use the Adjusted Income Statement, obtained from adjustments made to the Managerial Income Statement, detailed at the end of this Press Release.
|
Adjusted Income Statement - R$ million |
1Q16 |
4Q15 |
Variation |
1Q16 |
1Q15 |
Variation | ||
|
Amount |
% |
Amount |
% | |||||
|
Net Interest Income |
14,892 |
14,512 |
380 |
2.6 |
14,892 |
13,599 |
1,293 |
9.5 |
|
NII - Interest Earning Portion |
14,734 |
14,380 |
354 |
2.5 |
14,734 |
13,273 |
1,461 |
11.0 |
|
NII - Non-Interest Earning Portion |
158 |
132 |
26 |
19.7 |
158 |
326 |
(168) |
(51.5) |
|
ALL Expenses |
(5,448) |
(4,192) |
(1,256) |
30.0 |
(5,448) |
(3,580) |
(1,868) |
52.2 |
|
Gross Income from Financial Intermediation |
9,444 |
10,320 |
(876) |
(8.5) |
9,444 |
10,019 |
(575) |
(5.7) |
|
Income from Insurance Premiums, Pension Plans and Capitalization bonds, minus Variation of Technical Reserves, Retained Claims and others (1) |
1,625 |
1,493 |
132 |
8.8 |
1,625 |
1,211 |
414 |
34.2 |
|
Fee and Commission Income |
6,405 |
6,597 |
(192) |
(2.9) |
6,405 |
5,744 |
661 |
11.5 |
|
Personnel Expenses |
(3,754) |
(3,839) |
85 |
(2.2) |
(3,754) |
(3,445) |
(309) |
9.0 |
|
Other Administrative Expenses |
(4,116) |
(4,574) |
458 |
(10.0) |
(4,116) |
(3,639) |
(477) |
13.1 |
|
Tax Expenses |
(1,418) |
(1,650) |
232 |
(14.1) |
(1,418) |
(1,309) |
(109) |
8.3 |
|
Equity in the Earnings (Losses) of Unconsolidated |
40 |
93 |
(53) |
(57.0) |
40 |
(20) |
60 |
- |
|
Other Operating Income/ (Expenses) |
(1,669) |
(1,586) |
(83) |
5.2 |
(1,669) |
(1,912) |
243 |
(12.7) |
|
Operating Result |
6,557 |
6,854 |
(297) |
(4.3) |
6,557 |
6,649 |
(92) |
(1.4) |
|
Non-Operating Result |
(87) |
(68) |
(19) |
27.9 |
(87) |
(68) |
(19) |
27.9 |
|
Income Tax / Social Contribution |
(2,311) |
(2,183) |
(128) |
5.9 |
(2,311) |
(2,275) |
(36) |
1.6 |
|
Non-controlling Interest |
(46) |
(41) |
(5) |
12.2 |
(46) |
(32) |
(14) |
43.8 |
|
Adjusted Net Income |
4,113 |
4,562 |
(449) |
(9.8) |
4,113 |
4,274 |
(161) |
(3.8) |
8 Economic and Financial Analysis Report – March 2016
Press Release
|
|
Summarized Analysis of Adjusted Income
Adjusted Net Income and Profitability The return on the Average Adjusted Shareholders’ Equity (ROAE), which is calculated on a linear basis, registered 17.5% in March 2016. In this quarter, the reduction of the adjusted net income, which varied -9.8% in the quarterly comparison, and -3.8% in the annual comparison, impacted, largely, by the increase in allowance for loan losses expenses, as a result of: (i) the levelling of provisioning for corporate client operations, particularly a specific case, whose rating worsening had an impact of R$836 million; and (ii) the effect of an increase in delinquency due to the economic slowdown. The main events that affected adjusted net income are detailed below. Adjusted net income reached R$4,113 million in the first quarter of 2016, a decrease of R$449 million compared to the previous quarter, mainly due to the increase in allowance for loan losses expenses, for the reasons detailed above. However, it is highlighted: (i) the decrease in administrative expenses; and the increment; (ii) the “interest-earning portion of the NII”; and (iii) in the income of insurance premiums, pension and capitalization bonds. In the comparison between the first quarter of 2016 and the same period in the previous year, the adjusted net income decreased R$161 million, which reflects the highest revenues in (i) provision for doubtful debts, for the reasons detailed above; and (ii) personnel and administrative expenses. However, it is highlighted the increase of revenues originated from: (i) the interest earning portion; (ii) the services provided; and (iii) the highest operating result of Insurance, Pension Plans and Capitalization Bonds, net of technical reserves, retained claims and others. Shareholders’ Equity totaled R$93,330 million in March 2016, up 11.2% over March 2015. Basel III Ratio, calculated based on the Prudential Conglomerate, stood at 16.9%, 12.9% of which was classified as Common Equity / Tier I. Total Assets registered R$1.102 trillion in March 2016, a 6.5% increase over March 2015, driven by the increased turnover. Return on Average Assets (ROAA) reached 1.5%, calculated on a linear basis.

Bradesco 9
Press Release
|
|
Summarized Analysis of Adjusted Income
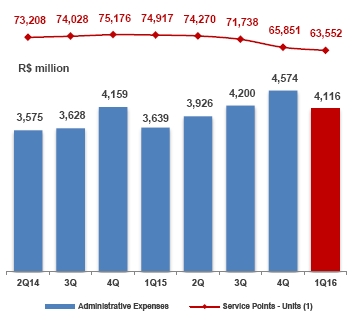
Operating Efficiency Ratio (ER) The 12-month ER(1) reached 37.2% in the first quarter of 2016, once again registering the best historical level, showing improvement of 0.3 p.p. in comparison to the previous quarter, and 1.1 p.p. in comparison to the same period of the previous year, whereby the main variations were due to the increase in (i) the interest earning portion of the NII; (ii) fee and commission income; (iii) higher income from Insurance, Pension Plans and Capitalization Bonds, net of technical reserves, retained claims and others; offset, largely, by: (iv) the increase in operational expenses in the period. The improvement of 3.0 p.p. in the quarterly ER, in the first quarter of 2016, was mainly, due to: (i) lower administrative expenses, arising, basically, (a) from the higher advertising and marketing expenses and (b) larger volumes of transactions and services, in the fourth quarter of 2015; combined with: (ii) the growth of interest-earning portion of the NII. The risk adjusted ER, reflects the impact of the risk associated with loan operations(2) and reached 47.1%, impacted by 0.6 p.p., primarily due to levelling of provisions for corporate clients carried out in the first quarter of 2016.
It is important to mention that the ER performance reflects the strategy of sustainable growth, which includes, among other things, (i) the availability of appropriate products and services for clients through the segmentation of the base and of digital channels, (ii) the optimization of points of service, and (iii) the strict control of operating expenses, arising from the actions of the Efficiency Committee and of investments in Information Technology, in the amount of R$1.390 billion, in the first quarter of 2016.

(1) ER = (Personnel Expenses – Employee Profit Sharing + Administrative Expenses) / (Net Interest Income + Fee and Commission Income + Income from Insurance + Equity in the Earnings (Losses) of Unconsolidated Companies + Other Operating Income – Other Operating Expenses); and
(2) Including ALL expenses, adjusted for discounts granted, loan recovery and sale of foreclosed assets, among others.
10 Economic and Financial Analysis Report – March 2016
Press Release
|
|
Summarized Analysis of Adjusted Income
NII (Net Interest Income)
|
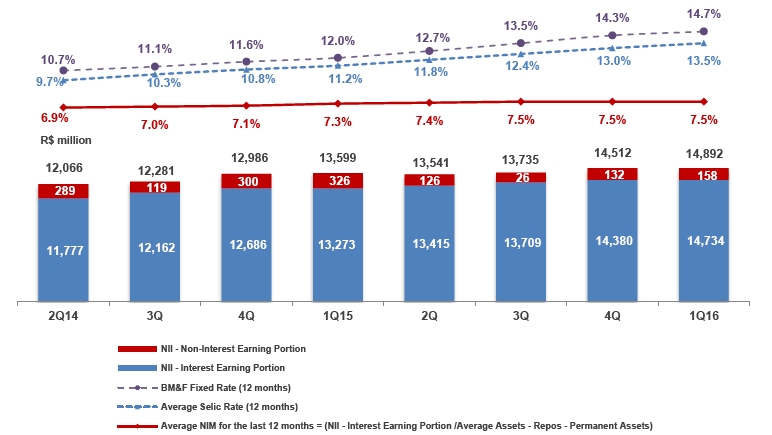
In the quarterly comparison, the R$380 million, or 2.6%, increase was, mainly, due to: (i) the higher interest-earning portion of the NII, to the value of R$354 million, with emphasis on “Securities/Other” and "Credit Intermediation", a result of an improved management in investment resources and funding operations; and (ii) non-interest-earning portion of the NII, in the amount of R$26 million. |
In the comparison between the first quarter of 2016 and the same period in the previous year, the net interest income increased by R$1,293 million, or 9.5%, mainly due to: (i) a higher interest-earning portion of the NII, in the amount of R$1,461 million, particularly in “Credit Intermediation”; and offset by: (ii) the non-interest-earning portion of the NII, in the amount of R$168 million. |
NII - Interest Earning Portion – Average Rates in the last 12 months
|
R$ million |
1Q16 |
1Q15 | ||||
|
Interest |
Average |
Average Rate |
Interest |
Average |
Average Rate | |
|
Credit Intermediation |
11,486 |
370,414 |
12.0% |
10,242 |
360,622 |
11.4% |
|
Insurance |
1,475 |
180,970 |
3.3% |
1,420 |
155,920 |
3.2% |
|
Securities/Other |
1,773 |
411,992 |
1.6% |
1,611 |
371,298 |
1.6% |
|
0 |
|
|
|
|
|
|
|
NII - Interest Earning Portion |
14,734 |
- |
7.5% |
13,273 |
- |
7.3% |
|
0 |
||||||
|
R$ million |
1Q16 |
4Q15 | ||||
|
Interest |
Average |
Average Rate |
Interest |
Average |
Average Rate | |
|
Credit Intermediation |
11,486 |
370,414 |
12.0% |
11,313 |
370,405 |
11.7% |
|
Insurance |
1,475 |
180,970 |
3.3% |
1,523 |
174,030 |
3.4% |
|
Securities/Other |
1,773 |
411,992 |
1.6% |
1,544 |
395,578 |
1.6% |
|
0 |
|
|
|
|
|
|
|
NII - Interest Earning Portion |
14,734 |
- |
7.5% |
14,380 |
- |
7.5% |
The average rate of the NII – interest-earning portion in the last 12 months was 7.5% in the first quarter of 2016. In the year-over-year comparison, the growth of 0.2 p.p. was the reflection of increased profits obtained in the interest earning portions of “Credit Intermediation” and "Insurance”.
Bradesco 11
Press Release
|
|
Summarized Analysis of Adjusted Income
Expanded Loan Portfolio(1) In March 2016, the expanded loan portfolio of Bradesco totaled R$463.2 billion, a 2.3% decrease in comparison to December 2015, impacted, partially, by the exchange rate variation in the quarter. Micro, Small and Medium Sized Enterprises and Corporations presented a reduction of 6.5% and 1.7%, respectively, while the Individual remained stable in the period. In relation to the last 12 months, the balance of the portfolio remained stable, focused on the growth of: (i) 4.0% in the Individual; and (ii) 2.9% in the Large Companies, favored by the exchange rate variation of the period. For Individuals, the products that have the strongest growth in the last 12 months were: (i) real estate financing; and (ii) payroll-deductible loans. For the Corporate segment, the highlights were: (i) export financing; and (ii) operations bearing credit risk – commercial portfolio (debentures and promissory notes).

(1) In addition to Bacen loan portfolio, it includes sureties, guarantees, letters of credit, advances of credit card receivables, debentures, promissory notes, co-obligation in mortgage-backed receivables, and farm loans.
For more information, see Chapter 2 of this Report.
|
Allowance for Loan Losses (ALL) Expenses (1) In the first quarter of 2016, allowance for loan losses expenses totaled R$5,448 million, registering a variation of 30.0%, or R$1,256 million, over the previous quarter, and a variation of 52.2%, or R$1,868 million, over the same quarter of 2015, mainly impacted by: (i) levelling of provisions for corporate clients, particularly a specific case, whose rating worsening had an impact of R$ 836 million; and (ii) by the higher delinquency rate in the quarter, mainly due to the process of deceleration in economic activity. It is important to note that the balance in credit operations – Bacen concept remained stable in the year and presented a decrease of 3.6% in the quarter. The effect in the growth of delinquency rates was mitigated by the reinforcement of the credit granting policies, quality of guarantees, as well as the improvement of the credit recovery processes. It is important to highlight that, from this quarter, the effect of an improvement in the guarantee management system, in terms of vehicle operations, did not produce any relevant effect on the allowance for loan losses expenses. |
|

12 Economic and Financial Analysis Report – March 2016
Press Release
|
|
Summarized Analysis of Adjusted Income
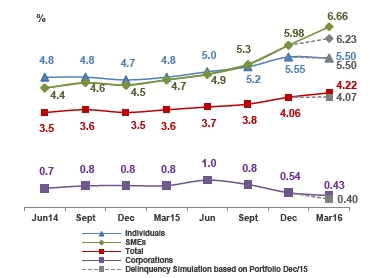
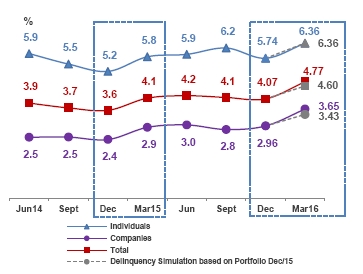
Delinquency Ratio(1) (2) Delinquency over 90 days As expected, the total delinquency ratio, which refers to operations that are over 90 days past due, increased in the quarter, mainly due: (i) to the continuity of the unfavorable economic situation, which impacted the quality of the credit portfolio, mainly for the Individual and Micro, Small and Medium-Sized Enterprises; and (ii) by the reduction of the credit portfolio in the first quarter of 2016, also including Micro, Small and Medium Sized Enterprises.
|
Delinquency from 15 to 90 days In the quarter, short-term delinquency, including operations past due between 15 and 90 days presented growth, impacted, in part, by: (i) seasonal issues of the beginning of the year; and (ii) the individual cases of corporate clients. (1) As defined by Bacen; and |
 |
|
Provisioning, Delinquency, ALL and Effective Coverage Ratio The assertiveness of the provisioning criteria adopted must be mentioned, which is proven by: (i) analyzing historical data on recorded allowances for loan losses; and (ii) effective losses in the subsequent 12-month period. When analyzed in terms of net loss of recovery, for an existing provision of 6.7% of the portfolio(1) in March 2015, the net loss in the subsequent 12 months was 3.3%, that is, representing an effective coverage of 203.0%. It should be highlighted that, considering the losses expected for one year (dotted part), which has a high correlation with E-H non-performing loans, there is an effective coverage of 220.5% for March 2016, which compares well with excess ALL, because it eliminates the effect of any sales of portfolios. |
 |
Bradesco 13
Press Release
|
|
Summarized Analysis of Adjusted Income
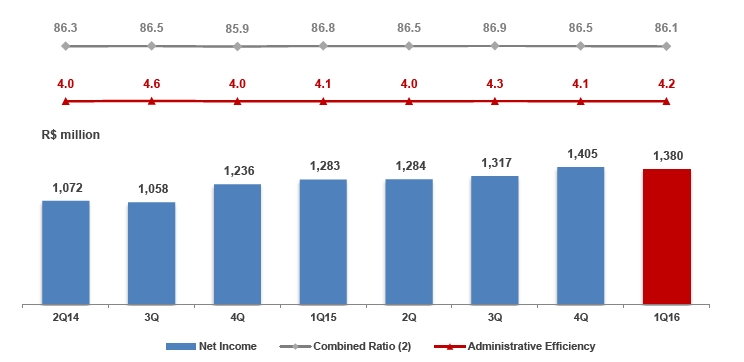
Income from Insurance, Pension Plans and Capitalization Bonds Net Income for the first quarter of 2016 totaled R$1.380 billion (R$1.405 billion in the first quarter of 2015), in line with the previous quarter, presenting an annualized return on Adjusted Shareholder’s Equity of 24.9%(1). In the comparison between the first quarter of 2016 and the same period of the previous year (R$1.283 billion), the net income increased by 7.6%.
|
R$ million (unless otherwise stated) |
1Q16 |
4Q15 |
3Q15 |
2Q15 |
1Q15 |
4Q14 |
3Q14 |
2Q14 |
Variation % | |
|
1Q16 x 4Q15 |
1Q16 x 1Q15 | |||||||||
|
Net Income |
1,380 |
1,405 |
1,317 |
1,284 |
1,283 |
1,236 |
1,058 |
1,072 |
(1.8) |
7.6 |
|
Insurance Written Premiums, Pension Plan Contributions and Capitalization Bond Income |
15,186 |
19,130 |
15,125 |
16,723 |
13,634 |
17,806 |
12,904 |
13,992 |
(20.6) |
11.4 |
|
Technical Reserves |
182,973 |
177,835 |
168,629 |
164,566 |
157,295 |
153,267 |
145,969 |
142,731 |
2.9 |
16.3 |
|
Financial Assets |
200,016 |
191,921 |
182,391 |
179,129 |
170,395 |
166,022 |
158,207 |
154,261 |
4.2 |
17.4 |
|
Claims Ratio (%) |
72.1 |
71.9 |
73.1 |
71.4 |
71.7 |
70.9 |
72.7 |
70.2 |
0.2 p.p. |
0.4 p.p. |
|
Combined Ratio (%) |
86.1 |
86.5 |
86.9 |
86.5 |
86.8 |
85.9 |
86.5 |
86.3 |
(0.4) p.p. |
(0.7) p.p. |
|
Policyholders / Participants and Customers (in thousands) |
50,570 |
49,806 |
48,185 |
47,758 |
47,789 |
46,956 |
46,303 |
45,468 |
1.5 |
5.8 |
|
Employees |
6,959 |
7,023 |
7,052 |
7,074 |
7,082 |
7,113 |
7,135 |
7,152 |
(0.9) |
(1.7) |
|
Market Share of Insurance Written Premiums, Pension Plan Contributions and Capitalization Bond Income (%) (3) |
25.3 |
25.5 |
24.7 |
24.8 |
23.5 |
24.4 |
23.3 |
23.5 |
(0.2) p.p. |
1.8 p.p. |
(1) Calculated on linear basis;
(2) Excluding additional provisions; and
(3) The first quarter of 2016 includes the latest data released by SUSEP (February/16).
Note: For comparability between the indexes in the periods demonstrated above, we disregarded extraordinary effects from the calculation.
14 Economic and Financial Analysis Report – March 2016
Press Release
|
|
Summarized Analysis of Adjusted Income
|
Income from Insurance, Pension Plans and Capitalization Bonds In the first quarter of 2016, the revenue showed an increase of 11.4% in comparison to the same period of the previous year, influenced by “Life and Pension Plans” and “Health Plans” products, which increased 13.6% and 16.8%, respectively. Due to the concentration of private pension contributions, which occur historically in the last quarter of the financial year, the revenue did not present the same performance, in comparison to the fourth quarter of 2015. The net income of the first quarter of 2016 remained in line with the results presented in the previous quarter, basically, due to: (i) a decrease of 0.5 p.p. in the commercialization index; (ii) the maintenance of the claims ratio and the administrative efficiency ratio, even considering the collective bargaining agreement in January 2016; partially offset by: (iii) a decrease in revenues; and (iv) a decrease in the financial and equity results. |
The net income of the first quarter of 2016 was 7.6% higher than the results presented in the same period last year, basically due to: (i) the growth of 11.4% in revenues; (ii) the decrease of 0.5 p.p. in the commercialization index; (iii) the improvement in the financial and equity results; partially offset by: (iv) the increase of the Social Contribution rate (CSLL), that influenced the first quarter of 2016 results; and (v) the increase of 0.4 p.p. in the claims ratio. |
|
Minimum Capital Required – Grupo Bradesco Seguros According to CNSP Resolution No. 321/15, corporations should have adjusted shareholder’s equity (ASE) equal to or higher than the minimum capital required (MCR). MCR is equivalent to the highest value between the base capital and the risk capital. For companies regulated by the ANS, Normative Resolution No. 373/15 establishes that corporations should have adjusted shareholder’s equity (ASE) equal to or higher than the Solvency Margin. |
The capital adjustment and management process is continuously monitored and aims to ensure that Grupo Bradesco Seguros keeps a solid capital base to support the development of activities and cope with the risks in any market situation, in compliance with regulatory requirements and/or Corporate Governance principles. Companies must permanently maintain a capital compatible with the risks for their activities and operations, according to the characteristics and peculiarities of each company belonging to Grupo Bradesco Seguros, represented by adequate capital levels. Grupo Bradesco Seguros permanently observes the limits required by the respective regulatory entities. The Minimum Capital Required in February 2016 was R$8,539 billion. |
Bradesco 15
Press Release
|
|
Summarized Analysis of Adjusted Income
Fee and Commission Income In the comparison between the first quarter of 2016 and the same period of the previous year, the increase of R$661 million, or 11.5%, in the revenues of provision of services, was mainly due to: (i) an increase in the volume of operations, which are arising from the continuous investments in service channels and in technology; and (ii) an advance in the client segmentation process for a better offer of products and services. It must be noted that the lines that have most contributed to this result derived from: (i) an increase in the checking account income, mainly due to an improvement in the client segmentation process; (ii) the good performance of the card business, as a result of (a) the increase in the financial volume traded; and (b) the highest volume of transactions performed; and evolution of revenue with: (iii) asset management; (iv) consortium management; and (v) loan operations, especially income from collaterals. In the first quarter of 2016, fee and commission income totaled R$6,405 million, showing a decrease of R$192 million, or 2.9%, in comparison to the previous quarter, primarily due to the smaller volume of operations/billing, caused by the seasonality of the end of the year and the lower number of business days in the first quarter of 2016, which impacted the revenue generated with: (i) cards; (ii) credit operations; and (iii) checking accounts.

Personnel Expenses In the comparison between the first quarter of 2016 and the same period of the previous year, the increase of R$309 million, or 9.0%, in personnel expenses, is mainly due to the variations in the following expenses: (i) structural portion due to the increase in expenses with payroll, social charges and benefits, impacted by higher salaries, in accordance with the 2015 collective bargaining agreement; and (ii) "non-structural", mainly due to higher expenses with profit sharing to management and employees (EPS) and provision for labor lawsuits. In the first quarter of 2016(1), the decrease of R$85 million, or 2.2%, compared to the previous quarter is mainly composed of the variations in the following expenses: · "structural" – reduction of R$133 million originated, largely, from the higher concentration of vacation, characteristic of the first quarter of each year; and · "non-structural" – increase of R$48 million, basically as a consequence of the higher expenses with profit to management and employees (EPS).

Note: Structural Expenses = Salaries + Social Charges + Benefits + Pension Plans.
Non-Structural Expenses = Employee and Management Profit Sharing + Training + Labor Provision + Costs with termination of employment contracts.
16 Economic and Financial Analysis Report – March 2016
Press Release
|
|
Summarized Analysis of Adjusted Income
Administrative Expenses In the comparison between the first quarter of 2016 and the same period of the previous year, the 13.1%, or R$477 million increase in administrative expenses, was primarily due to an increase in expenses originated from: (i) higher business volume in the period; (ii) contractual adjustments; (iii) the effect of advertising and marketing actions; and offset by: (iv) the optimization of service channels. In the first quarter of 2016, the decrease of 10.0%, or R$458 million, over the previous quarter, was mainly due to: (i) the seasonal effect of greater expenses incurred in the fourth quarter of each year, especially in advertising and marketing, due to the higher concentration of actions related to the institutional campaign and to support the offer of products and services; combined with: (ii) the decrease in business volume, caused by the seasonality of the end of the year; and (iii) the fewer number of business days, resulting in less expenses with: (a) outsourced services; (b) asset maintenance; and (c) data processing.
(1) The decrease as of March 2015 is related to: (i) the migration of “External ATM Network – Bradesco” to “Banco24Horas Network”; (ii) the deactivation of ATMs from “Banco24Horas Network”; and (iii) the decrease of Bradesco Expresso correspondents.
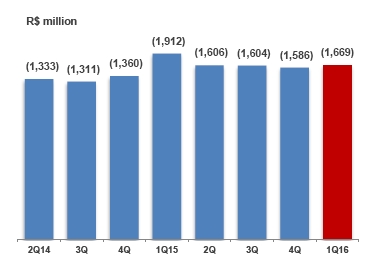
Other Operating Income and Expenses In the first quarter of 2016, other operating expenses, net, totaled R$1,669 million, a R$243 million decrease over the same period of the previous year, primarily due to the constitution of tax provisions, in the first quarter of 2015, relating to the levy of pension plan contributions and IRPJ/CSLL on credit losses, in the amount of R$475 million. In the comparison between the first quarter of 2016 and the previous quarter, other operating expenses increased by R$83 million, or 5.2%, primarily due to: (i) higher expenses with civil provisions; and (ii) higher operating expenses related to insurance activities and cards.
Bradesco 17
Press Release
|
|
Summarized Analysis of Adjusted Income
|
Income Tax and Social Contribution Income tax and social contribution expenses, in the quarterly comparison showed an increase of 5.9%, or R$128 million, mainly due to the higher use of tax benefit in the constitution of interest on shareholder’s equity in the fourth quarter of 2015. In the comparison between the first quarter of 2016 and the same period of the previous year, the increase of 1.6%, or R$36 million, is related to: (i) the increase in the CSLL (social contribution) rate; and partially offset by the: (ii) increase in the TJLP (from 5.5% in the first quarter of 2015 to 7.5% in the first quarter of 2016), which provided a reduction of the tax due to higher values in the constitution of interest on shareholder’s equity in higher values in this quarter. |
 |
|
Unrealized Gains Unrealized gains totaled R$13,097 million at the end of the first quarter of 2016, an R$5,997 million increase over the previous quarter. Such variation was mainly due to: (i) investments, highlighting the shares of Cielo, which appreciated 5.0%; and (ii) securities indexed to fixed income. |
 |
18 Economic and Financial Analysis Report – March 2016
Press Release
|
|
Capital Ratios - Basel III
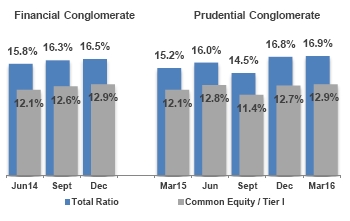
Basel Ratio In March 2016, the Capital of the Prudential Conglomerate stood at R$100,452 million, against risk-weighted assets totaling R$595,757 million. The Basel Ratio presented an increase of 0.1 p.p., from 16.8% in December 2015 to 16.9% in March 2016, and the Common Equity Tier I ratio from 12.7% in December 2015 to 12.9% in March 2016.
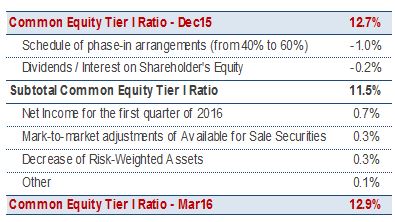
The table below shows the main events that impacted the Common Equity Tier I ratio in the quarter:
It is important to highlight that the impact of the change in phase-in arrangements, from 40% in December 2015 to 60% in January 2016, as defined in CMN Resolution No. 4,192/13, was offset by: (i) an increase in results; (ii) decrease in the credit and market risk-weighted assets; and (iii) the improvement of the mark-to-market adjustments of available for sale securities.
Full Impact – Basel III We calculated a Basel III simulation, considering some of the main future adjustments, which include: (i) the 100% deductions according to the schedule of phase-in arrangements; (ii) the allocation of resources, obtained via payment of dividends, by our Insurance Group; (iii) the use of tax credits; (iv) the decrease in market and operational risk multiplier (early adoption),
from 9.875% to8%; and (v) the impact of the HSBC’s acquisition of, reaching an 11.0% Common Equity ratio, which, added to funding obtained via subordinated debt, may reach a Common Equity Tier I ratio of approximately 12.5% in the end of 2018.

(1) Published (Schedule 60%);
(2) Effect of the full impact. Includes the allocation of resources, obtained via payment of dividends, by the Insurance Group;
(3) Considers the decrease in the market and operational risks multiplier (early adoption), from 9.875% to 8% in 2019;
(4) Under analysis by the Regulating Agencies;
(5) Refers to the minimum required. It is important to highlight that Bacen fixed at 0% the tranche of countercyclical capital required, which could reach up to 2.5% in 2019; and
(6) Considering a possible issuance of additional capital by 2018, according to the Management, depending on market conditions.
Bradesco 19
Press Release
|
|
Economic Environment
The risks present in the international environment intensified at the turn of the year. The loss of the Chinese foreign exchange reserves and devaluation of the Chinese yuan brought back uncertainties regarding the economic conditions of the country. However, the timely action of the main central banks worldwide reduced the volatility of the markets at the end of the first quarter. China promoted new monetary and fiscal stimuli, while the Japanese central bank adopted a negative interest rate for deposits and Europe intensified its program of purchase of sovereign bonds. At the same time, the Federal Reserve (Fed) signaled that it would reduce the rhythm of monetary normalization. As a result, the dollar lost strength in comparison to other currencies and the price of commodities showed some recovery. The domestic economy maintained a trajectory of deceleration in the first quarter, although at a slower rate to that recorded in previous periods. The formal labor market should be highlighted, which showed a reduction in the rate of lay-offs. At the same time, the relief of global financial conditions and incipient signs of the decompression of inflation positively impacted the confidence of the local agents. However, political uncertainties and the slowdown in economic activity continued to hinder the ongoing fiscal adjustment in the short term. Thus, actions to ensure fiscal sustainability in the medium term and the progress on the reform agenda have become even more relevant. Efforts in this direction are a necessary condition to maintain the economic predictability and to increase the level of trust of families and entrepreneurs, enabling the resumption of the trend to increase actual income and productive investments. Additional actions of a structural nature that leverage future growth are also fundamental. The constant search for excellence in education is Brazil’s front line in its struggle to become more competitive and to expedite its efforts to upgrade infrastructure. It is never too much to remember that, in the long term, the main source of economic growth is productivity, a theme that is even more relevant in a global context characterized by increased competition and an economic growth that is still fragile. The investments tend to have an increasingly important role in the composition of growth in coming years, especially in the process of the recovery of economic activity. This should still be favored by greater participation of the capital market in the financing of these projects. At the same time, despite the cyclical retraction of the consumer market in some segments, structurally, the potential of domestic demand for goods and services is not exhausted. Bradesco maintains a positive outlook towards Brazil, with favorable perspectives for its operating segments. Credit volume is evolving in sustainable and risk-compatible rates, even in the face of a cyclical upswing in delinquency rates, due to the retraction of the activity and the reduction of the employment level this year. The circumstances are still very promising for Brazilian banking and insurance sectors in the medium and long term.
20 Economic and Financial Analysis Report – March 2016
Press Release
|
|
Main Economic Indicators
|
Main Indicators (%) |
1Q16 |
4Q15 |
3Q15 |
2Q15 |
1Q15 |
4Q14 |
3Q14 |
2Q14 |
|
Interbank Deposit Certificate (CDI) |
3.27 |
3.37 |
3.43 |
3.03 |
2.81 |
2.76 |
2.72 |
2.51 |
|
Ibovespa |
15.47 |
(3.79) |
(15.11) |
3.77 |
2.29 |
(7.59) |
1.78 |
5.46 |
|
USD – Commercial Rate |
(8.86) |
(1.71) |
28.05 |
(3.29) |
20.77 |
8.37 |
11.28 |
(2.67) |
|
General Price Index - Market (IGP-M) |
2.96 |
3.95 |
1.93 |
2.27 |
2.02 |
1.89 |
(0.68) |
(0.10) |
|
Extended Consumer Price Index (IPCA) |
2.62 |
2.82 |
1.39 |
2.26 |
3.83 |
1.72 |
0.83 |
1.54 |
|
Federal Government Long-Term Interest Rate (TJLP) |
1.82 |
1.72 |
1.59 |
1.48 |
1.36 |
1.24 |
1.24 |
1.24 |
|
Reference Interest Rate (TR) |
0.45 |
0.53 |
0.61 |
0.40 |
0.23 |
0.26 |
0.25 |
0.15 |
|
Savings Account |
1.96 |
2.05 |
2.13 |
1.92 |
1.75 |
1.77 |
1.76 |
1.66 |
|
Business Days (number) |
61 |
63 |
65 |
61 |
61 |
65 |
66 |
61 |
|
Indicators (Closing Rate) |
Mar16 |
Dec15 |
Sept15 |
Jun15 |
Mar15 |
Dec14 |
Sept14 |
Jun14 |
|
USD – Commercial Selling Rate - (R$) |
3.5589 |
3.9048 |
3.9729 |
3.1026 |
3.2080 |
2.6562 |
2.4510 |
2.2025 |
|
Euro - (R$) |
4.0539 |
4.2504 |
4.4349 |
3.4603 |
3.4457 |
3.2270 |
3.0954 |
3.0150 |
|
Country Risk (points) |
409 |
521 |
442 |
304 |
322 |
259 |
239 |
208 |
|
Base Interest Rate - Selic (% p.a.) |
14.25 |
14.25 |
14.25 |
13.75 |
12.75 |
11.75 |
11.00 |
11.00 |
|
BM&F Pre Fixed Rate - 1 year (% p.a.) |
13.81 |
15.86 |
15.56 |
14.27 |
13.52 |
12.96 |
11.77 |
10.91 |
Projections up to 2018
|
% |
2016 |
2017 |
2018 |
|
USD - Commercial Rate (year-end) - R$ |
3.60 |
3.60 |
3.60 |
|
Extended Consumer Price Index (IPCA) |
6.50 |
4.50 |
4.50 |
|
General Price Index - Market (IGP-M) |
6.10 |
4.85 |
5.00 |
|
Selic (year-end) |
12.25 |
10.25 |
9.25 |
|
Gross Domestic Product (GDP) |
(3.50) |
1.50 |
3.00 |
Guidance
Bradesco's Perspective for 2016
This guidance contains forward-looking statements that are subject to risks and uncertainties, as they are based on Management’s expectations and assumptions and information available to the market as of the date hereof.
|
Loan Portfolio (1) |
1 to 5% |
|
Individuals |
4 to 8% |
|
Companies |
0 to 4% |
|
NII - Interest Earning Portion |
6 to 10% |
|
Fee and Commission Income |
7 to 11% |
|
Operating Expenses (2) |
4.5 to 8.5% |
|
Insurance Premiums |
8 to 12% |
|
ALL Expenses (3) |
R$16.5 bi to R$18.5 bi |
(1) Expanded Loan Portfolio;
(2) Administrative and Personnel Expenses; and
(3) Includes incomes with credit recovery.
Bradesco 21
Press Release
|
|
Managerial Income vs. Adjusted Income Statement
Analytical Breakdown of Managerial Income(1) vs. Adjusted Income(3) Statement
First Quarter of 2016 and Fourth Quarter of 2015
|
R$ million |
First Quarter of 2016 |
x |
Fourth Quarter of 2015 | ||||||
|
Managerial Income Statement (1) |
Reclassifications (2) |
Non-Recurring Events |
Adjusted Income Statement (3) |
Managerial Income Statement (1) |
Reclassifications (2) |
Non-Recurring Events |
Adjusted Income Statement (3) | ||
|
Net Interest Income |
20,397 |
(5,613) |
108 |
14,892 |
15,771 |
(1,684) |
425 |
14,512 | |
|
ALL |
(5,919) |
471 |
- |
(5,448) |
(4,799) |
607 |
- |
(4,192) | |
|
Gross Income from Financial Intermediation |
14,478 |
(5,142) |
108 |
9,444 |
10,972 |
(1,077) |
425 |
10,320 | |
|
Income from Insurance, Pension Plans and Capitalization Bonds |
1,625 |
- |
- |
1,625 |
2,019 |
- |
(526) |
1,493 | |
|
Fee and Commission Income |
6,404 |
1 |
- |
6,405 |
6,573 |
24 |
- |
6,597 | |
|
Personnel Expenses |
(3,754) |
- |
- |
(3,754) |
(3,839) |
- |
- |
(3,839) | |
|
Other Administrative Expenses |
(4,116) |
- |
- |
(4,116) |
(4,615) |
41 |
- |
(4,574) | |
|
Tax Expenses |
(1,829) |
416 |
(5) |
(1,418) |
(1,749) |
80 |
19 |
(1,650) | |
|
Equity in the Earnings (Losses) of Unconsolidated |
40 |
- |
- |
40 |
93 |
- |
- |
93 | |
|
Other Operating Income/Expenses |
(2,418) |
704 |
45 |
(1,669) |
(1,796) |
(24) |
234 |
(1,586) | |
|
Operating Result |
10,430 |
(4,021) |
148 |
6,557 |
7,658 |
(956) |
152 |
6,854 | |
|
Non-Operating Result |
92 |
(16) |
(163) |
(87) |
(344) |
94 |
182 |
(68) | |
|
Income Tax / Social Contribution and Non-controlling Interest |
(6,401) |
4,037 |
7 |
(2,357) |
(2,961) |
862 |
(125) |
(2,224) | |
|
Net Income |
4,121 |
- |
(8) |
4,113 |
4,353 |
- |
209 |
4,562 | |
(1) For more information, please check note 4 – Statement of Financial Position and Managerial Income Statement, in chapter 6 of this report;
(2) Includes reclassifications in items from the income statement which do not affect the Net Income, but allow a better analysis of business items, particularly hedge adjustment, which represents the partial result of derivatives used for hedge investments abroad, which in terms of Net Income, simply cancels the tax effect (IR/CS and PIS/COFINS) of this hedge strategy, in the amount of R$4,429 million in the first quarter of 2016 and R$955 million in the fourth quarter of 2015; and
(3) It refers to Managerial Income Statement(1) with the reclassifications between lines, which do not affect the Net Income, and without the extraordinary events of the period.
22 Economic and Financial Analysis Report – March 2016
Press Release
|
|
Managerial Income vs. Adjusted Income Statement
Analytical Breakdown of Managerial Income(1) vs. Adjusted Income(3) Statement
First Quarter of 2016 and First Quarter of 2015
|
R$ million |
First Quarter of 2016 |
|
First Quarter of 2015 | ||||||
|
Managerial Income Statement (1) |
Reclassifications (2) |
Non-Recurring Events |
Adjusted Income Statement (3) |
Managerial Income Statement (1) |
Reclassifications (2) |
Non-Recurring Events |
Adjusted Income Statement (3) | ||
|
Net Interest Income |
20,397 |
(5,613) |
108 |
14,892 |
9,281 |
4,318 |
- |
13,599 | |
|
ALL |
(5,919) |
471 |
- |
(5,448) |
(3,853) |
273 |
- |
(3,580) | |
|
Gross Income from Financial Intermediation |
14,478 |
(5,142) |
108 |
9,444 |
5,428 |
4,591 |
- |
10,019 | |
|
Income from Insurance, Pension Plans and Capitalization Bonds |
1,625 |
- |
- |
1,625 |
1,211 |
- |
- |
1,211 | |
|
Fee and Commission Income |
6,404 |
1 |
- |
6,405 |
5,701 |
43 |
- |
5,744 | |
|
Personnel Expenses |
(3,754) |
- |
- |
(3,754) |
(3,445) |
- |
- |
(3,445) | |
|
Other Administrative Expenses |
(4,116) |
- |
- |
(4,116) |
(3,681) |
42 |
- |
(3,639) | |
|
Tax Expenses |
(1,829) |
416 |
(5) |
(1,418) |
(1,017) |
(292) |
- |
(1,309) | |
|
Equity in the Earnings (Losses) of Unconsolidated |
40 |
- |
- |
40 |
(20) |
- |
- |
(20) | |
|
Other Operating Income/Expenses |
(2,418) |
704 |
45 |
(1,669) |
(2,732) |
771 |
50 |
(1,912) | |
|
Operating Result |
10,430 |
(4,021) |
148 |
6,557 |
1,445 |
5,155 |
50 |
6,649 | |
|
Non-Operating Result |
92 |
(16) |
(163) |
(87) |
(36) |
(33) |
- |
(68) | |
|
Income Tax / Social Contribution and Non-controlling Interest |
(6,401) |
4,037 |
7 |
(2,357) |
2,835 |
(5,122) |
(20) |
(2,307) | |
|
Net Income |
4,121 |
- |
(8) |
4,113 |
4,244 |
- |
30 |
4,274 | |
(1) For more information, please check note 4 – Statement of Financial Position and Managerial Income Statement, in chapter 6 of this report;
(2) Includes reclassifications in items from the income statement which do not affect the Net Income, but allow a better analysis of business items, particularly hedge adjustment, which represents the partial result of derivatives used for hedge investments abroad, which in terms of Net Income, simply cancels the tax effect (IR/CS and PIS/COFINS) of this hedge strategy, in the amount of R$4,429 million in the first quarter of 2016 and R$5,398 million in the first quarter of 2015; and
(3) It refers to Managerial Income Statement(1) with the reclassifications between lines, which do not affect the Net Income, and without the extraordinary events of the period.
Bradesco 23
Press Release
(This page has been left blank intentionally)
|
BANCO BRADESCO S.A. | ||
|
By: |
/S/ Luiz Carlos Angelotti
| |
| Luiz Carlos Angelotti Executive Managing Officer and Investor Relations Officer | ||
This press release may contain forward-looking statements. These statements are statements that are not historical facts, and are based on management's current view and estimates of future economic circumstances, industry conditions, company performance and financial results. The words "anticipates", "believes", "estimates", "expects", "plans" and similar expressions, as they relate to the company, are intended to identify forward-looking statements. Statements regarding the declaration or payment of dividends, the implementation of principal operating and financing strategies and capital expenditure plans, the direction of future operations and the factors or trends affecting financial condition, liquidity or results of operations are examples of forward-looking statements. Such statements reflect the current views of management and are subject to a number of risks and uncertainties. There is no guarantee that the expected events, trends or results will actually occur. The statements are based on many assumptions and factors, including general economic and market conditions, industry conditions, and operating factors. Any changes in such assumptions or factors could cause actual results to differ materially from current expectations.
Serious News for Serious Traders! Try StreetInsider.com Premium Free!
You May Also Be Interested In
- Dimensional Fund Advisors Ltd. : Form 8.3 - BARRATT DEVELOPMENTS PLC - Ordinary Shares
- Dimensional Fund Advisors Ltd. : Form 8.3 - Irish Residential Properties REIT PLC
- Orange: Combined Ordinary and Extraordinary Shareholders’ Meeting of 22 May 2024 Availability of documents
Create E-mail Alert Related Categories
SEC FilingsSign up for StreetInsider Free!
Receive full access to all new and archived articles, unlimited portfolio tracking, e-mail alerts, custom newswires and RSS feeds - and more!
