

Form 425 POST PROPERTIES INC Filed by: MID AMERICA APARTMENT COMMUNITIES INC
 Tweet
Tweet Share
Share| Filed by Mid-America Apartment Communities, Inc. Pursuant to Rule 425 under the Securities Act of 1933 and deemed filed pursuant to Rule 14a-12 under the Securities Exchange Act of 1934
Subject Company: Post Properties, Inc. Commission File No.: 1-12080 |
|
|

COMBINATION CREATES PREMIER SUNBELT MULTIFAMILY REIT A U G U S T 1 5 , 2 0 1 6
|
|
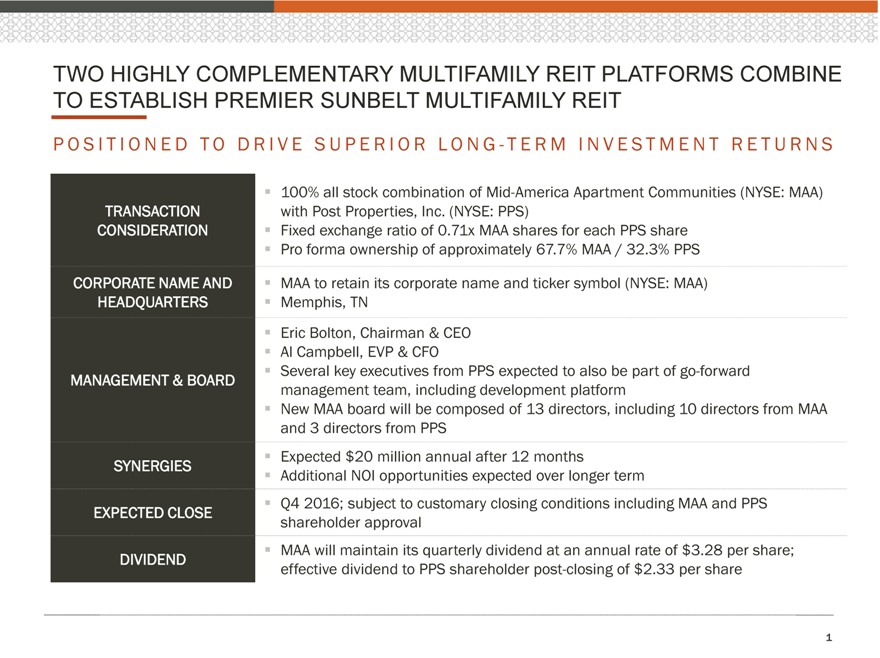
TWO HIGHLY COMPLEMENTARY MULTIFAMILY REIT PLATFORMS COMBINE TO ESTABLISH PREMIER SUNBELT MULTIFAMILY REIT P O S I T I O N E D T O D R I V E S U P E R I O R L O N G—T E R M I N V E S T M E N T R E T U R N S ? 100% all stock combination of Mid-America Apartment Communities (NYSE: MAA) TRANSACTION with Post Properties, Inc. (NYSE: PPS) CONSIDERATION ? Fixed exchange ratio of 0.71x MAA shares for each PPS share ? Pro forma ownership of approximately 67.7% MAA / 32.3% PPS CORPORATE NAME AND ? MAA to retain its corporate name and ticker symbol (NYSE: MAA) HEADQUARTERS ? Memphis, TN ? Eric Bolton, Chairman & CEO ? Al Campbell, EVP & CFO ? Several key executives from PPS expected to also be part of go-forward MANAGEMENT & BOARD management team, including development platform ? New MAA board will be composed of 13 directors, including 10 directors from MAA and 3 directors from PPS ? Expected $20 million annual after 12 months SYNERGIES ? Additional NOI opportunities expected over longer term ? Q4 2016; subject to customary closing conditions including MAA and PPS EXPECTED CLOSE shareholder approval ? MAA will maintain its quarterly dividend at an annual rate of $3.28 per share; DIVIDEND effective dividend to PPS shareholder post-closing of $2.33 per share 1
|
|
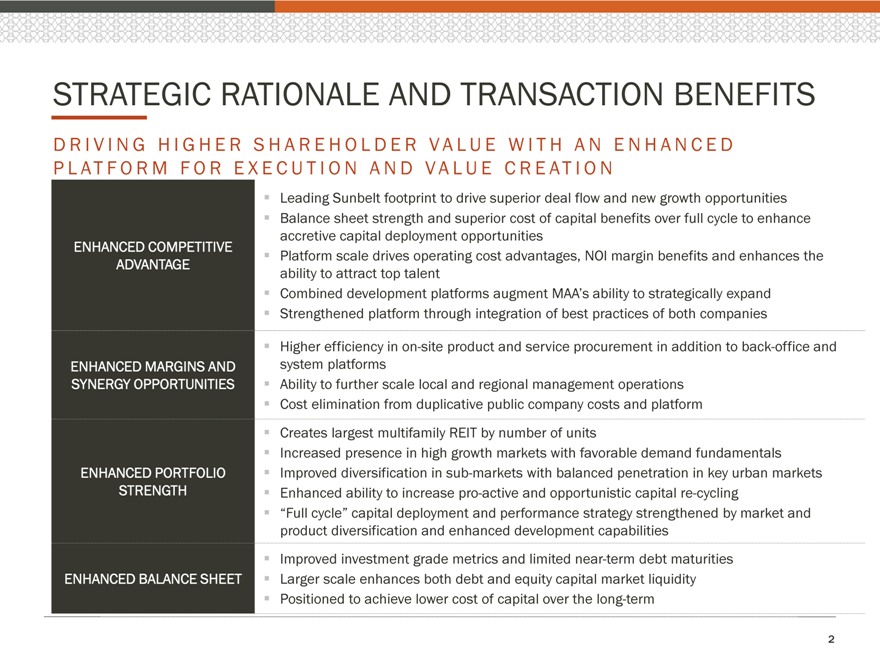
STRATEGIC RATIONALE AND TRANSACTION BENEFITS D R I V I N G H I G H E R S H A R E H O L D E R V A L U E W I T H A N E N H A N C E D P L A T F O R M F O R E X E C U T I O N A N D V A L U E C R E A T I O N ? Leading Sunbelt footprint to drive superior deal flow and new growth opportunities ? Balance sheet strength and superior cost of capital benefits over full cycle to enhance accretive capital deployment opportunities ENHANCED COMPETITIVE ? Platform scale drives operating cost advantages, NOI margin benefits and enhances the ADVANTAGE ability to attract top talent ? Combined development platforms augment MAA’s ability to strategically expand ? Strengthened platform through integration of best practices of both companies ? Higher efficiency in on-site product and service procurement in addition to back-office and ENHANCED MARGINS AND system platforms SYNERGY OPPORTUNITIES ? Ability to further scale local and regional management operations ? Cost elimination from duplicative public company costs and platform ? Creates largest multifamily REIT by number of units ? Increased presence in high growth markets with favorable demand fundamentals ENHANCED PORTFOLIO ? Improved diversification in sub-markets with balanced penetration in key urban markets STRENGTH ? Enhanced ability to increase pro-active and opportunistic capital re-cycling ? “Full cycle” capital deployment and performance strategy strengthened by market and product diversification and enhanced development capabilities ? Improved investment grade metrics and limited near-term debt maturities ENHANCED BALANCE SHEET ? Larger scale enhances both debt and equity capital market liquidity ? Positioned to achieve lower cost of capital over the long-term 2
|
|
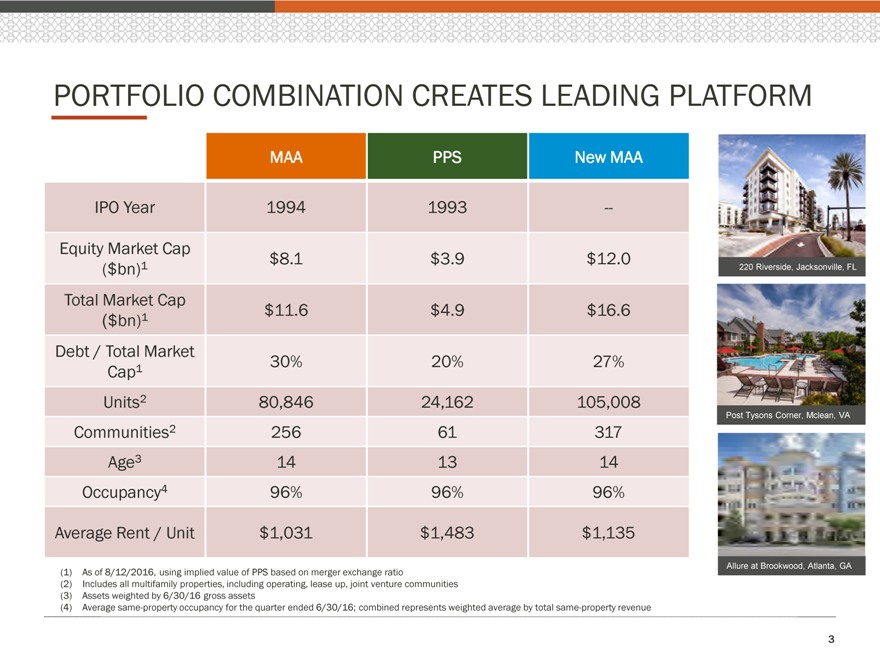
PORTFOLIO COMBINATION CREATES LEADING PLATFORM MAA PPS New MAA IPO Year 1994 1993 — Equity Market Cap $8.1 $3.9 $12.0 ($ bn)1 220 Riverside, Jacksonville, FL Total Market Cap ($bn)1 $11.6 $4.9 $16.6 Debt / Total Market Cap1 30% 20% 27% Units2 80,846 24,162 105,008 Post Tysons Corner, Mclean, VA Communities2 256 61 317 Age3 14 13 14 Occupancy4 96% 96% 96% Average Rent / Unit $1,031 $1,483 $1,135 Allure at Brookwood, Atlanta, GA (1) As of 8/12/2016, using implied value of PPS based on merger exchange ratio (2) Includes all multifamily properties, including operating, lease up, joint venture communities (3) Assets weighted by 6/30/16 gross assets (4) Average same-property occupancy for the quarter ended 6/30/16; combined represents weighted average by total same-property revenue 3
|
|
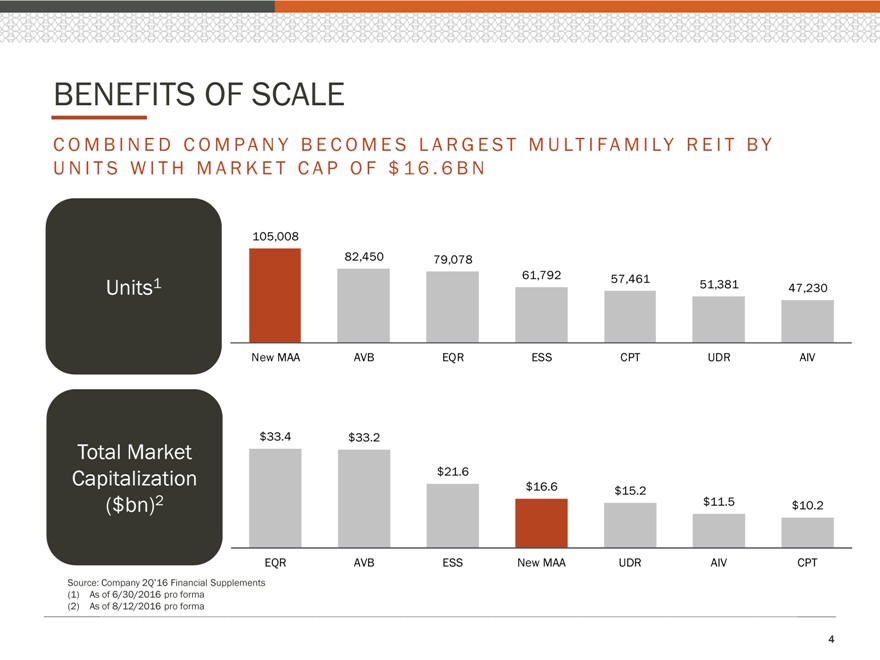
BENEFITS OF SCALE C O M B I N E D C O M P A N Y B E C O M E S L A R G E S T M U L T I F A M I L Y R E I T B Y U N I T S W I T H M A R K E T C A P O F $ 1 6 . 6 B N 105,008 82,450 79,078 61,792 Units1 57,461 51,381 47,230 New MAA AVB EQR ESS CPT UDR AIV $33.4 $33.2 Total Market Capitalization $21.6 $16.6 $15.2 ($bn)2 $11.5 $10.2 EQR AVB ESS New MAA UDR AIV CPT Source: Company 2Q’16 Financial Supplements (1) As of 6/30/2016 pro forma (2) As of 8/12/2016 pro forma 4
|
|
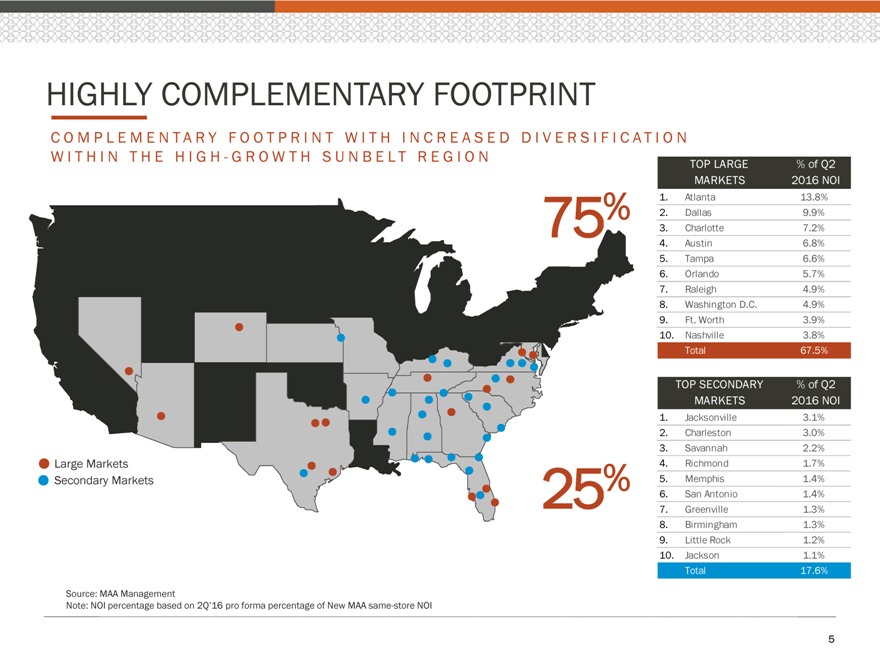
HIGHLY COMPLEMENTARY FOOTPRINT C O M P L E M E N T A R Y F O O T P R I N T W I T H I N C R E A S E D D I V E R S I F I C A T I O N W I T H I N T H E H I G H—G R O W T H S U N B E L T R E G I O N TOP LARGE % of Q2 MARKETS 2016 NOI 1. Atlanta 13.8% 2. Dallas 9.9% 75% 3. Charlotte 7.2% 4. Austin 6.8% 5. Tampa 6.6% 6. Orlando 5.7% 7. Raleigh 4.9% 8. Washington D.C. 4.9% 9. Ft. Worth 3.9% 10. Nashville 3.8% Total 67.5% TOP SECONDARY % of Q2 MARKETS 2016 NOI 1. Jacksonville 3.1% 2. Charleston 3.0% 3. Savannah 2.2% Large Markets 4. Richmond 1.7% Secondary Markets 5. Memphis 1.4% 25% 6. San Antonio 1.4% 7. Greenville 1.3% 8. Birmingham 1.3% 9. Little Rock 1.2% 10. Jackson 1.1% Total 17.6% Source: MAA Management Note: NOI percentage based on 2Q’16 pro forma percentage of New MAA same-store NOI 5
|
|
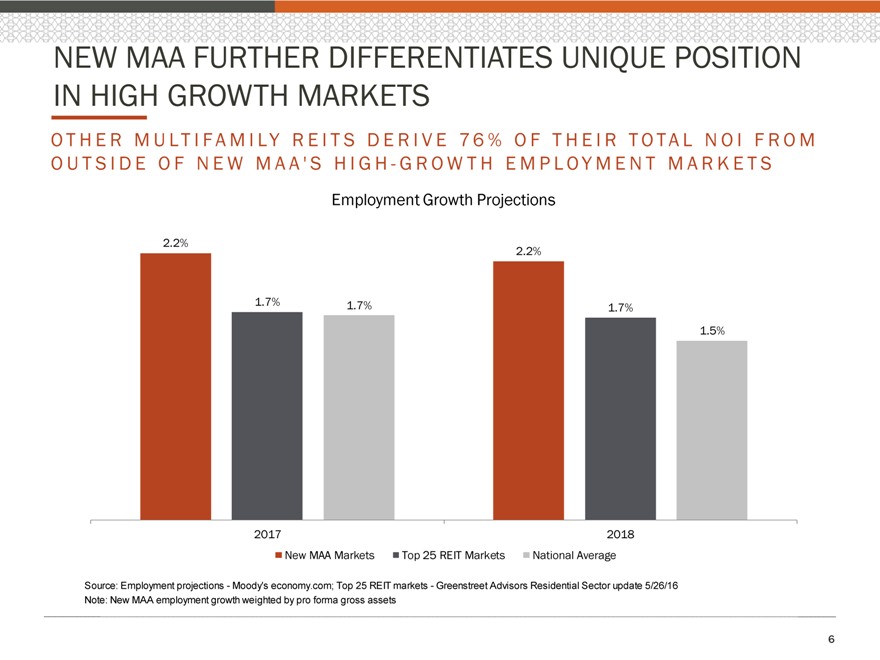
NEW MAA FURTHER DIFFERENTIATES UNIQUE POSITION IN HIGH GROWTH MARKETS O T H E R M U L T I F A M I L Y R E I T S D E R I V E 7 6 % O F T H E I R T O T A L N O I F R O M O U T S I D E O F N E W M A A ‘ S H I G H—G R O W T H E M P L O Y M E N T M A R K E T S Employment Growth Projections 2.2% 2.2% 1.7% 1.7% 1.7% 1.5% 2017 2018 New MAA Markets Top 25 REIT Markets National Average Source: Employment projections—Moody’s economy.com; Top 25 REIT markets—Greenstreet Advisors Residential Sector update 5/26/16 Note: New MAA employment growth weighted by pro forma gross assets 6
|
|
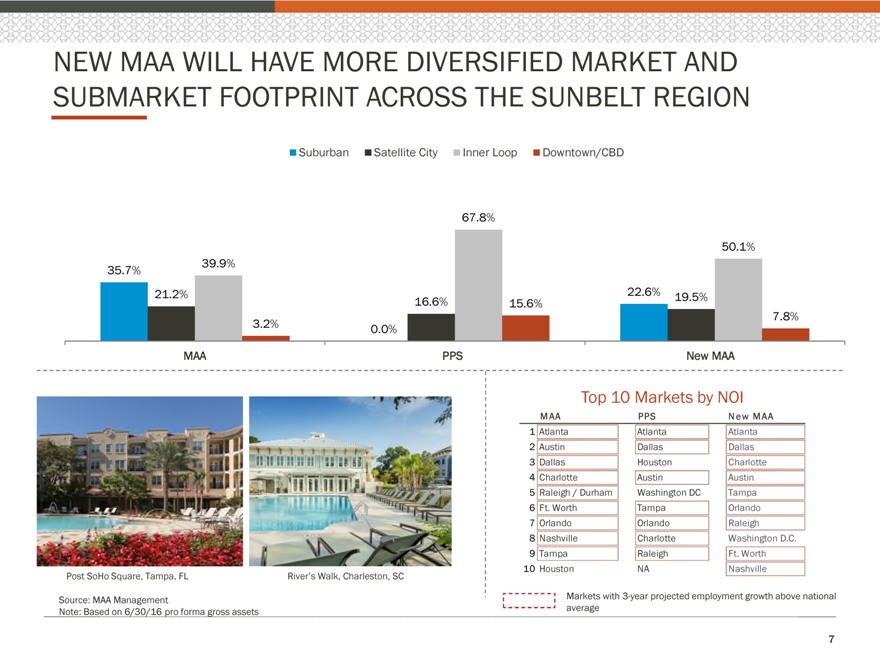
NEW MAA WILL HAVE MORE DIVERSIFIED MARKET AND SUBMARKET FOOTPRINT ACROSS THE SUNBELT REGION Suburban Satellite City Inner Loop Downtown/CBD 67.8% 50.1% 35.7% 39.9% 21.2% 22.6% 19.5% 16.6% 15.6% 7.8% 3.2% 0.0% MAA PPS New MAA Top 10 Markets by NOI M AA PPS N ew MAA 1 Atlanta Atlanta Atlanta 2 Austin Dallas Dallas 3 Dallas Houston Charlotte 4 Charlotte Austin Austin 5 Raleigh / Durham Washington DC Tampa 6 Ft. Worth Tampa Orlando 7 Orlando Orlando Raleigh 8 Nashville Charlotte Washington D.C. 9 Tampa Raleigh Ft. Worth 10 Houston NA Nashville Post SoHo Square, Tampa, FL River’s Walk, Charleston, SC Source: MAA Management Markets with 3-year projected employment growth above national Note: Based on 6/30/16 pro forma gross assets average 7
|
|
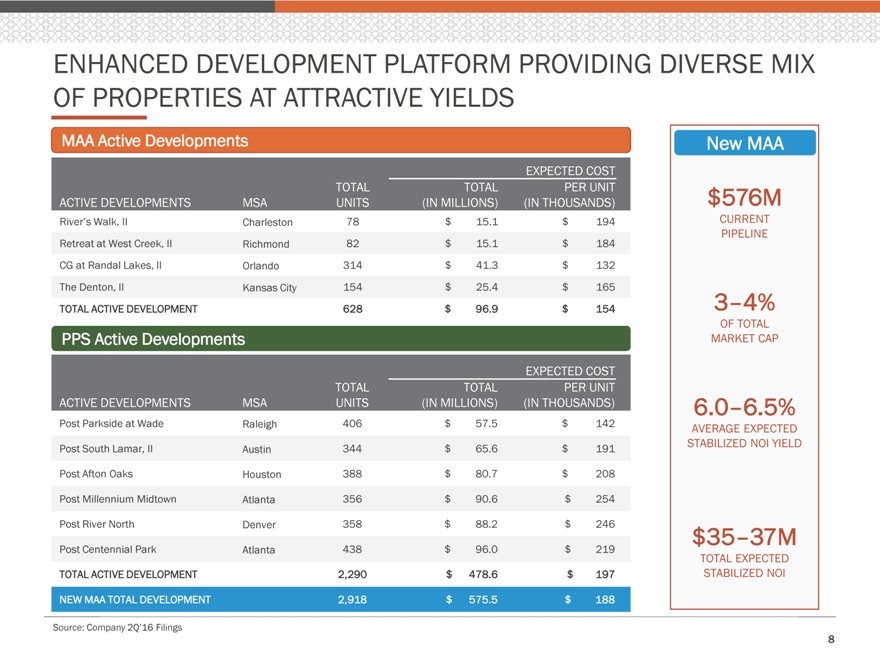
ENHANCED DEVELOPMENT PLATFORM PROVIDING DIVERSE MIX OF PROPERTIES AT ATTRACTIVE YIELDS MAA Active Developments New MAA EXPECTED COST ACTIVE TOTAL TOTAL PER UNIT $576M DEVELOPMENTS MSA UNITS (IN MILLIONS) (IN THOUSANDS) River’s Walk, II Charleston 78 $ 15.1 $ 194 CURRENT PIPELINE Retreat at West Creek, II Richmond 82 $ 15.1 $ 184 CG at Randal Lakes, II Orlando 314 $ 41.3 $ 132 The Denton, II Kansas City 154 $ 25.4 $ 165 TOTAL ACTIVE DEVELOPMENT 628 $ 96.9 $ 154 3–4% OF TOTAL PPS Active Developments MARKET CAP EXPECTED COST TOTAL TOTAL PER UNIT ACTIVE DEVELOPMENTS MSA UNITS (IN MILLIONS) (IN THOUSANDS) 6.0–6.5% Post Parkside at Wade Raleigh 406 $ 57.5 $ 142 AVERAGE EXPECTED Post South Lamar, II Austin 344 $ 65.6 $ 191 STABILIZED NOI YIELD Post Afton Oaks Houston 388 $ 80.7 $ 208 Post Millennium Midtown Atlanta 356 $ 90.6 $ 254 Post River North Denver 358 $ 88.2 $ 246 $35–37M Post Centennial Park Atlanta 438 $ 96.0 $ 219 TOTAL EXPECTED TOTAL ACTIVE DEVELOPMENT 2,290 $ 478.6 $ 197 STABILIZED NOI NEW MAA TOTAL DEVELOPMENT 2,918 $ 575.5 $ 188 Source: Company 2Q’16 Filings 8
|
|
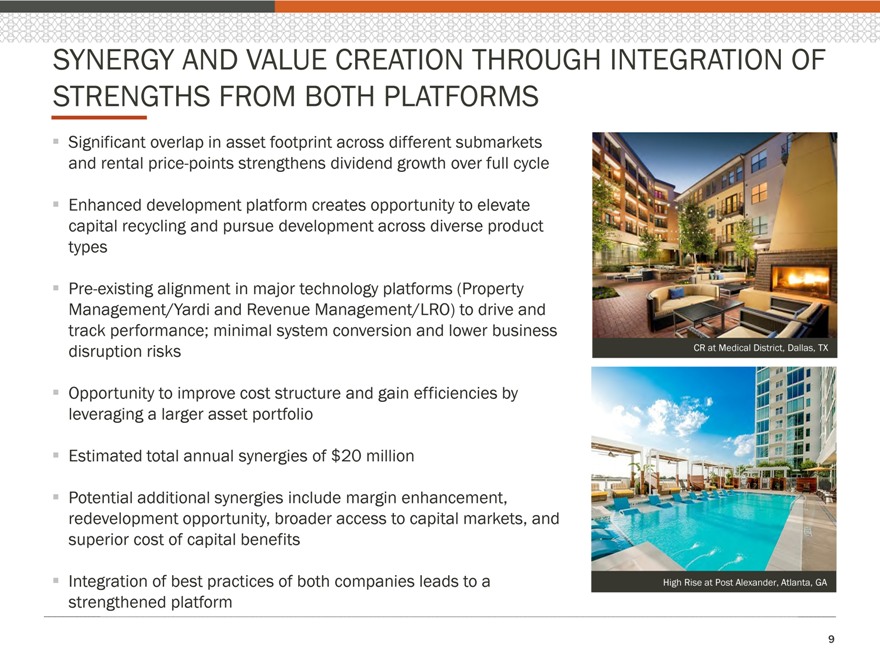
SYNERGY AND VALUE CREATION THROUGH INTEGRATION OF STRENGTHS FROM BOTH PLATFORMS ? . Significant overlap in asset footprint across different submarkets and rental price-points strengthens dividend growth over full cycle ? Enhanced development platform creates opportunity to elevate capital recycling and pursue development across diverse product types ? Pre-existing alignment in major technology platforms (Property Management/Yardi and Revenue Management/LRO) to drive and track performance; minimal system conversion and lower business disruption risks CR at Medical District, Dallas, TX ? Opportunity to improve cost structure and gain efficiencies by leveraging a larger asset portfolio ? Estimated total annual synergies of $20 million ? Potential additional synergies include margin enhancement, redevelopment opportunity, broader access to capital markets, and superior cost of capital benefits ? Integration of best practices of both companies leads to a High Rise at Post Alexander, Atlanta, GA strengthened platform 9
|
|
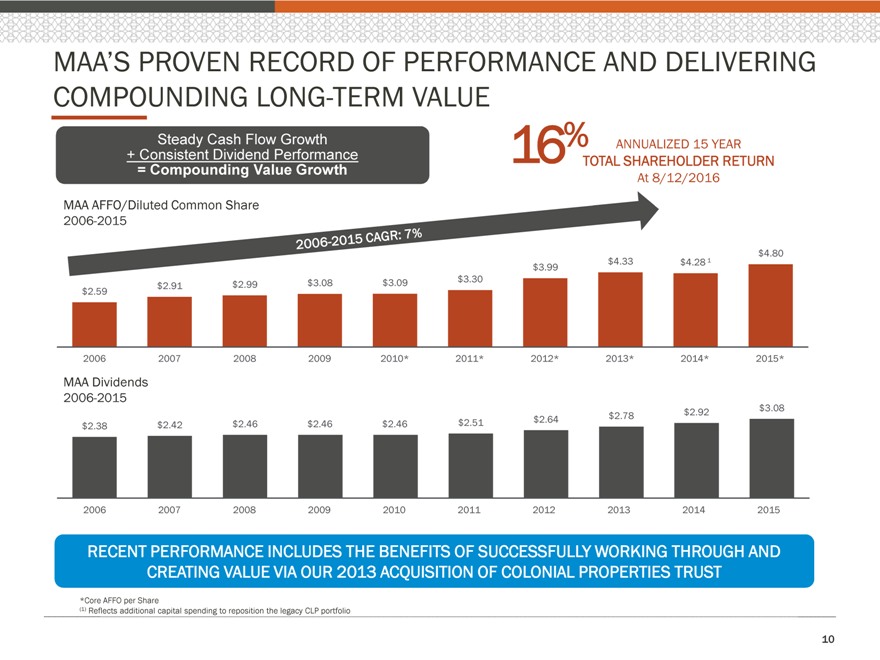
MAA’S PROVEN RECORD OF PERFORMANCE AND DELIVERING COMPOUNDING LONG-TERM VALUE Steady Cash Flow Growth ANNUALIZED 15 YEAR + Consistent Dividend Performance 16% TOTAL SHAREHOLDER RETURN = Compounding Value Growth At 8/12/2016 MAA AFFO/Diluted Common Share 2006-2015 $4.80 $3.99 $4.33 $4.28 1 $2.91 $2.99 $3.08 $3.09 $3.30 $2.59 2006 2007 2008 2009 2010* 2011* 2012* 2013* 2014* 2015* MAA Dividends 2006-2015 $3.08 $2.78 $2.92 $2.38 $2.42 $2.46 $2.46 $2.46 $2.51 $2.64 2006 2007 2008 2009 2010 2011 2012 2013 2014 2015 RECENT PERFORMANCE INCLUDES THE BENEFITS OF SUCCESSFULLY WORKING THROUGH AND CREATING VALUE VIA OUR 2013 ACQUISITION OF COLONIAL PROPERTIES TRUST *Core AFFO per Share (1) Reflects additional capital spending to reposition the legacy CLP portfolio 10
|
|
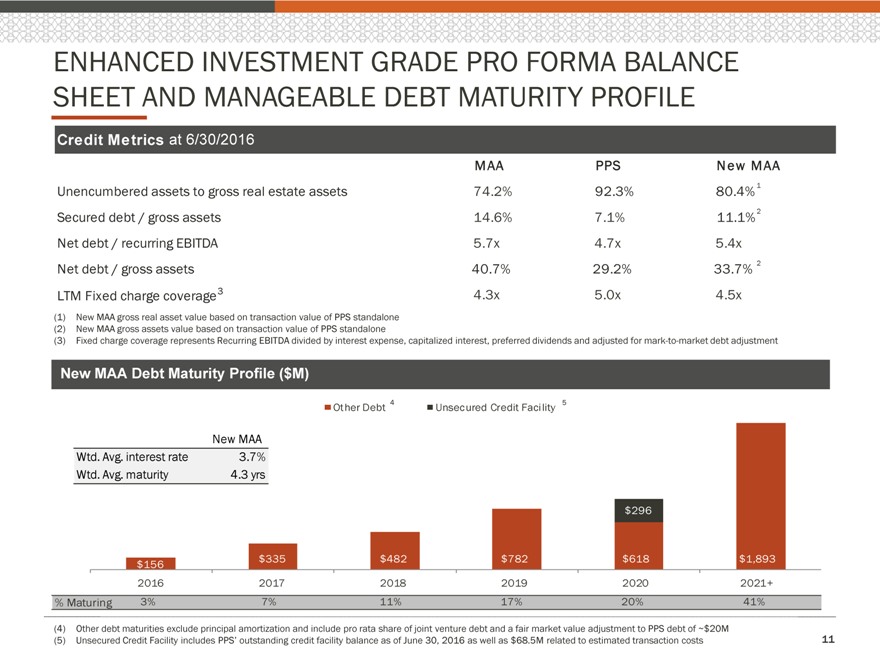
ENHANCED INVESTMENT GRADE PRO FORMA BALANCE SHEET AND MANAGEABLE DEBT MATURITY PROFILE Credit Metrics at 6/30/2016 M AA PPS N ew M AA Unencumbered assets to gross real estate assets 74.2% 92.3% 80.4% 1 Secured debt / gross assets 14.6% 7.1% 11.1% 2 Net debt / recurring EBITDA 5.7x 4.7x 5.4x Net debt / gross assets 40.7% 29.2% 33.7% 2 LTM Fixed charge coverage 3 4.3x 5.0x 4.5x (1) New MAA gross real asset value based on transaction value of PPS standalone (2) New MAA gross assets value based on transaction value of PPS standalone (3) Fixed charge coverage represents Recurring EBITDA divided by interest expense, capitalized interest, preferred dividends and adjusted for mark-to-market debt adjustment New MAA Debt Maturity Profile ($M) Other Debt 4 Unsecured Credit Facility 5 New MAA Wtd. Avg. interest rate 3.7% Wtd. Avg. maturity 4.3 yrs $296 — — $335 — $482 $782 $618 $1,893 $156 % 2016 2017 2018 2019 2020 2021+ 0.0% 10.8% 6.1% 13.5% 12.6% 57.0% % Maturing 3% 7% 11% 17% 20% 41% (4) Other debt maturities exclude principal amortization and include pro rata share of joint venture debt and a fair market value adjustment to PPS debt of ~$20M (5) Unsecured Credit Facility includes PPS’ outstanding credit facility balance as of June 30, 2016 as well as $68.5M related to estimated transaction costs 11
|
|
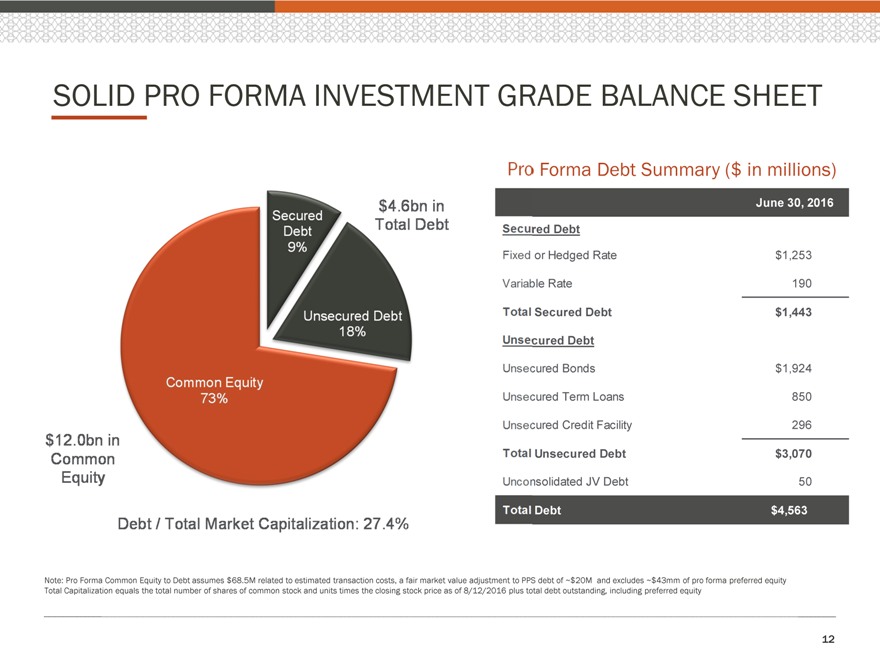
SOLID PRO FORMA INVESTMENT GRADE BALANCE SHEET Forma Debt Summary ($ in millions) June 30, 2016 red Debt Amt. Outstanding or Hedged Rate $1,253 le Rate 190 Secured Debt $1,443 cured Debt cured Bonds $1,924 cured Term Loans 850 cured Credit Facility 296 Unsecured Debt $3,070 nsolidated JV Debt 50 Debt $4,563 Note: Pro Forma Common Equity to Debt assumes $68.5M related to estimated transaction costs, a fair market value adjustment to PPS debt of ~$20M and excludes ~$43mm of pro forma preferred equity Total Capitalization equals the total number of shares of common stock and units times the closing stock price as of 8/12/2016 plus total debt outstanding, including preferred equity 12
|
|
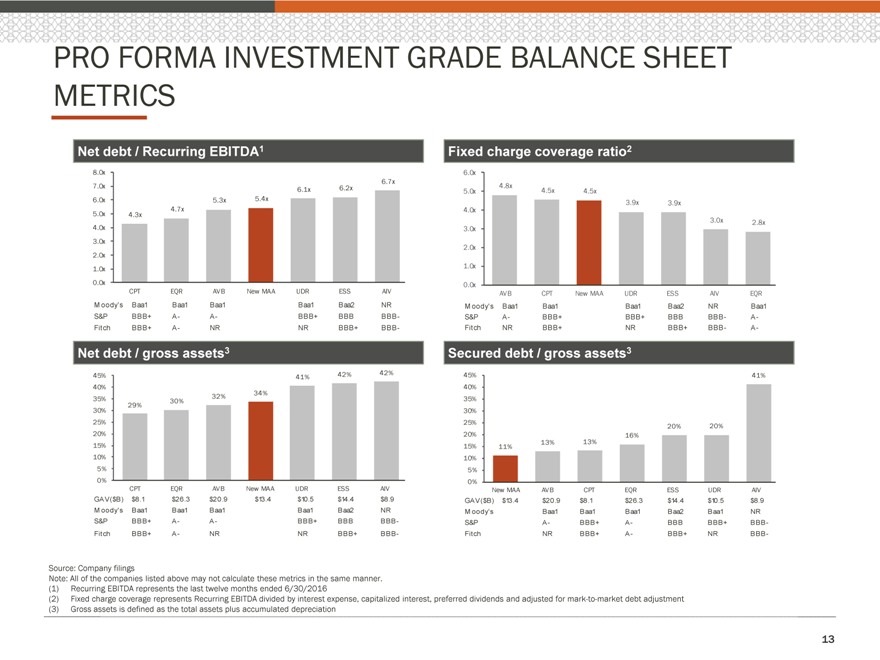
PRO FORMA INVESTMENT GRADE BALANCE SHEET METRICS Net debt / Recurring EBITDA1 Fixed charge coverage ratio2 8.0x 6.0x 6.7x 7.0x 6.1x 6.2x 5.0x 4.8x 4.5x 4.5x 6.0x 5.3x 5.4x 3.9x 3.9x 5.0x 4.3x 4.7x 4.0x 3.0x 2.8x 4.0x 3.0x 3.0x 2.0x 2.0x 1.0x 1.0x 0.0x 0.0x CPT EQR AVB New MAA UDR ESS AIV AVB CPT New MAA UDR ESS AIV EQR M oody’s Baa1 Baa1 Baa1 Baa1 Baa2 NR M oody’s Baa1 Baa1 Baa1 Baa2 NR Baa1 S&P BBB+ A- A- BBB+ BBB BBB- S&P A- BBB+ BBB+ BBB BBB- A- Fitch BBB+ A- NR NR BBB+ BBB- Fitch NR BBB+ NR BBB+ BBB- A- Net debt / gross assets3 Secured debt / gross assets3 45% 41% 42% 42% 45% 41% 40% 40% 32% 34% 35% 30% 35% 29% 30% 30% 25% 25% 20% 20% 20% 20% 16% 15% 15% 11% 13% 13% 10% 10% 5% 5% 0% 0% CPT EQR AVB New MAA UDR ESS AIV New MAA AVB CPT EQR ESS UDR AIV GAV($B) $8.1 $26.3 $20.9 $13.4 $10.5 $14.4 $8.9 GAV($B) $13.4 $20.9 $8.1 $26.3 $14.4 $10.5 $8.9 M oody’s Baa1 Baa1 Baa1 Baa1 Baa2 NR M oody’s Baa1 Baa1 Baa1 Baa2 Baa1 NR S&P BBB+ A- A- BBB+ BBB BBB- S&P A- BBB+ A- BBB BBB+ BBB- Fitch BBB+ A- NR NR BBB+ BBB- Fitch NR BBB+ A- BBB+ NR BBB- Source: Company filings Note: All of the companies listed above may not calculate these metrics in the same manner. (1) Recurring EBITDA represents the last twelve months ended 6/30/2016 (2) Fixed charge coverage represents Recurring EBITDA divided by interest expense, capitalized interest, preferred dividends and adjusted for mark-to-market debt adjustment (3) Gross assets is defined as the total assets plus accumulated depreciation 13
|
|

STRATEGY AND LONG TERM OUTLOOK ? Retain focus on driving growing cash flows with lower levels of volatility through the cycle ? Retain focus on active diversification and balanced capital allocation across the high-growth Sunbelt region ? Largest owner/operator focused on high-growth Sunbelt region – well positioned for future growth and value creation 1225 South Church, Charlotte, NC Post Meridian, Dallas, TX ? Premier development capability to support strategic expansion ? Proactive and opportunistic capital recycling program ? Increased diversification in higher asset quality and pricing spectrum; enhanced performance over the cycle ? “Full-cycle” dividend growth strengthened Post Lake at Baldwin Park, Orlando, FL Venue at Cool Springs, Nashville, TN ? Strengthened and diversified long-term earnings and reduced earnings volatility ? Greater capital markets access and cost of capital advantage ? Significant opportunity to realize synergies Stonefield Commons, Charlottesville, VA Post South End, Charlotte, NC 14
|
|
FORWARD LOOKING STATEMENTS This investor presentation contains forward-looking statements within the meaning of Section 27A of the U.S. Securities Act of 1933, as amended, and Section 21E of the U.S. Securities Exchange Act of 1934, as amended. These forward-looking statements, which are based on current expectations, estimates and projections about the industry and markets in which MAA and Post Properties, Inc. operate and beliefs of and assumptions made by MAA management and Post Properties, Inc. management, involve uncertainties that could significantly affect the financial results of MAA or Post Properties, Inc. or the combined company. Words such as “expects,” “anticipates,” “intends,” “plans,” “believes,” “seeks,” “estimates,” and variations of such words and similar expressions are intended to identify such forward-looking statements, which generally are not historical in nature. Such forward-looking statements include, but are not limited to, statements about the anticipated benefits of the proposed merger between MAA and Post Properties, Inc., including future financial and operating results, the attractiveness of the value to be received by Post shareholders, and the combined company’s plans, objectives, expectations and intentions. All statements that address operating performance, events or developments that we expect or anticipate will occur in the future — including statements relating to expected synergies, improved liquidity and balance sheet strength — are forward-looking statements. These statements are not guarantees of future performance and involve certain risks, uncertainties and assumptions that are difficult to predict. Although we believe the expectations reflected in any forward-looking statements are based on reasonable assumptions, we can give no assurance that our expectations will be attained and therefore, actual outcomes and results may differ materially from what is expressed or forecasted in such forward-looking statements. Some of the factors that may affect outcomes and results include, but are not limited to: (i) national, regional and local economic climates, (ii) changes in financial markets and interest rates, or to the business or financial condition of either company or business (iii) increased or unanticipated competition for the companies’ properties, (iv) risks associated with acquisitions, including the integration of the combined companies’ businesses, (v) the potential liability for the failure to meet regulatory requirements, including the maintenance of REIT status, (vi) availability of financing and capital, (vii) risks associated with achieving expected revenue synergies or cost savings, (viii) risks associated with the companies’ ability to consummate the merger and the timing of the closing of the merger, and (ix) those additional risks and factors discussed in reports filed with the Securities and Exchange Commission (“SEC”) by MAA and Post Properties, Inc. from time to time, including those discussed under the heading “Risk Factors” in their respective most recently filed reports on Forms 10-K and 10-Q. Neither MAA nor Post Properties, Inc. undertakes any duty to update any forward-looking statements appearing in this investor presentation. Contact Eric Bolton Al Campbell Tim Argo Jennifer Patrick Chairman and CEO EVP, CFO SVP, Finance Investor Relations 901-248-4127 901-248-4169 901-248-4149 901-435-5371 [email protected] [email protected] [email protected] [email protected] Dave Stockert Art Quirk President & CEO SVP, CAO 404-846-6166 404-846-5013 [email protected] [email protected] 15
|
|
ADDITIONAL INFORMATION ABOUT THE PROPOSED MERGER AND WHERE TO FIND IT This investor presentation relates to the proposed merger pursuant to the terms of the Agreement and Plan of Merger, dated August 15, 2016, by and among Mid-America Apartment Communities, Inc., Mid-America Apartments, L.P., Post Properties, Inc., Post GP Holdings, Inc., and Post Apartment Homes, L.P. For information on how non-GAAP metrics, including NOI, EBITDA and AFFO, have been calculated in this presentation and for historical reconciliations to the nearest comparable financial measures under GAAP, see supplemental information provided with MAA’s earnings release and supplemental data available on the SEC’s website at www.sec.gov or on MAA’s website at www.maac.com. In connection with the proposed transaction, MAA expects to file with the SEC a registration statement on Form S-4 that will include a joint proxy statement of MAA and Post Properties, Inc. that also constitutes a prospectus of MAA. MAA and Post Properties, Inc. also plan to file other relevant documents with the SEC regarding the proposed transaction. INVESTORS ARE URGED TO READ THE JOINT PROXY STATEMENT/PROSPECTUS AND OTHER RELEVANT DOCUMENTS FILED WITH THE SEC IF AND WHEN THEY BECOME AVAILABLE, BECAUSE THEY WILL CONTAIN IMPORTANT INFORMATION ABOUT THE MERGER. You may obtain a free copy of the joint proxy statement/prospectus (if and when it becomes available) and other relevant documents filed by MAA and Post Properties, Inc. with the SEC at the SEC’s website at www.sec.gov. Copies of the documents filed by MAA with the SEC will be available free of charge on MAA’s website at www.maac.com or by contacting MAA Investor Relations at 901-682-6600. Copies of the documents filed by Post Properties, Inc. with the SEC will be available free of charge on Post Properties, Inc.’s website at www.postproperties.com or by contacting Post Properties, Inc. Investor Relations at 404-846- 5022. MAA and Post Properties, Inc. and their respective directors and executive officers and other members of management and employees may be deemed to be participants in the solicitation of proxies in respect of the proposed transaction. You can find information about MAA’s executive officers and directors in MAA’s definitive proxy statement filed with the SEC on April 14, 2016 and in Form 4s of MAA’s directors and executive officers filed with the SEC. You can find information about Post Properties, Inc.’s executive officers and directors in Post Properties, Inc.’s definitive proxy statement filed with the SEC on April 12, 2016 and in Form 4s of Post Properties, Inc.’s directors and executive officers filed with the SEC. Additional information regarding the interests of such potential participants will be included in the joint proxy statement/prospectus and other relevant documents filed with the SEC if and when they become available. You may obtain free copies of these documents from MAA or Post Properties, Inc. using the sources indicated above. This document shall not constitute an offer to sell or the solicitation of an offer to buy any securities, nor shall there be any sale of securities in any jurisdiction in which such offer, solicitation or sale would be unlawful prior to registration or qualification under the securities laws of any such jurisdiction. No offering of securities shall be made except by means of a prospectus meeting the requirements of Section 10 of the U.S. Securities Act of 1933, as amended. 16
Serious News for Serious Traders! Try StreetInsider.com Premium Free!
You May Also Be Interested In
- Valstybės investicinis kapitalas UAB audited Annual information for the year 2023
- Robbins LLP Reminds IRobot Corporation Shareholders of the Pending May 7, 2024 Lead Plaintiff Deadline
- ROSEN, NATIONAL TRIAL LAWYERS, Encourages Northern Genesis Acquisition Corp. n/k/a The Lion Electric Company Investors to Secure Counsel Before Important Deadline in Securities Class Action – NGA
Create E-mail Alert Related Categories
SEC FilingsSign up for StreetInsider Free!
Receive full access to all new and archived articles, unlimited portfolio tracking, e-mail alerts, custom newswires and RSS feeds - and more!
