

Form 10-K WESTFIELD FINANCIAL INC For: Dec 31
 Tweet
Tweet Share
Share
Securities and Exchange Commission
Washington, D.C. 20549
FORM 10-K
ANNUAL REPORT PURSUANT TO SECTION 13 OR 15 (d) OF THE SECURITIES EXCHANGE ACT OF 1934
For the fiscal year ended December 31, 2014
Commission File No.: 001-16767
Westfield Financial, Inc.
(Exact name of registrant as specified in its charter)
| Massachusetts | 73-1627673 | |
| (State or other jurisdiction of incorporation or organization) | (I.R.S. Employer Identification No.) |
141 Elm Street, Westfield, Massachusetts 01085
(Address of principal executive offices, including zip code)
(413) 568-1911
(Registrant’s telephone number, including area code)
Securities registered pursuant to Section 12(b) of the Act:
| Common Stock, $.01 par value per share | The NASDAQ Global Select Market | |
| (Title of each class) | (Name of each exchange on which registered) |
Securities registered pursuant to Section 12(g) of the Act: None.
Indicate by check mark if the registrant is a well-known seasoned issuer, as defined in Rule 405 of the Securities Act.
Yes ☐ No ☒
Indicate by check mark if the registrant is not required to file reports pursuant to Section 13 or Section 15(d) of the Act.
Yes ☐ No ☒
Indicate by check mark whether the registrant (1) has filed all reports required to be filed by Section 13 or 15(d) of the Securities Exchange Act of 1934 during the preceding 12 months (or for such shorter period that the registrant was required to file such reports), and (2) has been subject to such filing requirements for the past 90 days. Yes ☒ No ☐
Indicate by check mark whether the registrant has submitted electronically and posted on its corporate Website, if any, every Interactive Data File required to be submitted and posted pursuant to Rule 405 of Regulation S-T during the preceding 12 months (or for such shorter period that the registrant was required to submit and post such filed). Yes ☒ No ☐
Indicate by check mark if disclosure of delinquent filers pursuant to Item 405 of Regulation S-K is not contained herein, and will not be contained, to the best of registrant’s knowledge, in definitive proxy or information statements incorporated by reference in Part III of this Form 10-K or any amendment to this Form 10-K. ☐
Indicate by check mark whether the registrant is a large accelerated filer, an accelerated filer, a non-accelerated filer or a smaller reporting company. See the definitions of “large accelerated filer,” “accelerated filer” and “smaller reporting company” in Rule 12b-2 of the Exchange Act. (Check one):
| Large accelerated filer ☐ | Accelerated filer ☒ | Non-accelerated filer ☐ | Smaller reporting company ☐ |
Indicate by check mark whether the registrant is a shell company (as defined in Rule 12b-2 of the Act). Yes ☐ No ☒
The aggregate market value of the voting stock held by non-affiliates of the registrant as of June 30, 2014, was $143,009,655. This amount was based on the closing price as of June 30, 2014 on The NASDAQ Global Select Market for a share of the registrant’s common stock, which was $7.46 on June 30, 2014.
As of March 5, 2015, the registrant had 18,709,412 shares of common stock, $0.01 per value, issued and outstanding.
DOCUMENTS INCORPORATED BY REFERENCE:
Portions of the Proxy Statement for the 2015 Annual Meeting of Shareholders are incorporated by reference into Part III of this report.
FORWARD-LOOKING STATEMENTS
We may, from time to time, make written or oral “forward-looking statements” within the meaning of the Private Securities Litigation Reform Act of 1995, including statements contained in our filings with the Securities and Exchange Commission (the “SEC”), our reports to shareholders and in other communications by us. This Annual Report on Form 10-K contains “forward-looking statements” which may be identified by the use of such words as “believe,” “expect,” “anticipate,” “should,” “planned,” “estimated,” and “potential.” Examples of forward-looking statements include, but are not limited to, estimates with respect to our financial condition, results of operation and business that are subject to various factors which could cause actual results to differ materially from these estimates. These factors include, but are not limited to:
| · | changes in the interest rate environment that reduce margins; |
| · | changes in the regulatory environment; |
| · | the highly competitive industry and market area in which we operate; |
| · | general economic conditions, either nationally or regionally, resulting in, among other things, a deterioration in credit quality; |
| · | changes in business conditions and inflation; |
| · | changes in credit market conditions; |
| · | changes in the securities markets which affect investment management revenues; |
| · | increases in Federal Deposit Insurance Corporation deposit insurance premiums and assessments could adversely affect our financial condition; |
| · | changes in technology used in the banking business; |
| · | the soundness of other financial services institutions which may adversely affect our credit risk; |
| · | certain of our intangible assets may become impaired in the future; |
| · | our controls and procedures may fail or be circumvented; |
| · | new lines of business or new products and services, which may subject us to additional risks; |
| · | changes in key management personnel which may adversely impact our operations; |
| · | the effect on our operations of governmental legislation and regulation, including changes in accounting regulation or standards, the nature and timing of the adoption and effectiveness of new requirements under the Dodd-Frank Act, Basel guidelines, capital requirements and other applicable laws and regulations; |
| · | severe weather, natural disasters, acts of war or terrorism and other external events which could significantly impact our business; and |
| · | other factors detailed from time to time in our SEC filings. |
Although we believe that the expectations reflected in such forward-looking statements are reasonable, actual results may differ materially from the results discussed in these forward-looking statements. You are cautioned not to place undue reliance on these forward-looking statements, which speak only as of the date hereof. We do not undertake any obligation to republish revised forward-looking statements to reflect events or circumstances after the date hereof or to reflect the occurrence of unanticipated events.
Unless the context indicates otherwise, all references in this prospectus to “Westfield Financial,” “we,” “us,” “our company,” and “our” refer to Westfield Financial, Inc. and its subsidiaries (including Westfield Bank, Elm Street Securities Corporation, WFD Securities, Inc. and WB Real Estate Holdings, LLC).
| 1 |
| ITEM 1. | BUSINESS |
General. Westfield Financial is a Massachusetts-chartered stock holding company and the parent company of Westfield Bank (the “Bank”). Westfield Financial was formed in 2001 in connection with its reorganization from a federally chartered mutual holding company to a Massachusetts-chartered stock holding company with the second step conversion being completed in 2007. The Bank was formed in 1853 and is a federally chartered savings bank regulated by the Office of Comptroller of the Currency (“OCC”). As a community bank, we focus on servicing commercial customers, including commercial and industrial lending and commercial deposit relationships. We believe that this business focus is best for our long-term success and viability, and complements our existing commitment to high quality customer service.
Elm Street Securities Corporation, a Massachusetts-chartered corporation, was formed by us for the primary purpose of holding qualified securities. In February 2007, we formed WFD Securities, Inc., a Massachusetts-chartered corporation, for the primary purpose of holding qualified securities. In October 2009, we formed WB Real Estate Holdings, LLC, a Massachusetts-chartered limited liability company, for the primary purpose of holding real property acquired as security for debts previously contracted by the Bank.
Market Area. We operate 13 banking offices in Agawam, Feeding Hills, East Longmeadow, Holyoke, Southwick, Springfield, West Springfield and Westfield, Massachusetts and Granby and Enfield, Connecticut. Our banking offices in Granby and Enfield, Connecticut, which we opened in June 2013 and November 2014, respectively, are our first locations outside of western Massachusetts. In 2014, we relocated our middle market and commercial real estate lending team to offices in Springfield, Massachusetts. We also have 12 free-standing ATM locations in Holyoke, Southwick, Springfield, West Springfield and Westfield, Massachusetts. Our primary deposit gathering area is concentrated in the communities surrounding these locations and our primary lending area includes all of Hampden County in western Massachusetts and Hartford and Tolland Counties in northern Connecticut. In addition, we provide online banking services through our website located at www.westfieldbank.com.
The markets served by our branches are primarily suburban in character, as we operate only one banking office and headquarter our middle market commercial lending team in Springfield, the Pioneer Valley’s primary urban market. Westfield, Massachusetts, is located in the Pioneer Valley near the intersection of U.S. Interstates 90 (the Massachusetts Turnpike) and 91. The Pioneer Valley of western Massachusetts encompasses the sixth largest metropolitan area in New England. The Springfield Metropolitan area covers a relatively diverse area ranging from densely populated urban areas, such as Springfield, to outlying rural areas.
Competition. We face intense competition both in making loans and attracting deposits. Our primary market area is highly competitive and we face direct competition from approximately 17 financial institutions, many with a local, state-wide or regional presence and, in some cases, a national presence. Many of these financial institutions are significantly larger than us and have greater financial resources. Our competition for loans comes principally from commercial banks, savings institutions, mortgage banking firms, credit unions, finance companies, mutual funds, insurance companies and brokerage and investment banking firms. Historically, our most direct competition for deposits has come from savings and commercial banks. We face additional competition for deposits from internet-based institutions, credit unions, brokerage firms and insurance companies.
Personnel. As of December 31, 2014, we had 164 full-time employees and 36 part-time employees. The employees are not represented by a collective bargaining unit, and we consider our relationship with our employees to be excellent.
Lending Activities
Loan Portfolio Composition. Our loan portfolio primarily consists of commercial real estate loans, commercial and industrial loans, residential real estate loans, home equity loans and consumer loans.
At December 31, 2014, we had total loans of $723.4 million, of which 53.1% were adjustable rate loans and 46.9% were fixed rate loans. Commercial real estate loans and commercial and industrial loans totaled $278.4 million and $165.7 million, respectively. The remainder of our loans at December 31, 2014 consisted of residential real estate loans, home equity loans and consumer loans. Residential real estate and home equity loans outstanding at December 31, 2014 totaled $277.7 million. Consumer loans outstanding at December 31, 2014 were $1.5 million.
| 2 |
The interest rates we charge on loans are affected principally by the demand for loans, the supply of money available for lending purposes and the interest rates offered by our competitors. These factors are, in turn, affected by general and local economic conditions, monetary policies of the federal government, including the Federal Reserve Board, legislative tax policies and governmental budgetary matters.
The following table presents the composition of our loan portfolio in dollar amounts and in percentages of the total portfolio at the dates indicated.
| At December 31, | ||||||||||||||||||||||||||||||||||||||||
| 2014 | 2013 | 2012 | 2011 | 2010 | ||||||||||||||||||||||||||||||||||||
| Amount | Percent of Total | Amount | Percent of Total | Amount | Percent of Total | Amount | Percent of Total | Amount | Percent of Total | |||||||||||||||||||||||||||||||
| (Dollars in thousands) | ||||||||||||||||||||||||||||||||||||||||
| Real estate loans: | ||||||||||||||||||||||||||||||||||||||||
| Commercial | $ | 278,405 | 38.49 | % | $ | 264,476 | 41.54 | % | $ | 245,764 | 41.38 | % | $ | 232,491 | 42.04 | % | $ | 221,578 | 43.57 | % | ||||||||||||||||||||
| Residential | 237,436 | 32.82 | 198,686 | 31.21 | 185,345 | 31.21 | 155,994 | 28.20 | 112,680 | 22.17 | ||||||||||||||||||||||||||||||
| Home equity | 40,305 | 5.57 | 35,371 | 5.56 | 34,352 | 5.78 | 36,464 | 6.59 | 36,116 | 7.09 | ||||||||||||||||||||||||||||||
| Total real estate loans | 556,146 | 76.88 | 498,533 | 78.31 | 465,461 | 78.37 | 424,949 | 76.83 | 370,374 | 72.83 | ||||||||||||||||||||||||||||||
| Other loans | ||||||||||||||||||||||||||||||||||||||||
| Commercial and industrial | 165,728 | 22.91 | 135,555 | 21.29 | 126,052 | 21.22 | 125,739 | 22.73 | 135,250 | 26.59 | ||||||||||||||||||||||||||||||
| Consumer | 1,542 | 0.21 | 2,572 | 0.40 | 2,431 | 0.41 | 2,451 | 0.44 | 2,960 | 0.58 | ||||||||||||||||||||||||||||||
| Total other loans | 167,270 | 23.12 | 138,127 | 21.69 | 128,483 | 21.63 | 128,190 | 23.17 | 138,210 | 27.17 | ||||||||||||||||||||||||||||||
| Total loans | 723,416 | 100.00 | % | 636,660 | 100.00 | % | 593,944 | 100.00 | % | 553,139 | 100.00 | % | 508,584 | 100.00 | % | |||||||||||||||||||||||||
| Unearned premiums and net deferred loan fees and costs, net | 1,270 | 767 | 974 | 1,017 | 742 | |||||||||||||||||||||||||||||||||||
| Allowance for loan losses | (7,948 | ) | (7,459 | ) | (7,794 | ) | (7,764 | ) | (6,934 | ) | ||||||||||||||||||||||||||||||
| Total loans, net | $ | 716,738 | $ | 629,968 | $ | 587,124 | $ | 546,392 | $ | 502,392 | ||||||||||||||||||||||||||||||
| 3 |
Loan Maturity and Repricing. The following table shows the repricing dates or contractual maturity dates as of December 31, 2014. The table does not reflect prepayments or scheduled principal amortization. Demand loans, loans having no stated maturity, and overdrafts are shown as due in within one year.
| At December 31, 2014 | ||||||||||||||||||||||||||||
| Commercial Real Estate | Residential | Home Equity | Commercial and Industrial | Consumer | Unallocated | Totals | ||||||||||||||||||||||
| (In thousands) | ||||||||||||||||||||||||||||
| Amount due: | ||||||||||||||||||||||||||||
| Within one year | $ | 45,890 | $ | 8,104 | $ | 24,980 | $ | 89,452 | $ | 585 | $ | — | $ | 169,011 | ||||||||||||||
| After one year: | ||||||||||||||||||||||||||||
| One to three years | 89,568 | 3,592 | 562 | 15,652 | 354 | — | 109,728 | |||||||||||||||||||||
| Three to five years | 68,000 | 14,405 | 1,326 | 28,211 | 254 | — | 112,196 | |||||||||||||||||||||
| Five to ten years | 49,922 | 32,789 | 7,155 | 32,411 | — | — | 122,277 | |||||||||||||||||||||
| Ten to twenty years | 22,702 | 51,450 | 5,166 | — | — | — | 79,318 | |||||||||||||||||||||
| Over twenty years | 2,323 | 127,096 | 1,116 | 2 | 349 | — | 130,886 | |||||||||||||||||||||
| Total due after one year | 232,515 | 229,332 | 15,325 | 76,276 | 957 | — | 554,405 | |||||||||||||||||||||
| Total amount due: | 278,405 | 237,436 | 40,305 | 165,728 | 1,542 | — | 723,416 | |||||||||||||||||||||
| Net deferred loan origination fees and costs and unearned premiums | (125 | ) | 978 | 276 | 117 | 24 | — | 1,270 | ||||||||||||||||||||
| Allowance for loan losses | (3,705 | ) | (1,755 | ) | (298 | ) | (2,174 | ) | (15 | ) | (1 | ) | (7,948 | ) | ||||||||||||||
| Loans, net | $ | 274,575 | $ | 236,659 | $ | 40,283 | $ | 163,671 | $ | 1,551 | $ | (1 | ) | $ | 716,738 | |||||||||||||
The following table presents, as of December 31, 2014, the dollar amount of all loans contractually due or scheduled to reprice after December 31, 2015, and whether such loans have fixed interest rates or adjustable interest rates.
| Due After December 31, 2015 | ||||||||||||
| Fixed | Adjustable | Total | ||||||||||
| (In thousands) | ||||||||||||
| Real estate loans: | ||||||||||||
| Residential | $ | 189,302 | $ | 40,030 | $ | 229,332 | ||||||
| Home equity | 15,325 | — | 15,325 | |||||||||
| Commercial real estate | 52,835 | 179,680 | 232,515 | |||||||||
| Total real estate loans | 257,462 | 219,710 | 477,172 | |||||||||
| Other loans: | ||||||||||||
| Commercial and industrial | 72,360 | 3,916 | 76,276 | |||||||||
| Consumer | 958 | — | 957 | |||||||||
| Total other loans | 73,318 | 3,916 | 77,233 | |||||||||
| Total loans | $ | 330,780 | $ | 223,626 | $ | 554,405 | ||||||
| 4 |
The following table presents our loan originations, purchases and principal payments for the years indicated:
| For the Years Ended December 31, | ||||||||||||
| 2014 | 2013 | 2012 | ||||||||||
| (In thousands) | ||||||||||||
| Loans: | ||||||||||||
| Balance outstanding at beginning of year | $ | 636,660 | $ | 593,944 | $ | 553,139 | ||||||
| Originations: | ||||||||||||
| Real estate loans: | ||||||||||||
| Residential | 4,880 | 4,842 | 2,688 | |||||||||
| Home equity | 15,089 | 12,139 | 9,220 | |||||||||
| Commercial | 37,399 | 52,027 | 68,721 | |||||||||
| Total mortgage originations | 57,368 | 69,008 | 80,629 | |||||||||
| Commercial and industrial loans | 105,438 | 74,594 | 51,521 | |||||||||
| Consumer loans | 1,491 | 858 | 975 | |||||||||
| Total originations | 164,297 | 144,460 | 133,125 | |||||||||
| Purchase of one-to-four family mortgage loans | 53,272 | 37,700 | 62,895 | |||||||||
| 217,569 | 182,160 | 196,020 | ||||||||||
| Less: | ||||||||||||
| Principal repayments, unadvanced funds and other, net | 129,729 | 139,365 | 154,547 | |||||||||
| Loan charge-offs, net | 1,086 | 79 | 668 | |||||||||
| Total deductions | 130,813 | 139,444 | 155,215 | |||||||||
| Balance outstanding at end of year | $ | 723,416 | $ | 636,660 | $ | 593,944 | ||||||
Commercial and Industrial Loans. We offer commercial and industrial loan products and services that are designed to give business owners borrowing opportunities for modernization, inventory, equipment, construction, consolidation, real estate, working capital, vehicle purchases and the financing of existing corporate debt. We offer business installment loans, vehicle and equipment financing, lines of credit, and other commercial loans. At December 31, 2014, our commercial and industrial loan portfolio consisted of 1,139 loans, totaling $165.7 million, or 22.9% of our total loans. Our commercial loan team includes nine commercial loan officers, four credit analysts and two portfolio managers. We may hire additional commercial loan officers on an as needed basis.
As part of our strategy of increasing our emphasis on commercial lending, we seek to attract our business customers’ entire banking relationship. Most commercial borrowers also maintain commercial deposits. We provide complementary commercial products and services, a variety of commercial deposit accounts, cash management services, internet banking, sweep accounts, a broad ATM network and night deposit services. We offer a remote deposit capture product whereby commercial customers can receive credit for check deposits by electronically transmitting check images from their own locations. Commercial loan officers are based in our main and branch offices, and we view our potential branch expansion as a means of facilitating these commercial relationships. We intend to continue to expand the volume of our commercial business products and services within our current underwriting standards.
| 5 |
Our commercial and industrial loan portfolio does not have any significant loan concentration by type of property or borrower. The largest concentration of loans was for manufacturing, comprised approximately 7.8% of the total loan portfolio as of December 31, 2014. At December 31, 2014, our largest commercial and industrial loan relationship was $20.0 million to a stocking distributor for firearms, ammunition and shooting supplies. The loan relationship is secured by business assets. The loans to this borrower have performed to contractual terms.
Commercial and industrial loans generally have terms of seven years or less, however, on an occasional basis, may have terms of up to ten years. Among the $165.7 million we have in our commercial and industrial loan portfolio as of December 31, 2014, $84.9 million have adjustable interest rates and $80.8 million have fixed interest rates. Whenever possible, we seek to originate adjustable rate commercial and industrial loans. Borrower activity and market conditions, however, may influence whether we are able to originate adjustable rate loans rather than fixed rate loans. We generally require the personal guarantee of the business owner. Interest rates on commercial and industrial loans generally have higher yields than residential or commercial real estate loans.
Commercial and industrial loans are generally considered to involve a higher degree of risk than residential or commercial real estate loans because the collateral may be in the form of intangible assets and/or inventory subject to market obsolescence. Please see “Risk Factors – Our loan portfolio includes loans with a higher risk of loss.” Commercial and industrial loans may also involve relatively large loan balances to single borrowers or groups of related borrowers, with the repayment of such loans typically dependent on the successful operation and income stream of the borrower. These risks can be significantly affected by economic conditions. In addition, business lending generally requires substantially greater oversight efforts by our staff compared to residential or commercial real estate lending, including obtaining and analyzing periodic financial statements of the borrowers. In order to mitigate this risk, we monitor our loan concentration and our loan policies generally to limit the amount of loans to a single borrower or group of borrowers. We also utilize the services of an outside consultant to conduct credit quality reviews of the commercial and industrial loan portfolio.
Commercial Real Estate Loans. We originate commercial real estate loans to finance the purchase of real property, which generally consists of apartment buildings, business properties, multi-family investment properties and construction loans to developers of commercial and residential properties. In underwriting commercial real estate loans, consideration is given to the property’s historic cash flow, current and projected occupancy, location and physical condition. At December 31, 2014, our commercial real estate loan portfolio consisted of 422 loans, totaling $278.4 million, or 38.5% of total loans. Since 2010, commercial real estate loans have grown by $56.8 million, or 25.6%, from $221.6 million at December 31, 2010 to $278.4 million at December 31, 2014.
The majority of the commercial real estate portfolio consists of loans which are collateralized by properties in the Pioneer Valley of Massachusetts and northern Connecticut. Our commercial real estate loan portfolio is diverse, and does not have any significant loan concentration by type of property or borrower. We generally lend up to a loan-to-value ratio of 80% on commercial properties. We, however, will lend up to a maximum of 85% loan-to-value ratio and will generally require a minimum debt coverage ratio of 1.15. Our largest non-owner occupied commercial real estate loan relationship was $15.1 million at December 31, 2014, which is secured by a commercial property located in Rhode Island. The loans to this borrower are performing.
We also offer construction loans to finance the construction of commercial properties located in our primary market area. At December 31, 2014, we had $14.5 million in commercial construction loans and commitments that are committed to refinance into permanent mortgages at the end of the construction period and $2.3 million in commercial construction loans and commitments that are not committed to permanent financing at the end of the construction period.
Commercial real estate lending involves additional risks compared with one-to-four family residential lending. Payments on loans secured by commercial real estate properties often depend on the successful management of the properties, on the amount of rent from the properties, or on the level of expenses needed to maintain the properties. Repayment of such loans may therefore be adversely affected by conditions in the real estate market or the general economy. Also, commercial real estate loans typically involve large loan balances to single borrowers or groups of related borrowers. In order to mitigate this risk, we obtain and analyze periodic financial statements of the borrowers as well as monitor our loan concentration risk on a quarterly basis and our loan policies generally limit the amount of loans to a single borrower or group of borrowers.
| 6 |
Because of increased risks associated with commercial real estate loans, our commercial real estate loans generally have higher rates than residential real estate loans. Please see “Risk Factors – Our loan portfolio includes loans with a higher risk of loss.” Commercial real estate loans generally have adjustable rates with repricing dates of five years or less; however, occasionally repricing dates may be as long as 10 years. Whenever possible, we seek to originate adjustable rate commercial real estate loans. Borrower activity and market conditions, however, may influence whether we are able to originate adjustable rate loans rather than fixed rate loans.
Residential Real Estate Loans and Originations. We process substantially all of our originations of residential real estate loans through a third-party mortgage company. Residential real estate borrowers submit applications to us, but the loan is approved by and closed on the books of the mortgage company. The third-party mortgage company owns the servicing rights and services the loans. We retain no residual ownership interest in these loans. We receive a fee for each of these loans originated by the third-party mortgage company.
Even though substantially all residential real estate loan originations are referred to a third-party mortgage company, we still hold residential real estate loans in our loan portfolio. In 2014, we purchased $35.3 million in residential loans from a New England-based bank as a means of supplementing our loan growth. In addition, through our long standing relationship with a third-party mortgage company, we purchased a total of $18.0 million in residential loans within and contiguous to our market area during 2014. While in prior quarters management has used residential loan growth to supplement the loan portfolio, the long-term strategy remains focused on commercial lending. At December 31, 2014, loans on one-to-four family residential properties, including home equity lines, accounted for $277.7 million, or 38.4% of our total loan portfolio.
Our residential adjustable rate mortgage loans generally are fully amortizing loans with contractual maturities of up to 30 years, payments due monthly. Our adjustable rate mortgage loans generally provide for specified minimum and maximum interest rates, with a lifetime cap and floor, and a periodic adjustment on the interest rate over the rate in effect on the date of origination. As a consequence of using caps, the interest rates on these loans are not generally as rate sensitive as our cost of funds. The adjustable rate mortgage loans that we originate generally are not convertible into fixed rate loans.
Adjustable rate mortgage loans generally pose different credit risks than fixed rate loans, primarily because as interest rates rise, the borrower’s payments rise, increasing the potential for default. To date, we have not experienced difficulty with payments for these loans. At December 31, 2014, our residential real estate included $48.1 million in adjustable rate loans, or 6.7% of our total loan portfolio, and $189.3 million in fixed rate loans, or 26.2% of our total loan portfolio.
Our home equity loans totaled $40.3 million, or 5.6% of total loans at December 31, 2014. Home equity loans include $15.4 million in fixed rate loans, or 2.1% of total loans, and $24.9 million in adjustable rate loans, or 3.4% of total loans. These loans may be originated in amounts up to 80% current loan to value (CLTV) of the appraised value of the property securing the loan. The term to maturity on our home equity and home improvement loans may be up to 15 years.
Consumer Loans. Consumer loans are generally originated at higher interest rates than residential and commercial real estate loans, but they also generally tend to have a higher credit risk than residential real estate loans because they are usually unsecured or secured by rapidly depreciable assets. Management, however, believes that offering consumer loan products helps to expand and create stronger ties to our existing customer base by increasing the number of customer relationships and providing cross-marketing opportunities.
We offer a variety of consumer loans to retail customers in the communities we serve. Examples of our consumer loans include automobile loans, secured passbook loans, credit lines tied to deposit accounts to provide overdraft protection, and unsecured personal loans. At December 31, 2014, the consumer loan portfolio totaled $1.5 million, or 0.2% of total loans. Our consumer lending will allow us to diversify our loan portfolio while continuing to meet the needs of the individuals and businesses that we serve.
| 7 |
Loans collateralized by rapidly depreciable assets such as automobiles or that are unsecured entail greater risks than residential real estate loans. In such cases, repossessed collateral for a defaulted loan may not provide an adequate source of repayment of the outstanding loan balance, since there is a greater likelihood of damage, loss or depreciation of the underlying collateral. The remaining deficiency often does not warrant further substantial collection efforts against the borrower beyond obtaining a deficiency judgment. Further, collections on these loans are dependent on the borrower’s continuing financial stability and, therefore, are more likely to be adversely affected by job loss, divorce, illness or personal bankruptcy. There was no repossessed collateral relating to consumer loans at December 31, 2014. Finally, the application of various federal and state laws, including federal and state bankruptcy and insolvency laws, may limit the amount which can be recovered on such loans if a borrower defaults.
Loan Approval Procedures and Authority. Individuals authorized to make loans on our behalf are designated by our Senior Lending Officer and approved by the Board of Directors. Each designated loan officer has loan approval authority up to prescribed limits that depend upon the officer’s level of experience.
Upon receipt of a completed loan application from a prospective borrower, we order a credit report and verify other information. If necessary, we obtain additional financial or credit related information. We also require an appraisal for all commercial real estate loans greater than $250,000, which is performed by licensed or certified third-party appraisal firms and reviewed by our credit administration department
Loans that are $250,000 or under, an assessment of valuation will be performed by a qualified individual. The individual performing the assessment of valuation is independent from the loan production and will validate the evaluation methodology by supporting criteria. If the valuation assessment is over 70% loan to value (LTV) a full appraisal will be ordered by a licensed appraiser. For loan amounts over $250,000 a full appraisal is required by a licensed appraiser
Commercial and Industrial Loans and Commercial Real Estate Loans. We lend up to a maximum loan-to-value ratio of 85% on commercial properties and the majority of these loans require a minimum debt coverage ratio of 1.15. Commercial real estate lending involves additional risks compared with one-to-four-family residential lending. Because payments on loans secured by commercial real estate properties are often dependent on the successful operation or management of the properties, and/or the collateral value of the commercial real estate securing the loan, repayment of such loans may be subject, to a greater extent, to adverse conditions in the real estate market or the economy. Also, commercial real estate loans typically involve large loan balances to single borrowers or groups of related borrowers. Our loan policies limit the amounts of loans to a single borrower or group of borrowers to reduce this risk.
Our lending policies permit our lending and underwriting departments to review and approve commercial and industrial loans and commercial real estate loans up to $1.0 million. Any commercial and industrial or commercial real estate loan application that exceeds $1.0 million or that would result in the borrower’s total credit exposure with us to exceed $1.0 million, or whose approval requires an exception to our standard loan approval procedures, requires approval of the Executive Committee of the Board of Directors. An example of an exception to our standard loan approval procedures would be if a borrower was located outside our primary lending area. For loans requiring Board approval, management is responsible for presenting to the Board information about the creditworthiness of a borrower and the estimated value of the subject equipment or property. Generally, these determinations are based on financial statements, corporate and personal tax returns, as well as any other necessary information, including real estate and or equipment appraisals.
Home Equity Loans. We originate and fund home equity loans. These loans may be originated in amounts up to 85% (CLTV) of the current value of the property. Our lending and underwriting department may approve home equity loans up to $250,000. Home equity loans in amounts greater than $250,000 and up to $350,000 may be approved by certain officers who have been approved by the Board of Directors. Home equity loans over $350,000, or who approval requires an exception to our standard approval procedures, are reviewed and approved by the Executive Committee of the Board of Directors.
| 8 |
Asset Quality
One of our key operating objectives has been and continues to be the achievement of a high level of asset quality. We maintain a large proportion of loans secured by residential and commercial properties, set sound credit standards for new loan originations and follow careful loan administration procedures. We also utilize the services of an outside consultant to conduct credit quality reviews of our commercial and industrial and commercial real estate loan portfolio on at least an annual basis.
Nonaccrual Loans and Foreclosed Assets. Our policies require that management continuously monitor the status of the loan portfolio and report to the Board of Directors on a monthly basis. These reports include information on nonaccrual loans and foreclosed real estate, as well as our actions and plans to cure the nonaccrual status of the loans and to dispose of the foreclosed property.
The following table presents information regarding nonperforming mortgage, consumer and other loans, and foreclosed real estate as of the dates indicated. All loans where the payment is 90 days or more in arrears as of the closing date of each month are placed on nonaccrual status. At December 31, 2014, 2013 and 2012, we had $8.8 million, $2.6 million, and $3.0 million, respectively, of nonaccrual loans. If all nonaccrual loans had been performing in accordance with their terms, we would have earned additional interest income of $221,000, $162,000 and $406,000 for the years ended December 31, 2014, 2013 and 2012, respectively.
| At December 31, | ||||||||||||||||||||
| 2014 | 2013 | 2012 | 2011 | 2010 | ||||||||||||||||
| (Dollars in thousands) | ||||||||||||||||||||
| Nonaccrual real estate loans: | ||||||||||||||||||||
| Residential | $ | 1,323 | $ | 712 | $ | 939 | $ | 670 | $ | 629 | ||||||||||
| Home equity | 1 | 38 | 103 | 230 | 144 | |||||||||||||||
| Commercial real estate | 3,257 | 1,449 | 1,558 | 1,879 | 1,892 | |||||||||||||||
| Total nonaccrual real estate loans | 4,581 | 2,199 | 2,600 | 2,779 | 2,665 | |||||||||||||||
| Other loans: | ||||||||||||||||||||
| Commercial and industrial | 4,233 | 386 | 409 | 154 | 539 | |||||||||||||||
| Consumer | 16 | 1 | — | — | — | |||||||||||||||
| Total nonaccrual other loans | 4,249 | 387 | 409 | 154 | 539 | |||||||||||||||
| Total nonperforming loans | 8,830 | 2,586 | 3,009 | 2,933 | 3,204 | |||||||||||||||
| Foreclosed real estate, net | — | — | 964 | 1,130 | 223 | |||||||||||||||
| Total nonperforming assets | $ | 8,830 | $ | 2,586 | $ | 3,973 | $ | 4,063 | $ | 3,427 | ||||||||||
| Nonperforming loans to total loans | 1.22 | % | 0.41 | % | 0.51 | % | 0.53 | % | 0.63 | % | ||||||||||
| Nonperforming assets to total assets | 0.67 | 0.20 | 0.31 | 0.32 | 0.28 | |||||||||||||||
| 9 |
Allowance for Loan Losses. The following table presents the activity in our allowance for loan losses and other ratios at or for the dates indicated.
| At or for Years Ended December 31, | ||||||||||||||||||||
| 2014 | 2013 | 2012 | 2011 | 2010 | ||||||||||||||||
| (Dollars in thousands) | ||||||||||||||||||||
| Balance at beginning of year | $ | 7,459 | $ | 7,794 | $ | 7,764 | $ | 6,934 | $ | 7,645 | ||||||||||
| Charge-offs: | ||||||||||||||||||||
| Residential | (31 | ) | (80 | ) | — | (2 | ) | (36 | ) | |||||||||||
| Commercial real estate | (350 | ) | (20 | ) | (195 | ) | (175 | ) | (7,536 | ) | ||||||||||
| Home equity loans | — | — | (155 | ) | — | — | ||||||||||||||
| Commercial and industrial | (787 | ) | (208 | ) | (391 | ) | (442 | ) | (2,129 | ) | ||||||||||
| Consumer | (55 | ) | (33 | ) | (27 | ) | (21 | ) | (16 | ) | ||||||||||
| Total charge-offs | (1,223 | ) | (341 | ) | (768 | ) | (640 | ) | (9,717 | ) | ||||||||||
| Recoveries: | ||||||||||||||||||||
| Residential | 1 | 1 | 3 | 6 | 7 | |||||||||||||||
| Commercial real estate | — | 155 | 78 | 140 | 8 | |||||||||||||||
| Home equity loans | — | — | 2 | 3 | 4 | |||||||||||||||
| Commercial and industrial | 121 | 84 | 7 | 90 | 21 | |||||||||||||||
| Consumer | 15 | 22 | 10 | 25 | 43 | |||||||||||||||
| Total recoveries | 137 | 262 | 100 | 264 | 83 | |||||||||||||||
| Net charge-offs | (1,086 | ) | (79 | ) | (668 | ) | (376 | ) | (9,634 | ) | ||||||||||
| Provision (credit) for loan losses | 1,575 | (256 | ) | 698 | 1,206 | 8,923 | ||||||||||||||
| Balance at end of year | $ | 7,948 | $ | 7,459 | $ | 7,794 | $ | 7,764 | $ | 6,934 | ||||||||||
| Total loans receivable (1) | $ | 723,416 | $ | 636,660 | $ | 593,944 | $ | 553,139 | $ | 508,584 | ||||||||||
| Average loans outstanding | $ | 683,064 | $ | 619,240 | $ | 573,642 | $ | 536,084 | $ | 482,215 | ||||||||||
| Allowance for loan losses as a percent of total loans receivable | 1.10 | % | 1.17 | % | 1.31 | % | 1.40 | % | 1.36 | % | ||||||||||
| Net loans charged-off as a percent of average loans outstanding | 0.16 | 0.01 | 0.12 | 0.07 | 2.00 | |||||||||||||||
| (1) Does not include unearned premiums, deferred costs and fees, or allowance for loan losses. | |
We maintain an allowance for loan losses to absorb losses inherent in the loan portfolio based on ongoing quarterly assessments of the estimated losses. Our methodology for assessing the appropriateness of the allowance consists of a review of the components, which include a specific valuation allowance for impaired loans and a general allowance for non-impaired loans. The specific valuation allowance incorporates the results of measuring impairment for specifically identified non-homogenous problem loans and, as applicable, troubled debt restructurings (“TDRs”). The specific allowance reduces the carrying amount of the impaired loans to their estimated fair value, less costs to sell, if collateral dependent. A loan is recognized as impaired when it is probable that principal and/or interest are not collectible in accordance with the loan’s contractual terms. The general allowance is calculated by applying loss factors to outstanding loans by type, excluding loans for which a specific allowance has been determined. As part of this analysis, each quarter we prepare an allowance for loan losses worksheet which categorizes the loan portfolio by risk characteristics such as loan type and loan grade. The general allowance is inherently subjective as it requires material estimates that may be susceptible to significant change. There are a number of factors that are considered when evaluating the appropriate level of the allowance. These factors include current economic and business conditions that affect our key lending areas, new loan products, collateral values, loan volumes and concentrations, credit quality trends such as nonperforming loans, delinquency and loan losses, and specific industry concentrations within the portfolio segments that may impact the collectability of the loan portfolio. For information on our methodology for assessing the appropriateness of the allowance for loan losses please see Footnote 1 – “Summary of Significant Accounting Policies” of our notes to consolidated financial statements.
| 10 |
In addition, management employs an independent third party to perform a semi-annual review of a sample of our commercial and industrial loans and owner occupied commercial real estate loans. During the course of their review, the third party examines a sample of loans, including new loans, existing relationships over certain dollar amounts and classified assets.
Our methodologies include several factors that are intended to reduce the difference between estimated and actual losses; however, because these are management’s best estimates based on information known at the time, estimates may differ from actual losses incurred. The loss factors that are used to establish the allowance for pass graded loans are designated to be self-correcting by taking into account changes in loan classification, loan concentrations and loan volumes and by permitting adjustments based on management’s judgments of qualitative factors as of the evaluation date. Similarly, by basing the pass graded loan loss factors on loss experience over the prior six years, the methodology is designed to take loss experience into account.
Our allowance methodology has been applied on a consistent basis. Based on this methodology, we believe that we have established and maintained the allowance for loan losses at appropriate levels. Future adjustments to the allowance for loan losses, however, may be necessary if economic, real estate and other conditions differ substantially from the current operating environment resulting in estimated and actual losses differing substantially. Adjustments to the allowance for loan losses are charged to income through the provision for loan losses.
A summary of the components of the allowance for loan losses is as follows:
| December 31, 2014 | December 31, 2013 | December 31, 2012 | ||||||||||||||||||||||||||||||||||
| Specific | General | Total | Specific | General | Total | Specific | General | Total | ||||||||||||||||||||||||||||
| (In thousands) | ||||||||||||||||||||||||||||||||||||
| Commercial real estate | $ | — | $ | 3,705 | $ | 3,705 | $ | 82 | $ | 3,468 | $ | 3,550 | $ | 377 | $ | 3,029 | $ | 3,406 | ||||||||||||||||||
| Residential real estate: | ||||||||||||||||||||||||||||||||||||
| Residential | — | 1,755 | 1,755 | — | 1,454 | 1,454 | 57 | 1,425 | 1,482 | |||||||||||||||||||||||||||
| Home Equity | — | 298 | 298 | — | 253 | 253 | — | 264 | 264 | |||||||||||||||||||||||||||
| Commercial and industrial | — | 2,174 | 2,174 | 15 | 2,176 | 2,191 | 104 | 2,063 | 2,167 | |||||||||||||||||||||||||||
| Consumer | — | 15 | 15 | — | 13 | 13 | — | 13 | 13 | |||||||||||||||||||||||||||
| Unallocated | — | 1 | 1 | — | (2 | ) | (2 | ) | — | 462 | 462 | |||||||||||||||||||||||||
| Total | $ | — | $ | 7,948 | $ | 7,948 | $ | 97 | $ | 7,362 | $ | 7,459 | $ | 538 | $ | 7,256 | $ | 7,794 | ||||||||||||||||||
| December 31, 2011 | December 31, 2010 | |||||||||||||||||||||||
| Specific | General | Total | Specific | General | Total | |||||||||||||||||||
| (In thousands) | ||||||||||||||||||||||||
| Commercial real estate | $ | 449 | $ | 3,055 | $ | 3,504 | $ | — | $ | 3,182 | $ | 3,182 | ||||||||||||
| Real estate mortgage: | ||||||||||||||||||||||||
| Residential | 70 | 1,152 | 1,222 | — | 877 | 877 | ||||||||||||||||||
| Home Equity | 39 | 270 | 309 | — | — | — | ||||||||||||||||||
| Commercial and industrial | 39 | 2,673 | 2,712 | 19 | 2,830 | 2,849 | ||||||||||||||||||
| Consumer | — | 17 | 17 | — | 26 | 26 | ||||||||||||||||||
| Total | $ | 597 | $ | 7,167 | $ | 7,764 | $ | 19 | $ | 6,915 | $ | 6,934 | ||||||||||||
| 11 |
In addition, the OCC, as an integral part of its examination process, periodically reviews our loan and foreclosed real estate portfolios and the related allowance for loan losses and valuation allowance for foreclosed real estate. The OCC may require us to adjust the allowance for loan losses or the valuation allowance for foreclosed real estate based on their judgment of information available to them at the time of their examination, thereby adversely affecting our results of operations. There were no adjustments recommended during 2014.
For the year ended December 31, 2014, we recorded a provision of $1.6 million to the allowance for loan losses based on our evaluation of the items discussed above. We believe that the allowance for loan losses adequately reflects the level of incurred losses in the current loan portfolio as of December 31, 2014.
Allocation of Allowance for Loan Losses. The following tables set forth the allowance for loan losses allocated by loan category, the total loan balances by category, and the percent of loans in each category to total loans.
| December 31, 2014 | December 31, 2013 | December 31, 2012 | ||||||||||||||||||||||||||||||||||
| Loan Category | Amount of Allowance for Loan Losses | Loan Balances by Category | Percent of Loans in Each Category to Total Loans | Amount of Allowance for Loan Losses | Loan Balances by Category | Percent of Loans in Each Category to Total Loans | Amount of Allowance for Loan Losses | Loan Balances by Category | Percent of Loans in Each Category to Total Loans | |||||||||||||||||||||||||||
| (In thousands) | ||||||||||||||||||||||||||||||||||||
| Commercial real estate | $ | 3,705 | $ | 278,405 | 38.49 | % | $ | 3,550 | $ | 264,476 | 41.54 | % | $ | 3,406 | $ | 245,764 | 41.38 | |||||||||||||||||||
| Real estate mortgage: | ||||||||||||||||||||||||||||||||||||
| Residential | 1,755 | 237,436 | 32.82 | 1,454 | 198,686 | 31.21 | 1,482 | 185,345 | 31.21 | % | ||||||||||||||||||||||||||
| Home equity | 298 | 40,305 | 5.57 | 253 | 35,371 | 5.56 | 264 | 34,352 | 5.78 | |||||||||||||||||||||||||||
| Commercial loans | 2,174 | 165,728 | 22.91 | 2,191 | 135,555 | 21.29 | 2,167 | 126,052 | 21.22 | |||||||||||||||||||||||||||
| Consumer loans | 15 | 1,542 | 0.21 | 13 | 2,572 | 0.40 | 13 | 2,431 | 0.41 | |||||||||||||||||||||||||||
| Unallocated | 1 | — | 0.00 | (2 | ) | — | 0.00 | 462 | — | 0.00 | ||||||||||||||||||||||||||
| Total allowances for loan losses | $ | 7,948 | $ | 723,416 | 100.00 | % | $ | 7,459 | $ | 636,660 | 100.00 | % | $ | 7,794 | $ | 593,944 | 100.00 | % | ||||||||||||||||||
| December 31, 2011 | December 31, 2010 | |||||||||||||||||||||||
| Amount of Allowance for Loan Losses | Loan Balances by Category | Percent of Loans in Each Category to Total Loans | Amount of Allowance for Loan Losses | Loan Balances by Category | Percent of Loans in Each Category to Total Loans | |||||||||||||||||||
| (In thousands) | ||||||||||||||||||||||||
| Commercial real estate | $ | 3,504 | $ | 232,491 | 42.03 | % | $ | 3,182 | $ | 221,578 | 43.57 | |||||||||||||
| Real estate mortgage: | ||||||||||||||||||||||||
| Residential | 1,222 | 155,994 | 28.20 | 877 | 112,680 | 22.16 | % | |||||||||||||||||
| Home equity | 309 | 36,464 | 6.59 | — | 36,116 | 7.10 | ||||||||||||||||||
| Commercial loans | 2,712 | 125,739 | 22.73 | 2,849 | 135,250 | 26.59 | ||||||||||||||||||
| Consumer loans | 17 | 2,451 | 0.44 | 26 | 2,960 | 0.58 | ||||||||||||||||||
| Total allowances for loan losses | $ | 7,764 | $ | 553,139 | 100.00 | % | $ | 6,934 | $ | 508,584 | 100.00 | % | ||||||||||||
Potential Problem Loans. We have no potential problem loans not reported as impaired at December 31, 2014.
Investment Activities. The Board of Directors reviews and approves our investment policy on an annual basis. The Chief Executive Officer and Chief Financial Officer, as authorized by the Board of Directors, implement this policy based on the established guidelines within the written policy.
| 12 |
Our investment policy is designed primarily to manage the interest rate sensitivity of our assets and liabilities, to generate a favorable return without incurring undue interest rate and credit risk, to complement our lending activities and to provide and maintain liquidity within the range established by policy. In determining our investment strategies, we consider our interest rate sensitivity, yield, credit risk factors, maturity and amortization schedules, and other characteristics of the securities to be held.
Federally chartered savings banks have authority to invest in various types of assets, including U.S. Treasury obligations, securities of various government-sponsored enterprises, mortgage-backed securities, certain certificates of deposit of insured financial institutions, repurchase agreements, overnight and short-term loans to other banks and corporate debt instruments.
Securities Portfolio. We invest in government-sponsored enterprise debt securities which consist of bonds issued by the Federal National Mortgage Association and the Federal Home Loan Mortgage Corporation. We also invest in municipal bonds issued by cities and towns in Massachusetts that are rated as investment grade by Moody’s, Standard and Poor’s, or Fitch, the majority of which are also independently insured. These securities have maturities that do not exceed 15 years; however, many have earlier call dates. In addition, we have investments in Federal Home Loan Bank stock and mutual funds that invest only in securities allowed by the OCC.
Our mortgage-backed securities, the majority of which are directly or indirectly insured or guaranteed by Freddie Mac, Ginnie Mae or Fannie Mae, consist primarily of fixed rate securities.
The following table sets forth the composition of our securities portfolio at the dates indicated.
| At December 31, | ||||||||||||||||||||||||
| 2014 | 2013 | 2012 | ||||||||||||||||||||||
| Amortized | Fair | Amortized | Fair | Amortized | Fair | |||||||||||||||||||
| Cost | Value | Cost | Value | Cost | Value | |||||||||||||||||||
| Available for sale: | (In thousands) | |||||||||||||||||||||||
| Debt Securities: | ||||||||||||||||||||||||
| Government sponsored enterprise obligations | $ | 24,066 | $ | 23,979 | $ | 10,992 | $ | 10,700 | $ | 60,840 | $ | 62,060 | ||||||||||||
| State and municipal bonds | 16,472 | 17,034 | 18,240 | 18,897 | 38,788 | 40,846 | ||||||||||||||||||
| Corporate Bonds | 25,711 | 26,223 | 26,716 | 27,389 | 50,782 | 52,337 | ||||||||||||||||||
| Total debt securities | 66,249 | 67,236 | 55,948 | 56,986 | 150,410 | 155,243 | ||||||||||||||||||
| Mortgage-backed securities: | ||||||||||||||||||||||||
| Government sponsored mortgage-backed securities | 139,637 | 139,213 | 135,981 | 132,372 | 318,951 | 328,023 | ||||||||||||||||||
| U.S. Government guaranteed mortgage-backed securities | 1,591 | 1,586 | 46,225 | 46,328 | 124,650 | 130,735 | ||||||||||||||||||
| Total mortgage-backed securities | 141,228 | 140,799 | 182,206 | 178,700 | 443,601 | 458,758 | ||||||||||||||||||
| Marketable equity securities: | ||||||||||||||||||||||||
| Mutual funds | 6,296 | 6,176 | 6,150 | 5,919 | 5,998 | 6,046 | ||||||||||||||||||
| Common and preferred stock | 1,309 | 1,539 | 1,310 | 1,599 | 1,310 | 1,460 | ||||||||||||||||||
| Total marketable equity securities | 7,605 | 7,715 | 7,460 | 7,518 | 7,308 | 7,506 | ||||||||||||||||||
| Total available for sale securities | $ | 215,082 | $ | 215,750 | $ | 245,614 | $ | 243,204 | $ | 601,319 | $ | 621,507 | ||||||||||||
| Held to maturity: | ||||||||||||||||||||||||
| Debt Securities: | ||||||||||||||||||||||||
| Government sponsored enterprise obligations | $ | 43,477 | $ | 42,882 | $ | 43,405 | $ | 40,034 | $ | — | $ | — | ||||||||||||
| State and municipal bonds | 7,285 | 7,250 | 7,351 | 7,011 | — | — | ||||||||||||||||||
| Corporate Bonds | 24,751 | 24,579 | 27,566 | 27,029 | — | — | ||||||||||||||||||
| Total debt securities | 75,513 | 74,711 | 78,322 | 74,074 | — | — | ||||||||||||||||||
| Mortgage-backed securities: | ||||||||||||||||||||||||
| Government sponsored mortgage-backed securities | 164,001 | 164,932 | 176,986 | 170,167 | — | — | ||||||||||||||||||
| U.S. Government guaranteed mortgage-backed securities | 38,566 | 37,993 | 39,705 | 38,314 | — | — | ||||||||||||||||||
| Total mortgage-backed securities | 202,567 | 202,925 | 216,691 | 208,481 | — | — | ||||||||||||||||||
| Total held to maturity securities | $ | 278,080 | $ | 277,636 | $ | 295,013 | $ | 282,555 | $ | — | $ | — | ||||||||||||
| 13 |
Mortgage-Backed Securities. The following table sets forth the amortized cost and fair value of our mortgage-backed securities, which are classified as available for sale or held to maturity at the dates indicated.
| At December 31, | ||||||||||||||||||||||||||||||||||||
| 2014 | 2013 | 2012 | ||||||||||||||||||||||||||||||||||
| Amortized | Percent of | Fair | Amortized | Percent of | Fair | Amortized | Percent of | Fair | ||||||||||||||||||||||||||||
| Cost | Total | Value | Cost | Total | Value | Cost | Total | Value | ||||||||||||||||||||||||||||
| (Dollars in thousands) | ||||||||||||||||||||||||||||||||||||
| Available for sale: | ||||||||||||||||||||||||||||||||||||
| Government sponsored residential mortgage-backed | $ | 139,637 | 40.62 | % | $ | 139,213 | $ | 135,981 | 34.09 | % | $ | 132,372 | $ | 318,951 | 71.90 | % | $ | 328,023 | ||||||||||||||||||
| U.S. Government guaranteed residential mortgage-backed | 1,591 | 0.46 | 1,586 | 46,225 | 11.59 | 46,328 | 124,650 | 28.10 | 130,735 | |||||||||||||||||||||||||||
| Total available for sale | 141,228 | 41.08 | 140,799 | 182,206 | 45.68 | 178,700 | 443,601 | 100.00 | 458,758 | |||||||||||||||||||||||||||
| Held to maturity: | ||||||||||||||||||||||||||||||||||||
| Government sponsored residential mortgage-backed | 164,001 | 47.70 | 164,932 | 176,986 | 44.37 | 170,167 | — | — | — | |||||||||||||||||||||||||||
| U.S. Government guaranteed residential mortgage-backed | 38,566 | 11.22 | 37,993 | 39,705 | 9.95 | 38,314 | — | — | — | |||||||||||||||||||||||||||
| Total held to maturity | 202,567 | 58.92 | 202,925 | 216,691 | 54.32 | 208,481 | — | — | — | |||||||||||||||||||||||||||
| Total | $ | 343,795 | 100.00 | % | $ | 343,724 | $ | 398,897 | 100.00 | % | $ | 387,181 | $ | 443,601 | 100.00 | % | $ | 458,758 | ||||||||||||||||||
| 14 |
Securities Portfolio Maturities. The composition and maturities of the debt securities portfolio and the mortgage-backed securities portfolio at December 31, 2014 are summarized in the following table. Maturities are based on the final contractual payment dates, and do not reflect the impact of prepayments or redemptions that may occur.
| One Year or Less | More than One Year through Five Years | More than Five Years through Ten Years | More than Ten Years | Total Securities | ||||||||||||||||||||||||||||||||||||||||
| Weighted | Weighted | Weighted | Weighted | Weighted | ||||||||||||||||||||||||||||||||||||||||
| Amortized | Average | Amortized | Average | Amortized | Average | Amortized | Average | Amortized | Fair | Average | ||||||||||||||||||||||||||||||||||
| Cost | Yield | Cost | Yield | Cost | Yield | Cost | Yield | Cost | Value | Yield | ||||||||||||||||||||||||||||||||||
| (Dollars in thousands) | ||||||||||||||||||||||||||||||||||||||||||||
| Debt Securities available for sale: | ||||||||||||||||||||||||||||||||||||||||||||
| Government sponsored enterprise obligations | $ | — | — | % | $ | 20,570 | 1.41 | % | $ | 3,496 | 2.71 | % | $ | — | — | % | $ | 24,066 | $ | 23,979 | 1.60 | % | ||||||||||||||||||||||
| State and municipal bonds | 2,742 | 3.76 | 9,130 | 3.61 | 4,414 | 3.55 | 186 | 4.22 | 16,472 | 17,034 | 3.63 | |||||||||||||||||||||||||||||||||
| Corporate Bonds | — | — | 20,124 | 3.07 | 5,587 | 3.14 | — | — | 25,711 | 26,223 | 3.09 | |||||||||||||||||||||||||||||||||
| Total debt securities available for sale | 2,742 | — | 49,824 | 2.48 | 13,497 | 3.16 | 186 | 4.22 | 66,249 | 67,236 | 2.68 | |||||||||||||||||||||||||||||||||
| Mortgage-backed securities available for sale: | ||||||||||||||||||||||||||||||||||||||||||||
| Government sponsored residential mortgage-backed | — | — | 10,083 | 1.00 | 23,140 | 1.00 | 106,414 | 2.15 | 139,637 | 139,213 | 2.15 | |||||||||||||||||||||||||||||||||
| U.S. Government guaranteed residential mortgage-backed | — | — | — | — | — | — | 1,591 | 2.28 | 1,591 | 1,586 | 2.28 | |||||||||||||||||||||||||||||||||
| Total mortgage-backed securities available for sale | — | — | 10,083 | — | 23,140 | 1.00 | 108,005 | 2.16 | 141,228 | 140,799 | 2.15 | |||||||||||||||||||||||||||||||||
| Total available for sale | $ | 2,742 | 3.76 | % | $ | 59,907 | 2.23 | % | $ | 36,637 | 1.80 | % | $ | 108,191 | $ | 2.16 | % | $ | 207,477 | $ | 208,035 | 2.32 | % | |||||||||||||||||||||
| Debt securities held to maturity: | ||||||||||||||||||||||||||||||||||||||||||||
| U.S. Government and federal agency | $ | — | — | % | $ | — | — | % | $ | 33,410 | 2.37 | % | $ | 10,067 | 3.13 | % | $ | 43,477 | $ | 42,882 | 2.55 | |||||||||||||||||||||||
| State and municipal | 381 | 0.75 | 180 | 1.02 | 2,124 | 2.84 | 4,600 | 3.32 | 7,285 | 7,250 | 2.99 | |||||||||||||||||||||||||||||||||
| Corporate Bonds | — | — | 19,850 | 1.63 | 4,901 | 3.24 | — | — | 24,751 | 24,579 | 1.95 | |||||||||||||||||||||||||||||||||
| Total debt securities held to maturity | 381 | — | 20,030 | 1.62 | 40,435 | 2.50 | 14,667 | 3.19 | 75,513 | 74,711 | 2.39 | % | ||||||||||||||||||||||||||||||||
| Mortgage-backed securities held to maturity: | ||||||||||||||||||||||||||||||||||||||||||||
| Government sponsored residential mortgage-backed | — | — | — | — | 46,091 | 1.00 | 117,910 | 2.99 | 164,001 | 164,932 | 2.76 | |||||||||||||||||||||||||||||||||
| U.S. Government guaranteed residential mortgage-backed | — | — | — | — | — | — | 38,566 | 1.98 | 38,566 | 37,993 | 1.98 | |||||||||||||||||||||||||||||||||
| Total mortgage-backed securities held to maturity | — | — | — | — | 46,091 | 1.00 | 156,476 | 2.74 | 202,567 | 202,925 | 2.61 | |||||||||||||||||||||||||||||||||
| Total held to maturity | $ | 381 | 0.75 | % | $ | 20,030 | 1.62 | % | $ | 86,526 | 1.70 | % | $ | 171,143 | 2.78 | % | $ | 278,080 | $ | 277,636 | 2.55 | % | ||||||||||||||||||||||
| 15 |
Sources of Funds
General. Deposits, short-term borrowings, long-term debt, scheduled amortization and prepayments of loan principal, maturities and calls of securities and funds provided by operations are our primary sources of funds for use in lending, investing and for other general purposes. See “Management’s Discussion and Analysis of Financial Condition and Results of Operations — Liquidity and Capital Resources.”
Deposits. We offer a variety of deposit accounts having a range of interest rates and terms. We currently offer regular savings deposits (consisting of passbook and statement savings accounts), interest-bearing demand accounts, noninterest-bearing demand accounts, money market accounts and time deposits. We have expanded the types of deposit products that we offer to include jumbo certificates of deposit, tiered money market accounts and customer repurchase agreements to complement our increased emphasis on attracting commercial banking relationships.
Deposit flows are influenced significantly by general and local economic conditions, changes in prevailing interest rates, pricing of deposits and competition. Our deposits are primarily obtained from areas surrounding our offices. We rely primarily on paying competitive rates, service and long-standing relationships with customers to attract and retain these deposits.
When we determine our deposit rates, we consider local competition, U.S. Treasury securities offerings and the rates charged on other sources of funds. Core deposits (defined as regular accounts, money market accounts, and interest-bearing and noninterest-bearing demand accounts) represented 57.1% of total deposits on December 31, 2014 and 58.2% on December 31, 2013. At December 31, 2014 and December 31, 2013, time deposits with remaining terms to maturity of less than one year amounted to $199.0 million and $212.9 million, respectively. See “Management’s Discussion and Analysis of Financial Condition and Results of Operations — Net Interest and Dividend Income” for information relating to the average balances and costs of our deposit accounts for the years ended December 31, 2014, 2013 and 2012.
Deposit Distribution and Weighted Average Rates. The following table sets forth the distribution of our deposit accounts, by account type, at the dates indicated.
| At December, 31 | ||||||||||||||||||||||||||||||||||||
| 2014 | 2013 | 2012 | ||||||||||||||||||||||||||||||||||
| Amount | Percent | Weighted Average Rates | Amount | Percent | Weighted Average Rates | Amount | Percent | Weighted Average Rates | ||||||||||||||||||||||||||||
| (Dollars in thousands) | ||||||||||||||||||||||||||||||||||||
| Demand deposits | $ | 136,186 | 16.33 | % | — | % | $ | 145,040 | 17.75 | % | — | % | $ | 114,388 | 15.18 | % | — | % | ||||||||||||||||||
| Interest-bearing checking accounts | 37,983 | 4.55 | 0.24 | 44,924 | 5.50 | 0.27 | 52,595 | 6.98 | 0.30 | |||||||||||||||||||||||||||
| Regular accounts | 74,970 | 8.99 | 0.10 | 81,244 | 9.94 | 0.10 | 92,188 | 12.24 | 0.17 | |||||||||||||||||||||||||||
| Money market accounts | 227,330 | 27.25 | 0.37 | 204,469 | 25.02 | 0.38 | 168,195 | 22.32 | 0.38 | |||||||||||||||||||||||||||
| Total non-certificated accounts | 476,469 | 57.12 | 0.21 | 475,677 | 58.21 | 0.21 | 427,366 | 56.72 | 0.22 | |||||||||||||||||||||||||||
| Time certificates of deposit: | ||||||||||||||||||||||||||||||||||||
| Due within the year | 198,972 | 23.85 | 1.02 | 212,901 | 26.06 | 1.18 | 172,065 | 22.84 | 1.12 | |||||||||||||||||||||||||||
| Over 1 year through 3 years | 110,214 | 13.21 | 1.27 | 104,527 | 12.79 | 1.45 | 137,200 | 18.21 | 1.88 | |||||||||||||||||||||||||||
| Over 3 years | 48,563 | 5.82 | 1.72 | 24,007 | 2.94 | 1.41 | 16,782 | 2.23 | 1.66 | |||||||||||||||||||||||||||
| Total certificated accounts | 357,749 | 42.88 | 1.19 | 341,435 | 41.79 | 1.28 | 326,047 | 43.28 | 1.46 | |||||||||||||||||||||||||||
| Total | $ | 834,218 | 100.00 | % | 0.63 | % | $ | 817,112 | 100.00 | % | 0.66 | % | $ | 753,413 | 100.00 | % | 0.76 | % | ||||||||||||||||||
| 16 |
Certificate of Deposit Maturities. At December 31, 2014, we had $163.5 million in time certificates of deposit with balances of $100,000 and over maturing as follows:
| Maturity Period | Amount | Weighted Average Rate | ||||||||
| (In thousands) | ||||||||||
| 3 months or less | $ | 21,357 | 1.03 | % | ||||||
| Over 3 months through 6 months | 22,162 | 1.18 | ||||||||
| Over 6 months through 12 months | 51,375 | 1.01 | ||||||||
| Over 12 months | 68,597 | 1.45 | ||||||||
| Total | $ | 163,491 | 1.22 | % | ||||||
Certificate of Deposit Balances by Rates. The following table sets forth, by interest rate ranges, information concerning our time certificates of deposit at the dates indicated.
| At December 31, 2014 | ||||||||||||||||||||||||
| Period to Maturity | ||||||||||||||||||||||||
| Less than One Year | One to Two Years | Two to Three Years | More than Three Years | Total | Percent of Total | |||||||||||||||||||
| (Dollars in thousands) | ||||||||||||||||||||||||
| 1.00% and under | $ | 134,132 | $ | 15,727 | $ | 8,600 | $ | 6,419 | $ | 164,878 | 46.09 | % | ||||||||||||
| 1.01% to 2.00% | 48,235 | 59,027 | 26,579 | 41,012 | 174,853 | 48.87 | ||||||||||||||||||
| 2.01% to 3.00% | 16,460 | 281 | — | 1,132 | 17,873 | 5.00 | ||||||||||||||||||
| 3.01% to 4.00% | 145 | — | — | — | 145 | 0.04 | ||||||||||||||||||
| Total | $ | 198,972 | $ | 75,035 | $ | 35,179 | $ | 48,563 | $ | 357,749 | 100.00 | % | ||||||||||||
Short-term borrowings and long-term debt. We also use short-term borrowings and long-term debt as an additional source of funds to finance our lending and investing activities and to provide liquidity for daily operations. Short-term borrowings are made up of Federal Home Loan Bank of Boston (“FHLBB”) advances (including line of credit advances) with an original maturity of less than one year as well as customer repurchase agreements, which have an original maturity of one day. Short-term borrowings issued by the FHLBB were $62.8 million at December 31, 2014 and $20.0 million at December 31, 2013. We have an “Ideal Way” line of credit with the FHLBB for $9.5 million for the years ended December 31, 2014 and 2013. Interest on this line of credit is payable at a rate determined and reset by the FHLBB on a daily basis. The outstanding principal is due daily but the portion not repaid will be automatically renewed. At December 31, 2014, there was a $1.8 million advance outstanding under this line. There were no advances outstanding under this line at December 31, 2013.
Our repurchase agreements are with commercial customers. These agreements are linked to customers’ checking accounts. Excess funds are swept out of certain commercial checking accounts and into repurchase agreements where the customers can earn interest on their funds. At December 31, 2014 and 2013, such repurchase agreement borrowings totaled $31.2 million and $28.2 million, respectively. In addition, we have a $4.0 million line of credit with Bankers Bank Northeast (“BBN”) and a $50.0 million line of credit with PNC Bank, respectively, at an interest rate determined and reset by BBN and PNC on a daily basis. At December 31, 2014 and 2013, we had no advances outstanding under these lines. As part of our contract with BBN, we are required to maintain a reserve balance of $300,000 with BBN for our use of this line.
| 17 |
Long-term debt consists of FHLBB advances, securities sold under repurchase agreements and customer repurchase agreements with an original maturity of one year or more. At December 31, 2014, we had $216.7 million in long-term debt with the FHLBB, $10.0 million in a security sold under repurchase agreement with an approved broker-dealer and $5.8 million in long-term customer repurchase agreements. This compares to $232.7 million in FHLBB advances and $10.0 million in securities sold under repurchase agreements with an approved broker-dealer and $5.6 million in long-term customer repurchase agreements at December 31, 2013. At December 31, 2014, the security sold under a repurchase agreement of $10.0 million had a weighted average interest rate of 2.7% and a final maturity of $10.0 million in the year 2018. The security sold under an agreement to repurchase is callable at the issuer’s option in the year 2015.
Regulation
Westfield Financial and the Bank are subject to extensive regulation under federal and state laws. The regulatory framework applicable to savings and loan holding companies and their insured depository institution subsidiaries is intended to protect depositors, the federal deposit insurance fund, consumers and the banking system as a whole, and not necessarily investors in savings and loan holding companies such as Westfield Financial.
Set forth below is a description of the significant elements of the laws and regulations applicable to Westfield Financial and the Bank. The description that follows is qualified in its entirety by reference to the full text of the statutes, regulations, policies and guidelines that are described.
Regulatory Reforms. The Dodd-Frank Wall Street Reform and Consumer Protection Act (the “Dodd-Frank Act”), enacted on July 21, 2010, significantly changed the bank regulatory landscape and has impacted and will continue to impact the lending, deposit, investment, trading and operating activities of insured depository institutions and their holding companies. The Dodd-Frank Act requires various federal agencies to adopt a broad range of new rules and regulations. Certain provisions of the Dodd-Frank Act applicable to Westfield Financial and the Bank are discussed herein.
In July 2013, the Board of Governors of the Federal Reserve System (“Federal Reserve Board”) and the OCC approved final rules and the Federal Deposit Insurance Corporation (“FDIC”) approved an interim final rule (the “New Capital Rules”) establishing a new comprehensive capital framework for U.S. banking organizations. The New Capital Rules generally implement the Basel Committee on Banking Supervision’s (the “Basel Committee”) December 2010 final capital framework referred to as “Basel III” for strengthening international capital standards. The New Capital Rules substantially revise the risk-based capital requirements applicable to holding companies and their depository institution subsidiaries, including Westfield Financial and the Bank, as compared to the former U.S. general risk-based capital rules. The New Capital Rules revise the definitions and the components of regulatory capital, as well as address other issues affecting the numerator in banking institutions’ regulatory capital ratios. The New Capital Rules also address asset risk weights and other matters affecting the denominator in banking institutions’ regulatory capital ratios and replace the existing general risk-weighting approach, which was derived from the Basel Committee’s 1988 “Basel I” capital accords, with a more risk-sensitive approach based, in part, on the “standardized approach” in the Basel Committee’s 2004 “Basel II” capital accords. In addition, the New Capital Rules implement certain provisions of the Dodd-Frank Act, including the requirements of Section 939A to remove references to credit ratings from the federal banking agencies’ rules. The New Capital Rules became effective for Westfield Financial on January 1, 2015, subject to phase-in periods for certain components and other provisions.
In December 2013, the federal banking agencies jointly adopted final rules implementing Section 619 of the Dodd-Frank Act, commonly known as the Volcker Rule. The Volcker Rule restricts the ability of banking entities, such as Westfield Financial, to engage in proprietary trading or to own, sponsor or have certain relationships with hedge funds or private equity funds—so-called “Covered Funds.” The final rule definition of Covered Fund includes certain investments such as collateralized debt obligation (“CDO”) securities. Compliance is generally required by July 21, 2015.
| 18 |
The requirements of the Dodd-Frank Act and other regulatory reforms continue to be implemented. It is difficult to predict at this time what specific impact certain provisions and yet to be finalized implementing rules and regulations will have on us, including regulations promulgated by the Consumer Financial Protection Bureau (“CFPB”). Financial reform legislation and rules could have adverse implications on the financial industry, the competitive environment, and our ability to conduct business. Management will have to apply resources to ensure compliance with all applicable provisions of law and regulation including the Dodd-Frank Act and any implementing rules, which may increase our costs of operations and adversely impact our earnings.
Regulatory Agencies. Westfield Financial is a legal entity separate and distinct from the Bank and its other subsidiaries. As a savings and loan holding company, Westfield Financial is regulated under the Homeowners’ Loan Act of 1933, as amended (the “HOLA”), and is subject to inspection, examination and supervision by the Federal Reserve Board. In addition, the Federal Reserve Board has enforcement authority over Westfield Financial and its non-savings association subsidiaries.
The Bank is organized as a federal
savings association under the HOLA. It is subject to broad regulation and examination as well as enforcement by the OCC as its
primary supervisory agency, and by the FDIC as its deposit insurer.
Regulation of Savings and Loan Holding Companies. In general, the HOLA limits the business of savings and loan holding companies to that permitted for financial holding companies under the Bank Holding Company Act of 1956, as amended. Permissible businesses activities includes banking, managing or controlling banks and other activities that the Federal Reserve Board has determined to be so closely related to banking as to be a proper incident thereto, as well as any activity that is either (i) financial in nature or incidental to such financial activity (as determined by the Federal Reserve Board in consultation with the Secretary of the Treasury) or (ii) complementary to a financial activity, and that does not pose a substantial risk to the safety and soundness of depository institutions or the financial system generally (as solely determined by the Federal Reserve Board). Activities that are financial in nature include, among others, securities underwriting and dealing, insurance underwriting and making merchant banking investments.
Mergers and Acquisitions. The HOLA, the federal Bank Merger Act and other federal and state statutes regulate direct and indirect acquisitions of savings associations. The HOLA requires the prior approval of the Federal Reserve Board for the direct or indirect acquisition of more than 5% of the voting shares of a savings association or its parent holding company. Under the Bank Merger Act, the prior approval of the OCC is required for a federal savings association to merge with another insured depository institution, where the resulting institution is a federal savings association, or to purchase the assets or assume the deposits of another insured depository institution. In reviewing applications seeking approval of merger and acquisition transactions, the federal banking agencies must consider, among other things, the competitive effect and public benefits of the transactions, the capital position of the combined organization, performance records under the Community Reinvestment Act of 1977 (“CRA”) (see the section captioned “Community Reinvestment Act” included elsewhere in this section) and the effectiveness of the subject organizations in combating money laundering.
Source of Strength Doctrine. Federal Reserve Board policy requires savings and loan holding companies to act as a source of financial and managerial strength to their subsidiary savings associations. The Dodd-Frank Act codified the requirement that holding companies act as a source of financial strength. As a result, Westfield Financial is expected to commit resources to support the Bank, including at times when Westfield Financial may not be in a financial position to provide such resources. Any capital loans by a savings and loan holding company to any of its subsidiary savings associations are subordinate in right of payment to deposits and to certain other indebtedness of such subsidiary savings associations. In the event of a savings and loan holding company’s bankruptcy, any commitment by the savings and loan holding company to a federal banking agency to maintain the capital of a subsidiary insured depository institution will be assumed by the bankruptcy trustee and entitled to priority of payment.
Dividends. The principal source of Westfield Financial’s liquidity is dividends from the Bank. The OCC imposes various restrictions or requirements on the Bank’s ability to make capital distributions, including cash dividends. The prior approval of the OCC is required if the total of all distributions, including the proposed distribution, declared by a federal savings association in any calendar year would exceed an amount equal to the Bank’s net income for the year-to-date plus the Bank’s retained net income for the previous two years, or that would cause the Bank to be less than well capitalized. In addition, section 10(f) of the HOLA requires a subsidiary savings association of a saving and loan holding company, such as Bank, to file a notice with the Federal Reserve prior to declaring certain types of dividends. At December 31, 2014, there were no retained earnings available for the payment of dividends by the Bank to Westfield Financial without the prior approval of the OCC. The Bank paid Westfield Financial $14.7 million in dividends during the year ended December 31, 2014.
| 19 |
In addition, Westfield Financial and the Bank are subject to other regulatory policies and requirements relating to the payment of dividends, including requirements to maintain adequate capital above regulatory minimums. The appropriate federal banking agency is authorized to determine, under certain circumstances relating to the financial condition of a savings and loan holding company or a savings association, that the payment of dividends would be an unsafe or unsound practice and to prohibit payment thereof. The federal banking agencies have indicated that paying dividends that deplete an insured depository institution’s capital base to an inadequate level would be an unsafe and unsound banking practice and that banking organizations should generally pay dividends only out of current operating earnings.
Capital. Prior to the enactment of the Dodd-Frank Act, savings and loan holding companies were not subject to regulatory capital requirements. Pursuant to the Dodd-Frank Act, Westfield Financial, as a savings and loan holding company, is subject to the New Capital Rules.
The New Capital Rules: (i) introduce a new capital measure called “Common Equity Tier 1” (“CET1”) and related regulatory capital ratio of CET1 to risk-weighted assets; (ii) specify that Tier 1 capital consists of CET1 and “Additional Tier 1 capital” instruments meeting certain revised requirements; (iii) mandate that most deductions/adjustments to regulatory capital measures be made to CET1 and not to the other components of capital; and (iv) expand the scope of the deductions from and adjustments to capital as compared to existing regulations. Under the New Capital Rules, for most banking organizations, including Westfield Financial, the most common form of Additional Tier 1 capital is non-cumulative perpetual preferred stock and the most common forms of Tier 2 capital are subordinated notes and a portion of the allocation for loan and lease losses, in each case, subject to the New Capital Rules’ specific requirements.
Pursuant to the New Capital Rules, the minimum capital ratios as of January 1, 2015 are as follows:
| · | 4.5% CET1 to risk-weighted assets; |
| · | 6.0% Tier 1 capital (that is, CET1 plus Additional Tier 1 capital) to risk-weighted assets; |
| · | 8.0% Total capital (that is, Tier 1 capital plus Tier 2 capital) to risk-weighted assets; and |
| · | 4.0% Tier 1 capital to average consolidated assets as reported on consolidated financial statements (known as the “leverage ratio”). |
The New Capital Rules also introduce a new “capital conservation buffer,” composed entirely of CET1, on top of these minimum risk-weighted asset ratios. The capital conservation buffer is designed to absorb losses during periods of economic stress. Banking institutions with a ratio of CET1 to risk-weighted assets above the minimum but below the capital conservation buffer will face constraints on dividends, equity and other capital instrument repurchases and compensation based on the amount of the shortfall. Thus, when fully phased-in on January 1, 2019, the capital standards applicable to Westfield Financial will include an additional capital conservation buffer of 2.5% of CET1, effectively resulting in minimum ratios inclusive of the capital conservation buffer of (i) CET1 to risk-weighted assets of at least 7%, (ii) Tier 1 capital to risk-weighted assets of at least 8.5%, and (iii) Total capital to risk-weighted assets of at least 10.5%.
The New Capital Rules provide for a number of deductions from and adjustments to CET1. These include, for example, the requirement that mortgage servicing rights, deferred tax assets arising from temporary differences that could not be realized through net operating loss carrybacks and significant investments in non-consolidated financial entities be deducted from CET1 to the extent that any one such category exceeds 10% of CET1 or all such items, in the aggregate, exceed 15% of CET1.
| 20 |
In addition, under the current general risk-based capital rules, the effects of accumulated other comprehensive income or loss (“AOCI”) items included in shareholders’ equity (for example, marks-to-market of securities held in the available-for-sale portfolio) under U.S. GAAP are reversed for the purposes of determining regulatory capital ratios. Pursuant to the New Capital Rules, the effects of certain AOCI items are not excluded; however, non-advanced approaches banking organizations, including the Company, may make a one-time permanent election to continue to exclude these items. This election must be made concurrently with the first filing of certain of Westfield Financial’s periodic regulatory reports in the beginning of 2015. The New Capital Rules also preclude certain hybrid securities, such as trust preferred securities, from inclusion in a holding company’s Tier 1 capital. However, depository institution holding companies with total consolidated assets of less than $15 billion as of year-end 2009 are permitted to continue to count as Tier 1 capital trust preferred securities issued before May 19, 2010.
Implementation of the deductions and other adjustments to CET1 will begin on January 1, 2015 and will be phased-in over a 4-year period (beginning at 40% on January 1, 2015 and an additional 20% per year thereafter). The implementation of the capital conservation buffer will begin on January 1, 2016 at the 0.625% level and increase by 0.625% on each subsequent January 1, until it reaches 2.5% on January 1, 2019.
The New Capital Rules prescribe a new standardized approach for risk weightings that expand the risk-weighting categories from the current four Basel I-derived categories (0%, 20%, 50% and 100%) to a larger and more risk-sensitive number of categories, depending on the nature of the assets, generally ranging from 0% for U.S. government and agency securities, to 600% for certain equity exposures, and resulting in higher risk weights for a variety of asset classes.
We believe that Westfield Financial will be in compliance with the targeted capital ratios under the New Capital Rules.
Regulation of Federal Savings Banks.
Business Activities. The Bank derives its lending and investment powers from the HOLA and the regulations of the OCC thereunder. Those laws and regulations limit the Bank’s authority to invest in certain types of assets and to make certain types of loans. Permissible investments include, but are not limited to, mortgage loans secured by residential and commercial real estate, commercial and consumer loans, certain types of debt securities, and certain other assets. The Bank may also establish service corporations that may engage in activities not otherwise permissible for the Bank, including certain real estate equity investments and securities and insurance brokerage.
Loans to One Borrower. Generally, a federal savings bank may not make a loan or extend credit to a single borrower or related group of borrowers in excess of 15% of unimpaired capital and surplus. An additional amount may be loaned, equal to 10% of unimpaired capital and surplus, if the loan is secured by readily marketable collateral, which generally does not include real estate. As of December 31, 2014, we were in compliance with these limitations on loans to one borrower.
Qualified Thrift Lender Test. Under federal law, as a federal savings association the Bank must comply with the qualified thrift lender, or “QTL” test. Under the QTL test, the Bank is required to maintain at least 65% of its “portfolio assets” in certain “qualified thrift investments” in at least nine months of the most recent 12-month period. “Portfolio assets” means, in general, the Bank’s total assets less the sum of:
| · | specified liquid assets up to 20% of total assets; |
| · | goodwill and other intangible assets; and |
| · | value of property used to conduct the Bank’s business. |
| 21 |
“Qualified thrift investments” include certain assets that are includable without limit, such as residential and manufactured housing loans, home equity loans, education loans, small business loans, credit card loans, mortgage backed securities, Federal Home Loan Bank stock and certain U.S. government obligations. In addition, certain assets are includable as “qualified thrift investments” in an amount up to 20% of portfolio assets, including certain consumer loans and loans in “credit-needy” areas.
The Bank may also satisfy the QTL test by qualifying as a “domestic building and loan association” as defined in the Internal Revenue Code. Failure by the Bank to maintain its status as a QTL would result in restrictions on activities, including restrictions on branching and the payment of dividends. If the Bank were unable to correct that failure within a specified period of time, it must either continue to operate under those restrictions on its activities or convert to a national bank charter. The Bank met the QTL test in each of the prior 12 months and, therefore, is a “qualified thrift lender.”
Capital Requirements. As with Westfield Financial, the Bank is subject to the New Capital Rules on the same phase-in schedule. We believe that the Bank similarly will be able to comply with the targeted capital ratios under the New Capital Rules.
Liquidity. The Bank is required to maintain a sufficient amount of liquid assets to ensure its safe and sound operation.
Community Reinvestment. The Bank has a responsibility under the CRA to help meet the credit needs of its communities, including low and moderate-income neighborhoods. The CRA does not establish specific lending requirements or programs for insured depository institutions nor does it limit an institution’s discretion to develop the types of products and services that it believes are best suited to its particular community, consistent with the CRA. In connection with its examination, the OCC assesses the Bank’s record of compliance with the CRA. The Bank’s failure to comply with the provisions of the CRA could, at a minimum, result in regulatory restrictions on its activities and the activities of Westfield Financial. The Bank’s latest CRA rating was “outstanding.”
Consumer Protection. The Bank is subject to a number of federal and state laws designed to protect borrowers and promote fair lending. These laws include the Equal Credit Opportunity Act, the Fair Credit Reporting Act, the Truth in Lending Act, the Home Mortgage Disclosure Act, the Real Estate Settlement Procedures Act, various state law counterparts, and the Consumer Financial Protection Act of 2010, which constitutes part of the Dodd-Frank Act and established the CFPB.
On January 10, 2013, the CFPB issued a final rule implementing the ability-to-repay and qualified mortgage (QM) provisions of the Truth in Lending Act, as amended by the Dodd-Frank Act (the “QM Rule”). The ability-to-repay provision requires creditors to make reasonable, good faith determinations that borrowers are able to repay their mortgages before extending the credit based on a number of factors and consideration of financial information about the borrower from reasonably reliable third-party documents. Under the Dodd-Frank Act and the QM Rule, loans meeting the definition of “qualified mortgage” are entitled to a presumption that the lender satisfied the ability-to-repay requirements. The presumption is a conclusive presumption/safe harbor for prime loans meeting the QM requirements, and a rebuttable presumption for higher-priced/subprime loans meeting the QM requirements. The definition of a “qualified mortgage” incorporates the statutory requirements, such as not allowing negative amortization or terms longer than 30 years. The QM Rule also adds an explicit maximum 43% debt-to-income ratio for borrowers if the loan is to meet the QM definition, though some mortgages that meet GSE, FHA and VA underwriting guidelines may, for a period not to exceed seven years, meet the QM definition without being subject to the 43% debt-to-income limits. The QM Rule became effective January 10, 2014.
Transactions with Affiliates. Under federal law, transactions between insured depository institutions and their affiliates are governed by Sections 23A and 23B of the Federal Reserve Act (“FRA”). In a holding company context, at a minimum, the parent holding company of a bank or savings association, and any companies which are controlled by such parent holding company, are affiliates of the bank or savings association. Generally, sections 23A and 23B are intended to protect insured depository institutions from losses arising from transactions with non-insured affiliates, by limiting the extent to which a depository institution or its subsidiaries may engage in covered transactions with any one affiliate and with all affiliates of the depository institution in the aggregate, and by requiring that such transactions be on terms that are consistent with safe and sound banking practices.
| 22 |
Loans to Insiders. Section 22(h) of the FRA restricts loans to directors, executive officers, and principal stockholders (“insiders”). Under Section 22(h), loans to insiders and their related interests may not exceed, together with all other outstanding loans to such persons and affiliated entities, the insured depository institution’s total capital and surplus. Loans to insiders above specified amounts must receive the prior approval of the board of directors. Further, under Section 22(h), loans to directors, executive officers and principal stockholders must be made on terms substantially the same as offered in comparable transactions to other persons, except that such insiders may receive preferential loans made under a benefit or compensation program that is widely available to the bank’s employees and does not give preference to the insider over the employees. Section 22(g) of the FRA places additional limitations on loans to executive officers.
Enforcement. The OCC has primary enforcement responsibility over savings associations, including the Bank. This enforcement authority includes, among other things, the ability to assess civil money penalties, to issue cease and desist orders and to remove directors and officers. In general, these enforcement actions may be initiated in response to violations of laws and regulations as well as in response to unsafe or unsound practices.
Standards for Safety and Soundness. The Bank is subject to certain standards designed to maintain the safety and soundness of individual insured depository institutions and the banking system. The OCC has prescribed safety and soundness guidelines relating to (i) internal controls, information systems and internal audit systems; (ii) loan documentation; (iii) credit underwriting; (iv) interest rate exposure; (v) asset growth, concentration, and quality; (vi) earnings; and (vii) compensation and benefit standards for officers, directors, employees and principal shareholders. A savings association not meeting one or more of the safety and soundness guidelines may be required to file a compliance plan with the OCC.
Prompt Corrective Action. The federal banking agencies have established by regulation, for each capital measure, the levels at which an insured institution is “well-capitalized,” “adequately capitalized,” “undercapitalized,” “significantly undercapitalized” or “critically undercapitalized.” The federal banking agencies are required to take prompt corrective action (“PCA”) with respect to insured institutions that fall below the “adequately capitalized” level. Any insured depository institution that falls below the “adequately capitalized” level must submit a capital restoration plan, and, if its capital levels further decline or do not increase, will face increased scrutiny and more stringent supervisory action. As of December 31, 2014, the most recent notification from the OCC categorized the Bank as “well capitalized” under the PCA framework.
The New Capital Rules revise the PCA regulations adopted pursuant to Section 38 of the Federal Deposit Insurance Act (“FDIA”), by: (i) introducing a CET1 ratio requirement at each PCA category (other than critically undercapitalized), with the required CET1 ratio being 6.5% for well-capitalized status; (ii) increasing the minimum Tier 1 capital ratio requirement for each category, with the minimum Tier 1 capital ratio for well-capitalized status being 8% (as compared to the current 6%); and (iii) eliminating the provision that allowed a bank with a composite supervisory rating of 1 to have a 3% leverage ratio and still be considered adequately capitalized. The New Capital Rules do not change the total risk-based capital requirement for any PCA category.
Insurance of Deposit Accounts. The deposits of the Bank are insured up to applicable limits by the Deposit Insurance Fund (“DIF”) of the FDIC. The Bank is subject to deposit insurance assessments to maintain the DIF. The FDIC uses a risk-based assessment system that imposes insurance premiums based upon a risk matrix that takes into account an insured depository institution’s capital level and supervisory rating, knows as the CAMELS rating. The risk matrix utilizes four risk categories which are distinguished by capital levels and supervisory ratings.
In February 2011, the FDIC issued rules to implement changes to the deposit insurance assessment base, and risk-based assessments mandated by the Dodd-Frank Act. The base for insurance assessments changed from domestic deposits to consolidated assets less tangible equity. Assessment rates are calculated using formulas that take into account the risk of the institution being assessed. The rule was effective April 1, 2011. On September 28, 2011, the FDIC issued notification to insured depository institutions that the transition guidance for reporting certain leveraged and subprime loans on the Call Report had been extended from October 1, 2011 to April 1, 2012.
The Bank’s FDIC deposit insurance assessment expenses totaled $713,000, $655,000 and $611,000, for the years ended December 31, 2014, 2013, and 2012, respectively. FDIC insurance expense includes deposit insurance assessments and Financing Corporation (“FICO”) assessments related to outstanding FICO bonds. The FICO is a mixed-ownership government corporation established by the Competitive Equality Banking Act of 1987, whose sole purpose was to function as a financing vehicle for the now defunct Federal Savings & Loan Insurance Corporation.
| 23 |
Under the FDIA, the FDIC may terminate deposit insurance upon a finding that the institution has engaged in unsafe and unsound practices, is in an unsafe or unsound condition to continue operations, or has violated any applicable law, regulation, rule, order or condition imposed by the FDIC. Management is not aware of any practice, condition or violation that might lead to the termination of the Bank’s deposit insurance.
Depositor Preference. FDIA provides that, in the event of the “liquidation or other resolution” of an insured depository institution, the claims of depositors of the institution, including the claims of the FDIC as subrogee of insured depositors, and certain claims for administrative expenses of the FDIC as a receiver, will have priority over other general unsecured claims against the institution. If an insured depository institution fails, insured and uninsured depositors, along with the FDIC, will have priority in payment ahead of unsecured, non-deposit creditors, including the parent bank holding company, with respect to any extensions of credit they have made to such insured depository institution.
Federal Home Loan Bank System. The Bank is a member of the FHLBB, which is one of the regional Federal Home Loan Banks comprising the Federal Home Loan Bank System. Each Federal Home Loan Bank serves as a central credit facility primarily for its member institutions. The Bank, as a member of the FHLBB, is required to acquire and hold shares of capital stock in the FHLBB. While the required percentages of stock ownership are subject to change by the FHLBB, the Bank was in compliance with this requirement with an investment in FHLBB stock at December 31, 2014 of $14.7 million. Any advances from a Federal Home Loan Bank must be secured by specified types of collateral, and all long-term advances may be obtained only for the purpose of providing funds for residential housing finance. If there are any developments that cause the value of our stock investment in the FHLBB to become impaired, we would be required to write down the value of our investment, which in turn could affect our net income and shareholders’ equity.
Federal Reserve System. Federal Reserve Board regulations require depository institutions to maintain reserves against their transaction accounts (primarily interest-bearing and regular checking accounts). The Bank’s required reserves can be in the form of vault cash and, if vault cash does not fully satisfy the required reserves, in the form of a balance maintained with the Federal Reserve Bank of Boston. The Federal Reserve Board regulations currently require that reserves be maintained against aggregate transaction accounts except for transaction accounts up to $13.3 million, which are exempt. Transaction accounts greater than $14.5 million up to $103.06 million have a reserve requirement of 3%, and those greater than $103.06 million have a reserve requirement of $2.67 million plus 10% of the amount over $103.06 million. The Federal Reserve Board generally makes annual adjustments to the tiered reserves. The Bank is in compliance with these requirements.
Prohibitions Against Tying Arrangements. Federal savings associations are subject to prohibitions on certain tying arrangements. A savings association is prohibited, subject to some exceptions, from extending credit or offering any other service, or fixing or varying the consideration for such extension of credit or service, on the condition that the customer obtain some additional service from the institution or its affiliates or not obtain credit or services from a competitor of the institution.
Financial Privacy Laws. Federal law and certain state laws currently contain client privacy protection provisions. These provisions limit the ability of insured depository institutions and other financial institutions to disclose non-public information about consumers to affiliated companies and non-affiliated third parties. These rules require disclosure of privacy policies to clients and, in some circumstance, allow consumers to prevent disclosure of certain personal information to affiliates or non-affiliated third parties by means of “opt out” or “opt in” authorizations. Pursuant to the Gramm-Leach-Bliley Act and certain state laws companies are required to notify clients of security breaches resulting in unauthorized access to their personal information.
USA PATRIOT Act. Under Title III of the USA PATRIOT Act, all financial institutions are required to take certain measures to identify their customers, prevent money laundering, monitor customer transactions and report suspicious activity to U.S. law enforcement agencies. Financial institutions also are required to respond to requests for information from federal banking agencies and law enforcement agencies. Information sharing among financial institutions for the above purposes is encouraged by an exemption granted to complying financial institutions from the privacy provisions of Gramm Leach Bliley Act and other privacy laws. Financial institutions are required to have anti-money laundering programs in place, which include, among other things, performing risk assessments and customer due diligence. The primary federal banking agencies and the Secretary of the Treasury have adopted regulations to implement several of these provisions. Financial institutions also are required to establish internal anti-money laundering programs. The effectiveness of institutions in combating money laundering activities is a factor to be considered in any application submitted by an insured depository institution under the Bank Merger Act. Westfield Financial and the Bank have in place a Bank Secrecy Act and USA PATRIOT Act compliance program and engage in limited transactions with foreign financial institutions or foreign persons.
| 24 |
Office of Foreign Assets Control Regulation. The United States has imposed economic sanctions that affect transactions with designated foreign countries, nationals and others. These are typically known as the “OFAC” rules based on their administration by the Office of Foreign Assets Control, which is an office within the U.S. Department of Treasury (“OFAC”). The OFAC-administered sanctions targeting countries take many different forms. Generally, the sanctions contain one or more of the following elements: i) restrictions on trade with or investment in a sanctioned country, including prohibitions against direct or indirect imports from and exports to a sanctioned country and prohibitions on “U.S. persons” engaging in financial transactions relating to making investments in, or providing investment-related advice or assistance to, a sanctioned country; and ii) a blocking of assets in which the government or specially designated nationals of the sanctioned country have an interest, by prohibiting transfers of property subject to U.S. jurisdiction (including property in the possession or control of U.S. persons). Blocked assets (e.g., property and bank deposits) cannot be paid out, withdrawn, set off or transferred in any manner without a license from OFAC. Failure to comply with these sanctions could have serious legal and reputational consequences.
Incentive Compensation. The Dodd-Frank Act requires publicly traded companies to give stockholders a non-binding vote on executive compensation at their first annual meeting taking place six months after the date of enactment and at least every three years thereafter and on so-called “golden parachute” payments in connection with approvals of mergers and acquisitions. The legislation also authorizes the SEC to promulgate rules that would allow stockholders to nominate their own candidates using a company’s proxy materials. Additionally, the Dodd-Frank Act directs the federal banking regulators to promulgate rules requiring the reporting of incentive-based compensation and prohibiting excessive incentive-based compensation paid to executives of depository institutions and their holding companies with assets in excess of $1.0 billion, regardless of whether the company is publicly traded or not. In April 2011, the Federal Reserve Board, along with other federal banking agencies, issued a joint notice of proposed rulemaking implementing those requirements. The Dodd-Frank Act gives the SEC authority to prohibit broker discretionary voting on elections of directors, executive compensation matters and any other significant matter. At the 2012 Annual Meeting of Shareholders, Westfield Financial’s shareholders voted on a non-binding, advisory basis to hold a non-binding, advisory vote on the compensation of named executive officers of Westfield Financial annually. In light of the results, the Board of Directors determined to hold the vote annually.
Other Legislative Initiatives. From time to time, various legislative and regulatory initiatives are introduced in Congress and state legislatures, as well as by regulatory agencies. Such initiatives may include proposals to expand or contract the powers of bank and savings and loan holding companies and/or insured depository institutions or proposals to substantially change the financial institution regulatory system. Such legislation could change banking statutes and the operating environment of Westfield Financial in substantial and unpredictable ways. If enacted, such legislation could increase or decrease the cost of doing business, limit or expand permissible activities or affect the competitive balance among banks, savings associations, credit unions, and other financial institutions. Westfield Financial cannot predict whether any such legislation will be enacted, and, if enacted, the effect that it or any implementing regulations would have on the financial condition or results of operations of Westfield Financial. A change in statutes, regulations or regulatory policies applicable to Westfield Financial or any of its subsidiaries could have a material effect on the business of Westfield Financial.
Available Information
We maintain a website at www.westfieldbank.com. The website contains information about us and our operations. Through a link to the Investor Relations section of our website, copies of each of our filings with the SEC, including our Annual Report on Form 10-K, Quarterly Reports Form 10-Q and Current Reports on Form 8-K and all amendments to those reports, can be viewed and downloaded free of charge as soon as reasonably practicable after the reports and amendments are electronically filed with or furnished to the SEC. In addition, copies of any document we file with or furnish to the SEC may be obtained from the SEC at its public reference room at 100 F Street, N.E., Washington, D.C. 20549. You may obtain information on the operation of the SEC’s public reference room by calling the SEC at 1-800-SEC-0330. You can request copies of these documents, upon payment of a duplicating fee, by writing to the SEC at its principal office at 100 F Street, N.E., Washington, D.C. 20549. The SEC maintains a website at www.sec.gov that contains reports, proxy and information statements, and other information regarding issuers that file or furnish such information electronically with the SEC. The information found on our website or the website of the SEC is not incorporated by reference into this Annual Report on Form 10-K or any other report we file with or furnish to the SEC.
| 25 |
| ITEM 1A. | RISK FACTORS |
Our loan portfolio includes loans with a higher risk of loss. We originate commercial and industrial loans, commercial real estate loans, consumer loans, and residential mortgage loans primarily within our market area. We have developed and implemented a lending strategy that focuses on residential real estate lending as well as servicing commercial customers, including increased emphasis on commercial and industrial lending and commercial deposit relationships. Commercial and industrial loans, commercial real estate loans, and consumer loans may expose a lender to greater credit risk than loans secured by residential real estate because the collateral securing these loans may not be sold as easily as residential real estate. In addition, commercial real estate and commercial and industrial loans may also involve relatively large loan balances to individual borrowers or groups of borrowers. These loans also have greater credit risk than residential real estate for the following reasons:
| • | Commercial Real Estate Loans. Repayment is dependent on income being generated in amounts sufficient to cover operating expenses and debt service. |
| • | Commercial and Industrial Loans. Repayment is generally dependent upon the successful operation of the borrower’s business. |
| • | Consumer Loans. Consumer loans are collateralized, if at all, with assets that may not provide an adequate source of payment of the loan due to depreciation, damage or loss. |
Any downturn in the real estate market or local economy could adversely affect the value of the properties securing the loans or revenues from the borrower’s business thereby increasing the risk of non-performing loans.
If our allowance for loan losses is not sufficient to cover actual loan losses, our earnings could decrease. Our loan customers may not repay their loans according to their terms and the collateral securing the payment of these loans may be insufficient to pay any remaining loan balance. We therefore may experience significant loan losses, which could have a material adverse effect on our operating results. Material additions to our allowance for loan losses also would materially decrease our net income, and the charge-off of loans may cause us to increase the allowance. We make various assumptions and judgments about the collectability of our loan portfolio, including the creditworthiness of our borrowers and the value of the real estate and other assets serving as collateral for the repayment of many of our loans. We rely on our loan quality reviews, our experience and our evaluation of economic conditions, among other factors, in determining the amount of the allowance for loan losses. If our assumptions prove to be incorrect, our allowance for loan losses may not be sufficient to cover losses inherent in our loan portfolio, resulting in additions to our allowance.
If a significant portion of any future unrealized losses in our portfolio of investment securities were to become other than temporarily impaired with credit losses, we would recognize a material charge to our earnings, and our capital ratios would be adversely impacted. As of December 31, 2014, the fair value of our securities portfolio was approximately $493.4 million. Factors beyond our control can significantly influence the fair value of securities in our portfolio and can cause potential adverse changes to the fair value of those securities. These factors include, but are not limited to, changes in interest rates, rating agency downgrades of the securities, defaults by the issuer or individual mortgagors with respect to the underlying securities, and instability in the credit markets. Any of the foregoing factors could cause an other-than-temporary impairment (“OTTI”) in future periods and result in realized losses.
We analyze our investment securities quarterly to determine whether, in the opinion of management, any of the securities have OTTI. To the extent that any portion of the unrealized losses in our portfolio of investment securities is determined to have OTTI and is credit loss related, we will recognize a charge to our earnings in the quarter during which such determination is made, and our capital ratios will be adversely impacted. Generally, a fixed income security is determined to have OTTI when it appears unlikely that we will receive all of the principal and interest due in accordance with the original terms of the investment. In addition to credit losses, losses are recognized for a security having an unrealized loss if the Company has the intent to sell the security or if it is more likely than not that the Company will be required to sell the security before collection of the principal amount.
| 26 |
If dividends are not paid on our investment in the FHLBB, or if our investment is classified as other-than-temporarily impaired, our earnings and/or shareholders’ equity could decrease. We own common stock of the FHLBB to qualify for membership in the Federal Home Loan Bank System and to be eligible to borrow funds under the FHLBB’s advance program. There is no market for our FHLBB common stock. There can be no assurance that such dividends will be declared in the future. Further, there can be no assurance that the impact of recent or future legislation on the Federal Home Loan Banks also will not cause a decrease in the value of the FHLBB stock held by us.
It is possible that the capitalization of a Federal Home Loan Bank, including the FHLBB, could be substantially diminished or reduced to zero. Consequently, we believe that there is a risk that our investment in FHLBB common stock could be deemed other-than-temporarily impaired at some time in the future, and if this occurs, it would cause our earnings and shareholders’ equity to decrease by the after-tax amount of the impairment charge.
Changes in interest rates could adversely affect our results of operations and financial condition. Our profitability, like that of most financial institutions, depends substantially on our net interest income, which is the difference between the interest income earned on our interest-earning assets and the interest expense paid on our interest-bearing liabilities. Increases in interest rates may decrease loan demand and make it more difficult for borrowers to repay adjustable rate loans. In addition, as market interest rates rise, we will have competitive pressures to increase the rates we pay on deposits, which will result in a decrease of our net interest income.
We also are subject to reinvestment risk associated with changes in interest rates. Changes in interest rates may affect the average life of loans and mortgage-related securities. Decreases in interest rates can result in increased prepayments of loans and mortgage-related securities as borrowers refinance to reduce borrowing costs. Under these circumstances, we are subject to reinvestment risk to the extent that we are unable to reinvest the cash received from such prepayments at rates that are comparable to the rates on existing loans and securities.
Changes in the national and local economy may affect our future growth possibilities. Our current market area is principally located in Hampden County, Massachusetts. Our future growth opportunities depend on the growth and stability of our regional economy and our ability to expand our market area. The continued downturn in our local economy may limit funds available for deposit and may negatively affect our borrowers’ ability to repay their loans on a timely basis, both of which could have an impact on our profitability.
Dramatic declines in the housing market, with decreasing home prices and increasing delinquencies and foreclosures, have negatively impacted the credit performance of mortgage loans and resulted in significant write-downs of assets by many financial institutions. In addition, the values of real estate collateral supporting many loans have declined and may continue to decline. The ongoing economic recession, reduced availability of commercial credit and increasing unemployment have negatively impacted the credit performance of commercial and consumer credit, resulting in additional write-downs. Concerns over the stability of the financial markets and the economy have resulted in decreased lending by financial institutions to their customers and to each other. This market turmoil and tightening of credit has led to increased commercial and consumer delinquencies, lack of customer confidence, increased market volatility and widespread reduction in general business activity. We do not believe these difficult conditions are likely to improve in the near future. A worsening of these conditions would likely exacerbate the adverse effects of these difficult market and economic conditions on us, our customers and the other financial institutions in our market. As a result, we may experience increases in foreclosures, delinquencies and customer bankruptcies, as well as more restricted access to funds and decrease in our stock price.
We depend on our executive officers and key personnel to continue the implementation of our long-term business strategy and could be harmed by the loss of their services. We believe that our continued growth and future success will depend in large part upon the skills of our management team. The competition for qualified personnel in the financial services industry is intense, and the loss of our key personnel or an inability to continue to attract, retain and motivate key personnel could adversely affect our business. We cannot assure you that we will be able to retain our existing key personnel or attract additional qualified personnel. We have employment agreements with our Chief Executive Officer, Chief Financial Officer, and Executive Vice President and General Counsel and change of control agreements with several other senior executive officers, and the loss of the services of one or more of our executive officers and key personnel could impair our ability to continue to develop our business strategy.
| 27 |
Competition in our primary market area may reduce our ability to attract and retain deposits and originate loans. We operate in a competitive market for both attracting deposits, which is our primary source of funds, and originating loans. Historically, our most direct competition for deposits has come from savings and commercial banks. Our competition for loans comes principally from commercial banks, savings institutions, mortgage banking firms, credit unions, finance companies, mutual funds, insurance companies and brokerage and investment banking firms. We also face additional competition from internet-based institutions, brokerage firms and insurance companies. Competition for loan originations and deposits may limit our future growth and earnings prospects.
We operate in a highly regulated environment, and changes in laws and regulations to which we are subject may adversely affect our results of operations. The Bank is subject to extensive regulation, supervision and examination by the OCC, as its chartering authority, and by the FDIC as the insurer of its deposits up to certain limits. In addition, the Federal Reserve Board regulates and oversees Westfield Financial. We also belong to the Federal Home Loan Bank System and, as a member of such system, we are subject to certain limited regulations promulgated by the FHLBB. This regulation and supervision limits the activities in which we may engage. The purpose of regulation and supervision is primarily to protect our depositors and borrowers and, in the case of FDIC regulation, the FDIC’s insurance fund. Regulatory authorities have extensive discretion in the exercise of their supervisory and enforcement powers. They may, among other things, impose restrictions on the operation of a banking institution, the classification of assets by such institution and such institution’s allowance for loan losses. Regulatory and law enforcement authorities also have wide discretion and extensive enforcement powers under various consumer protection and civil rights laws, including the Truth-in-Lending Act, the Equal Credit Opportunity Act, the Fair Housing Act, and the Real Estate Settlement Procedures Act.
The Dodd-Frank Act created the CFBP as an independent bureau of the Federal Reserve System, which began operations on July 21, 2011. The Bureau has broad authority to write regulations regarding consumer financial products and services, and certain examination and enforcement powers. We will have to devote resources to evaluating any regulations proposed by the Bureau and to complying with any such regulations after they are finalized.
In addition, financial institutions could continue to be the subject of further significant legislation or regulation in the future, none of which is within our control. These changes as well as any future change in the laws or regulations applicable to us, or in banking regulators’ supervisory policies or examination procedures, whether by the OCC, the Federal Reserve Board, the CFBP, the FDIC, other state or federal regulators, or the United States Congress could have a material adverse effect on our business, financial condition, results of operations and cash flows. In addition, the cost and burden of compliance, over time, could significantly increase and adversely affect our ability to operate profitably.
Compliance with the Dodd-Frank Act will alter the regulatory regime to which we are subject, and may increase our costs of operations and adversely impact our business. The Dodd-Frank Act represents a significant overhaul of many aspects of the regulation of the financial-services industry. Among other things, the Dodd-Frank Act creates the CFBP, tightens capital standards, imposes clearing and margining requirements on many derivatives activities, and generally increases oversight and regulation of financial institutions and financial activities.
In addition to the self-implementing provisions of the statute, the Dodd-Frank Act calls for over 200 administrative rulemakings by various federal agencies to implement various parts of the legislation. While many rules have been finalized and/or issued in proposed form, some have yet to be proposed. It is impossible to predict when all such additional rules will be issued or finalized, and what the content of such rules will be. We will have to apply resources to ensure that we are in compliance with all applicable provisions of the Dodd-Frank Act and any implementing rules, which may increase our costs of operations and adversely impact our earnings.
The Dodd-Frank Act and any implementing rules that are ultimately issued could have adverse implications on the financial industry, the competitive environment, and our ability to conduct business.
We may be subject to more stringent capital requirements. The Bank and Westfield Financial are each subject to capital adequacy guidelines and other regulatory requirements specifying minimum amounts and types of capital which each of the Bank and Westfield Financial must maintain. From time to time, the regulators implement changes to these regulatory capital adequacy guidelines. If we fail to meet these minimum capital guidelines and other regulatory requirements, our financial condition would be materially and adversely affected. In light of proposed changes to regulatory capital requirements contained in the Dodd-Frank Act and the regulatory accords on international banking institutions formulated by the Basel Committee and implemented by the Federal Reserve and the OCC, we may be required to satisfy additional, more stringent, capital adequacy standards. The ultimate impact of the new capital and liquidity standards on us cannot be determined at this time and will depend on a number of factors, including the treatment and implementation by the U.S. banking regulators. These requirements, however, and any other new regulations, could adversely affect our ability to pay dividends, or could require us to reduce business levels or to raise capital, including in ways that may adversely affect our financial condition or results of operations.
| 28 |
| ITEM 1B. | UNRESOLVED STAFF COMMENTS |
| None. |
| ITEM 2. | PROPERTIES |
We currently conduct our business through our 13 banking offices and 12 off-site ATMs. The following table sets forth certain information regarding our properties as of December 31, 2014. As of this date, the properties and leasehold improvements owned by us had an aggregate net book value of $11.7 million. We believe that our existing facilities are sufficient for our current needs.
| Location | Ownership | Year Opened | Year of Lease or License Expiration |
| Main Office: | |||
| 141 Elm St., Westfield, MA | Owned | 1964 | N/A |
| Loan Center: | |||
| 136 Elm St., Westfield, MA | Leased | 2011 | 2016 |
| Commercial Lending & Middle Market: | |||
| 1500 Main St., Springfield, MA | Leased | 2014 | 2019 |
| Branch Offices: | |||
| 206 Park St., West Springfield, MA | Owned | 1957 | N/A |
| 655 Main St., Agawam, MA | Owned | 1968 | N/A |
| 26 Arnold St., Westfield, MA | Owned | 1976 | N/A |
| 300 Southampton Rd., Westfield, MA | Owned | 1987 | N/A |
| 462 College Highway, Southwick, MA | Owned | 1990 | N/A |
| 382 North Main St., E. Longmeadow, MA | Leased | 1997 | 2017 |
| 1500 Main St., Springfield, MA | Leased | 2006 | 2016 |
| 1642 Northampton St., Holyoke, MA | Owned | 2001 | N/A |
| 560 East Main St., Westfield, MA | Leased | 2007 | 2015 |
| 237 South Westfield St., Feeding Hills, MA | Leased | 2009 | 2038 |
| 10 Hartford Avenue, Granby, CT | Leased | 2013 | 2018 |
| 47 Palomba Drive, Enfield, CT | Leased | 2014 | 2024 |
| 29 |
| ATMs: | |||
| 98 Lower Westfield Road, Holyoke, MA | Leased | 2010 | 2020 |
| 516 Carew St., Springfield, MA | Tenant at will | 2002 | N/A |
| 1000 State St., Springfield, MA | Tenant at will | 2003 | N/A |
| 214 College Highway, Southwick, MA | Leased | 2010 | 2016 |
| 1342 Liberty St., Springfield, MA | Owned | 2001 | N/A |
| 788 Memorial Ave., West Springfield, MA | Leased | 2006 | 2016 |
| 2620 Westfield St., West Springfield, MA | Leased | 2006 | 2020 |
| 98 Southwick Rd., Westfield, MA | Leased | 2006 | 2021 |
| 115 West Silver St., Westfield, MA | Tenant at will | 2005 | N/A |
| Westfield State University | |||
| 577 Western Avenue, Westfield, MA | |||
| Woodward Center | Leased | 2010 | 2015 |
| Wilson Hall | Leased | 2010 | 2015 |
| Ely Hall | Leased | 2010 | 2015 |
| ITEM 3. | LEGAL PROCEEDINGS |
We are not involved in any pending legal proceeding other than routine legal proceedings occurring in the ordinary course of business. In the opinion of management, no legal proceedings will have a material effect on our consolidated financial position or results of operations.
| ITEM 4. | MINE SAFETY DISCLOSURES |
| nONE. |
| 30 |
| ITEM 5. | MARKET FOR REGISTRANT’S COMMON EQUITY, RELATED SHAREHOLDER MATTERS AND ISSUER PURCHASES OF EQUITY SECURITIES |
Market Information
Our common stock is currently listed on The NASDAQ Stock Market under the symbol “WFD.” Prior to August 21, 2007, we were listed on the American Stock Exchange. At December 31, 2014, there were 18,734,791 shares of common stock issued and outstanding, and there were approximately 2,114 shareholders of record.
The table below shows the high and low sales prices during the periods indicated as well as dividends declared per share.
| Price Per Share | Cash Dividends Declared | |||||||||||||
| 2014 | High ($) | Low ($) | ($) | |||||||||||
| Fourth Quarter ended December 31, 2014 | 7.55 | 6.88 | 0.03 | |||||||||||
| Third Quarter ended September 30, 2014 | 7.68 | 7.00 | 0.06 | |||||||||||
| Second Quarter ended June 30, 2014 | 7.58 | 6.85 | 0.06 | |||||||||||
| First Quarter ended March 31, 2014 | 8.00 | 7.10 | 0.06 | |||||||||||
| Price Per Share | Cash Dividends Declared | |||||||||||||
| 2013 | High ($) | Low ($) | ($) | |||||||||||
| Fourth Quarter ended December 31, 2013 | 7.55 | 6.94 | 0.06 | |||||||||||
| Third Quarter ended September 30, 2013 | 7.50 | 6.50 | 0.06 | |||||||||||
| Second Quarter ended June 30, 2013 | 8.07 | 6.91 | 0.11 | * | ||||||||||
| First Quarter ended March 31, 2013 | 7.94 | 7.05 | 0.06 | |||||||||||
*Includes a special cash dividend of $0.05 in addition to the regular quarterly cash dividend.
Dividend Policy
The continued payment of dividends depends upon our debt and equity structure, earnings, financial condition, need for capital in connection with possible future acquisitions and other factors, including economic conditions, regulatory restrictions and tax considerations. We cannot guarantee the payment of dividends or that, if paid, that dividends will not be reduced or eliminated in the future.
The only funds available for the payment of dividends on our capital stock will be cash and cash equivalents held by us, dividends paid by to us by the Bank, and borrowings. The Bank will be prohibited from paying cash dividends to us to the extent that any such payment would reduce the Bank’s capital below required capital levels or would impair the liquidation account to be established for the benefit of the Bank’s eligible account holders and supplemental eligible account holders at the time of the reorganization and stock offering.
| 31 |
Recent Sales of Unregistered Securities
There were no sales by us of unregistered securities during the year ended December 31, 2014.
Purchases of Equity Securities by the Issuer and Affiliated Purchasers
The following table sets forth information with respect to purchases made by us of our common stock during the three months ended December 31, 2014.
| Period | Total Number of Shares Purchased | Average Price Paid per Share ($) | Total Number of Shares Purchased as Part of Publicly Announced Programs | Maximum Number of Shares that May Yet Be Purchased Under the Program | ||||||||||||||||||
| October 1 - 31, 2014 | 33,368 | (2 | ) | 7.06 | 32,293 | 1,053,716 | (1) | |||||||||||||||
| November 1 - 30, 2014 | 4,262 | 7.05 | 4,262 | 1,049,454 | ||||||||||||||||||
| December 1 - 31, 2014 | 50,303 | (3 | ) | 7.27 | 49,994 | 999,460 | ||||||||||||||||
| Total | 87,933 | 7.18 | 86,549 | 999,460 | ||||||||||||||||||
| (1) | On March 13, 2014, the Board of Directors announced a repurchase program under which the Company may purchase up to 1,970,000 shares, or 10% of its outstanding common stock, to be affected via a combination of Rule 10b5-1 plans and discretionary share repurchases. This plan began in April and as of December 31, 2014, there were 999,460 shares remaining to be purchased under the new repurchase program. |
| (2) | Number includes repurchase of 1,075 shares from certain executives as payment of their tax obligations for shares of restricted stock that vested on October 20, 2014, under our 2007 Recognition and Retention Plan. These repurchases were reported by each reporting person on October 23, 2014. |
| (3) | Number includes open-market repurchase of 49,994 shares with an average price of $7.27 and 309 shares with an average price of $7.46. These shares were repurchased for forfeited ESOP shares to offset our ESOP annual contribution. |
| 32 |
Performance Graph
The following graph compares our total cumulative shareholder return by an investor who invested $100.00 on December 31, 2009 to December 31, 2014, to the total return by an investor who invested $100.00 in each of the Russell 2000 Index and the NASDAQ Bank Index for the same period.
COMPARISON OF 5 YEAR CUMULATIVE TOTAL RETURN
Among Westfield Financial, Inc., The Russell 2000 Index and the
NASDAQ Bank Index
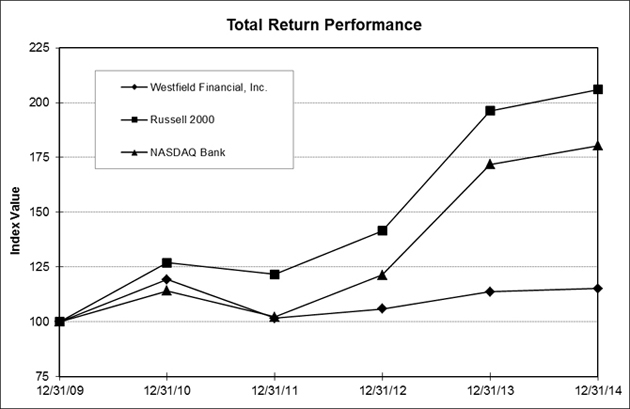
| Period Ending | ||||||
| Index | 12/31/09 | 12/31/10 | 12/31/11 | 12/31/12 | 12/31/13 | 12/31/14 |
| Westfield Financial, Inc. | 100.00 | 119.24 | 101.62 | 105.91 | 113.70 | 115.17 |
| Russell 2000 | 100.00 | 126.86 | 121.56 | 141.43 | 196.34 | 205.95 |
| NASDAQ Bank | 100.00 | 114.16 | 102.17 | 121.26 | 171.86 | 180.31 |
| 33 |
| ITEM 6. | SELECTED FINANCIAL DATA |
The summary information presented below at or for each of the years presented is derived in part from our consolidated financial statements. The following information is only a summary, and you should read it in conjunction with our consolidated financial statements and notes beginning on page F-1.
| At December 31, | ||||||||||||||||||||
| 2014 | 2013 | 2012 | 2011 | 2010 | ||||||||||||||||
| (In thousands) | ||||||||||||||||||||
| Selected Financial Condition Data: | ||||||||||||||||||||
| Total assets | $ | 1,320,096 | $ | 1,276,841 | $ | 1,301,462 | $ | 1,263,264 | $ | 1,239,489 | ||||||||||
| Loans, net (1) | 716,738 | 629,968 | 587,124 | 546,392 | 502,392 | |||||||||||||||
| Securities available for sale | 215,750 | 243,204 | 621,507 | 617,537 | 642,467 | |||||||||||||||
| Securities held to maturity (2) | 278,080 | 295,013 | — | — | — | |||||||||||||||
| Deposits | 834,218 | 817,112 | 753,413 | 732,958 | 700,335 | |||||||||||||||
| Short-term borrowings | 93,997 | 48,197 | 69,934 | 52,985 | 62,937 | |||||||||||||||
| Long-term debt | 232,479 | 248,377 | 278,861 | 247,320 | 238,151 | |||||||||||||||
| Total shareholders’ equity | 142,543 | 154,144 | 189,187 | 218,988 | 221,245 | |||||||||||||||
| Allowance for loan losses | 7,948 | 7,459 | 7,794 | 7,764 | 6,934 | |||||||||||||||
| Nonperforming loans | 8,830 | 2,586 | 3,009 | 2,933 | 3,204 | |||||||||||||||
| For the Years Ended December 31, | ||||||||||||||||||||
| 2014 | 2013 | 2012 | 2011 | 2010 | ||||||||||||||||
| (In thousands, except per share data) | ||||||||||||||||||||
| Selected Operating Data: | ||||||||||||||||||||
| Interest and dividend income | $ | 40,991 | $ | 41,031 | $ | 43,104 | $ | 45,005 | $ | 46,147 | ||||||||||
| Interest expense | 9,923 | 10,290 | 12,663 | 14,467 | 16,765 | |||||||||||||||
| Net interest and dividend income | 31,068 | 30,741 | 30,441 | 30,538 | 29,382 | |||||||||||||||
| Provision for loan losses | 1,575 | (256 | ) | 698 | 1,206 | 8,923 | ||||||||||||||
| Net interest and dividend income after provision for loan losses | 29,493 | 30,997 | 29,743 | 29,332 | 20,459 | |||||||||||||||
| Total noninterest income | 4,460 | 4,272 | 5,990 | 3,806 | 7,390 | |||||||||||||||
| Total noninterest expense | 25,909 | 26,642 | 27,223 | 25,958 | 24,809 | |||||||||||||||
| Income before income taxes | 8,044 | 8,627 | 8,510 | 7,180 | 3,040 | |||||||||||||||
| Income taxes | 1,882 | 1,871 | 2,256 | 1,306 | 34 | |||||||||||||||
| Net income | $ | 6,162 | $ | 6,756 | $ | 6,254 | $ | 5,874 | $ | 3,006 | ||||||||||
| Basic earnings per share | $ | 0.34 | $ | 0.34 | $ | 0.26 | $ | 0.22 | $ | 0.11 | ||||||||||
| Diluted earnings per share | $ | 0.34 | $ | 0.34 | $ | 0.26 | $ | 0.22 | $ | 0.11 | ||||||||||
| Dividends per share paid | $ | 0.21 | $ | 0.29 | $ | 0.44 | $ | 0.54 | $ | 0.52 | ||||||||||
| (1) | Loans are shown net of deferred loan fees and costs, unearned premiums, allowance for loan losses and unadvanced loan funds. |
| (2) | During 2013, securities with an amortized cost of $304.9 million were reclassified from available-for-sale to held-to-maturity. |
| 34 |
| At or for the Years Ended December 31, | ||||||||||||||||||||
| 2014 | 2013 | 2012 | 2011 | 2010 | ||||||||||||||||
| Selected Financial Ratios and | ||||||||||||||||||||
| Other Data(1) | ||||||||||||||||||||
| Performance Ratios: | ||||||||||||||||||||
| Return on average assets | 0.48 | % | 0.53 | % | 0.48 | % | 0.47 | % | 0.25 | % | ||||||||||
| Return on average equity | 4.18 | 4.04 | 2.97 | 2.65 | 1.25 | |||||||||||||||
| Average equity to average assets | 11.42 | 13.02 | 16.17 | 17.79 | 19.63 | |||||||||||||||
| Equity to total assets at end of year | 10.80 | 12.07 | 14.54 | 17.34 | 17.85 | |||||||||||||||
| Interest rate spread | 2.42 | 2.39 | 2.24 | 2.34 | 2.22 | |||||||||||||||
| Net interest margin (2) | 2.60 | 2.58 | 2.53 | 2.67 | 2.64 | |||||||||||||||
| Average interest-earning assets to average interest-earning liabilities | 121.90 | 122.92 | 126.80 | 127.30 | 128.51 | |||||||||||||||
| Total noninterest expense to average assets | 2.01 | 2.07 | 2.09 | 2.08 | 2.03 | |||||||||||||||
| Efficiency ratio (3) | 73.59 | 76.79 | 78.81 | 76.22 | 75.53 | |||||||||||||||
| Dividend payout ratio | 0.62 | 0.85 | 1.69 | 2.45 | 4.73 | |||||||||||||||
| Regulatory Capital Ratios: | ||||||||||||||||||||
| Total risk-based capital | 18.68 | 21.17 | 25.41 | 31.60 | 34.05 | |||||||||||||||
| Tier 1 risk-based capital | 17.73 | 20.21 | 24.33 | 30.46 | 33.03 | |||||||||||||||
| Tier 1 leverage capital | 11.30 | 12.28 | 13.91 | 16.76 | 18.07 | |||||||||||||||
| Asset Quality Ratios: | ||||||||||||||||||||
| Nonperforming loans to total loans | 1.22 | 0.41 | 0.51 | 0.53 | 0.63 | |||||||||||||||
| Nonperforming assets to total assets | 0.67 | 0.20 | 0.31 | 0.32 | 0.28 | |||||||||||||||
| Allowance for loan losses to total loans | 1.10 | 1.17 | 1.31 | 1.40 | 1.36 | |||||||||||||||
| Allowance for loan losses to nonperforming assets | 0.90 | 2.88 | 1.96 | 1.91 | 2.02 | |||||||||||||||
| Number of: | ||||||||||||||||||||
| Banking offices | 13 | 12 | 11 | 11 | 11 | |||||||||||||||
| Full-time equivalent employees | 183 | 191 | 199 | 180 | 180 | |||||||||||||||
| (1) | Asset Quality Ratios and Regulatory Capital Ratios are end of period ratios. |
| (2) | Net interest margin represents tax-equivalent net interest and dividend income as a percentage of average interest earning assets. |
| (3) | The efficiency ratio represents the ratio of operating expenses divided by the sum of net interest and dividend income and noninterest income excluding gain and loss on sale and losses on other-than-temporary impairment of securities and gain or loss on sale of premises and equipment. |
| 35 |
| ITEM 7. | MANAGEMENT’S DISCUSSION AND ANALYSIS OF FINANCIAL CONDITION AND RESULTS OF OPERATIONS |
Overview. We strive to remain a leader in meeting the financial service needs of the local community and to provide quality service to the individuals and businesses in the market areas that we have served since 1853. Historically, we have been a community-oriented provider of traditional banking products and services to business organizations and individuals, including products such as residential and commercial real estate loans, consumer loans and a variety of deposit products. We meet the needs of our local community through a community-based and service-oriented approach to banking.
We have adopted a growth-oriented strategy that has focused on increasing commercial lending while decreasing our securities portfolio. Our strategy also calls for increasing deposit relationships and broadening our product lines and services. We believe that this business strategy is best for our long-term success and viability, and complements our existing commitment to high quality customer service. In connection with our overall growth strategy, we seek to:
| • | grow our commercial and industrial and commercial real estate loan portfolio by targeting businesses in our primary market area and in northern Connecticut as a means to increase the yield on and diversify our loan portfolio and build transactional deposit account relationships; |
| • | focus on expanding our retail banking franchise and increase the number of households served within our market area; and |
| • | to supplement the commercial focus, grow the residential loan portfolio to diversify risk and deepen customer relationships. |
You should read the following financial results for the year ended December 31, 2014 in the context of this strategy.
| • | Net income was $6.2 million, or $0.34 per diluted share, for the year ended December 31, 2014, compared to $6.8 million, or $0.34 per diluted share, for the same period in 2013. The results for the year ended December 31, 2014 showed an increase in the provision for loan losses compared to the same period in 2013; however, this was partially offset by increases in net interest and dividend income and noninterest income and a decrease in noninterest expense. |
| • | We had a provision expense of $1.6 million for the year ended December 31, 2014, compared to a credit of $256,000 for the year ended December 31, 2013. The provision expense for the year ended December 31, 2014 was primarily due to loan growth, while the credit for the year ended December 31, 2013 was the result of continued improvement in the overall risk profile of the commercial loan portfolio. Classified loans that previously carried higher allowances showed considerable improvement, resulting in a lower allowance requirement. The allowance was $7.9 million for December 31, 2014 and $7.5 million for December 31, 2013, or 1.10% and 1.17% of total loans, respectively. |
| • | Net interest and dividend income increased $327,000 to $31.1 million for the year ended December 31, 2014, compared to $30.7 million for the year ended December 31, 2013 primarily due to a $367,000 decrease in interest expense from the comparable 2013 period. Noninterest income increased $188,000 to $4.5 million for the year ended December 31, 2014, compared to $4.3 million for the same period in 2013 primarily due to the collection of $97,000 in prepayment fees on a commercial loan relationship that paid off early during the first quarter of 2014. |
| • | Noninterest expense decreased $733,000 to $25.9 million at December 31, 2014, compared to $26.6 million at December 31, 2013. The decrease in noninterest expense for the year ended December 31, 2014 was primarily due to a decrease in salaries and benefits of $749,000 resulting from a decrease in employee benefits costs and share-based compensation expense. |
| 36 |
General. Our consolidated results of operations depend primarily on net interest and dividend income. Net interest and dividend income is the difference between the interest income earned on interest-earning assets and the interest paid on interest-bearing liabilities. Interest-earning assets consist primarily of commercial real estate loans, commercial and industrial loans, residential real estate loans and securities. Interest-bearing liabilities consist primarily of certificates of deposit and money market account, demand deposit accounts and savings account deposits, borrowings from the FHLBB and securities sold under repurchase agreements. The consolidated results of operations also depend on the provision for loan losses, noninterest income, and noninterest expense. Noninterest expense includes salaries and employee benefits, occupancy expenses and other general and administrative expenses. Noninterest income includes service fees and charges, income on bank-owned life insurance, and gains (losses) on securities.
Critical Accounting Policies. Our accounting policies are disclosed in Note 1 to our consolidated financial statements. Given our current business strategy and asset/liability structure, the more critical policies are the allowance for loan losses and provision for loan losses, accounting for nonperforming loans, the valuation of deferred taxes and other-than-temporary impairment of securities. In addition to the informational disclosure in the notes to the consolidated financial statements, our policy on each of these accounting policies is described in detail in the applicable sections of “Management’s Discussion and Analysis of Financial Condition and Results of Operations.” Senior management has discussed the development and selection of these accounting policies and the related disclosures with the Audit Committee of our Board of Directors.
The process of evaluating the loan portfolio, classifying loans and determining the allowance and provision is described in detail in Part I under “Business – Lending Activities - Allowance for Loan Losses.” Our methodology for assessing the allocation of the allowance consists of two key components, which are a specific allowance for impaired loans and an allowance for the remainder of the portfolio. Measurement of impairment can be based on present value of expected future cash flows discounted at the loan’s effective interest rate, the loan’s observable market price or the fair value of the collateral, if the loan is collateral dependent. This evaluation is inherently subjective as it requires material estimates that may be susceptible to significant change. The allocation of the allowance is also reviewed by management based upon our evaluation of then-existing economic and business conditions affecting our key lending areas and other conditions, such as new loan products, credit quality trends (including trends in nonperforming loans expected to result from existing conditions), collateral values, loan volumes and concentrations, specific industry conditions within portfolio segments that existed as of the balance sheet date and the impact that such conditions were believed to have had on the collectability of the loan portfolio. Although management believes it has established and maintained the allowance for loan losses at adequate levels, if management’s assumptions and judgments prove to be incorrect due to continued deterioration in economic, real estate and other conditions, and the allowance for loan losses is not adequate to absorb inherent losses, our earnings and capital could be significantly and adversely affected.
Our general policy regarding recognition of interest on loans is to discontinue the accrual of interest when principal or interest payments are delinquent 90 days or more, or earlier if the loan is considered impaired. Any unpaid amounts previously accrued on these loans are reversed from income. Subsequent cash receipts are applied to the outstanding principal balance or to interest income if, in the judgment of management, collection of the principal balance is not in question. Loans are returned to accrual status when they become current as to both principal and interest and when subsequent performance reduces the concern as to the collectability of principal and interest. Loan fees and certain direct loan origination costs are deferred, and the net fee or cost is recognized as an adjustment to interest income over the estimated average lives of the related loans.
We must make certain estimates in determining income tax expense for financial statement purposes. These estimates occur in the calculation of the deferred tax assets and liabilities, which arise from the temporary differences between the tax basis and financial statement basis of our assets and liabilities. The carrying value of our net deferred tax asset is based on our historic taxable income for the two prior years as well as our belief that it is more likely than not that we will generate sufficient future taxable income to realize these deferred tax assets. Judgments regarding future taxable income may change due to changes in market conditions, changes in tax laws or other factors which could result in a change in the assessment of the realization of the net deferred tax asset.
| 37 |
On a quarterly basis, we review securities with a decline in fair value below the amortized cost of the investment to determine whether the decline in fair value is temporary or other than temporary. Declines in the fair value of marketable equity securities below their cost that are deemed to be other than temporary based on the severity and duration of the impairment are reflected in earnings as realized losses. In estimating other than temporary impairment losses for securities, impairment is required to be recognized if (1) we intend to sell the security; (2) it is “more likely than not” that we will be required to sell the security before recovery of its amortized cost basis; or (3) for debt securities, the present value of expected cash flows is not sufficient to recover the entire amortized cost basis. For all impaired available for sale securities that we intend to sell, or more likely than not will be required to sell, the full amount of the other than temporary impairment is recognized through earnings. For other impaired debt securities, credit-related other than temporary impairment is recognized through earnings, while non-credit related other than temporary impairment is recognized in other comprehensive income, net of applicable taxes.
Average Balance Sheet and Analysis of Net Interest and Dividend Income
The following table sets forth information relating to our financial condition and net interest and dividend income for the years ended December 31, 2014, 2013 and 2012 and reflects the average yield on assets and average cost of liabilities for the years indicated. The yields and costs were derived by dividing income or expense by the average balance of interest-earning assets or interest-bearing liabilities, respectively, for the years shown. Average balances were derived from actual daily balances over the years indicated. Interest income includes fees earned from making changes in loan rates or terms, and fees earned when commercial real estate loans were prepaid or refinanced.
The interest earned on tax-exempt assets is adjusted to a tax-equivalent basis to recognize the income tax savings which facilitates comparison between taxable and tax-exempt assets.
| 38 |
| For the Years Ended December 31, | ||||||||||||||||||||||||||||||||||||
| 2014 | 2013 | 2012 | ||||||||||||||||||||||||||||||||||
| Average Balance | Interest | Avg Yield/ Cost | Average Balance | Interest | Avg Yield/ Cost | Average Balance | Interest | Avg Yield/ Cost | ||||||||||||||||||||||||||||
| (Dollars in thousands) | ||||||||||||||||||||||||||||||||||||
| ASSETS: | ||||||||||||||||||||||||||||||||||||
| Interest-earning assets | ||||||||||||||||||||||||||||||||||||
| Loans(1)(2) | $ | 683,064 | $ | 27,989 | 4.10 | % | $ | 604,732 | $ | 25,558 | 4.23 | % | $ | 573,642 | $ | 25,762 | 4.49 | % | ||||||||||||||||||
| Securities(2) | 504,532 | 13,299 | 2.64 | 584,029 | 16,027 | 2.74 | 638,467 | 18,110 | 2.84 | |||||||||||||||||||||||||||
| Other investments - at cost | 16,597 | 246 | 1.48 | 17,258 | 93 | 0.54 | 15,287 | 94 | 0.61 | |||||||||||||||||||||||||||
| Short-term investments(3) | 13,749 | 13 | 0.09 | 9,790 | 9 | 0.09 | 11,074 | 8 | 0.07 | |||||||||||||||||||||||||||
| Total interest-earning assets | 1,217,942 | 41,547 | 3.41 | 1,215,809 | 41,687 | 3.43 | 1,238,470 | 43,974 | 3.55 | |||||||||||||||||||||||||||
| Total noninterest-earning assets | 73,334 | 69,753 | 64,629 | |||||||||||||||||||||||||||||||||
| Total assets | $ | 1,291,276 | $ | 1,285,562 | $ | 1,303,099 | ||||||||||||||||||||||||||||||
| LIABILITIES AND EQUITY: | ||||||||||||||||||||||||||||||||||||
| Interest-bearing liabilities | ||||||||||||||||||||||||||||||||||||
| Checking accounts | $ | 40,412 | 99 | 0.24 | $ | 46,982 | 134 | 0.29 | $ | 61,277 | 266 | 0.43 | ||||||||||||||||||||||||
| Savings accounts | 79,086 | 80 | 0.10 | 87,535 | 119 | 0.14 | 95,129 | 186 | 0.20 | |||||||||||||||||||||||||||
| Money market accounts | 221,391 | 846 | 0.38 | 196,265 | 763 | 0.39 | 170,171 | 807 | 0.47 | |||||||||||||||||||||||||||
| Time certificates of deposit | 343,190 | 4,152 | 1.21 | 330,510 | 4,509 | 1.36 | 318,000 | 4,883 | 1.54 | |||||||||||||||||||||||||||
| Total interest-bearing deposits | 684,079 | 5,177 | 661,292 | 5,525 | 644,577 | 6,142 | ||||||||||||||||||||||||||||||
| Short-term borrowings and long-term debt | 315,089 | 4,746 | 1.51 | 327,783 | 4,765 | 1.45 | 332,129 | 6,521 | 1.96 | |||||||||||||||||||||||||||
| Interest-bearing liabilities | 999,168 | 9,923 | 0.99 | 989,075 | 10,290 | 1.04 | 976,706 | 12,663 | 1.30 | |||||||||||||||||||||||||||
| Noninterest-bearing deposits | 132,923 | 118,749 | 104,454 | |||||||||||||||||||||||||||||||||
| Other noninterest-bearing liabilities | 11,692 | 10,373 | 11,179 | |||||||||||||||||||||||||||||||||
| Total noninterest-bearing liabilities | 144,615 | 129,122 | 115,633 | |||||||||||||||||||||||||||||||||
| Total liabilities | 1,143,783 | 1,118,197 | 1,092,339 | |||||||||||||||||||||||||||||||||
| Total equity | 147,493 | 167,365 | 210,760 | |||||||||||||||||||||||||||||||||
| Total liabilities and equity | $ | 1,291,276 | $ | 1,285,562 | $ | 1,303,099 | ||||||||||||||||||||||||||||||
| Less: Tax-equivalent adjustment(2) | (556 | ) | (656 | ) | (870 | ) | ||||||||||||||||||||||||||||||
| Net interest and dividend income | $ | 31,068 | $ | 30,741 | $ | 30,441 | ||||||||||||||||||||||||||||||
| Net interest rate spread(4) | 2.42 | % | 2.39 | % | 2.24 | % | ||||||||||||||||||||||||||||||
| Net interest margin(5) | 2.60 | % | 2.58 | % | 2.53 | % | ||||||||||||||||||||||||||||||
| Average interest-earning assets to average interest-bearing liabilities | 121.90 | 122.92 | 126.80 | |||||||||||||||||||||||||||||||||
| (1) | Loans, including non-accrual loans, are net of deferred loan origination costs, and unadvanced funds and allowance for loan losses. |
| (2) | Securities income, loan income and net interest income are presented on a tax-equivalent basis using a tax rate of 34%. The tax-equivalent adjustment is deducted from tax-equivalent net interest and dividend income to agree to the amount reported in the statements of income. |
| (3) | Short-term investments include federal funds sold. |
| (4) | Net interest rate spread represents the difference between the weighted average yield on interest-earning assets and the weighted average cost of interest-bearing liabilities. |
| (5) | Net interest margin represents tax-equivalent net interest and dividend income as a percentage of average interest-earning assets. |
| 39 |
Rate/Volume Analysis. The following table shows how changes in interest rates and changes in the volume of interest-earning assets and interest-bearing liabilities have affected our interest and dividend income and interest expense during the periods indicated. Information is provided in each category with respect to: (1) interest income changes attributable to changes in volume (changes in volume multiplied by prior rate); (2) interest income changes attributable to changes in rate (changes in rate multiplied by prior volume); and (3) the net change.
The changes attributable to the combined impact of volume and rate have been allocated proportionately to the changes due to volume and the changes due to rate.
| Year Ended December 31, 2014 Compared to Year Ended December 31, 2013 | Year Ended December 31, 2013 Compared to Year Ended December 31, 2012 | |||||||||||||||||||||||
| Increase (Decrease) Due to | Increase (Decrease) Due to | |||||||||||||||||||||||
| Volume | Rate | Net | Volume | Rate | Net | |||||||||||||||||||
| Interest-earning assets | (In thousands) | |||||||||||||||||||||||
| Loans (1) | $ | 3,311 | $ | (880 | ) | $ | 2,431 | $ | 1,393 | $ | (1,597 | ) | $ | (204 | ) | |||||||||
| Securities (1) | (2,182 | ) | (546 | ) | (2,728 | ) | (1,536 | ) | (547 | ) | (2,083 | ) | ||||||||||||
| Other investments - at cost | (4 | ) | 157 | 153 | 12 | (13 | ) | (1 | ) | |||||||||||||||
| Short-term investments | 4 | — | 4 | (1 | ) | 2 | 1 | |||||||||||||||||
| Total interest-earning assets | 1,129 | (1,269 | ) | (140 | ) | (132 | ) | (2,155 | ) | (2,287 | ) | |||||||||||||
| Interest-bearing liabilities | ||||||||||||||||||||||||
| Checking accounts | (19 | ) | (16 | ) | (35 | ) | (62 | ) | (70 | ) | (132 | ) | ||||||||||||
| Savings accounts | (11 | ) | (28 | ) | (39 | ) | (13 | ) | (54 | ) | (67 | ) | ||||||||||||
| Money market accounts | 98 | (15 | ) | 83 | 119 | (163 | ) | (44 | ) | |||||||||||||||
| Time deposits | 173 | (530 | ) | (357 | ) | 200 | (574 | ) | (374 | ) | ||||||||||||||
| Short-term borrowing and long-time debt | (185 | ) | 166 | (19 | ) | (90 | ) | (1,666 | ) | (1,756 | ) | |||||||||||||
| Total interest-bearing liabilities | 56 | (423 | ) | (367 | ) | 154 | (2,527 | ) | (2,373 | ) | ||||||||||||||
| Change in net interest and dividend income | $ | 1,073 | $ | (846 | ) | $ | 227 | $ | (286 | ) | $ | 372 | $ | 86 | ||||||||||
______________________
| (1) | Securities and loan income and net interest income are presented on a tax-equivalent basis using a tax rate of 34%. The tax-equivalent adjustment is deducted from tax-equivalent net interest income to agree to the amount reported in the statements of income. |
| 40 |
Comparison of Financial Condition at December 31, 2014 and December 31, 2013
Total assets increased $43.3 million to $1.3 billion at December 31, 2014. Net loans increased by $86.7 million to $716.7 million at December 31, 2014 from $630.0 million at December 31, 2013. The increase in loans was partially offset by a $45.0 million decrease in the securities portfolio to $508.8 million at December 31, 2014.
Net loans increased by $86.7 million to $716.7 million at December 31, 2014 from $630.0 million at December 31, 2013. The increase in net loans was primarily the result of increases in residential real estate loans, commercial and industrial loans and commercial real estate loans. Residential real estate loans increased $43.6 million to $277.7 million at December 31, 2014 from $234.1 million at December 31, 2013. We purchased $35.3 million in residential loans from a New England-based bank as a means of supplementing our loan growth. In addition, through our long standing relationship with a third-party mortgage company, we purchased a total of $18.0 million in residential loans within and contiguous to our market area.
Commercial and industrial loans increased $30.1 million to $165.7 million at December 31, 2014 from $135.6 million at December 31, 2013. The growth in commercial and industrial loans was the result of new loan originations and customers increasing balances on their lines of credit, which were both partially offset by normal loan payments and payoffs.
Commercial real estate loans increased $14.0 million to $278.4 million at December 31, 2014 from $264.4 million at December 31, 2013. Non-owner occupied commercial real estate loans totaled $169.1 million at December 31, 2014 and $151.9 million at December 31, 2013, while owner occupied commercial real estate loans totaled $109.3 million at December 31, 2014 and $112.5 million at December 31, 2013. The growth in commercial real estate loans was due to executing on our strategy of increasing loan originations.
Securities decreased $45.0 million to $508.8 million at December 31, 2014 from $553.8 million at December 31, 2013. The securities portfolio is primarily comprised of mortgage-backed securities, which totaled $343.4 million at December 31, 2014 and $395.4 million at December 31, 2013, the majority of which were issued by government-sponsored enterprises such as the Federal National Mortgage Association. There were no privately issued mortgage-backed securities in the portfolio at December 31, 2014 and 2013.
Debt securities issued by government-sponsored enterprises were $67.5 million at December 31, 2014 and $54.1 million at December 31, 2013. Securities issued by government-sponsored enterprises include bonds issued by the Federal National Mortgage Association and the Federal Home Loan Mortgage Corporation. Corporate bonds totaled $51.0 million and $55.0 million at December 31, 2014 and 2013, respectively. We began investing in investment-grade corporate bonds during the second quarter of 2012 as a means of diversifying our securities portfolio while also increasing the average yield on the portfolio. We also invest in municipal bonds primarily issued by cities and towns in Massachusetts that are rated as investment grade by Moody’s, Standard & Poor’s or Fitch, and the majority of which are also independently insured. Municipal bonds were $24.3 million at December 31, 2014 and $26.2 million at December 31, 2013. In addition, we have investments in FHLBB stock, common stock and mutual funds that invest only in securities allowed by the OCC.
During the second quarter of 2013, securities with an amortized cost of $172.1 million were reclassified from available-for-sale to held-to-maturity. In addition, during the third quarter of 2013, securities with an amortized cost of $132.8 million were reclassified from available-for-sale to held-to-maturity. The transfers of securities into the held-to-maturity category from the available-for-sale category were made at fair value at the date of transfer. The unrealized holding gain or loss at the date of transfer was retained in accumulated other comprehensive loss and in the carrying value of the held-to-maturity securities. Such amounts will be amortized over the remaining life of the securities.
Management selected the securities because of our positive intent and ability to hold until maturity. Considerations were taken into account in the selection of each security, including our overall sources of liquidity, the ability to pledge the security as collateral if needed, and the impact on our interest rate risk (IRR) positioning. In a rising rate environment, this reclassification helps to mitigate the effects on shareholders’ equity and tangible book value from changes in the fair market value of securities. This reclassification still allows much flexibility in the balance sheet to manage IRR and liquidity.
| 41 |
As of September 30, 2013, we entered into several forward-starting interest rate swap contracts with a combined notional value of $155.0 million. At December 31, 2014, $40.0 million in notional value of swap contracts were effective and four forward-starting interest rate swaps will become effective during 2015 and 2016. This hedge strategy converts the LIBOR based rate of interest on certain FHLB advances to fixed interest rates, thereby protecting us from floating interest rate variability. On a stand-alone basis, the interest rate swaps introduce potential future volatility in tangible book value and accumulated other comprehensive income (“AOCI”); however, the valuation of the swaps is expected to change in the opposite direction of the valuations on the available-for-sale securities portfolio. This is consistent with our objective to reduce total volatility in tangible book value and AOCI.
Total deposits increased $17.1 million to $834.2 million at December 31, 2014, compared to $817.1 million at December 31, 2013. Money market accounts increased $22.8 million to $227.3 million at December 31, 2014 from $204.5 million at December 31, 2013. Time deposits increased $16.3 million to $357.7 million at December 31, 2014 from $341.4 million at December 31, 2013. These increases were offset by decreases in checking accounts and regular savings accounts. Checking accounts decreased $15.8 million to $174.2 million at December 31, 2014 from $190.0 million at December 31, 2013. Regular savings accounts decreased $6.2 million to $75.0 million at December 31, 2014 from $81.2 million at December 31, 2013.
Short-term borrowings increased $45.8 million to $94.0 million at December 31, 2014 from $48.2 million at December 31, 2013. Short-term borrowings are made up of FHLBB advances with an original maturity of less than one year as well as customer repurchase agreements, which have an original maturity of one day. Short-term borrowings issued by the FHLBB were $62.8 million and $20.0 million at December 31, 2014 and 2013, respectively. Customer repurchase agreements increased $3.0 million to $31.2 million at December 31, 2014 from $28.2 million at December 31, 2013. A customer repurchase agreement is an agreement by us to sell to and repurchase from the customer an interest in specific securities issued by or guaranteed by the United States government or government-sponsored enterprises. This transaction settles immediately on a same day basis in immediately available funds. Interest paid is commensurate with other products of equal interest and credit risk. At December 31, 2014 and 2013, all of our customer repurchase agreements were held by commercial customers.
Long-term debt consists of FHLBB advances, securities sold under repurchase agreements and customer repurchase agreements with an original maturity of one year or more. At December 31, 2014, we had $216.7 million in long-term debt with the FHLBB, $10.0 million in securities sold under repurchase agreements and $5.8 million in customer repurchase agreements. This compares to $232.7 million in FHLBB advances, $10.0 million in securities sold under repurchase agreements and $5.6 million in customer repurchase agreements at December 31, 2013. The decrease of $16.0 million in long-term FHLBB advances for the year ended December 31, 2014 was due to the maturity of long-term advances that were repaid and not renewed.
Shareholders’ equity was $142.5 million and $154.1 million, which represented 10.8% and 12.1% of total assets at December 31, 2014 and December 31, 2013, respectively. The decrease in shareholders’ equity reflects the repurchase of 1.4 million shares of our common stock at a cost of $10.2 million pursuant to our stock repurchase program, a decrease in accumulated other comprehensive income of $4.5 million primarily due to the change in market values of interest rate swaps and pension plan mark-to market adjustments and the payment of regular dividends amounting to $3.8 million. This was partially offset by net income of $6.2 million for the year ended December 31, 2014 and an increase of $667,000 related to the recognition of share-based compensation.
| 42 |
Comparison of Operating Results for Years Ended December 31, 2014 and 2013
General. Net income for the year ended December 31, 2014 was $6.2 million, or $0.34 per diluted share, compared to $6.8 million, or $0.34 per diluted share, for the same period in 2013.
Interest and Dividend Income. Total interest and dividend was stable, decreasing $40,000 to $41.0 million for the year ended December 31, 2014 compared to the same period in 2013.
The stable interest and dividend income was primarily the result executing our strategy to improve the balance sheet mix by decreasing securities while increasing loans. At December 31, 2014, the average balance of securities decreased $79.5 million to $504.5 million, while the average balance of loans increased $78.4 million to $683.1 million. The favorable shift in assets out of securities and into loans helped to offset the stable balance of interest-earning assets, which remained unchanged at $1.2 billion for the years-ended December 31, 2014 and 2013, respectively. The average yield on interest-earning assets, on a tax-equivalent basis, decreased 2 basis points to 3.41% for the year ended December 31, 2014 from 3.43% for the same period in 2013.
Interest income on securities decreased $2.6 million to $12.9 million for the year ended December 31, 2014 from $15.5 million for the year ended December 31, 2013. The tax-equivalent yield on securities decreased 10 basis points from 2.74% for the year 2013 to 2.64% for the same period in 2014. The decrease in interest income and tax-equivalent yield on securities for the year ended December 31, 2014 was due to the average balance of securities decreasing $79.5 million in executing our strategy to improve the balance sheet mix by reinvesting cash flows from securities sales and pay downs into loans.
Interest income on loans increased $2.4 million to $27.8 million for the year ended December 31, 2014 from $25.4 million for the year ended December 31, 2013. The tax-equivalent yield on loans decreased 13 basis points from 4.23% for the year 2013 to 4.10% for the same period in 2014. The increase in interest income on loans for the year ended December 31, 2014 was due to the average balance of loans increasing $78.4 million in executing our strategy to improve the balance sheet mix by reinvesting cash flows from securities sales and pay downs into loans.
Interest Expense. Interest expense for the year ended December 31, 2014 decreased $367,000 to $9.9 million from 2013. This was attributable to a 5 basis point decrease in the average cost of interest-bearing liabilities to 0.99% for the year ended December 31, 2014 from 1.04% in 2013. The decrease in the cost of interest-bearing liabilities was due to decreases in rates on time deposits, savings and checking accounts.
Net Interest and Dividend Income. Net interest and dividend income increased $327,000 to $31.1 million for the year ended December 31, 2014 as compared to $30.7 million for same period in 2013. The net interest margin, on a tax-equivalent basis, was 2.60% and 2.58% for the years ended December 31, 2014 and 2013, respectively. The increase in the net interest margin was due to the improvement of our balance sheet mix by reducing securities and reinvesting in loans along with the cost of interest-bearing liabilities decreasing 5 basis points, while the yield on average interest-bearing assets decreased 2 basis points.
Provision (Credit) for Loan Losses. The provision (credit) for loan losses is reviewed by management based upon our evaluation of then-existing economic and business conditions affecting our key lending areas and other conditions, such as new loan products, credit quality trends (including trends in nonperforming loans expected to result from existing conditions), collateral values, loan volumes and concentrations, specific industry conditions within portfolio segments that existed as of the balance sheet date and the impact that such conditions were believed to have had on the collectability of the loan portfolio.
The amount that we provided for loan losses during the year ended December 31, 2014 was based upon the changes that occurred in the loan portfolio during that same period. The changes in the loan portfolio, described in detail below, include increases in the balances of commercial and industrial loans, commercial real estate loans and residential real estate loans; an increase in nonaccrual loans and charge-offs related to a single commercial loan relationship of $6.8 million; and a decrease in the balance of impaired loans. After evaluating these factors, we recorded a provision for loan losses of $1.6 million for the year ended December 31, 2014, compared to a credit of $256,000 for the same period in 2013. The allowance was $7.9 million at December 31, 2014 and $7.5 million at December 31, 2013, respectively. The allowance for loan losses as a percentage of total loans was 1.10% and 1.17% at December 31, 2014 and 2013, respectively.
| 43 |
Commercial and industrial loans increased $30.1 million to $165.7 million at December 31, 2014 from $135.6 million at December 31, 2013. Commercial real estate loans increased $13.9 million to $278.4 million at December 31, 2014 from $264.5 million at December 31, 2013. Residential real estate loans increased $43.6 million to $277.7 million at December 31, 2014. We consider residential real estate loans to contain less credit risk and market risk than commercial and industrial loans and commercial real estate.
Nonaccrual loans were $8.8 million at December 31, 2014 and $2.6 million at December 31, 2013. During the third quarter of 2014, one manufacturing loan relationship with a balance of $6.8 million, which is comprised of commercial and industrial loans of $4.1 million and a commercial real estate loan of $2.7 million, was placed into nonaccrual status and deemed impaired. We have maintained a relationship with this borrower for over 15 years. The relationship has been classified as a substandard credit since 2011 and has experienced declining sales that impacted their business operations. Based upon the fair value of the underlying business collateral, we recorded a charge-off of $950,000 in the third quarter of 2014 related to this single relationship.
Net charge-offs were $1.1 million for the year ended December 31, 2014. This comprised charge-offs of $1.2 million for the year ended December 31, 2014, offset by recoveries of $137,000. Net charge-offs were $79,000 for the year ended December 31, 2013. This comprised charge-offs of $341,000, partially offset by recoveries of $262,000 for the year ended December 31, 2013.
Impaired loans decreased $8.7 million to $7.8 million at December 31, 2014 from $16.5 million at December 31, 2013. The decrease in impaired loan balances was due to the financial improvement of a single commercial real estate loan relationship with a balance of $14.3 million, which returned to the general allowance pool for reserve measurement during the third quarter of 2014. This decrease was partially offset by an increase in impaired loan balances of $6.8 million related to the manufacturing loan relationship described above as of December 31, 2014.
Although management believes it has established and maintained the allowance for loan losses at appropriate levels, future adjustments may be necessary if economic, real estate and other conditions differ substantially from the current operating environment.
Noninterest Income. Noninterest income increased $188,000 to $4.5 million for the year ended December 31, 2014 compared to $4.3 million for the same period in 2013.
The primary reason for the increase in noninterest income was due to an increase in service charges and fees, which increased $213,000 to $2.6 million for the year ended December 31, 2014 from $2.4 million for the year ended December 31, 2013. The increase was primarily due to the collection of $97,000 in prepayment fees on a commercial loan relationship that paid off early. Fees collected from card-based transactions increased $76,000 for the year ended December 31, 2014, which reflects an increase in customer debit card and automated teller machine transactions. Wealth management fees were $54,000 for the year ended December 31, 2014. We introduced the addition of wealth management services during the first quarter of 2014. In addition, fees from the third-party mortgage company increased $37,000 to $153,000 for the year ended December 31, 2014.
Net gains on the sales of securities were $320,000 for the year ended December 31, 2014, compared to $3.1 million for the comparable 2013 period. The net gains for the years ended December 31, 2014 and 2013 were primarily the result of management selling securities to fund loan growth and decrease the expected duration of the portfolio. The net gains on the sales of securities were completely offset by prepayment expenses during the year ended December 31, 2013, as we prepaid repurchase agreements in the amount of $43.3 million and incurred a prepayment expense of $3.4 million. The repurchase agreements had a weighted average cost of 2.99%. We also recorded gains on the proceeds of BOLI death benefits of $563,000 for the year ended December 31, 2013.
Noninterest Expense. Noninterest expense decreased $733,000 to $25.9 million for the year ended December 31, 2014, from $26.6 million for the same period in 2013. The decrease in noninterest expense for the year ended December 31, 2014 was due to a decrease in salaries and benefits of $749,000 mainly the result of a decrease in employee benefits costs and share-based compensation expense. Professional fees decreased $97,000 to $1.9 million for the year ended December 31, 2014, compared to $2.0 million for the year ended December 31, 2013 partially due to one-time consulting services utilized for the year ended December 31, 2013.
| 44 |
Stock Option Tender Offer. During 2013, we completed a cash tender offer for certain out-of-the-money stock options that were granted prior to January 1, 2013 and held by current and former employees, officers, and directors of Westfield Financial, Inc., provided that such stock options had not expired or terminated prior to the expiration of the offering period. The cash purchase price paid in exchange for the cancellation of eligible options was $2.1 million. Costs associated with the stock option tender offer were $90,000 related to remaining unamortized stock-based compensation expense associated with the unvested portion of the options tendered in the offer, plus $566,000 related to associated taxes.
Income Taxes. The provision for income taxes was $1.9 million for the years ended December 31, 2014 and 2013, respectively. The effective tax rate was 23.4% for the year ended December 31, 2014 and 21.7% for the same period in 2013. The change in effective tax rate is primarily due to the net gain on BOLI death benefits recognized during the year ended December 31, 2013. In addition, we also maintained slightly lower levels of tax-advantaged income such as bank owned life insurance (“BOLI”) and tax-exempt municipal obligations for the year ended December 31, 2014.
Comparison of Operating Results for Years Ended December 31, 2013 and 2012
General. Net income for the year ended December 31, 2013 was $6.8 million, or $0.34 per diluted share, compared to $6.3 million, or $0.26 per diluted share, for the same period in 2012.
Interest and Dividend Income. Total interest and dividend income decreased $2.1 million to $41.0 million for the year ended December 31, 2013, compared to $43.1 million for the same period in 2012.
The decrease in interest income was primarily the result of a decrease in the average yield on interest-earning assets and a decrease in the average balance of interest-earning assets for the year ended December 31, 2013. The average yield on interest-earning assets, on a tax-equivalent basis, decreased 12 basis points to 3.43% for the year ended December 31, 2013 from 3.55% for the same period in 2012, while the balance of interest-earning assets decreased $22.7 million to $1.2 billion at December 31, 2013. At December 31, 2013, the average balance of securities decreased $54.4 million to $584.0 million, while the average balance of loans increased $31.1 million to $604.7 million. In executing our strategy to improve the balance sheet mix by decreasing securities while increasing loans, a timing difference occurred between decreasing the securities portfolio in the third quarter 2013 and growing commercial loans, which primarily occurred at the end of the fourth quarter 2013. As a result, the average balance of loans was $604.7 million for the year ended December 31, 2013, yet the ending balance was $637.4 million at December 31, 2013.
Interest income on securities decreased $1.9 million to $15.5 million for the year ended December 31, 2013 from $17.4 million for the year ended December 31, 2012. The tax-equivalent yield on securities decreased 10 basis points from 2.84% for the year 2012 to 2.74% for the same period in 2013. The decrease in interest income and tax-equivalent yield on securities for the year ended December 31, 2013 was due to the execution of our strategy to improve the balance sheet mix by reinvesting cash flows from securities sales and pay downs into loans.
The decrease in the average balance of securities was partially offset by an increase in the average balance of loans for the year ended December 31, 2013. The average balance of loans increased $31.1 million to $604.7 million from $573.6 million for the year ended December 31, 2013. Interest income on loans decreased $195,000 to $25.6 million for the year ended December 31, 2013 from $25.8 million for the year ended December 31, 2012. The tax-equivalent yield on loans decreased 26 basis points from 4.49% for the year 2012 to 4.23% for the same period in 2013. The tax-equivalent yield on loans decreased because a timing difference occurred between decreasing the securities portfolio in the third quarter 2013 and growing commercial loans, which primarily occurred at the end of the fourth quarter 2013 in a lower rate environment.
| 45 |
Interest Expense. Interest expense for the year ended December 31, 2013 decreased $2.4 million to $10.3 million from 2012. This was attributable to a decrease in the average cost of interest-bearing liabilities of 26 basis points to 1.04% for the year ended December 31, 2013 from 1.30% in 2012. The decrease in the cost of interest-bearing liabilities was due to decreases in rates on short and long-term borrowings, time deposits, checking accounts and savings and money market accounts. During 2013, we also prepaid repurchase agreements in the amount of $43.3 million and incurred a prepayment expense of $3.4 million. The repurchase agreements had a weighted average cost of 2.99%. During the last week of 2012, we prepaid repurchase agreements in the amount of $28.0 million and incurred a prepayment expense of $1.0 million. The repurchase agreements had a weighted average cost of 3.06%. The prepayments decreased the cost of funds and improved the net interest margin for the year ended December 31, 2013.
Net Interest and Dividend Income. Net interest and dividend income increased $300,000 to $30.7 million for the year ended December 31, 2013 as compared to $30.4 million for same period in 2012. The net interest margin, on a tax-equivalent basis, was 2.58% and 2.53% for the years ended December 31, 2013 and 2012, respectively. The increase in the net interest margin was due to the cost of interest-bearing liabilities decreasing 26 basis points, while the yield on average interest-bearing assets decreased 12 basis points, both occurring because of the low interest rate environment.
Provision (Credit) for Loan Losses. The provision (credit) for loan losses is reviewed by management based upon our evaluation of then-existing economic and business conditions affecting our key lending areas and other conditions, such as new loan products, credit quality trends (including trends in nonperforming loans expected to result from existing conditions), collateral values, loan volumes and concentrations, specific industry conditions within portfolio segments that existed as of the balance sheet date and the impact that such conditions were believed to have had on the collectability of the loan portfolio.
The amount of the credit provision for loan losses during the year ended December 31, 2013 was based upon the changes that occurred in the loan portfolio during that same period. The changes in the loan portfolio, described in detail below, include increases in the balances of commercial real estate loans, commercial and industrial loans and residential real estate loans as well as the continuous improvement of the overall risk profile of the commercial loan portfolio. After evaluating these factors, we recorded a credit provision for loan losses of $256,000 for the year ended December 31, 2013, compared to $698,000 in provision expense for the same period in 2012. The allowance was $7.5 million at December 31, 2013 and $7.8 million at December 31, 2012, respectively. The allowance for loan losses as a percentage of total loans was 1.17% and 1.31% at December 31, 2013 and 2012, respectively.
Commercial real estate loans increased $18.7 million to $264.5 million at December 31, 2013 from $245.8 million at December 31, 2012. Commercial and industrial loans increased $9.5 million to $135.6 million at December 31, 2013 from $126.1 million at December 31, 2012. Residential real estate loans increased $14.4 million to $234.1 million at December 31, 2013. We consider residential real estate loans to contain less credit risk and market risk than commercial real estate and commercial and industrial loans.
While the loan portfolio increased by $42.9 million to $630.0 million at December 31, 2013 from $587.1 million at December 31, 2012, the portfolio also experienced an overall positive change in its risk profile throughout the year ended December 31, 2013. Impaired loans that previously carried higher allowances showed considerable improvement resulting in allowances on impaired loans decreasing $441,000 to $97,000 at December 31, 2013 from $538,000 at December 31, 2012.
For the year ended December 31, 2013, we recorded net charge-offs of $79,000 compared to net charge-offs of $668,000 for the year ended December 31, 2012. The year ended December 31, 2013 net charge off was composed of charge-offs of $340,000 partially offset by recoveries of $261,000. The 2012 period was composed of charge-offs of $768,000 partially offset by recoveries of $100,000.
Although management believes it has established and maintained the allowance for loan losses at appropriate levels, future adjustments may be necessary if economic, real estate and other conditions differ substantially from the current operating environment.
Noninterest Income. Noninterest income decreased $1.7 million to $4.3 million for the year ended December 31, 2013 compared to $6.0 million for the same period in 2012.
| 46 |
The primary reason for the decrease in noninterest income was due to the net gains on the sales of securities being completely offset by prepayment expenses during the year ended December 31, 2013, whereas the 2012 period showed a net overall gain of $1.9 million in sales of securities after prepayment expenses. The net gains for the years ended December 31, 2013 and 2012 were primarily the result of management selling mortgage-backed securities that were expected to prepay rapidly and decrease the expected yield.
During 2013, we also prepaid repurchase agreements in the amount of $43.3 million and incurred a prepayment expense of $3.4 million. The repurchase agreements had a weighted average cost of 2.99%. During the last week of 2012, we prepaid repurchase agreements in the amount of $28.0 million and incurred a prepayment expense of $1.0 million. The repurchase agreements had a weighted average cost of 3.06%. The prepayments decreased the cost of funds and improved the net interest margin for the year ended December 31, 2013. In addition, during the year ended December 31, 2013, we recorded gains on the proceeds of BOLI death benefits of $563,000, as compared to $80,000 in the comparable 2012 period.
Service charges and fees decreased $177,000 to $2.4 million for the year ended December 31, 2013 from $2.6 million for the year ended December 31, 2012. The year ended included $156,000 related to a written risk participation agreement (“RPA”) with another financial institution. The RPA is the result of a contract with another financial institution, as a guarantor, to share credit risk associated with an interest rate swap. As such, we accept a portion of the credit risk in exchange for a one-time fee. Our risks and responsibilities as guarantor are further discussed in Note 14, Commitments and Contingencies. Fees from the third-party mortgage company decreased $143,000 to $116,000 for the year ended December 31, 2013. In addition, fees collected from card-based transactions increased $158,000 for the year ended December 31, 2013, which reflects an increase in customer debit card and automated teller machine transactions.
Noninterest Expense. Noninterest expense decreased $581,000 to $26.6 million for the year ended December 31, 2013, from $27.2 million for the same period in 2012. The decrease in noninterest expense for the year ended December 31, 2013 was due to a decrease in salaries and benefits of $1.1 million mainly the result of the completion of vesting of certain stock-based compensation during the fourth quarter of 2012. Expenses associated with other real estate owned (“OREO”) decreased $215,000 for the year ended December 31, 2013 as the 2012 period included a write-down of $167,000 on a foreclosed property. Data processing fees increased $234,000 due to increased use of technology in customer delivery channels and general bank operations. Professional fees increased $161,000 to $2.0 million for the year ended December 31, 2013, compared to $1.9 million for the year ended December 31, 2012. This was primarily due to an increase in ongoing consulting services regarding best practices for the year ended December 31, 2013.
Stock Option Tender Offer. During 2013, we completed a cash tender offer for certain out-of-the-money stock options that were granted prior to January 1, 2013 and held by current and former employees, officers, and directors of Westfield Financial, Inc., provided that such stock options had not expired or terminated prior to the expiration of the offering period. The cash purchase price paid in exchange for the cancellation of eligible options was $2.1 million, Costs associated with the stock option tender offer were $90,000 related to remaining unamortized stock-based compensation expense associated with the unvested portion of the options tendered in the offer, plus $566,000 related to associated taxes.
Income Taxes. The provision for income taxes decreased to $1.9 million for the year ended December 31, 2013, compared to $2.3 million for the comparable 2012 period. The effective tax rate was 21.7% for the year ended December 31, 2013 and 26.5% for the same period in 2012. The change in effective tax rate is primarily due to the net gain on BOLI death benefits recognized during the year ended December 31, 2013, while the year ended December 31, 2012 showed an additional income tax provision of $160,000, or 1.9% of income before income taxes, due to the redemption of BOLI. We also maintained comparable levels of tax-advantaged income such as bank owned life insurance (“BOLI”) and tax-exempt municipal obligations.
| 47 |
Liquidity and Capital Resources
The term “liquidity” refers to our ability to generate adequate amounts of cash to fund loan originations, loan purchases, deposit withdrawals and operating expenses. Our primary sources of liquidity are deposits, scheduled amortization and prepayments of loan principal and mortgage-backed securities, maturities and calls of investment securities and funds provided by our operations. We also can borrow funds from the FHLBB based on eligible collateral of loans and securities. Outstanding borrowings from the FHLBB were $279.5 million at December 31, 2014, and $252.7 million at December 31, 2013. At December 31, 2014, we had $70.8 million in available borrowing capacity with the FHLBB. We have the ability to increase our borrowing capacity with the FHLBB by pledging investment securities or loans. In addition, we have a $4.0 million line of credit with BBN at an interest rate determined and reset by BBN on a daily basis. At December 31, 2014 and 2013, we did not have an outstanding balance under this line. As part of our contract with BBN, we are required to maintain a reserve balance of $300,000 with BBN for our use of this line. In addition, we may enter into reverse repurchase agreements with approved broker-dealers. Reverse repurchase agreements are agreements that allow us to borrow money using our securities as collateral.
We also have outstanding at any time, a significant number of commitments to extend credit and provide financial guarantees to third parties. These arrangements are subject to strict credit control assessments. Guarantees specify limits to our obligations. Because many commitments and almost all guarantees expire without being funded in whole or in part, the contract amounts are not estimates of future cash flows. We are also obligated under agreements with the FHLBB to repay borrowed funds and are obligated under leases for certain of our branches and equipment. A summary of lease obligations, borrowings and credit commitments at December 31, 2014 follows:
| Within 1 Year | After 1 Year But Within 3 Years | After 3 Years But Within 5 Years | After 5 Years | Total | ||||||||||||||||
| (Dollars in thousands) | ||||||||||||||||||||
| Lease Obligations | ||||||||||||||||||||
| Operating lease obligations | $ | 653 | $ | 927 | $ | 732 | $ | 3,859 | $ | 6,171 | ||||||||||
| Borrowings and Debt | ||||||||||||||||||||
| Federal Home Loan Bank | 103,283 | 111,257 | 58,000 | 7,000 | 279,540 | |||||||||||||||
| Securities sold under agreements to repurchase | 36,936 | — | 10,000 | — | 46,936 | |||||||||||||||
| Total borrowings and debt | 140,219 | 111,257 | 68,000 | 7,000 | 326,476 | |||||||||||||||
| Credit Commitments | ||||||||||||||||||||
| Available lines of credit | 84,320 | — | 6 | 26,085 | 110,411 | |||||||||||||||
| Other loan commitments | 61,279 | — | — | 37 | 61,316 | |||||||||||||||
| Letters of credit | 1,998 | 373 | 392 | 270 | 3,033 | |||||||||||||||
| Total credit commitments | 147,597 | 373 | 398 | 26,392 | 174,760 | |||||||||||||||
| Total | $ | 288,469 | $ | 112,557 | $ | 69,130 | $ | 37,251 | $ | 507,407 | ||||||||||
Maturing investment securities are a relatively predictable source of funds. However, deposit flows, calls of securities and prepayments of loans and mortgage-backed securities are strongly influenced by interest rates, general and local economic conditions and competition in the marketplace. These factors reduce the predictability of the timing of these sources of funds.
Our primary investing activities are the origination of commercial real estate, commercial and industrial and consumer loans, and the purchase of mortgage-backed and other investment securities. During the year ended December 31, 2014, we originated loans of $164.3 million, compared to $144.5 million in 2013. Under our residential real estate loan program, we refer our residential real estate borrowers to a third-party mortgage company and substantially all of our residential real estate loans are underwritten, originated and serviced by a third-party mortgage company. Purchases of securities totaled $66.8 million for the year ended December 31, 2014 and $216.2 million for the year ended December 31, 2013. At December 31, 2014, we had loan commitments to borrowers of approximately $64.4 million, and available home equity and unadvanced lines of credit of approximately $110.4 million.
| 48 |
Deposit flows are affected by the level of interest rates, by the interest rates and products offered by competitors and by other factors. Total deposits increased $17.1 million and $63.7 million during the years ended December 31, 2014 and 2013, respectively. Time deposit accounts scheduled to mature within one year were $199.0 million at December 31, 2014. Based on our deposit retention experience and current pricing strategy, we anticipate that a significant portion of these certificates of deposit will remain on deposit. We monitor our liquidity position frequently and anticipate that it will have sufficient funds to meet our current funding commitments.
At December 31, 2014, Westfield Financial and the Bank exceeded each of the applicable regulatory capital requirements. Westfield Financial had tier 1 leverage capital of $150.0 million, or 11.3% to adjusted total assets, tier 1 capital to risk weighted assets of $150.0 million, or 17.7%, and total capital of $158.0 million or 18.7% to risk weighted assets. The Bank had tangible equity to tangible assets of 10.7%, tier 1 leverage capital of $142.4 million, or 10.7% to adjusted total assets, tier 1 capital to risk weighted assets of $142.4 million or 16.9%, and total capital to risk weighted assets of $150.4 million or 17.8%. See Note 11, Regulatory Capital, to our consolidated financial statements for further information on our regulatory requirements.
We do not anticipate any material capital expenditures during calendar year 2015, nor do we have any balloon or other payments due on any long-term obligations or any off-balance sheet items other than the commitments and unused lines of credit noted above.
Off-Balance Sheet Arrangements
We do not have any off-balance sheet arrangements, other than noted above and in Note 10, Derivatives and Hedging Activity, to our consolidated financial statements, that have or are reasonably likely to have a current or future effect on our financial condition, changes in financial condition, revenues or expenses, results of operations, liquidity, capital expenditures or capital resources that is material to investors.
Management of Market Risk
As a financial institution, our primary market risk is interest rate risk since substantially all transactions are denominated in U.S. dollars with no direct foreign exchange or changes in commodity price exposure. Fluctuations in interest rates will affect both our level of income and expense on a large portion of our assets and liabilities. Fluctuations in interest rates will also affect the market value of all interest-earning assets.
The primary goal of our interest rate management strategy is to limit fluctuations in net interest income as interest rates vary up or down and control variations in the market value of assets, liabilities and net worth as interest rates vary. We seek to coordinate asset and liability decisions so that, under changing interest rate scenarios, net interest income will remain within an acceptable range.
To achieve the objectives of managing interest rate risk, the Asset and Liability Management Committee meets periodically to discuss and monitor the market interest rate environment relative to interest rates that are offered on our products. The Asset and Liability Management Committee presents quarterly reports to our Board of Directors at their regular meetings.
Our primary source of funds has been deposits, consisting primarily of time deposits, money market accounts, savings accounts, demand accounts and interest bearing checking accounts, which have shorter terms to maturity than the loan portfolio. Several strategies have been employed to manage the interest rate risk inherent in the asset/liability mix, including but not limited to:
| 49 |
| · | maintaining the diversity of our existing loan portfolio through a balanced approach of growing the residential mortgages, for which we have experienced a greater demand in our market area, and commercial loans and commercial real estate loan originations, which typically have variable rates and shorter terms than residential mortgages; |
| · | emphasizing investments with an expected average duration of five years or less; and |
| · | using interest rate swaps to manage the interest rate position of the balance sheet. |
In 2014, increasing the residential loan portfolio has helped generate higher yields than investments in a low rate environment. However management has continued its emphasis on growing commercial loans has which have variable rates and shorter maturities than residential loans. Moreover, the actual amount of time before loans are repaid can be significantly affected by changes in market interest rates. Prepayment rates will also vary due to a number of other factors, including the regional economy in the area where the loans were originated, seasonal factors, demographic variables and the assumability of the loans. However, the major factors affecting prepayment rates are prevailing interest rates, related financing opportunities and competition. We monitor interest rate sensitivity so that we can adjust our asset and liability mix in a timely manner and minimize the negative effects of changing rates.
Each of our sources of liquidity is vulnerable to various uncertainties beyond our control. Scheduled loan and security payments are a relatively stable source of funds, while loan and security prepayments and calls, and deposit flows vary widely in reaction to market conditions, primarily prevailing interest rates. Asset sales are influenced by pledging activities, general market interest rates and unforeseen market conditions. Our financial condition is affected by our ability to borrow at attractive rates, retain deposits at market rates and other market conditions. We consider our sources of liquidity to be adequate to meet expected funding needs and also to be responsive to changing interest rate markets.
Net Interest and Dividend Income Simulation. We use a simulation model to monitor net interest income at risk under different interest rate environments. The changes in interest income and interest expense due to changes in interest rates reflect the rate sensitivity of our interest-earning assets and interest-bearing liabilities. For example, in a rising interest rate environment, the interest income from an adjustable rate loan is likely to increase depending on its repricing characteristics while the interest income from a fixed rate loan would not increase until the funds were repaid and loaned out at a higher interest rate.
The table below sets forth as of December 31, 2014 the estimated changes in net interest and dividend income for the following 12 month period resulting from a constant balance sheet and instantaneous and parallel shifts in the yield curve up 100, 200, 300 and 400 basis points and down 100 basis points compared to rates remaining unchanged.
| For the Year Ending December 31, 2014 | ||||||
| Changes in Interest Rates (Basis Points) | Net Interest and Dividend Income |
% Change | ||||
| (Dollars in thousands) | ||||||
| 400 | 30,829 | 2.9% | ||||
| 300 | 30,770 | 2.8% | ||||
| 200 | 30,560 | 2.1% | ||||
| 100 | 30,406 | 1.5% | ||||
| 0 | 29,946 | 0.0% | ||||
| -100 | 28,341 | -5.4% | ||||
The repricing and/or new rates of assets and liabilities moved in tandem with market rates. However, in certain deposit products, the use of data from a historical analysis indicated that the rates on these products would move only a fraction of the rate change amount. Pertinent data from each loan account, deposit account and investment security was used to calculate future cash flows. The data included such items as maturity date, payment amount, next repricing date, repricing frequency, repricing index and spread. Prepayment speed assumptions were based upon the difference between the account rate and the current market rate.
| 50 |
The income simulation analysis was based upon a variety of assumptions. These assumptions include but are not limited to asset mix, prepayment speeds, the timing and level of interest rates, and the shape of the yield curve. As market conditions vary from the assumptions in the income simulation analysis, actual results will differ. As a result, the income simulation analysis does not serve as a forecast of net interest income, nor do the calculations represent any actions that management may undertake in response to changes in interest rates.
Recent Accounting Pronouncements
Refer to Note 1 to our consolidated financial statements for a summary of the recent accounting pronouncements.
Impact of Inflation and Changing Prices
Our consolidated financial statements and accompanying notes have been prepared in accordance with accounting principles generally accepted in the United States of America (“GAAP”). GAAP generally requires the measurement of financial position and operating results in terms of historical dollars without consideration for changes in the relative purchasing power of money over time due to inflation. The impact of inflation is reflected in the increased cost of our operations. Unlike industrial companies, our assets and liabilities are primarily monetary in nature. As a result, changes in market interest rates have a greater impact on performance than do the effects of inflation.
| ITEM 7A. | QUANTITATIVE AND QUALITATIVE DISCLOSURES ABOUT MARKET RISK |
See Item 7, “Management’s Discussion and Analysis of Financial Condition and Results of Operations-Management of Market Risk,” for a discussion of quantitative and qualitative disclosures about market risk.
| ITEM 8. | FINANCIAL STATEMENTS AND SUPPLEMENTARY DATA |
Our consolidated financial statements and the accompanying notes may be found on pages F-1 through F-46 of this report.
| ITEM 9. | CHANGES IN AND DISAGREEMENTS WITH ACCOUNTANTS ON ACCOUNTING AND FINANCIAL DISCLOSURE |
None.
| ITEM 9A. | CONTROLS AND PROCEDURES |
Evaluation of Disclosure Controls and Procedures
Management, including our President and Chief Executive Officer and Chief Financial Officer and Treasurer, has evaluated the effectiveness of our disclosure controls and procedures (as defined in Exchange Act Rules 13a-15(e) and 15d-15(e)) as of the end of the period covered by this report. Based upon that evaluation, our Chief Executive Officer and Chief Financial Officer and Treasurer concluded that the disclosure controls and procedures were effective to ensure that information required to be disclosed in the reports we file and submit under the Exchange Act (i) is recorded, processed, summarized and reported as and when required and (ii) accumulated and communicated to our management including the Chief Executive Officer and Chief Financial Officer and Treasurer, as appropriate to allow timely discussion regarding required disclosure.
| 51 |
Management Report on Internal Control Over Financial Reporting
Our management, including our President and Chief Executive Officer and Chief Financial Officer and Treasurer, is responsible for establishing and maintaining adequate internal control over financial reporting, as defined in Rule 13a-15(f) of the Exchange Act. Our management assessed the effectiveness of our internal control over financial reporting as of December 31, 2014 based on the criteria set forth by the Committee of Sponsoring Organizations of the Treadway Commission in Internal Control-Integrated Framework (1992). Based on this assessment, management concluded that our internal control over financial reporting was effective as of December 31, 2014.
There have been no changes in our internal control over financial reporting identified in connection with the evaluation that occurred during our last fiscal quarter that has materially affected, or that is reasonably likely to materially affect, our internal control over financial reporting.
Attestation Report of the Registered Public Accounting Firm
The attestation report of Wolf & Company, P.C., our independent registered public accounting firm, regarding our internal control over financial reporting as of December 31, 2014 is included elsewhere in this report.
| ITEM 9B. | OTHER INFORMATION |
| None. |
| 52 |
REPORT OF INDEPENDENT REGISTERED PUBLIC ACCOUNTING FIRM
The Board of Directors and Shareholders
Westfield Financial, Inc.
We have audited Westfield Financial, Inc. and subsidiaries’ (the “Company”) internal control over financial reporting as of December 31, 2014, based on criteria established in Internal Control — Integrated Framework (1992) issued by the Committee of Sponsoring Organizations of the Treadway Commission. Management of Westfield Financial, Inc. is responsible for maintaining effective internal control over financial reporting and for its assessment of the effectiveness of internal control over financial reporting. Our responsibility is to express an opinion on the Company’s internal control over financial reporting based on our audit.
We conducted our audit in accordance with the standards of the Public Company Accounting Oversight Board (United States). Those standards require that we plan and perform the audit to obtain reasonable assurance about whether effective internal control over financial reporting was maintained in all material respects. Our audit included obtaining an understanding of internal control over financial reporting, assessing the risk that a material weakness exists, and testing and evaluating the design and operating effectiveness of internal control based on the assessed risk. Our audit also included performing such other procedures as we considered necessary in the circumstances. We believe that our audit provides a reasonable basis for our opinion.
A company’s internal control over financial reporting is a process designed to provide reasonable assurance regarding the reliability of financial reporting and the preparation of financial statements for external purposes in accordance with accounting principles generally accepted in the United States of America. Also, because management’s assessment and our audit were conducted to meet the reporting requirements of Section 112 of the Federal Deposit Insurance Corporation Improvement Act (FDICIA), our audit of Westfield Financial, Inc.’s internal control over financial reporting included controls over the preparation of financial statements in accordance with the instructions to the Consolidated Financial Statements for Bank Holding Companies (Form FR Y-9C) and the Federal Financial Institutions Examination Council Instructions for Consolidated Reports of Condition and Income. A company’s internal control over financial reporting includes those policies and procedures that (a) pertain to the maintenance of records that, in reasonable detail, accurately and fairly reflect the transactions and dispositions of the assets of the company; (b) provide reasonable assurance that transactions are recorded as necessary to permit preparation of financial statements in accordance with generally accepted accounting principles, and that receipts and expenditures of the company are being made only in accordance with authorizations of management and directors of the company; and (c) provide reasonable assurance regarding prevention or timely detection of unauthorized acquisition, use, or disposition of the company’s assets that could have a material effect on the financial statements.
Because of its inherent limitations, internal control over financial reporting may not prevent or detect misstatements. Also, projections of any evaluation of effectiveness to future periods are subject to the risk that controls may become inadequate because of changes in conditions, or that the degree of compliance with the policies or procedures may deteriorate.
In our opinion, Westfield Financial, Inc. maintained, in all material respects, effective internal control over financial reporting as of December 31, 2014, based on criteria established in Internal Control — Integrated Framework (1992) issued by the Committee of Sponsoring Organizations of the Treadway Commission.
We have also audited, in accordance with the standards of the Public Company Accounting Oversight Board (United States), the December 31, 2014 consolidated financial statements of Westfield Financial, Inc. and our report dated March 13, 2015 expressed an unqualified opinion thereon.
/s/ WOLF & COMPANY, P.C.
Boston, Massachusetts
March 13, 2015
| 53 |
| ITEM 10. | DIRECTORS, EXECUTIVE OFFICERS AND CORPORATE GOVERNANCE |
The following information included in the Proxy Statement is incorporated herein by reference: “Information About Our Board of Directors,” “Information About Our Executive Officers,” “Information About the Board of Directors and Corporate Governance,” and “Section 16(a) Beneficial Ownership Reporting Compliance.”
| ITEM 11. | EXECUTIVE COMPENSATION |
The following information included in the Proxy Statement is incorporated herein by reference: “Compensation Committee Interlocks,” “Compensation Discussion and Analysis,” “Compensation Committee Report,” and “Executive and Director Compensation Tables.”
| ITEM 12. | SECURITY OWNERSHIP OF CERTAIN BENEFICIAL OWNERS AND MANAGEMENT AND RELATED SHAREHOLDER MATTERS |
The following information included in the Proxy Statement is incorporated herein by reference: “Security Ownership of Certain Beneficial Owners and Management” and “Securities Authorized For Issuance Under Equity Compensation Plans.”
| ITEM 13. | CERTAIN RELATIONSHIPS AND RELATED TRANSACTIONS, AND DIRECTOR INDEPENDENCE |
The following information included in the Proxy Statement is incorporated herein by reference: “Transactions with Related Persons” and “Board of Directors Independence.”
| ITEM 14. | PRINCIPAL ACCOUNTING FEES AND SERVICES |
The following information included in the Proxy Statement is incorporated herein by reference: “Independent Registered Public Accounting Firm Fees and Services.”
| ITEM 15. | EXHIBITS AND FINANCIAL STATEMENT SCHEDULES |
| (a)(1) | Financial Statements |
Reference is made to our consolidated financial statements and accompanying notes included in Item 8 of Part II hereof.
| (a)(2) | Financial Statement Schedules |
Consolidated financial statement schedules have been omitted because the required information is not present, or not present in amounts sufficient to require submission of the schedules, or because the required information is provided in the consolidated financial statements or notes thereto.
| (a)(3) | Exhibits |
The exhibits required to be filed as part of this Annual Report on Form 10-K are listed in the Exhibit Index attached hereto and are incorporated herein by reference.
| 54 |
SIGNATURES
Pursuant to the requirements of Section 13 or 15(d) of the Securities Exchange Act of 1934, as amended, the registrant has duly caused this report to be signed on its behalf by the undersigned, thereunto duly authorized, on March 13, 2015.
| Westfield Financial, Inc. | ||
| By: | /s/ James C. Hagan | |
| James C. Hagan | ||
| Chief Executive Officer and President | ||
| (Principal Executive Officer) | ||
| By: | /s/ Leo R. Sagan, Jr. | |
| Leo R. Sagan, Jr. | ||
| Chief Financial Officer and Treasurer | ||
| (Principal Financial Officer and Principal Accounting Officer) | ||
POWER OF ATTORNEY
Each person whose individual signature appears below hereby authorizes and appoints James C. Hagan and Leo R. Sagan, Jr., and each of them, with full power of substitution and resubstitution and full power to act without the other, as his or her true and lawful attorney-in-fact and agent to act in his or her name, place and stead and to execute in the name and on behalf of each person, individually and in each capacity stated below, and to file any and all amendments to this report on Form 10-K, and to file the same, with all exhibits thereto, and other documents in connection therewith, with the Securities and Exchange Commission, granting unto said attorneys-in-fact and agents, and each of them, full power and authority to do and perform each and every act and thing, ratifying and confirming all that said attorneys-in-fact and agents or any of them or their or his substitute or substitutes may lawfully do or cause to be done by virtue thereof.
Pursuant to the requirements of the Securities Exchange Act of 1934, as amended, this Annual Report on Form 10-K has been signed by the following persons on behalf of the registrant and in the capacities indicated on March 13, 2015.
|
Name |
Title | |
| /s/ James C. Hagan | Chief Executive Officer, President and Director (Principal Executive Officer) | |
| James C. Hagan | ||
| /s/ Leo R. Sagan, Jr. |
Chief Financial Officer and Treasurer (Principal Financial Officer and Principal Accounting Officer) | |
| Leo R. Sagan, Jr. | ||
| /s/ Donald A. Williams | Chairman of the Board | |
| Donald A. Williams | ||
| /s/ Laura Benoit | Director | |
| Laura Benoit | ||
| /s/ David C. Colton, Jr. | Director | |
| David C. Colton, Jr. | ||
| /s/ Donna J. Damon | Director | |
| Donna J. Damon | ||
| /s/ Lisa G. McMahon | Director | |
| Lisa G. McMahon | ||
| /s/ Steven G. Richter | Director | |
| Steven G. Richter | ||
| /s/ Philip R. Smith | Director | |
| Philip R. Smith | ||
| /s/ Charles E. Sullivan | Director | |
| Charles E. Sullivan | ||
| /s/ Kevin M. Sweeney | Director | |
| Kevin M. Sweeney | ||
| /s/ Christos A. Tapases | Director | |
| Christos A. Tapases |
REPORT OF INDEPENDENT REGISTERED PUBLIC ACCOUNTING FIRM
To the Board of Directors and Shareholders
Westfield Financial, Inc.
We have audited the accompanying consolidated balance sheets of Westfield Financial, Inc. and subsidiaries (the “Company”) as of December 31, 2014 and 2013, and the related consolidated statements of income, comprehensive income (loss), shareholders’ equity and cash flows for each of the years in the three-year period ended December 31, 2014. These consolidated financial statements are the responsibility of the Company’s management. Our responsibility is to express an opinion on these consolidated financial statements based on our audits.
We conducted our audits in accordance with the standards of the Public Company Accounting Oversight Board (United States). Those standards require that we plan and perform the audit to obtain reasonable assurance about whether the financial statements are free of material misstatement. An audit includes examining, on a test basis, evidence supporting the amounts and disclosures in the financial statements. An audit also includes assessing the accounting principles used and significant estimates made by management, as well as evaluating the overall financial statement presentation. We believe that our audits provide a reasonable basis for our opinion.
In our opinion, the consolidated financial statements referred to above present fairly, in all material respects, the financial position of Westfield Financial, Inc. and subsidiaries as of December 31, 2014 and 2013, and the results of their operations and their cash flows for each of the years in the three-year period ended December 31, 2014 in conformity with accounting principles generally accepted in the United States of America.
We also have audited, in accordance with the standards of the Public Company Accounting Oversight Board (United States), the Company’s internal control over financial reporting as of December 31, 2014, based on criteria established in Internal Control—Integrated Framework (1992) issued by the Committee of Sponsoring Organizations of the Treadway Commission (COSO) and our report, dated March 13, 2015, expressed an unqualified opinion thereon.
/s/ WOLF & COMPANY, P.C.
Boston, Massachusetts
March 13, 2015
| F-1 |
| WESTFIELD FINANCIAL INC., AND SUBSIDIARIES | ||||||||
| CONSOLIDATED BALANCE SHEETS | ||||||||
(Dollars in thousands, except per share data)
| ||||||||
| December 31, | December 31, | |||||||
| 2014 | 2013 | |||||||
| ASSETS | ||||||||
| CASH AND DUE FROM BANKS | $ | 10,294 | $ | 14,112 | ||||
| FEDERAL FUNDS SOLD | 269 | 521 | ||||||
| INTEREST-BEARING DEPOSITS AND OTHER SHORT-TERM INVESTMENTS | 8,222 | 5,109 | ||||||
| CASH AND CASH EQUIVALENTS | 18,785 | 19,742 | ||||||
| SECURITIES AVAILABLE FOR SALE – AT FAIR VALUE | 215,750 | 243,204 | ||||||
| SECURITIES HELD TO MATURITY (Fair value of $277,636 and $282,555 at December 31, 2014 and 2013, respectively) | 278,080 | 295,013 | ||||||
| FEDERAL HOME LOAN BANK OF BOSTON AND OTHER RESTRICTED STOCK - AT COST | 14,934 | 15,631 | ||||||
| LOANS - Net of allowance for loan losses of $7,948 and $7,459 at December 31, 2014 and 2013, respectively | 716,738 | 629,968 | ||||||
| PREMISES AND EQUIPMENT, Net | 11,703 | 10,995 | ||||||
| ACCRUED INTEREST RECEIVABLE | 4,213 | 4,201 | ||||||
| BANK-OWNED LIFE INSURANCE | 48,703 | 47,179 | ||||||
| DEFERRED TAX ASSET, Net | 8,819 | 6,334 | ||||||
| OTHER ASSETS | 2,371 | 4,574 | ||||||
| TOTAL ASSETS | $ | 1,320,096 | $ | 1,276,841 | ||||
| LIABILITIES AND SHAREHOLDERS’ EQUITY | ||||||||
| LIABILITIES: | ||||||||
| DEPOSITS : | ||||||||
| Noninterest-bearing | $ | 136,186 | $ | 145,040 | ||||
| Interest-bearing | 698,032 | 672,072 | ||||||
| Total deposits | 834,218 | 817,112 | ||||||
| SHORT-TERM BORROWINGS | 93,997 | 48,197 | ||||||
| LONG-TERM DEBT | 232,479 | 248,377 | ||||||
| DUE TO BROKER | — | 299 | ||||||
| OTHER LIABILITIES | 16,859 | 8,712 | ||||||
| TOTAL LIABILITIES | 1,177,553 | 1,122,697 | ||||||
| SHAREHOLDERS’ EQUITY: | ||||||||
| Preferred stock - $.01 par value, 5,000,000 shares authorized, none outstanding | — | — | ||||||
| Common stock - $.01 par value, 75,000,000 shares authorized; 18,734,791 shares issued and outstanding at December 31, 2014; 20,140,669 shares issued and outstanding at December 31, 2013 | 187 | 201 | ||||||
| Additional paid-in capital | 111,696 | 121,860 | ||||||
| Unearned compensation - ESOP | (7,469 | ) | (8,003 | ) | ||||
| Unearned compensation - Equity Incentive Plan | (95 | ) | (187 | ) | ||||
| Retained earnings | 45,699 | 43,248 | ||||||
| Accumulated other comprehensive loss | (7,475 | ) | (2,975 | ) | ||||
| Total shareholders’ equity | 142,543 | 154,144 | ||||||
| TOTAL LIABILITIES AND SHAREHOLDERS’ EQUITY | $ | 1,320,096 | $ | 1,276,841 | ||||
See accompanying notes to unaudited consolidated financial statements.
| F-2 |
| WESTFIELD FINANCIAL, INC. AND SUBSIDIARIES | ||||||||||||
| CONSOLIDATED STATEMENTS OF INCOME | ||||||||||||
(Dollars in thousands, except per share data)
| ||||||||||||
| Years Ended December 31, | ||||||||||||
| 2014 | 2013 | 2012 | ||||||||||
| INTEREST AND DIVIDEND INCOME: | ||||||||||||
| Residential and commercial real estate loans | $ | 21,953 | $ | 20,204 | $ | 20,449 | ||||||
| Commercial and industrial loans | 5,749 | 5,064 | 4,994 | |||||||||
| Consumer loans | 141 | 140 | 160 | |||||||||
| Debt securities, taxable | 11,880 | 14,302 | 15,621 | |||||||||
| Debt securities, tax-exempt | 833 | 1,067 | 1,592 | |||||||||
| Equity securities | 176 | 152 | 186 | |||||||||
| Other investments – at cost | 246 | 93 | 94 | |||||||||
| Federal funds sold, interest-bearing deposits and other short-term investments | 13 | 9 | 8 | |||||||||
| Total interest and dividend income | 40,991 | 41,031 | 43,104 | |||||||||
| INTEREST EXPENSE: | ||||||||||||
| Deposits | 5,177 | 5,525 | 6,142 | |||||||||
| Long-term debt | 4,326 | 4,591 | 6,406 | |||||||||
| Short-term borrowings | 420 | 174 | 115 | |||||||||
| Total interest expense | 9,923 | 10,290 | 12,663 | |||||||||
| Net interest and dividend income | 31,068 | 30,741 | 30,441 | |||||||||
| PROVISION (CREDIT) FOR LOAN LOSSES | 1,575 | (256 | ) | 698 | ||||||||
| Net interest and dividend income after provision (credit) for loan losses | 29,493 | 30,997 | 29,743 | |||||||||
| NONINTEREST INCOME (LOSS): | ||||||||||||
| Service charges and fees | 2,617 | 2,404 | 2,581 | |||||||||
| Income from bank-owned life insurance | 1,523 | 1,549 | 1,439 | |||||||||
| Gain on bank-owned life insurance death benefit | — | 563 | 80 | |||||||||
| Loss on prepayment of borrowings | — | (3,370 | ) | (1,017 | ) | |||||||
| Gain on sales of securities, net | 320 | 3,126 | 2,907 | |||||||||
| Total noninterest income | 4,460 | 4,272 | 5,990 | |||||||||
| NONINTEREST EXPENSE: | ||||||||||||
| Salaries and employees benefits | 14,709 | 15,458 | 16,530 | |||||||||
| Occupancy | 3,076 | 2,898 | 2,775 | |||||||||
| Computer operations | 2,341 | 2,340 | 2,106 | |||||||||
| Professional fees | 1,936 | 2,033 | 1,872 | |||||||||
| OREO expense | — | 22 | 237 | |||||||||
| FDIC insurance assessment | 713 | 655 | 611 | |||||||||
| Other | 3,134 | 3,236 | 3,092 | |||||||||
| Total noninterest expense | 25,909 | 26,642 | 27,223 | |||||||||
| INCOME BEFORE INCOME TAXES | 8,044 | 8,627 | 8,510 | |||||||||
| INCOME TAX PROVISION | 1,882 | 1,871 | 2,256 | |||||||||
| NET INCOME | $ | 6,162 | $ | 6,756 | $ | 6,254 | ||||||
| EARNINGS PER COMMON SHARE: | ||||||||||||
| Basic earnings per share | $ | 0.34 | $ | 0.34 | $ | 0.26 | ||||||
| Weighted average shares outstanding | 18,183,739 | 20,079,251 | 24,501,951 | |||||||||
| Diluted earnings per share | $ | 0.34 | $ | 0.34 | $ | 0.26 | ||||||
| Weighted average diluted shares outstanding | 18,183,739 | 20,079,265 | 24,519,515 | |||||||||
See accompanying notes to consolidated financial statements.
| F-3 |
| WESTFIELD FINANCIAL, INC. AND SUBSIDIARIES | ||||||||||||
| CONSOLIDATED STATEMENTS OF COMPREHENSIVE INCOME (LOSS) | ||||||||||||
(Dollars in thousands)
| ||||||||||||
| Years Ended December 31, | ||||||||||||
| 2014 | 2013 | 2012 | ||||||||||
| Net income | $ | 6,162 | $ | 6,756 | $ | 6,254 | ||||||
| Other comprehensive income (loss): | ||||||||||||
| Securities available for sale: | ||||||||||||
| Unrealized holding gains (losses) | 3,398 | (20,970 | ) | 7,371 | ||||||||
| Reclassification adjustment for gains realized in income | (320 | ) | (3,126 | ) | (2,907 | ) | ||||||
| Amortization of net unrealized loss on held-to-maturity securities(1) | (55 | ) | (234 | ) | — | |||||||
| Net unrealized gains (losses) | 3,023 | (24,330 | ) | 4,464 | ||||||||
| Tax effect | (1,045 | ) | 8,371 | (1,532 | ) | |||||||
| Net-of-tax amount | 1,978 | (15,959 | ) | 2,932 | ||||||||
| Derivative instruments: | ||||||||||||
| Change in fair value of derivatives used for cash flow hedges | (7,684 | ) | 1,755 | — | ||||||||
| Reclassification adjustment for loss realized in interest expense (2) | 190 | — | — | |||||||||
| Net adjustments pertaining to derivative instruments | (7,494 | ) | 1,755 | |||||||||
| Tax effect | 2,548 | (597 | ) | — | ||||||||
| Net-of-tax amount | (4,946 | ) | 1,158 | — | ||||||||
| Defined benefit pension plans: | ||||||||||||
| Gains (losses) arising during the period | (2,312 | ) | 1,608 | (94 | ) | |||||||
| Reclassification adjustments(3): | ||||||||||||
| Actuarial loss | — | 117 | 175 | |||||||||
| Transition asset | (10 | ) | (11 | ) | (11 | ) | ||||||
| Net adjustments pertaining to defined benefit plans | (2,322 | ) | 1,714 | 70 | ||||||||
| Tax effect | 790 | (583 | ) | (23 | ) | |||||||
| Net-of-tax amount | (1,532 | ) | 1,131 | 47 | ||||||||
| Other comprehensive (loss) income | (4,500 | ) | (13,670 | ) | 2,979 | |||||||
| Comprehensive income (loss) | $ | 1,662 | $ | (6,914 | ) | $ | 9,233 | |||||
| (1) | Amortization of net unrealized loss on held-to-maturity securities is recognized as a component of interest income on debt securities. Income tax benefits associated with the reclassification adjustments were $18,000, $80,000 and $0 for the years ended December 31, 2014, 2013 and 2012, respectively.
|
| (2) | Loss realized in interest expense on derivative instruments is recognized as a component of interest expense on long-term debt. Income tax benefits associated with the reclassification adjustment was $65,000 for the year ended December 31, 2014.
|
| (3) | Amounts represent the reclassification of defined benefit plans amortization and have been recognized as a component of salaries and employee benefit expense. Income tax expense (benefits) associated with the reclassification adjustments were $3,000, $(36,000) and $(56,000) for the years ended December 31, 2014, 2013 and 2012, respectively. |
See accompanying notes to consolidated financial statements.
| F-4 |
| WESTFIELD FINANCIAL, INC. AND SUBSIDIARIES | ||||||||||||||||||||||||||||||||
| CONSOLIDATED STATEMENTS OF CHANGES IN SHAREHOLDERS' EQUITY | ||||||||||||||||||||||||||||||||
| (Dollars in thousands, except share data) | ||||||||||||||||||||||||||||||||
| Common Stock | ||||||||||||||||||||||||||||||||
| Shares | Par Value | Additional Paid-in Capital | Unearned Compensation- ESOP | Unearned Compensation- Equity Incentive Plan | Retained Earnings | Accumulated Other Comprehensive Income (Loss) | Total | |||||||||||||||||||||||||
| BALANCE AT DECEMBER 31, 2011 | 26,918,250 | $ | 269 | $ | 173,615 | $ | (9,119 | ) | $ | (1,228 | ) | $ | 47,735 | $ | 7,716 | $ | 218,988 | |||||||||||||||
| Comprehensive income | — | — | — | — | — | 6,254 | 2,979 | 9,233 | ||||||||||||||||||||||||
| Common stock held by ESOP committed to be released (84,261 shares) | — | — | 62 | 566 | — | — | — | 628 | ||||||||||||||||||||||||
| Share-based compensation - stock options | — | — | 642 | — | — | — | — | 642 | ||||||||||||||||||||||||
| Share-based compensation - equity incentive plan | — | — | — | — | 963 | — | — | 963 | ||||||||||||||||||||||||
| Excess tax shortfall from equity incentive plan | — | — | (96 | ) | — | — | — | — | (96 | ) | ||||||||||||||||||||||
| Common stock repurchased | (4,311,841 | ) | (43 | ) | (31,688 | ) | — | — | — | — | (31,731 | ) | ||||||||||||||||||||
| Issuance of common stock in connection with stock option exercises | 237,313 | 2 | 1,943 | — | — | (904 | ) | — | 1,041 | |||||||||||||||||||||||
| Excess tax benefits in connection with stock option exercises | — | — | 240 | — | — | — | — | 240 | ||||||||||||||||||||||||
| Cash dividends declared and paid ($0.44 per share) | — | — | — | — | — | (10,721 | ) | — | (10,721 | ) | ||||||||||||||||||||||
| BALANCE AT DECEMBER 31, 2012 | 22,843,722 | 228 | 144,718 | (8,553 | ) | (265 | ) | 42,364 | 10,695 | 189,187 | ||||||||||||||||||||||
| Comprehensive income (loss) | — | — | — | — | — | 6,756 | (13,670 | ) | (6,914 | ) | ||||||||||||||||||||||
| Common stock held by ESOP committed to be released (81,803 shares) | — | — | 49 | 550 | — | — | — | 599 | ||||||||||||||||||||||||
| Share-based compensation - stock options | — | — | 128 | — | — | — | — | 128 | ||||||||||||||||||||||||
| Share-based compensation - equity incentive plan | — | — | — | — | 126 | — | — | 126 | ||||||||||||||||||||||||
| Excess tax shortfall from equity incentive plan | — | — | (1 | ) | — | — | — | — | (1 | ) | ||||||||||||||||||||||
| Common stock repurchased | (2,703,053 | ) | (27 | ) | (20,365 | ) | — | — | — | — | (20,392 | ) | ||||||||||||||||||||
| Issuance of common stock in connection with equity incentive plan | — | — | 48 | — | (48 | ) | — | — | — | |||||||||||||||||||||||
| Tender offer to purchase outstanding options, including tax impact of $566,000 | — | — | (2,717 | ) | — | — | — | — | (2,717 | ) | ||||||||||||||||||||||
| Cash dividends declared and paid ($0.29 per share) | — | — | — | — | — | (5,872 | ) | — | (5,872 | ) | ||||||||||||||||||||||
| BALANCE AT DECEMBER 31, 2013 | 20,140,669 | 201 | 121,860 | (8,003 | ) | (187 | ) | 43,248 | (2,975 | ) | 154,144 | |||||||||||||||||||||
| Comprehensive income (loss) | — | — | — | — | — | 6,162 | (4,500 | ) | 1,662 | |||||||||||||||||||||||
| Common stock held by ESOP committed to be released (79,345 shares) | — | — | 42 | 534 | — | — | — | 576 | ||||||||||||||||||||||||
| Share-based compensation - equity incentive plan | — | — | — | — | 92 | — | — | 92 | ||||||||||||||||||||||||
| Excess tax shortfall from equity incentive plan | — | — | (1 | ) | — | — | — | — | (1 | ) | ||||||||||||||||||||||
| Common stock repurchased | (1,405,878 | ) | (14 | ) | (10,205 | ) | — | — | — | — | (10,219 | ) | ||||||||||||||||||||
| Return of dividends issued in connection with equity incentive plan | — | — | — | — | — | 121 | — | 121 | ||||||||||||||||||||||||
| Cash dividends declared and paid ($0.21 per share) | — | — | — | — | — | (3,832 | ) | — | (3,832 | ) | ||||||||||||||||||||||
| BALANCE AT DECEMBER 31, 2014 | 18,734,791 | $ | 187 | $ | 111,696 | $ | (7,469 | ) | $ | (95 | ) | $ | 45,699 | $ | (7,475 | ) | $ | 142,543 | ||||||||||||||
See accompanying notes to consolidated financial statements
| F-5 |
| WESTFIELD FINANCIAL, INC. AND SUBSIDIARIES | ||||||||||||
| CONSOLIDATED STATEMENTS OF CASH FLOWS | ||||||||||||
(Dollars in thousands)
| ||||||||||||
| Years Ended December 30, | ||||||||||||
| 2014 | 2013 | 2012 | ||||||||||
| OPERATING ACTIVITIES: | ||||||||||||
| Net income | $ | 6,162 | $ | 6,756 | $ | 6,254 | ||||||
| Adjustments to reconcile net income to net cash provided by operating activities: | ||||||||||||
| Provision (credit) for loan losses | 1,575 | (256 | ) | 698 | ||||||||
| Depreciation and amortization of premises and equipment | 1,189 | 1,102 | 1,049 | |||||||||
| Net amortization of premiums and discounts on securities and mortgage loans | 4,263 | 4,248 | 4,411 | |||||||||
| Net amortization of premiums on modified debt | 610 | 627 | 537 | |||||||||
| Share-based compensation expense | 92 | 254 | 1,605 | |||||||||
| ESOP expense | 576 | 599 | 628 | |||||||||
| Excess tax shortfall from equity incentive plan | 1 | 1 | 96 | |||||||||
| Excess tax benefits in connection with stock option exercises | — | — | (240 | ) | ||||||||
| Excess tax expense in connection with tender offer completion | — | 566 | — | |||||||||
| Net gains on sales of securities | (320 | ) | (3,126 | ) | (2,907 | ) | ||||||
| Write-downs of other real estate owned | — | — | 166 | |||||||||
| Loss on sale of other real estate owned | — | 6 | — | |||||||||
| Loss on prepayment of borrowings | — | 3,370 | 1,017 | |||||||||
| Deferred income tax (benefit) expense | (193 | ) | 980 | 185 | ||||||||
| Income from bank-owned life insurance | (1,523 | ) | (1,549 | ) | (1,439 | ) | ||||||
| Gain on bank-owned life insurance death benefit | — | (563 | ) | (80 | ) | |||||||
| Changes in assets and liabilities: | ||||||||||||
| Accrued interest receivable | (12 | ) | 401 | (580 | ) | |||||||
| Other assets | (150 | ) | (21 | ) | 976 | |||||||
| Other liabilities | 77 | 807 | (1,066 | ) | ||||||||
| Net cash provided by operating activities | 12,347 | 14,202 | 11,310 | |||||||||
| INVESTING ACTIVITIES: | ||||||||||||
| Securities, held to maturity: | ||||||||||||
| Purchases | — | (3,461 | ) | — | ||||||||
| Proceeds from calls, maturities, and principal collections | 14,433 | 6,064 | — | |||||||||
| Securities, available for sale: | ||||||||||||
| Purchases | (66,784 | ) | (212,765 | ) | (375,168 | ) | ||||||
| Proceeds from sales | 71,738 | 206,788 | 288,116 | |||||||||
| Proceeds from calls, maturities, and principal collections | 24,135 | 61,270 | 86,210 | |||||||||
| Purchase of residential mortgages | (53,272 | ) | (37,700 | ) | (62,895 | ) | ||||||
| Loan originations and principal payments, net | (34,522 | ) | (4,946 | ) | 21,286 | |||||||
| Redemption (purchase) of Federal Home Loan Bank of Boston stock | 697 | (1,393 | ) | (2,026 | ) | |||||||
| Proceeds from redemption of other restricted stock | — | 31 | 195 | |||||||||
| Proceeds from sale of other real estate owned | — | 958 | — | |||||||||
| Purchases of premises and equipment | (1,937 | ) | (1,020 | ) | (1,129 | ) | ||||||
| Proceeds from sale of premises and equipment | 40 | — | — | |||||||||
| Purchase of bank-owned life insurance | — | — | (2,600 | ) | ||||||||
| Surrender of bank-owned life insurance | — | — | 1,585 | |||||||||
| Disbursement of bank-owned life insurance gain | — | (282 | ) | — | ||||||||
| Proceeds from payout on bank-owned life insurance | — | 1,437 | — | |||||||||
| Net cash (used in) provided by investing activities | (45,472 | ) | 14,981 | (46,426 | ) | |||||||
| FINANCING ACTIVITIES: | ||||||||||||
| Net increase in deposits | 17,106 | 63,699 | 20,455 | |||||||||
| Net change in short-term borrowings | 45,800 | (21,737 | ) | 16,949 | ||||||||
| Repayment of long-term debt | (21,650 | ) | (66,620 | ) | (88,748 | ) | ||||||
| Proceeds from long-term debt | 5,142 | 32,139 | 118,735 | |||||||||
| Return of dividends issued in connection with equity incentive plan | 121 | — | — | |||||||||
| Tender offer to purchase outstanding options | — | (2,151 | ) | — | ||||||||
| Excess tax expense in connection with tender offer completion | — | (566 | ) | — | ||||||||
| Cash dividends paid | (3,832 | ) | (5,872 | ) | (10,721 | ) | ||||||
| Common stock repurchased | (10,518 | ) | (20,093 | ) | (32,083 | ) | ||||||
| Issuance of common stock in connection with stock option exercises | — | — | 1,041 | |||||||||
| Excess tax shortfall in connection with equity incentive plan | (1 | ) | (1 | ) | (96 | ) | ||||||
| Excess tax benefits in connection with stock option exercises | — | — | 240 | |||||||||
| Net cash provided by (used in) financing activities | 32,168 | (21,202 | ) | 25,772 | ||||||||
| NET CHANGE IN CASH AND CASH EQUIVALENTS: | (957 | ) | 7,981 | (9,344 | ) | |||||||
| Beginning of year | 19,742 | 11,761 | 21,105 | |||||||||
| End of year | $ | 18,785 | $ | 19,742 | $ | 11,761 | ||||||
| Supplemental cashflow information: | ||||||||||||
| Securities reclassified from available-for-sale to held-to-maturity | $ | — | $ | 299,203 | $ | — | ||||||
| Securities reclassified to loan portfolio | 606 | — | — | |||||||||
| Net cash due to (from) broker for investment purchases | — | — | (11 | ) | ||||||||
| Net cash due to (from) broker for common stock repurchased | — | 299 | (352 | ) | ||||||||
See the accompanying notes to consolidated financial statements
| F-6 |
WESTFIELD FINANCIAL, INC. AND SUBSIDIARIES
NOTES TO CONSOLIDATED FINANCIAL STATEMENTS
YEARS ENDED DECEMBER 31, 2014, 2013 AND 2012
1. SUMMARY OF SIGNIFICANT ACCOUNTING POLICIES
Nature of Operations and Basis of Presentation - Westfield Financial, Inc. (“Westfield Financial,” the “Company,” “we” or “us”) is a Massachusetts-chartered stock holding company for Westfield Bank, a federally chartered stock savings bank (the “Bank”).
The Bank’s deposits are insured to the limits specified by the Federal Deposit Insurance Corporation (“FDIC”). The Bank operates 13 banking offices in western Massachusetts and Granby and Enfield, Connecticut, and its primary sources of revenue are income from securities and earnings on loans to small and middle-market businesses and to residential property homeowners.
Elm Street Securities Corporation and WFD Securities Corporation, Massachusetts-chartered security corporations, were formed by Westfield Financial for the primary purpose of holding qualified securities. WB Real Estate Holdings, LLC, a Massachusetts-chartered limited liability company was formed for the primary purpose of holding real property acquired as security for debts previously contracted by the Bank.
Principles of Consolidation - The consolidated financial statements include the accounts of Westfield Financial, the Bank, Elm Street Securities Corporation, WB Real Estate Holdings and WFD Securities Corporation. All material intercompany balances and transactions have been eliminated in consolidation.
Estimates - The preparation of consolidated financial statements in conformity with accounting principles generally accepted in the United States of America (“U.S. GAAP”) requires management to make estimates and assumptions that affect the reported amounts of assets and liabilities and disclosure of contingent assets and liabilities at the date of the consolidated financial statements and the reported amounts of income and expenses for each. Actual results could differ from those estimates. Estimates that are particularly susceptible to significant change in the near-term relate to the determination of the allowance for loan losses, other-than-temporary impairment of securities and the valuation of deferred tax assets.
Reclassifications – Amounts in the prior year financial statements are reclassified when necessary to conform to the current year presentation.
Cash and Cash Equivalents - We define cash on hand, cash due from banks, federal funds sold and interest-bearing deposits having an original maturity of 90 days or less as cash and cash equivalents. We are required to maintain a reserve balance with Bankers Bank Northeast (“BBN”) as part of our coin and currency contract and line of credit with BBN. The required reserve amounted to $690,000 at December 31, 2014 and $975,000 at December 31, 2013. There were no cash reserve requirements for the Federal Reserve Bank of Boston at December 31, 2014 or 2013.
Securities and Mortgage-Backed Securities - Debt securities, including mortgage-backed securities, which management has the positive intent and ability to hold until maturity are classified as held to maturity and are carried at amortized cost. Securities, including mortgage-backed securities, which have been identified as assets for which there is not a positive intent to hold to maturity are classified as available for sale and are carried at fair value with unrealized gains and losses, net of income taxes, reported as a separate component of comprehensive income/loss. We do not acquire securities and mortgage-backed securities for purposes of engaging in trading activities.
Realized gains and losses on sales of securities and mortgage-backed securities are computed using the specific identification method and are included in noninterest income on the trade date. The amortization of premiums and accretion of discounts is determined by using the level yield method to the maturity date.
| F-7 |
Derivatives - We enter into interest rate swap agreements as part of our interest-rate risk management strategy for certain assets and liabilities and not for speculative purposes. Based on our intended use for interest rate swaps, these are hedging instruments subject to hedge accounting provisions. Cash flow hedges are recorded at fair value in other assets or liabilities within our balance sheets. Changes in the fair value of these cash flow hedges are initially recorded in accumulated other comprehensive income (loss) and subsequently reclassified into earnings when the forecasted transaction affects earnings. Any hedge ineffectiveness assessed as part of our quarterly analysis is recorded directly to earnings. We would discontinue hedge accounting if the derivative was not expected to be or ceased to be highly effective as a hedge, and record changes in fair value of the derivative in earnings upon termination of the hedge relationship.
Other-than-Temporary Impairment of Securities - On a quarterly basis, we review securities with a decline in fair value below the amortized cost of the investment to determine whether the decline in fair value is temporary or other-than-temporary. Declines in the fair value of marketable equity securities below their cost that are deemed to be other-than-temporary based on the severity and duration of the impairment are reflected in earnings as realized losses. In estimating other-than-temporary impairment losses for securities, impairment is required to be recognized if (1) we intend to sell the security; (2) it is “more likely than not” that we will be required to sell the security before recovery of its amortized cost basis; or (3) for debt securities, the present value of expected cash flows is not sufficient to recover the entire amortized cost basis. For all impaired debt securities that we intend to sell, or more likely than not will be required to sell, the full amount of the other-than-temporary impairment is recognized through earnings. For all other impaired debt securities, credit-related other-than-temporary impairment is recognized through earnings, while non-credit related other-than-temporary impairment is recognized in other comprehensive income/loss, net of applicable taxes.
Fair Value Hierarchy - We group our assets and liabilities generally measured at fair value in three levels, based on the markets in which the assets and liabilities are traded and the reliability of the assumptions used to determine fair value.
Level 1 – Valuation is based on quoted prices in active markets for identical assets. Level 1 assets generally include debt and equity securities that are traded in an active exchange market. Valuations are obtained from readily available pricing sources for market transactions involving identical assets.
Level 2 – Valuation is based on observable inputs other than Level 1 prices, such as quoted prices for similar assets and liabilities; quoted prices in markets that are not active; or other inputs that are observable or can be corroborated by observable market data for substantially the full term of the assets and liabilities.
Level 3 – Valuation is based on unobservable inputs that are supported by little or no market activity and that are significant to the fair value of the assets and liabilities. Level 3 assets include financial instruments whose value is determined using pricing models, discounted cash flow methodologies, or similar techniques, as well as instruments for which the determination of fair value requires significant management judgment or estimation.
Transfers between levels are recognized at the end of a reporting period, if applicable.
Federal Home Loan Bank of Boston Stock - The Bank, as a member of the Federal Home Loan Bank of Boston (“FHLBB”) system, is required to maintain an investment in capital stock of the FHLBB. Based on the redemption provisions of the FHLBB, the stock has no quoted market value and is carried at cost. At its discretion, the FHLBB may declare dividends on the stock. Management reviews for impairment based on the ultimate recoverability of the cost basis in the FHLBB stock. As of December 31, 2014, no impairment has been recognized.
Loans - Loans are recorded at the principal amount outstanding, adjusted for charge-offs, unearned premiums and deferred loan fees and costs. Interest on loans is calculated using the effective yield method on daily balances of the principal amount outstanding and is credited to income on the accrual basis to the extent it is deemed collectible. Our general policy is to discontinue the accrual of interest when principal or interest payments are delinquent 90 days or more based on the contractual terms of the loan, or earlier if the loan is considered impaired. Any unpaid amounts previously accrued on these loans are reversed from income. Subsequent cash receipts are applied to the outstanding principal balance or to interest income if, in the judgment of management, collection of the principal balance is not in question. Loans are returned to accrual status when they become current as to both principal and interest and when subsequent performance reduces the concern as to the collectability of principal and interest. Loan fees, discounts and premiums on purchased loans, and certain direct loan origination costs are deferred and the net fee or cost is recognized as an adjustment to interest income over the estimated average lives of the related loans.
| F-8 |
Allowance for Loan Losses - The allowance for loan losses is established through provisions for loan losses charged to expense. Loans are charged-off against the allowance when management believes that the collectability of the principal is unlikely. Subsequent recoveries, if any, are credited to the allowance.
The allowance for loan losses is evaluated on a regular basis by management. This evaluation is inherently subjective as it requires estimates that are susceptible to significant revision as more information becomes available. The allowance consists of general, allocated and unallocated components, as further described below.
General component
The general component of the allowance for loan losses is based on historical loss experience adjusted for qualitative factors stratified by the following loan segments: residential real estate, commercial real estate, commercial and industrial, and consumer. Residential real estate loans include classes for residential and home equity. Management uses a rolling average of historical losses based on a time frame appropriate to capture relevant loss data for each loan segment. This historical loss factor is adjusted for the following qualitative factors: trends in delinquencies and nonperforming loans; trends in volume and terms of loans; internal credit ratings; effects of changes in risk selection; underwriting standards and other changes in lending policies, procedures and practices; and national and local economic trends and industry conditions. There were no changes in our policies or methodology pertaining to the general component of the allowance for loan losses during 2014, 2013 and 2012.
The qualitative factors are determined based on the various risk characteristics of each loan segment. Risk characteristics relevant to each portfolio segment are as follows:
Residential real estate – We require private mortgage insurance for all loans originated with a loan-to-value ratio greater than 80 percent and do not grant subprime loans. All loans in this segment are collateralized by owner-occupied residential real estate and repayment is dependent on the credit quality of the individual borrower. The overall health of the economy, including unemployment rates and housing prices, will have an effect on the credit quality in this segment.
Commercial real estate – Loans in this segment are primarily income-producing investment properties and owner occupied commercial properties throughout New England. The underlying cash flows generated by the properties or operations can be adversely impacted by a downturn in the economy due to increased vacancy rates or diminished cash flows, which in turn, would have an effect on the credit quality in this segment. Management obtains financial information annually and continually monitors the cash flows of these loans.
Commercial and industrial loans – Loans in this segment are made to businesses and are generally secured by assets of the business. Repayment is expected from the cash flows of the business. A weakened economy, decreased consumer spending, changes in technology and government spending are examples of what will have an effect on the credit quality in this segment.
Consumer loans – Loans in this segment are both secured and unsecured and repayment is dependent on the credit quality of the individual borrower.
Allocated component
The allocated component relates to loans that are classified as impaired. Impaired loans are identified by analysis of loan performance, internal credit ratings and watch list loans that management believes are subject to a higher risk of loss. Impairment is measured on a loan by loan basis for commercial real estate and commercial and industrial loans by either the present value of expected future cash flows discounted at the loan’s effective interest rate or the fair value of the collateral if the loan is collateral dependent. An allowance is established when the discounted cash flows (or collateral value) of the impaired loan is lower than the carrying value of that loan. Large groups of smaller balance homogeneous loans are collectively evaluated for impairment. Accordingly, we do not separately identify individual consumer and residential real estate loans for impairment disclosures, unless such loans are subject to a troubled debt restructuring agreement.
| F-9 |
A loan is considered impaired when, based on current information and events, it is probable that we will be unable to collect all of the principal or interest when due according to the contractual terms of the loan agreement. Factors considered by management in determining impairment include payment status, collateral value, and the probability of collecting scheduled principal and interest payments when due. Loans that experience insignificant payment delays and payment shortfalls generally are not classified as impaired. We determine the significance of payment delays and payment shortfalls on a case-by-case basis, taking into consideration all of the circumstances surrounding the loan and the borrower, including the length of the delay, the reasons for the delay, the borrower’s prior payment record, and the amount of the shortfall in relation to the principal and interest owed.
We may periodically agree to modify the contractual terms of loans. When a loan is modified and a concession is made to a borrower experiencing financial difficulty, the modification is considered a troubled debt restructuring (“TDR”). All TDRs are initially classified as impaired.
While we use our best judgment and information available, the ultimate appropriateness of the allowance is dependent upon a variety of factors beyond our control, including the performance of our loan portfolio, the economy, changes in interest rates and the view of the regulatory authorities toward loan classifications.
We also maintain a reserve for unfunded credit commitments to provide for the risk of loss inherent in these arrangements. This reserve is determined using a methodology similar to the analysis of the allowance for loan losses, taking into consideration probabilities of future funding requirements. This reserve for unfunded commitments is included in other liabilities and was $60,000 at December 31, 2014 and 2013.
Unallocated component
An unallocated component may be maintained to cover uncertainties that could affect management’s estimate of probable losses. The unallocated component of the allowance reflects the margin of imprecision inherent in the underlying assumptions used in the methodologies for estimating allocated and general reserves in the portfolio.
Bank-owned Life Insurance – Bank-owned life insurance policies are reflected on the consolidated balance sheets at cash surrender value. Changes in the net cash surrender value of the policies, as well as insurance proceeds received, are reflected in noninterest income on the consolidated statements of income and are not subject to income taxes.
Transfers and Servicing of Financial Assets – Transfers of financial assets are accounted for as sales, when control over the assets has been surrendered. Control over transferred assets is deemed to be surrendered when (1) the assets have been isolated from us, (2) the transferee obtains the right (free of conditions that constrain it from taking advantage of that right) to pledge or exchange the transferred assets, and (3) we do not maintain effective control over the transferred assets through an agreement to repurchase them before their maturity.
Premises and Equipment – Land is carried at cost. Buildings, furniture and equipment are stated at cost, less accumulated depreciation and amortization, computed on the straight-line method over the estimated useful lives of the assets, or the expected lease term, if shorter. Expected terms include lease option periods to the extent that the exercise of such options is reasonably assured. The estimated useful lives of the assets are as follows:
| Years | ||||
| Buildings | 39 | |||
| Leasehold Improvements | 5-20 | |||
| Furniture and Equipment | 3-7 | |||
The cost of maintenance and repairs is charged to expense when incurred. Major expenditures for betterments are capitalized and depreciated.
| F-10 |
Other Real Estate Owned - Other real estate owned (“OREO”) represents property acquired through foreclosure or deeded to us in lieu of foreclosure. OREO is initially recorded at the estimated fair value of the real estate acquired, net of estimated selling costs, establishing a new cost basis. Initial write-downs are charged to the allowance for loan losses at the time the loan is transferred to OREO. Subsequent valuations are periodically performed by management and the carrying value is adjusted by a charge to expense to reflect any subsequent declines in the estimated fair value. Operating costs associated with OREO are expensed as incurred.
Retirement Plans and Employee Benefits - We provide a defined benefit pension plan for eligible employees in conjunction with a third-party provider. The compensation cost of an employee’s pension benefit is recognized on the projected unit credit method over the employee’s approximate service period. The aggregate cost method is utilized for funding purposes. Employees are also eligible to participate in a 401(k) plan through third-party provider. We make matching contributions to this plan at 50% of up to 6% of the employees’ eligible compensation.
We currently offer postretirement life insurance benefits to retired employees. Such postretirement benefits represent a form of deferred compensation which requires that the cost and obligations of such benefits are recognized in the period in which services are rendered.
Share-based Compensation Plans – We measure and recognize compensation cost relating to share-based payment transactions based on the grant-date fair value of the equity instruments issued. Share-based compensation is recognized over the period the employee is required to provide services for the award. Reductions in compensation expense associated with forfeited options are estimated at the date of grant, and this estimated forfeiture rate is adjusted based on actual forfeiture experience. We use a binomial option-pricing model to determine the fair value of the stock options granted.
Employee Stock Ownership Plan – Compensation expense for the Employee Stock Ownership Plan (“ESOP”) is recorded at an amount equal to the shares allocated by the ESOP multiplied by the average fair market value of the shares during the period. We recognize compensation expense ratably over the year based upon our estimate of the number of shares expected to be allocated by the ESOP. Unearned compensation applicable to the ESOP is reflected as a reduction of shareholders’ equity in the consolidated balance sheets. The difference between the average fair market value and the cost of the shares allocated by the ESOP is recorded as an adjustment to additional paid-in capital.
Advertising Costs – Advertising costs are expensed as incurred.
Income Taxes - We use the asset and liability method for income tax accounting, whereby, deferred tax assets and liabilities are recognized for the future tax consequences attributable to differences between the financial statement carrying amounts of existing assets and liabilities and their respective tax bases. Deferred tax assets and liabilities are measured using enacted tax rates applied to taxable income in the years in which those temporary differences are expected to be recovered or settled. The effect on deferred tax assets and liabilities of a change in tax rates is recognized in income in the period that includes the enactment date. A valuation allowance related to deferred tax assets is established when, in the judgment of management, it is more likely than not that all or a portion of such deferred tax assets will not be realized based on the available evidence including historical and projected taxable income. We do not have any uncertain tax positions at December 31, 2014 which require accrual or disclosure. We record interest and penalties as part of income tax expense.
Earnings per Share – Basic earnings per share represents income available to common shareholders divided by the weighted-average number of common shares outstanding during the period. If rights to dividends or unvested awards are non-forfeitable, these unvested awards are considered outstanding in the computation of basic earnings per share. Diluted earnings per share reflect additional common shares that would have been outstanding if dilutive potential common shares had been issued, as well as any adjustment to income that would result from the assumed issuance. Potential common shares that may be issued by us relate solely to stock options and are determined using the treasury stock method. Unallocated ESOP shares are not deemed outstanding for earnings per share calculations.
| F-11 |
Earnings per common share have been computed based on the following:
| Years Ended December 31, | ||||||||||||
| 2014 | 2013 | 2012 | ||||||||||
| (In thousands, except per share data) | ||||||||||||
| Net income applicable to common stock | $ | 6,162 | $ | 6,756 | $ | 6,254 | ||||||
| Average number of common shares issued | 19,274 | 21,254 | 25,763 | |||||||||
| Less: Average unallocated ESOP Shares | (1,090 | ) | (1,171 | ) | (1,254 | ) | ||||||
| Less: Average ungranted equity incentive plan shares | — | (4 | ) | (7 | ) | |||||||
| Average number of common shares outstanding used to calculate basic earnings per common share | 18,184 | 20,079 | 24,502 | |||||||||
| Effect of dilutive stock options | — | — | 18 | |||||||||
| Average number of common shares outstanding used to calculate diluted earnings per common share | 18,184 | 20,079 | 24,520 | |||||||||
| Basic earnings per share | $ | 0.34 | $ | 0.34 | $ | 0.26 | ||||||
| Diluted earnings per share | $ | 0.34 | $ | 0.34 | $ | 0.26 | ||||||
| Antidilutive shares (1) | — | 833 | 1,666 | |||||||||
____________________
| (1) | Options outstanding but not included in the computation of earnings per share because they were anti-dilutive, meaning the exercise price of such options exceeded the market value of the Company’s common stock. At December 31, 2014, there were no stock options outstanding. |
| F-12 |
Comprehensive Income (Loss)
Accounting principles generally require that recognized revenue, expenses, gains and losses be included in net income. Although certain changes in assets and liabilities are reported as a separate component of the equity section of the balance sheet, such items, along with net income, are components of comprehensive income (loss).
The components of accumulated other comprehensive loss, included in shareholders’ equity, are as follows:
| December 31, 2014 | December 31, 2013 | |||||||
| (In thousands) | ||||||||
| Net unrealized gains (losses) on securities available for sale | $ | 668 | $ | (2,410 | ) | |||
| Tax effect | (226 | ) | 837 | |||||
| Net-of-tax amount | 442 | (1,573 | ) | |||||
| Net unamortized losses on securities transferred from available-for-sale to held-to-maturity | (1,787 | ) | (1,732 | ) | ||||
| Tax effect | 617 | 599 | ||||||
| Net-of-tax amount | (1,170 | ) | (1,133 | ) | ||||
| Fair value of derivatives used for cash flow hedges | (5,739 | ) | 1,755 | |||||
| Tax effect | 1,951 | (597 | ) | |||||
| Net-of-tax amount | (3,788 | ) | 1,158 | |||||
| Unrecognized transition asset pertaining to defined benefit plan | — | 10 | ||||||
| Unrecognized deferred loss pertaining to defined benefit plan | (4,484 | ) | (2,172 | ) | ||||
| Net adjustments pertaining to defined benefit plans | (4,484 | ) | (2,162 | ) | ||||
| Tax effect | 1,525 | 735 | ||||||
| Net-of-tax amount | (2,959 | ) | (1,427 | ) | ||||
| Accumulated other comprehensive loss | $ | (7,475 | ) | $ | (2,975 | ) | ||
The following table presents changes in accumulated other comprehensive loss for the years ended December 31, 2014 and 2013 by component:
| Securities | Derivatives | Defined Benefit Pension Plans | Accumulated Other Comprehensive Loss | |||||||||||||
| (In thousands) | ||||||||||||||||
| Balance at December 31, 2012 | $ | 13,253 | $ | — | $ | (2,558 | ) | $ | 10,695 | |||||||
| Current-period other comprehensive (loss) income | (15,959 | ) | 1,158 | 1,131 | (13,670 | ) | ||||||||||
| Balance at December 31, 2013 | $ | (2,706 | ) | $ | 1,158 | $ | (1,427 | ) | $ | (2,975 | ) | |||||
| Balance at December 31, 2013 | $ | (2,706 | ) | $ | 1,158 | $ | (1,427 | ) | $ | (2,975 | ) | |||||
| Current-period other comprehensive (loss) income | 1,978 | (4,946 | ) | (1,532 | ) | (4,500 | ) | |||||||||
| Balance at December 31, 2014 | $ | (728 | ) | $ | (3,788 | ) | $ | (2,959 | ) | $ | (7,475 | ) | ||||
With regard to defined benefit plans, an actuarial loss of $118,000 is expected to be recognized as a component of net periodic pension cost for the year ending December 31, 2015. There is no amortization of a transition asset expected to be recognized as a component of net periodic pension cost for the year ending December 31, 2015.
| F-13 |
Recent Accounting Pronouncements
In January 2014, FASB issued ASU 2014-04, Receivables - Troubled Debt Restructurings by Creditors (Subtopic 310-40): “Reclassification of Residential Real Estate Collateralized Consumer Mortgage Loans Upon Foreclosure.” This ASU clarifies that an in substance repossession or foreclosure occurs, and a creditor is considered to have received physical possession of residential real estate property collateralizing a consumer mortgage loan, upon either (i) the creditor obtaining legal title to the residential real estate property upon completion of a foreclosure or (ii) the borrower conveying all interest in the residential real estate property to the creditor to satisfy that loan through completion of a deed in lieu of foreclosure or through a similar agreement. In addition, the amendments require disclosure of both the amount of foreclosed residential real estate property held by the creditor and the recorded investment in consumer mortgage loans collateralized by residential real estate property that are in the process of foreclosure in accordance with local requirements of the applicable jurisdiction. An entity can elect to adopt the amendments using either a modified retrospective method or a prospective transition method. The amendments in this update are effective for annual periods, and interim periods within those annual periods, beginning after December 15, 2014. We do not expect the application of this guidance to have a material impact on our consolidated financial statements.
In May 2014, the FASB issued ASU 2014-09, Revenue from Contracts with Customers (Topic 606). The amendments in this Update create Topic 606, Revenue from Contracts with Customers, and supersede the revenue recognition requirements in Topic 605, Revenue Recognition, including most industry-specific revenue recognition guidance throughout the Industry Topics of the Codification. The core principle of Topic 606 is that an entity recognizes revenue to depict the transfer of promised goods or services to customers in an amount that reflects the consideration to which the entity expects to be entitled in exchange for those goods or services. This ASU is effective for annual reporting periods, including interim periods, beginning after December 15, 2016. Early application is not permitted. Management is currently evaluating the impact to the consolidated financial statements of adopting this Update.
In August 2014, the FASB issued ASU 2014-14, Receivables-Troubled Debt Restructuring by Creditors (Subtopic 310-40) “Classification of Certain Government-Guaranteed Residential Mortgage Loans upon Foreclosure.” This Update clarifies the accounting classification of foreclosed mortgage loans that are fully or partially guaranteed by the Federal Housing Administration and the Department of Veterans Affairs. The amendments in this Update are effective for annual periods, and interim periods within those annual periods, beginning after December 15, 2014. We do not expect the application of this guidance to have a material impact on our consolidated financial statements.
| F-14 |
2. SECURITIES
Securities available for sale are summarized as follows:
| December 31, 2014 | ||||||||||||||||
| Amortized Cost | Gross Unrealized Gains | Gross Unrealized Losses | Fair Value | |||||||||||||
| (In thousands) | ||||||||||||||||
| Available for sale securities: | ||||||||||||||||
| Government-sponsored mortgage-backed securities | $ | 139,637 | $ | 423 | $ | (847 | ) | $ | 139,213 | |||||||
| U.S. Government guaranteed mortgage-backed securities | 1,591 | 7 | (12 | ) | 1,586 | |||||||||||
| Corporate bonds | 25,711 | 532 | (20 | ) | 26,223 | |||||||||||
| State and municipal bonds | 16,472 | 562 | — | 17,034 | ||||||||||||
| Government-sponsored enterprise obligations | 24,066 | 69 | (156 | ) | 23,979 | |||||||||||
| Mutual funds | 6,296 | 8 | (128 | ) | 6,176 | |||||||||||
| Common and preferred stock | 1,309 | 230 | — | 1,539 | ||||||||||||
| Total available for sale securities | 215,082 | 1,831 | (1,163 | ) | 215,750 | |||||||||||
| Held to maturity securities: | ||||||||||||||||
| Government-sponsored mortgage-backed securities | 164,001 | 2,384 | (1,453 | ) | 164,932 | |||||||||||
| U.S. Government guaranteed mortgage-backed securities | 38,566 | 34 | (607 | ) | 37,993 | |||||||||||
| Corporate bonds | 24,751 | 76 | (248 | ) | 24,579 | |||||||||||
| State and municipal bonds | 7,285 | 59 | (94 | ) | 7,250 | |||||||||||
| Government-sponsored enterprise obligations | 43,477 | 257 | (852 | ) | 42,882 | |||||||||||
| Total held to maturity securities | 278,080 | 2,810 | (3,254 | ) | 277,636 | |||||||||||
| Total | $ | 493,162 | $ | 4,641 | $ | (4,417 | ) | $ | 493,386 | |||||||
| December 31, 2013 | ||||||||||||||||
| Amortized Cost | Gross Unrealized Gains | Gross Unrealized Losses | Fair Value | |||||||||||||
| (In thousands) | ||||||||||||||||
| Available for sale securities: | ||||||||||||||||
| Government-sponsored mortgage-backed securities | $ | 135,981 | $ | 419 | $ | (4,028 | ) | $ | 132,372 | |||||||
| U.S. Government guaranteed mortgage-backed securities | 46,225 | 240 | (137 | ) | 46,328 | |||||||||||
| Corporate bonds | 26,716 | 766 | (93 | ) | 27,389 | |||||||||||
| State and municipal bonds | 18,240 | 659 | (2 | ) | 18,897 | |||||||||||
| Government-sponsored enterprise obligations | 10,992 | 18 | (310 | ) | 10,700 | |||||||||||
| Mutual funds | 6,150 | 8 | (239 | ) | 5,919 | |||||||||||
| Common and preferred stock | 1,310 | 289 | — | 1,599 | ||||||||||||
| Total available for sale securities | 245,614 | 2,399 | (4,809 | ) | 243,204 | |||||||||||
| Held to maturity securities: | ||||||||||||||||
| Government-sponsored mortgage-backed securities | 176,986 | — | (6,819 | ) | 170,167 | |||||||||||
| U.S. Government guaranteed mortgage-backed securities | 39,705 | — | (1,391 | ) | 38,314 | |||||||||||
| Corporate bonds | 27,566 | 30 | (567 | ) | 27,029 | |||||||||||
| State and municipal bonds | 7,351 | 5 | (345 | ) | 7,011 | |||||||||||
| Government-sponsored enterprise obligations | 43,405 | — | (3,371 | ) | 40,034 | |||||||||||
| Total held to maturity securities | 295,013 | 35 | (12,493 | ) | 282,555 | |||||||||||
| Total | $ | 540,627 | $ | 2,434 | $ | (17,302 | ) | $ | 525,759 | |||||||
| F-15 |
Our repurchase agreements and FHLBB advances are collateralized by government-sponsored enterprise obligations and certain mortgage-backed securities (see Notes 6 and 7).
The amortized cost and fair value of securities at December 31, 2014, by final maturity, are shown below. Actual maturities may differ from contractual maturities because certain issuers have the right to call or repay obligations.
| December 31, 2014 | ||||||||||||||||
| Securities | Securities | |||||||||||||||
| Available for Sale | Held to Maturity | |||||||||||||||
| Amortized Cost | Fair Value | Amortized Cost | Fair Value | |||||||||||||
| (In thousands) | ||||||||||||||||
| Mortgage-backed securities: | ||||||||||||||||
| Due after one year through five years | $ | 10,083 | $ | 10,132 | $ | — | $ | — | ||||||||
| Due after five years through ten years | 23,140 | 22,789 | 46,091 | 45,255 | ||||||||||||
| Due after ten years | 108,005 | 107,878 | 156,476 | 157,670 | ||||||||||||
| Total | $ | 141,228 | $ | 140,799 | $ | 202,567 | $ | 202,925 | ||||||||
| Debt securities: | ||||||||||||||||
| Due in one year or less | $ | 2,742 | $ | 2,759 | $ | 381 | $ | 382 | ||||||||
| Due after one year through five years | 49,824 | 50,381 | 20,030 | 19,784 | ||||||||||||
| Due after five years through ten years | 13,497 | 13,890 | 40,435 | 40,048 | ||||||||||||
| Due after ten years | 186 | 206 | 14,667 | 14,497 | ||||||||||||
| Total | $ | 66,249 | $ | 67,236 | $ | 75,513 | $ | 74,711 | ||||||||
Gross realized gains and losses on sales of securities for the years ended December 31, 2014, 2013 and 2012 are as follows:
| Years Ended December 31, | ||||||||||||
| 2014 | 2013 | 2012 | ||||||||||
| (In thousands) | ||||||||||||
| Gross gains realized | $ | 801 | $ | 3,978 | $ | 4,068 | ||||||
| Gross losses realized | (481 | ) | (852 | ) | (1,161 | ) | ||||||
| Net gain realized | $ | 320 | $ | 3,126 | $ | 2,907 | ||||||
Proceeds from the sales of securities available for sale amounted to $71.7 million, $206.8 million and $288.1 million for the years ended December 31, 2014, 2013 and 2012, respectively.
The tax provisions applicable to net realized gains and losses were $109,000, $1.1 million and $1.0 million for the years ended December 31, 2014, 2013 and 2012, respectively.
| F-16 |
Information pertaining to securities with gross unrealized losses at December 31, 2014 and 2013 aggregated by investment category and length of time that individual securities have been in a continuous loss position, follows:
| December 31, 2014 | ||||||||||||||||
| Less Than 12 Months | Over 12 Months | |||||||||||||||
| Gross Unrealized Losses | Fair Value | Gross Unrealized Losses | Fair Value | |||||||||||||
| (In thousands) | ||||||||||||||||
| Available for sale: | ||||||||||||||||
| Government-sponsored mortgage-backed securities | $ | 47 | $ | 20,637 | $ | 800 | $ | 56,830 | ||||||||
| U.S. Government guaranteed mortgage-backed securities | — | — | 12 | 677 | ||||||||||||
| Corporate bonds | 17 | 4,438 | 3 | 1,497 | ||||||||||||
| Government-sponsored enterprise obligations | 52 | 9,189 | 104 | 7,396 | ||||||||||||
| Mutual funds | — | — | 128 | 5,103 | ||||||||||||
| Total available for sale | 116 | 34,264 | 1,047 | 71,503 | ||||||||||||
| Held to maturity: | ||||||||||||||||
| Government-sponsored mortgage-backed securities | 200 | 10,292 | 1,253 | 65,526 | ||||||||||||
| U.S. Government guaranteed mortgage-backed securities | — | — | 607 | 31,951 | ||||||||||||
| Corporate bonds | 128 | 5,684 | 120 | 13,918 | ||||||||||||
| State and municipal bonds | — | — | 94 | 4,853 | ||||||||||||
| Government-sponsored enterprise obligations | — | — | 852 | 33,224 | ||||||||||||
| Total held to maturity | 328 | 15,976 | 2,926 | 149,472 | ||||||||||||
| Total | $ | 444 | $ | 50,240 | $ | 3,973 | $ | 220,975 | ||||||||
| December 31, 2013 | ||||||||||||||||
| Less Than 12 Months | Over 12 Months | |||||||||||||||
| Gross Unrealized Losses | Fair Value | Gross Unrealized Losses | Fair Value | |||||||||||||
| (In thousands) | ||||||||||||||||
| Available for sale: | ||||||||||||||||
| Government-sponsored mortgage-backed securities | $ | 3,717 | $ | 118,846 | $ | 311 | $ | 2,761 | ||||||||
| U.S. Government guaranteed mortgage-backed securities | 137 | 15,045 | — | — | ||||||||||||
| Corporate bonds | 93 | 4,659 | — | — | ||||||||||||
| State and municipal bonds | 2 | 256 | — | — | ||||||||||||
| Government-sponsored enterprise obligations | 310 | 7,189 | — | — | ||||||||||||
| Mutual funds | 84 | 3,205 | 155 | 1,656 | ||||||||||||
| Total available for sale | 4,343 | 149,200 | 466 | 4,417 | ||||||||||||
| Held to maturity: | ||||||||||||||||
| Government-sponsored mortgage-backed securities | 5,866 | 145,438 | 953 | 24,729 | ||||||||||||
| U.S. Government guaranteed mortgage-backed securities | 1,391 | 38,314 | — | — | ||||||||||||
| Corporate bonds | 567 | 22,059 | — | — | ||||||||||||
| State and municipal bonds | 345 | 5,852 | — | — | ||||||||||||
| Government-sponsored enterprise obligations | 3,330 | 38,228 | 41 | 1,806 | ||||||||||||
| Total held to maturity | 11,499 | 249,891 | 994 | 26,535 | ||||||||||||
| Total | $ | 15,842 | $ | 399,091 | $ | 1,460 | $ | 30,952 | ||||||||
| F-17 |
| December 31, 2014 | ||||||||||||||||||||||||||||||||
| Less Than 12 Months | Over 12 Months | |||||||||||||||||||||||||||||||
| Number of Securities | Amortized Cost Basis | Gross Unrealized Losses | Depreciation from Amortized Cost Basis (%) | Number of Securities | Amortized Cost Basis | Gross Unrealized Losses | Depreciation from Amortized Cost Basis (%) | |||||||||||||||||||||||||
| (Dollars in thousands) | ||||||||||||||||||||||||||||||||
| Government-sponsored mortgage-backed securities | 13 | $ | 31,176 | $ | 247 | 0.8 | % | 31 | $ | 124,409 | $ | 2,053 | 1.7 | % | ||||||||||||||||||
| U.S. Government guaranteed mortgage-backed securities | — | — | — | — | 5 | 33,247 | 619 | 1.9 | ||||||||||||||||||||||||
| Corporate Bonds | 5 | 10,267 | 145 | 1.4 | 5 | 15,538 | 123 | 0.8 | ||||||||||||||||||||||||
| State and municipal bonds | — | — | — | — | 9 | 4,947 | 94 | 1.9 | ||||||||||||||||||||||||
| Government-sponsored enterprise obligations | — | 9,241 | 52 | 0.6 | 9 | 41,576 | 956 | 2.3 | ||||||||||||||||||||||||
| Mutual funds | — | — | — | — | 2 | 5,231 | 128 | 2.4 | ||||||||||||||||||||||||
| Total | $ | 50,684 | $ | 444 | $ | 224,948 | $ | 3,973 | ||||||||||||||||||||||||
These unrealized losses are the result of changes in interest rates and not credit quality. Because we do not intend to sell the securities and it is more likely than not that we will not be required to sell the investments before recovery of their amortized cost bases, no declines are deemed to be other-than-temporary.
3. LOANS
| Loans consisted of the following amounts: | December 31, | |||||||
| 2014 | 2013 | |||||||
| (In thousands) | ||||||||
| Commercial real estate | $ | 278,405 | $ | 264,476 | ||||
| Residential real estate: | ||||||||
| Residential | 237,436 | 198,686 | ||||||
| Home equity | 40,305 | 35,371 | ||||||
| Commercial and industrial | 165,728 | 135,555 | ||||||
| Consumer | 1,542 | 2,572 | ||||||
| Total loans | 723,416 | 636,660 | ||||||
| Unearned premiums and deferred loan fees and costs, net | 1,270 | 767 | ||||||
| Allowance for loan losses | (7,948 | ) | (7,459 | ) | ||||
| $ | 716,738 | $ | 629,968 | |||||
During 2014 and 2013, we purchased residential real estate loans aggregating $53.3 million and $37.7 million, respectively. These purchased loans are subject to underwriting standards that are consistent with our originated loans and we consider the risk attributes to be similar to originated loans.
We have transferred a portion of our originated commercial real estate loans to participating lenders. The amounts transferred have been accounted for as sales and are therefore not included in our accompanying consolidated balance sheets. We share ratably with our participating lenders in any gains or losses that may result from a borrower’s lack of compliance with contractual terms of the loan. We continue to service the loans on behalf of the participating lenders and, as such, collect cash payments from the borrowers, remit payments (net of servicing fees) to participating lenders and disburse required escrow funds to relevant parties. At December 31, 2014 and 2013, we serviced loans for participants aggregating $20.5 million and $14.3 million, respectively.
Mortgage loans serviced for others are not included in the accompanying consolidated balance sheets. The unpaid balances of these loans totaled $1.1 million and $1.4 million at December 31, 2014 and 2013, respectively. Net service fee income of $4,000, $5,000 and $7,000 was recorded for the years ended December 31, 2014, 2013 and 2012, respectively, and is included in service charges and fees on the consolidated statements of income.
| F-18 |
An analysis of changes in the allowance for loan losses by segment for the years ended December 31, 2014, 2013 and 2012 is as follows:
| Commercial Real Estate | Residential Real Estate | Commercial and Industrial | Consumer | Unallocated | Total | |||||||||||||||||||
| (In thousands) | ||||||||||||||||||||||||
| Balance at December 31, 2011 | $ | 3,504 | $ | 1,531 | $ | 2,712 | $ | 17 | $ | — | $ | 7,764 | ||||||||||||
| Provision (credit) | 19 | 365 | (161 | ) | 13 | 462 | 698 | |||||||||||||||||
| Charge-offs | (195 | ) | (155 | ) | (391 | ) | (27 | ) | — | (768 | ) | |||||||||||||
| Recoveries | 78 | 5 | 7 | 10 | — | 100 | ||||||||||||||||||
| Balance at December 31, 2012 | $ | 3,406 | $ | 1,746 | $ | 2,167 | $ | 13 | $ | 462 | $ | 7,794 | ||||||||||||
| Provision (credit) | 9 | 40 | 148 | 11 | (464 | ) | (256 | ) | ||||||||||||||||
| Charge-offs | (20 | ) | (80 | ) | (208 | ) | (33 | ) | — | (341 | ) | |||||||||||||
| Recoveries | 155 | 1 | 84 | 22 | — | 262 | ||||||||||||||||||
| Balance at December 31, 2013 | $ | 3,550 | $ | 1,707 | $ | 2,191 | $ | 13 | $ | (2 | ) | $ | 7,459 | |||||||||||
| Provision | 505 | 376 | 649 | 42 | 3 | 1,575 | ||||||||||||||||||
| Charge-offs | (350 | ) | (31 | ) | (787 | ) | (55 | ) | — | (1,223 | ) | |||||||||||||
| Recoveries | — | 1 | 121 | 15 | — | 137 | ||||||||||||||||||
| Balance at December 31, 2014 | $ | 3,705 | $ | 2,053 | $ | 2,174 | $ | 15 | $ | 1 | $ | 7,948 | ||||||||||||
Further information pertaining to the allowance for loan losses by segment at December 31, 2014 and 2013 follows:
| Commercial Real Estate | Residential Real Estate | Commercial and Industrial | Consumer | Unallocated | Total | |||||||||||||||||||
| (In thousands) | ||||||||||||||||||||||||
| December 31, 2014 | ||||||||||||||||||||||||
| Amount of allowance for loans individually evaluated and deemed impaired | $ | — | $ | — | $ | — | $ | — | $ | — | $ | — | ||||||||||||
| Amount of allowance for loans collectively or individually evaluated and not deemed impaired | 3,705 | 2,053 | 2,174 | 15 | 1 | 7,948 | ||||||||||||||||||
| Total allowance for loan losses | 3,705 | 2,053 | 2,174 | 15 | 1 | 7,948 | ||||||||||||||||||
| Loans individually evaluated and deemed impaired | 3,104 | 291 | 4,436 | — | — | 7,831 | ||||||||||||||||||
| Loans collectively or individually evaluated and not deemed impaired | 275,301 | 277,450 | 161,292 | 1,542 | — | 715,585 | ||||||||||||||||||
| Total loans | $ | 278,405 | $ | 277,741 | $ | 165,728 | $ | 1,542 | $ | — | $ | 723,416 | ||||||||||||
| December 31, 2013 | ||||||||||||||||||||||||
| Amount of allowance for loans individually evaluated and deemed impaired | $ | 82 | $ | — | $ | 15 | $ | — | $ | — | $ | 97 | ||||||||||||
| Amount of allowance for loans collectively or individually evaluated and not deemed impaired | 3,467 | 1,707 | 2,177 | 13 | (2 | ) | 7,362 | |||||||||||||||||
| Total allowance for loan losses | 3,549 | 1,707 | 2,192 | 13 | (2 | ) | 7,459 | |||||||||||||||||
| Loans individually evaluated and deemed impaired | 14,962 | 234 | 1,352 | — | — | 16,548 | ||||||||||||||||||
| Loans collectively or individually evaluated and not deemed impaired | 249,514 | 233,823 | 134,203 | 2,572 | — | 620,112 | ||||||||||||||||||
| Total loans | $ | 264,476 | $ | 234,057 | $ | 135,555 | $ | 2,572 | $ | — | $ | 636,660 | ||||||||||||
| F-19 |
The following is a summary of past due and non-accrual loans by class at December 31, 2014 and 2013:
| 30 – 59 Days Past Due | 60 – 89 Days Past Due | Greater than 90 Days Past Due | Total Past Due | Past Due 90 Days or More and Still Accruing | Loans on Non-Accrual | |||||||||||||||||||
| (In thousands) | ||||||||||||||||||||||||
| December 31, 2014 | ||||||||||||||||||||||||
| Commercial real estate | $ | 3,003 | $ | — | $ | 529 | $ | 3,532 | $ | — | $ | 3,257 | ||||||||||||
| Residential real estate: | ||||||||||||||||||||||||
| Residential | 314 | 61 | 1,158 | 1,533 | — | 1,323 | ||||||||||||||||||
| Home equity | 252 | — | 1 | 253 | — | 1 | ||||||||||||||||||
| Commercial and industrial | 169 | — | 394 | 563 | — | 4,233 | ||||||||||||||||||
| Consumer | 22 | — | 3 | 25 | — | 16 | ||||||||||||||||||
| Total | $ | 3,760 | $ | 61 | $ | 2,085 | $ | 5,906 | $ | — | $ | 8,830 | ||||||||||||
| December 31, 2013 | ||||||||||||||||||||||||
| Commercial real estate | $ | 430 | $ | 146 | $ | 793 | $ | 1,369 | $ | — | $ | 1,449 | ||||||||||||
| Residential real estate: | ||||||||||||||||||||||||
| Residential | 1,004 | 325 | 311 | 1,640 | — | 712 | ||||||||||||||||||
| Home equity | 217 | — | 2 | 219 | — | 38 | ||||||||||||||||||
| Commercial and industrial | 516 | 780 | 140 | 1,436 | — | 386 | ||||||||||||||||||
| Consumer | 25 | 16 | 1 | 42 | — | 1 | ||||||||||||||||||
| Total | $ | 2,192 | $ | 1,267 | $ | 1,247 | $ | 4,706 | $ | — | $ | 2,586 | ||||||||||||
The following is a summary of impaired loans by class:
| Year Ended | ||||||||||||||||||||
| At December 31, 2014 | December 31, 2014 | |||||||||||||||||||
| Recorded Investment | Unpaid Principal Balance | Related Allowance | Average Recorded Investment | Interest Income Recognized | ||||||||||||||||
| (In thousands) | ||||||||||||||||||||
| Impaired loans without a valuation allowance: | ||||||||||||||||||||
| Commercial real estate | $ | 3,104 | $ | 3,662 | $ | — | $ | 2,267 | $ | — | ||||||||||
| Residential real estate | 291 | 407 | — | 223 | — | |||||||||||||||
| Commercial and industrial | 4,436 | 5,181 | — | 2,032 | — | |||||||||||||||
| Total | 7,831 | 9,250 | — | 4,522 | — | |||||||||||||||
| Impaired loans with a valuation allowance: | ||||||||||||||||||||
| Commercial real estate | — | — | — | 8,382 | 576 | |||||||||||||||
| Commercial and industrial | — | — | — | 600 | 41 | |||||||||||||||
| Total | — | — | — | 8,982 | 617 | |||||||||||||||
| Total impaired loans | $ | 7,831 | $ | 9,250 | $ | — | $ | 13,504 | $ | 617 | ||||||||||
| F-20 |
| Year Ended | ||||||||||||||||||||
| At December 31, 2013 | December 31, 2013 | |||||||||||||||||||
| Recorded Investment | Unpaid Principal Balance | Related Allowance | Average Recorded Investment | Interest Income Recognized | ||||||||||||||||
| (In thousands) | ||||||||||||||||||||
| Impaired loans without a valuation allowance: | ||||||||||||||||||||
| Commercial real estate | $ | 1,449 | $ | 1,756 | $ | — | $ | 1,502 | $ | — | ||||||||||
| Residential real estate | 234 | 306 | — | 248 | — | |||||||||||||||
| Commercial and industrial | 385 | 487 | — | 403 | — | |||||||||||||||
| Total | 2,068 | 2,549 | — | 2,153 | — | |||||||||||||||
| Impaired loans with a valuation allowance: | ||||||||||||||||||||
| Commercial real estate | 13,513 | 13,513 | 82 | 13,678 | 582 | |||||||||||||||
| Commercial and industrial | 967 | 967 | 15 | 979 | 42 | |||||||||||||||
| Total | 14,480 | 14,480 | 97 | 14,657 | 624 | |||||||||||||||
| Total impaired loans | $ | 16,548 | $ | 17,029 | $ | 97 | $ | 16,810 | $ | 624 | ||||||||||
No interest income was recognized for impaired loans on a cash-basis method during the years ended December 31, 2014 and 2013. Interest income recognized during the years ended December 31, 2014 and 2013 related to TDRs.
We may periodically agree to modify the contractual terms of loans. When a loan is modified and a concession is made to a borrower experiencing financial difficulty, the modification is considered a troubled debt restructuring (“TDR”). These concessions could include a reduction in the interest rate on the loan, payment extensions, postponement or forgiveness of principal, forbearance or other actions intended to maximize collection. All TDRs are initially classified as impaired.
When we modify loans in a TDR, we measure impairment similar to other impaired loans based on the present value of expected future cash flows, discounted at the contractual interest rate of the original loan agreement, or use the current fair value of the collateral, less selling costs for collateral dependent loans. If we determine that the value of the modified loan is less than the recorded investment in the loan (net of previous charge-offs, deferred loan fees or costs and unamortized premium or discount), impairment is recognized through an allowance estimate or a charge-off to the allowance. In periods subsequent to modification, we evaluate all TDRs, including those that have payment defaults, for possible impairment and recognize impairment through the allowance.
Loans modified in TDRs in 2014 and 2012 are included in the table below. There were no loans modified as TDRs in 2013. Prior to modification, the four loans listed below for 2014 had been paying interest only. Upon stabilization of the credits, the related loans were modified and placed on an amortization schedule with higher interest rates. During the third quarter of 2014, one loan relationship with a balance of $14.3 million previously restructured in March 2012 was removed from TDR status upon maturity of the existing loans. The new loans were granted under market conditions and are performing according to the terms of the loan agreements.
| Year Ended, | Year Ended | |||||||||||||||||||||||
| December 31, 2014 | December 31, 2012 | |||||||||||||||||||||||
| Number of Contracts | Pre-Modification Outstanding Recorded Investment | Post-Modification Outstanding Recorded Investment | Number of Contracts | Pre-Modification Outstanding Recorded Investment | Post-Modification Outstanding Recorded Investment | |||||||||||||||||||
| (Dollars in thousands) | (Dollars in thousands) | |||||||||||||||||||||||
| Troubled Debt Restructurings | ||||||||||||||||||||||||
| Commercial Real Estate | 1 | $ | 228 | $ | 228 | 5 | $ | 14,785 | $ | 14,785 | ||||||||||||||
| Commercial and Industrial | 3 | 203 | 203 | 6 | 1,344 | 1,344 | ||||||||||||||||||
| Total | 4 | $ | 431 | $ | 431 | 11 | $ | 16,129 | $ | 16,129 | ||||||||||||||
No TDRs defaulted (defined as 30 days or more past due) within 12 months of restructuring during the years ended December 31, 2014 and 2013. The following is a summary of TDRs that have subsequently defaulted within one year of modification during 2012:
| December 31, 2012 | ||||||||
| Number of Contracts | Recorded Investment | |||||||
| (Dollars in thousands) | ||||||||
| Troubled Debt Restructurings: | ||||||||
| Commercial real estate | 4 | $ | 944 | |||||
| Commercial and industrial | 1 | 141 | ||||||
| Residential | — | — | ||||||
| Total | 5 | $ | 1,085 | |||||
| F-21 |
As of December 31, 2014, we have not committed to lend any additional funds for loans that are classified as impaired. There were no charge-offs on TDRs during the years ended December 31, 2014 or 2013. As of December 31, 2012, we were committed to lend an additional $113,000 to one customer with outstanding loans that are classified as TDRs. This loan was used for building improvements to generate rental income. There were no charge-offs on TDRs during the year ended December 31, 2012.
Credit Quality Information
We use an eight-grade internal loan rating system for commercial real estate and commercial and industrial loans. Performing residential real estate, home equity and consumer loans are grouped with “Pass” rated loans. Nonperforming residential real estate, home equity and consumer loans are monitored individually for impairment and risk rated as “substandard.”
Loans rated 1 – 3 are considered “Pass” rated loans with low to average risk
Loans rated 4 are considered “Pass Watch,” which represent loans to borrowers with declining earnings, losses, or strained cash flow.
Loans rated 5 are considered “Special Mention.” These loans exhibit potential credit weaknesses or downward trends and are being closely monitored by us.
Loans rated 6 are considered “Substandard.” Generally, a loan is considered substandard if the borrower exhibits a well-defined weakness that may be inadequately protected by the current net worth and cash flow capacity to pay the current debt.
Loans rated 7 are considered “Doubtful.” Loans classified as doubtful have all the weaknesses inherent in those classified substandard with the added characteristic that the weaknesses make collection or liquidation in full, on the basis of currently existing facts, highly questionable and improbable and that a partial loss of principal is likely.
Loans rated 8 are considered uncollectible and of such little value that their continuance as loans is not warranted.
On an annual basis, or more often if needed, we formally review the ratings on all commercial real estate and commercial and industrial loans. Construction loans are reported within commercial real estate loans and total $16.8 million and $23.4 million at December 31, 2014 and 2013, respectively. We engage an independent third party to review a significant portion of loans within these segments on at least an annual basis. We use the results of these reviews as part of our annual review process. In addition, management utilizes delinquency reports, the watch list and other loan reports to monitor credit quality in other segments.
| F-22 |
The following table presents our loans by risk rating at December 31, 2014 and December 31, 2013:
| Commercial Real Estate | Residential 1-4 family | Home Equity | Commercial and Industrial | Consumer | Total | |||||||||||||||||||
| (Dollars in thousands) | ||||||||||||||||||||||||
| December 31, 2014 | ||||||||||||||||||||||||
| Loans rated 1 – 3 | $ | 234,010 | $ | 236,113 | $ | 40,282 | $ | 139,109 | $ | 1,526 | $ | 651,040 | ||||||||||||
| Loans rated 4 | 33,305 | — | — | 16,841 | — | 50,146 | ||||||||||||||||||
| Loans rated 5 | 7,833 | — | 22 | 5,545 | — | 13,400 | ||||||||||||||||||
| Loans rated 6 | 3,257 | 1,323 | 1 | 4,233 | 16 | 8,830 | ||||||||||||||||||
| $ | 278,405 | $ | 237,436 | $ | 40,305 | $ | 165,728 | $ | 1,542 | $ | 723,416 | |||||||||||||
| December 31, 2013 | ||||||||||||||||||||||||
| Loans rated 1 – 3 | $ | 213,985 | $ | 197,974 | $ | 35,333 | $ | 108,671 | $ | 2,571 | $ | 558,534 | ||||||||||||
| Loans rated 4 | 41,459 | — | — | 15,722 | — | 57,181 | ||||||||||||||||||
| Loans rated 5 | 1,972 | — | — | 3,509 | — | 5,481 | ||||||||||||||||||
| Loans rated 6 | 7,060 | 712 | 38 | 7,653 | 1 | 15,464 | ||||||||||||||||||
| $ | 264,476 | $ | 198,686 | $ | 35,371 | $ | 135,555 | $ | 2,572 | $ | 636,660 | |||||||||||||
4. PREMISES AND EQUIPMENT
Premises and equipment are summarized as follows:
| December 31, | ||||||||
| 2014 | 2013 | |||||||
| (In thousands) | ||||||||
| Land | $ | 1,826 | $ | 1,826 | ||||
| Buildings | 13,293 | 13,104 | ||||||
| Leasehold improvements | 2,156 | 1,622 | ||||||
| Furniture and equipment | 11,951 | 10,777 | ||||||
| Total | 29,226 | 27,329 | ||||||
| Accumulated depreciation and amortization | (17,523 | ) | (16,334 | ) | ||||
| Premises and equipment, net | $ | 11,703 | $ | 10,995 | ||||
Depreciation and amortization expense for the years ended December 31, 2014, 2013 and 2012 amounted to $1.2 million, $1.1 million and $1.0 million, respectively.
| F-23 |
5. DEPOSITS
Deposit accounts by type and weighted average rates are summarized as follows:
| December 31, | ||||||||||||||||
| 2014 | 2013 | |||||||||||||||
| Amount | Rate | Amount | Rate | |||||||||||||
| (Dollars in thousands) | ||||||||||||||||
| Demand: | ||||||||||||||||
| Interest-bearing | $ | 37,983 | 0.24 | % | $ | 44,924 | 0.27 | % | ||||||||
| Noninterest-bearing deposits | 136,186 | — | 145,040 | — | ||||||||||||
| Savings: | ||||||||||||||||
| Regular | 74,970 | 0.10 | 81,244 | 0.10 | ||||||||||||
| Money market | 227,330 | 0.37 | 204,469 | 0.38 | ||||||||||||
| Time certificates of deposit | 357,749 | 1.19 | 341,435 | 1.28 | ||||||||||||
| Total deposits | $ | 834,218 | 0.63 | % | $ | 817,112 | 0.66 | % | ||||||||
Time deposits of $100,000 or more totaled $163.5 million and $139.6 million at December 31, 2014 and 2013, respectively. Interest expense on such deposits totaled $1.7 million, $1.6 million and $1.7 million for the years ended December 31, 2014, 2013 and 2012, respectively.
At December 31, 2014, the scheduled maturities of time certificates of deposit are as follows:
| Year Ending December 31, | Amount | |||||
| (In thousands) | ||||||
| 2015 | $ | 198,972 | ||||
| 2016 | 75,035 | |||||
| 2017 | 35,179 | |||||
| 2018 | 17,608 | |||||
| 2019 | 30,955 | |||||
| $ | 357,749 | |||||
Interest expense on deposits for the years ended December 31, 2014, 2013 and 2012 is summarized as follows:
| Years Ended December 31, | ||||||||||||
| 2014 | 2013 | 2012 | ||||||||||
| (In thousands) | ||||||||||||
| Regular | $ | 80 | $ | 119 | $ | 186 | ||||||
| Money market | 846 | 762 | 807 | |||||||||
| Time | 4,152 | 4,509 | 4,883 | |||||||||
| Interest-bearing demand | 99 | 135 | 266 | |||||||||
| $ | 5,177 | $ | 5,525 | $ | 6,142 | |||||||
Cash paid for interest on deposits totaled $5.2 million, $5.5 million and $6.2 million for years ended December 31, 2014, 2013 and 2012, respectively.
| F-24 |
6. SHORT-TERM BORROWINGS
FHLBB Advances – We have an “Ideal Way” line of credit with the FHLBB for $9.5 million for the years ended December 31, 2014 and 2013. Interest on this line of credit is payable at a rate determined and reset by the FHLBB on a daily basis. The outstanding principal is due daily but the portion not repaid will be automatically renewed. At December 31, 2014, there was a $1.8 million advance outstanding under this line. There were no advances outstanding under this line at December 31, 2013.
FHLBB advances, including line of credit advances, with an original maturity of less than one year, amounted to $62.8 million and $20.0 million at December 31, 2014 and 2013, respectively, at a weighted average rate of 0.33% and 0.30%, respectively.
FHLBB advances are collateralized by a blanket lien on our residential real estate loans and certain mortgage-backed securities.
BBN Advances – We have a $4.0 million line of credit with BBN at an interest rate determined and reset by BBN on a daily basis. There were no advances outstanding under this line at December 31, 2014 and 2013. As part of our contract with BBN, we are required to maintain a reserve balance of $300,000 with BBN for our use of this line.
PNC Advances – We have a $50.0 million line of credit with PNC Bank at an interest rate determined and reset by PNC on a daily basis. There were no advances outstanding under the line at December 31, 2014 and 2013.
Customer Repurchase Agreements – The following table summarizes information regarding repurchase agreements:
| Years Ended | ||||||||
| December 31, | ||||||||
| 2014 | 2013 | |||||||
| (Dollars in thousands) | ||||||||
| Balance outstanding at end of year | $ | 31,164 | $ | 28,197 | ||||
| Maximum amount outstanding during year | 44,435 | 40,860 | ||||||
| Average amount outstanding during year | 35,657 | 31,754 | ||||||
| Weighted average interest rate at end of year | 0.19 | % | 0.19 | % | ||||
| Amortized cost of collateral pledged at end of year (1) | 63,660 | 53,714 | ||||||
| Fair value of collateral pledged at end of year (1) | 65,992 | 54,885 | ||||||
| (1) Includes collateral pledged toward $5.8 million in long-term customer repurchase agreements. | ||||||||
| Our repurchase agreements are collateralized by government-sponsored enterprise obligations and certain mortgage-backed securities. The weighted average interest rate on the pledged collateral was 3.56% and 3.49% at December 31, 2014 and 2013, respectively. |
Cash paid for interest on short-term borrowings totaled $414,000, $111,000 and $114,000 for years ended December 31, 2014, 2013 and 2012, respectively.
| F-25 |
7. LONG-TERM DEBT
FHLBB Advances – The following advances are collateralized by a blanket lien on our residential real estate loans and certain mortgage-backed securities.
| Amount | Weighted Average Rate | |||||||||||||||||
| 2014 | 2013 | 2014 | 2013 | |||||||||||||||
| (In thousands) | ||||||||||||||||||
| Fixed-rate advances maturing: | ||||||||||||||||||
| 2014 | $ | — | $ | 21,542 | — | % | 1.2 | % | ||||||||||
| 2015 | 30,573 | 25,395 | 1.4 | 1.6 | ||||||||||||||
| 2016 | 53,757 | 53,574 | 2.2 | 2.2 | ||||||||||||||
| 2017 | 47,500 | 17,500 | 2.4 | 2.6 | ||||||||||||||
| 2018 | 10,000 | 10,000 | 2.2 | 2.2 | ||||||||||||||
| 2019 | 5,000 | 5,000 | 3.2 | 3.2 | ||||||||||||||
| 2020 | 7,000 | 7,000 | 1.8 | 1.8 | ||||||||||||||
| 153,830 | 140,011 | 2.1 | % | 2.0 | % | |||||||||||||
| Variable-rate advances maturing: | ||||||||||||||||||
| 2015 | 9,877 | 9,736 | 0.9 | 0.9 | ||||||||||||||
| 2016 | 10,000 | 10,000 | 1.4 | 1.4 | ||||||||||||||
| 2017 | — | 30,000 | — | (0.2 | ) | |||||||||||||
| 2018* | 32,000 | 32,000 | 0.4 | 0.4 | ||||||||||||||
| 2019* | 11,000 | 11,000 | (0.1 | ) | (0.1 | ) | ||||||||||||
| 62,877 | 92,736 | 0.5 | 0.3 | |||||||||||||||
Total advances | $ | 216,707 | $ | 232,747 | 1.6 | % | 1.3 | % | ||||||||||
*At December 31, 2014, the following amounts are callable at the option of FHLBB: $33.0 million in 2015. If these advances are not called, the weighted average rate on these advances, which is currently variable and resets based on LIBOR, will become fixed and increase to 2.3% for the 2015 call. At December 31, 2013 there were $30.0 million in FHLBB advances that were callable.
At December 31, 2014 and 2013, securities pledged as collateral to the FHLB had a carrying value of $257.5 million and $245.1 million, respectively.
Customer Repurchase Agreements - At December 31, 2014, we had one long-term customer repurchase agreement for $5.8 million with a rate of 2.5% and a final maturity in 2015. At December 31, 2013, we had one long-term customer repurchase agreement for $5.6 million with a rate of 2.5% and a final maturity in 2014.
Securities Sold Under Agreements to Repurchase – The following securities sold under agreements to repurchase are secured by government-sponsored enterprise obligations with a carrying value of $12.6 million and $12.4 million as of December 31, 2014 and 2013, respectively. We may be required to provide additional collateral based on the fair value of the underlying securities.
| Amount | Weighted Average Rate | |||||||||||||||||
| 2014 | 2013 | 2014 | 2013 | |||||||||||||||
| (In thousands) | ||||||||||||||||||
| Fixed-rates maturing: | ||||||||||||||||||
| 2018* | $ | 10,000 | * | $ | 10,000 | 2.7 | % | 2.7 | % | |||||||||
*Callable in 2015
Cash paid for interest on long-term debt totaled $4.3 million, $4.6 million and $6.5 million for years ended December 31, 2014, 2013 and 2012, respectively.
During 2013, we prepaid repurchase agreements in the amount of $43.3 million and incurred a prepayment expense of $3.4 million. The repurchase agreements had a weighted average cost of 2.99%.
| F-26 |
8. STOCK PLANS AND EMPLOYEE STOCK OWNERSHIP PLAN
Stock Options - Under our 2002 Stock Option Plan and 2007 Stock Option Plan, we could grant both incentive and non-statutory options to our directors, officers, and employees for up to 1,631,682 and 1,560,101, respectively, shares of common stock, of which 1,631,682 and 1,503,869, respectively, were granted. The exercise price of each option equaled the market price of our stock on the date of grant with a maximum term of 10 years. The fair value of each option grant was estimated on the date of grant using the binomial option pricing model.
During the third quarter of 2013, we completed a tender offer to purchase for cancellation 1,665,415 outstanding options to purchase common stock. The recipients of each eligible option tendered received a cash payment equal to the current fair valuation of the option as measured under the binomial model. The total cash paid to purchase the options was $2.1 million and resulted in a decrease to cash and shareholders’ equity. A deferred tax asset of $566,000 was charged to shareholders’ equity as a result of the tender offer. As of December 31, 2013, 57,232 stock options that had been available for future grants were returned to the 2007 Stock Option Plan reserve and the 2002 and 2007 Stock Option Plans were frozen.
No stock options were granted in 2014 or 2013, and no stock options were outstanding during 2014.
For the years ended December 31, 2013 and 2012, share-based compensation expense applicable to stock options was $128,000 and $642,000, respectively, with related tax benefits of $35,000 and $173,000, respectively. The completion of the tender offer caused the acceleration of vesting of certain stock options and resulted in $97,000 of total option expense with a related tax benefit of $26,000 for the year ended December 31, 2013.
Restricted Stock Awards – During 2002 and 2007, we adopted equity incentive plans under which 652,664 and 624,041 shares, respectively, were reserved for issuance as restricted stock awards to directors and employees, all of which are currently issued and outstanding as of December 31, 2014. Shares issued upon vesting may be either authorized but unissued shares or reacquired shares held by us. Any shares not issued because vesting requirements are not met will again be available for issuance under the plans. Shares awarded vest ratably over five years. The fair market value of shares awarded, based on the market price at the date of grant, is recorded as unearned compensation and amortized over the applicable vesting period.
A summary of the status of unvested restricted stock awards at December 31, 2014 is presented below:
| Shares | Weighted Average Grant Date Fair Value | |||||||||||||||
| Balance at December 31, 2013 | 25,720 | $ | 7.93 | |||||||||||||
| Shares vested | (12,720 | ) | 7.79 | |||||||||||||
| Balance at December 31, 2014 | 13,000 | $ | 8.07 | |||||||||||||
We recorded total expense for restricted stock awards of $92,000, $126,000 and $963,000 for the years ended December 31, 2014, 2013, and 2012, respectively. Tax provisions related to equity incentive plan expense were $1,000, $1,000 and $96,000 for the years ended December 31, 2014, 2013 and 2012, respectively. Unrecognized compensation cost for stock awards was $95,000 at December 31, 2014 with a remaining life of 1.71 years.
Employee Stock Ownership Plan - We established an ESOP for the benefit of each employee that has reached the age of 21 and has completed at least 1,000 hours of service in the previous 12-month period. In January 2002, as part of the initial stock conversion, we provided a loan to the ESOP Trust which was used to purchase 8%, or 1,305,359 shares, of the common stock sold in the initial public offering.
In January 2007, as part of the second-step stock conversion, we provided an additional loan to the ESOP Trust which was used to purchase 4.0%, or 736,000 shares, of the 18,400,000 shares of common stock sold in the offering. The 2002 and 2007 loans bear interest equal to 8.0% and provide for annual payments of interest and principal.
| F-27 |
At December 31, 2014, the remaining principal balances are payable as follows:
| Year Ending | ||||||
| December 31, | Amount | |||||
| (In thousands) | ||||||
| 2015 | $ | 447 | ||||
| 2016 | 447 | |||||
| 2017 | 447 | |||||
| 2018 | 447 | |||||
| 2019 | 447 | |||||
| Thereafter | 6,587 | |||||
| $ | 8,822 | |||||
We have committed to make contributions to the ESOP sufficient to support the debt service of the loans. The loans are secured by the shares purchased, which are held in a suspense account for allocation among the participants as the loans are paid. Total compensation expense applicable to the ESOP amounted to $576,000, $599,000 and $628,000 for the years ended December 31, 2014, 2013 and 2012, respectively.
Shares held by the ESOP include the following at December 31, 2014 and 2013:
| 2014 | 2013 | |||||||
| Allocated | 739,506 | 662,013 | ||||||
| Committed to be allocated | 79,345 | 81,803 | ||||||
| Unallocated | 1,040,751 | 1,120,096 | ||||||
| 1,859,602 | 1,863,912 | |||||||
Cash dividends declared and received on allocated shares are allocated to participants and charged to retained earnings. Cash dividends declared and received on unallocated shares are held in suspense and are applied to repay the outstanding debt of the ESOP. The fair value of unallocated shares was $7.6 million and $8.4 million at December 31, 2014 and 2013, respectively. ESOP shares are considered outstanding for earnings per share calculations as they are committed to be allocated. Unallocated ESOP shares are excluded from earnings per share calculations. The cost of unearned shares to be allocated to ESOP participants for future services not yet performed is reflected as a reduction of shareholders’ equity.
9. RETIREMENT PLANS AND EMPLOYEE BENEFITS
Pension Plan - We provide a defined benefit pension plan for eligible employees (the “Plan”). Employees must work a minimum of 1,000 hours per year to be eligible for the Plan. Eligible employees become vested in the Plan after five years of service.
The following table provides information for the Plan at or for the years ended December 31:
| Years Ended December 31, | ||||||||||||
| 2014 | 2013 | 2012 | ||||||||||
| (In thousands) | ||||||||||||
| Change in benefit obligation: | ||||||||||||
| Benefit obligation at beginning of year | $ | 19,039 | $ | 18,752 | $ | 18,326 | ||||||
| Service cost | 1,000 | 1,170 | 1,094 | |||||||||
| Interest | 824 | 763 | 800 | |||||||||
| Actuarial loss (gain) | 3,085 | (1,540 | ) | 27 | ||||||||
| Benefits paid | (314 | ) | (106 | ) | (1,495 | ) | ||||||
| Benefit obligation at end of year | 23,634 | 19,039 | 18,752 | |||||||||
| Change in plan assets: | ||||||||||||
| Fair value of plan assets at beginning of year | 13,811 | 12,200 | 11,377 | |||||||||
| Actual return on plan assets | 1,725 | 992 | 818 | |||||||||
| Employer contribution | 725 | 725 | 1,500 | |||||||||
| Benefits paid | (314 | ) | (106 | ) | (1,495 | ) | ||||||
| Fair value of plan assets at end of year | 15,947 | 13,811 | 12,200 | |||||||||
| Funded status and accrued benefit at end of year | $ | (7,687 | ) | $ | (5,228 | ) | $ | (6,552 | ) | |||
| Accumulated benefit obligation at end of year | $ | 16,423 | $ | 13,192 | $ | 13,297 | ||||||
| F-28 |
The following actuarial assumptions were used in determining the pension benefit obligation:
| December 31, | ||||||||
| 2014 | 2013 | |||||||
| Discount rate | 4.00 | % | 5.00 | % | ||||
| Rate of compensation increase | 4.00 | 4.00 | ||||||
Net pension cost includes the following components for the years ended December 31:
| 2014 | 2013 | 2012 | ||||||||||
| (In thousands) | ||||||||||||
| Service cost | $ | 1,000 | $ | 1,170 | $ | 1,094 | ||||||
| Interest cost | 824 | 763 | 800 | |||||||||
| Expected return on assets | (959 | ) | (948 | ) | (867 | ) | ||||||
| Amortization of transition asset | (10 | ) | (12 | ) | (12 | ) | ||||||
| Amortization of actuarial loss | — | 117 | 175 | |||||||||
| Net periodic pension cost | $ | 855 | $ | 1,090 | $ | 1,190 | ||||||
The following actuarial assumptions were used in determining the service costs for the years ended December 31:
| 2014 | 2013 | 2012 | ||||||||||
| Discount rate | 5.00 | % | 4.00 | % | 4.50 | % | ||||||
| Expected return on plan assets | 7.50 | 8.00 | 8.00 | |||||||||
| Rate of compensation increase | 4.00 | 4.00 | 4.00 | |||||||||
| F-29 |
The fair value of major categories of our pension plan assets are summarized below:
| December 31, 2014 | ||||||||||||||||
| Plan Assets | Level 1 | Level 2 | Level 3 | Fair Value | ||||||||||||
| (In thousands) | ||||||||||||||||
| Large U.S. equity | $ | — | $ | 3,845 | $ | — | $ | 3,845 | ||||||||
| Small/mid U.S. equity | — | 924 | — | 924 | ||||||||||||
| International equity | — | 1,385 | — | 1,385 | ||||||||||||
| Balanced/asset allocation | — | 744 | — | 744 | ||||||||||||
| Short-term fixed income | — | 1,582 | — | 1,582 | ||||||||||||
| Fixed income | — | 7,467 | — | 7,467 | ||||||||||||
| $ | — | $ | 15,947 | $ | — | $ | 15,947 | |||||||||
| December 31, 2013 | ||||||||||||||||
| Level 1 | Level 2 | Level 3 | Fair Value | |||||||||||||
| (In thousands) | ||||||||||||||||
| Large U.S. equity | $ | — | $ | 3,325 | $ | — | $ | 3,325 | ||||||||
| Small/mid U.S. equity | — | 831 | — | 831 | ||||||||||||
| International equity | — | 1,394 | — | 1,394 | ||||||||||||
| Balanced/asset allocation | — | 693 | — | 693 | ||||||||||||
| Short-term fixed income | — | 1,519 | — | 1,519 | ||||||||||||
| Fixed income | — | 6,049 | — | 6,049 | ||||||||||||
| $ | — | $ | 13,811 | $ | — | $ | 13,811 | |||||||||
Plan assets are all measured at fair value in Level 2 and are based on pricing models that consider standard input factors such as observable market data, benchmark yields, interest rate volatilities, broker/dealer quotes, credit spreads and new issue data.
The asset or liability fair value measurement level within fair value hierarchy is based on the lowest level of any input that is significant to the fair value measurement. Valuation techniques used need to maximize the use of observable inputs and minimize the use of unobservable inputs. The plan reports bonds and other obligations, short-term investments and equity securities at fair value based on published quotations. Collective funds are valued in accordance with valuations provided by such Funds, which generally value marketable equity securities at the last reported sales price on the valuation date and other investments at fair value, as determined by each Fund’s manager.
The preceding methods described may produce a fair value calculation that may not be indicative of net realizable value or reflective of future values. Furthermore, although the plan believes its valuation methods are appropriate and consistent with other market participants, the use of different methodologies to determine the fair value of certain financial instruments could result in a different fair value measurement at the reporting date.
The defined benefit plan offers a mixture of fixed income, equity and real assets as the underlying investment structure for its retirement structure for the pension plan. The target allocation mix for the pension plan for 2014 was an equity-based investment deployment of 44% of total portfolio assets based on advice received from an external advisory firm with confirmation by the Bank’s Investment Committee. The remainder of the portfolio is allocated to fixed income at 56% of total assets. The investment objective is to diversify investments across a spectrum of investment types to limit risks from large market swings and to provide anticipated stabilized investment returns. Trustees of the Plan select investment managers for the portfolio and a second investment advisory firm is retained to provide allocation analysis. The overall investment objective is to diversify equity investments across a spectrum of types, small cap, large cap and international, along with investment styles such as growth and value.
| F-30 |
We estimate that the benefits to be paid from the pension plan for years ended December 31 are as follows:
| Year | Benefit Payments to Participants | |||||
| (In thousands) | ||||||
| 2015 | $ | 757 | ||||
| 2016 | 1,998 | |||||
| 2017 | 426 | |||||
| 2018 | 1,012 | |||||
| 2019 | 791 | |||||
| In aggregate for 2020 – 2024 | 6,509 | |||||
We have not yet determined the amount of the contribution we expect to make to the plan during the fiscal year ending December 31, 2015.
Postretirement Benefits - We provided postretirement life insurance benefits to employees based on the employee’s salary at time of retirement. As of December 31, 2014 and 2013, the accrued liability recorded in other liabilities on the consolidated balance sheets amounted to $158,000 and $217,000, respectively. Total expense associated with this plan amounted to $23,000, $27,000 and $29,000 for the years ended December 31, 2014, 2013 and 2012, respectively.
401(k) - Employees are eligible to participate in a 401(k) plan. We make a matching contribution of 50% with respect to the first 6% of each participant’s annual earnings contributed to the plan. Our contributions to the plan were $236,000, $231,000 and $214,000 for the years ended December 31, 2014, 2013 and 2012, respectively.
10. DERIVATIVES AND HEDGING ACTIVITIES
Risk Management Objective of Using Derivatives
We are exposed to certain risks arising from both our business operations and economic conditions. We principally manage our exposures to a wide variety of business and operational risks through management of our core business activities. We manage economic risks, including interest rate, liquidity, and credit risk, primarily by managing the amount, sources, and duration of our assets and liabilities and the use of derivative financial instruments. Specifically, we entered into derivative financial instruments to manage exposures that arise from business activities that result in the receipt or payment of future known and uncertain cash amounts, the value of which are determined by interest rates. Our derivative financial instruments are used to manage differences in the amount, timing, and duration of our known or expected cash receipts and our known or expected cash payments principally related to certain variable rate borrowings.
| F-31 |
Fair Values of Derivative Instruments on the Balance Sheet
The table below presents the fair value of our derivative financial instruments designated as hedging instruments as well as our classification on the balance sheet as of December 31, 2014.
| December 31, 2014 | Asset Derivatives | Liability Derivatives | ||||||||||
Balance Sheet Location | Fair Value | Balance Sheet Location | Fair Value | |||||||||
| (In thousands) | ||||||||||||
| Interest rate swaps | Other Assets | $ | 9 | Other Liabilities | $ | 5,748 | ||||||
| Total derivatives designated as hedging instruments | $ | 9 | $ | 5,748 | ||||||||
| December 31, 2013 | Asset Derivatives | Liability Derivatives | ||||||||||
Balance Sheet Location | Fair Value | Balance Sheet Location | Fair Value | |||||||||
| (In thousands) | ||||||||||||
| Interest rate swaps | Other Assets | $ | 1,755 | N/A | — | |||||||
| Total derivatives designated as hedging instruments | $ | 1,755 | — | |||||||||
At December 31, 2014 and 2013, all derivatives were designated as hedging instruments.
Cash Flow Hedges of Interest Rate Risk
Our objectives in using interest rate derivatives are to add stability to interest income and expense and to manage our exposure to interest rate movements. To accomplish this objective, we entered into interest rate swaps in September 2013 as part of our interest rate risk management strategy. These interest rate swaps are designated as cash flow hedges and involve the receipt of variable rate amounts from a counterparty in exchange for our making fixed payments.
The following table presents information about our cash flow hedges at December 31, 2014 and 2013:
| December 31, 2014 | Notional | Weighted Average | Weighted Average Rate | Estimated Fair | ||||||||||||||||
| Amount | Maturity | Receive | Pay | Value | ||||||||||||||||
| (In thousands) | (In years) | (In thousands) | ||||||||||||||||||
| Interest rate swaps on FHLBB borrowings | $ | 40,000 | 3.3 | 0.23 | % | 1.52 | % | $ | (268 | ) | ||||||||||
| Forward starting interest rate swaps on FHLBB borrowings | 115,000 | 6.7 | — | 3.11 | % | (5,471 | ) | |||||||||||||
| Total cash flow hedges | $ | 155,000 | 5.8 | $ | (5,739 | ) | ||||||||||||||
| December 31, 2013 | Notional | Weighted Average | Weighted Average Rate | Estimated Fair | ||||||||||||||||
| Amount | Maturity | Received | Paid | Value | ||||||||||||||||
| (In thousands) | (In years) | (In thousands) | ||||||||||||||||||
| Interest rate swaps on FHLBB borrowings | $ | 20,000 | 3.8 | 0.24 | % | 1.17 | % | $ | 40 | |||||||||||
| Forward starting interest rate swaps on FHLBB borrowings | 135,000 | 7.2 | — | 2.93 | % | 1,715 | ||||||||||||||
| Total cash flow hedges | $ | 155,000 | 6.8 | $ | 1,755 | |||||||||||||||
The forward-starting interest rate swaps will become effective in 2015 and 2016 with notional amounts of $47.5 million and $67.5 million, respectively.
| F-32 |
For derivatives designated as cash flow hedges, the effective portion of changes in the fair value of the derivative is initially reported in other comprehensive income (outside of earnings), net of tax, and subsequently reclassified to earnings when the hedged transaction affects earnings. The ineffective portion of changes in the fair value of the derivative is recognized directly in earnings. We assess the effectiveness of each hedging relationship by comparing the changes in cash flows of the derivative hedging instrument with the changes in cash flows of the designated hedged transactions. We did not recognize any hedge ineffectiveness in earnings in 2014 or 2013.
We are hedging our exposure to the variability in future cash flows for forecasted transactions over a maximum period of six years (excluding forecasted transactions related to the payment of variable interest on existing financial instruments).
The table below presents the pre-tax net (loss) gain of our cash flow hedges for the period indicated.
Amount of (Loss) Gain Recognized in OCI on Derivative (Effective Portion) | ||||||||
| Years Ended December 30, | ||||||||
| 2014 | 2013 | |||||||
| (In thousands) | ||||||||
| Interest rate swaps | $ | (7,684 | ) | $ | 1,755 | |||
Amounts reported in accumulated other comprehensive loss related to these derivatives are reclassified to interest expense as interest payments are made on our rate sensitive assets/liabilities. During the year ended December 31, 2014, we reclassified $190,000 into interest expense. During the period ended December 31, 2013, we had no reclassifications to interest expense. During the next 12 months, we estimate that $931,000 will be reclassified as an increase in interest expense. During the years ended December 31, 2014 and 2013, no gains or losses were reclassified from accumulated other comprehensive loss into income for ineffectiveness on cash flow hedges.
Credit-risk-related Contingent Features
By using derivative financial instruments, we expose the Company to credit risk. Credit risk is the risk of failure by the counterparty to perform under the terms of the derivative contract. When the fair value of a derivative contract is positive, the counterparty owes us, which creates credit risk for us. When the fair value of a derivative is negative, we owe the counterparty and, therefore, it does not possess credit risk. The credit risk in derivative instruments is mitigated by entering into transactions with highly-rated counterparties that we believe to be creditworthy and by limiting the amount of exposure to each counterparty.
We have agreements with our derivative counterparties that contain a provision where if we default on any of our indebtedness, including default where repayment of the indebtedness has not been accelerated by the lender, then we could also be declared in default on our derivative obligations. We also have agreements with certain of our derivative counterparties that contain a provision where if we fail to maintain our status as well capitalized, then the counterparty could terminate the derivative positions and we would be required to settle our obligations under the agreements. Certain of our agreements with our derivative counterparties contain provisions where if a formal administrative action by a federal or state regulatory agency occurs that materially changes our creditworthiness in an adverse manner, we may be required to fully collateralize our obligations under the derivative instrument.
At December 31, 2014, we had a net liability position of $5.9 million with our counterparties. As of December 31, 2013, we had no derivatives in a net liability position.
11. REGULATORY CAPITAL
The Bank is subject to various regulatory capital requirements administered by the Office of Comptroller of the Currency (the “OCC”). Failure to meet minimum capital requirements can initiate certain mandatory and possibly additional discretionary, actions by regulators that, if undertaken, could have a direct material effect on our consolidated financial statements. Under capital adequacy guidelines and the regulatory framework for prompt corrective action, the Bank must meet specific capital guidelines that involve quantitative measures of assets, liabilities, and certain off-balance sheet items as calculated under regulatory accounting practices. The capital amounts and classification are also subject to qualitative judgments by the regulators about components, risk weightings, and other factors. Prompt corrective action provisions are not applicable to savings and loan holding companies.
| F-33 |
To ensure capital adequacy, the OCC regulations establish quantitative measures which require the Bank and Westfield Financial to maintain minimum amounts and ratios of total and Tier 1 capital to risk-weighted assets, Tier 1 capital to average assets and of tangible capital to tangible assets. We believe, as of December 31, 2014 and 2013, that we met all capital adequacy requirements to which we are subject. Westfield Financial’s and the Bank’s capital ratios as of December 31, 2014 and 2013 are set forth in the following table.
As of December 31, 2014, the most recent notification from the OCC categorized the Bank as “well capitalized” under the regulatory framework for prompt corrective action. To be categorized as “well capitalized,” the Bank must maintain minimum total risk-based, Tier 1 risk based and Tier 1 leverage ratios as set forth in the following table. There are no conditions or events since that notification that management believes have changed the Bank’s category.
| Actual | Minimum for Capital Adequacy Purposes | Minimum To Be Well Capitalized Under Prompt Corrective Action Provisions | ||||||||||||||||||||||
| Amount | Ratio | Amount | Ratio | Amount | Ratio | |||||||||||||||||||
| (Dollars in thousands) | ||||||||||||||||||||||||
| December 31, 2014 | ||||||||||||||||||||||||
| Total Capital (to Risk Weighted Assets): | ||||||||||||||||||||||||
| Consolidated | $ | 158,016 | 18.68 | % | $ | 67,675 | 8.00 | % | N/A | — | ||||||||||||||
| Bank | 150,392 | 17.81 | 67,549 | 8.00 | $ | 84,436 | 10.00 | % | ||||||||||||||||
| Tier 1 Capital (to Risk Weighted Assets): | ||||||||||||||||||||||||
| Consolidated | 150,018 | 17.73 | 33,838 | 4.00 | N/A | — | ||||||||||||||||||
| Bank | 142,383 | 16.86 | 33,775 | 4.00 | 50,662 | 6.00 | ||||||||||||||||||
| Tier 1 Capital (to Adjusted Total Assets): | ||||||||||||||||||||||||
| Consolidated | 150,018 | 11.30 | 53,103 | 4.00 | N/A | — | ||||||||||||||||||
| Bank | 142,383 | 10.74 | 53,035 | 4.00 | 66,293 | 5.00 | ||||||||||||||||||
| Tangible Equity (to Tangible Assets): | ||||||||||||||||||||||||
| Consolidated | N/A | — | N/A | — | N/A | — | ||||||||||||||||||
| Bank | 142,383 | 10.74 | 19,888 | 1.50 | N/A | — | ||||||||||||||||||
| December 31, 2013 | ||||||||||||||||||||||||
| Total Capital (to Risk Weighted Assets): | ||||||||||||||||||||||||
| Consolidated | $ | 164,605 | 21.17 | % | $ | 62,207 | 8.00 | % | N/A | — | ||||||||||||||
| Bank | 157,484 | 20.30 | 62,073 | 8.00 | $ | 77,591 | 10.00 | % | ||||||||||||||||
| Tier 1 Capital (to Risk Weighted Assets): | ||||||||||||||||||||||||
| Consolidated | 157,119 | 20.21 | 31,104 | 4.00 | N/A | — | ||||||||||||||||||
| Bank | 149,965 | 19.33 | 31,036 | 4.00 | 46,555 | 6.00 | ||||||||||||||||||
| Tier 1 Capital (to Adjusted Total Assets): | ||||||||||||||||||||||||
| Consolidated | 157,119 | 12.28 | 51,193 | 4.00 | N/A | — | ||||||||||||||||||
| Bank | 149,965 | 11.73 | 51,121 | 4.00 | 63,901 | 5.00 | ||||||||||||||||||
| Tangible Equity (to Tangible Assets): | ||||||||||||||||||||||||
| Consolidated | N/A | — | N/A | — | N/A | — | ||||||||||||||||||
| Bank | 149,965 | 11.73 | 19,170 | 1.50 | N/A | — | ||||||||||||||||||
| F-34 |
The following is a reconciliation of our GAAP capital to regulatory Tier 1 and total capital:
| December 31, | ||||||||
| 2014 | 2013 | |||||||
| (In thousands) | ||||||||
| Consolidated GAAP capital | $ | 142,543 | $ | 154,144 | ||||
| Net unrealized losses on available-for-sale securities, net of tax | 728 | 2,706 | ||||||
| Unrealized loss on defined benefit pension plan, net of tax | 2,959 | 1,427 | ||||||
| Accumulated net loss (gain) on cash flow hedges, net of tax | 3,788 | (1,158 | ) | |||||
| Tier 1 capital | 150,018 | 157,119 | ||||||
| Unrealized gains on certain available-for-sale equity securities | 50 | 27 | ||||||
| Allowance for loan losses | 7,948 | 7,459 | ||||||
| Total regulatory capital | $ | 158,016 | $ | 164,605 | ||||
On March 13, 2014, the Board of Directors authorized the commencement of our current stock repurchase program, authorizing the repurchase of up to 1,970,000 shares, or 10% of our outstanding shares of common stock. There were 999,460 shares available to be purchased under the repurchase program as of December 31, 2014.
We are subject to dividend restrictions imposed by various regulators, including a limitation on the total of all dividends that the Bank may pay to the Company in any calendar year, to an amount that shall not exceed the Bank’s net income for the current year, plus its net income retained for the two previous years, without regulatory approval. In addition, the Bank may not declare or pay dividends on, and we may not repurchase, any of our shares of common stock if the effect thereof would cause shareholders’ equity to be reduced below applicable regulatory capital maintenance requirements or if such declaration, payment or repurchase would otherwise violate regulatory requirements. At December 31, 2014 and 2013, the Bank had no retained earnings available for payment of dividends without prior regulatory approval. The Bank will be prohibited from paying cash dividends to us to the extent that any such payment would reduce the Bank’s capital below required capital levels. Accordingly, $67.6 million and $62.1 million of our equity in the net assets of the Bank was restricted at December 31, 2014 and 2013, respectively.
The only funds available for the payment of dividends on our capital stock will be cash and cash equivalents held by us, dividends paid from the Bank to us, and borrowings.
In July 2013, federal banking regulators approved final rules that implement changes to the regulatory capital framework for U.S. banks. The rules set minimum requirements for both the quantity and quality of capital held by community banking institutions. The final rule includes a new minimum ratio of common equity Tier 1 capital to risk weighted assets of 4.5%, raises the minimum ratio of Tier 1 capital to risk-weighted assets from 4% to 6% and includes a minimum leverage ratio of 4% for all banking organizations. Additionally, community banking institutions must maintain a capital conservation buffer of common equity Tier 1 capital in an amount greater than 2.5% of total risk-weighted assets to avoid being subject to limitations on capital distributions and discretionary bonus payments to executive officers. The phase-in period for the rules will begin for the Bank on January 1, 2015, with full compliance with all of the final rule’s requirements phased in over a multi-year schedule. Management believes that the Company will be characterized as “well-capitalized” under the new rules.
| F-35 |
12. INCOME TAXES
Income taxes consist of the following:
| Years Ended December 31, | ||||||||||||
| 2014 | 2013 | 2012 | ||||||||||
| (In thousands) | ||||||||||||
| Current tax provision: | ||||||||||||
| Federal | $ | 1,854 | $ | 795 | $ | 1,856 | ||||||
| State | 221 | 96 | 215 | |||||||||
| Total | 2,075 | 891 | 2,071 | |||||||||
| Deferred tax (benefit) provision: | ||||||||||||
| Federal | (188 | ) | 980 | 184 | ||||||||
| State | (5 | ) | — | 1 | ||||||||
| Total | (193 | ) | 980 | 185 | ||||||||
| Total | $ | 1,882 | $ | 1,871 | $ | 2,256 | ||||||
The reasons for the differences between the statutory federal income tax rate and the effective rates are summarized below:
| Years Ended December 31, | ||||||||||||
| 2014 | 2013 | 2012 | ||||||||||
| Statutory federal income tax rate | 34.0 | % | 34.0 | % | 34.0 | % | ||||||
| Increase (decrease) resulting from: | ||||||||||||
| State taxes, net of federal tax benefit | 1.8 | 0.7 | 1.7 | |||||||||
| Tax exempt income | (4.1 | ) | (4.7 | ) | (6.4 | ) | ||||||
| Bank-owned life insurance (BOLI) | (6.4 | ) | (6.1 | ) | (5.7 | ) | ||||||
| Gain on life insurance proceeds | — | (3.3 | ) | (0.3 | ) | |||||||
| Tax benefit of stock option buyout | — | (2.1 | ) | — | ||||||||
| Surrender of BOLI policies | — | — | 1.9 | |||||||||
| Other, net | (1.9 | ) | 3.2 | 1.3 | ||||||||
| Effective tax rate | 23.4 | % | 21.7 | % | 26.5 | % | ||||||
Cash paid for income taxes for the years ended December 31, 2014, 2013 and 2012 was $2.0 million, $941,000 and $2.6 million, respectively.
The tax effects of each item that gives rise to deferred taxes are as follows:
| December 31, | ||||||||
| 2014 | 2013 | |||||||
| (In thousands) | ||||||||
| Deferred tax assets: | ||||||||
| Allowance for loan losses | $ | 2,702 | $ | 2,536 | ||||
| Employee benefit and share-based compensation plans | 2,133 | 2,071 | ||||||
| Net unrealized loss on derivative and hedging activity | 1,951 | — | ||||||
| Defined benefit plan | 1,525 | 735 | ||||||
| Net unamortized loss on securities transferred from available for sale to held to maturity | 617 | 599 | ||||||
| Net unrealized loss on securities available for sale | — | 837 | ||||||
| Other-than-temporary impairment write-down | 110 | 110 | ||||||
| Other | 312 | 334 | ||||||
| 9,350 | 7,222 | |||||||
| Deferred tax liabilities: | ||||||||
| Deferred loan fees | (267 | ) | (117 | ) | ||||
| Net unrealized gain on securities available for sale | (226 | ) | — | |||||
| Net unrealized gain on derivative and hedging activity | — | (597 | ) | |||||
| Other | (38 | ) | (174 | ) | ||||
| (531 | ) | (888 | ) | |||||
| Net deferred tax asset | $ | 8,819 | $ | 6,334 | ||||
| F-36 |
The federal income tax reserve for loan losses at the Bank’s base year is $5.8 million. If any portion of the reserve is used for purposes other than to absorb loan losses, approximately 150% of the amount actually used, limited to the amount of the reserve, would be subject to taxation in the fiscal year in which used. As the Bank intends to use the reserve solely to absorb loan losses, a deferred tax liability of $2.4 million has not been provided.
We do not have any uncertain tax positions at December 31, 2014 or 2013 which require accrual or disclosure. We record interest and penalties as part of income tax expense. No interest was recorded for the years ended December 31, 2014 and 2012, and no penalties were recorded for the years ended December 31, 2014, 2013 and 2012. Interest of $9,000 was recorded for the year ended December 31, 2013.
Our income tax returns are subject to review and examination by federal and state tax authorities. We are currently open to audit under the applicable statutes of limitations by the Internal Revenue Service for the years ended December 31, 2011 through 2014. The years open to examination by state taxing authorities vary by jurisdiction; however, no years prior to 2011 are open.
13. TRANSACTIONS WITH DIRECTORS AND EXECUTIVE OFFICERS
We have had, and expect to have in the future, loans with our directors and executive officers. Such loans, in our opinion, do not include more than the normal risk of collectability or other unfavorable features. Following is a summary of activity for such loans:
| Years Ended December 31, | ||||||||
| 2014 | 2013 | |||||||
| (In thousands) | ||||||||
| Balance at beginning of year | $ | 6,225 | $ | 16,264 | ||||
| Principal distributions | 504 | 2,713 | ||||||
| Repayments of principal | (3,897 | ) | (2,635 | ) | ||||
| Change in related party status | 49 | (10,117 | ) | |||||
| Balance at end of year | $ | 2,881 | $ | 6,225 | ||||
14. COMMITMENTS AND CONTINGENCIES
In the normal course of business, various commitments and contingent liabilities are outstanding, such as standby letters of credit and commitments to extend credit with off-balance-sheet risk that are not reflected in the consolidated financial statements. Financial instruments with off-balance-sheet risk involve elements of credit, interest rate, liquidity and market risk.
We do not anticipate any significant losses as a result of these transactions. The following summarizes these financial instruments and other commitments and contingent liabilities at their contract amounts:
| December 31, | ||||||||
| 2014 | 2013 | |||||||
| (In thousands) | ||||||||
| Commitments to extend credit: | ||||||||
| Unused lines of credit | $ | 110,411 | $ | 99,899 | ||||
| Loan commitments | 49,897 | 10,260 | ||||||
| Existing construction loan agreements | 11,419 | 14,667 | ||||||
| Standby letters of credit | 3,033 | 1,728 | ||||||
| F-37 |
We use the same credit policies in making commitments and conditional obligations as for on balance sheet instruments.
Commitments to extend credit are agreements to lend to a customer as long as there is no violation of any condition established in the contract. Commitments generally have fixed expiration dates or other termination clauses and may require payment of a fee. Since some commitments expire without being drawn upon, the total commitment amounts do not necessarily represent future cash requirements. We evaluate each customer’s creditworthiness on a case-by-case basis. The amount of collateral obtained, if deemed necessary by us upon extension of credit, is based on management’s credit evaluation of the counterparty. Collateral held varies but may include accounts receivable, inventory, property, plant and equipment, and income-producing commercial properties.
During 2012, we entered into a risk participation agreement (“RPA”) with another financial institution. The RPA is a guarantee to share credit risk associated with an interest rate swap on a participation loan in the event of counterparty default. As such, we accept a portion of the credit risk in order to participate in the loan and we receive a one-time fee. The interest rate swap is collateralized (generally by real estate or business assets) by us and the third party, which limits the credit risk associated with the RPA. Per the terms of the RPA, we must pledge collateral equal to our exposure for the interest rate swap. We monitor overall collateral as part of our off-balance sheet liability analysis, and at December 31, 2014, believe sufficient collateral is available to cover potential swap losses. The term of the RPA, which correspond to the term of the underlying swap, is 10 years. At December 31, 2014, the fair value of the interest rate swap was $1,500 of which we guarantee 50% of the amount in a default event. The maximum potential future payment guaranteed by us cannot be readily estimated, but is dependent upon the fair value of the interest rate swap and the probability of a default event. If an event of default on all contracts had occurred at December 31, 2014, we would have been required to make payments of approximately $750.
Standby letters of credit are written conditional commitments issued by us that guarantee the performance of a customer to a third party. Those guarantees are primarily issued to support public and private borrowing arrangements. The credit risk involved in issuing letters of credit is essentially the same as that involved in extending loan facilities to customers.
At December 31, 2014, outstanding commitments to extend credit totaled $174.8 million, with $33.2 million in fixed rate commitments with interest rates ranging from 2.45% to 18.00% and $141.6 million in variable rate commitments. At December 31, 2013, outstanding commitments to extend credit totaled $126.6 million, with $27.0 million in fixed rate commitments with interest rates ranging from 2.75% to 12.00% and $99.6 million in variable rate commitments.
In the ordinary course of business, we are party to various legal proceedings, none of which, in our opinion, will have a material effect on our consolidated financial position or results of operations.
We lease facilities and certain equipment under cancelable and non-cancelable leases expiring in various years through the year 2046. Certain of the leases provide for renewal periods for up to forty years at our discretion. Rent expense under operating leases was $707,000, $671,000, and $625,000 for the years ended December 31, 2014, 2013, and 2012, respectively.
| F-38 |
Aggregate future minimum rental payments under the terms of non-cancelable operating leases at December 31, 2014, are as follows:
| Year Ending December 31, | Amount | |||||
| (In thousands) | ||||||
| 2015 | $ | 653 | ||||
| 2016 | 521 | |||||
| 2017 | 406 | |||||
| 2018 | 377 | |||||
| 2019 | 355 | |||||
| Thereafter | 3,859 | |||||
| $ | 6,171 | |||||
Employment and change of control agreements
We have entered into employment and change of control agreements with certain senior officers. The initial term of the employment agreements is for three years subject to separate one-year extensions as approved by the Board of Directors at the end of each applicable fiscal year. Each employment agreement provides for minimum annual salaries, discretionary cash bonuses and other fringe benefits as well as severance benefits upon certain terminations of employment that are not for cause. The change of control agreements expire one year following a notice of non-extension and only provide for severance benefits upon certain terminations of employment that are not for cause and that are related to a change of control of the Company or the Bank.
15. CONCENTRATIONS OF CREDIT RISK
Most of our loans consist of residential and commercial real estate loans located in western Massachusetts. As of December 31, 2014 and 2013, our residential and commercial related real estate loans represented 76.9% and 78.3% of total loans, respectively. Our policy for collateral requires that the amount of the loan may not exceed 100% and 85% of the appraised value of the property for residential and commercial real estate, respectively, at the date the loan is granted. For residential loans, in cases where the loan exceeds 80%, private mortgage insurance is typically obtained for that portion of the loan in excess of 80% of the appraised value of the property.
16. FAIR VALUE OF ASSETS AND LIABLITIES
Determination of Fair Value
We use fair value measurements to record fair value adjustments to certain assets and liabilities and to determine fair value disclosures. The fair value of a financial instrument is the price that would be received to sell an asset or paid to transfer a liability in an orderly transaction between market participants at the measurement date. Fair value is best determined based upon quoted market prices. However, in many instances, there are no quoted market prices for our various financial instruments. In cases where quoted market prices are not available, fair values are based on estimates using present value or other valuation techniques. Those techniques are significantly affected by the assumptions used, including the discount rate and estimates of future cash flows. Accordingly, the fair value estimates may not be realized in an immediate settlement of the instrument.
Methods and assumptions for valuing our financial instruments are set forth below. Estimated fair values are calculated based on the value without regard to any premium or discount that may result from concentrations of ownership of a financial instrument, possible tax ramifications or estimated transaction cost.
Cash and cash equivalents - The carrying amounts of cash and short-term instruments approximate fair values based on the short-term nature of the assets. The carrying amounts of interest-bearing deposits in banks maturing within ninety days approximate their fair values. Fair values of other interest-bearing deposits are estimated using discounted cash flow analyses based on current market rates for similar types of deposits.
| F-39 |
Securities and mortgage-backed securities - The securities measured at fair value in Level 1 are based on quoted market prices in an active exchange market. These securities include marketable equity securities. All other securities are measured at fair value in Level 2 and are based on pricing models that consider standard input factors such as observable market data, benchmark yields, interest rate volatilities, broker/dealer quotes, credit spreads and new issue data. These securities include government-sponsored enterprise obligations, state and municipal obligations, residential mortgage-backed securities guaranteed and sponsored by the U.S. government or an agency thereof. Fair value measurements are obtained from a third-party pricing service and are not adjusted by management.
Federal Home Loan Bank and other stock - These investments are carried at cost which is their estimated redemption value.
Loans receivable - For adjustable-rate loans that reprice frequently and with no significant change in credit risk, fair values are based on carrying values. Fair values for other loans (e.g., commercial real estate and investment property mortgage loans, commercial and industrial loans and residential real estate) are estimated using discounted cash flow analyses, using market interest rates currently being offered for loans with similar terms to borrowers of similar credit quality. Fair values for non-performing loans are estimated using discounted cash flow analyses or underlying collateral values, where applicable.
Accrued interest - The carrying amounts of accrued interest approximate fair value.
Deposit liabilities - The fair values disclosed for demand deposits (e.g., interest and non-interest checking, passbook savings, and certain types of money market accounts) are, by definition, equal to the amount payable on demand at the reporting date (i.e., their carrying amounts). The carrying amounts of fixed-term money market accounts and certificates of deposit approximate their fair values at the reporting date. Fair values for fixed-rate certificates of deposit are estimated using a discounted cash flow calculation that applies market interest rates currently being offered on certificates to a schedule of aggregated expected monthly maturities on time deposits.
Short-term borrowings and long-term debt - The fair values of our debt instruments are estimated using discounted cash flow analyses based on the current incremental borrowing rates in the market for similar types of borrowing arrangements.
Interest rate swaps - The valuation of our interest rate swaps is obtained from a third-party pricing service and is determined using a discounted cash flow analysis on the expected cash flows of each derivative. The pricing analysis is based on observable inputs for the contractual terms of the derivatives, including the period to maturity and interest rate curves. We have determined that the majority of the inputs used to value our interest rate derivatives fall within Level 2 of the fair value hierarchy.
Commitments to extend credit - The stated value of commitments to extend credit approximates fair value as the current interest rates for similar commitments do not differ significantly. For fixed-rate loan commitments, fair value also considers the difference between current levels of interest rates and the committed rates. Such differences are not considered significant.
| F-40 |
Assets and Liabilities Measured at Fair Value on a Recurring Basis
Assets and liabilities measured at fair value on a recurring basis are summarized below:
| December 31, 2014 | ||||||||||||||||
| Level 1 | Level 2 | Level 3 | Total | |||||||||||||
| Assets: | (In thousands) | |||||||||||||||
| Government-sponsored residential mortgage-backed securities | $ | — | $ | 139,213 | $ | — | $ | 139,213 | ||||||||
| U.S. government guaranteed residential mortgage-backed securities | — | 1,586 | — | 1,586 | ||||||||||||
| Corporate bonds | — | 26,223 | — | 26,223 | ||||||||||||
| State and municipal bonds | — | 17,034 | — | 17,034 | ||||||||||||
| Government-sponsored enterprise obligations | — | 23,979 | — | 23,979 | ||||||||||||
| Mutual funds | 6,176 | — | — | 6,176 | ||||||||||||
| Common and preferred stock | 1,539 | — | — | 1,539 | ||||||||||||
| Total securities available for sale | 7,715 | 208,035 | — | 215,750 | ||||||||||||
| Interest rate swaps | — | 9 | — | 9 | ||||||||||||
| Total assets | $ | 7,715 | $ | 208,044 | $ | — | $ | 215,759 | ||||||||
| Liabilities: | ||||||||||||||||
| Interest rate swaps | $ | — | $ | 5,748 | $ | — | $ | 5,748 | ||||||||
| December 31, 2013 | ||||||||||||||||
| Level 1 | Level 2 | Level 3 | Total | |||||||||||||
| Assets: | (In thousands) | |||||||||||||||
| Government-sponsored residential mortgage-backed securities | $ | — | $ | 132,372 | $ | — | $ | 132,372 | ||||||||
| U.S. government guaranteed residential mortgage-backed securities | — | 46,328 | — | 46,328 | ||||||||||||
| Corporate bonds | — | 27,389 | — | 27,389 | ||||||||||||
| State and municipal bonds | — | 18,897 | — | 18,897 | ||||||||||||
| Government-sponsored enterprise obligations | — | 10,700 | — | 10,700 | ||||||||||||
| Mutual funds | 5,919 | — | — | 5,919 | ||||||||||||
| Common and preferred stock | 1,599 | — | — | 1,599 | ||||||||||||
| Total securities available for sale | 7,518 | 235,686 | — | 243,204 | ||||||||||||
| Interest rate swaps | — | 1,755 | — | 1,755 | ||||||||||||
| Total assets | $ | 7,518 | $ | 237,441 | $ | — | $ | 244,959 | ||||||||
There were no transfers to or from Level 1 and 2 for assets measured at fair value on a recurring basis during the years ended December 31, 2014 and 2013. There were no liabilities measured at fair value on a recurring basis at December 31, 2013.
| F-41 |
Assets Measured at Fair Value on a Non-recurring Basis
We may also be required, from time to time, to measure certain other financial assets on a nonrecurring basis in accordance with generally accepted accounting principles. These adjustments to fair value usually result from application of lower-of-cost-or-market accounting or write-downs of individual assets. The following table summarizes the fair value hierarchy used to determine the carrying values of the related assets as of December 31, 2014 and 2013.
| At | Year Ended | |||||||||||||||
| December 31, 2014 | December 31, 2014 | |||||||||||||||
| Total | ||||||||||||||||
| Level 1 | Level 2 | Level 3 | Losses | |||||||||||||
| (In thousands) | (In thousands) | |||||||||||||||
| Impaired loans | $ | — | $ | — | $ | 5,149 | $ | (1,036 | ) | |||||||
| Total assets | $ | — | $ | — | $ | 5,149 | $ | (1,036 | ) | |||||||
| At | Year Ended | |||||||||||||||
| December 31, 2013 | December 31, 2013 | |||||||||||||||
| Total | ||||||||||||||||
| Level 1 | Level 2 | Level 3 | Losses | |||||||||||||
| (In thousands) | (In thousands) | |||||||||||||||
| Impaired loans | $ | — | $ | — | $ | 2,069 | $ | (31 | ) | |||||||
| Total assets | $ | — | $ | — | $ | 2,069 | $ | (31 | ) | |||||||
The amount of impaired loans represents the carrying value, and net of the related write-down or valuation allowance of impaired loans for which adjustments are based on the estimated fair value of the underlying collateral. The fair value of impaired loans with specific allocations of the allowance for loan losses is generally based on real estate appraisals performed by independent licensed or certified appraisers. These appraisals may utilize a single valuation approach or a combination of approaches including comparable sales and the income approach. Adjustments are routinely made in the appraisal process by the appraisers to adjust for differences between the comparable sales and income data available. Management will discount appraisals as deemed necessary based on the date of the appraisal and new information deemed relevant to the valuation. Such adjustments are typically significant and result in a Level 3 classification of the inputs for determining fair value. The resulting losses were recognized in earnings through the provision for loan losses.
There were no liabilities measured at fair value on a non-recurring basis at December 31, 2014 or 2013.
| F-42 |
Summary of Fair Values of Financial Instruments
The estimated fair values of our financial instruments are as follows:
| December 31, 2014 | ||||||||||||||||||||
| Carrying Value | Fair Value | |||||||||||||||||||
| Level 1 | Level 2 | Level 3 | Total | |||||||||||||||||
| (In thousands) | ||||||||||||||||||||
| Assets: | ||||||||||||||||||||
| Cash and cash equivalents | $ | 18,785 | $ | 18,785 | $ | — | $ | — | $ | 18,785 | ||||||||||
| Securities available for sale | 215,750 | 7,715 | 208,035 | — | 215,750 | |||||||||||||||
| Securities held to maturity | 278,080 | — | 277,636 | — | 277,636 | |||||||||||||||
| Federal Home Loan Bank of Boston and other restricted stock | 14,934 | — | — | 14,934 | 14,934 | |||||||||||||||
| Loans - net | 716,738 | — | — | 721,818 | 721,818 | |||||||||||||||
| Accrued interest receivable | 4,213 | — | — | 4,213 | 4,213 | |||||||||||||||
| Derivative assets | 9 | — | 9 | — | 9 | |||||||||||||||
| Liabilities: | ||||||||||||||||||||
| Deposits | 834,218 | — | — | 834,838 | 834,838 | |||||||||||||||
| Short-term borrowings | 93,997 | — | 93,997 | — | 93,997 | |||||||||||||||
| Long-term debt | 232,479 | — | 236,457 | — | 236,457 | |||||||||||||||
| Accrued interest payable | 501 | — | — | 501 | 501 | |||||||||||||||
| Derivative liabilities | 5,748 | — | 5,748 | — | 5,748 | |||||||||||||||
| December 31, 2013 | ||||||||||||||||||||
| Carrying Value | Fair Value | |||||||||||||||||||
| Level 1 | Level 2 | Level 3 | Total | |||||||||||||||||
| (In thousands) | ||||||||||||||||||||
| Assets: | ||||||||||||||||||||
| Cash and cash equivalents | $ | 19,742 | $ | 19,742 | $ | — | $ | — | $ | 19,742 | ||||||||||
| Securities available for sale | 243,204 | 7,518 | 237,441 | — | 243,204 | |||||||||||||||
| Securities held to maturity | 295,013 | — | 282,555 | — | 282,555 | |||||||||||||||
| Federal Home Loan Bank of Boston and other restricted stock | 15,631 | — | — | 15,631 | 15,631 | |||||||||||||||
| Loans - net | 629,968 | — | — | 631,417 | 631,417 | |||||||||||||||
| Accrued interest receivable | 4,201 | — | — | 4,201 | 4,201 | |||||||||||||||
| Derivative assets | 1,755 | — | 1,755 | — | 1,755 | |||||||||||||||
| Liabilities: | ||||||||||||||||||||
| Deposits | 817,112 | — | — | 819,109 | 819,109 | |||||||||||||||
| Short-term borrowings | 48,197 | — | 48,197 | — | 48,197 | |||||||||||||||
| Long-term debt | 248,377 | — | 251,678 | — | 251,678 | |||||||||||||||
| Accrued interest payable | 392 | — | — | 392 | 392 | |||||||||||||||
Limitations - Fair value estimates are made at a specific point in time, based on relevant market information and information about the financial instrument. These estimates do not reflect any premium or discount that could result from offering for sale at one time our entire holdings of a particular financial instrument. Where quoted market prices are not available, fair value estimates are based on judgments regarding future expected loss experience, current economic conditions, risk characteristics of various financial instruments, and other factors. These estimates are subjective in nature and involve uncertainties and matters of significant judgment. Changes in assumptions could significantly affect the estimates.
| F-43 |
17. SEGMENT INFORMATION
We have one reportable segment, “Community Banking.” All of our activities are interrelated, and each activity is dependent and assessed based on how each of the activities supports the others. For example, commercial lending is dependent upon the ability of the Bank to fund itself with retail deposits and other borrowings and to manage interest rate and credit risk. This situation is also similar for consumer and residential mortgage lending. Accordingly, all significant operating decisions are based upon our analysis as one operating segment or unit.
We operate only in the U.S. domestic market, primarily in western Massachusetts and northern Connecticut. For the years ended December 31, 2014, 2013 and 2012, there is no customer that accounted for more than 10% of our revenue.
18. CONDENSED PARENT COMPANY FINANCIAL STATEMENTS
The condensed balance sheets of the parent company are as follows:
| December 31, | ||||||||
| 2014 | 2013 | |||||||
| (In thousands) | ||||||||
| ASSETS: | ||||||||
| Cash equivalents | $ | 178 | $ | 158 | ||||
| Securities available for sale | 1,539 | 1,599 | ||||||
| Investment in subsidiaries | 134,836 | 146,951 | ||||||
| ESOP loan receivable | 8,822 | 9,269 | ||||||
| Other assets | 6,184 | 5,912 | ||||||
| TOTAL ASSETS | 151,559 | 163,889 | ||||||
| LIABILITIES: | ||||||||
| ESOP loan payable | 8,822 | 9,269 | ||||||
| Other liabilities | 194 | 476 | ||||||
| EQUITY | 142,543 | 154,144 | ||||||
| TOTAL LIABILITIES AND EQUITY | $ | 151,559 | $ | 163,889 | ||||
The condensed statements of income for the parent company are as follows:
| Years Ended December 31, | ||||||||||||
| 2014 | 2013 | 2012 | ||||||||||
| (In thousands) | ||||||||||||
| INCOME: | ||||||||||||
| Dividends from subsidiaries | $ | 14,712 | $ | 26,964 | $ | 42,372 | ||||||
| Interest income from securities | 31 | 16 | 68 | |||||||||
| ESOP loan interest income | 741 | 777 | 813 | |||||||||
| Gain on sale of securities, net | — | 3 | — | |||||||||
| Total income | 15,484 | 27,760 | 43,253 | |||||||||
| OPERATING EXPENSE: | ||||||||||||
| Salaries and employee benefits | 697 | 879 | 2,262 | |||||||||
| ESOP interest | 741 | 777 | 813 | |||||||||
| Other | 503 | 586 | 511 | |||||||||
| Total operating expense | 1,941 | 2,242 | 3,586 | |||||||||
| INCOME BEFORE EQUITY IN UNDISTRIBUTED | ||||||||||||
| INCOME OF SUBSIDIARIES AND INCOME TAXES | 13,543 | 25,518 | 39,667 | |||||||||
| EQUITY IN UNDISTRIBUTED LOSS OF SUBSIDIARIES | (7,655 | ) | (19,073 | ) | (34,130 | ) | ||||||
| NET INCOME BEFORE TAXES | 5,888 | 6,445 | 5,537 | |||||||||
| INCOME TAX BENEFIT | (274 | ) | (311 | ) | (717 | ) | ||||||
| NET INCOME | $ | 6,162 | $ | 6,756 | $ | 6,254 | ||||||
| F-44 |
The condensed statements of cash flows of the parent company are as follows:
| Years Ended December 31, | ||||||||||||
| 2014 | 2013 | 2012 | ||||||||||
| (In thousands) | ||||||||||||
| OPERATING ACTIVITIES: | ||||||||||||
| Net income | $ | 6,162 | $ | 6,756 | $ | 6,254 | ||||||
| Dividends in excess of earnings of subsidiaries | 7,655 | 19,073 | 34,130 | |||||||||
| Net realized securities gains | — | (3 | ) | — | ||||||||
| Change in other liabilities | (409 | ) | 198 | 36 | ||||||||
| Change in other assets | 174 | (487 | ) | (271 | ) | |||||||
| Other, net | 667 | 1,422 | 2,089 | |||||||||
| Net cash provided by operating activities | 14,249 | 26,959 | 42,238 | |||||||||
| INVESTING ACTIVITIES: | ||||||||||||
| Purchase of securities | (235 | ) | (349 | ) | (1,533 | ) | ||||||
| Proceeds from principal collections of securities | — | 1,307 | 575 | |||||||||
| Sales of securities | 235 | 352 | 566 | |||||||||
| Net cash provided by (used in) investing activities | — | 1,310 | (392 | ) | ||||||||
| FINANCING ACTIVITIES: | ||||||||||||
| Cash dividends paid | (3,832 | ) | (5,872 | ) | (10,721 | ) | ||||||
| Common stock repurchased | (10,518 | ) | (20,093 | ) | (32,083 | ) | ||||||
| Tender offer to purchase outstanding options | 121 | (2,151 | ) | — | ||||||||
| Excess tax expense in connection with tender offer completion | — | (566 | ) | |||||||||
| Excess tax (shortfall) benefit from share-based compensation | — | (1 | ) | 144 | ||||||||
| Issuance of common stock to ESOP | — | — | — | |||||||||
| Issuance of common stock in connection with stock | ||||||||||||
| option exercises | — | — | 1,041 | |||||||||
| Repayment of long-term debt | — | — | (446 | ) | ||||||||
| Net cash used in financing activities | (14,229 | ) | (28,683 | ) | (42,065 | ) | ||||||
| NET DECREASE IN CASH AND | ||||||||||||
| CASH EQUIVALENTS | 20 | (414 | ) | (219 | ) | |||||||
| CASH AND CASH EQUIVALENTS | ||||||||||||
| Beginning of year | 158 | 572 | 791 | |||||||||
| End of year | $ | 178 | $ | 158 | $ | 572 | ||||||
| Supplemental cashflow information: | ||||||||||||
| Net cash due to (from) broker for common stock repurchased | — | 299 | (352 | ) | ||||||||
| F-45 |
19. OTHER NONINTEREST EXPENSE
There is no item that as a component of other noninterest expense exceeded 1% of the aggregate of total interest income and noninterest income for the years ended December 31, 2014, 2013 and 2012.
20. SUMMARY OF QUARTERLY FINANCIAL INFORMATION (UNAUDITED)
The following tables present a summary of our quarterly financial information for the periods indicated. The year to date totals may differ slightly due to rounding.
| 2014 | ||||||||||||||||
| First Quarter | Second Quarter | Third Quarter | Fourth Quarter | |||||||||||||
| (Dollars in thousands, except per share amounts) | ||||||||||||||||
| Interest and dividend income | $ | 10,034 | $ | 10,143 | $ | 10,343 | $ | 10,471 | ||||||||
| Interest expense | 2,379 | 2,442 | 2,509 | 2,593 | ||||||||||||
| Net interest and dividend income | 7,655 | 7,701 | 7,834 | 7,878 | ||||||||||||
| Provision for loan losses | 100 | 450 | 750 | 275 | ||||||||||||
| Other noninterest income | 1,049 | 1,018 | 1,039 | 1,033 | ||||||||||||
| Gain on sales of securities, net | 29 | 21 | 226 | 44 | ||||||||||||
| Noninterest expense | 6,534 | 6,531 | 6,348 | 6,496 | ||||||||||||
| Income before income taxes | 2,099 | 1,759 | 2,001 | 2,184 | ||||||||||||
| Income tax provision | 451 | 417 | 491 | 523 | ||||||||||||
| Net income | $ | 1,648 | $ | 1,342 | $ | 1,510 | $ | 1,661 | ||||||||
| Basic earnings per share | $ | 0.09 | $ | 0.07 | $ | 0.08 | $ | 0.09 | ||||||||
| Diluted earnings per share | $ | 0.09 | $ | 0.07 | $ | 0.08 | $ | 0.09 | ||||||||
| 2013 | ||||||||||||||||
| First Quarter | Second Quarter | Third Quarter | Fourth Quarter | |||||||||||||
| (Dollars in thousands, except per share amounts) | ||||||||||||||||
| Interest and dividend income | $ | 10,349 | $ | 10,246 | $ | 10,348 | $ | 10,089 | ||||||||
| Interest expense | 2,679 | 2,609 | 2,520 | 2,482 | ||||||||||||
| Net interest and dividend income | 7,670 | 7,637 | 7,828 | 7,607 | ||||||||||||
| Provision for loan losses | (235 | ) | (70 | ) | (71 | ) | 120 | |||||||||
| Other noninterest income | 957 | 981 | 1,003 | 1,013 | ||||||||||||
| Gain on bank-owned life insurance | — | 563 | — | — | ||||||||||||
| Loss on prepayment of borrowings | (1,426 | ) | (1,404 | ) | (540 | ) | — | |||||||||
| Gain on sales of securities, net | 1,427 | 823 | 546 | 330 | ||||||||||||
| Noninterest expense | 6,515 | 6,789 | 6,851 | 6,488 | ||||||||||||
| Income before income taxes | 2,348 | 1,881 | 2,057 | 2,342 | ||||||||||||
| Income tax provision | 566 | 297 | 476 | 533 | ||||||||||||
| Net income | $ | 1,782 | $ | 1,584 | $ | 1,581 | $ | 1,809 | ||||||||
| Basic earnings per share | $ | 0.08 | $ | 0.08 | $ | 0.08 | $ | 0.09 | ||||||||
| Diluted earnings per share | $ | 0.08 | $ | 0.08 | $ | 0.08 | $ | 0.09 | ||||||||
| F-46 |
EXHIBIT INDEX
| 3.1 | Articles of Organization of New Westfield Financial, Inc. (incorporated by reference to Exhibit 3.1 of the Registration Statement on Form S-1 (No. 333-137024) filed with the SEC on August 31, 2006). |
| 3.2 | Articles of Amendment of New Westfield Financial, Inc. (incorporated by reference to Exhibit 3.3 of the Form 8-K filed with the SEC on January 5, 2007). |
| 3.3 | Amended and Restated Bylaws of Westfield Financial, Inc. (incorporated by reference to Exhibit 3.2 of the Form 10-K filed with the SEC on March 14, 2011). |
| 4.1 | Form of Stock Certificate of Westfield Financial, Inc. (incorporated by reference to Exhibit 4.1 of the Registration Statement on Form S-1 (No. 333-137024) filed with the SEC on August 31, 2006). |
| 10.1* | Form of Employee Stock Ownership Plan of Westfield Financial, Inc. (incorporated by reference to Exhibit 10.1 of the Form 10-Q filed with the SEC on November 8, 2011). |
| 10.2* | Form of Director’s Deferred Compensation Plan (incorporated by reference to Exhibit 10.7 of the Form 8-K filed with the SEC on December 22, 2005). |
| 10.3* | The 401(k) Plan adopted by Westfield Bank (incorporated herein by reference to Exhibit 4.1 of the Post-Effective Amendment No. 1 to the Registration Statement on Form S-8 (No. 333-73132) filed with the SEC on April 28, 2006). |
| 10.4* | Amendment to the 401(k) Plan adopted by Westfield Bank (incorporated by reference to Exhibit 10.11 of the Form 8-K filed with the SEC on July 13, 2006). |
| 10.5* | Amended and Restated Benefit Restoration Plan of Westfield Financial, Inc. (incorporated by reference to Exhibit 10.5 of the Form 8-K filed with the SEC on October 29, 2007). |
| 10.6* | Form of Amended and Restated Deferred Compensation Agreement with Donald A. Williams (incorporated by reference to Exhibit 10.10 of the Form 8-K filed with the SEC on December 22, 2005). |
| 10.7* | Amended and Restated Employment Agreement between James C. Hagan and Westfield Bank (incorporated by reference to Exhibit 10.9 of the Form 8-K filed with the SEC on January 5, 2009). |
| 10.8* | Amended and Restated Employment Agreement between James C. Hagan and Westfield Financial, Inc. (incorporated by reference to Exhibit 10.12 of the Form 8-K filed with the SEC on January 5, 2009). |
| 10.9 | Agreement between Westfield Bank and Village Mortgage Company (incorporated by reference to Exhibit 10.17 of Amendment No. 1 of the Registration Statement No. 333-137024 on Form S-1 filed with the SEC on August 31, 2006). |
| 10.10* | Employment Agreement between Leo R. Sagan, Jr. and Westfield Bank (incorporated by reference to Exhibit 10.15 of the Form 8-K filed with the SEC on January 5, 2009). |
| 10.11* | Employment Agreement between Leo R. Sagan, Jr. and Westfield Financial, Inc. (incorporated by reference to Exhibit 10.16 of the Form 8-K filed with the SEC on January 5, 2009). |
| 10.12* | Employment Agreement between Gerald P. Ciejka and Westfield Bank (incorporated by reference to Exhibit 10.17 of the Form 8-K filed with the SEC on January 5, 2009). |
| 10.13* | Employment Agreement between Gerald P. Ciejka and Westfield Financial, Inc. (incorporated by reference to Exhibit 10.18 of the Form 8-K filed with the SEC on January 5, 2009). |
| 10.14* | Employment Agreement between Allen J. Miles, III and Westfield Bank (incorporated by reference to Exhibit 10.19 of the Form 8-K filed with the SEC on January 5, 2009). |
| 10.15* | Employment Agreement between Allen J. Miles, III and Westfield Financial, Inc. (incorporated by reference to Exhibit 10.20 of the Form 8-K filed with the SEC on January 5, 2009). |
| 10.16* | 2002 Stock Option Plan (incorporated by reference to Appendix B of the Schedule 14A filed with the SEC on May 24, 2002). |
| 10.17* | Amendment to the 2002 Stock Option Plan (incorporated by reference to Appendix A of the Schedule 14A filed with the SEC on April 25, 2003). |
| 10.18* | 2002 Recognition and Retention Plan (incorporated by reference to Appendix C of the Schedule 14A filed with the SEC on May 24, 2002). |
| 10.19* | Amendment to the 2002 Recognition and Retention Plan (incorporated by reference to Appendix B of the Schedule 14A filed with the SEC on April 25, 2003). |
| 10.20* | 2007 Stock Option Plan (incorporated by reference to Appendix A of the Schedule 14A filed with the SEC on June 18, 2007). |
| 10.21* | Amendment to the 2007 Stock Option Plan (incorporated by reference to Appendix B of the Schedule 14A filed with the SEC on April 14, 2008). |
| 10.22* | 2007 Recognition and Retention Plan (incorporated by reference to Appendix B of the Schedule 14A filed with the SEC on June 18, 2007). |
| 10.23* | Amendment to the 2007 Recognition and Retention Plan (incorporated by reference to Appendix C of the Schedule 14A filed with the SEC on April 14, 2008). |
| 10.24* | 2014 Omnibus Incentive Plan (incorporated by reference to Exhibit 10.1 to the Form 8-K filed with the SEC on May 19, 2014). |
| 21.1 | Subsidiaries of Westfield Financial (incorporated by reference to Exhibit 21.1 of the Form 10-K filed with the SEC on March 15, 2013). |
| 23.1† | Consent of Wolf & Company, P.C. |
| 31.1† | Certification of Chief Executive Officer pursuant to Section 302 of the Sarbanes-Oxley Act of 2002. |
| 31.2† | Certification of Chief Financial Officer pursuant to Section 302 of the Sarbanes-Oxley Act of 2002. |
| 32.1† | Certification of Chief Executive Officer pursuant to Section 906 of the Sarbanes-Oxley Act of 2002. |
| 32.2† | Certification of Chief Financial Officer pursuant to Section 906 of the Sarbanes-Oxley Act of 2002. |
| 101** | Financial statements from the annual report on Form 10-K of Westfield Financial, Inc. for the year ended December 31, 2014, formatted in XBRL (eXtensible Business Reporting Language): (i) the Consolidated Balance Sheets, (ii) the Consolidated Statements of Operations, (iii) the Consolidated Statements of Shareholders’ Equity and Comprehensive Income, (iv) the Consolidated Statements of Cash Flows and (v) Notes to Consolidated Financial Statements. |
_______________________________
| † | Filed herewith. |
| * | Management contract or compensatory plan or arrangement. |
| ** | Pursuant to Rule 406T of Regulation S-T, the Interactive Data Files on Exhibit 101 hereto are deemed not filed or part of a registration statement or prospectus for purposes of Sections 11 or 12 of the Securities Act of 1933, as amended, are deemed not filed for purposes of Section 18 of the Securities Exchange Act of 1934, as amended, and otherwise are not subject to liability under those sections. |
Westfield Financial, Inc. 10-K
Exhibit 23.1
CONSENT OF INDEPENDENT REGISTERED PUBLIC ACCOUNTING FIRM
We consent to the incorporation by reference in Westfield Financial, Inc.’s Registration Statements (Nos. 333-73132, 333-98903, 333-145857 and 333-197928) on Forms S-8 of our reports dated March 13, 2015 relating to our audits of the consolidated financial statements and internal control over financial reporting of Westfield Financial, Inc. and subsidiaries which appear in this Annual Report on Form 10-K for the year ended December 31, 2014.
| /s/ WOLF & COMPANY, P.C. | |
| Boston, Massachusetts | |
| March 13, 2015 |
Westfield Financial, Inc. 10-K
Exhibit 31.1
CERTIFICATION OF THE CHIEF EXECUTIVE OFFICER
PURSUANT TO SECTION 302 OF THE SARBANES-OXLEY ACT OF 2002
I, James C. Hagan, certify that:
| 1. | I have reviewed this annual report on Form 10-K of Westfield Financial, Inc.; |
| 2. | Based on my knowledge, this report does not contain any untrue statement of a material fact or omit to state a material fact necessary to make the statements made, in light of the circumstances under which such statements were made, not misleading with respect to the period covered by this report; |
| 3. | Based on my knowledge, the financial statements, and other financial information included in this report, fairly present in all material respects the financial condition, results of operations and cash flows of the registrant as of, and for, the periods presented in this report; |
| 4. | The registrant’s other certifying officer and I are responsible for establishing and maintaining disclosure controls and procedures (as defined in Exchange Act Rules 13a-15(e) and 15d-15(e)) and internal control over financial reporting (as defined in Exchange Act Rules 13a-15(f) and 15d-15(f)) for the registrant and have: |
| (a) | Designed such disclosure controls and procedures, or caused such disclosure controls and procedures to be designed under our supervision, to ensure that material information relating to the registrant, including its consolidated subsidiaries, is made known to us by others within those entities, particularly during the period in which this report is being prepared; |
| (b) | Designed such internal control over financial reporting, or caused such internal control over financial reporting to be designed under our supervision, to provide reasonable assurance regarding the reliability of financial reporting and the preparation of financial statements for external purposes in accordance with generally accepted accounting principles; |
| (c) | Evaluated the effectiveness of the registrant’s disclosure controls and procedures and presented in this report our conclusions about the effectiveness of the disclosure controls and procedures, as of the end of the period covered by this report based on such evaluation; and |
| (d) | Disclosed in this report any change in the registrant’s internal control over financial reporting that occurred during the registrant’s most recent fiscal quarter (the registrant’s fourth fiscal quarter in the case of an annual report) that has materially affected, or is reasonably likely to materially affect, the registrant’s internal control over financial reporting; and |
| 5. | The registrant’s other certifying officer and I have disclosed, based on our most recent evaluation of internal control over financial reporting, to the registrant’s auditors and the audit committee of the registrant’s board of directors (or persons performing the equivalent functions): |
| (a) | All significant deficiencies and material weaknesses in the design or operation of internal control over financial reporting which are reasonably likely to adversely affect the registrant’s ability to record, process, summarize and report financial information; and |
| (b) | Any fraud, whether or not material, that involves management or other employees who have a significant role in the registrant’s internal control over financial reporting. |
| Date: March 13, 2015 | /s/ James C. Hagan |
| James C. Hagan | |
| Chief Executive Officer and President | |
|
(Principal Executive Officer) |
Westfield Financial, Inc. 10-K
Exhibit 31.2
CERTIFICATION OF THE CHIEF FINANCIAL OFFICER
PURSUANT TO SECTION 302 OF THE SARBANES-OXLEY ACT OF 2002
I, Leo R. Sagan, Jr., certify that:
| 1. | I have reviewed this annual report on Form 10-K of Westfield Financial, Inc.; |
| 2. | Based on my knowledge, this report does not contain any untrue statement of a material fact or omit to state a material fact necessary to make the statements made, in light of the circumstances under which such statements were made, not misleading with respect to the period covered by this report; |
| 3. | Based on my knowledge, the financial statements, and other financial information included in this report, fairly present in all material respects the financial condition, results of operations and cash flows of the registrant as of, and for, the periods presented in this report; |
| 4. | The registrant’s other certifying officer and I are responsible for establishing and maintaining disclosure controls and procedures (as defined in Exchange Act Rules 13a-15(e) and 15d-15(e)) and internal control over financial reporting (as defined in Exchange Act Rules 13a-15(f) and 15d-15(f)) for the registrant and have: |
| (a) | Designed such disclosure controls and procedures, or caused such disclosure controls and procedures to be designed under our supervision, to ensure that material information relating to the registrant, including its consolidated subsidiaries, is made known to us by others within those entities, particularly during the period in which this report is being prepared; |
| (b) | Designed such internal control over financial reporting, or caused such internal control over financial reporting to be designed under our supervision, to provide reasonable assurance regarding the reliability of financial reporting and the preparation of financial statements for external purposes in accordance with generally accepted accounting principles; |
| (c) | Evaluated the effectiveness of the registrant’s disclosure controls and procedures and presented in this report our conclusions about the effectiveness of the disclosure controls and procedures, as of the end of the period covered by this report based on such evaluation; and |
| (d) | Disclosed in this report any change in the registrant’s internal control over financial reporting that occurred during the registrant’s most recent fiscal quarter (Westfield Financial’s fourth fiscal quarter in the case of an annual report) that has materially affected, or is reasonably likely to materially affect, the registrant’s internal control over financial reporting; and |
| 5. | The registrant’s other certifying officer and I have disclosed, based on our most recent evaluation of internal control over financial reporting, to the registrant’s auditors and the audit committee of the registrant’s board of directors (or persons performing the equivalent functions): |
| (a) | All significant deficiencies and material weaknesses in the design or operation of internal control over financial reporting which are reasonably likely to adversely affect the registrant’s ability to record, process, summarize and report financial information; and |
| (b) | Any fraud, whether or not material, that involves management or other employees who have a significant role in the registrant’s internal control over financial reporting. |
|
Date: March 13, 2015 |
/s/Leo R. Sagan, Jr | |
|
Leo R. Sagan, Jr. | ||
| Chief Financial Officer and Treasurer | ||
| (Principal Financial and Accounting Officer) | ||
Westfield Financial, Inc. 10-K
Exhibit 32.1
statement
furnished pursuant to section 906 of the
sarbanes-oxley act of 2002, 18 u.s.c. section 1350
The undersigned, James C. Hagan, is the Chief Executive Officer and President of Westfield Financial, Inc. (“Westfield Financial”).
This statement is being furnished in connection with the filing by Westfield Financial of Westfield Financial’s Annual Report on Form 10-K for the period ended December 31, 2014 (the “Report”).
By execution of this statement, I certify that:
| A) | the Report fully complies with the requirements of Section 13(a) or 15(d), as applicable, of the Securities Exchange Act of 1934, and |
| B) | the information contained in the Report fairly presents, in all material respects, the financial condition and results of operations of Westfield Financial as of the dates and for the periods covered by the Report. |
This statement is authorized to be attached as an exhibit to the Report so that this statement will accompany the Report at such time as the Report is filed with the Securities and Exchange Commission, pursuant to Section 906 of the Sarbanes-Oxley Act of 2002, 18 U.S.C. Section 1350. It is not intended that this statement be deemed to be filed for purposes of the Securities Exchange Act of 1934, as amended.
A signed original of this written statement required by Section 906 has been provided to Westfield Financial, Inc. and will be retained by Westfield Financial, Inc. and furnished to the Securities and Exchange Commission or its staff upon request.
| March 13, 2015 | /s/ James C. Hagan | |
| Dated | James C. Hagan | |
| Chief Executive Officer and President | ||
| (Principal Executive Officer) |
Westfield Financial, Inc. 10-K
Exhibit 32.2
statement furnished
pursuant to section 906 of the
sarbanes-oxley act of 2002, 18 u.s.c. section 1350
The undersigned, Leo R. Sagan, Jr., Chief Financial Officer and Treasurer of Westfield Financial, Inc. (“Westfield Financial”).
This statement is being furnished in connection with the filing by Westfield Financial of Westfield Financial’s Annual Report on Form 10-K for the period ended December 31, 2014 (the “Report”).
By execution of this statement, I certify that:
| A) | the Report fully complies with the requirements of Section 13(a) or 15(d), as applicable, of the Securities Exchange Act of 1934, and |
| B) | the information contained in the Report fairly presents, in all material respects, the financial condition and results of operations of Westfield Financial as of the dates and for the periods covered by the Report. |
This statement is authorized to be attached as an exhibit to the Report so that this statement will accompany the Report at such time as the Report is filed with the Securities and Exchange Commission, pursuant to Section 906 of the Sarbanes-Oxley Act of 2002, 18 U.S.C. Section 1350. It is not intended that this statement be deemed to be filed for purposes of the Securities Exchange Act of 1934, as amended.
A signed original of this written statement required by Section 906 has been provided to Westfield Financial, Inc. and will be retained by Westfield Financial, Inc. and furnished to the Securities and Exchange Commission or its staff upon request.
| March 13, 2015 | /s/Leo R. Sagan, Jr |
| Dated | Leo R. Sagan, Jr. |
|
Chief Financial Officer and Treasurer | |
| (Principal Financial and Accounting Officer) |
Serious News for Serious Traders! Try StreetInsider.com Premium Free!
You May Also Be Interested In
- VFS Stockholders: Contact Robbins LLP for Information About the VinFast Auto Ltd. Securities Class Action Lawsuit
- INVZ Stockholders: Robbins LLP Reminds INVZ Stockholders of Pending Lead Plaintiff Deadline in Class Action Against the Company
- Fulton Financial Corporation Acquires Substantially All of the Assets and Assumes Substantially All of the Deposits of Republic First Bank From the FDIC
Create E-mail Alert Related Categories
SEC FilingsSign up for StreetInsider Free!
Receive full access to all new and archived articles, unlimited portfolio tracking, e-mail alerts, custom newswires and RSS feeds - and more!
