

Form 10-K SOVRAN SELF STORAGE INC For: Dec 31
 Tweet
Tweet Share
ShareTable of Contents
UNITED STATES
SECURITIES AND EXCHANGE COMMISSION
Washington, D.C. 20549
FORM 10-K
ANNUAL REPORT PURSUANT TO SECTION 13 OR 15(d)
OF THE SECURITIES EXCHANGE ACT OF 1934
For the fiscal year ended December 31, 2014
Commission File Number: 1-13820
SOVRAN SELF STORAGE, INC.
(Exact name of Registrant as specified in its charter)
| Maryland | 16-1194043 | |
| (State of incorporation or organization) |
(I.R.S. Employer Identification No.) |
6467 Main Street
Williamsville, NY 14221
(Address of principal executive offices) (Zip code)
(716) 633-1850
(Registrant’s telephone number including area code)
Securities registered pursuant to Section 12(b) of the Act:
| Title of Securities |
Exchanges on which Registered | |
| Common Stock, $.01 Par Value | New York Stock Exchange |
Securities registered pursuant to section 12(g) of the Act: None
Indicate by check mark if the registrant is a well-known seasoned issuer, as defined in Rule 405 of the Securities Act. Yes x No ¨
Indicate by check mark if the registrant is not required to file reports pursuant to Section 13 or Section 15(d) of the Exchange Act. Yes ¨ No x
Indicate by check mark whether the registrant (1) has filed all reports required to be filed by Section 13 or 15(d) of the Securities Exchange Act of 1934 during the preceding 12 months (or for such shorter period that the registrant was required to file such reports), and (2) has been subject to such filing requirements for the past 90 days. Yes x No ¨
Indicate by check mark whether the registrant has submitted electronically and posted on its corporate Web site, if any, every Interactive Data File required to be submitted and posted pursuant to Rule 405 of Regulation S-T (§ 232.405 of this chapter) during the preceding 12 months (or for such shorter period that the registrant was required to submit and post such files). Yes x No ¨
Indicate by check mark if disclosure of delinquent filers pursuant to Item 405 of Regulation S-K is not contained herein, and will not be contained, to the best of registrant’s knowledge, in definitive proxy or information statements incorporated by reference in Part III of this Form 10-K or any amendment to this Form 10-K. x
Indicate by check mark whether the registrant is a large accelerated filer, an accelerated filer, a non-accelerated filer or a smaller reporting company. See the definitions of “large accelerated filer,” “accelerated filer” and “smaller reporting company” in Rule 12b-2 of the Exchange Act. (Check one):
| Large accelerated filer | x | Accelerated filer | ¨ | |||
| Non-accelerated filer | ¨ | Smaller reporting company | ¨ | |||
Indicate by check mark whether the registrant is a shell company (as defined in Rule 12b-2 of the Exchange Act). Yes ¨ No x
As of June 30, 2014, 33,240,930 shares of Common Stock, $.01 par value per share, were outstanding, and the aggregate market value of the Common Stock held by non-affiliates was approximately $2,505,480,768 (based on the closing price of the Common Stock on the New York Stock Exchange on June 30, 2014).
As of February 13, 2015, 34,174,772 shares of Common Stock, $.01 par value per share, were outstanding.
DOCUMENTS INCORPORATED BY REFERENCE
Portions of the registrant’s Proxy Statement for the 2015 Annual Meeting of Shareholders are incorporated herein by reference in Part III of this Annual Report on Form 10-K to the extent stated herein. Such proxy statement will be filed with the Securities and Exchange Commission within 120 days of the registrant’s fiscal year ended December 31, 2014.
Table of Contents
| 3 | ||||||
| 10 | ||||||
| 16 | ||||||
| 17 | ||||||
| 18 | ||||||
| 18 | ||||||
| 19 | ||||||
| 22 | ||||||
| Item 7. Management’s Discussion and Analysis of Financial Condition and Results of Operations |
23 | |||||
| Item 7A. Quantitative and Qualitative Disclosures About Market Risk |
38 | |||||
| 39 | ||||||
| Item 9. Changes in and Disagreements With Accountants on Accounting and Financial Disclosure |
66 | |||||
| 66 | ||||||
| 68 | ||||||
| Item 10. Directors, Executive Officers and Corporate Governance |
68 | |||||
| 68 | ||||||
| 68 | ||||||
| Item 13. Certain Relationships and Related Transactions, and Director Independence |
68 | |||||
| 68 | ||||||
| 68 | ||||||
| SIGNATURES |
74 | |||||
| EX-12.1 |
||||||
| EX-21.1 |
||||||
| EX-23.1 |
||||||
| EX-31.1 |
||||||
| EX-31.2 |
||||||
| EX-32.1 |
||||||
| EX-101 |
||||||
2
Table of Contents
When used in this discussion and elsewhere in this document, the words “intends,” “believes,” “expects,” “anticipates,” and similar expressions are intended to identify “forward-looking statements” within the meaning of that term in Section 27A of the Securities Act of 1933 and in Section 21E of the Securities Exchange Act of 1934. Such forward-looking statements involve known and unknown risks, uncertainties and other factors, which may cause the actual results, performance or achievements of the Company to be materially different from those expressed or implied by such forward-looking statements. Such factors include, but are not limited to, the effect of competition from new self-storage facilities, which would cause rents and occupancy rates to decline; the Company’s ability to evaluate, finance and integrate acquired businesses into the Company’s existing business and operations; the Company’s ability to effectively compete in the industry in which it does business; the Company’s existing indebtedness may mature in an unfavorable credit environment, preventing refinancing or forcing refinancing of the indebtedness on terms that are not as favorable as the existing terms; interest rates may fluctuate, impacting costs associated with the Company’s outstanding floating rate debt; the Company’s ability to comply with debt covenants; any future ratings on the Company’s debt instruments; regional concentration of the Company’s business may subject it to economic downturns in the states of Florida and Texas; the Company’s reliance on its call center; the Company’s cash flow may be insufficient to meet required payments of operating expenses, principal, interest and dividends; and tax law changes that may change the taxability of future income.
| Item 1. | Business |
Sovran Self Storage, Inc. together with its direct and indirect subsidiaries and its consolidated joint ventures, to the extent appropriate in the applicable context, (the “Company,” “We,” “Our,” or “Sovran”) is a self-administered and self-managed real estate investment trust (“REIT”) that acquires, owns and manages self-storage properties. We refer to the self-storage properties in which we have an ownership interest, lease, and/or are managed by us as “Properties.” We began operations on June 26, 1995. We were formed to continue the business of our predecessor company, which had engaged in the self-storage business since 1985. At December 31, 2014, we held ownership interests in, leased, and/or managed 518 Properties consisting of approximately 35.5 million net rentable square feet, situated in 25 states. Among our 518 self-storage properties are 39 properties that we manage for an unconsolidated joint venture of which we are a 20% owner, 30 properties that we manage for an unconsolidated joint venture of which we are a 15% owner, 17 properties that we manage and in which have no ownership interest, and four properties that we lease. We believe we are the fifth largest operator of self-storage properties in the United States based on square feet owned and managed. Our Properties conduct business under the user-friendly name Uncle Bob’s Self-Storage®.
At December 31, 2014, we own an indirect interest in 497 of the Properties through a limited partnership (the “Partnership”). Included in the 497 properties are the 69 facilities in our unconsolidated joint ventures. At December 31, 2014 the Partnership also leased, but had no ownership in, four facilities under a long-term lease with the option to buy the facilities during a 16 month window starting in February 2015. The Partnership exercised its option to purchase the properties and acquired the four facilities for $120 million in February 2015. In total, we own a 99.5% economic interest in the Partnership and unaffiliated third parties own collectively a 0.5% limited partnership interest at December 31, 2014. We believe that this structure, commonly known as an umbrella partnership real estate investment trust (“UPREIT”), facilitates our ability to acquire properties by using units of the Partnership as currency. By utilizing interests in the Partnership as currency in facility acquisitions, we may partially defer the seller’s income tax liability which in turn may allow us to obtain more favorable pricing.
We were incorporated on April 19, 1995 under Maryland law. Our principal executive offices are located at 6467 Main Street, Williamsville, New York 14221, our telephone number is (716) 633-1850 and our website is www.unclebobs.com.
We seek to enhance shareholder value through internal growth and acquisition of additional storage properties. Internal growth is achieved through aggressive property management: optimizing rental rates, increasing occupancy levels, controlling costs, maximizing collections, and strategically expanding and enhancing the
3
Table of Contents
Properties. Should economic conditions warrant, we may develop new properties. We believe that there continue to be opportunities for growth through acquisitions, and constantly seek to acquire self-storage properties that are susceptible to realization of increased economies of scale and improved performance through application of our expertise.
Industry Overview
We believe that self-storage facilities offer inexpensive storage space to residential and commercial users. In addition to fully enclosed and secure storage space, many facilities also offer outside storage for automobiles, recreational vehicles and boats. Better facilities, such as those owned and/or managed by the Company, are usually fenced and well lighted with automated access systems, surveillance cameras, and have a full-time manager. Our customers rent space on a month-to-month basis and typically have access to their storage space up to 15 hours a day and in certain circumstances are provided with 24-hour access. Individual storage spaces are secured by the customer’s lock, and the customer has sole control of access to the space.
According to the 2015 Self-Storage Almanac, of the approximately 51,000 facilities in the United States, approximately 13% are managed by the ten largest operators. The remainder of the industry is characterized by numerous small, local operators. The scarcity of capital available to small operators for acquisitions and expansions, internet marketing, and call centers, and the potential for savings through economies of scale are factors that are leading to consolidation in the industry. We believe that, as a result of this trend, significant growth opportunities exist for operators with proven management systems and sufficient capital resources to grow either through acquisitions or third party management platforms.
Property Management
We have nearly 30 years of experience managing self storage facilities and the combined experience of our key personnel makes us one of the leaders in the industry. All of our stores operate under the user-friendly name of Uncle Bob’s Self Storage®, and we employ the following strategies with respect to our property management:
Our People:
We recognize the importance of quality people to the success of an organization. Accordingly, we hire and train to ensure that all associates can reach their full potential. Each strives to conduct themselves in accordance with our core values: Teamwork, Respect, Accountability, Integrity, and Innovation. In turn, we support them with state of the art training tools including an online learning management system, a company intranet and a network of certified training personnel. Every store team also has frequent, and sometimes daily, interaction with an Area Manager, a Regional Vice President, an Accounting Representative, and other support personnel. As such, our store associates are held to high standards for customer service, store appearance, financial performance, and overall operations.
Training & Development:
Our employees benefit from a wide array of training and development opportunities. New store employees undergo a comprehensive, proprietary training program designed to drive sales and operational results while ensuring the delivery of quality customer service. To supplement their initial training, employees enjoy continuing edification, coaching, and performance feedback throughout their tenure.
All learning and development activities are facilitated through our online Learning and Performance Management System internally named eBOB. eBOB delivers and tracks hundreds of on-demand computer based training and compliance courses; it also administers tests, surveys, and the employee appraisal process. Sovran’s training and development program encompasses the tools and support we deem essential to the success of our employees and business.
4
Table of Contents
Marketing and Advertising:
We believe the avenues for attracting and capturing new customers have changed dramatically over the years. As such, we have implemented the following strategies to market our properties and increase profitability:
| • | We employ a Customer Care Center (call center) that services an average of 33,000 rental inquiries per month. Our Sales Representatives answer incoming sales calls for all of our stores, 361 days a year, 24 hours a day. The team undertakes continuous training and coaching in effective storage sales techniques, which we believe results in higher conversions of inquiries to rentals. |
| • | The digital age has changed consumer behavior - the way people shop, their expectations, and the way we communicate with them. Our aggressive internet marketing and website provide customers with real-time pricing, online reservations, online payments, and support for mobile devices. We involve internal and external expertise to manage our internet presence and leverage a mix of mobile, desktop, and social media to attract and engage customers. |
| • | Since the need for storage is largely based on timing, the ultimate goal is to create as much positive brand recognition as possible. When the time comes for a customer to select a storage company, we want the Uncle Bob’s brand to be on the top of their mind. We employ a variety of different strategies to create brand awareness; this includes our Uncle Bob’s rental trucks, branded merchandise such as moving and packing supplies, and extensive regional marketing in the communities in which we operate. We strive to gain the most exposure as possible for the longest period of time. |
| • | Dri-guard humidity-controlled spaces are a premium storage feature intended to protect metal, electronics, furniture, fabrics and paper from moisture. We became the first self-storage operator to utilize this humidity protection technology and we believe it helps to differentiate us from other operators. |
| • | We also have a fleet of rental trucks that serve as an added incentive to choose our storage facilities. The truck rental charge is waived for new move-in customers and we believe it provides a valuable service and added incentive to choose us. Further, the prominent display of our logo turns each truck into a moving billboard. |
Ancillary Income:
We know that our 275,000 customers require more than just a storage space. Knowing this, we offer a wide range of other products and services that fulfill their needs while providing us with ancillary income. Whereas our Uncle Bob’s trucks are available with no rental charge for new move-in customers, they are available for rent to non-customers and existing customers. We also rent moving dollies and blankets, and we carry a wide assortment of moving and packing supplies including boxes, tape, locks, and other essential items. For those customers who do not carry storage insurance, we make available renters insurance through a third party carrier, on which we earn a commission. We also receive incidental income from billboards and cell towers.
Information Systems:
Each of our primary business functions is linked to our customized computer applications, many of which are proprietary. These systems provide for consistent, timely and accurate flow of information throughout our critical platforms:
| • | Our proprietary operating software (“ubOS”) is installed at all locations and performs the functions necessary for field personnel to efficiently and effectively run a property. This includes customer account management, automatic imposition of late fees, move-in and move-out analysis, generation of essential legal notices, and marketing reports to aid in regional marketing efforts. Financial reports are automatically transmitted to our Corporate Offices overnight to allow for strict accounting oversight. |
| • | ubOS is linked with each of our primary sales channels (customer care center, internet, store) allowing for real-time access to space type and inventory, pricing, promotions, and other pertinent store information. This robust flow of information facilitates our commitment to capturing prospective customers from all channels. |
| • | ubOS provides our revenue management team with raw data on historical pricing, move-in and move-out activity, specials and occupancies, etc. This data is utilized in the various algorithms that form the foundation of our revenue management program. Changes to pricing and specials are “pushed out” to all sales channels instantaneously. |
5
Table of Contents
| • | ubOS generates financial reports for each property that provide our accounting and audit departments with the necessary oversight of transactions; this allows us to maintain proper control of receipts. |
Revenue Management:
Our proprietary revenue management system is constantly evolving through the efforts of our revenue management team comprised of a group of analysts. We have the ability to change pricing instantaneously for any one unit type, at any single location, based on the occupancy, competition, and forecasted changes in demand. By analyzing current customer rent tenures, we can implement rental rate increases at optimal times to increase revenues. Advanced pricing analytics enables us to reduce the amount of concessions, attracting a more stable customer base and discouraging short-term price shoppers. This system continues to drive revenues throughout our portfolio.
Property Maintenance:
We take great pride in the appearance and structural integrity of our Properties. All of our Properties go through a thorough annual inspection performed by experienced Project Managers. Those inspections provide the basis for short and long term planned projects that are all performed under a standardized set of specifications. Routine maintenance such as landscaping, pest control, and snowplowing is contracted to local providers who have a clear understanding of our standards. Further, our software tracks repairs, monitors contractor performance and measures the useful life of assets. As with many other aspects of our Company, our size has allowed us to enjoy relatively low maintenance costs because we have the benefit of economies of scale in purchasing, travel, and overhead absorption. In addition, we continually look to green alternatives and implement energy saving alternatives as new technology becomes available. This includes the installation of solar panels and LED lighting which are both environmentally friendly and have the potential to reduce energy consumption (thereby reducing costs) in the buildings in which they are installed.
Environmental and Other Regulations
We are subject to federal, state, and local environmental regulations that apply generally to the ownership of real property. We have not received notice from any governmental authority or private party of any material environmental noncompliance, claim, or liability in connection with any of the Properties, and are not aware of any environmental condition with respect to any of the Properties that could have a material adverse effect on our financial condition or results of operations.
The Properties are also generally subject to the same types of local regulations governing other real property, including zoning ordinances. We believe that the Properties are in substantial compliance with all such regulations.
Insurance
Each of the Properties is covered by fire and property insurance (including comprehensive liability), and all-risk property insurance policies, which are provided by reputable companies and on commercially reasonable terms. In addition, we maintain a policy insuring against environmental liabilities resulting from tenant storage on terms customary for the industry, and title insurance insuring fee title to the Company-owned Properties in an amount that we believe to be adequate.
Federal Income Tax
We operate, and intend to continue to operate, in such a manner as to continue to qualify as a REIT under the Internal Revenue Code of 1986 (the “Code”), but no assurance can be given that we will at all times so qualify. To the extent that we continue to qualify as a REIT, we will not be taxed, with certain limited exceptions, on the taxable income that is distributed to our shareholders. We have elected to treat one of our subsidiaries as a taxable
6
Table of Contents
REIT subsidiary. In general, our taxable REIT subsidiary may perform additional services for customers and generally may engage in certain real estate or non-real estate related business. Our taxable REIT subsidiary is subject to corporate federal and state income taxes. See Item 7, “Management’s Discussion and Analysis of Financial Condition and Results of Operations - REIT Qualification and Distribution Requirements.”
Competition
The primary factors upon which competition in the self-storage industry is based are location, rental rates, suitability of the property’s design to prospective customers’ needs, and the manner in which the property is operated and marketed. We believe we compete successfully on these bases. The extent of competition depends significantly on local market conditions. We seek to locate facilities in a manner in which we can increase market share while not adversely affecting any of our existing locations in that market. However, the number of self-storage facilities in a particular area could have a material adverse effect on the performance of any of the Properties.
Several of our competitors are larger and have substantially greater financial resources than we do. These larger operators may, among other possible advantages, be capable of greater leverage and the payment of higher prices for acquisitions.
Investment Policy
While we emphasize equity real estate investments, we may, at our discretion, invest in mortgage and other real estate interests related to self-storage properties in a manner consistent with our qualification as a REIT. We may also retain a purchase money mortgage for a portion of the sale price in connection with the disposition of Properties from time to time. Should investment opportunities become available, we may look to acquire self-storage properties via a joint-venture partnership or similar entity. We may or may not elect to have a significant investment in such a venture, but would use such an opportunity to expand our portfolio of branded and managed properties.
Subject to the percentage of ownership limitations and gross income tests necessary for REIT qualification, we also may invest in securities of entities engaged in real estate activities or securities of other issuers, including for the purpose of exercising control over such entities.
Disposition Policy
Any disposition decision of our Properties is based on a variety of factors, including, but not limited to, the (i) potential to continue to increase cash flow and value, (ii) sale price, (iii) strategic fit with the rest of our portfolio, (iv) potential for, or existence of, environmental or regulatory issues, (v) alternative uses of capital, and (vi) maintaining qualification as a REIT.
During 2014, we sold two non-strategic storage facilities in Texas for net proceeds of approximately $11.0 million resulting in a gain of approximately $5.2 million. During 2013, we sold four non-strategic storage facilities in Florida, Ohio, and Virginia for net proceeds of approximately $11.7 million resulting in a gain of approximately $2.4 million. During 2012, we sold 17 non-strategic storage facilities in Maryland, Michigan, and Texas for net proceeds of approximately $47.7 million resulting in a gain of approximately $4.5 million.
Distribution Policy
We intend to pay regular quarterly distributions to our shareholders. However, future distributions by us will be at the discretion of the Board of Directors and will depend on the actual cash available for distribution, our financial condition and capital requirements, the annual distribution requirements under the REIT provisions of the Code and such other factors as the Board of Directors deems relevant. In order to maintain our qualification as a REIT, we must make annual distributions to shareholders of at least 90% of our REIT taxable income (which does not include capital gains). Under certain circumstances, we may be required to make distributions in excess of cash available for distribution in order to meet the minimum requirements.
7
Table of Contents
Financing Policy
Our Board of Directors currently limits the amount of debt that may be incurred by us to less than 50% of the sum of the market value of our issued and outstanding Common and Preferred Stock plus our debt. We, however, may from time to time re-evaluate and modify our borrowing policy in light of then current economic conditions, relative costs of debt and equity capital, market values of properties, growth and acquisition opportunities and other factors. In addition to our Board of Directors’ debt limits, our most restrictive debt covenants limit our leverage. However, we believe cash flow from operations, access to the capital markets and access to our credit facility, as described below, are adequate to execute our current business plan and remain in compliance with our debt covenants.
We have a $300 million revolving line of credit bearing interest at a variable rate equal to LIBOR plus a margin based on the Company’s credit rating (at December 31, 2014 the margin was 1.30%). At December 31, 2014, there was $250.3 million available on the unsecured line of credit without considering the additional availability under the credit facility expansion feature. The revolving line of credit has a maturity date of December 2019.
In 2014, the Company utilized a continuous equity offering
program (“Equity Program”) pursuant to which we could sell from time to time up to $225 million in aggregate offering price of shares of our common stock. During 2014, we issued approximately 0.9 million shares under the Equity
Program and 0.3 million shares under our previous Equity Program for net proceeds of approximately $99.2 million. During 2013, we issued approximately 1.67 million shares under our previous Equity Program for net proceeds of approximately
$107.8 million. During 2012 we issued approximately 1.39 million shares under our previous Equity Program for net proceeds of approximately $75.3 million. As of December 31, 2014, the Company has
$151.3 million availability for
issuance of shares under the current Equity Program.
To the extent that we desire to obtain additional capital to pay distributions, to provide working capital, to pay existing indebtedness or to finance acquisitions, expansions or development of new properties, we may utilize amounts available under the line of credit, common or preferred stock offerings, floating or fixed rate debt financing, retention of cash flow (subject to satisfying our distribution requirements under the REIT rules) or a combination of these methods. Additional debt financing may also be obtained through mortgages on our Properties, which may be recourse, non-recourse, or cross-collateralized and may contain cross-default provisions. We have not established any limit on the number or amount of mortgages that may be placed on any single Property or on our portfolio as a whole, although certain of our existing term loans contain limits on overall mortgage indebtedness. For additional information regarding borrowings, see Item 7, “Management’s Discussion and Analysis of Financial Condition and Results of Operations - Liquidity and Capital Resources” and Note 7 to the Consolidated Financial Statements filed herewith.
Employees
We currently employ a total of 1,378 employees, including 518 property managers, 33 area managers, and 631 associate managers and part-time employees. At our headquarters, in addition to our six senior executive officers, we employ 190 people engaged in various support activities, including accounting, human resources, customer care, and management information systems. None of our employees are covered by a collective bargaining agreement. We consider our employee relations to be excellent.
Available Information
We file with the U.S. Securities and Exchange Commission quarterly and annual reports on Forms 10-Q and 10-K, respectively, current reports on Form 8-K, and proxy statements pursuant to the Securities Exchange Act
8
Table of Contents
of 1934, in addition to other information as required. The public may read and copy any materials that we file with the SEC at the SEC’s Public Reference Room at 100 F Street, NE, Washington, D.C. 20549. The public may obtain information on the operation of the Public Reference Room by calling the SEC at 1 (800) SEC-0330. We file this information with the SEC electronically, and the SEC maintains an Internet site that contains reports, proxy and information statements, and other information regarding issuers that file electronically with the SEC at http://www.sec.gov. Our annual reports on Form 10-K, quarterly reports on Form 10-Q, current reports on Form 8-K, and all amendments to those reports are available free of charge on our web site at http://www.unclebobs.com as soon as reasonably practicable after such material is electronically filed with or furnished to the SEC. In addition, our Codes of Ethics and Charters of our Governance Committee, Audit Committee, and Compensation Committee are available free of charge on our website at http://www.unclebobs.com.
Also, copies of our annual report and Charters of our Governance Committee, Audit Committee, and Compensation Committee will be made available, free of charge, upon written request to Sovran Self Storage, Inc., Attn: Investor Relations, 6467 Main Street, Williamsville, NY 14221.
9
Table of Contents
| Item 1A. | Risk Factors |
You should carefully consider the risks described below, together with all of the other information included in or incorporated by reference into our Form 10-K, as part of your evaluation of the Company. If any of the following risks actually occur, our business could be harmed. In such case, the trading price of our securities could decline, and you may lose all or part of your investment.
Our Acquisitions May Not Perform as Anticipated
We have completed hundreds of acquisitions of self-storage facilities since our initial public offering of common stock in June 1995. Our strategy is to continue to grow by acquiring additional self-storage facilities. Acquisitions entail risks that investments will fail to perform in accordance with our expectations. Our judgments with respect to the prices paid for acquired self-storage facilities and the costs of any improvements required to bring an acquired property up to our standards may prove to be inaccurate. Acquisitions also involve general investment risks associated with any new real estate investment.
We May Incur Problems with Our Real Estate Financing
Unsecured Credit Facility and Term Notes. We have a line of credit and term note agreements with a syndicate of financial institutions and other lenders. This unsecured credit facility and the term notes are recourse to us and the required payments are not reduced if the economic performance of any of the properties declines. The unsecured credit facility limits our ability to make distributions to our shareholders, except in limited circumstances.
Rising Interest Rates. Indebtedness that we incur under the unsecured credit facility and bank term notes bears interest at a variable rate. Accordingly, increases in interest rates could increase our interest expense, which would reduce our cash available for distribution and our ability to pay expected distributions to our shareholders. We manage our exposure to rising interest rates using interest rate swaps and other available mechanisms. If the amount of our indebtedness bearing interest at a variable rate increases, our unsecured credit facility may require us to enter into additional interest rate swaps.
Refinancing May Not Be Available. It may be necessary for us to refinance our term notes and our unsecured credit facility through additional debt financing or equity offerings. If we were unable to refinance this indebtedness on acceptable terms, we might be forced to dispose of some of our self-storage facilities upon disadvantageous terms, which might result in losses to us and might adversely affect the cash available for distribution. If prevailing interest rates or other factors at the time of refinancing result in higher interest rates on refinancings, our interest expense would increase, which would adversely affect our cash available for distribution and our ability to pay expected distributions to shareholders.
Covenants and Risk of Default. Our unsecured credit facility and term notes require us to operate within certain covenants, including financial covenants with respect to leverage, fixed charge coverage, minimum net worth, limitations on additional indebtedness and dividend limitations. If we violate any of these covenants or otherwise default under our unsecured credit facility or term notes, then our lenders could declare all indebtedness under these facilities to be immediately due and payable which would have a material adverse effect on our business and could require us to sell self-storage facilities under distressed conditions and seek replacement financing on substantially more expensive terms.
Reduction in or Loss of Credit Rating. Certain of our debt instruments require us to maintain an investment grade rating from at least one and in some cases two debt ratings agencies. Should we fail to attain an investment grade rating from the agencies, the interest rate on our line of credit would increase by 0.30%, the interest rate on $325 million of our bank term notes would increase by 0.40%, and the interest rates on our $150 million term note due 2016, our $100 million term note due 2021, and our $175 million term note due 2024 would each increase by 1.750%.
10
Table of Contents
Our Debt Levels May Increase
Our Board of Directors currently has a policy of limiting the amount of our debt at the time of incurrence to less than 50% of the sum of the market value of our issued and outstanding common stock and preferred stock plus the amount of our debt at the time that debt is incurred. However, our organizational documents do not contain any limitation on the amount of indebtedness we might incur. Accordingly, our Board of Directors could alter or eliminate the current policy limitation on borrowing without a vote of our shareholders. We could become highly leveraged if this policy were changed. However, our ability to incur debt is limited by covenants in our bank credit arrangements.
We Are Subject to the Risks Posed by Fluctuating Demand and Significant Competition in the Self-Storage Industry
Our self-storage facilities are subject to all operating risks common to the self-storage industry. These risks include but are not limited to the following:
| • | Decreases in demand for rental spaces in a particular locale; |
| • | Changes in supply of similar or competing self-storage facilities in an area; |
| • | Changes in market rental rates; and |
| • | Inability to collect rents from customers. |
Our current strategy is to acquire interests only in self-storage facilities. Consequently, we are subject to risks inherent in investments in a single industry. Our self-storage facilities compete with other self-storage facilities in their geographic markets. As a result of competition, the self-storage facilities could experience a decrease in occupancy levels and rental rates, which would decrease our cash available for distribution. We compete in operations and for acquisition opportunities with companies that have substantial financial resources. Competition may reduce the number of suitable acquisition opportunities offered to us and increase the bargaining power of property owners seeking to sell. The self-storage industry has at times experienced overbuilding in response to perceived increases in demand. A recurrence of overbuilding might cause us to experience a decrease in occupancy levels, limit our ability to increase rents, and compel us to offer discounted rents.
Our Real Estate Investments Are Illiquid and Are Subject to Uninsurable Risks and Government Regulation
General Risks. Our investments are subject to varying degrees of risk generally related to the ownership of real property. The underlying value of our real estate investments and our income and ability to make distributions to our shareholders are dependent upon our ability to operate the self-storage facilities in a manner sufficient to maintain or increase cash available for distribution. Income from our self-storage facilities may be adversely affected by the following factors:
| • | Changes in national economic conditions; |
| • | Changes in general or local economic conditions and neighborhood characteristics; |
| • | Competition from other self-storage facilities; |
| • | Changes in interest rates and in the availability, cost and terms of financing; |
| • | The impact of present or future environmental legislation and compliance with environmental laws; |
| • | The ongoing need for capital improvements, particularly in older facilities; |
11
Table of Contents
| • | Changes in real estate tax rates and other operating expenses; |
| • | Adverse changes in governmental rules and fiscal policies; |
| • | Uninsured losses resulting from casualties associated with civil unrest, acts of God, including natural disasters, and acts of war; |
| • | Adverse changes in zoning laws; and |
| • | Other factors that are beyond our control. |
Illiquidity of Real Estate May Limit its Value. Real estate investments are relatively illiquid. Our ability to vary our portfolio of self-storage facilities in response to changes in economic and other conditions is limited. In addition, provisions of the Code may limit our ability to profit on the sale of self-storage facilities held for fewer than two years. We may be unable to dispose of a facility when we find disposition advantageous or necessary and the sale price of any disposition may not equal or exceed the amount of our investment.
Uninsured and Underinsured Losses Could Reduce the Value of our Self Storage Facilities. Some losses, generally of a catastrophic nature, that we potentially face with respect to our self-storage facilities may be uninsurable or not insurable at an acceptable cost. Our management uses its discretion in determining amounts, coverage limits and deductibility provisions of insurance, with a view to acquiring appropriate insurance on our investments at a reasonable cost and on suitable terms. These decisions may result in insurance coverage that, in the event of a substantial loss, would not be sufficient to pay the full current market value or current replacement cost of our lost investment. Inflation, changes in building codes and ordinances, environmental considerations, and other factors also might make it infeasible to use insurance proceeds to replace a property after it has been damaged or destroyed. Under those circumstances, the insurance proceeds received by us might not be adequate to restore our economic position with respect to a particular property.
Possible Liability Relating to Environmental Matters. Under various federal, state and local environmental laws, ordinances and regulations, a current or previous owner or operator of real property may be liable for the costs of removal or remediation of hazardous or toxic substances on, under, or in that property. Those laws often impose liability even if the owner or operator did not cause or know of the presence of hazardous or toxic substances and even if the storage of those substances was in violation of a customer’s lease. In addition, the presence of hazardous or toxic substances, or the failure of the owner to address their presence on the property, may adversely affect the owner’s ability to borrow using that real property as collateral. In connection with the ownership of the self-storage facilities, we may be potentially liable for any of those costs.
Americans with Disabilities Act. The Americans with Disabilities Act of 1990, or ADA, generally requires that buildings be made accessible to persons with disabilities. A determination that we are not in compliance with the ADA could result in imposition of fines or an award of damages to private litigants. If we were required to make modifications to comply with the ADA, our results of operations and ability to make expected distributions to our shareholders could be adversely affected.
There Are Limitations on the Ability to Change Control of Sovran
Limitation on Ownership and Transfer of Shares. To maintain our qualification as a REIT, not more than 50% in value of our outstanding shares of stock may be owned, directly or indirectly, by five or fewer individuals, as defined in the Code. To limit the possibility that we will fail to qualify as a REIT under this test, our Amended and Restated Articles of Incorporation (“Articles of Incorporation”) include ownership limits and transfer restrictions on shares of our stock. Our Articles of Incorporation limit ownership of our issued and outstanding stock by any single shareholder to 9.8% of the aggregate value of our outstanding stock, except that the ownership by some of our shareholders is limited to 15%.
12
Table of Contents
These ownership limits may:
| • | Have the effect of precluding an acquisition of control of Sovran by a third party without consent of our Board of Directors even if the change in control would be in the interest of shareholders; and |
| • | Limit the opportunity for shareholders to receive a premium for shares of our common stock they hold that might otherwise exist if an investor were attempting to assemble a block of common stock in excess of 9.8% or 15%, as the case may be, of the outstanding shares of our stock or to otherwise effect a change in control of Sovran. |
Our Board of Directors may waive the ownership limits if it is satisfied that ownership by those shareholders in excess of those limits will not jeopardize our status as a REIT under the Code or in the event it determines that it is no longer in our best interests to be a REIT. Waivers have been granted to the former holders of our Series C preferred stock, FMR Corporation, Cohen & Steers, Inc. and Invesco Advisers, Inc. A transfer of our common stock and/or preferred stock to a person who, as a result of the transfer, violates the ownership limits may not be effective under some circumstances.
Other Limitations. Other limitations could have the effect of discouraging a takeover or other transaction in which holders of some, or a majority, of our outstanding common stock might receive a premium for their shares of our common stock that exceeds the then prevailing market price or that those holders might believe to be otherwise in their best interest. The issuance of additional shares of preferred stock could have the effect of delaying or preventing a change in control of Sovran even if a change in control were in the shareholders’ interest. In addition, the Maryland General Corporation Law, or MGCL, imposes restrictions and requires specific procedures with respect to the acquisition of stated levels of share ownership and business combinations, including combinations with interested shareholders. These provisions of the MGCL could have the effect of delaying or preventing a change in control of Sovran even if a change in control were in the shareholders’ interest. Our bylaws contain a provision exempting from the MGCL control share acquisition statute any and all acquisitions by any person of shares of our stock. However, this provision may be amended or eliminated at any time. In addition, under the Partnership’s agreement of limited partnership, in general, we may not merge, consolidate or engage in any combination with another person or sell all or substantially all of our assets unless that transaction includes the merger or sale of all or substantially all of the assets of the Partnership, which requires the approval of the holders of 75% of the limited partnership interests thereof. If we were to own less than 75% of the limited partnership interests in the Partnership, this provision of the limited partnership agreement could have the effect of delaying or preventing us from engaging in some change of control transactions.
Our Failure to Qualify as a REIT Would Have Adverse Consequences
We intend to continue to operate in a manner that will permit us to qualify as a REIT under the Code. We have not requested and do not plan to request a ruling from the Internal Revenue Service (“IRS”) that we qualify as a REIT, and the statements in this Annual Report on Form 10-K are not binding on the IRS or any court. Qualification as a REIT involves the application of highly technical and complex Code provisions for which there are only limited judicial and administrative interpretations. Continued qualification as a REIT depends upon our continuing ability to meet various requirements concerning, among other things, the ownership of our outstanding stock, the nature of our assets, the sources of our income and the amount of our distributions to our shareholders. The fact that we hold substantially all of our assets through our Partnership and its subsidiaries and joint ventures further complicates the application of the REIT requirements for us. Even a technical or inadvertent mistake could jeopardize our REIT status and, given the highly complex nature of the rules governing REITs and the ongoing importance of factual determinations, we cannot provide any assurance that we will continue to qualify as a REIT. Furthermore, Congress and the IRS might make changes to the tax laws and regulations, and the courts and the IRS might issue new rulings, that make it more difficult, or impossible, for us to remain qualified as a REIT.
If we were to fail to qualify as a REIT in any taxable year, and are unable to avail ourselves of certain
13
Table of Contents
savings provisions set forth in the Code, we would not be allowed a deduction for distributions to shareholders in computing our taxable income and would be subject to federal income tax (including any applicable alternative minimum tax and possibly increased state and local taxes) on our taxable income at regular corporate rates. Unless entitled to relief under certain Code provisions, we also would be ineligible for qualification as a REIT for the four taxable years following the year during which our qualification was lost. As a result, distributions to the shareholders would be reduced for each of the years involved. Although we currently intend to continue to operate in a manner designed to qualify as a REIT, it is possible that future economic, market, legal, tax or other considerations may cause our Board of Directors to revoke our REIT election. If we fail to qualify as a REIT for federal income tax purposes and are able to avail ourselves of one or more of the statutory savings provisions in order to maintain our REIT status, we would nevertheless be required to pay penalty taxes of $50,000 or more for each such failure.
We Will Pay Some Taxes Even if We Qualify as a REIT, Reducing Cash Available for Shareholders
Even if we qualify as a REIT for federal income tax purposes, we are required to pay some federal, state and local taxes on our income and property. For example, we will be subject to income tax to the extent we distribute less than 100% of our REIT taxable income (including capital gains). Additionally, we will be subject to a 4% nondeductible excise tax on the amount, if any, by which dividends paid by us in any calendar year are less than the sum of 85% of our ordinary income, 95% of our capital gain net income and 100% of our undistributed income from prior years. Moreover, if we have net income from “prohibited transactions,” that income will be subject to a 100% tax. In general, prohibited transactions are sales or other dispositions of property held primarily for sale to customers in the ordinary course of business. The determination as to whether a particular sale is a prohibited transaction depends on the facts and circumstances related to that sale. While we will undertake sales of assets if those assets become inconsistent with our long-term strategic or return objectives, we do not believe that those sales should be considered prohibited transactions, but there can be no assurance that the IRS would not contend otherwise. The need to avoid prohibited transactions could cause us to forego or defer sales of properties that might otherwise be in our best interest to sell.
One of our subsidiaries has elected to be treated as a “taxable REIT subsidiary” of the Company for federal income tax purposes. A taxable REIT subsidiary is taxed as a regular corporation and is limited in its ability to deduct interest payments made to us in excess of a certain amount. In addition, if we receive or accrue certain amounts and the underlying economic arrangements among our taxable REIT subsidiary and us are not comparable to similar arrangements among unrelated parties, we will be subject to a 100% penalty tax on those payments in excess of amounts deemed reasonable between unrelated parties.
Finally, some state and local jurisdictions may tax some of our income even though as a REIT we are not subject to federal income tax on that income because not all states and localities follow the federal income tax treatment of REITs. To the extent that we are or any taxable REIT subsidiary is required to pay federal, foreign, state or local taxes, we will have less cash available for distribution to shareholders.
Complying with REIT Requirements May Limit Our Ability to Hedge Effectively and May Cause Us to Incur Tax Liabilities
The REIT provisions of the Code may limit our ability to hedge our assets and operations. Under these provisions, any income that we generate from transactions intended to hedge our interest rate risk will be excluded from gross income for purposes of the REIT 75% and 95% gross income tests if the instrument hedges interest rate risk on liabilities used to carry or acquire real estate assets or manages the risk of certain currency fluctuations, and such instrument is properly identified under applicable Treasury Regulations. Income from hedging transactions that do not meet these requirements will generally constitute non-qualifying income for purposes of both the REIT 75% and 95% gross income tests. As a result of these rules, we may have to limit our use of hedging techniques that might otherwise be advantageous or implement those hedges through a taxable REIT subsidiary. This could increase the cost of our hedging activities because our taxable REIT subsidiary would be subject to tax on gains or expose us to greater risks associated with changes in interest rates than we would otherwise want to bear. In addition, losses in our taxable REIT subsidiary will generally not provide any tax benefit, except for being carried back or forward against past or future taxable income in the taxable REIT subsidiary.
14
Table of Contents
Complying with the REIT Requirements May Cause Us to Forgo and/or Liquidate Otherwise Attractive Investments
To qualify as a REIT, we must continually satisfy tests concerning, among other things, the sources of our income, the nature and diversification of our assets, the amounts that we distribute to our shareholders and the ownership of our shares. To meet these tests, we may be required to take or forgo taking actions that we would otherwise consider advantageous. For instance, in order to satisfy the gross income or asset tests applicable to REITs under the Code, we may be required to forgo investments that we otherwise would make. Furthermore, we may be required to liquidate from our portfolio otherwise attractive investments. In addition, we may be required to make distributions to shareholders at disadvantageous times or when we do not have funds readily available for distribution. These actions could reduce our income and amounts available for distribution to our shareholders. Thus, compliance with the REIT requirements may hinder our investment performance.
If the Partnership Fails to Qualify as a Partnership for Federal Income Tax Purposes, We Could Fail to Qualify as a REIT and Suffer Other Adverse Consequences
We believe that our Partnership is organized and operated in a manner so as to be treated as a partnership and not an association or a publicly traded partnership taxable as a corporation, for federal income tax purposes. As a partnership, our Partnership is not subject to federal income tax on its income. Instead, each of the partners is allocated its share of our Partnership’s income. No assurance can be provided, however, that the IRS will not challenge our Partnership’s status as a partnership for federal income tax purposes, or that a court would not sustain such a challenge. If the IRS were successful in treating our Partnership as an association or publicly traded partnership taxable as a corporation for federal income tax purposes, we would fail to meet the gross income tests and certain of the asset tests applicable to REITs and, accordingly, would cease to qualify as a REIT. Also, the failure of the Partnership to qualify as a partnership would cause it to become subject to federal corporate income tax, which would reduce significantly the amount of its cash available for distribution to its partners, including us.
We May Change the Dividend Policy for Our Common Stock in the Future
In 2014, our Board of Directors authorized and we declared quarterly common stock dividends of $0.68 per share in January, April, July and October, the equivalent of an annual rate of $2.72 per share. In addition, our board of directors authorized and we declared an increased quarterly common stock dividend of $0.75 per share in January 2015. We can provide no assurance that our board will not reduce or eliminate entirely dividend distributions on our common stock in the future.
Our Board of Directors will continue to evaluate our distribution policy on a quarterly basis as they monitor the capital markets and the impact of the economy on our operations. The decisions to authorize and pay dividends on our common stock in the future, as well as the timing, amount and composition of any such future dividends, will be at the sole discretion of our board of directors in light of conditions then existing, including our earnings, financial condition, capital requirements, debt maturities, the availability of capital, applicable REIT and legal restrictions and the general overall economic conditions and other factors. Any change in our dividend policy could have a material adverse effect on the market price of our common stock.
Market Interest Rates May Influence the Price of Our Common Stock
One of the factors that may influence the price of our common stock in public trading markets or in private transactions is the annual yield on our common stock as compared to yields on other financial instruments. An increase in market interest rates will result in higher yields on other financial instruments, which could adversely affect the price of our common stock.
15
Table of Contents
Regional Concentration of Our Business May Subject Us to Economic Downturns in the States of Texas and Florida
As of December 31, 2014, 205 of our 518 self-storage facilities are located in the states of Texas and Florida. For the year ended December 31, 2014, these facilities accounted for approximately 39% of store revenues. This concentration of business in Texas and Florida exposes us to potential losses resulting from a downturn in the economies of those states. If economic conditions in those states deteriorate, we may experience a reduction in existing and new business, which may have an adverse effect on our business, financial condition and results of operations.
Changes in Taxation of Corporate Dividends May Adversely Affect the Value of Our Common Stock
The maximum marginal rate of tax payable by domestic noncorporate taxpayers on dividends received from a regular “C” corporation under current federal law generally is 20%, as opposed to higher ordinary income rates. The reduced tax rate, however, does not apply to distributions paid to domestic noncorporate taxpayers by a REIT on its stock, except for certain limited amounts. The earnings of a REIT that are distributed to its stockholders generally remain subject to less federal income taxation than earnings of a non-REIT “C” corporation that are distributed to its stockholders net of corporate-level income tax. However, the lower rate of taxation to dividends paid by regular “C” corporations could cause domestic noncorporate investors to view the stock of regular “C” corporations as more attractive relative to the stock of a REIT, because the dividends from regular “C” corporations continue to be taxed at a lower rate while distributions from REITs (other than distributions designated as capital gain dividends) are generally taxed at the same rate as other ordinary income for domestic noncorporate taxpayers.
We are heavily dependent on computer systems, telecommunications and the Internet to process transactions, summarize results and manage our business. Security breaches or a failure of such networks, systems or technology could adversely impact our business and customer relationships.
We are heavily dependent upon automated information technology and Internet commerce, with many of our new customers coming from the Internet or the telephone, and the nature of our business involves the receipt and retention of personal information about them. We centrally manage significant components of our operations with our computer systems, including our financial information, and we also rely extensively on third-party vendors to retain data, process transactions and provide other systems services. These systems are subject to damage or interruption from power outages, computer and telecommunications failures, computer worms, viruses and other destructive or disruptive security breaches and catastrophic events.
As a result, our operations could be severely impacted by a natural disaster, terrorist attack or other circumstance that resulted in a significant outage of our systems or those of our third party providers, despite our use of back up and redundancy measures. Further, viruses and other related risks could negatively impact our information technology processes. We could also be subject to a “cyber-attack” or other data security breach which would penetrate our network security, resulting in misappropriation of our confidential information, including customer personal information. System disruptions and shutdowns could also result in additional costs to repair or replace such networks or information systems and possible legal liability, including government enforcement actions and private litigation. In addition, our customers could lose confidence in our ability to protect their personal information, which could cause them to move out of rented storage spaces. Such events could lead to lost future sales and adversely affect our results of operations.
| Item 1B. | Unresolved Staff Comments |
None.
16
Table of Contents
| Item 2. | Properties |
At December 31, 2014, we held ownership interests in, leased, and/or managed a total of 518 Properties situated in twenty-five states. Among our 518 self-storage properties are 39 properties that we manage for an unconsolidated joint venture of which we are a 20% owner, 30 properties that we manage for an unconsolidated joint venture of which we are a 15% owner, 17 properties that we manage and in which have no ownership interest, and four properties that, as of December 31, 2014, we leased.
Our self-storage facilities offer inexpensive, easily accessible, enclosed storage space to residential and commercial users on a month-to-month basis. Most of our Properties are fenced and well lighted with automated access systems and surveillance cameras. A majority of the Properties are single-story, thereby providing customers with the convenience of direct vehicle access to their storage spaces. Our stores range in size from 18,000 to 181,000 net rentable square feet, with an average of approximately 69,000 net rentable square feet. The Properties generally are constructed of masonry or steel walls resting on concrete slabs and have standing seam metal, shingle, or tar and gravel roofs. All Properties have a property manager on-site during business hours. Generally, customers have access to their storage space up to 15 hours a day, and some customers are provided 24-hour access. Individual storage spaces are secured by a lock furnished by the customer to provide the customer with control of access to the space.
All of the Properties conduct business under the user-friendly name Uncle Bob’s Self-Storage ®.
The following table provides certain information regarding the Properties in which we have an ownership interest, lease, and/or manage as of December 31, 2014:
| Number of Stores at December 31, 2014 |
Square Feet |
Number of Spaces |
Percentage of Store Revenue |
|||||||||||||
| Alabama |
22 | 1,616,958 | 12,175 | 3.4 | % | |||||||||||
| Arizona |
10 | 668,582 | 5,870 | 1.6 | % | |||||||||||
| Colorado |
5 | 330,246 | 2,781 | 1.2 | % | |||||||||||
| Connecticut |
8 | 640,025 | 6,415 | 2.9 | % | |||||||||||
| Florida |
72 | 4,940,025 | 48,038 | 14.3 | % | |||||||||||
| Georgia |
30 | 2,128,323 | 18,063 | 5.5 | % | |||||||||||
| Illinois |
13 | 954,448 | 9,162 | 2.6 | % | |||||||||||
| Kentucky |
2 | 142,914 | 1,321 | 0.4 | % | |||||||||||
| Louisiana |
17 | 1,053,939 | 8,808 | 2.6 | % | |||||||||||
| Maine |
4 | 220,241 | 2,204 | 0.8 | % | |||||||||||
| Maryland |
3 | 138,729 | 1,618 | 0.6 | % | |||||||||||
| Massachusetts |
13 | 693,754 | 6,655 | 2.6 | % | |||||||||||
| Mississippi |
15 | 1,154,222 | 8,805 | 2.6 | % | |||||||||||
| Missouri |
15 | 928,165 | 8,271 | 2.3 | % | |||||||||||
| New Hampshire |
4 | 260,236 | 2,342 | 0.8 | % | |||||||||||
| New Jersey |
29 | 2,093,768 | 21,963 | 7.6 | % | |||||||||||
| New York |
35 | 2,144,105 | 20,708 | 8.4 | % | |||||||||||
| North Carolina |
20 | 1,226,815 | 11,179 | 3.2 | % | |||||||||||
| Ohio |
23 | 1,575,216 | 13,124 | 4.0 | % | |||||||||||
| Pennsylvania |
9 | 606,776 | 5,164 | 1.5 | % | |||||||||||
| Rhode Island |
4 | 206,121 | 1,924 | 0.7 | % | |||||||||||
| South Carolina |
8 | 448,268 | 3,926 | 1.2 | % | |||||||||||
| Tennessee |
5 | 348,504 | 2,999 | 0.8 | % | |||||||||||
| Texas |
133 | 9,691,740 | 80,210 | 25.1 | % | |||||||||||
| Virginia |
19 | 1,296,341 | 12,065 | 3.3 | % | |||||||||||
|
|
|
|
|
|
|
|
|
|||||||||
| Total |
518 | 35,508,461 | 315,790 | 100.0 | % | |||||||||||
|
|
|
|
|
|
|
|
|
|||||||||
At December 31, 2014, the Properties had an average occupancy of 88.5% and an annualized rent per occupied square foot of $12.40.
17
Table of Contents
| Item 3. | Legal Proceedings |
On or about August 25, 2014, a putative class action was filed against the Company in the Superior Court of New Jersey Law Division Burlington County. The action seeks to obtain declaratory, injunctive and monetary relief for a class of consumers based upon alleged violations by the Company of the New Jersey Truth in Customer Contract, Warranty and Notice Act, the New Jersey Consumer Fraud Act and the New Jersey Insurance Producer Licensing Act. On October 17, 2014, the action was removed from the Superior Court of New Jersey Law Division Burlington County to the United States District Court for the District of New Jersey. The Company intends to vigorously defend the action, and the possibility of any adverse outcome cannot be determined at this time.
| Item 4. | Mine Safety Disclosures |
Not Applicable
18
Table of Contents
| Item 5. | Market for Registrant’s Common Equity, Related Stockholder Matters and Issuer Purchases of Equity Securities |
Our Common Stock is traded on the New York Stock Exchange under the symbol “SSS.” Set forth below are the high and low sales prices for our Common Stock for each full quarterly period within the two most recent fiscal years.
| Quarter 2013 |
High | Low | ||||||
| 1st | $ | 67.44 | $ | 60.29 | ||||
| 2nd | 71.55 | 62.11 | ||||||
| 3rd | 76.53 | 64.69 | ||||||
| 4th | 80.24 | 63.07 | ||||||
| Quarter 2014 |
High | Low | ||||||
| 1st | $ | 76.45 | $ | 62.66 | ||||
| 2nd | 79.29 | 72.88 | ||||||
| 3rd | 79.93 | 73.59 | ||||||
| 4th | 89.57 | 74.10 | ||||||
As of February 13, 2015, there were approximately 752 holders of record of our Common Stock.
We have paid quarterly dividends to our shareholders since our inception. Reflected in the table below are the dividends paid in the last two years.
For federal income tax purposes, distributions to shareholders are treated as ordinary income, capital gain, return of capital or a combination thereof. Distributions to shareholders for 2014 represent 100% ordinary income.
| History of Dividends Declared on Common Stock | ||
| January 2013 | $0.480 per share | |
| April 2013 | $0.480 per share | |
| July 2013 | $0.530 per share | |
| October 2013 | $0.530 per share | |
| January 2014 | $0.680 per share | |
| April 2014 | $0.680 per share | |
| July 2014 | $0.680 per share | |
| October 2014 | $0.680 per share | |
19
Table of Contents
EQUITY COMPENSATION PLAN INFORMATION
The following table sets forth certain information as of December 31, 2014, with respect to equity compensation plans under which shares of the Company’s Common Stock may be issued.
| Plan Category |
Number of securities to be issued upon exercise of outstanding options, warrants and rights (#) |
Weighted average exercise price of outstanding options, warrants and rights ($) |
Number of securities remaining available for future issuance (#) |
|||||||||
| Equity compensation plans approved by shareholders: |
||||||||||||
| 2005 Award and Option Plan |
82,606 | $ | 45.75 | 543,229 | ||||||||
| 2009 Outside Directors’ Stock Option and Award Plan |
29,000 | $ | 56.31 | 84,855 | ||||||||
| 1995 Outside Directors’ Stock Option Plan |
4,000 | $ | 49.65 | 0 | ||||||||
| Deferred Compensation Plan for Directors (1) |
45,505 | N/A | 2,050 | |||||||||
| Equity compensation plans not approved by shareholders: |
N/A | N/A | N/A | |||||||||
| (1) | Under the Deferred Compensation Plan for Directors, non-employee Directors may defer all or part of their Directors’ fees that are otherwise payable in cash. Directors’ fees that are deferred under the Plan will be credited to each Directors’ account under the Plan in the form of Units. The number of Units credited is determined by dividing the amount of Directors’ fees deferred by the closing price of the Company’s Common Stock on the New York Stock Exchange on the day immediately preceding the day upon which Directors’ fees otherwise would be paid by the Company. A Director is credited with additional Units for dividends on the shares of Common Stock represented by Units in such Directors’ Account. A Director may elect to receive the shares in a lump sum on a date specified by the Director or in quarterly or annual installments over a specified period and commencing on a specified date. |
Unregistered Sale of Securities
During the quarterly period ended December 31, 2014, the Company issued 2,000 shares of common stock as a result of the exercise of stock options issued under the Company’s 2009 Outside Directors’ Stock Option and Award Plan. The Company received aggregate proceeds of $139,800 in connection with the exercise of the stock options. The issuance of such common stock was exempt from registration pursuant to the Securities Act of 1933, among other reasons, by virtue of Section 4(2) as transactions not involving a public offering.
20
Table of Contents
CORPORATE PERFORMANCE GRAPH
The following chart and line-graph presentation compares (i) the Company’s shareholder return on an indexed basis since December 31, 2009 with (ii) the S&P Stock Index and (iii) the National Association of Real Estate Investment Trusts Equity Index.
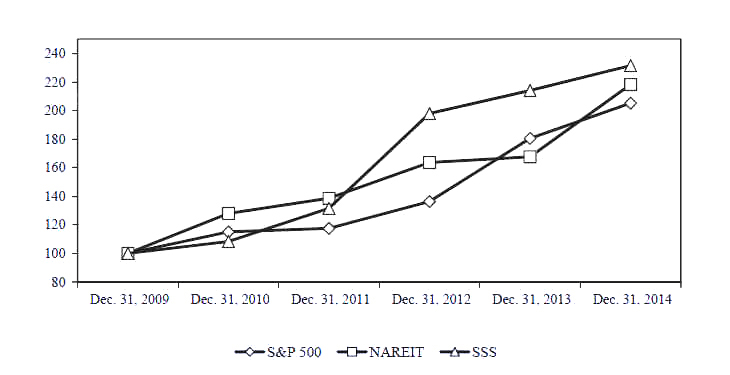
CUMULATIVE TOTAL SHAREHOLDER RETURN
SOVRAN SELF STORAGE, INC.
DECEMBER 31, 2009 - DECEMBER 31, 2014
| Dec. 31, 2009 |
Dec. 31, 2010 |
Dec. 31, 2011 |
Dec. 31, 2012 |
Dec. 31, 2013 |
Dec. 31, 2014 |
|||||||||||||||||||
| S&P |
100.00 | 115.06 | 117.49 | 136.30 | 180.44 | 205.14 | ||||||||||||||||||
| NAREIT |
100.00 | 127.96 | 138.57 | 163.60 | 167.63 | 218.16 | ||||||||||||||||||
| SSS |
100.00 | 108.34 | 131.52 | 197.92 | 214.01 | 231.41 | ||||||||||||||||||
The foregoing item assumes $100.00 invested on December 31, 2009, with dividends reinvested.
21
Table of Contents
| Item 6. | Selected Financial Data |
The following selected financial and operating information should be read in conjunction with “Management’s Discussion and Analysis of Financial Condition and Results of Operations,” and the financial statements and related notes included elsewhere in this Annual Report on Form 10-K:
| At or For Year Ended December 31, | ||||||||||||||||||||
| (dollars in thousands, except per share data) | 2014 | 2013 | 2012 | 2011 | 2010 | |||||||||||||||
| Operating Data |
||||||||||||||||||||
| Operating revenues |
$ | 326,080 | $ | 273,507 | $ | 234,082 | $ | 200,860 | $ | 181,874 | ||||||||||
| Income from continuing operations |
89,057 | 71,472 | 48,121 | 27,314 | 30,819 | |||||||||||||||
| Income from discontinued operations (1) |
— | 3,123 | 7,520 | 4,215 | 11,722 | |||||||||||||||
| Net income |
89,057 | 74,595 | 55,641 | 31,529 | 42,541 | |||||||||||||||
| Net income attributable to common shareholders |
88,531 | 74,126 | 55,128 | 30,592 | 40,642 | |||||||||||||||
| Income from continuing operations per common share attributable to common shareholders– diluted |
2.67 | 2.26 | 1.61 | 0.95 | 1.05 | |||||||||||||||
| Net income per common share attributable to common shareholders – basic |
2.68 | 2.37 | 1.88 | 1.11 | 1.48 | |||||||||||||||
| Net income per common share attributable to common shareholders – diluted |
2.67 | 2.36 | 1.87 | 1.10 | 1.48 | |||||||||||||||
| Dividends declared per common share (2) |
2.72 | 2.02 | 1.80 | 1.80 | 1.80 | |||||||||||||||
| Balance Sheet Data |
||||||||||||||||||||
| Investment in storage facilities at cost |
$ | 2,177,983 | $ | 1,864,637 | $ | 1,742,354 | $ | 1,525,283 | $ | 1,349,927 | ||||||||||
| Total assets |
1,854,800 | 1,561,875 | 1,484,310 | 1,343,544 | 1,184,369 | |||||||||||||||
| Total debt |
801,127 | 626,254 | 684,251 | 625,423 | 488,954 | |||||||||||||||
| Total liabilities |
865,309 | 678,226 | 742,910 | 673,539 | 527,226 | |||||||||||||||
| Other Data |
||||||||||||||||||||
| Net cash provided by operating activities |
$ | 146,068 | $ | 120,646 | $ | 98,762 | $ | 79,897 | $ | 73,671 | ||||||||||
| Net cash used in investing activities |
(334,993 | ) | (114,345 | ) | (175,664 | ) | (189,879 | ) | (32,605 | ) | ||||||||||
| Net cash (used in) provided by financing activities |
187,944 | 4,032 | 76,836 | 111,537 | (46,010 | ) | ||||||||||||||
| (1) | In 2013 we sold four stores, in 2012 we sold seventeen stores, in 2010 we sold ten stores, and in 2009 we sold five stores whose results of operations and gain (loss) on disposal are classified as discontinued operations for all previous years presented. |
| (2) | In 2010, 2011 and 2012 we declared regular quarterly dividends of $0.45 in January, April, July and October. In 2013 we declared regular quarterly dividends of $0.48 in January and April, and $0.53 in July and October. In 2014 we declared regular quarterly dividends of $0.68 in January, April, July and October. |
22
Table of Contents
| Item 7. | Management’s Discussion and Analysis of Financial Condition and Results of Operations |
The following discussion and analysis of the consolidated financial condition and results of operations should be read in conjunction with the financial statements and notes thereto included elsewhere in this report.
Disclosure Regarding Forward-Looking Statements
When used in this discussion and elsewhere in this document, the words “intends,” “believes,” “expects,” “anticipates,” and similar expressions are intended to identify “forward-looking statements” within the meaning of that term in Section 27A of the Securities Act of 1933 and in Section 21E of the Securities Exchange Act of 1934. Such forward-looking statements involve known and unknown risks, uncertainties and other factors, which may cause our actual results, performance or achievements to be materially different from those expressed or implied by such forward-looking statements. Such factors include, but are not limited to, the effect of competition from new self-storage facilities, which would cause rents and occupancy rates to decline; the Company’s ability to evaluate, finance and integrate acquired businesses into the Company’s existing business and operations; the Company’s ability to effectively compete in the industry in which it does business; the Company’s existing indebtedness may mature in an unfavorable credit environment, preventing refinancing or forcing refinancing of the indebtedness on terms that are not as favorable as the existing terms; interest rates may fluctuate, impacting costs associated with the Company’s outstanding floating rate debt; the Company’s ability to comply with debt covenants; any future ratings on the Company’s debt instruments; the regional concentration of the Company’s business may subject it to economic downturns in the states of Florida and Texas; the Company’s reliance on its call center; the Company’s cash flow may be insufficient to meet required payments of operating expenses, principal, interest and dividends; and tax law changes that may change the taxability of future income.
Business and Overview
We believe we are the fifth largest operator of self-storage properties in the United States based on square feet owned and managed. All of our stores are operated under the user-friendly name “Uncle Bob’s Self-Storage”®.
Operating Strategy
Our operating strategy is designed to generate growth and enhance value by:
| A. | Increasing operating performance and cash flow through aggressive management of our stores: |
| • | We seek to differentiate our self-storage facilities from our competition through innovative marketing and value-added product offerings including: |
| • | Our Customer Care Center, established in 2000, answers sales inquires and makes reservations for all of our Properties on a centralized basis. Further, our call center and customer contact software was developed in-house and is 100% supported by our in-house experts; |
| • | The Uncle Bob’s truck move-in program, under which, at present, 349 of our stores offer a free Uncle Bob’s truck to assist our customers moving into their spaces, and also serve as a moving billboard further supporting our branding efforts; |
| • | Our dehumidification system, known as Dri-guard, which provides our customers with a better environment to store their goods and improves yields on our Properties; |
| • | Strategic and efficient Web and Mobile marketing that places Uncle Bob’s in front of customers in search engines at the right time for conversion; |
| • | Regional marketing which creates effective brand awareness in the cities where we do business. |
| • | Our customized computer applications link each of our primary sales channels (customer care center, web, and store) allowing for real time access to space type and inventory, pricing, promotions, and |
23
Table of Contents
| other pertinent store information. This also provides us with raw data on historical and current pricing, move-in and move-out activity, specials and occupancies, etc. This data is then used within the advanced pricing analytics programs employed by our revenue management team. |
| • | All of our store employees receive a high level of training. New store associates are assigned a Certified Training Manager as a mentor during their initial training period. In addition, all employees have access to our online Learning and Performance Management System internally named eBOB for initial training as well as continuing education. Finally, we have a company intranet that acts as a communications portal for company policy and procedures, online ordering, incentive rankings, etc. |
| B. | Acquiring additional stores: |
| • | Our objective is to acquire new stores in markets in which we currently operate. This is a proven strategy we have employed over the years as it facilitates our branding efforts, grows market share, and allows us to achieve improved economies of scale through shared advertising, payroll, and other services. |
| • | We also look to enter new markets that are in the top 50 MSA by acquiring established multi-property portfolios. With this strategy we are then able to seek out additional acquisition or third party management opportunities to continue to grow market share, branding and enhance economies of scale. |
| C. | Expanding our management business: |
| • | We see our management business as a source of future acquisitions. We hold a minority interest in two joint ventures which hold a total of 69 properties that we manage. In addition, we manage 17 self-storage facilities for which we have no ownership. We may enter into additional management agreements and develop additional joint ventures in the future. The joint venture agreements will give us first right of refusal to purchase the managed properties in the event they are offered for sale. |
| D. | Expanding and enhancing our existing stores: |
| • | Over the past 5 years we have undertaken a program of expanding and enhancing our Properties. In 2010, we added 162,000 square feet to existing Properties, and converted 6,500 square feet to premium storage for a total cost of approximately $9 million; in 2011, we added 118,000 square feet to existing Properties and converted 2,000 square feet to premium storage for a total cost of approximately $7.2 million; in 2012, we added 372,000 square feet to existing Properties and converted 35,000 square feet to premium storage for a total cost of approximately $22.5 million; in 2013, we added 295,000 square feet to existing Properties and converted 9,000 square feet to premium storage for a total cost of approximately $17.9 million, and in 2014, we added 272,000 square feet to existing Properties and converted 9,000 square feet to premium storage for a total cost of approximately $18.3 million. From 2011 through 2014 we also installed solar panels on 18 buildings for a total cost of approximately $4.7 million. Our solar panel initiative has reduced energy consumption and operating cost at those installed locations. |
Supply and Demand / Operating Trends
We believe the supply and demand model in the self-storage industry is micro market specific in that a majority of our business comes from within a five mile radius of our stores. The recent economic conditions and the credit market environment have resulted in a decrease in new supply on a national basis in the last five years. With the recent loosening of the debt and equity markets, we have seen capitalization rates on quality acquisitions (expected annual return on investment) decrease from approximately 5.75% to 5.00%.
24
Table of Contents
We believe our industry weathered the most recent recession very well. Although our industry experienced softness in 2008 through 2011, our same store sales showed positive increases save for 2009, when we showed a 3.1% decrease in same store revenue. That was the first time in recent history that we recorded negative same store sales. We feel our recent performance further supports the notion that the self-storage industry holds up well through recessions.
We believe our same-store move-ins in 2014 were lower than 2013 due to the fact that our stores were higher occupied in 2014, resulting in less space to rent. We believe the reduction in same store move outs is a result of longer staying customers.
| 2014 | 2013 | Change | ||||||||||
| Same store move ins |
159,274 | 166,116 | (6,842 | ) | ||||||||
| Same store move outs |
155,914 | 158,305 | (2,391 | ) | ||||||||
|
|
|
|
|
|
|
|||||||
| Difference |
3,360 | 7,811 | (4,451 | ) | ||||||||
We expect conditions in most of our markets to continue the recovery that we saw in 2011 through 2014.
We were able to maintain relatively flat expenses at the store operating level from 2009 through 2012, but did see above average increases in property taxes and insurance in 2013, and above average increases in property taxes in 2014. We do expect same store expense growth to see pressure from wages, health costs and property tax increases in 2015. We believe the same store expense increases will be at manageable levels.
Critical Accounting Policies and Estimates
The discussion and analysis of our financial condition and results of operations are based upon our consolidated financial statements, which have been prepared in accordance with U.S. generally accepted accounting principles. The preparation of these financial statements requires us to make estimates and judgments that affect the amounts reported in our financial statements and the accompanying notes. On an on-going basis, we evaluate our estimates and judgments, including those related to carrying values of storage facilities, bad debts, and contingencies and litigation. We base these estimates on experience and on various other assumptions that we believe to be reasonable under the circumstances, the results of which form the basis for making judgments about the carrying values of assets and liabilities that are not readily apparent from other sources. Actual results may differ from these estimates under different assumptions or conditions.
Assigning purchase price to assets acquired: The purchase price of acquired storage facilities is assigned primarily to land, land improvements, building, equipment, and in-place customer leases based on the fair values of these assets as of the date of acquisition. We use significant unobservable inputs in our determination of the fair values of these assets. The determination of these inputs involves judgments and estimates that can vary for each individual property based on a number of factors specific to the properties and the functional, economic and other factors affecting each property. To determine the fair value of land, we use prices per acre derived from observed transactions involving comparable land in similar locations. To determine the fair value of buildings, equipment and improvements, we use current replacement cost based on information derived from construction industry data by geographic region as adjusted for the age, condition, and economic obsolescence associated with these assets. The fair values of in-place customer leases is based on the rent lost due to the amount of time required to replace existing customers which is based on our historical experience with turnover in our facilities.
Carrying value of storage facilities: We believe our judgment regarding the impairment of the carrying value of our storage facilities is a critical accounting policy. Our policy is to assess the carrying value of our storage facilities for impairment whenever events or circumstances indicate that the carrying value of a storage facility may not be recoverable. Such events or circumstances would include negative operating cash flow, significant declining revenue per storage facility, significant damage sustained from accidents or natural disasters, or an expectation that, more likely than not, a property will be sold or otherwise disposed of significantly before the end of its previously
25
Table of Contents
estimated useful life. Impairment is evaluated based upon comparing the sum of the expected undiscounted future cash flows to the carrying value of the storage facility, on a property by property basis. If the sum of the undiscounted cash flow is less than the carrying amount, an impairment loss is recognized for the amount by which the carrying amount exceeds the fair value of the asset group. If cash flow projections are inaccurate and in the future it is determined that storage facility carrying values are not recoverable, impairment charges may be required at that time and could materially affect our operating results and financial position. Estimates of undiscounted cash flows could change based upon changes in market conditions, expected occupancy rates, etc. No assets had been determined to be impaired under this policy in 2014.
Estimated useful lives of long-lived assets: We believe that the estimated lives used for our depreciable, long-lived assets is a critical accounting policy. We periodically evaluate the estimated useful lives of our long-lived assets to determine if any changes are warranted based upon various factors, including changes in the planned usage of the assets, customer demand, etc. Changes in estimated useful lives of these assets could have a material adverse impact on our financial condition or results of operations. We have not made significant changes to the estimated useful lives of our long-lived assets in the past and we do not have any current expectation of making significant changes in 2015.
Consolidation and investment in joint ventures: We consolidate all wholly owned subsidiaries. Partially owned subsidiaries and joint ventures are consolidated when we control the entity or have the power to direct the activities most significant to the economic performance of the entity. Investments in joint ventures that we do not control but over which we have significant influence are reported using the equity method. Under the equity method, our investment in joint ventures are stated at cost and adjusted for our share of net earnings or losses and reduced by distributions. Equity in earnings of real estate ventures is generally recognized based on our ownership interest in the earnings of each of the unconsolidated real estate ventures.
Revenue and Expense Recognition: Rental income is recognized when earned pursuant to month-to-month leases for storage space. Promotional discounts are recognized as a reduction to rental income over the promotional period, which is generally during the first month of occupancy. Rental income received prior to the start of the rental period is included in deferred revenue.
Qualification as a REIT: We operate, and intend to continue to operate, as a REIT under the Code, but no assurance can be given that we will at all times so qualify. To the extent that we continue to qualify as a REIT, we will not be taxed, with certain limited exceptions, on the taxable income that is distributed to our shareholders. If we fail to qualify as a REIT, any requirement to pay federal income taxes could have a material adverse impact on our financial condition and results of operations.
Recent Accounting Pronouncements
In July 2013, the FASB issued ASU 2013-11, “Income Taxes (Topic 740): Presentation of an Unrecognized Tax Benefit When a Net Operating Loss Carryforward, a Similar Tax Loss, or a Tax Credit Carryforward Exists.” This ASU provides explicit guidance regarding the presentation in the statement of financial position of an unrecognized tax benefit when net operating losses or tax credit carryforwards exist. It is effective for fiscal years, and interim periods within those years, beginning after December 15, 2013, with early adoption permitted, and is applicable to the Company’s fiscal year beginning January 1, 2014. The adoption of this guidance did not have a material impact on the Company’s consolidated financial statements.
In April 2014, the FASB issued ASU 2014-08, “Presentation of Financial Statements (Topic 205) and Property, Plant and Equipment (Topic 360): Reporting Discontinued Operations and disclosures of Components of an Entity”. Under this ASU, only disposals representing a strategic shift in operations should be presented as discontinued operations. Those strategic shifts should have a major effect on the organization’s operations and financial results. The ASU also requires new disclosures of both discontinued operations and certain other disposals that do not meet the definition of a discontinued operation. It is effective for fiscal years, and interim periods within those years, beginning after December 15, 2014, with early adoption permitted. The Company adopted this guidance effective January 1, 2014 and the adoption is expected to significantly reduce the classification of property sales by the Company as discontinued operations.
26
Table of Contents
In May 2014, FASB issued ASU 2014-09, “Revenue from Contracts with Customers,” which supersedes the revenue recognition requirements in “Revenue Recognition (Topic 605),” and requires an entity to recognize revenue in a way that depicts the transfer of promised goods or services to customers in an amount that reflects the consideration to which the entity expects to be entitled to in exchange for those goods or services. ASU 2014-09 is effective for fiscal years, and interim periods within those years, beginning after December 15, 2016. The Company has the option to apply the provisions of ASU 2014-09 either retrospectively to each prior reporting period presented or retrospectively with the cumulative effect of initially applying the new guidance recognized at the date of initial application. The Company has not yet completed its assessment of the impact that the adoption of ASU 2014-09 will have on its consolidated financial statements.
In June 2014, the FASB issued ASU 2014-12, “Accounting for Share-Based Payments When the Terms of an Award Provide That a Performance
Target Could Be Achieved after the Requisite Service Period,” which requires a reporting entity to treat a performance target that affects vesting and that could be achieved after the requisite service period as a performance condition.
ASU
2014-12 is effective for annual periods, and interim periods within those annual periods, beginning after December 15, 2015. Early adoption is permitted. ASU 2014-12 may be adopted either prospectively for share-based payment awards granted or
modified on or after the effective date, or retrospectively, using a modified retrospective approach. The modified retrospective approach would apply to share-based payment awards outstanding as of the beginning of the earliest annual period
presented in the financial statements on adoption, and to all new or modified awards thereafter. The Company does not expect the adoption of ASU 2014-12 to have a material impact on its consolidated financial statements.
YEAR ENDED DECEMBER 31, 2014 COMPARED TO YEAR ENDED DECEMBER 31, 2013
We recorded rental revenues of $302.0 million for the year ended December 31, 2014, an increase of $48.7 million or 19.2% when compared to 2013 rental revenues of $253.4 million. Of the increase in rental revenue, $18.1 million resulted from a 7.3% increase in rental revenues at the 384 core properties considered in same store sales (those properties included in the consolidated results of operations since January 1, 2013, excluding the properties we sold in 2013 and 2014). The increase in same store rental revenues was a result of a 195 basis point increase in average occupancy and a 4.4% increase in rental income per square foot. The remaining increase in rental revenue of $30.6 million resulted from the revenues from the acquisition of 44 properties and the lease of four properties completed since January 1, 2013, slightly offset with the revenue decrease as a result of two self storage properties sold in 2014. Other operating income, which includes merchandise sales, insurance commissions, truck rentals, management fees and acquisition fees, increased by $3.9 million for the year ended December 31, 2014 compared to 2013 primarily as a result of increased commissions earned on customer insurance and an increase in management and acquisition fees.
Property operations and maintenance expenses increased $8.4 million or 13.8% in 2014 compared to 2013. The 384 core properties considered in the same store pool experienced a $2.0 million or 3.3% increase in operating expenses as a result of increases in payroll, utilities, credit card fees and maintenance costs. The same store pool benefited from reduced insurance and yellow page advertising expense. In addition to the same store operating expense increase, operating expenses increased $6.4 million from the acquisition of 44 properties and the lease of four properties completed since January 1, 2013. Real estate tax expense increased $5.6 million as a result of a 6.3% increase in property taxes on the 384 same store pool and the inclusion of taxes on the properties acquired or leased in 2014 and 2013.
Our 2014 same store results consist of only those properties that were included in our consolidated results since January 1, 2013, excluding the properties we sold in 2014 and 2013. The following table sets forth operating data for our 384 same store properties. These results provide information relating to property operating changes without the effects of acquisition.
27
Table of Contents
Same Store Summary
| Year ended December 31, | Percentage | |||||||||||
| (dollars in thousands) |
2014 | 2013 | Change | |||||||||
| Same store rental income |
$ | 265,788 | $ | 247,678 | 7.3 | % | ||||||
| Same store other operating income |
14,426 | 12,923 | 11.6 | % | ||||||||
|
|
|
|
|
|
|
|||||||
| Total same store operating income |
280,214 | 260,601 | 7.5 | % | ||||||||
| Payroll and benefits |
25,178 | 24,505 | 2.7 | % | ||||||||
| Real estate taxes |
27,289 | 25,671 | 6.3 | % | ||||||||
| Utilities |
10,608 | 10,155 | 4.5 | % | ||||||||
| Repairs and maintenance |
10,540 | 9,448 | 11.6 | % | ||||||||
| Office and other operating expenses |
9,783 | 9,555 | 2.4 | % | ||||||||
| Insurance |
3,987 | 4,303 | -7.3 | % | ||||||||
| Advertising and yellow pages |
1,391 | 1,528 | -9.0 | % | ||||||||
|
|
|
|
|
|
|
|||||||
| Total same store operating expenses |
88,776 | 85,165 | 4.2 | % | ||||||||
|
|
|
|
|
|
|
|||||||
| Same store net operating income |
$ | 191,438 | $ | 175,436 | 9.1 | % | ||||||
|
|
|
|
|
|
|
|||||||
Net operating income increased $38.5 million or 20.7% as a result of a 9.1% increase in our same store net operating income and the acquisitions and property leases completed since January 1, 2013.
Net operating income or “NOI” is a non-GAAP (generally accepted accounting principles) financial measure that we define as total continuing revenues less continuing property operating expenses. NOI also can be calculated by adding back to net income: interest expense, impairment and casualty losses, operating lease expense, depreciation and amortization expense, acquisition related costs, general and administrative expense, and deducting from net income: income from discontinued operations, interest income, gain on sale of real estate, and equity in income of joint ventures. We believe that NOI is a meaningful measure of operating performance because we utilize NOI in making decisions with respect to capital allocations, in determining current property values, and in comparing period-to-period and market-to-market property operating results. NOI should be considered in addition to, but not as a substitute for, other measures of financial performance reported in accordance with GAAP, such as total revenues, operating income and net income. There are material limitations to using a measure such as NOI, including the difficulty associated with comparing results among more than one company and the inability to analyze certain significant items, including depreciation and interest expense, that directly affect our net income. We compensate for these limitations by considering the economic effect of the excluded expense items independently as well as in connection with our analysis of net income. The following table reconciles NOI generated by our self-storage facilities to our net income presented in the 2014 and 2013 consolidated financial statements.
28
Table of Contents
| Year ended December 31, | ||||||||
| (dollars in thousands) |
2014 | 2013 | ||||||
| Net operating income |
||||||||
| Same store |
$ | 191,438 | $ | 175,436 | ||||
| Other stores and management fee income |
32,782 | 10,259 | ||||||
|
|
|
|
|
|||||
| Total net operating income |
224,220 | 185,695 | ||||||
| General and administrative |
(40,792 | ) | (34,939 | ) | ||||
| Acquisition related costs |
(7,359 | ) | (3,129 | ) | ||||
| Operating leases of storage facilities |
(7,987 | ) | (1,331 | ) | ||||
| Depreciation and amortization |
(51,749 | ) | (45,233 | ) | ||||
| Interest expense |
(34,578 | ) | (32,000 | ) | ||||
| Interest income |
40 | 40 | ||||||
| Gain on sale of real estate |
5,176 | 421 | ||||||
| Equity in income of joint ventures |
2,086 | 1,948 | ||||||
| Income from discontinued operations |
— | 3,123 | ||||||
|
|
|
|
|
|||||
| Net income |
$ | 89,057 | $ | 74,595 | ||||
|
|
|
|
|
|||||
General and administrative expenses increased $5.9 million or 16.8% from 2013 to 2014. The key drivers of the increase were a $3.6 million increase in salaries and performance incentives, and a $0.8 million increase in internet advertising. The remaining $1.5 million increase is the result of various other administrative costs related to managing the increased number of stores in our portfolio as compared to 2013.
Acquisition related costs were $7.4 million in 2014 as a result of the acquisition of 33 stores. Acquisition related costs for 2013 were $3.1 million as a result of the acquisition of 11 stores in 2013.
The Operating leases of storage facilities in 2013 and 2014 relate to lease agreements entered in November 2013 with respect to four self storage facilities in New York (2) and Connecticut (2). Such leases had annual lease payments of $6 million with a provision for 4% annual increases, and an exclusive option to purchase the facilities for $120 million. We exercised the purchase option and acquired these four stores in February 2015.
Depreciation and amortization expense increased to $51.7 million in 2014 from $45.2 million in 2013, primarily as a result of depreciation on the properties acquired in 2013 and 2014.
Interest expense increased from $32.0 million in 2013 to $34.6 million in 2014. The increase was mainly due to the new $175 million 10 year term unsecured note entered in April 2014, offset by reduced rates on our bank revolving credit facility and term notes. In addition, in September 2013 we replaced a maturing fixed rate term note with a bank term loan with a lower interest rate.
During 2014 we sold two non-strategic facilities in Texas for net proceeds of approximately $11.0 million resulting in a gain
on the sale of real estate of $5.2 million. Since the two sales occurred subsequent to the Company’s adoption of ASU 2014-08, these sales were not classified as discontinued operations since they did not meet the criteria for such
classification under
ASU 2014-08 guidance. During 2013, we sold our equity interest and mortgage note in a formerly consolidated joint venture for $4.4 million resulting in a gain on the sale of $0.4 million.
In the 4th quarter of 2013, we sold four non-strategic facilities in Ohio, Florida (2), and Virginia for net proceeds of approximately $11.7 million resulting in a gain of approximately 2.4 million. In July and August of 2012, the Company sold 17 non-strategic storage facilities in Maryland (1), Michigan (4) and Texas (12) for net proceeds of approximately $47.7 million resulting in a gain of approximately $4.5 million. The 2013 and 2012 operations of these facilities are reported in income from discontinued operations for all periods presented.
29
Table of Contents
YEAR ENDED DECEMBER 31, 2013 COMPARED TO YEAR ENDED DECEMBER 31, 2012
We recorded rental revenues of $253.4 million for the year ended December 31, 2013, an increase of $35.5 million or 16.3% when compared to 2012 rental revenues of $217.9 million. Of the increase in rental revenue, $15.8 million resulted from a 7.4% increase in rental revenues at the 358 core properties considered in same store sales (those properties included in the consolidated results of operations since January 1, 2012, excluding the properties we sold in 2012 and 2013). The increase in same store rental revenues was a result of a 340 basis point increase in average occupancy and a 2.6% increase in rental income per square foot. The remaining increase in rental revenue of $19.7 million resulted from the revenues from the acquisition of 39 properties and the lease of four properties completed from January 1, 2012 to December 31, 2013. Other operating income, which includes merchandise sales, insurance commissions, truck rentals, management fees and acquisition fees, increased by $3.9 million for the year ended December 31, 2013 compared to 2012 primarily as a result of increased commissions earned on customer insurance.
Property operations and maintenance expenses increased $6.2 million or 11.2% in 2013 compared to 2012. The 358 core properties considered in the same store pool experienced a $1.1 million or 2.0% increase in operating expenses as a result of increases in payroll, credit card fees and snow removal costs. The same store pool benefited from reduced yellow page advertising expense. In addition to the same store operating expense increase, operating expenses increased $5.1 million from the acquisition of 39 properties and the lease of four properties completed from January 1, 2012 to December 31, 2013. Real estate tax expense increased $4.4 million as a result of a 7.4% increase in property taxes on the 358 same store pool and the inclusion of taxes on the properties acquired or leased in 2013 and 2012.
Our 2013 same store results consist of only those properties that were included in our consolidated results since January 1, 2012, excluding the properties we sold in 2013 and 2012. The following table sets forth operating data for our 358 same store properties. These results provide information relating to property operating changes without the effects of acquisition.
Same Store Summary
| Year ended December 31, | Percentage | |||||||||||
| (dollars in thousands) |
2013 | 2012 | Change | |||||||||
| Same store rental income |
$ | 228,357 | $ | 212,596 | 7.4 | % | ||||||
| Same store other operating income |
12,284 | 10,745 | 14.3 | % | ||||||||
|
|
|
|
|
|
|
|||||||
| Total same store operating income |
240,641 | 223,341 | 7.7 | % | ||||||||
| Payroll and benefits |
22,521 | 22,277 | 1.1 | % | ||||||||
| Real estate taxes |
22,999 | 21,417 | 7.4 | % | ||||||||
| Utilities |
9,262 | 9,167 | 1.0 | % | ||||||||
| Repairs and maintenance |
8,734 | 8,488 | 2.9 | % | ||||||||
| Office and other operating expenses |
8,776 | 8,339 | 5.2 | % | ||||||||
| Insurance |
3,819 | 3,435 | 11.2 | % | ||||||||
| Advertising and yellow pages |
1,411 | 1,734 | -18.6 | % | ||||||||
|
|
|
|
|
|
|
|||||||
| Total same store operating expenses |
77,522 | 74,857 | 3.6 | % | ||||||||
|
|
|
|
|
|
|
|||||||
| Same store net operating income |
$ | 163,119 | $ | 148,484 | 9.9 | % | ||||||
|
|
|
|
|
|
|
|||||||
Net operating income increased $28.9 million or 18.4% as a result of a 9.9% increase in our same store net operating income and the acquisitions and property leases completed since January 1, 2012.
Net operating income or “NOI” is a non-GAAP (generally accepted accounting principles) financial measure that we define as total continuing revenues less continuing property operating expenses. NOI also can be calculated by adding back to net income: interest expense, impairment and casualty losses, operating lease expense, depreciation and amortization expense, acquisition related costs, general and administrative expense, and deducting
30
Table of Contents
from net income: income from discontinued operations, interest income, gain on sale of real estate, and equity in income of joint ventures. We believe that NOI is a meaningful measure of operating performance because we utilize NOI in making decisions with respect to capital allocations, in determining current property values, and in comparing period-to-period and market-to-market property operating results. NOI should be considered in addition to, but not as a substitute for, other measures of financial performance reported in accordance with GAAP, such as total revenues, operating income and net income. There are material limitations to using a measure such as NOI, including the difficulty associated with comparing results among more than one company and the inability to analyze certain significant items, including depreciation and interest expense, that directly affect our net income. We compensate for these limitations by considering the economic effect of the excluded expense items independently as well as in connection with our analysis of net income. The following table reconciles NOI generated by our self-storage facilities to our net income presented in the 2013 and 2012 consolidated financial statements.
| Year ended December 31, | ||||||||
| (dollars in thousands) |
2013 | 2012 | ||||||
| Net operating income |
||||||||
| Same store |
$ | 163,119 | $ | 148,484 | ||||
| Other stores and management fee income |
22,576 | 8,359 | ||||||
|
|
|
|
|
|||||
| Total net operating income |
185,695 | 156,843 | ||||||
| General and administrative |
(34,939 | ) | (32,313 | ) | ||||
| Acquisition related costs |
(3,129 | ) | (4,328 | ) | ||||
| Operating leases of storage facilities |
(1,331 | ) | — | |||||
| Depreciation and amortization |
(45,233 | ) | (40,542 | ) | ||||
| Interest expense |
(32,000 | ) | (33,166 | ) | ||||
| Interest income |
40 | 4 | ||||||
| Gain on sale of real estate |
421 | 687 | ||||||
| Equity in income of joint ventures |
1,948 | 936 | ||||||
| Income from discontinued operations |
3,123 | 7,520 | ||||||
|
|
|
|
|
|||||
| Net income |
$ | 74,595 | $ | 55,641 | ||||
|
|
|
|
|
|||||
General and administrative expenses increased $2.6 million or 8.1% from 2012 to 2013. The key drivers of the increase were a $1.6 million increase in salaries and performance incentives, and a $1.0 million increase in internet advertising.
Acquisition related costs decreased by $1.2 million as a result of the $94.9 million of stores acquired or leased in 2013 compared to the $189.1 million of stores acquired in 2012.
The Operating leases of storage facilities in 2013 relate to lease agreements entered in November 2013 with respect to four self storage facilities in New York (2) and Connecticut (2). Such leases had annual lease payments of $6 million with a provision for 4% annual increases, and an exclusive option to purchase the facilities for $120 million. We exercised the purchase option and acquired these four stores in February 2015.
Depreciation and amortization expense increased to $45.2 million in 2013 from $40.5 million in 2012, primarily as a result of depreciation on the properties acquired in 2012 and 2013.
Interest expense decreased from $33.2 million in 2012 to $32.0 million in 2013. The decrease was mainly due to the refinancing of our bank line of credit and term notes in June 2013 which reduced our interest rate on those obligations. In addition, in September 2013 we replaced a maturing fixed rate term note with a bank term loan with a lower interest rate.
During 2013, we sold our equity interest and mortgage note in a formerly consolidated joint venture for $4.4 million resulting in a gain on the sale of $0.4 million. During 2012, we sold a portion of one of our facilities and a parcel of land for net proceeds of $3.3 million resulting in a gain of $0.7 million.
31
Table of Contents
In the 4th quarter of 2013, we sold four non-strategic facilities in Ohio, Florida (2), and Virginia for net proceeds of approximately $11.7 million resulting in a gain of approximately 2.4 million. In July and August of 2012, the Company sold 17 non-strategic storage facilities in Maryland (1), Michigan (4) and Texas (12) for net proceeds of approximately $47.7 million resulting in a gain of approximately $4.5 million. The 2013 and 2012 operations of these facilities are reported in income from discontinued operations for all periods presented.
FUNDS FROM OPERATIONS
We believe that Funds from Operations (“FFO”) provides relevant and meaningful information about our operating performance that is necessary, along with net earnings and cash flows, for an understanding of our operating results. FFO adds back historical cost depreciation, which assumes the value of real estate assets diminishes predictably in the future. In fact, real estate asset values increase or decrease with market conditions. Consequently, we believe FFO is a useful supplemental measure in evaluating our operating performance by disregarding (or adding back) historical cost depreciation.
FFO is defined by the National Association of Real Estate Investment Trusts, Inc. (“NAREIT”) as net income available to common shareholders computed in accordance with generally accepted accounting principles (“GAAP”), excluding gains or losses on sales of properties, plus impairment of real estate assets, plus depreciation and amortization and after adjustments to record unconsolidated partnerships and joint ventures on the same basis. We believe that to further understand our performance, FFO should be compared with our reported net income and cash flows in accordance with GAAP, as presented in our consolidated financial statements.
In October and November of 2011, NAREIT issued guidance for reporting FFO that reaffirmed NAREIT’s view that impairment write-downs of depreciable real estate should be excluded from the computation of FFO. This view is based on the fact that impairment write-downs are akin to and effectively reflect the early recognition of losses on prospective sales of depreciable property or represent adjustments of previously charged depreciation. Since depreciation of real estate and gains/losses from sales are excluded from FFO, it is NAREIT’s view that it is consistent and appropriate for write-downs of depreciable real estate to also be excluded. Our calculation of FFO excludes impairment write-downs of investments in storage facilities.
Our computation of FFO may not be comparable to FFO reported by other REITs or real estate companies that do not define the term in accordance with the current NAREIT definition or that interpret the current NAREIT definition differently. FFO does not represent cash generated from operating activities determined in accordance with GAAP, and should not be considered as an alternative to net income (determined in accordance with GAAP) as an indication of our performance, as an alternative to net cash flows from operating activities (determined in accordance with GAAP) as a measure of our liquidity, or as an indicator of our ability to make cash distributions.
32
Table of Contents
Reconciliation of Net Income to Funds From Operations
| For Year Ended December 31, | ||||||||||||||||||||
| (dollars in thousands) | 2014 | 2013 | 2012 | 2011 | 2010 | |||||||||||||||
| Net income attributable to common shareholders |
$ | 88,531 | $ | 74,126 | $ | 55,128 | $ | 30,592 | $ | 40,642 | ||||||||||
| Net income attributable to noncontrolling interests |
526 | 469 | 513 | 937 | 1,899 | |||||||||||||||
| Depreciation of real estate and amortization of intangible assets exclusive of deferred financing fees |
50,827 | 44,369 | 40,153 | 34,835 | 31,218 | |||||||||||||||
| Depreciation of real estate included in discontinued operations |
— | 313 | 1,137 | 1,742 | 1,938 | |||||||||||||||
| Depreciation and amortization from unconsolidated joint ventures |
1,666 | 1,496 | 1,595 | 1,018 | 788 | |||||||||||||||
| Casualty and impairment loss |
— | — | — | 1,173 | — | |||||||||||||||
| Gain on sale of real estate |
(5,176 | ) | (2,852 | ) | (5,185 | ) | (1,511 | ) | (6,944 | ) | ||||||||||
| Funds from operations allocable to noncontrolling interest in Operating Partnership |
(806 | ) | (742 | ) | (881 | ) | (812 | ) | (885 | ) | ||||||||||
| Funds from operations allocable to noncontrolling interest in consolidated joint ventures |
— | — | — | (567 | ) | (1,360 | ) | |||||||||||||
|
|
|
|
|
|
|
|
|
|
|
|||||||||||
| Funds from operations available to common shareholders |
$ | 135,568 | $ | 117,179 | $ | 92,460 | $ | 67,407 | $ | 67,296 | ||||||||||
|
|
|
|
|
|
|
|
|
|
|
|||||||||||
LIQUIDITY AND CAPITAL RESOURCES
Our line of credit and term notes require us to meet certain financial covenants measured on a quarterly basis, including prescribed leverage, fixed charge coverage, minimum net worth, limitations on additional indebtedness, and limitations on dividend payouts. At December 31, 2014, the Company was in compliance with all debt covenants. The most sensitive covenant is the leverage ratio covenant contained in certain of our term note agreements. This covenant limits our total consolidated liabilities to 55% of our gross asset value. At December 31, 2014, our leverage ratio as defined in the agreements was approximately 37.7%. The agreements define total consolidated liabilities to include the liabilities of the Company plus our share of liabilities of unconsolidated joint ventures. The agreements also define a prescribed formula for determining gross asset value which incorporates the use of a 9.25% capitalization rate applied to annualized earnings before interest, taxes, depreciation and amortization and other items (“Adjusted EBITDA”) as defined in the agreements. In the event that the Company violates its debt covenants in the future, the amounts due under the agreements could be callable by the lenders and could adversely affect our credit rating requiring us to pay higher interest and other debt-related costs. We believe that if operating results remain consistent with historical levels and levels of other debt and liabilities remain consistent with amounts outstanding at December 31, 2014, the entire availability under our line of credit could be drawn without violating our debt covenants.
Our ability to retain cash flow is limited because we operate as a REIT. In order to maintain our REIT status, a substantial portion of our operating cash flow must be used to pay dividends to our shareholders. We believe that our internally generated net cash provided by operating activities and the availability on our line of credit will be sufficient to fund ongoing operations, capital improvements, dividends and debt service requirements through April 2016, at which time $150 million of term notes mature.
Cash flows from operating activities were $146.1 million, $120.6 million and $98.8 million for the years ended December 31, 2014, 2013, and 2012, respectively. The increase in operating cash flows from 2013 to 2014 and from 2012 to 2013 was primarily due to an increase in net income.
33
Table of Contents
Cash used in investing activities was $335.0 million, $114.3 million, and $175.7 million for the years ended December 31, 2014, 2013, and 2012 respectively. The increase in cash used from 2013 to 2014 was primarily due to $281.7 million spent in 2014 to purchase 33 storage facilities compared to the $94.8 million spent in 2013 on the acquisition of 11 storage facilities. In addition, in 2014 we invested $28.6 million in an unconsolidated joint venture to fund our share of the acquisition of 14 stores. In 2012 we spent $186.9 million to purchase 28 storage facilities. Also, in 2012 we received $47.7 million from the sale of storage facilities as compared to the $11.7 million we received in 2013 and the $11.2 million received in 2014.
Cash provided by financing activities was $187.9 million in 2014 compared to cash used in financing activities of $4.0 million in 2013. In 2014 we used the $112.7 million net proceeds from the sale of common stock and $175.0 million in term note proceeds to fund property acquisitions. In 2013, we used the $119.5 million net proceeds from the sale of common stock to paydown our line of credit and to fund a portion of the property acquisitions. In 2012 we realized $78.9 million from the sale of our common stock through our at the market equity offering and stock option plans, and $59.0 million in net proceeds from draws on our line of credit to fund a portion of our acquisitions and capital improvements.
On December 10, 2014, the Company amended its existing unsecured credit agreement. As part of the amended agreement, the Company increased its revolving credit limit from $175 million to $300 million. The interest rate on the revolving credit facility bears interest at a variable rate equal to LIBOR plus a margin based on the Company’s credit rating (at December 31, 2014 the margin is 1.30%), and requires a facility fee based on the Company’s credit rating (at December 31, 2014 the facility fee is 0.20%). The amended agreement also reduced the interest rate on the $325 million unsecured term note maturing June 4, 2020, with the term note bearing interest at LIBOR plus a margin based on the Company’s credit rating (at December 31, 2014 the margin is 1.40%). The interest rate at December 31, 2014 on the Company’s line of credit was approximately 1.46% (1.67% at December 31, 2013). At December 31, 2014, there was $250.3 million available on the unsecured line of credit net of $49.0 million in outstanding borrowings and outstanding letters of credit of $0.7 million. The revolving line of credit has a maturity date of December 10, 2019. The amended agreement also provides for an increase in the revolving credit facility and the bank term notes at the Company’s request to an aggregate amount up to $850 million.
On April 8, 2014, the Company entered into a $175 million term note maturing April 2024 bearing interest at a fixed rate of 4.533%. The interest rate on the term note increases to 6.283% if the Company is not rated by at least one rating agency or if the Company’s credit rating is downgraded. The proceeds from this term note were used to repay the $115 million outstanding on the Company’s line of credit at April 8, 2014, with the excess proceeds used for acquisitions.
In February 2015, the Company acquired five storage facilities for a combined purchase price of $126.8 million. These acquisitions were funded with draws on the Company’s line of credit.
On August 5, 2011, the Company entered into a $100 million term note maturing August 2021 bearing interest at a fixed rate of 5.54%. The interest rate on the term note increases to 7.29% if the notes are not rated by at least one rating agency, the credit rating on the notes is downgraded or if the Company’s credit rating is downgraded. The proceeds from this term note were used to fund acquisitions and investments in unconsolidated joint ventures.
The Company also maintains a $150 million unsecured term note maturing in April 2016 bearing interest at 6.38%. The interest rate on the $150 million unsecured term note increases to 8.13% if the notes are not rated by at least one rating agency, the credit rating on the notes is downgraded or the Company’s credit rating is downgraded.
Our line of credit facility and term notes have an investment grade rating from Standard and Poor’s and Fitch Ratings (BBB-).
In addition to the unsecured financing mentioned above, our consolidated financial statements also include $2.1 million of mortgages payable at December 31, 2014, that are secured by a storage facility.
34
Table of Contents
On May 12, 2014, the Company entered into a continuous equity offering program (“Equity Program”) with Wells Fargo Securities, LLC (“Wells Fargo”), Jefferies LLC (“Jefferies”), SunTrust Robinson Humphrey, Inc. (“SunTrust”), Piper Jaffray & Co. (“Piper”), HSBC Securities (USA) Inc. (“HSBC”), and BB&T Capital Markets, a division of BB&T Securities, LLC (“BB&T”), pursuant to which the Company may sell from time to time up to $225 million in aggregate offering price of shares of the Company’s common stock. Actual sales under the Equity Program will depend on a variety of factors and conditions, including, but not limited to, market conditions, the trading price of the Company’s common stock, and determinations of the appropriate sources of funding for the Company. The Company expects to continue to offer, sell, and issue shares of common stock under the Equity Program from time to time based on various factors and conditions, although the Company is under no obligation to sell any shares under the Equity Program.
During 2014, the Company issued 924,403 shares of common stock under the Equity Program at a weighted average issue price of $79.77 per share, generating net proceeds of $72.8 million after deducting $0.9 million of sales commissions paid to Piper, HSBC and BB&T. As of December 31, 2014, the Company had $151.3 million available for issuance under the Equity Program.
During the three months ended March 31, 2014, the Company issued 359,102 shares of common stock under a previous equity program at a weighted average issue price of $74.32 per share, generating net proceeds of $26.4 million after deducting $0.3 million of sales commissions payable to SunTrust.
During 2013, the Company issued 1,667,819 shares under its previously available equity offering program at a weighted average issue price of $65.66 per share, generating net proceeds of $107.8 million after deducting $0.5 million of sales commissions payable to SunTrust, $0.5 million to Wells Fargo, and $0.5 million to Jefferies. In addition to sales commissions, the Company incurred expenses of $0.2 million in connection with the Equity Program during 2013. The Company used the proceeds from the Equity Program to reduce the outstanding balance under the Company’s revolving line of credit and to fund the acquisition of 11 storage facilities.
During 2012, the Company issued 1,391,425 shares under its previously available equity offering program with Wells Fargo at a weighted average issue price of $55.20 per share, generating net proceeds of $75.3 million after deducting $1.5 million of sales commissions payable to Wells Fargo. In addition to sales commissions paid to Wells Fargo, the Company incurred expenses of $58,000 in connection with this equity offering program during 2012. The Company used the proceeds from this offering to reduce the outstanding balance under the Company’s revolving line of credit.
We implemented a Dividend Reinvestment Plan in March 2013. We issued 171,854 and 68,957 shares under the plan in 2014 and 2013, respectively.
During 2014 and 2013, we did not acquire any shares of our common stock via the Share Repurchase Program authorized by the Board of Directors. From the inception of the Share Repurchase Program through December 31, 2014, we have reacquired a total of 1,171,886 shares pursuant to this program. From time to time, subject to market price and certain loan covenants, we may reacquire additional shares.
Future acquisitions, our expansion and enhancement program, and share repurchases are expected to be funded with draws on our line of credit, issuance of common and preferred stock, the issuance of unsecured term notes, sale of properties, and private placement solicitation of joint venture equity. Should the capital markets deteriorate, we may have to curtail acquisitions, our expansion and enhancement program, and share repurchases as we approach April 2016, when certain term notes mature.
35
Table of Contents
CONTRACTUAL OBLIGATIONS
The following table summarizes our future contractual obligations:
| Payments due by period (in thousands) | ||||||||||||||||||||
| Contractual obligations |
Total | 2015 | 2016-2017 | 2018-2019 | 2020 and thereafter | |||||||||||||||
| Line of credit |
$ | 49,000 | — | — | $ | 49,000 | — | |||||||||||||
| Term notes |
750,000 | — | $ | 150,000 | — | $ | 600,000 | |||||||||||||
| Mortgages payable |
2,127 | $ | 134 | 293 | 330 | 1,370 | ||||||||||||||
| Interest payments |
156,688 | 29,560 | 42,348 | 39,811 | 44,969 | |||||||||||||||
| Interest rate swap payments |
13,341 | 5,501 | 2,825 | 4,364 | 651 | |||||||||||||||
| Standby letter of credit |
652 | 652 | — | — | — | |||||||||||||||
| Land lease |
802 | 53 | 106 | 107 | 536 | |||||||||||||||
| Expansion and enhancement contracts |
10,142 | 10,142 | — | — | — | |||||||||||||||
| Building leases |
8,740 | 1,481 | 1,934 | 1,947 | 3,378 | |||||||||||||||
| Self storage facility acquisitions |
143,680 | 143,680 | — | — | — | |||||||||||||||
|
|
|
|
|
|
|
|
|
|
|
|||||||||||
| Total |
$ | 1,135,172 | $ | 191,203 | $ | 197,506 | $ | 95,559 | $ | 650,904 | ||||||||||
Interest payments include actual interest on fixed rate debt and estimated interest for floating-rate debt based on December 31, 2014 rates. Interest rate swap payments include estimated net settlements of swap liabilities based on forecasted variable rates.
At December 31, 2014, the Company was under contract to acquire seven self-storage facilities for approximately $143.7 million. Five of the properties were acquired in February 2015 for $126.8 million. The purchase of the remaining facilities by the Company is subject to customary conditions to closing, and there is no assurance that these facilities will be acquired.
ACQUISITION OF PROPERTIES
In 2014, we acquired 33 self storage facilities comprising 2.4 million square feet in Florida (4), Georgia (1), Illinois (3), Louisiana (1), Maine (2), Missouri (7), New Jersey (6), New York (1), Texas (6), Tennessee (1), and Virginia (1) for a total purchase price of $291.9 million. Based on the trailing financials of the entities from which the properties were acquired, the weighted average capitalization rate was 5.5% on these purchases and ranged from 0%, on a newly constructed store, to 7.4%. In 2013, we acquired 11 self storage facilities comprising 0.6 million square feet in Colorado (1), Connecticut (1), Florida (1), Massachusetts (1), New Jersey (2), New York (3), and Texas (2) for a total purchase price of $94.9 million. Based on the trailing financials of the entities from which the properties were acquired, the weighted average capitalization rate was 4.8% on these purchases and ranged from 2.3% to 6.5%. In addition to the properties acquired, in November 2013 the Company entered into lease agreements with respect to four self storage facilities in New York (2) and Connecticut (2). Such leases had annual lease payments of $6 million with a provision for 4% annual increases, and an exclusive option to purchase the facilities for $120 million. We exercised our purchase option in November 2014 and completed the acquisition of these four properties in February 2015. In 2012, we acquired 28 self storage facilities comprising 2.2 million square feet in Arizona (1), Florida (8), Georgia (5), Illinois (9), North Carolina (1), Texas (3), and Virginia (1) for a total purchase price of $189.1 million.
36
Table of Contents
FUTURE ACQUISITION AND DEVELOPMENT PLANS
Our external growth strategy is to increase the number of facilities we own by acquiring suitable facilities in markets in which we already have operations, or to expand into new markets by acquiring several facilities at once in those new markets. We are actively pursuing acquisitions in 2015 and at December 31, 2014 we had seven properties under contract to be purchased for $143.7 million. Five of the properties were acquired in February 2015.
In 2014, we added 272,000 square feet to existing Properties and converted 9,000 square feet to premium storage for a total cost of approximately $18.3 million. During 2013, we added 295,000 square feet to existing Properties and converted 9,000 square feet to premium storage for a total cost of approximately $17.9 million. During 2012, we added 372,000 square feet to existing Properties, and converted 35,000 square feet to premium storage for a total cost of approximately $22.5 million. From 2011 through 2014 we also installed solar panels on 18 buildings for a total cost of approximately $4.7 million. Although we do not expect to construct any new facilities in 2015, we do plan to complete approximately $30 million in expansions and enhancements to existing facilities of which $3.3 million was paid prior to December 31, 2014.
In 2014, the Company spent approximately $20.4 million for recurring capitalized expenditures including roofing, paving, and office renovations. We expect to spend $19.4 million in 2015 on similar capital expenditures.
DISPOSITION OF PROPERTIES
During 2014, we sold two non-strategic storage facilities in Texas for net proceeds of approximately $11.0 million resulting in a gain of approximately $5.2 million. During 2013, we sold four non-strategic storage facilities in Florida, Ohio, and Virginia for net proceeds of approximately $11.7 million resulting in a gain of approximately $2.4 million. During 2012, we sold 17 non-strategic storage facilities in Maryland, Michigan, and Texas for net proceeds of approximately $47.7 million resulting in a gain of approximately $4.5 million.
We may seek to sell additional Properties to third parties or joint venture partners in 2015.
OFF-BALANCE SHEET ARRANGEMENTS
Our off-balance sheet arrangements consist of our investment in two self storage joint ventures in which we have a 20% and 15% ownership, as well as our investment in the entity that owns the building that houses our corporate office in which we have a 49% ownership. We account for these real estate entities under the equity method. The debt held by the unconsolidated real estate entity is secured by the real estate owned by these entities, and is non-recourse to us. See Note 12 to our consolidated financial statements appearing elsewhere in this annual report on Form 10-K.
REIT QUALIFICATION AND DISTRIBUTION REQUIREMENTS
As a REIT, we are not required to pay federal income tax on income that we distribute to our shareholders, provided that we satisfy certain requirements, including distributing at least 90% of our REIT taxable income for a taxable year. These distributions must be made in the year to which they relate, or in the following year if declared before we file our federal income tax return, and if they are paid not later than the date of the first regular dividend of the following year.
As a REIT, we must derive at least 95% of our total gross income from income related to real property, interest and dividends. In 2014, our percentage of revenue from such sources was approximately 97%, thereby passing the 95% test, and no special measures are expected to be required to enable us to maintain our REIT designation. Although we currently intend to operate in a manner designed to qualify as a REIT, it is possible that future economic, market, legal, tax or other considerations may cause our Board of Directors to revoke our REIT election.
37
Table of Contents
INTEREST RATE RISK
The primary market risk to which we believe we are exposed is interest rate risk, which may result from many factors, including government monetary and tax policies, domestic and international economic and political considerations, and other factors that are beyond our control.
We have entered into interest rate swap agreements in order to mitigate the effects of fluctuations in interest rates on our variable rate debt. Upon renewal or replacement of the credit facility, our total interest may change dependent on the terms we negotiate with the lenders; however, the LIBOR base rates have been contractually fixed on $325 million of our debt through the interest rate swap termination dates. See Note 8 to our consolidated financial statements appearing elsewhere in this annual report on Form 10-K.
Through September 2018, $325 million of our $374 million of floating rate unsecured debt is on a fixed rate basis after taking into account our interest rate swap agreements. Based on our outstanding unsecured floating rate debt of $374 million at December 31, 2014, a 100 basis point increase in interest rates would have a $0.5 million effect on our interest expense. These amounts were determined by considering the impact of the hypothetical interest rates on our borrowing cost and our interest rate hedge agreements in effect on December 31, 2014. These analyses do not consider the effects of the reduced level of overall economic activity that could exist in such an environment. Further, in the event of a change of such magnitude, we would consider taking actions to further mitigate our exposure to the change. However, due to the uncertainty of the specific actions that would be taken and their possible effects, the sensitivity analysis assumes no changes in our capital structure.
INFLATION
We do not believe that inflation has had or will have a direct effect on our operations. Substantially all of the leases at the facilities are on a month-to-month basis which provides us with the opportunity to increase rental rates as each lease matures.
SEASONALITY
Our revenues typically have been higher in the third and fourth quarters, primarily because self-storage facilities tend to experience greater occupancy during the late spring, summer and early fall months due to the greater incidence of residential moves and college student activity during these periods. However, we believe that our customer mix, diverse geographic locations, rental structure and expense structure provide adequate protection against undue fluctuations in cash flows and net revenues during off-peak seasons. Thus, we do not expect seasonality to affect materially distributions to shareholders.
| Item 7A. | Quantitative and Qualitative Disclosures About Market Risk |
The information required is incorporated by reference to the information appearing under the caption “Interest Rate Risk” in Item 7. Management’s Discussion and Analysis of Financial Condition and Results of Operations” above.
38
Table of Contents
| Item 8. | Financial Statements and Supplementary Data |
Report of Independent Registered Public Accounting Firm
The Board of Directors and Shareholders of Sovran Self Storage, Inc.
We have audited the accompanying consolidated balance sheets of Sovran Self Storage, Inc. as of December 31, 2014 and 2013, and the related consolidated statements of operations, comprehensive income, shareholders’ equity and cash flows for each of the three years in the period ended December 31, 2014. Our audits also included the financial statement schedule listed in the Index at Item 15(a). These financial statements and schedule are the responsibility of the Company’s management. Our responsibility is to express an opinion on these financial statements and schedule based on our audits.
We conducted our audits in accordance with the standards of the Public Company Accounting Oversight Board (United States). Those standards require that we plan and perform the audit to obtain reasonable assurance about whether the financial statements are free of material misstatement. An audit includes examining, on a test basis, evidence supporting the amounts and disclosures in the financial statements. An audit also includes assessing the accounting principles used and significant estimates made by management, as well as evaluating the overall financial statement presentation. We believe that our audits provide a reasonable basis for our opinion.
In our opinion, the financial statements referred to above present fairly, in all material respects, the consolidated financial position of Sovran Self Storage, Inc. at December 31, 2014 and 2013, and the consolidated results of its operations and its cash flows for each of the three years in the period ended December 31, 2014, in conformity with U.S. generally accepted accounting principles. Also, in our opinion, the related financial statement schedule, when considered in relation to the basic financial statements taken as a whole, presents fairly in all material respects the information set forth therein.
As discussed in Note 2 to the consolidated financial statements, Sovran Self Storage, Inc. changed its method for reporting discontinued operations effective January 1, 2014.
We also have audited, in accordance with the standards of the Public Company Accounting Oversight Board (United States), Sovran Self Storage, Inc.’s internal control over financial reporting as of December 31, 2014, based on criteria established in Internal Control-Integrated Framework issued by the Committee of Sponsoring Organizations of the Treadway Commission (1992 framework) and our report dated February 24, 2015 expressed an unqualified opinion thereon.
| /s/ Ernst & Young LLP |
| Buffalo, New York |
| February 24, 2015 |
39
Table of Contents
SOVRAN SELF STORAGE, INC.
CONSOLIDATED BALANCE SHEETS
| December 31, | ||||||||
| (dollars in thousands, except share data) | 2014 | 2013 | ||||||
| Assets |
||||||||
| Investment in storage facilities: |
||||||||
| Land |
$ | 397,642 | $ | 312,053 | ||||
| Building, equipment, and construction in progress |
1,780,341 | 1,552,584 | ||||||
|
|
|
|
|
|||||
| 2,177,983 | 1,864,637 | |||||||
| Less: accumulated depreciation |
(411,701 | ) | (366,472 | ) | ||||
|
|
|
|
|
|||||
| Investment in storage facilities, net |
1,766,282 | 1,498,165 | ||||||
| Cash and cash equivalents |
8,543 | 9,524 | ||||||
| Accounts receivable |
5,758 | 5,119 | ||||||
| Receivable from unconsolidated joint ventures |
583 | 883 | ||||||
| Investment in unconsolidated joint ventures |
57,803 | 30,391 | ||||||
| Prepaid expenses |
6,533 | 5,978 | ||||||
| Fair value of interest rate swap agreements |
— | 794 | ||||||
| Other assets |
9,298 | 11,021 | ||||||
|
|
|
|
|
|||||
| Total Assets |
$ | 1,854,800 | $ | 1,561,875 | ||||
|
|
|
|
|
|||||
| Liabilities |
||||||||
| Line of credit |
$ | 49,000 | $ | 49,000 | ||||
| Term notes |
750,000 | 575,000 | ||||||
| Accounts payable and accrued liabilities |
43,551 | 37,741 | ||||||
| Deferred revenue |
7,290 | 6,708 | ||||||
| Fair value of interest rate swap agreements |
13,341 | 7,523 | ||||||
| Mortgages payable |
2,127 | 2,254 | ||||||
|
|
|
|
|
|||||
| Total Liabilities |
865,309 | 678,226 | ||||||
| Noncontrolling redeemable Operating Partnership Units at redemption value |
13,622 | 12,940 | ||||||
| Shareholders’ Equity |
||||||||
| Common stock $.01 par value, 100,000,000 shares authorized, 34,105,955 shares outstanding at December 31, 2014 (32,532,991 at December 31, 2013) |
353 | 337 | ||||||
| Additional paid-in capital |
1,183,388 | 1,066,399 | ||||||
| Dividends in excess of net income |
(167,692 | ) | (162,450 | ) | ||||
| Accumulated other comprehensive loss |
(13,005 | ) | (6,402 | ) | ||||
| Treasury stock at cost, 1,171,886 shares |
(27,175 | ) | (27,175 | ) | ||||
|
|
|
|
|
|||||
| Total Shareholders’ Equity |
975,869 | 870,709 | ||||||
|
|
|
|
|
|||||
| Total Liabilities and Shareholders’ Equity |
$ | 1,854,800 | $ | 1,561,875 | ||||
|
|
|
|
|
|||||
See notes to consolidated financial statements.
40
Table of Contents
SOVRAN SELF STORAGE, INC.
CONSOLIDATED STATEMENTS OF OPERATIONS
| Year Ended December 31, | ||||||||||||
| (dollars in thousands, except per share data) | 2014 | 2013 | 2012 | |||||||||
| Revenues |
||||||||||||
| Rental income |
$ | 302,044 | $ | 253,384 | $ | 217,906 | ||||||
| Other operating income |
24,036 | 20,123 | 16,176 | |||||||||
|
|
|
|
|
|
|
|||||||
| Total operating revenues |
326,080 | 273,507 | 234,082 | |||||||||
| Expenses |
||||||||||||
| Property operations and maintenance |
69,763 | 61,316 | 55,163 | |||||||||
| Real estate taxes |
32,097 | 26,496 | 22,076 | |||||||||
| General and administrative |
40,792 | 34,939 | 32,313 | |||||||||
| Acquisition costs |
7,359 | 3,129 | 4,328 | |||||||||
| Operating leases of storage facilities |
7,987 | 1,331 | — | |||||||||
| Depreciation and amortization |
51,749 | 45,233 | 40,542 | |||||||||
|
|
|
|
|
|
|
|||||||
| Total operating expenses |
209,747 | 172,444 | 154,422 | |||||||||
|
|
|
|
|
|
|
|||||||
| Income from operations |
116,333 | 101,063 | 79,660 | |||||||||
| Other income (expenses) |
||||||||||||
| Interest expense |
(34,578 | ) | (32,000 | ) | (33,166 | ) | ||||||
| Interest income |
40 | 40 | 4 | |||||||||
| Gain on sale of storage facilities |
5,176 | — | — | |||||||||
| Gain on sale of real estate |
— | 421 | 687 | |||||||||
| Equity in income of joint ventures |
2,086 | 1,948 | 936 | |||||||||
|
|
|
|
|
|
|
|||||||
| Income from continuing operations |
89,057 | 71,472 | 48,121 | |||||||||
| Income from discontinued operations (including a gain on disposal of $2,431 in 2013 and $4,498 in 2012) |
— | 3,123 | 7,520 | |||||||||
|
|
|
|
|
|
|
|||||||
| Net income |
89,057 | 74,595 | 55,641 | |||||||||
| Net income attributable to noncontrolling interest |
(526 | ) | (469 | ) | (513 | ) | ||||||
|
|
|
|
|
|
|
|||||||
| Net income attributable to common shareholders |
$ | 88,531 | $ | 74,126 | $ | 55,128 | ||||||
|
|
|
|
|
|
|
|||||||
| Earnings per common share attributable to common shareholders - basic |
||||||||||||
| Continuing operations |
$ | 2.68 | $ | 2.27 | $ | 1.62 | ||||||
| Discontinued operations |
— | 0.10 | 0.26 | |||||||||
|
|
|
|
|
|
|
|||||||
| Earnings per share - basic |
$ | 2.68 | $ | 2.37 | $ | 1.88 | ||||||
|
|
|
|
|
|
|
|||||||
| Earnings per common share attributable to common shareholders - diluted |
||||||||||||
| Continuing operations |
$ | 2.67 | $ | 2.26 | $ | 1.61 | ||||||
| Discontinued operations |
— | 0.10 | 0.26 | |||||||||
|
|
|
|
|
|
|
|||||||
| Earnings per share - diluted |
$ | 2.67 | $ | 2.36 | $ | 1.87 | ||||||
|
|
|
|
|
|
|
|||||||
See notes to consolidated financial statements.
41
Table of Contents
SOVRAN SELF STORAGE, INC.
CONSOLIDATED STATEMENTS OF COMPREHENSIVE INCOME
| Year Ended December 31, | ||||||||||||
| (dollars in thousands, except per share data) | 2014 | 2013 | 2012 | |||||||||
| Net income |
$ | 89,057 | $ | 74,595 | $ | 55,641 | ||||||
| Other comprehensive income: |
||||||||||||
| Change in fair value of derivatives net of reclassification to interest expense |
(6,603 | ) | 8,840 | (4,987 | ) | |||||||
|
|
|
|
|
|
|
|||||||
| Total comprehensive income |
82,454 | 83,435 | 50,654 | |||||||||
| Comprehensive income attributable to noncontrolling interest |
(487 | ) | (525 | ) | (467 | ) | ||||||
|
|
|
|
|
|
|
|||||||
| Comprehensive income attributable to common shareholders |
$ | 81,967 | $ | 82,910 | $ | 50,187 | ||||||
|
|
|
|
|
|
|
|||||||
See notes to consolidated financial statements.
42
Table of Contents
SOVRAN SELF STORAGE, INC.
CONSOLIDATED STATEMENTS OF SHAREHOLDERS’ EQUITY
| (dollars in thousands, except share data) | Common Stock Shares |
Common Stock |
Additional Paid-in Capital |
Dividends in Excess of Net Income |
Accumulated Other Comprehensive Income (loss) |
Treasury Stock |
Total Shareholders’ Equity |
|||||||||||||||||||||
| Balance January 1, 2012 |
28,952,356 | $ | 301 | $ | 862,467 | $ | (169,799 | ) | $ | (10,255 | ) | $ | (27,175 | ) | $ | 655,539 | ||||||||||||
| Net proceeds from the issuance of common stock |
1,400,931 | 14 | 75,192 | — | — | — | 75,206 | |||||||||||||||||||||
| Exercise of stock options |
91,520 | 1 | 3,735 | — | — | — | 3,736 | |||||||||||||||||||||
| Issuance of non-vested stock |
1,813 | — | — | — | — | — | — | |||||||||||||||||||||
| Earned portion of non-vested stock |
— | — | 2,392 | — | — | — | 2,392 | |||||||||||||||||||||
| Stock option expense |
— | — | 280 | — | — | — | 280 | |||||||||||||||||||||
| Deferred compensation outside directors |
— | — | 122 | — | — | — | 122 | |||||||||||||||||||||
| Carrying value less than redemption value on redeemed noncontrolling interest |
— | — | (584 | ) | — | — | — | (584 | ) | |||||||||||||||||||
| Adjustment to redemption value of noncontrolling redeemable Operating Partnership Units |
— | — | — | (5,088 | ) | — | — | (5,088 | ) | |||||||||||||||||||
| Net income attributable to common shareholders |
— | — | — | 55,128 | — | — | 55,128 | |||||||||||||||||||||
| Change in fair value of derivatives |
— | — | — | — | (4,987 | ) | — | (4,987 | ) | |||||||||||||||||||
| Dividends |
— | — | — | (53,014 | ) | — | — | (53,014 | ) | |||||||||||||||||||
|
|
|
|
|
|
|
|
|
|
|
|
|
|
|
|||||||||||||||
| Balance December 31, 2012 |
30,446,620 | $ | 316 | $ | 943,604 | $ | (172,773 | ) | $ | (15,242 | ) | $ | (27,175 | ) | $ | 728,730 | ||||||||||||
| Net proceeds from the issuance of common stock |
1,667,819 | 17 | 107,810 | — | — | — | 107,827 | |||||||||||||||||||||
| Net proceeds from the issuance of common stock through Dividend Reinvestment Plan |
68,957 | 1 | 4,677 | — | — | — | 4,678 | |||||||||||||||||||||
| Exercise of stock options |
160,515 | 1 | 7,016 | — | — | — | 7,017 | |||||||||||||||||||||
| Issuance of non-vested stock |
189,080 | 2 | (2 | ) | — | — | — | — | ||||||||||||||||||||
| Earned portion of non-vested stock |
— | — | 2,876 | — | — | — | 2,876 | |||||||||||||||||||||
| Stock option expense |
— | — | 301 | — | — | — | 301 | |||||||||||||||||||||
| Deferred compensation outside directors |
— | — | 118 | — | — | — | 118 | |||||||||||||||||||||
| Carrying value less than redemption value on redeemed noncontrolling interest |
— | — | (1 | ) | — | — | — | (1 | ) | |||||||||||||||||||
| Adjustment to redemption value of noncontrolling redeemable Operating Partnership Units |
— | — | — | (524 | ) | — | — | (524 | ) | |||||||||||||||||||
| Net income attributable to common shareholders |
— | — | — | 74,126 | — | — | 74,126 | |||||||||||||||||||||
| Change in fair value of derivatives |
— | — | — | — | 8,840 | — | 8,840 | |||||||||||||||||||||
| Dividends |
— | — | — | (63,279 | ) | — | — | (63,279 | ) | |||||||||||||||||||
|
|
|
|
|
|
|
|
|
|
|
|
|
|
|
|||||||||||||||
| Balance December 31, 2013 |
32,532,991 | $ | 337 | $ | 1,066,399 | $ | (162,450 | ) | $ | (6,402 | ) | $ | (27,175 | ) | $ | 870,709 | ||||||||||||
| Net proceeds from the issuance of common stock |
1,283,505 | 13 | 98,968 | — | — | — | 98,981 | |||||||||||||||||||||
| Net proceeds from the issuance of common stock through Dividend Reinvestment Plan |
171,854 | 2 | 12,447 | — | — | — | 12,449 | |||||||||||||||||||||
| Exercise of stock options |
27,462 | — | 1,245 | — | — | — | 1,245 | |||||||||||||||||||||
| Issuance of non-vested stock |
90,143 | 1 | (1 | ) | — | — | — | — | ||||||||||||||||||||
| Earned portion of non-vested stock |
— | — | 4,556 | — | — | — | 4,556 | |||||||||||||||||||||
| Stock option expense |
— | — | 223 | — | — | — | 223 | |||||||||||||||||||||
| Deferred compensation outside directors |
— | — | 121 | — | — | — | 121 | |||||||||||||||||||||
| Carrying value less than redemption value on redeemed noncontrolling interest |
— | — | (570 | ) | — | — | — | (570 | ) | |||||||||||||||||||
| Adjustment to redemption value of noncontrolling redeemable Operating Partnership Units |
— | — | — | (3,738 | ) | — | — | (3,738 | ) | |||||||||||||||||||
| Net income attributable to common shareholders |
— | — | — | 88,531 | — | — | 88,531 | |||||||||||||||||||||
| Change in fair value of derivatives |
— | — | — | — | (6,603 | ) | — | (6,603 | ) | |||||||||||||||||||
| Dividends |
— | — | — | (90,035 | ) | — | — | (90,035 | ) | |||||||||||||||||||
|
|
|
|
|
|
|
|
|
|
|
|
|
|
|
|||||||||||||||
| Balance December 31, 2014 |
34,105,955 | $ | 353 | $ | 1,183,388 | $ | (167,692 | ) | $ | (13,005 | ) | $ | (27,175 | ) | $ | 975,869 | ||||||||||||
|
|
|
|
|
|
|
|
|
|
|
|
|
|
|
|||||||||||||||
See notes to consolidated financial statements
43
Table of Contents
SOVRAN SELF STORAGE, INC.
CONSOLIDATED STATEMENTS OF CASH FLOWS
| Year Ended December 31, | ||||||||||||
| (dollars in thousands) | 2014 | 2013 | 2012 | |||||||||
| Operating Activities |
||||||||||||
| Net income |
$ | 89,057 | $ | 74,595 | $ | 55,641 | ||||||
| Adjustments to reconcile net income to net cash provided by operating activities: |
||||||||||||
| Depreciation and amortization |
51,749 | 45,546 | 41,679 | |||||||||
| Amortization of deferred financing fees |
942 | 834 | 836 | |||||||||
| Gain on sale of storage facilities |
(5,176 | ) | — | — | ||||||||
| Gain on disposal of discontinued operations |
— | (2,431 | ) | (4,498 | ) | |||||||
| Gain on sale of real estate |
— | (421 | ) | (687 | ) | |||||||
| Equity in (income) losses of joint ventures |
(2,086 | ) | (1,948 | ) | (936 | ) | ||||||
| Distributions from unconsolidated joint venture |
3,123 | 2,630 | 2,184 | |||||||||
| Non-vested stock earned |
4,677 | 2,994 | 2,513 | |||||||||
| Stock option expense |
223 | 301 | 280 | |||||||||
| Changes in assets and liabilities (excluding the effects of acquisitions): |
||||||||||||
| Accounts receivable |
(606 | ) | (1,659 | ) | (451 | ) | ||||||
| Prepaid expenses |
(457 | ) | (810 | ) | (977 | ) | ||||||
| Receipts from (advances to) joint ventures |
590 | (27 | ) | (242 | ) | |||||||
| Accounts payable and other liabilities |
5,187 | 1,079 | 4,240 | |||||||||
| Deferred revenue |
(1,155 | ) | (37 | ) | (820 | ) | ||||||
|
|
|
|
|
|
|
|||||||
| Net cash provided by operating activities |
146,068 | 120,646 | 98,762 | |||||||||
| Investing Activities |
||||||||||||
| Acquisition of storage facilities |
(281,731 | ) | (94,759 | ) | (186,870 | ) | ||||||
| Improvements, equipment additions, and construction in progress |
(35,097 | ) | (33,889 | ) | (36,845 | ) | ||||||
| Net proceeds from the sale of storage facilities |
11,191 | — | — | |||||||||
| Net proceeds from the disposal of discontinued operations |
— | 11,741 | 47,698 | |||||||||
| Net proceeds from the sale of real estate |
— | 4,866 | 3,298 | |||||||||
| Casualty insurance proceeds received |
— | — | 626 | |||||||||
| Investment in unconsolidated joint ventures |
(28,650 | ) | (4,237 | ) | (3,571 | ) | ||||||
| Return of capital from unconsolidated joint ventures |
— | 7,360 | — | |||||||||
| Property deposits |
(706 | ) | (5,427 | ) | — | |||||||
|
|
|
|
|
|
|
|||||||
| Net cash used in investing activities |
(334,993 | ) | (114,345 | ) | (175,664 | ) | ||||||
| Financing Activities |
||||||||||||
| Net proceeds from sale of common stock |
112,676 | 119,522 | 78,943 | |||||||||
| Proceeds from line of credit |
202,000 | 152,000 | 154,000 | |||||||||
| Proceeds from term notes |
175,000 | 325,000 | — | |||||||||
| Repayment of line of credit |
(202,000 | ) | (208,000 | ) | (95,000 | ) | ||||||
| Repayment of term notes |
— | (325,000 | ) | — | ||||||||
| Financing costs |
(3,001 | ) | (1,554 | ) | — | |||||||
| Dividends paid - common stock |
(90,035 | ) | (63,279 | ) | (53,014 | ) | ||||||
| Distributions to noncontrolling interest holders |
(541 | ) | (402 | ) | (549 | ) | ||||||
| Redemption of operating partnership units |
(6,028 | ) | (322 | ) | (7,372 | ) | ||||||
| Mortgage principal payments |
(127 | ) | (1,997 | ) | (172 | ) | ||||||
|
|
|
|
|
|
|
|||||||
| Net cash provided by (used in) financing activities |
187,944 | (4,032 | ) | 76,836 | ||||||||
|
|
|
|
|
|
|
|||||||
| Net (decrease) increase in cash |
(981 | ) | 2,269 | (66 | ) | |||||||
| Cash at beginning of period |
9,524 | 7,255 | 7,321 | |||||||||
|
|
|
|
|
|
|
|||||||
| Cash at end of period |
$ | 8,543 | $ | 9,524 | $ | 7,255 | ||||||
|
|
|
|
|
|
|
|||||||
| Supplemental cash flow information |
||||||||||||
| Cash paid for interest, net of interest capitalized |
$ | 31,764 | $ | 32,909 | $ | 32,402 | ||||||
See notes to consolidated financial statements.
44
Table of Contents
SOVRAN SELF STORAGE, INC. - DECEMBER 31, 2014
NOTES TO CONSOLIDATED FINANCIAL STATEMENTS
1. ORGANIZATION
Sovran Self Storage, Inc. (the “Company,” “We,” “Our,” or “Sovran”), a self-administered and self-managed real estate investment trust (a “REIT”), was formed on April 19, 1995 to own and operate self-storage facilities throughout the United States. On June 26, 1995, the Company commenced operations effective with the completion of its initial public offering. At December 31, 2014, we had an ownership interest in, leased, and/or managed 518 self-storage properties in 25 states under the name Uncle Bob’s Self Storage ®. Among our 518 self-storage properties are 39 properties that we manage for an unconsolidated joint venture (Sovran HHF Storage Holdings LLC) of which we are a 20% owner, 30 properties that we manage for an unconsolidated joint venture (Sovran HHF Storage Holdings II LLC) of which we are a 15% owner, 17 properties that we manage and have no ownership interest, and four properties that we lease. Approximately 39% of the Company’s revenue is derived from stores in the states of Texas and Florida.
2. SUMMARY OF SIGNIFICANT ACCOUNTING POLICIES
Basis of Presentation: All of the Company’s assets are owned by, and all its operations are conducted through, Sovran Acquisition Limited Partnership (the “Operating Partnership”). Sovran Holdings, Inc., a wholly-owned subsidiary of the Company (the “Subsidiary”), is the sole general partner of the Operating Partnership; the Company is a limited partner of the Operating Partnership, and through its ownership of the Subsidiary and its limited partnership interest controls the operations of the Operating Partnership, holding a 99.5% ownership interest therein as of December 31, 2014. The remaining ownership interests in the Operating Partnership (the “Units”) are held by certain former owners of assets acquired by the Operating Partnership subsequent to its formation.
We consolidate all wholly owned subsidiaries. Partially owned subsidiaries and joint ventures are consolidated when we control the entity. Our consolidated financial statements include the accounts of the Company, the Operating Partnership, Uncle Bob’s Management, LLC (the Company’s taxable REIT subsidiary), Locke Sovran I, LLC (a wholly-owned subsidiary), and Locke Sovran II, LLC (a wholly-owned subsidiary). All intercompany transactions and balances have been eliminated. Investments in joint ventures that we do not control but for which we have significant influence over are accounted for using the equity method.
On June 30, 2011, the Company entered into a newly formed joint venture agreement with an owner of a self-storage facility in New Jersey (West Deptford JV LLC). As part of the agreement the Company contributed $4.2 million to the joint venture for a $2.8 million mortgage note at 8%, a 20% common interest, and a $1.4 million preferred interest with an 8% preferred return. The Company had concluded that this joint venture is a variable interest entity pursuant to the guidance in FASB ASC Topic 810, “Consolidation” on the basis that the total equity investment in the joint venture is not sufficient to permit the joint venture to finance its activities without additional subordinated financial support from its investors. On February 5, 2013 the Company entered into a Membership Interest Purchase Agreement to sell its common and preferred interests in West Deptford JV LLC to the other joint venture partner for approximately $1.4 million, resulting in a gain of $0.4 million. Simultaneous with this transaction the joint venture partner also repaid the $2.8 million mortgage note held by the Company. As a result of these transactions the Company no longer holds any ownership interest in this joint venture. The results of operations of this joint venture are included in our consolidated financial statements through the February 5, 2013 date of divesture.
Included in the consolidated balance sheets are noncontrolling redeemable operating partnership units. These interests are presented in the “mezzanine” section of the consolidated balance sheet because they do not meet the functional definition of a liability or equity under current accounting literature. These represent the outside ownership interests of the limited partners in the Operating Partnership. At December 31, 2014, there were 155,484 noncontrolling redeemable operating partnership Units outstanding (198,913 at December 31, 2013). These unitholders are entitled to receive distributions per unit equivalent to the dividends declared per share on the
45
Table of Contents
Company’s common stock. The Operating Partnership is obligated to redeem each of these limited partnership Units in the Operating Partnership at the request of the holder thereof for cash equal to the fair market value of a share of the Company’s common stock, at the time of such redemption, provided that the Company at its option may elect to acquire any such Unit presented for redemption for one common share or cash. The Company accounts for these noncontrolling redeemable Operating Partnership Units under the provisions of EITF D-98, “Classification and Measurement of Redeemable Securities” which was codified in FASB ASC Topic 480-10-S99. The application of the FASB ASC Topic 480-10-S99 accounting model requires the noncontrolling interest to follow normal noncontrolling interest accounting and then be marked to redemption value at the end of each reporting period if higher (but never adjusted below that normal noncontrolling interest accounting amount). The offset to the adjustment to the carrying amount of the noncontrolling redeemable Operating Partnership Units is reflected in dividends in excess of net income. Accordingly, in the accompanying consolidated balance sheet, noncontrolling redeemable Operating Partnership Units are reflected at redemption value at December 31, 2014 and 2013, equal to the number of Units outstanding multiplied by the fair market value of the Company’s common stock at that date. Redemption value exceeded the value determined under the Company’s historical basis of accounting at those dates.
| (Dollars in thousands) |
2014 | 2013 | ||||||
| Beginning balance noncontrolling redeemable Operating Partnership Units |
$ | 12,940 | $ | 12,670 | ||||
| Redemption of Operating Partnership Units |
(6,028 | ) | (322 | ) | ||||
| Redemption value in excess of carrying value |
570 | 1 | ||||||
| Issuance of Operating Partnership Units |
2,417 | — | ||||||
| Net income attributable to noncontrolling interests – consolidated joint venture |
526 | 469 | ||||||
| Distributions |
(541 | ) | (402 | ) | ||||
| Adjustment to redemption value |
3,738 | 524 | ||||||
|
|
|
|
|
|||||
| Ending balance noncontrolling redeemable Operating Partnership Units |
$ | 13,622 | $ | 12,940 | ||||
|
|
|
|
|
|||||
In 2014 the Company issued 28,481 Units with a fair value of $2.4 million to acquire one self-storage property. The fair value of the Units on the date of issuance was determined based upon the fair market value of the Company’s common stock on that date.
Cash and Cash Equivalents: The Company considers all highly liquid investments purchased with maturities of three months or less to be cash equivalents. Cash and cash equivalents include $6,000 and $34,000 held in escrow for an encumbered property at December 31, 2014 and 2013, respectively.
Accounts Receivable: Accounts receivable are composed of trade and other receivables recorded at billed amounts and do not bear interest. The allowance for doubtful accounts is the Company’s best estimate of the amount of probable uncollectible amounts in the Company’s existing accounts receivable. The Company determines the allowance based on a number of factors, including experience, credit worthiness of customers, and current market and economic conditions. The Company reviews the allowance for doubtful accounts on a regular basis. Account balances are charged against the allowance after all means of collection have been exhausted and the potential for recovery is considered remote. The allowance for doubtful accounts is recorded as a reduction of accounts receivable and amounted to $0.5 million, $0.4 million and $0.4 million at December 31, 2014, 2013 and 2012, respectively.
Revenue and Expense Recognition: Rental income is recognized when earned pursuant to month-to-month leases for storage space. Promotional discounts are recognized as a reduction to rental income over the promotional period, which is generally during the first month of occupancy. Rental income received prior to the start of the rental period is included in deferred revenue. Equity in earnings of real estate joint ventures that we have significant influence over is recognized based on our ownership interest in the earnings of these entities.
Cost of operations, general and administrative expense, interest expense and advertising costs are expensed as incurred. For the years ended December 31, 2014, 2013, and 2012, advertising costs were $6.2 million, $5.4 million, and $4.6 million, respectively. The Company accrues property taxes based on estimates and historical trends. If these estimates are incorrect, the timing and amount of expense recognition would be affected.
46
Table of Contents
Other Operating Income: Consists primarily of sales of storage-related merchandise (locks and packing supplies), insurance commissions, incidental truck rentals, and management and acquisition fees from unconsolidated joint ventures.
Investment in Storage Facilities: Storage facilities are recorded at cost. The purchase price of acquired facilities is allocated to land, land improvements, building, equipment, and in-place customer leases based on the fair value of each component. The fair values of land are determined based upon comparable market sales information. The fair values of buildings are determined based upon estimates of current replacement costs adjusted for depreciation on the properties. For the years ended December 31, 2014, 2013, and 2012, $7.4 million, $3.1 million and $4.3 million of acquisition related costs were incurred and expensed, respectively.
Depreciation is computed using the straight-line method over estimated useful lives of forty years for buildings and improvements, and five to twenty years for furniture, fixtures and equipment. Expenditures for significant renovations or improvements that extend the useful life of assets are capitalized. Interest and other costs incurred during the construction period of major expansions are capitalized. Capitalized interest during the years ended December 31, 2014, 2013, and 2012 was $0.1 million, $0.1 million and $0.1 million, respectively. Repair and maintenance costs are expensed as incurred.
Whenever events or changes in circumstances indicate that the basis of the Company’s property may not be recoverable, the Company’s policy is to complete an assessment of impairment. Impairment is evaluated based upon comparing the sum of the property’s expected undiscounted future cash flows to the carrying value of the property. If the sum of the undiscounted cash flow is less than the carrying amount, an impairment loss is recognized for the amount by which the carrying amount of the asset exceeds the fair value of the asset. For the years ended December 31, 2014, 2013 and 2012, no assets had been determined to be impaired under this policy.
In general, sales of real estate and related profits / losses are recognized when all consideration has changed hands and risks and rewards of ownership have been transferred.
Other Assets: Included in other assets are net deferred financing costs, property deposits, and the value placed on in-place customer leases at the time of acquisition. The gross deferred financing costs were $8.2 million and $6.3 million at December 31, 2014, and 2013, respectively. Accumulated amortization on gross deferred financing costs was approximately $1.9 million and $2.0 million at December 31, 2014, and 2013, respectively. Deferred financing costs are amortized over the terms of the related debt. Property deposits at December 31, 2014 and 2013 were $0.8 million and $5.6 million, respectively.
The Company allocates a portion of the purchase price of acquisitions to in-place customer leases. The methodology used to determine the fair value of in-place customer leases is disclosed in Note 9. The Company amortizes in-place customer leases on a straight-line basis over 12 months (the estimated future benefit period).
Amortization expense related to deferred financing costs was $0.9 million, $0.8 million and $0.8 million for the periods ended December 31, 2014, 2013 and 2012, respectively, and is included in interest expense in the consolidated statement of operations.
Investment in Unconsolidated Joint Ventures: The Company’s investment in unconsolidated joint ventures, where the Company has significant influence, but not control and joint ventures which are VIEs in which the Company is not the primary beneficiary, are recorded under the equity method of accounting in the accompanying consolidated financial statements. Under the equity method, the Company’s investment in unconsolidated joint ventures is stated at cost and adjusted for the Company’s share of net earnings or losses and reduced by distributions. Equity in earnings of unconsolidated joint ventures is generally recognized based on the Company’s ownership interest in the earnings of each of the unconsolidated joint ventures. For the purposes of presentation in the statement of cash flows, the Company follows the “look through” approach for classification of distributions from joint ventures. Under this approach, distributions are reported under operating cash flow unless
47
Table of Contents
the facts and circumstances of a specific distribution clearly indicate that it is a return of capital (e.g., a liquidating dividend or distribution of the proceeds from the joint venture’s sale of assets), in which case it is reported as an investing activity.
Accounts Payable and Accrued Liabilities: Accounts payable and accrued liabilities consists primarily of trade payables, accrued interest, and property tax accruals. The Company accrues property tax expense based on estimates and historical trends. Actual expense could differ from these estimates.
Income Taxes: The Company qualifies as a REIT under the Internal Revenue Code of 1986, as amended, and will generally not be subject to corporate income taxes to the extent it distributes its taxable income to its shareholders and complies with certain other requirements.
The Company has elected to treat one of its subsidiaries as a taxable REIT subsidiary. In general, the Company’s taxable REIT subsidiary may perform additional services for tenants and generally may engage in certain real estate or non-real estate related business. A taxable REIT subsidiary is subject to corporate federal and state income taxes. Deferred tax assets and liabilities are determined based on differences between financial reporting and tax bases of assets and liabilities.
For the years ended December 31, 2014, 2013 and 2012, the Company recorded federal and state income tax expense of $0.9 million, $0.9 million and $1.3 million, respectively. The 2014 income tax expense includes current expense of $0.5 million and deferred tax expense of $0.4 million. At December 31, 2014 and 2013, there were no material unrecognized tax benefits. Interest and penalties relating to uncertain tax positions will be recognized in income tax expense when incurred. As of December 31, 2014 and 2013, the Company had no interest or penalties related to uncertain tax provisions. Net income taxes payable and the deferred tax liability of our taxable REIT subsidiary are classified within accounts payable and accrued liabilities in the consolidated balance sheet. As of December 31, 2014, the Company’s taxable REIT subsidiary has current prepaid taxes of $0.5 million and a deferred tax liability of $1.3 million. As of December 31, 2013, the Company’s taxable REIT subsidiary had current prepaid taxes of $0.3 million and a deferred tax liability of $0.9 million.
Derivative Financial Instruments: The Company accounts for derivatives in accordance with ASC Topic 815 “Derivatives and Hedging”, which requires companies to carry all derivatives on the balance sheet at fair value. The Company determines the fair value of derivatives using an income approach. The accounting for changes in the fair value of a derivative instrument depends on whether it has been designated and qualifies as part of a hedging relationship and, if so, the reason for holding it. The Company’s use of derivative instruments is limited to cash flow hedges of certain interest rate risks.
Recent Accounting Pronouncements: In July 2013, the FASB issued ASU 2013-11, “Income Taxes (Topic 740): Presentation of an Unrecognized Tax Benefit When a Net Operating Loss Carryforward, a Similar Tax Loss, or a Tax Credit Carryforward Exists.” This ASU provides explicit guidance regarding the presentation in the statement of financial position of an unrecognized tax benefit when net operating losses or tax credit carryforwards exist. It is effective for fiscal years, and interim periods within those years, beginning after December 15, 2013, with early adoption permitted, and is applicable to the Company’s fiscal year beginning January 1, 2014. The adoption of this guidance did not have a material impact on the Company’s consolidated financial statements.
In April 2014, the FASB issued ASU 2014-08, “Presentation of Financial Statements (Topic 205) and Property, Plant and Equipment (Topic 360): Reporting Discontinued Operations and disclosures of Components of an Entity”. Under this ASU, only disposals representing a strategic shift in operations should be presented as discontinued operations. Those strategic shifts should have a major effect on the organization’s operations and financial results. The ASU also requires new disclosures of both discontinued operations and certain other disposals that do not meet the definition of a discontinued operation. It is effective for fiscal years, and interim periods within those years, beginning after December 15, 2014, with early adoption permitted. The Company adopted this guidance effective January 1, 2014 and the adoption is expected to significantly reduce the classification of property sales by the Company as discontinued operations.
48
Table of Contents
During 2014 the Company sold two properties with a carrying value of $5.8 million and received cash proceeds of $11.0 million, resulting in a $5.2 million gain on sale. The following table summarizes the revenues and expenses up to the date of sale of the two properties sold in 2014 that are included in the Company’s consolidated statements of operations for 2014, 2013 and 2012.
| (dollars in thousands) | 2014 | 2013 | 2012 | |||||||||
| Total revenues |
$ | 1,268 | $ | 1,480 | $ | 1,333 | ||||||
| Property operations and maintenance expense |
(259 | ) | (362 | ) | (367 | ) | ||||||
| Real estate tax expense |
(158 | ) | (187 | ) | (157 | ) | ||||||
| Depreciation and amortization expense |
(137 | ) | (179 | ) | (175 | ) | ||||||
| Gain on sale of storage facilities |
5,176 | — | — | |||||||||
|
|
|
|
|
|
|
|||||||
| $ | 5,890 | $ | 752 | $ | 634 | |||||||
|
|
|
|
|
|
|
|||||||
In May 2014, FASB issued ASU 2014-09, “Revenue from Contracts with Customers,” which supersedes the revenue recognition requirements in “Revenue Recognition (Topic 605),” and requires an entity to recognize revenue in a way that depicts the transfer of promised goods or services to customers in an amount that reflects the consideration to which the entity expects to be entitled to in exchange for those goods or services. ASU 2014-09 is effective for fiscal years, and interim periods within those years, beginning after December 15, 2016. The Company has the option to apply the provisions of ASU 2014-09 either retrospectively to each prior reporting period presented or retrospectively with the cumulative effect of initially applying the new guidance recognized at the date of initial application. The Company has not yet completed its assessment of the impact that the adoption of ASU 2014-09 will have on its consolidated financial statements.
In June 2014, the FASB issued ASU 2014-12, “Accounting for Share-Based Payments When the Terms of an Award Provide That a Performance Target Could Be Achieved after the Requisite Service Period,” which requires a reporting entity to treat a performance target that affects vesting and that could be achieved after the requisite service period as a performance condition. ASU 2014-12 is effective for annual periods, and interim periods within those annual periods, beginning after December 15, 2015. Early adoption is permitted. ASU 2014-12 may be adopted either prospectively for share-based payment awards granted or modified on or after the effective date, or retrospectively, using a modified retrospective approach. The modified retrospective approach would apply to share-based payment awards outstanding as of the beginning of the earliest annual period presented in the financial statements on adoption, and to all new or modified awards thereafter. The Company does not expect the adoption of ASU 2014-12 to have a material impact on its consolidated financial statements.
Stock-Based Compensation: The Company accounts for stock-based compensation under the provisions of ASC Topic 718, “Compensation - Stock Compensation”. The Company recognizes compensation cost in its financial statements for all share based payments granted, modified, or settled during the period. For awards with graded vesting, compensation cost is recognized on a straight-line basis over the related vesting period.
The Company recorded compensation expense (included in general and administrative expense) of $223,000, $301,000 and $280,000 related to stock options and $4.6 million, $2.9 million and $2.4 million related to amortization of non-vested stock grants for the years ended December 31, 2014, 2013 and 2012, respectively. The Company uses the Black-Scholes Merton option pricing model to estimate the fair value of stock options granted subsequent to the adoption of ASC Topic 718. The application of this pricing model involves assumptions that are judgmental and sensitive in the determination of compensation expense. The weighted average for key assumptions used in determining the fair value of options granted during 2014 follows:
| Weighted Average | Range | |||||
| Expected life (years) |
4.50 | 4.50 | ||||
| Risk free interest rate |
1.63 | % | 1.57% - 1.71% | |||
| Expected volatility |
22.77 | % | 22.60% - 22.90% | |||
| Expected dividend yield |
3.58 | % | 3.58% | |||
| Fair value |
$ | 10.04 | $10.02 - $10.06 | |||
49
Table of Contents
The weighted-average fair value of options granted during the years ended December 31, 2013 and 2012, were $13.95 and $12.40, respectively.
To determine expected volatility, the Company uses historical volatility based on daily closing prices of its Common Stock over periods that correlate with the expected terms of the options granted. The risk-free rate is based on the United States Treasury yield curve at the time of grant for the expected life of the options granted. Expected dividends are based on the Company’s history and expectation of dividend payouts. The expected life of stock options is based on the midpoint between the vesting date and the end of the contractual term.
During 2014 and 2013, the Company issued performance based non-vested stock to certain executives. The fair value for the performance based non-vested shares granted in 2014 and 2013 was estimated at the time the shares were granted using a Monte Carlo pricing model applying the following assumptions:
| 2014 | 2013 | |||||||
| Expected life (years) |
3.0 | 3.0 | ||||||
| Risk free interest rate |
1.18 | % | 0.64 | % | ||||
| Expected volatility |
18.42 | % | 24.78 | % | ||||
| Fair value |
$ | 46.95 | $ | 35.32 | ||||
The Monte Carlo pricing model was not used to value any other 2014, 2013 and 2012 non-vested shares granted as no market conditions were present in these awards. The value of these other non-vested shares was equal to the stock price on the date of grant.
Use of Estimates: The preparation of financial statements in conformity with U.S. generally accepted accounting principles requires management to make estimates and assumptions that affect the amounts reported in the financial statements and accompanying notes. Actual results could differ from those estimates.
3. EARNINGS PER SHARE
The Company reports earnings per share data in accordance ASC Topic 260, “Earnings Per Share.” Effective January 1, 2009, FASB ASC Topic 260 was updated for the issuance of FASB Staff Position (“FSP”) EITF 03-6-1, “Determining Whether Instruments Granted in Share-Based Payment Transactions Are Participating Securities”, or FSP EITF 03-6-1, with transition guidance included in FASB ASC Topic 260-10-65-2. Under FSP EITF 03-6-1, unvested share-based payment awards that contain nonforfeitable rights to dividends or dividend equivalents, whether paid or unpaid, are participating securities and shall be included in the computation of earnings-per-share pursuant to the two-class method. The Company has calculated its basic and diluted earnings per share using the two-class method. The following table sets forth the computation of basic and diluted earnings per common share utilizing the two-class method.
50
Table of Contents
| Year Ended December 31, | ||||||||||||
| (Amounts in thousands, except per share data) |
2014 | 2013 | 2012 | |||||||||
| Numerator: |
||||||||||||
| Net income from continuing operations attributable to common shareholders |
$ | 88,531 | $ | 71,023 | $ | 47,677 | ||||||
| Denominator: |
||||||||||||
| Denominator for basic earnings per share - weighted average shares |
33,019 | 31,297 | 29,358 | |||||||||
| Effect of Dilutive Securities: |
||||||||||||
| Stock options and non-vested stock |
172 | 156 | 131 | |||||||||
|
|
|
|
|
|
|
|||||||
| Denominator for diluted earnings per share - adjusted weighted average shares and assumed conversion |
33,191 | 31,453 | 29,489 | |||||||||
| Basic Earnings per Common Share from continuing operations attributable to common shareholders |
$ | 2.68 | $ | 2.27 | $ | 1.62 | ||||||
| Basic Earnings per Common Share attributable to common shareholders |
$ | 2.68 | $ | 2.37 | $ | 1.88 | ||||||
| Diluted Earnings per Common Share from continuing operations attributable to common shareholders |
$ | 2.67 | $ | 2.26 | $ | 1.61 | ||||||
| Diluted Earnings per Common Share attributable to common shareholders |
$ | 2.67 | $ | 2.36 | $ | 1.87 | ||||||
Not included in the effect of dilutive securities above are 5,000 stock options and 151,474 unvested restricted shares for the year ended December 31, 2014; and 2,000 stock options and 112,664 unvested restricted shares for the year ended December 31, 2013; and 31,375 stock options and 121,711 unvested restricted shares for the year ended December 31, 2012, because their effect would be antidilutive.
4. INVESTMENT IN STORAGE FACILITIES
The following summarizes activity in storage facilities during the years ended December 31, 2014 and December 31, 2013.
| (Dollars in thousands) |
2014 | 2013 | ||||||
| Cost: |
||||||||
| Beginning balance |
$ | 1,864,637 | $ | 1,742,354 | ||||
| Acquisition of storage facilities |
286,691 | 93,376 | ||||||
| Improvements and equipment additions |
40,137 | 32,241 | ||||||
| Increase (decrease) in construction in progress |
(5,040 | ) | 1,570 | |||||
| Dispositions and impairments |
(8,442 | ) | (4,904 | ) | ||||
|
|
|
|
|
|||||
| Ending balance |
$ | 2,177,983 | $ | 1,864,637 | ||||
|
|
|
|
|
|||||
| Accumulated Depreciation: |
||||||||
| Beginning balance |
$ | 366,472 | $ | 324,963 | ||||
| Additions during the year |
47,656 | 41,929 | ||||||
| Dispositions and impairments |
(2,427 | ) | (420 | ) | ||||
|
|
|
|
|
|||||
| Ending balance |
$ | 411,701 | $ | 366,472 | ||||
|
|
|
|
|
|||||
51
Table of Contents
The assets and liabilities of the acquired storage facilities, which primarily consist of tangible and intangible assets, are measured at fair value on the date of acquisition in accordance with the principles of FASB ASC Topic 820, “Fair Value Measurements and Disclosures.” During 2014 and 2013, the Company acquired 33 and 11 self-storage facilities, respectively, and the purchase price of the facilities was assigned as follows (as of December 31, 2014 the purchase price assignments relating to the facilities acquired during the second half of 2014 are preliminary):
| Consideration paid | Acquisition Date Fair Value | |||||||||||||||||||||||||||||||||||||||
| (dollars in thousands) State |
Number of Properties |
Date of Acquisition |
Purchase Price |
Cash Paid | Value of Operating Partnership Units Issued |
Net Other Liabilities (Assets) Assumed |
Land | Building, Equipment, and Improvements |
In-Place Customer Leases |
Closing Costs Expensed |
||||||||||||||||||||||||||||||
| 2014 |
||||||||||||||||||||||||||||||||||||||||
| Florida |
2 | 1/9/2014 | $ | 54,000 | $ | 53,599 | $ | — | $ | 401 | $ | 23,309 | $ | 29,867 | $ | 824 | $ | 1,674 | ||||||||||||||||||||||
| Texas |
1 | 1/17/2014 | 9,000 | 8,962 | — | 38 | 3,999 | 4,856 | 145 | 216 | ||||||||||||||||||||||||||||||
| Texas |
1 | 2/10/2014 | 8,900 | 8,857 | — | 43 | 2,235 | 6,564 | 101 | 204 | ||||||||||||||||||||||||||||||
| Maine |
2 | 2/11/2014 | 14,750 | 14,602 | — | 148 | 2,639 | 11,824 | 287 | 409 | ||||||||||||||||||||||||||||||
| Illinois |
1 | 3/31/2014 | 8,700 | 8,582 | — | 118 | 1,837 | 6,724 | 139 | 224 | ||||||||||||||||||||||||||||||
| Illinois |
1 | 5/5/2014 | 5,500 | 5,487 | — | 13 | 598 | 4,902 | — | 45 | ||||||||||||||||||||||||||||||
| Texas |
1 | 5/13/2014 | 6,075 | 6,017 | — | 58 | 2,000 | 3,935 | 140 | 181 | ||||||||||||||||||||||||||||||
| Missouri |
7 | 5/22/2014 | 35,050 | 34,786 | — | 264 | 9,420 | 24,835 | 795 | 622 | ||||||||||||||||||||||||||||||
| New Jersey |
1 | 6/5/2014 | 12,600 | 12,526 | — | 74 | 5,161 | 7,201 | 238 | 281 | ||||||||||||||||||||||||||||||
| New York |
1 | 6/11/2014 | 8,000 | 7,988 | — | 12 | 1,741 | 6,106 | 153 | 202 | ||||||||||||||||||||||||||||||
| New Jersey |
1 | 6/12/2014 | 2,500 | 2,431 | — | 69 | — | 2,319 | 181 | 64 | ||||||||||||||||||||||||||||||
| Georgia |
1 | 6/12/2014 | 7,700 | 7,616 | — | 84 | 2,263 | 5,293 | 144 | 179 | ||||||||||||||||||||||||||||||
| New Jersey |
3 | 6/18/2014 | 18,325 | 18,221 | — | 104 | 2,543 | 15,377 | 405 | 542 | ||||||||||||||||||||||||||||||
| New Jersey |
1 | 7/10/2014 | 11,590 | 11,572 | — | 18 | 1,512 | 9,880 | 198 | 321 | ||||||||||||||||||||||||||||||
| Florida |
1 | 8/28/2014 | 10,200 | 10,111 | — | 89 | 2,958 | 7,055 | 187 | 184 | ||||||||||||||||||||||||||||||
| Virginia |
1 | 9/5/2014 | 6,400 | 6,373 | — | 27 | 2,349 | 3,947 | 104 | 267 | ||||||||||||||||||||||||||||||
| Texas |
1 | 9/10/2014 | 11,200 | 11,046 | — | 154 | 2,658 | 8,299 | 243 | 196 | ||||||||||||||||||||||||||||||
| Tennessee |
1 | 9/18/2014 | 6,550 | 6,535 | — | 15 | 759 | 5,749 | 42 | 144 | ||||||||||||||||||||||||||||||
| Louisiana |
1 | 10/10/2014 | 16,750 | 16,630 | — | 120 | 5,771 | 10,697 | 282 | 238 | ||||||||||||||||||||||||||||||
| Florida |
1 | 10/20/2014 | 11,250 | 11,119 | — | 131 | 6,091 | 4,971 | 188 | 495 | ||||||||||||||||||||||||||||||
| Texas |
1 | 10/28/2014 | 13,125 | 13,095 | — | 30 | 4,196 | 8,721 | 208 | 267 | ||||||||||||||||||||||||||||||
| Illinois |
1 | 11/14/2014 | 5,750 | 3,239 | 2,417 | 94 | 889 | 4,850 | 11 | 206 | ||||||||||||||||||||||||||||||
| Texas |
1 | 12/18/2014 | 8,000 | 7,937 | — | 63 | 1,598 | 6,193 | 209 | 197 | ||||||||||||||||||||||||||||||
|
|
|
|
|
|
|
|
|
|
|
|
|
|
|
|
|
|
|
|||||||||||||||||||||||
| Total acquired 2014 |
33 | $ | 291,915 | $ | 287,331 | $ | 2,417 | $ | 2,167 | $ | 86,526 | $ | 200,165 | $ | 5,224 | $ | 7,358 | |||||||||||||||||||||||
| 2013 |
||||||||||||||||||||||||||||||||||||||||
| Texas |
1 | 2/11/2013 | $ | 2,400 | $ | 2,382 | $ | — | $ | 18 | $ | 337 | $ | 2,005 | $ | 58 | $ | 125 | ||||||||||||||||||||||
| New York |
1 | 3/22/2013 | 11,050 | 11,119 | — | (69 | ) | 2,122 | 8,736 | 192 | 244 | |||||||||||||||||||||||||||||
| Massachusetts |
1 | 3/22/2013 | 8,850 | 8,848 | — | 2 | 1,553 | 7,186 | 111 | 141 | ||||||||||||||||||||||||||||||
| New York |
2 | 8/29/2013 | 22,000 | 21,985 | — | 15 | 3,320 | 18,378 | 302 | 466 | ||||||||||||||||||||||||||||||
| Colorado |
1 | 9/30/2013 | 5,940 | 5,859 | — | 81 | 628 | 5,201 | 111 | 167 | ||||||||||||||||||||||||||||||
| New Jersey |
1 | 11/26/2013 | 8,535 | 8,499 | — | 36 | 1,843 | 6,544 | 148 | 249 | ||||||||||||||||||||||||||||||
| Florida |
1 | 12/4/2013 | 6,300 | 6,231 | — | 69 | 868 | 5,306 | 126 | 153 | ||||||||||||||||||||||||||||||
| Texas |
1 | 12/27/2013 | 6,900 | 6,873 | — | 27 | 1,547 | 5,226 | 127 | 337 | ||||||||||||||||||||||||||||||
| Connecticut |
1 | 12/30/2013 | 10,160 | 10,209 | — | (49 | ) | 1,174 | 8,817 | 169 | 196 | |||||||||||||||||||||||||||||
| New Jersey |
1 | 12/30/2013 | 12,765 | 12,754 | — | 11 | 1,639 | 10,946 | 180 | 359 | ||||||||||||||||||||||||||||||
|
|
|
|
|
|
|
|
|
|
|
|
|
|
|
|
|
|
|
|||||||||||||||||||||||
| Total acquired 2013 |
11 | $ | 94,900 | $ | 94,759 | $ | — | $ | 141 | $ | 15,031 | $ | 78,345 | $ | 1,524 | $ | 2,437 | |||||||||||||||||||||||
| Leased stores (CT, NY) |
4 | 11/1/2013 | — | — | — | — | — | — | — | 692 | ||||||||||||||||||||||||||||||
|
|
|
|
|
|
|
|
|
|
|
|
|
|
|
|
|
|||||||||||||||||||||||||
| Total acquired or leased 2013 |
15 | $ | 94,900 | $ | 94,759 | $ | — | $ | 141 | $ | 15,031 | $ | 78,345 | $ | 1,524 | $ | 3,129 | |||||||||||||||||||||||
|
|
|
|
|
|
|
|
|
|
|
|
|
|
|
|
|
|||||||||||||||||||||||||
All of the properties acquired in 2014 and 2013 were purchased from unrelated third parties. The operating results of the acquired facilities have been included in the Company’s operations since the respective acquisition dates. Of the $287.3 million paid at closing for the properties acquired during 2014, $5.6 million represented deposits that were paid in 2013 when certain of these properties originally went under contract.
52
Table of Contents
The Company measures the fair value of in-place customer lease intangible assets based on the Company’s experience with customer turnover. The Company amortizes in-place customer leases on a straight-line basis over 12 months (the estimated future benefit period). In-place customer leases are included in other assets on the Company’s balance sheet as follows:
| (Dollars in thousands) |
2014 | 2013 | ||||||
| In-place customer leases |
$ | 19,867 | $ | 14,643 | ||||
| Accumulated amortization |
(17,663 | ) | (13,551 | ) | ||||
|
|
|
|
|
|||||
| Net carrying value at December 31, |
$ | 2,204 | $ | 1,092 | ||||
|
|
|
|
|
|||||
Amortization expense related to in-place customer leases was $4.1 million, $3.3 million, and $3.3 million for the years ended December 31, 2014, 2013, and 2012, respectively. Amortization expense in 2015 is expected to be $2.2 million.
As noted above, during 2014, the Company acquired 33 properties. The following unaudited pro forma information is based on the combined historical financial statements of the Company and the 33 properties acquired, and presents the Company’s results as if the acquisitions had occurred as of January 1, 2012:
| (dollars in thousands) | 2014 | 2013 | 2012 | |||||||||
| Total revenues |
$ | 337,168 | $ | 300,589 | $ | 258,450 | ||||||
| Net income attributable to common shareholders |
$ | 99,103 | $ | 75,622 | $ | 41,942 | ||||||
| Earnings per common share |
||||||||||||
| Basic |
$ | 2.94 | $ | 2.25 | $ | 1.25 | ||||||
| Diluted |
$ | 2.93 | $ | 2.23 | $ | 1.24 | ||||||
The following table summarizes the revenues and earnings related to the 33 properties since the acquisition dates that are included in the Company’s 2014 consolidated statements of operations.
| Total revenues |
$ | 16,793 | ||
| Net loss attributable to common shareholders |
$ | (7,953 | ) |
The above net losses attributable to common shareholders were primarily due to the acquisition costs incurred in connection with the 2014 acquisitions.
5. DISCONTINUED OPERATIONS
In the 4th quarter of 2013, the Company sold four non-strategic storage facilities in Florida (2), Ohio (1), and Virginia (1) for net proceeds of approximately $11.7 million resulting in a gain of approximately $2.4 million. In 2012, the Company sold 17 non-strategic storage facilities in Maryland (1), Michigan (4), and Texas (12) for net proceeds of approximately $47.7 million resulting in a gain of approximately $4.5 million. The operations of these facilities and the loss or gain on sale are reported as discontinued operations. Cash flows of discontinued operations have not been segregated from the cash flows of continuing operations on the accompanying consolidated statement of cash flows for the years ended December 31, 2013 and 2012. The Company did not report any dispositions of facilities as discontinued operations in 2014. The following is a summary of the amounts reported as discontinued operations in 2013 and 2012:
| Year Ended December 31, | ||||||||
| (dollars in thousands) |
2013 | 2012 | ||||||
| Total revenue |
$ | 1,726 | $ | 7,069 | ||||
| Property operations and maintenance expense |
(576 | ) | (2,189 | ) | ||||
| Real estate tax expense |
(145 | ) | (721 | ) | ||||
| Depreciation and amortization expense |
(313 | ) | (1,137 | ) | ||||
| Net realized gain (loss) on sale of property |
2,431 | 4,498 | ||||||
|
|
|
|
|
|||||
| Total income from discontinued operations |
$ | 3,123 | $ | 7,520 | ||||
|
|
|
|
|
|||||
53
Table of Contents
Income from continuing operations attributable to common shareholders was $71.0 million and $47.7 million in 2013, and 2012, respectively. Income from discontinued operations attributable to common shareholders was $3.1 million and $7.5 million in 2013, and 2012, respectively.
6. UNSECURED LINE OF CREDIT AND TERM NOTES
Borrowings outstanding on our unsecured line of credit and term notes are as follows:
| Dec. 31, | Dec. 31, | |||||||
| (Dollars in thousands) |
2014 | 2013 | ||||||
| Revolving line of credit borrowings |
$ | 49,000 | $ | 49,000 | ||||
| Term note due April 13, 2016 |
150,000 | 150,000 | ||||||
| Term note due June 4, 2020 |
325,000 | 325,000 | ||||||
| Term note due August 5, 2021 |
100,000 | 100,000 | ||||||
| Term note due April 8, 2024 |
175,000 | — | ||||||
|
|
|
|
|
|||||
| Total term notes payable |
$ | 750,000 | $ | 575,000 | ||||
|
|
|
|
|
|||||
On December 10, 2014, the Company amended its existing unsecured credit agreement. As part of the amended agreement, the Company increased its revolving credit limit from $175 million to $300 million. The interest rate on the revolving credit facility bears interest at a variable rate equal to LIBOR plus a margin based on the Company’s credit rating (at December 31, 2014 the margin is 1.30%), and requires a 0.20% facility fee. The amended agreement also reduced the interest rate on the $325 million unsecured term note maturing June 4, 2020, with the term note bearing interest at LIBOR plus a margin based on the Company’s credit rating (at December 31, 2014 the margin is 1.40%). The interest rate at December 31, 2014 on the Company’s line of credit was approximately 1.46% (1.67% at December 31, 2013). At December 31, 2014, there was $250.3 million available on the unsecured line of credit net of outstanding letters of credit of $0.7 million. The revolving line of credit has a maturity date of December 10, 2019. The amended agreement also provides for an increase in the revolving credit facility and the bank term notes at the Company’s request to an aggregate amount up to $850 million.
In connection with the execution of the amendment to our unsecured credit agreement, it was determined that the borrowing capacity of nine of the lenders participating in the revolving line of credit exceeded their borrowing capacities prior to the amendment. As a result, for these nine lenders the unamortized deferred financing costs associated with the agreement prior to its amendment remain deferred and are being amortized to interest expense over the term of the newly amended agreement. Fees and other costs paid to execute the amendment relating to the revolving line of credit totaling $1.3 million were recorded as additional deferred financing costs and are being amortized to interest expense over the term of the newly amended agreement.
The Company paid $1.0 million in fees to lenders for their commitments under the unsecured term note portion of the newly amended agreement. These lenders’ commitments were determined to be a modification of their unsecured term note commitments prior to the amendment. Such costs were recorded as additional deferred financing costs and are being amortized to interest expense over the term of the newly amended agreement. In addition, for the nine continuing lenders’ the previously unamortized deferred financing costs associated with the unsecured term note commitments prior to the amendment remain deferred and are being amortized to interest expense over the term of the newly amended agreement.
On April 8, 2014, the Company entered into a $175 million term note maturing April 2024 bearing interest at a fixed rate of 4.533%. The interest rate on the term note increases to 6.283% if the Company is not rated by at least one rating agency or if the Company’s credit rating is downgraded. The proceeds from this term note were used to repay the $115 million outstanding on the Company’s line of credit at April 8, 2014, with the excess proceeds used for acquisitions.
In 2011, the Company entered into a $100 million term note maturing August 5, 2021 bearing interest at a
54
Table of Contents
fixed rate of 5.54%. The interest rate on the term note increases to 7.29% if the notes are not rated by at least one rating agency, the credit rating on the notes is downgraded or if the Company’s credit rating is downgraded. The proceeds from this term note were used to fund acquisitions and investments in unconsolidated joint ventures.
The Company also maintains a $150 million unsecured term note maturing April 13, 2016 bearing interest at 6.38%. The interest rate on the $150 million unsecured term note increases to 8.13% if the notes are not rated by at least one rating agency, the credit rating on the notes is downgraded or the Company’s credit rating is downgraded.
The line of credit and term notes require the Company to meet certain financial covenants, measured on a quarterly basis, including prescribed leverage, fixed charge coverage, minimum net worth, limitations on additional indebtedness and limitations on dividend payouts. At December 31, 2014, the Company was in compliance with its debt covenants.
We believe that if operating results remain consistent with historical levels and levels of other debt and liabilities remain consistent with amounts outstanding at December 31, 2014 the entire availability on the line of credit could be drawn without violating our debt covenants.
The Company’s fixed rate term notes contain a provision that allows for the noteholders to call the debt upon a change of control of the Company at an amount that includes a make whole premium based on rates in effect on the date of the change of control.
7. MORTGAGES PAYABLE AND DEBT MATURITIES
Mortgages payable at December 31, 2014 and 2013 consist of the following:
| (dollars in thousands) |
December 31, 2014 |
December 31, 2013 |
||||||
| 5.99% mortgage notes due May 1, 2026, secured by 1 self-storage facility with an aggregate net book value of $4.4 million, principal and interest paid monthly (effective interest rate 6.19%) |
2,127 | 2,254 | ||||||
|
|
|
|
|
|||||
| Total mortgages payable |
$ | 2,127 | $ | 2,254 | ||||
|
|
|
|
|
|||||
The table below summarizes the Company’s debt obligations and interest rate derivatives at December 31, 2014. The estimated fair value of financial instruments is subjective in nature and is dependent on a number of important assumptions, including discount rates and relevant comparable market information associated with each financial instrument. The fair value of the fixed rate term notes and mortgage notes were estimated by discounting the future cash flows using the current rates at which similar loans would be made to borrowers with similar credit ratings and for the same remaining maturities. These assumptions are considered Level 2 inputs within the fair value hierarchy as described in Note 9. The carrying values of our variable rate debt instruments approximate their fair values as these debt instruments bear interest at current market rates that approximate market participant rates. This is considered a Level 2 input within the fair value hierarchy. The use of different market assumptions and estimation methodologies may have a material effect on the reported estimated fair value amounts. Accordingly, the estimates presented below are not necessarily indicative of the amounts the Company would realize in a current market exchange.
55
Table of Contents
| Expected Maturity Date Including Discount | ||||||||||||||||||||||||||||||||
| (dollars in thousands) |
2015 | 2016 | 2017 | 2018 | 2019 | Thereafter | Total | Fair Value | ||||||||||||||||||||||||
| Line of credit - variable rate LIBOR + 1.30% (1.46% at December 31, 2014) |
— | — | — | — | $ | 49,000 | — | $ | 49,000 | $ | 49,000 | |||||||||||||||||||||
| Notes Payable: |
||||||||||||||||||||||||||||||||
| Term note - fixed rate 6.38% |
— | $ | 150,000 | — | — | — | — | $ | 150,000 | $ | 161,166 | |||||||||||||||||||||
| Term note - variable rate LIBOR+1.40% (1.56% at December 31, 2014) |
— | — | — | — | — | $ | 325,000 | $ | 325,000 | $ | 325,000 | |||||||||||||||||||||
| Term note - fixed rate 5.54% |
— | — | — | — | — | $ | 100,000 | $ | 100,000 | $ | 111,452 | |||||||||||||||||||||
| Term note - fixed rate 4.533% |
— | — | — | — | — | $ | 175,000 | $ | 175,000 | $ | 181,331 | |||||||||||||||||||||
| Mortgage note - fixed rate 5.99% |
$ | 134 | $ | 142 | $ | 151 | $ | 160 | $ | 170 | $ | 1,370 | $ | 2,127 | $ | 2,277 | ||||||||||||||||
| Interest rate derivatives – liability |
— | — | — | — | — | — | — | $ | 13,341 | |||||||||||||||||||||||
8. DERIVATIVE FINANCIAL INSTRUMENTS
Interest rate swaps are used to adjust the proportion of total debt that is subject to variable interest rates. The interest rate swaps require the Company to pay an amount equal to a specific fixed rate of interest times a notional principal amount and to receive in return an amount equal to a variable rate of interest times the same notional amount. The notional amounts are not exchanged. No other cash payments are made unless the contract is terminated prior to its maturity, in which case the contract would likely be settled for an amount equal to its fair value. The Company enters into interest rate swaps with a number of major financial institutions to minimize counterparty credit risk.
The interest rate swaps qualify and are designated as hedges of the amount of future cash flows related to interest payments on variable rate debt. Therefore, the interest rate swaps are recorded in the consolidated balance sheet at fair value and the related gains or losses are deferred in shareholders’ equity as Accumulated Other Comprehensive Loss (“AOCL”). These deferred gains and losses are recognized in interest expense during the period or periods in which the related interest payments affect earnings. However, to the extent that the interest rate swaps are not perfectly effective in offsetting the change in value of the interest payments being hedged, the ineffective portion of these contracts is recognized in earnings immediately. Ineffectiveness was deminimus in 2014, 2013, and 2012.
The Company has interest rate swap agreements in effect at December 31, 2014 as detailed below to effectively convert a total of $325 million of variable-rate debt to fixed-rate debt.
| Notional Amount |
Effective Date |
Expiration Date |
Fixed Rate Paid |
Floating Rate Received |
||||||||||||
| $125 Million |
9/1/2011 | 8/1/18 | 2.3700 | % | 1 month LIBOR | |||||||||||
| $100 Million |
12/30/11 | 12/29/17 | 1.6125 | % | 1 month LIBOR | |||||||||||
| $100 Million |
9/4/13 | 9/4/18 | 1.3710 | % | 1 month LIBOR | |||||||||||
| $100 Million |
12/29/17 | 11/29/19 | 3.9680 | % | 1 month LIBOR | |||||||||||
| $125 Million |
8/1/18 | 6/1/20 | 4.1930 | % | 1 month LIBOR | |||||||||||
The interest rate swap agreements are the only derivative instruments, as defined by FASB ASC Topic 815 “Derivatives and Hedging”, held by the Company. During 2014, 2013, and 2012, the net reclassification from AOCL to interest expense was $5.5 million, $5.3 million and $4.9 million, respectively, based on payments made under the swap agreements. Based on current interest rates, the Company estimates that payments under the interest rate swaps will be approximately $5.5 million in 2015. Payments made under the interest rate swap agreements will be reclassified to interest expense as settlements occur. The fair value of the swap agreements, including accrued interest, was a liability of $13.3 million at December 31, 2014, and an asset of $0.8 million and a liability of $7.5 million at December 31, 2013.
56
Table of Contents
The Company’s agreements with its interest rate swap counterparties contain provisions pursuant to which the Company could be declared in default of its derivative obligations if the Company defaults on any of its indebtedness, including default where repayment of the indebtedness has not been accelerated by the lender. The interest rate swap agreements also incorporate other loan covenants of the Company. Failure to comply with the loan covenant provisions would result in the Company being in default on the interest rate swap agreements. As of December 31, 2014, the Company had not posted any collateral related to the interest rate swap agreements. If the Company had breached any of these provisions as of December 31, 2014, it could have been required to settle its obligations under the agreements at their net termination value of $13.3 million.
The changes in AOCL for the years ended December 31, 2014, 2013 and 2012 are summarized as follows:
| (dollars in thousands) |
Jan. 1, 2014 to Dec. 31, 2014 |
Jan. 1, 2013 to Dec. 31, 2013 |
Jan. 1, 2012 to Dec. 31, 2012 |
|||||||||
| Accumulated other comprehensive loss beginning of period |
$ | (6,402 | ) | $ | (15,242 | ) | $ | (10,255 | ) | |||
| Realized loss reclassified from accumulated other comprehensive loss to interest expense |
5,506 | 5,299 | 4,889 | |||||||||
| Unrealized gain (loss) from changes in the fair value of the effective portion of the interest rate swaps |
(12,109 | ) | 3,541 | (9,876 | ) | |||||||
|
|
|
|
|
|
|
|||||||
| (Loss) gain included in other comprehensive loss |
(6,603 | ) | 8,840 | (4,987 | ) | |||||||
|
|
|
|
|
|
|
|||||||
| Accumulated other comprehensive loss end of period |
$ | (13,005 | ) | $ | (6,402 | ) | $ | (15,242 | ) | |||
|
|
|
|
|
|
|
|||||||
9. FAIR VALUE MEASUREMENTS
The Company applies the provisions of ASC Topic 820 “Fair Value Measurements and Disclosures” in determining the fair value of its financial and nonfinancial assets and liabilities. ASC Topic 820 establishes a valuation hierarchy for disclosure of the inputs to valuation used to measure fair value. This hierarchy prioritizes the inputs into three broad levels as follows. Level 1 inputs are quoted prices (unadjusted) in active markets for identical assets or liabilities. Level 2 inputs are quoted prices for similar assets and liabilities in active markets or inputs that are observable for the asset or liability, either directly or indirectly through market corroboration. Level 3 inputs are unobservable inputs based on our own assumptions used to measure assets and liabilities at fair value. A financial asset or liability’s classification within the hierarchy is determined based on the lowest level input that is significant to the fair value measurement.
In May 2011 the FASB issued ASU No. 2011-04, Fair Value Measurements (Topic 820): Amendments to Achieve Common Fair Value Measurement and Disclosure Requirements in US GAAP and International Financial Reporting Standards (“IFRS”) (“ASU 2011-04”). ASU 2011-04 represents the converged guidance of the FASB and the IASB (the “Boards”) on fair value measurements. The collective efforts of the Boards and their staffs, reflected in ASU 2011-04, have resulted in common requirements for measuring fair value and for disclosing information about fair value measurements, including a consistent meaning of the term “fair value.” The Boards have concluded the common requirements will result in greater comparability of fair value measurements presented and disclosed in financial statements prepared in accordance with GAAP and IFRS. The amendments in this ASU were required to be applied prospectively, and were effective for interim and annual periods beginning after December 15, 2011. The Company adopted the provisions of ASU 2011-04 on January 1, 2012 and its adoption did not have a significant impact on the Company’s current fair value measurements or disclosures. The adoption is not expected to have a significant effect on any future fair value measurements or disclosures.
Refer to Note 7 for presentation of the fair values of debt obligations which are disclosed at fair value on a recurring basis.
57
Table of Contents
The following table provides the assets and liabilities carried at fair value measured on a recurring basis as of December 31, 2014 (in thousands):
| Asset (Liability) |
Level 1 | Level 2 | Level 3 | |||||||||||||
| Interest rate swaps |
(13,341 | ) | — | (13,341 | ) | — | ||||||||||
Interest rate swaps are over the counter securities with no quoted readily available Level 1 inputs, and therefore are measured at fair value using inputs that are directly observable in active markets and are classified within Level 2 of the valuation hierarchy, using the income approach.
During 2014, assets and liabilities measured at fair value on a non-recurring basis included the assets acquired and liabilities assumed in connection with the acquisition of 33 storage facilities (see note 4). To determine the fair value of land, the Company used prices per acre derived from observed transactions involving comparable land in similar locations, which is considered a Level 2 input. To determine the fair value of buildings, equipment and improvements, the Company used current replacement cost based on information derived from construction industry data by geographic region which is considered a Level 2 input. The replacement cost is then adjusted for the age, condition, and economic obsolescence associated with these assets, which are considered Level 3 inputs. The fair value of in-place customer leases is based on the rent lost due to the amount of time required to replace existing customers which is based on the Company’s historical experience with turnover at its facilities, which is a Level 3 input. Other assets acquired and liabilities assumed in the acquisitions consist primarily of prepaid or accrued real estate taxes and deferred revenues from advance monthly rentals paid by customers. The fair values of these assets and liabilities are based on their carrying values as they typically turn over within one year from the acquisition date and these are Level 3 inputs.
10. STOCK BASED COMPENSATION
The Company established the 2005 Award and Option Plan (the “Plan”) which replaced the expired 1995 Award and Option Plan for the purpose of attracting and retaining the Company’s executive officers and other key employees. 1,500,000 shares were authorized for issuance under the Plan. Options granted under the Plan vest ratably over four and eight years, and must be exercised within ten years from the date of grant. The exercise price for qualified incentive stock options must be at least equal to the fair market value of the common shares at the date of grant. As of December 31, 2014, options for 82,606 shares were outstanding under the Plans and options for 543,229 shares of common stock were available for future issuance. The Company may also grant other stock-based awards under the Plan, including restricted stock and performance-based vesting restricted stock awards.
The Company also established the 2009 Outside Directors’ Stock Option and Award Plan (the “Non-employee Plan”) which replaced the 1995 Outside Directors’ Stock Option Plan for the purpose of attracting and retaining the services of experienced and knowledgeable outside directors. The Non-employee Plan provides for the initial granting of options to purchase 3,500 shares of common stock and for the annual granting of options to purchase 2,000 shares of common stock to each eligible director. Such options vest over a one-year period for initial awards and immediately upon subsequent grants. In addition, each outside director receives non-vested shares annually equal to 80% of the annual fees paid to them. During the restriction period, the non-vested shares may not be sold, transferred, or otherwise encumbered. The holder of the non-vested shares has all rights of a holder of common shares, including the right to vote and receive dividends. During 2014, 1,684 non-vested shares were issued to outside directors. Such non-vested shares vest over a one-year period. The total shares reserved under the Non-employee Plan is 150,000. The exercise price for options granted under the Non-employee Plan is equal to the fair market value at the date of grant. As of December 31, 2014, options for 33,000 common shares and 22,850 of non-vested shares were outstanding under the Non-employee Plans. As of December 31, 2014 options for 84,855 shares of common stock were available for future issuance.
58
Table of Contents
A summary of the Company’s stock option activity and related information for the years ended December 31 follows:
| 2014 | 2013 | 2012 | ||||||||||||||||||||||
| Options | Weighted average exercise price |
Options | Weighted average exercise price |
Options | Weighted average exercise price |
|||||||||||||||||||
| Outstanding at beginning of year: |
130,568 | $ | 44.82 | 273,248 | $ | 43.45 | 364,268 | $ | 42.76 | |||||||||||||||
| Granted |
14,000 | 76.01 | 8,000 | 69.90 | 9,500 | 49.42 | ||||||||||||||||||
| Exercised |
(27,462 | ) | 45.34 | (160,515 | ) | 43.72 | (91,520 | ) | 40.82 | |||||||||||||||
| Adjusted / (forfeited) |
(1,500 | ) | 40.07 | 9,835 | 36.37 | (9,000 | ) | 39.23 | ||||||||||||||||
|
|
|
|
|
|
|
|
|
|
|
|
|
|||||||||||||
| Outstanding at end of year |
115,606 | $ | 48.54 | 130,568 | $ | 44.82 | 273,248 | $ | 43.45 | |||||||||||||||
| Exercisable at end of year |
67,316 | $ | 49.18 | 60,382 | $ | 46.85 | 165,667 | $ | 44.56 | |||||||||||||||
A summary of the Company’s stock options outstanding at December 31, 2014 follows:
| Outstanding | Exercisable | |||||||||||||||
| Exercise Price Range |
Options | Weighted average exercise price |
Options | Weighted average exercise price |
||||||||||||
| $23.15 – 29.99 |
3,500 | $ | 23.15 | 3,500 | $ | 23.15 | ||||||||||
| $30.00 – 39.99 |
5,000 | $ | 35.56 | 5,000 | $ | 35.56 | ||||||||||
| $40.00 – 59.99 |
87,106 | $ | 44.41 | 44,816 | $ | 45.16 | ||||||||||
| $60.00 – 76.07 |
20,000 | $ | 74.17 | 14,000 | $ | 73.43 | ||||||||||
|
|
|
|
|
|
|
|
|
|||||||||
| Total |
115,606 | $ | 48.54 | 67,316 | $ | 49.18 | ||||||||||
| Intrinsic value of outstanding stock options at December 31, 2014 |
$ | 4,472,123 | ||||||||||||||
| Intrinsic value of exercisable stock options at December 31, 2014 |
$ | 2,560,457 | ||||||||||||||
The intrinsic value of stock options exercised during the years ended December 31, 2014, 2013, and 2012, was $0.9 million, $3.6 million, and $1.1 million respectively.
Proceeds from stock options exercised during the years ended December 31, 2014, 2013, and 2012 amounted to $1.2 million, $7.0 million, and $3.7 million respectively.
The aggregate intrinsic value is calculated as the difference between the exercise price of the underlying awards and the quoted price of the Company’s common stock at December 31, 2014, or the price on the date of exercise for those exercised during the year. As of December 31, 2014, there was approximately $0.2 million of total unrecognized compensation cost related to stock option compensation arrangements granted under our stock award plans. That cost is expected to be recognized over a weighted-average period of approximately 1.6 years. The weighted average remaining contractual life of all options is 4.8 years, and for exercisable options is 5.2 years.
Non-vested stock
The Company has also issued shares of non-vested stock to employees which vest over one to nine year periods. During the restriction period, the non-vested shares may not be sold, transferred, or otherwise encumbered. The holder of the non-vested shares has all rights of a holder of common shares, including the right to vote and receive dividends. For issuances of non-vested stock during the year ended December 31, 2014, the fair market value of the non-vested stock on the date of grant ranged from $46.95 to $87.92. During 2014, 92,665 shares of
59
Table of Contents
non-vested stock were issued to employees and directors with an aggregate fair value of $5.6 million. The Company charges additional paid-in capital for the market value of shares as they are issued. The unearned portion is then amortized and charged to expense over the vesting period. The Company uses the average of the high and low price of its common stock on the date the award is granted as the fair value for non-vested stock awards that don’t have a market condition.
A summary of the status of unvested shares of stock issued to employees and directors as of and during the years ended December 31 follows:
| 2014 | 2013 | 2012 | ||||||||||||||||||||||
| Non-vested Shares |
Weighted average grant date fair value |
Non-vested Shares |
Weighted average grant date fair value |
Non-vested Shares |
Weighted average grant date fair value |
|||||||||||||||||||
| Unvested at beginning of year: |
293,196 | $ | 49.20 | 187,535 | $ | 37.36 | 246,634 | $ | 37.93 | |||||||||||||||
| Granted |
92,665 | 60.87 | 189,080 | 54.78 | 2,592 | 49.42 | ||||||||||||||||||
| Vested |
(72,876 | ) | 53.11 | (83,419 | ) | 35.28 | (60,912 | ) | 40.13 | |||||||||||||||
| Forfeited |
(2,522 | ) | 28.66 | — | — | (779 | ) | 41.07 | ||||||||||||||||
|
|
|
|
|
|
|
|
|
|
|
|
|
|||||||||||||
| Unvested at end of year |
310,463 | $ | 51.93 | 293,196 | $ | 49.20 | 187,535 | $ | 37.36 | |||||||||||||||
Compensation expense of $4.6 million, $2.9 million and $2.4 million was recognized for the vested portion of non-vested stock grants in 2014, 2013 and 2012, respectively. The fair value of non-vested stock that vested during 2014, 2013 and 2012 was $3.9 million, $2.9 million and $2.4 million, respectively. The total unrecognized compensation cost related to non-vested stock was $14.1 million at December 31, 2014, and the remaining weighted-average period over which this expense will be recognized was 2.7 years.
Performance-based vesting restricted stock
The Company granted a total of 60,654 performance shares under the Plan during 2014 which are included above. In 2013, the Company granted 87,040 performance shares under the Plan which are also included above. Performance shares granted are based upon the Company’s performance over a three year period depending on the Company’s total shareholder return relative to a group of peer companies. Performance based nonvested shares are recognized as compensation expense based on fair value on date of grant, the number of shares ultimately expected to vest and the vesting period. For accounting purposes, the performance shares are considered to have a market condition. The effect of the market condition is reflected in the grant date fair value of the award and, thus compensation expense is recognized on this type of award provided that the requisite service is rendered (regardless of whether the market condition is achieved). The Company estimated the fair value of each performance share granted under the Plan on the date of grant using a Monte Carlo simulation that uses the assumptions noted in Note 2.
During 2014, compensation expense of $1.2 million (included in the $4.6 million discussed above) was recognized for the performance shares granted in 2011, 2013 and 2014. The total unrecognized compensation cost related to non-vested performance shares was $4.7 million at December 31, 2014 and the weighted-average period over which this expense will be recognized is 2.4 years.
Deferred compensation plan for directors
Under the Deferred Compensation Plan for Directors, non-employee Directors may defer all or part of their Directors’ fees that are otherwise payable in cash. Directors’ fees that are deferred under this plan are credited to each Directors’ account under the plan in the form of Units. The number of Units credited is determined by dividing the amount of Directors’ fees deferred by the closing price of the Company’s Common Stock on the New York Stock Exchange on the day immediately preceding the day upon which Directors’ fees otherwise would be paid by the Company. A Director is credited with additional Units for dividends on the shares of Common Stock
60
Table of Contents
represented by Units in such Directors’ Account. A Director may elect to receive the shares in a lump sum on a date specified by the Director or in quarterly or annual installments over a specified period and commencing on a specified date. The Directors may not elect to receive cash in lieu of shares. Under this plan there were a total of 45,505 units outstanding at December 31, 2014. Fees that were earned and credited to Directors’ accounts are recorded as compensation expense which totaled $0.1 million, $0.1 million and $0.1 million in 2014, 2013 and 2012, respectively.
11. RETIREMENT PLAN
Employees of the Company qualifying under certain age and service requirements are eligible to be a participant in a
401(k) Plan. The Company contributes to the Plan at the rate of 25% of the first 4% of gross wages that the employee contributes. Total expense to the Company was approximately $192,000, $78,000, and $69,000 for the years ended December 31,
2014, 2013 and 2012, respectively.
12. INVESTMENT IN JOINT VENTURES
The Company has a 20% ownership interest in Sovran HHF Storage Holdings LLC (“Sovran HHF”), a joint venture that was formed in May 2008 to acquire self-storage properties that are managed by the Company. The carrying value of the Company’s investment at December 31, 2014 and 2013 was $45.2 million and $17.4 million, respectively. Twenty-five properties were acquired by Sovran HHF in 2008 for approximately $171.5 million and 14 additional properties were acquired by Sovran HHF in 2014 for $187.2 million. In 2008, the Company contributed $18.6 million to the joint venture as its share of capital required to fund the acquisitions. In 2012 the Company contributed an additional $1.2 million to the joint venture. In 2013 the Company received a return of capital distribution of $3.4 million as part of the refinancing of Sovran HHF. In 2014 the Company contributed an additional $28.6 million in cash to the joint venture as its share of capital required to fund acquisitions. As of December 31, 2014, the carrying value of the Company’s investment in Sovran HHF exceeds its share of the underlying equity in net assets of Sovran HHF by approximately $1.7 million as a result of the capitalization of certain acquisition related costs in 2008. This difference is included in the carrying value of the investment, which is assessed for other-than-temporary impairment on a periodic basis. No other-than-temporary impairments have been recorded on this investment.
The Company has a 15% ownership interest in Sovran HHF Storage Holdings II LLC (“Sovran HHF II”), a joint venture that was formed in 2011 to acquire self-storage properties that are managed by the Company. The carrying value of the Company’s investment at December 31, 2014 and 2013 was $12.6 million and $13.0, respectively. Twenty properties were acquired by Sovran HHF II during 2011 for approximately $166.1 million. During 2011, the Company contributed $12.8 million to the joint venture as its share of capital required to fund the acquisitions. Ten additional properties were acquired by Sovran HHF II during 2012 for approximately $29 million. During 2012, the Company contributed $2.4 million to the joint venture as its share of capital required to fund the acquisitions. The carrying value of this investment is assessed for other-than-temporary impairment on a periodic basis and no such impairments have been recorded on this investment.
As manager of Sovran HHF and Sovran HHF II, the Company earns a management and call center fee of 7% of gross revenues which totaled $3.9 million, $3.4 million, and $3.0 million for 2014, 2013, and 2012, respectively. The Company also received an acquisition fee of $0.4 million and $0.1 million, for securing purchases for Sovran HHF and Sovran HHF II in 2014 and 2012, respectively. The Company’s share of Sovran HHF and Sovran HHF II’s income for 2014, 2013 and 2012 was $1.9 million, $1.9 million, and $0.9 million, respectively.
The Company also has a 49% ownership interest in Iskalo Office Holdings, LLC, which owns the building that houses the Company’s headquarters and other tenants. The carrying value of the Company’s investment is a liability of $0.5 million and $0.5 million at December 31, 2014 and 2013, respectively, and is included in accounts payable and accrued liabilities in the accompanying consolidated balance sheets. For the years ended December 31, 2014, 2013, and 2012, the Company’s share of Iskalo Office Holdings, LLC’s income (loss) was $107,000, $59,000, and ($18,000), respectively. The Company paid rent to Iskalo Office Holdings, LLC of $1.0 million, $0.8 million and $0.7 million in 2014, 2013, and 2012, respectively.
61
Table of Contents
A summary of the unconsolidated joint ventures’ financial statements as of and for the year ended December 31, 2014 is as follows:
| (dollars in thousands) |
Sovran HHF Storage Holdings LLC |
Sovran HHF Storage Holdings II LLC |
Iskalo Office Holdings, LLC |
|||||||||
| Balance Sheet Data: |
||||||||||||
| Investment in storage facilities, net |
$ | 341,817 | $ | 185,214 | $ | — | ||||||
| Investment in office building |
— | — | 5,005 | |||||||||
| Other assets |
5,408 | 3,711 | 3,386 | |||||||||
|
|
|
|
|
|
|
|||||||
| Total Assets |
$ | 347,225 | $ | 188,925 | $ | 8,391 | ||||||
|
|
|
|
|
|
|
|||||||
| Due to the Company |
$ | 260 | $ | 333 | $ | — | ||||||
| Mortgages payable |
124,888 | 102,884 | 9,267 | |||||||||
| Other liabilities |
4,651 | 1,792 | 402 | |||||||||
|
|
|
|
|
|
|
|||||||
| Total Liabilities |
129,799 | 105,009 | 9,669 | |||||||||
| Unaffiliated partners’ equity (deficiency) |
173,941 | 71,335 | (729 | ) | ||||||||
| Company equity (deficiency) |
43,485 | 12,581 | (549 | ) | ||||||||
|
|
|
|
|
|
|
|||||||
| Total Partners’ Equity (Deficiency) |
217,426 | 83,916 | (1,278 | ) | ||||||||
|
|
|
|
|
|
|
|||||||
| Total Liabilities and Partners’ Equity (Deficiency) |
$ | 347,225 | $ | 188,925 | $ | 8,391 | ||||||
|
|
|
|
|
|
|
|||||||
| Income Statement Data: |
||||||||||||
| Total revenues |
$ | 26,508 | $ | 28,502 | $ | 1,405 | ||||||
| Property operating expenses |
(8,336 | ) | (9,809 | ) | (571 | ) | ||||||
| Administrative, management and call center fees |
(1,954 | ) | (2,113 | ) | — | |||||||
| Acquisition costs |
(1,837 | ) | — | — | ||||||||
| Depreciation and amortization of customer list |
(5,099 | ) | (4,163 | ) | (236 | ) | ||||||
| Amortization of financing fees |
(190 | ) | (203 | ) | (14 | ) | ||||||
| Income tax expense |
(151 | ) | (461 | ) | — | |||||||
| Interest expense |
(4,475 | ) | (5,142 | ) | (365 | ) | ||||||
|
|
|
|
|
|
|
|||||||
| Net income |
$ | 4,466 | $ | 6,611 | $ | 219 | ||||||
|
|
|
|
|
|
|
|||||||
The Company does not guarantee the debt of Sovran HHF, Sovran HHF II, or Iskalo Office Holdings, LLC.
We do not expect to have material future cash outlays relating to these joint ventures outside our share of capital for future acquisitions of properties. A summary of our cash flows arising from the off-balance sheet arrangements with Sovran HHF, Sovran HHF II and Iskalo Office Holdings, LLC for the three years ended December 31, 2014 are as follows:
| Year ended December 31, | ||||||||||||
| (dollars in thousands) | 2014 | 2013 | 2012 | |||||||||
| Statement of Operations |
||||||||||||
| Other operating income (management fees and acquisition fee income) |
$ | 4,231 | $ | 3,358 | $ | 3,177 | ||||||
| General and administrative expenses (corporate office rent) |
1,023 | 811 | 704 | |||||||||
| Equity in income (losses) of joint ventures |
2,086 | 1,948 | 936 | |||||||||
| Distributions from unconsolidated joint ventures |
3,123 | 2,630 | 2,184 | |||||||||
| Receipts from (advances to) joint ventures |
590 | (27 | ) | (242 | ) | |||||||
| Investing activities |
||||||||||||
| Investment in unconsolidated joint ventures |
(28,650 | ) | (4,237 | ) | (3,571 | ) | ||||||
| Return of capital from unconsolidated joint ventures |
— | 7,360 | — | |||||||||
62
Table of Contents
13. SHAREHOLDERS’ EQUITY
On May 12, 2014, the Company entered into a continuous equity offering program (“Equity Program”) with Wells Fargo Securities, LLC (“Wells Fargo”), Jefferies LLC (“Jefferies”), SunTrust Robinson Humphrey, Inc. (“SunTrust”), Piper Jaffray & Co. (“Piper”), HSBC Securities (USA) Inc. (“HSBC”), and BB&T Capital Markets, a division of BB&T Securities, LLC (“BB&T”), pursuant to which the Company may sell from time to time up to $225 million in aggregate offering price of shares of the Company’s common stock. Actual sales under the Equity Program will depend on a variety of factors and conditions, including, but not limited to, market conditions, the trading price of the Company’s common stock, and determinations of the appropriate sources of funding for the Company. The Company expects to continue to offer, sell, and issue shares of common stock under the Equity Program from time to time based on various factors and conditions, although the Company is under no obligation to sell any shares under the Equity Program.
During 2014, the Company issued 924,403 shares of common stock under the Equity Program at a weighted average issue price of $79.77 per share, generating net proceeds of $72.8 million after deducting $0.9 million of sales commissions paid to Piper, HSBC and BB&T. As of December 31, 2014, the Company had $151.3 million available for issuance under the Equity Program.
During the three months ended March 31, 2014, the Company issued 359,102 shares of common stock under a previous equity program at a weighted average issue price of $74.32 per share, generating net proceeds of $26.4 million after deducting $0.3 million of sales commissions payable to SunTrust.
In addition to sales commissions, the Company incurred expenses of $0.2 million in connection with these equity programs during 2014. The Company used the proceeds from the equity programs to fund a portion of the acquisition of 33 storage facilities.
In 2013, the Company implemented a Dividend Reinvestment Plan. The Company issued 171,854 shares under the plan in 2014.
14. SUPPLEMENTARY QUARTERLY FINANCIAL DATA (UNAUDITED)
The following is a summary of quarterly results of operations for the years ended December 31, 2014 and 2013 (dollars in thousands, except per share data):
| 2014 Quarter Ended | ||||||||||||||||
| March 31 | June 30 | Sept. 30 | Dec. 31 | |||||||||||||
| Operating revenue |
$ | 75,457 | $ | 80,444 | $ | 85,249 | $ | 84,930 | ||||||||
| Income from continuing operations |
16,775 | 20,701 | 25,743 | 25,838 | ||||||||||||
| Income from discontinued operations |
— | — | — | — | ||||||||||||
| Net Income |
16,775 | 20,701 | 25,743 | 25,838 | ||||||||||||
| Net income attributable to common shareholders |
16,673 | 20,576 | 25,589 | 25,693 | ||||||||||||
| Net Income Per Share Attributable to Common Shareholders |
||||||||||||||||
| Basic |
$ | 0.51 | $ | 0.63 | $ | 0.77 | $ | 0.76 | ||||||||
| Diluted |
$ | 0.51 | $ | 0.62 | $ | 0.77 | $ | 0.76 | ||||||||
63
Table of Contents
| 2013 Quarter Ended | ||||||||||||||||
| March 31 | June 30 | Sept. 30 | Dec. 31 | |||||||||||||
| Operating revenue (a) |
$ | 63,878 | $ | 67,109 | $ | 70,455 | $ | 72,065 | ||||||||
| Income from continuing operations (a) |
14,204 | 17,816 | 19,552 | 19,900 | ||||||||||||
| Income from discontinued operations (a) |
168 | 236 | 247 | 2,472 | ||||||||||||
| Net Income |
14,372 | 18,052 | 19,799 | 22,371 | ||||||||||||
| Net income attributable to common shareholders |
14,280 | 17,937 | 19,675 | 22,234 | ||||||||||||
| Net Income Per Share Attributable to Common Shareholders |
||||||||||||||||
| Basic |
$ | 0.47 | $ | 0.57 | $ | 0.63 | $ | 0.70 | ||||||||
| Diluted |
$ | 0.47 | $ | 0.57 | $ | 0.62 | $ | 0.69 | ||||||||
| (a) | March, June and September data from 2013 as presented in this table differ from the amounts as presented in the Company’s quarterly reports due to the impact of discontinued operations accounting with respect to the four properties sold in 2013 as described in Note 5. |
15. COMMITMENTS AND CONTINGENCIES
The Company’s current practice is to conduct environmental investigations in connection with property acquisitions. At this time, the Company is not aware of any environmental contamination of any of its facilities that individually or in the aggregate would be material to the Company’s overall business, financial condition, or results of operations.
Future minimum lease payments on the lease of the four storage facilities, a building lease, and the lease of the Company’s headquarters are as follows (dollars in thousands):
| Four Storage Facilities |
Building Lease |
Corporate Headquarters |
Total | |||||||||||||
| 2015 |
$ | 537 | $ | 48 | $ | 896 | $ | 1,481 | ||||||||
| 2016 |
— | 48 | 914 | 962 | ||||||||||||
| 2017 |
— | 48 | 924 | 972 | ||||||||||||
| 2018 |
— | 48 | 924 | 972 | ||||||||||||
| 2019 |
— | 51 | 924 | 975 | ||||||||||||
| Thereafter |
— | 211 | 3,167 | 3,378 | ||||||||||||
|
|
|
|
|
|
|
|
|
|||||||||
| Total |
$ | 537 | $ | 454 | $ | 7,749 | $ | 8,740 | ||||||||
On November 1, 2013, the Company completed certain transactions with respect to the lease of four self storage facilities in New York and Connecticut with annual lease payments of $6 million with a provision for 4% annual increases, and an exclusive option to purchase the facilities for $120 million. The leases commenced November 1, 2013 and run through December 31, 2028. The Company has an option to purchase the facilities during the period from February 2, 2015 through September 2, 2016. The operating results of the leased facilities have been included in the Company’s operations since November 1, 2013. On November 10, 2014, the Company exercised its option to purchase the facilities and the purchase transaction closed on February 2, 2015.
64
Table of Contents
At December 31, 2014, the Company was under contract to acquire seven self-storage facilities for cash consideration of approximately $143.7 million. Five of the properties were acquired in February 2015 from unrelated parties for $126.8 million, which included the four properties operated by the Company under a lease agreement. The Company has not yet determined the assignment of the purchase prices of these five facilities to the individual assets acquired. These acquisitions were funded with draws on the Company’s line of credit. The line of credit balance outstanding after the funding of the five acquisitions was $187 million. The following is a summary of the 2015 acquisitions (dollars in thousands):
| State |
Number of Properties |
Date of Acquisition |
Purchase Price |
|||||||||
| New York, Connecticut |
4 | 2/2/2015 | $ | 120,000 | ||||||||
| Illinois |
1 | 2/5/2015 | 6,800 | |||||||||
|
|
|
|
|
|||||||||
| Total acquired 2015 |
5 | $ | 126,800 | |||||||||
The purchase of the remaining facilities by the Company is subject to customary conditions to closing, and there is no assurance that this facility will be acquired.
At December 31, 2014, the Company has signed contracts in place with third party contractors for expansion and enhancements at its existing facilities. The Company expects to pay $10.1 million under these contracts in 2015.
On or about August 25, 2014, a putative class action was filed against the Company in the Superior Court of New Jersey Law Division Burlington County. The action seeks to obtain declaratory, injunctive and monetary relief for a class of consumers based upon alleged violations by the Company of the New Jersey Truth in Customer Contract, Warranty and Notice Act, the New Jersey Consumer Fraud Act and the New Jersey Insurance Producer Licensing Act. On October 17, 2014, the action was removed from the Superior Court of New Jersey Law Division Burlington County to the United States District Court for the District of New Jersey. The Company intends to vigorously defend the action, and the possibility of any adverse outcome cannot be determined at this time.
16. SUBSEQUENT EVENTS
On January 5, 2015, the Company declared a quarterly dividend of $0.75 per common share. The dividend was paid on January 26, 2015 to shareholders of record on January 16, 2015. The total dividend paid amounted to $25.5 million.
65
Table of Contents
| Item 9. | Changes in and Disagreements With Accountants on Accounting and Financial Disclosure |
None.
| Item 9A. | Controls and Procedures |
Conclusion Regarding the Effectiveness of Disclosure Controls and Procedures
Our management conducted an evaluation of the effectiveness of the design and operation of our disclosure controls and procedures, as such term is defined under Rule 13a-15(e) promulgated under the Securities Exchange Act of 1934, as amended (Exchange Act), under the supervision of and with the participation of our management, including the Chief Executive Officer and Chief Financial Officer. Based on that evaluation, our management, including the Chief Executive Officer and Chief Financial Officer, concluded that our disclosure controls and procedures were effective at December 31, 2014. There have not been changes in the Company’s internal controls or in other factors that could significantly affect these controls during the quarter ended December 31, 2014.
Management’s Report on Internal Control Over Financial Reporting
Our management is responsible for establishing and maintaining adequate internal control over financial reporting, and for performing an assessment of the effectiveness of internal control over financial reporting as of December 31, 2014. Internal control over financial reporting is a process designed to provide reasonable assurance regarding the reliability of financial reporting and the preparation of financial statements for external purposes in accordance with generally accepted accounting principles. Our system of internal control over financial reporting includes those policies and procedures that (i) pertain to the maintenance of records that, in reasonable detail, accurately and fairly reflect the transactions and dispositions of the assets of the company; (ii) provide reasonable assurance that transactions are recorded as necessary to permit preparation of financial statements in accordance with generally accepted accounting principles, and that receipts and expenditures of the company are being made only in accordance with authorizations of management and directors of the company; and (iii) provide reasonable assurance regarding prevention or timely detection of unauthorized acquisition, use, or disposition of the Company’s assets that could have a material effect on the financial statements.
Our management performed an assessment of the effectiveness of our internal control over financial reporting as of December 31, 2014 based upon criteria in Internal Control – Integrated Framework issued by the Committee of Sponsoring Organizations of the Treadway Commission (1992 Framework) (‘‘COSO’’). Based on our assessment, management determined that our internal control over financial reporting was effective as of December 31, 2014 based on the criteria in Internal Control-Integrated Framework issued by COSO.
The effectiveness of the Company’s internal control over financial reporting as of December 31, 2014 has been audited by Ernst & Young LLP, an independent registered public accounting firm, as stated in their report which is included in Item 9A herein.
| /S/ David L. Rogers | /S/ Andrew J. Gregoire | |
| Chief Executive Officer | Chief Financial Officer |
66
Table of Contents
Report of Independent Registered Public Accounting Firm
The Board of Directors and Shareholders of Sovran Self Storage, Inc.
We have audited Sovran Self Storage, Inc.’s internal control over financial reporting as of December 31, 2014, based on criteria established in Internal Control—Integrated Framework issued by the Committee of Sponsoring Organizations of the Treadway Commission (1992 framework) (the COSO criteria). Sovran Self Storage, Inc.’s management is responsible for maintaining effective internal control over financial reporting, and for its assessment of the effectiveness of internal control over financial reporting included in the accompanying Management’s Report on Internal Control Over Financial Reporting. Our responsibility is to express an opinion on the company’s internal control over financial reporting based on our audit.
We conducted our audit in accordance with the standards of the Public Company Accounting Oversight Board (United States). Those standards require that we plan and perform the audit to obtain reasonable assurance about whether effective internal control over financial reporting was maintained in all material respects. Our audit included obtaining an understanding of internal control over financial reporting, assessing the risk that a material weakness exists, testing and evaluating the design and operating effectiveness of internal control based on the assessed risk, and performing such other procedures as we considered necessary in the circumstances. We believe that our audit provides a reasonable basis for our opinion.
A company’s internal control over financial reporting is a process designed to provide reasonable assurance regarding the reliability of financial reporting and the preparation of financial statements for external purposes in accordance with generally accepted accounting principles. A company’s internal control over financial reporting includes those policies and procedures that (1) pertain to the maintenance of records that, in reasonable detail, accurately and fairly reflect the transactions and dispositions of the assets of the company; (2) provide reasonable assurance that transactions are recorded as necessary to permit preparation of financial statements in accordance with generally accepted accounting principles, and that receipts and expenditures of the company are being made only in accordance with authorizations of management and directors of the company; and (3) provide reasonable assurance regarding prevention or timely detection of unauthorized acquisition, use or disposition of the company’s assets that could have a material effect on the financial statements.
Because of its inherent limitations, internal control over financial reporting may not prevent or detect misstatements. Also, projections of any evaluation of effectiveness to future periods are subject to the risk that controls may become inadequate because of changes in conditions, or that the degree of compliance with the policies or procedures may deteriorate.
In our opinion, Sovran Self Storage, Inc. maintained, in all material respects, effective internal control over financial reporting as of December 31, 2014, based on the COSO criteria.
We also have audited, in accordance with the standards of the Public Company Accounting Oversight Board (United States), the consolidated balance sheets of Sovran Self Storage, Inc. as of December 31, 2014 and 2013 and the related consolidated statements of operations, comprehensive income, shareholders’ equity and cash flows for each of the three years in the period ended December 31, 2014 of Sovran Self Storage, Inc. and our report dated February 24, 2015 expressed an unqualified opinion thereon.
| /s/ Ernst & Young LLP |
| Buffalo, New York |
| February 24, 2015 |
67
Table of Contents
None.
| Item 10. | Directors, Executive Officers and Corporate Governance |
The information contained in our Proxy Statement for the 2015 Annual Meeting of Shareholders to be filed with the SEC within 120 days of the fiscal year ended December 31, 2014 (“2015 Proxy Statement”), with respect to directors, executive officers, audit committee, and audit committee financial experts of the Company and Section 16(a) beneficial ownership reporting compliance, is incorporated herein by reference in response to this item.
The Company has adopted a code of ethics that applies to all of its directors, officers, and employees. The Company has made the Code of Ethics available on its website at http://www.unclebobs.com.
| Item 11. | Executive Compensation |
The information required is incorporated by reference to “Executive Compensation” and “Director Compensation” in the 2015 Proxy Statement and is incorporated herein by reference.
| Item 12. | Security Ownership of Certain Beneficial Owners and Management and Related Stockholder Matters |
The information required herein is incorporated by reference to “Stock Ownership By Directors and Executive Officers” and “Security Ownership of Certain Beneficial Owners” in the 2015 Proxy Statement and is incorporated herein by reference.
| Item 13. | Certain Relationships and Related Transactions, and Director Independence |
The information required herein is incorporated by reference to “Certain Transactions” and “Election of Directors—Director Independence” in the 2015 Proxy Statement and is incorporated herein by reference.
| Item 14. | Principal Accountant Fees and Services |
The information required herein is incorporated by reference to “Appointment of Independent Registered Public Accounting Firm” in the 2015 Proxy Statement and is incorporated herein by reference.
| Item 15. | Exhibits, Financial Statement Schedules |
| (a) | Documents filed as part of this Annual Report on Form 10-K: |
| 1. | The following consolidated financial statements of Sovran Self Storage, Inc. are included in Item 8. |
| (i) | Consolidated Balance Sheets as of December 31, 2014 and 2013. | |||
| (ii) | Consolidated Statements of Operations for Years Ended December 31, 2014, 2013, and 2012. | |||
| (iii) | Consolidated Statements of Comprehensive Income for Years Ended December 31, 2014, 2013, and 2012. | |||
| (iv) | Consolidated Statements of Shareholders’ Equity. | |||
| (v) | Consolidated Statements of Cash Flows for Years Ended December 31, 2014, 2013, and 2012 and | |||
| (vi) | Notes to Consolidated Financial Statements. | |||
68
Table of Contents
| 2. | The following financial statement Schedule as of the period ended December 31, 2014 is included in this Annual Report on Form 10-K. |
Schedule III Real Estate and Accumulated Depreciation.
All other Consolidated financial schedules are omitted because they are inapplicable, not required, or the information is included elsewhere in the consolidated financial statements or the notes thereto.
| 3. | Exhibits |
The exhibits required to be filed as part of this Annual Report on Form 10-K have been included as follows:
| 3.1 | Amended and Restated Articles of Incorporation of the Registrant (incorporated by reference to Exhibit 3.1 (a) to the Registrant’s Registration Statement on Form S-11 (File No. 33-91422) filed June 19, 1995). | |
| 3.2 | Articles Supplementary to the Amended and Restated Articles of Incorporation of the Registrant classifying and designating the Series A Junior Participating Cumulative Preferred Stock (incorporated by reference to Exhibit 3.1 to
Registrant’s Form 8-A filed December 3, 1996). | |
| 3.3 | Articles Supplementary to the Amended and Restated Articles of Incorporation of the Registrant classifying and designating the 9.85% Series B Cumulative Redeemable Preferred Stock (incorporated by reference to Exhibit 1.6 to
Registrant’s Form 8-A filed July 29, 1999). | |
| 3.4 | Articles Supplementary to the Amended and Restated Articles of Incorporation of the Registrant classifying and designating the 8.375% Series C Convertible Cumulative Preferred Stock (incorporated by reference to Exhibit 4.1 to Registrant’s Current Report on Form 8-K filed July 12, 2002). | |
| 3.5 | Articles Supplementary to the Amended and Restated Articles of Incorporation of the Registrant reclassifying shares of Series B Cumulative Redeemable Preferred Stock into Preferred. (incorporated by reference to Exhibit 3.1 to Registrant’s Current Report on Form 8-K filed May 31, 2011). | |
| 3.6 | Bylaws, as amended, of the Registrant (incorporated by reference to Exhibit 3.1 to Registrant’s Current Report on Form 8-K filed July 17, 2012). | |
| 4.1 | Form of Common Stock Certificate (incorporated by reference to Exhibit 4.1 to Registrant’s Registration Statement on Form S-11 (File No. 33-91422) filed June 19, 1995). | |
| 10.1+ | Sovran Self Storage, Inc. 2005 Award and Option Plan, as amended (incorporated by reference to Exhibit 10.1 to the Registrant’s Report on Form 10-K filed February 28, 2012). | |
| 10.2+ | Sovran Self Storage, Inc. 1995 Outside Directors’ Stock Option Plan, as amended (incorporated by reference to Exhibit 10.2 to Registrant’s Annual Report on Form 10-K filed February 26, 2010). | |
| 10.3+ | Employment Agreement between the Registrant and Robert J. Attea (incorporated by reference to Exhibit 10.3 to Registrant’s Annual Report on Form 10-K filed February 27, 2009). | |
| 10.4+ | Amendment to Employment Agreement between the Registrant and Robert J. Attea (incorporated by reference to Exhibit 10.1 to Registrant’s Current Report on Form 8-K filed January 21, 2015). | |
| 10.5+ | Employment Agreement between the Registrant and Kenneth F. Myszka (incorporated by reference to Exhibit 10.4 to Registrant’s Annual Report on Form 10-K filed February 27, 2009). | |
69
Table of Contents
| 10.6+ | Amendment to Employment Agreement between the Registrant and Kenneth F. Myszka (incorporated by reference to Exhibit 10.2 to Registrant’s Current Report on Form 8-K filed January 21, 2015). | |
| 10.7+ | Employment Agreement between the Registrant and David L. Rogers (incorporated by reference to Exhibit 10.5 to Registrant’s Annual Report on Form 10-K filed February 27, 2009). | |
| 10.8+ | Amendment to Employment Agreement between the Registrant and David L. Rogers (incorporated by reference to Exhibit 10.3 to Registrant’s Current Report on Form 8-K filed January 21, 2015). | |
| 10.9+ | Form of restricted stock grant pursuant to Sovran Self Storage, Inc. 2005 Award and Option Plan (incorporated by reference to Exhibit 10.6 to the Registrant’s Report on Form 10-K filed February 28, 2012). | |
| 10.10+ | Form of stock option grant pursuant to Sovran Self Storage, Inc. 2005 Award and Option Plan (incorporated by reference to Exhibit 10.7 to the Registrant’s Report on Form 10-K filed February 28, 2012). | |
| 10.11+ | Form of restricted stock grant pursuant to Sovran Self Storage, Inc. 2005 Award and Option Plan (incorporated by reference to Exhibit 10.1 and Exhibit 10.2 to the Registrant’s Current Report on Form 8-K filed August 6, 2013). | |
| 10.12+ | Form of Long Term Incentive Restricted Stock Award Notice pursuant to Sovran Self Storage, Inc. 2005 Award and Option Plan (incorporated by reference to Exhibit 10.1 to Registrant’s Current Report on Form 8-K filed December 19, 2013). | |
| 10.13+ | Form of Performance-Based Vesting Restricted Stock Award Notice pursuant to Sovran Self Storage, Inc. 2005 Award and Option Plan (incorporated by reference to Exhibit 10.2 to Registrant’s Current Report on Form 8-K filed December 19, 2013). | |
| 10.14+ | Deferred Compensation Plan for Directors (incorporated by reference to Schedule 14A Proxy Statement filed April 10, 2008). | |
| 10.15 | Amended Indemnification Agreements with members of the Board of Directors and Executive Officers (incorporated by reference to Exhibit 10.35 and 10.36 to Registrant’s Current Report on Form 8-K filed July 20, 2006, SEC File Number 001-13820, Film Number 06971617). | |
| 10.16 | Agreement of Limited Partnership of Sovran Acquisition Limited Partnership (incorporated by reference to Exhibit 3.1 on Form 10 filed April 22, 1998). | |
| 10.17 | Amendments to the Agreement of Limited Partnership of Sovran Acquisition Limited Partnership dated July 30, 1999 and July 3, 2002 (incorporated by reference to Exhibit 10.13 to Registrant’s Annual Report on Form 10-K filed February 27, 2009). | |
| 10.18 | Sixth Amended and Restated Revolving Credit and Term Loan Agreement dated as of December 10, 2014 among Sovran Self Storage, Inc. and Sovran Acquisition Limited Partnership, Wells Fargo Bank, National Association, Manufacturers and Traders Trust Company and certain other lenders a party thereto or which may become a party thereto (collectively, the “Lenders”), Manufacturers and Traders Trust Company, as administrative agent for itself and the other Lenders, Wells Fargo Bank, National Association, as syndication agent, and U.S. Bank National Association, HSBC Bank USA, National Association, PNC Bank, National Association, and SunTrust Bank as co-documentation agents, for themselves and the other Lenders (incorporated by reference to Exhibit 10.1 to the Registrant’s Current Report on Form 8-K filed December 15, 2014). | |
70
Table of Contents
| 10.19 | Note Purchase Agreement dated as of August 5, 2011 among Sovran Self Storage, Inc., Sovran Acquisition Limited Partnership and the institutions named in Schedule A thereto as purchasers of $100 million, 5.54% Senior Guaranteed Notes, Series D due August 5, 2021 (incorporated by reference to Exhibit 10.2 to Registrant’s Current Report on Form 8-K filed August 8, 2011). | |
| 10.20 | $150 million, 6.38% Senior Guaranteed Notes, Series C due April 26, 2016 (incorporated by reference to Exhibit 10.27 to Registrant’s Current Report on Form 8-K filed May 1, 2006, SEC File Number 001-13820, Film Number 06795352). | |
| 10.21 | Note Purchase Agreement dated as of April 8, 2014 among Sovran Self Storage, Inc., Sovran Acquisition Limited Partnership and the institutions named in Schedule A thereto as purchasers of $175 million, 4.533% Senior Guaranteed Notes, Series E due April 8, 2024 (incorporated by reference to Exhibit 10.1 to Registrant’s Current Report on Form 8-K filed April 9, 2014). | |
| 10.22 | Lease by and between Sovran Acquisition Limited Partnership, as lessee, and Carlos A. Arredondo, as lessor, dated as of August 7, 2013 with respect to certain property in Milford, Connecticut, as amended by a First Amendment of Lease dated September 13, 2013. | |
| 10.23 | Lease by and between Sovran Acquisition Limited Partnership, as lessee, and various trustees of trusts for the benefit of the descendants of Carlos A. Arredondo and certain other parties, as lessor, with respect to certain property in Farmingdale, New York, as amended by a First Amendment of Lease dated September 13, 2013 and a Second Amendment of Lease dated as of September 27, 2013. | |
| 10.24 | Lease by and between Sovran Acquisition Limited Partnership, as lessee, and various trustees of trusts for the benefit of the descendants of Carlos A. Arredondo and certain other parties, as lessor, with respect to certain property in Danbury, Connecticut, as amended by a First Amendment of Lease dated September 13, 2013. | |
| 10.25 | Lease by and between Sovran Acquisition Limited Partnership, as lessee, and various trustees of trusts for the benefit of the descendants of Carlos A. Arredondo and certain other parties, as lessor, with respect to certain property in Hicksville, New York, as amended by a First Amendment of Lease dated September 13, 2013 and a Second Amendment of Lease dated as of September 27, 2013. | |
| 10.26 | Equity Distribution Agreement dated as of May 12, 2014 by and among Sovran Self Storage, Inc., Sovran Acquisition Limited Partnership, Sovran Holdings, Inc., and Wells Fargo Securities, LLC, as agent (incorporated by reference to Exhibit 1.1 to Registrant’s Current Report on Form 8-K filed May 12, 2014). | |
| 10.27 | Equity Distribution Agreement dated as of May 12, 2014 by and among Sovran Self Storage, Inc., Sovran Acquisition Limited Partnership, Sovran Holdings, Inc., and Jefferies LLC, as agent (incorporated by reference to Exhibit 1.2 to Registrant’s Current Report on Form 8-K filed May 12, 2014). | |
| 10.28 | Equity Distribution Agreement dated as of May 12, 2014 by and among Sovran Self Storage, Inc., Sovran Acquisition Limited Partnership, Sovran Holdings, Inc., and SunTrust Robinson Humphrey, as agent (incorporated by reference to Exhibit 1.3 to Registrant’s Current Report on Form 8-K filed May 12, 2014). | |
| 10.29 | Equity Distribution Agreement dated as of May 12, 2014 by and among Sovran Self Storage, Inc., Sovran Acquisition Limited Partnership, Sovran Holdings, Inc., and Piper Jaffray & Co, as agent (incorporated by reference to Exhibit 1.4 to Registrant’s Current Report on Form 8-K filed May 12, 2014). | |
71
Table of Contents
| 10.30 | Equity Distribution Agreement dated as of May 12, 2014 by and among Sovran Self Storage, Inc., Sovran Acquisition Limited Partnership, Sovran Holdings, Inc., and HSBC Securities (USA) Inc., as agent (incorporated by reference to Exhibit 1.5 to Registrant’s Current Report on Form 8-K filed May 12, 2014). | |
| 10.31 | Equity Distribution Agreement dated as of May 12, 2014 by and among Sovran Self Storage, Inc., Sovran Acquisition Limited Partnership, Sovran Holdings, Inc., and BB&T Capital Markets, a division of BB&T Securities, LLC, as agent (incorporated by reference to Exhibit 1.6 to Registrant’s Current Report on Form 8-K filed May 12, 2014). | |
| 10.32 | Indemnification Agreement dated September 25, 2009 between Registrant, Sovran Acquisition Limited Partnership and James R. Boldt, a director of the Company (incorporated by reference to Exhibit 10.1 to Registrant’s Current Report on Form 8-K filed September 25, 2009). | |
| 10.33+ | Sovran Self Storage, Inc. 2009 Outside Directors Stock Option and Award Plan (incorporated by reference to Registrant’s Proxy Statement filed April 9, 2009). | |
| 10.34+ | Outside Director Fee Schedule (incorporated by reference to Exhibit 10.1 to Registrant’s Current Report on Form 8-K filed November 5, 2010). | |
| 10.35+ | Sovran Self Storage, Inc. Annual Incentive Compensation Plan for Executive Officers (incorporated by reference to Exhibit 10.1 to Registrant’s Current Report on Form 8-K filed February 21, 2012). | |
| 10.36+ | Employment Agreement between Sovran Self Storage, Inc., Sovran Acquisition Limited Partnership and Andrew Gregoire amended and restated effective January 1, 2009 (incorporated by reference to Exhibit 10.1 to Registrant’s Current Report on Form 8-K filed February 14, 2012). | |
| 10.37+ | Employment Agreement between Sovran Self Storage, Inc., Sovran Acquisition Limited Partnership and Paul Powell amended and restated effective January 1, 2009 (incorporated by reference to Exhibit 10.2 to Registrant’s Current Report on Form 8-K filed February 14, 2012). | |
| 10.38+ | Employment Agreement between Sovran Self Storage, Inc., Sovran Acquisition Limited Partnership and Edward Killeen amended and restated effective January 1, 2009 (incorporated by reference to Exhibit 10.3 to Registrant’s Current Report on Form 8-K filed February 14, 2012). | |
| 10.39 | Indemnification Agreement dated July 16, 2012 between Registrant, Sovran Acquisition Limited Partnership and Stephen R. Rusmisel, a director of the Company (incorporated by reference to Exhibit 10.1 to Registrant’s Current Report on Form 8-K filed July 17, 2012). | |
| 10.40 | Indemnification Agreement dated January 30, 2015 between Registrant, Sovran Acquisition Limited Partnership and Arthur L. Havener, Jr., a director of the Company (incorporated by reference to Exhibit 10.1 to Registrant’s Current Report on Form 8-K filed February 3, 2015). | |
| 10.41 | Indemnification Agreement dated January 30, 2015 between Registrant, Sovran Acquisition Limited Partnership and Mark G. Barberio, a director of the Company (incorporated by reference to Exhibit 10.2 to Registrant’s Current Report on Form 8-K filed February 3, 2015). | |
| 10.42+ | Form of Long Term Incentive Restricted Stock Award Notice pursuant to Sovran Self Storage, Inc. 2005 Award and Option Plan (incorporated by reference to Exhibit 10.1 to Registrant’s Current Report on Form 8-K filed December 29, 2014). | |
72
Table of Contents
| 10.43+ | Form of Performance-Based Vesting Restricted Stock Award Notice pursuant to Sovran Self Storage, Inc. 2005 Award and Option Plan (incorporated by reference to Exhibit 10.2 to Registrant’s Current Report on Form 8-K filed December 29, 2014). | |
| 12.1* | Statement Re: Computation of Earnings to Fixed Charges. | |
| 21.1* | Subsidiaries of the Company. | |
| 23.1* | Consent of Independent Registered Public Accounting Firm. | |
| 24.1* | Powers of Attorney (included on signature pages). | |
| 31.1* | Certification of Chief Executive Officer pursuant to Rule 13a-14(a) and Rule 15d-14(a) of the Securities Exchange Act, as amended. | |
| 31.2* | Certification of Chief Financial Officer pursuant to Rule 13a-14(a) and Rule 15d-14(a) of the Securities Exchange Act, as amended. | |
| 32.1* | Certification of Chief Executive Officer and Chief Financial Officer Pursuant to 18 U.S.C. Section 1350 as adopted pursuant to Section 906 of the Sarbanes-Oxley Act of 2002. | |
| 101* | The following financial statements from the Company’s Annual Report on Form 10-K for the year ended December 31, 2014, formatted in XBRL, as follows: | |
| (i) Consolidated Balance Sheets at December 31, 2014 and 2013;
(ii) Consolidated Statements of Operations for Years Ended December 31, 2014, 2013, and 2012;
(iii) Consolidated Statements of Comprehensive Income for Years Ended December 31, 2014, 2013, and 2012.
(iv) Consolidated Statements of Shareholders’ Equity for Years Ended December 31, 2014, 2013, and 2012;
(v) Consolidated Statements of Cash Flows for Years Ended December 31, 2014, 2013, and 2012; and
(vi) Notes to Consolidated Financial Statements | ||
| * | Filed herewith. | |
| + | Management contract or compensatory plan or arrangement. | |
73
Table of Contents
SIGNATURES
Pursuant to the requirements of Section 13 or 15(d) of the Securities Exchange Act of 1934, the registrant has duly caused this report to be signed on its behalf by the undersigned, thereunto duly authorized.
| SOVRAN SELF STORAGE, INC. | ||||||
| February 24, 2015 | By: | /s/ Andrew J. Gregoire | ||||
| Andrew J. Gregoire, | ||||||
| Chief Financial Officer, | ||||||
| Secretary | ||||||
Pursuant to the requirements of the Securities Exchange Act of 1934, this report has been signed below by the following persons on behalf of the registrant and in the capacities and on the dates indicated.
| Signature |
Title |
Date | ||||
| /s/ Robert J. Attea |
Executive Chairman of the Board of Directors and Director |
February 24, 2015 | ||||
| Robert J. Attea | ||||||
| /s/ Kenneth F. Myszka |
President and Director | February 24, 2015 | ||||
| Kenneth F. Myszka |
||||||
| /s/ David L. Rogers |
Chief Executive Officer (Principal Executive Officer) |
February 24, 2015 | ||||
| David L. Rogers | ||||||
| /s/ Andrew J. Gregoire |
Chief Financial Officer (Principal Financial and Accounting Officer) | February 24, 2015 | ||||
| Andrew J. Gregoire | ||||||
| /s/ Anthony P. Gammie |
Director | February 24, 2015 | ||||
| Anthony P. Gammie | ||||||
| /s/ Charles E. Lannon |
Director | February 24, 2015 | ||||
| Charles E. Lannon | ||||||
| /s/ Stephen R. Rusmisel |
Director | February 24, 2015 | ||||
| Stephen R. Rusmisel | ||||||
| /s/ Arthur L. Havener, Jr. |
Director | February 24, 2015 | ||||
| Arthur L. Havener, Jr. | ||||||
| /s/ Mark. G. Barberio |
Director | February 24, 2015 | ||||
| Mark G. Barberio | ||||||
74
Table of Contents
Sovran Self Storage, Inc.
Schedule III
Combined Real Estate and Accumulated Depreciation
(in thousands)
December 31, 2014
| Initial Cost to Company | Cost Capitalized Subsequent to Acquisition |
Gross Amount at Which Carried at Close of Period |
||||||||||||||||||||||||||||||||||||||||
| Description |
ST | Encum brance |
Land | Building, Equipment and Impvmts |
Building, Equipment and Impvmts |
Land | Building, Equipment and Impvmts |
Total | Accum. Deprec. |
Date of Const. |
Date Acquired |
Life on which depr in latest income statement is computed |
||||||||||||||||||||||||||||||
| Charleston |
SC | $ | 416 | $ | 1,516 | $ | 2,194 | $ | 416 | $ | 3,710 | $ | 4,126 | $ | 1,378 | 1985 | 6/26/1995 | 5 to 40 years | ||||||||||||||||||||||||
| Lakeland |
FL | 397 | 1,424 | 1,626 | 397 | 3,050 | 3,447 | 1,128 | 1985 | 6/26/1995 | 5 to 40 years | |||||||||||||||||||||||||||||||
| Charlotte |
NC | 308 | 1,102 | 3,394 | 747 | 4,057 | 4,804 | 1,016 | 1986 | 6/26/1995 | 5 to 40 years | |||||||||||||||||||||||||||||||
| Youngstown |
OH | 239 | 1,110 | 2,444 | 239 | 3,554 | 3,793 | 1,112 | 1980 | 6/26/1995 | 5 to 40 years | |||||||||||||||||||||||||||||||
| Cleveland |
OH | 701 | 1,659 | 1,408 | 1,036 | 2,732 | 3,768 | 1,198 | 1987 | 6/26/1995 | 5 to 40 years | |||||||||||||||||||||||||||||||
| Pt. St. Lucie |
FL | 395 | 1,501 | 978 | 779 | 2,095 | 2,874 | 1,091 | 1985 | 6/26/1995 | 5 to 40 years | |||||||||||||||||||||||||||||||
| Orlando - Deltona |
FL | 483 | 1,752 | 2,223 | 483 | 3,975 | 4,458 | 1,567 | 1984 | 6/26/1995 | 5 to 40 years | |||||||||||||||||||||||||||||||
| Middletown |
NY | 224 | 808 | 957 | 224 | 1,765 | 1,989 | 845 | 1988 | 6/26/1995 | 5 to 40 years | |||||||||||||||||||||||||||||||
| Buffalo |
NY | 423 | 1,531 | 3,451 | 497 | 4,908 | 5,405 | 1,715 | 1981 | 6/26/1995 | 5 to 40 years | |||||||||||||||||||||||||||||||
| Rochester |
NY | 395 | 1,404 | 613 | 395 | 2,017 | 2,412 | 986 | 1981 | 6/26/1995 | 5 to 40 years | |||||||||||||||||||||||||||||||
| Jacksonville |
FL | 152 | 728 | 3,846 | 687 | 4,039 | 4,726 | 860 | 1985 | 6/26/1995 | 5 to 40 years | |||||||||||||||||||||||||||||||
| Columbia |
SC | 268 | 1,248 | 637 | 268 | 1,885 | 2,153 | 904 | 1985 | 6/26/1995 | 5 to 40 years | |||||||||||||||||||||||||||||||
| Boston |
MA | 363 | 1,679 | 791 | 363 | 2,470 | 2,833 | 1,145 | 1980 | 6/26/1995 | 5 to 40 years | |||||||||||||||||||||||||||||||
| Rochester |
NY | 230 | 847 | 2,237 | 234 | 3,080 | 3,314 | 679 | 1980 | 6/26/1995 | 5 to 40 years | |||||||||||||||||||||||||||||||
| Boston |
MA | 680 | 1,616 | 600 | 680 | 2,216 | 2,896 | 1,074 | 1986 | 6/26/1995 | 5 to 40 years | |||||||||||||||||||||||||||||||
| Savannah |
GA | 463 | 1,684 | 4,915 | 1,445 | 5,617 | 7,062 | 1,949 | 1981 | 6/26/1995 | 5 to 40 years | |||||||||||||||||||||||||||||||
| Greensboro |
NC | 444 | 1,613 | 2,990 | 444 | 4,603 | 5,047 | 1,464 | 1986 | 6/26/1995 | 5 to 40 years | |||||||||||||||||||||||||||||||
| Raleigh-Durham |
NC | 649 | 2,329 | 1,375 | 649 | 3,704 | 4,353 | 1,608 | 1985 | 6/26/1995 | 5 to 40 years | |||||||||||||||||||||||||||||||
| Hartford-New Haven |
CT | 387 | 1,402 | 3,911 | 387 | 5,313 | 5,700 | 1,179 | 1985 | 6/26/1995 | 5 to 40 years | |||||||||||||||||||||||||||||||
| Atlanta |
GA | 844 | 2,021 | 914 | 844 | 2,935 | 3,779 | 1,370 | 1988 | 6/26/1995 | 5 to 40 years | |||||||||||||||||||||||||||||||
| Atlanta |
GA | 302 | 1,103 | 640 | 303 | 1,742 | 2,045 | 808 | 1988 | 6/26/1995 | 5 to 40 years | |||||||||||||||||||||||||||||||
| Buffalo |
NY | 315 | 745 | 3,962 | 517 | 4,505 | 5,022 | 1,062 | 1984 | 6/26/1995 | 5 to 40 years | |||||||||||||||||||||||||||||||
| Raleigh-Durham |
NC | 321 | 1,150 | 778 | 321 | 1,928 | 2,249 | 912 | 1985 | 6/26/1995 | 5 to 40 years | |||||||||||||||||||||||||||||||
| Columbia |
SC | 361 | 1,331 | 774 | 374 | 2,092 | 2,466 | 1,036 | 1987 | 6/26/1995 | 5 to 40 years | |||||||||||||||||||||||||||||||
| Columbia |
SC | 189 | 719 | 1,138 | 189 | 1,857 | 2,046 | 851 | 1989 | 6/26/1995 | 5 to 40 years | |||||||||||||||||||||||||||||||
| Columbia |
SC | 488 | 1,188 | 1,942 | 488 | 3,130 | 3,618 | 981 | 1986 | 6/26/1995 | 5 to 40 years | |||||||||||||||||||||||||||||||
| Atlanta |
GA | 430 | 1,579 | 2,245 | 602 | 3,652 | 4,254 | 1,331 | 1988 | 6/26/1995 | 5 to 40 years | |||||||||||||||||||||||||||||||
| Orlando |
FL | 513 | 1,930 | 764 | 513 | 2,694 | 3,207 | 1,340 | 1988 | 6/26/1995 | 5 to 40 years | |||||||||||||||||||||||||||||||
| Sharon |
PA | 194 | 912 | 560 | 194 | 1,472 | 1,666 | 700 | 1975 | 6/26/1995 | 5 to 40 years | |||||||||||||||||||||||||||||||
| Ft. Lauderdale |
FL | 1,503 | 3,619 | 1,012 | 1,503 | 4,631 | 6,134 | 2,003 | 1985 | 6/26/1995 | 5 to 40 years | |||||||||||||||||||||||||||||||
| West Palm |
FL | 398 | 1,035 | 392 | 398 | 1,427 | 1,825 | 765 | 1985 | 6/26/1995 | 5 to 40 years | |||||||||||||||||||||||||||||||
| Atlanta |
GA | 423 | 1,015 | 533 | 424 | 1,547 | 1,971 | 770 | 1989 | 6/26/1995 | 5 to 40 years | |||||||||||||||||||||||||||||||
| Atlanta |
GA | 483 | 1,166 | 1,171 | 483 | 2,337 | 2,820 | 959 | 1988 | 6/26/1995 | 5 to 40 years | |||||||||||||||||||||||||||||||
| Atlanta |
GA | 308 | 1,116 | 718 | 308 | 1,834 | 2,142 | 939 | 1986 | 6/26/1995 | 5 to 40 years | |||||||||||||||||||||||||||||||
| Atlanta |
GA | 170 | 786 | 811 | 174 | 1,593 | 1,767 | 738 | 1981 | 6/26/1995 | 5 to 40 years | |||||||||||||||||||||||||||||||
| Atlanta |
GA | 413 | 999 | 777 | 413 | 1,776 | 2,189 | 941 | 1975 | 6/26/1995 | 5 to 40 years | |||||||||||||||||||||||||||||||
| Baltimore |
MD | 154 | 555 | 1,469 | 306 | 1,872 | 2,178 | 729 | 1984 | 6/26/1995 | 5 to 40 years | |||||||||||||||||||||||||||||||
| Baltimore |
MD | 479 | 1,742 | 2,906 | 479 | 4,648 | 5,127 | 1,643 | 1988 | 6/26/1995 | 5 to 40 years | |||||||||||||||||||||||||||||||
| Melbourne |
FL | 883 | 2,104 | 1,721 | 883 | 3,825 | 4,708 | 1,788 | 1986 | 6/26/1995 | 5 to 40 years | |||||||||||||||||||||||||||||||
| Newport News |
VA | 316 | 1,471 | 973 | 316 | 2,444 | 2,760 | 1,152 | 1988 | 6/26/1995 | 5 to 40 years | |||||||||||||||||||||||||||||||
| Pensacola |
FL | 632 | 2,962 | 1,558 | 651 | 4,501 | 5,152 | 2,226 | 1983 | 6/26/1995 | 5 to 40 years | |||||||||||||||||||||||||||||||
| Hartford |
CT | 715 | 1,695 | 1,243 | 715 | 2,938 | 3,653 | 1,301 | 1988 | 6/26/1995 | 5 to 40 years | |||||||||||||||||||||||||||||||
| Atlanta |
GA | 304 | 1,118 | 2,759 | 619 | 3,562 | 4,181 | 1,330 | 1988 | 6/26/1995 | 5 to 40 years | |||||||||||||||||||||||||||||||
75
Table of Contents
| Initial Cost to Company | Cost Capitalized Subsequent to Acquisition |
Gross Amount at Which Carried at Close of Period |
||||||||||||||||||||||||||||||||||||||||
| Description |
ST | Encum brance |
Land | Building, Equipment and Impvmts |
Building, Equipment and Impvmts |
Land | Building, Equipment and Impvmts |
Total | Accum. Deprec. |
Date of Const. |
Date Acquired |
Life on which depr in latest income statement is computed |
||||||||||||||||||||||||||||||
| Alexandria |
VA | 1,375 | 3,220 | 2,617 | 1,376 | 5,836 | 7,212 | 2,561 | 1984 | 6/26/1995 | 5 to 40 years | |||||||||||||||||||||||||||||||
| Pensacola |
FL | 244 | 901 | 620 | 244 | 1,521 | 1,765 | 776 | 1986 | 6/26/1995 | 5 to 40 years | |||||||||||||||||||||||||||||||
| Melbourne |
FL | 834 | 2,066 | 1,311 | 1,591 | 2,620 | 4,211 | 1,325 | 1986 | 6/26/1995 | 5 to 40 years | |||||||||||||||||||||||||||||||
| Hartford |
CT | 234 | 861 | 3,055 | 612 | 3,538 | 4,150 | 1,011 | 1992 | 6/26/1995 | 5 to 40 years | |||||||||||||||||||||||||||||||
| Atlanta |
GA | 256 | 1,244 | 2,097 | 256 | 3,341 | 3,597 | 1,307 | 1988 | 6/26/1995 | 5 to 40 years | |||||||||||||||||||||||||||||||
| Norfolk |
VA | 313 | 1,462 | 2,618 | 313 | 4,080 | 4,393 | 1,251 | 1984 | 6/26/1995 | 5 to 40 years | |||||||||||||||||||||||||||||||
| Norfolk II |
VA | 278 | 1,004 | 453 | 278 | 1,457 | 1,735 | 746 | 1989 | 6/26/1995 | 5 to 40 years | |||||||||||||||||||||||||||||||
| Birmingham |
AL | 307 | 1,415 | 1,866 | 385 | 3,203 | 3,588 | 1,234 | 1990 | 6/26/1995 | 5 to 40 years | |||||||||||||||||||||||||||||||
| Birmingham |
AL | 730 | 1,725 | 2,945 | 730 | 4,670 | 5,400 | 1,291 | 1990 | 6/26/1995 | 5 to 40 years | |||||||||||||||||||||||||||||||
| Montgomery |
AL | 863 | 2,041 | 864 | 863 | 2,905 | 3,768 | 1,441 | 1982 | 6/26/1995 | 5 to 40 years | |||||||||||||||||||||||||||||||
| Jacksonville |
FL | 326 | 1,515 | 627 | 326 | 2,142 | 2,468 | 1,054 | 1987 | 6/26/1995 | 5 to 40 years | |||||||||||||||||||||||||||||||
| Pensacola |
FL | 369 | 1,358 | 3,040 | 369 | 4,398 | 4,767 | 1,625 | 1986 | 6/26/1995 | 5 to 40 years | |||||||||||||||||||||||||||||||
| Pensacola |
FL | 244 | 1,128 | 2,776 | 720 | 3,428 | 4,148 | 1,008 | 1990 | 6/26/1995 | 5 to 40 years | |||||||||||||||||||||||||||||||
| Pensacola |
FL | 226 | 1,046 | 686 | 226 | 1,732 | 1,958 | 869 | 1990 | 6/26/1995 | 5 to 40 years | |||||||||||||||||||||||||||||||
| Tampa |
FL | 1,088 | 2,597 | 1,114 | 1,088 | 3,711 | 4,799 | 1,909 | 1989 | 6/26/1995 | 5 to 40 years | |||||||||||||||||||||||||||||||
| Clearwater |
FL | 526 | 1,958 | 1,255 | 526 | 3,213 | 3,739 | 1,455 | 1985 | 6/26/1995 | 5 to 40 years | |||||||||||||||||||||||||||||||
| Clearwater-Largo |
FL | 672 | 2,439 | 879 | 672 | 3,318 | 3,990 | 1,576 | 1988 | 6/26/1995 | 5 to 40 years | |||||||||||||||||||||||||||||||
| Jackson |
MS | 343 | 1,580 | 2,491 | 796 | 3,618 | 4,414 | 1,279 | 1990 | 6/26/1995 | 5 to 40 years | |||||||||||||||||||||||||||||||
| Jackson |
MS | 209 | 964 | 783 | 209 | 1,747 | 1,956 | 877 | 1990 | 6/26/1995 | 5 to 40 years | |||||||||||||||||||||||||||||||
| Richmond |
VA | 443 | 1,602 | 1,053 | 443 | 2,655 | 3,098 | 1,219 | 1987 | 8/25/1995 | 5 to 40 years | |||||||||||||||||||||||||||||||
| Orlando |
FL | 1,161 | 2,755 | 1,262 | 1,162 | 4,016 | 5,178 | 1,949 | 1986 | 9/29/1995 | 5 to 40 years | |||||||||||||||||||||||||||||||
| Birmingham |
AL | 424 | 1,506 | 1,170 | 424 | 2,676 | 3,100 | 1,259 | 1970 | 1/16/1996 | 5 to 40 years | |||||||||||||||||||||||||||||||
| Harrisburg |
PA | 360 | 1,641 | 694 | 360 | 2,335 | 2,695 | 1,167 | 1983 | 12/29/1995 | 5 to 40 years | |||||||||||||||||||||||||||||||
| Harrisburg |
PA | 627 | 2,224 | 3,837 | 692 | 5,996 | 6,688 | 1,750 | 1985 | 12/29/1995 | 5 to 40 years | |||||||||||||||||||||||||||||||
| Syracuse |
NY | 470 | 1,712 | 1,428 | 472 | 3,138 | 3,610 | 1,349 | 1987 | 12/27/1995 | 5 to 40 years | |||||||||||||||||||||||||||||||
| Ft. Myers |
FL | 205 | 912 | 374 | 206 | 1,285 | 1,491 | 744 | 1988 | 12/28/1995 | 5 to 40 years | |||||||||||||||||||||||||||||||
| Ft. Myers |
FL | 412 | 1,703 | 695 | 413 | 2,397 | 2,810 | 1,295 | 1991/94 | 12/28/1995 | 5 to 40 years | |||||||||||||||||||||||||||||||
| Newport News |
VA | 442 | 1,592 | 1,393 | 442 | 2,985 | 3,427 | 1,203 | 1988/93 | 1/5/1996 | 5 to 40 years | |||||||||||||||||||||||||||||||
| Montgomery |
AL | 353 | 1,299 | 859 | 353 | 2,158 | 2,511 | 915 | 1984 | 1/23/1996 | 5 to 40 years | |||||||||||||||||||||||||||||||
| Charleston |
SC | 237 | 858 | 847 | 232 | 1,710 | 1,942 | 776 | 1985 | 3/1/1996 | 5 to 40 years | |||||||||||||||||||||||||||||||
| Tampa |
FL | 766 | 1,800 | 725 | 766 | 2,525 | 3,291 | 1,189 | 1985 | 3/28/1996 | 5 to 40 years | |||||||||||||||||||||||||||||||
| Dallas-Ft.Worth |
TX | 442 | 1,767 | 399 | 442 | 2,166 | 2,608 | 1,032 | 1987 | 3/29/1996 | 5 to 40 years | |||||||||||||||||||||||||||||||
| Dallas-Ft.Worth |
TX | 408 | 1,662 | 1,215 | 408 | 2,877 | 3,285 | 1,268 | 1986 | 3/29/1996 | 5 to 40 years | |||||||||||||||||||||||||||||||
| Dallas-Ft.Worth |
TX | 328 | 1,324 | 449 | 328 | 1,773 | 2,101 | 830 | 1986 | 3/29/1996 | 5 to 40 years | |||||||||||||||||||||||||||||||
| San Antonio |
TX | 436 | 1,759 | 1,345 | 436 | 3,104 | 3,540 | 1,337 | 1986 | 3/29/1996 | 5 to 40 years | |||||||||||||||||||||||||||||||
| San Antonio |
TX | 289 | 1,161 | 2,381 | 289 | 3,542 | 3,831 | 180 | 2012 | 3/29/1996 | 5 to 40 years | |||||||||||||||||||||||||||||||
| Syracuse |
NY | 481 | 1,559 | 2,505 | 671 | 3,874 | 4,545 | 1,545 | 1983 | 6/5/1996 | 5 to 40 years | |||||||||||||||||||||||||||||||
| Montgomery |
AL | 279 | 1,014 | 1,354 | 433 | 2,214 | 2,647 | 850 | 1988 | 5/21/1996 | 5 to 40 years | |||||||||||||||||||||||||||||||
| West Palm |
FL | 345 | 1,262 | 502 | 345 | 1,764 | 2,109 | 795 | 1986 | 5/29/1996 | 5 to 40 years | |||||||||||||||||||||||||||||||
| Ft. Myers |
FL | 229 | 884 | 2,822 | 383 | 3,552 | 3,935 | 653 | 1986 | 5/29/1996 | 5 to 40 years | |||||||||||||||||||||||||||||||
| Lakeland |
FL | 359 | 1,287 | 1,257 | 359 | 2,544 | 2,903 | 1,175 | 1988 | 6/26/1996 | 5 to 40 years | |||||||||||||||||||||||||||||||
| Boston - Springfield |
MA | 251 | 917 | 2,376 | 297 | 3,247 | 3,544 | 1,371 | 1986 | 6/28/1996 | 5 to 40 years | |||||||||||||||||||||||||||||||
| Ft. Myers |
FL | 344 | 1,254 | 574 | 310 | 1,862 | 2,172 | 855 | 1987 | 6/28/1996 | 5 to 40 years | |||||||||||||||||||||||||||||||
| Cincinnati |
OH | 557 | 1,988 | 936 | 689 | 2,792 | 3,481 | 709 | 1988 | 7/23/1996 | 5 to 40 years | |||||||||||||||||||||||||||||||
| Baltimore |
MD | 777 | 2,770 | 587 | 777 | 3,357 | 4,134 | 1,545 | 1990 | 7/26/1996 | 5 to 40 years | |||||||||||||||||||||||||||||||
| Jacksonville |
FL | 568 | 2,028 | 1,212 | 568 | 3,240 | 3,808 | 1,518 | 1987 | 8/23/1996 | 5 to 40 years | |||||||||||||||||||||||||||||||
| Jacksonville |
FL | 436 | 1,635 | 788 | 436 | 2,423 | 2,859 | 1,119 | 1985 | 8/26/1996 | 5 to 40 years | |||||||||||||||||||||||||||||||
| Jacksonville |
FL | 535 | 2,033 | 530 | 538 | 2,560 | 3,098 | 1,274 | 1987/92 | 8/30/1996 | 5 to 40 years | |||||||||||||||||||||||||||||||
| Charlotte |
NC | 487 | 1,754 | 652 | 487 | 2,406 | 2,893 | 1,036 | 1995 | 9/16/1996 | 5 to 40 years | |||||||||||||||||||||||||||||||
| Charlotte |
NC | 315 | 1,131 | 481 | 315 | 1,612 | 1,927 | 731 | 1995 | 9/16/1996 | 5 to 40 years | |||||||||||||||||||||||||||||||
| Orlando |
FL | 314 | 1,113 | 1,258 | 314 | 2,371 | 2,685 | 1,025 | 1975 | 10/30/1996 | 5 to 40 years | |||||||||||||||||||||||||||||||
| Rochester |
NY | 704 | 2,496 | 2,458 | 707 | 4,951 | 5,658 | 1,722 | 1990 | 12/20/1996 | 5 to 40 years | |||||||||||||||||||||||||||||||
76
Table of Contents
| Initial Cost to Company | Cost Capitalized Subsequent to Acquisition |
Gross Amount at Which Carried at Close of Period |
||||||||||||||||||||||||||||||||||||||||
| Description |
ST | Encum brance |
Land | Building, Equipment and Impvmts |
Building, Equipment and Impvmts |
Land | Building, Equipment and Impvmts |
Total | Accum. Deprec. |
Date of Const. |
Date Acquired |
Life on which depr in latest income statement is computed |
||||||||||||||||||||||||||||||
| Youngstown |
OH | 600 | 2,142 | 2,292 | 693 | 4,341 | 5,034 | 1,520 | 1988 | 1/10/1997 | 5 to 40 years | |||||||||||||||||||||||||||||||
| Cleveland |
OH | 751 | 2,676 | 4,123 | 751 | 6,799 | 7,550 | 1,999 | 1986 | 1/10/1997 | 5 to 40 years | |||||||||||||||||||||||||||||||
| Cleveland |
OH | 725 | 2,586 | 2,226 | 725 | 4,812 | 5,537 | 1,857 | 1978 | 1/10/1997 | 5 to 40 years | |||||||||||||||||||||||||||||||
| Cleveland |
OH | 637 | 2,918 | 1,966 | 701 | 4,820 | 5,521 | 2,307 | 1979 | 1/10/1997 | 5 to 40 years | |||||||||||||||||||||||||||||||
| Cleveland |
OH | 495 | 1,781 | 1,132 | 495 | 2,913 | 3,408 | 1,306 | 1979 | 1/10/1997 | 5 to 40 years | |||||||||||||||||||||||||||||||
| Cleveland |
OH | 761 | 2,714 | 1,637 | 761 | 4,351 | 5,112 | 1,921 | 1977 | 1/10/1997 | 5 to 40 years | |||||||||||||||||||||||||||||||
| Cleveland |
OH | 418 | 1,921 | 2,893 | 418 | 4,814 | 5,232 | 1,689 | 1970 | 1/10/1997 | 5 to 40 years | |||||||||||||||||||||||||||||||
| Cleveland |
OH | 606 | 2,164 | 1,477 | 606 | 3,641 | 4,247 | 1,407 | 1982 | 1/10/1997 | 5 to 40 years | |||||||||||||||||||||||||||||||
| San Antonio |
TX | 474 | 1,686 | 531 | 504 | 2,187 | 2,691 | 938 | 1981 | 1/30/1997 | 5 to 40 years | |||||||||||||||||||||||||||||||
| San Antonio |
TX | 346 | 1,236 | 546 | 346 | 1,782 | 2,128 | 772 | 1985 | 1/30/1997 | 5 to 40 years | |||||||||||||||||||||||||||||||
| San Antonio |
TX | 432 | 1,560 | 1,969 | 432 | 3,529 | 3,961 | 1,418 | 1995 | 1/30/1997 | 5 to 40 years | |||||||||||||||||||||||||||||||
| Houston-Beaumont |
TX | 634 | 2,565 | 1,449 | 634 | 4,014 | 4,648 | 1,690 | 1993/95 | 3/26/1997 | 5 to 40 years | |||||||||||||||||||||||||||||||
| Houston-Beaumont |
TX | 566 | 2,279 | 511 | 566 | 2,790 | 3,356 | 1,218 | 1995 | 3/26/1997 | 5 to 40 years | |||||||||||||||||||||||||||||||
| Houston-Beaumont |
TX | 293 | 1,357 | 638 | 293 | 1,995 | 2,288 | 834 | 1995 | 3/26/1997 | 5 to 40 years | |||||||||||||||||||||||||||||||
| Lynchburg-Lakeside |
VA | 335 | 1,342 | 1,527 | 335 | 2,869 | 3,204 | 1,145 | 1982 | 3/31/1997 | 5 to 40 years | |||||||||||||||||||||||||||||||
| Lynchburg-Timberlake |
VA | 328 | 1,315 | 1,111 | 328 | 2,426 | 2,754 | 1,070 | 1985 | 3/31/1997 | 5 to 40 years | |||||||||||||||||||||||||||||||
| Lynchburg-Amherst |
VA | 155 | 710 | 464 | 152 | 1,177 | 1,329 | 555 | 1987 | 3/31/1997 | 5 to 40 years | |||||||||||||||||||||||||||||||
| Chesapeake |
VA | 260 | 1,043 | 3,482 | 260 | 4,525 | 4,785 | 1,222 | 1988/95 | 3/31/1997 | 5 to 40 years | |||||||||||||||||||||||||||||||
| Orlando-W 25th St |
FL | 289 | 1,160 | 2,106 | 616 | 2,939 | 3,555 | 773 | 1984 | 3/31/1997 | 5 to 40 years | |||||||||||||||||||||||||||||||
| Delray |
FL | 491 | 1,756 | 730 | 491 | 2,486 | 2,977 | 1,184 | 1969 | 4/11/1997 | 5 to 40 years | |||||||||||||||||||||||||||||||
| Savannah |
GA | 296 | 1,196 | 578 | 296 | 1,774 | 2,070 | 768 | 1988 | 5/8/1997 | 5 to 40 years | |||||||||||||||||||||||||||||||
| Delray |
FL | 921 | 3,282 | 655 | 921 | 3,937 | 4,858 | 1,808 | 1980 | 5/21/1997 | 5 to 40 years | |||||||||||||||||||||||||||||||
| Cleveland-Avon |
OH | 301 | 1,214 | 2,275 | 304 | 3,486 | 3,790 | 1,238 | 1989 | 6/4/1997 | 5 to 40 years | |||||||||||||||||||||||||||||||
| Dallas-Fort Worth |
TX | 965 | 3,864 | 1,553 | 943 | 5,439 | 6,382 | 2,370 | 1977 | 6/30/1997 | 5 to 40 years | |||||||||||||||||||||||||||||||
| Dallas-Fort Worth |
TX | 370 | 1,486 | 743 | 370 | 2,229 | 2,599 | 1,048 | 1975 | 6/30/1997 | 5 to 40 years | |||||||||||||||||||||||||||||||
| Atlanta-Alpharetta |
GA | 1,033 | 3,753 | 690 | 1,033 | 4,443 | 5,476 | 1,974 | 1994 | 7/24/1997 | 5 to 40 years | |||||||||||||||||||||||||||||||
| Atlanta-Marietta |
GA | 769 | 2,788 | 577 | 825 | 3,309 | 4,134 | 1,465 | 1996 | 7/24/1997 | 5 to 40 years | |||||||||||||||||||||||||||||||
| Atlanta-Doraville |
GA | 735 | 3,429 | 456 | 735 | 3,885 | 4,620 | 1,765 | 1995 | 8/21/1997 | 5 to 40 years | |||||||||||||||||||||||||||||||
| Greensboro-Hilltop |
NC | 268 | 1,097 | 431 | 231 | 1,565 | 1,796 | 699 | 1995 | 9/25/1997 | 5 to 40 years | |||||||||||||||||||||||||||||||
| Greensboro-StgCch |
NC | 89 | 376 | 1,729 | 89 | 2,105 | 2,194 | 788 | 1997 | 9/25/1997 | 5 to 40 years | |||||||||||||||||||||||||||||||
| Baton Rouge-Airline |
LA | 396 | 1,831 | 1,115 | 421 | 2,921 | 3,342 | 1,202 | 1982 | 10/9/1997 | 5 to 40 years | |||||||||||||||||||||||||||||||
| Baton Rouge-Airline2 |
LA | 282 | 1,303 | 435 | 282 | 1,738 | 2,020 | 794 | 1985 | 11/21/1997 | 5 to 40 years | |||||||||||||||||||||||||||||||
| Harrisburg-Peiffers |
PA | 635 | 2,550 | 669 | 637 | 3,217 | 3,854 | 1,430 | 1984 | 12/3/1997 | 5 to 40 years | |||||||||||||||||||||||||||||||
| Chesapeake-Military |
VA | 542 | 2,210 | 486 | 542 | 2,696 | 3,238 | 1,144 | 1996 | 2/5/1998 | 5 to 40 years | |||||||||||||||||||||||||||||||
| Chesapeake-Volvo |
VA | 620 | 2,532 | 1,233 | 620 | 3,765 | 4,385 | 1,503 | 1995 | 2/5/1998 | 5 to 40 years | |||||||||||||||||||||||||||||||
| Virginia Beach-Shell |
VA | 540 | 2,211 | 431 | 540 | 2,642 | 3,182 | 1,154 | 1991 | 2/5/1998 | 5 to 40 years | |||||||||||||||||||||||||||||||
| Virginia Beach-Central |
VA | 864 | 3,994 | 1,074 | 864 | 5,068 | 5,932 | 2,131 | 1993/95 | 2/5/1998 | 5 to 40 years | |||||||||||||||||||||||||||||||
| Norfolk-Naval Base |
VA | 1,243 | 5,019 | 947 | 1,243 | 5,966 | 7,209 | 2,534 | 1975 | 2/5/1998 | 5 to 40 years | |||||||||||||||||||||||||||||||
| Tampa-E.Hillsborough |
FL | 709 | 3,235 | 897 | 709 | 4,132 | 4,841 | 1,863 | 1985 | 2/4/1998 | 5 to 40 years | |||||||||||||||||||||||||||||||
| Boston-Northbridge |
MA | 441 | 1,788 | 1,092 | 694 | 2,627 | 3,321 | 643 | 1988 | 2/9/1998 | 5 to 40 years | |||||||||||||||||||||||||||||||
| Middletown-Harriman |
NY | 843 | 3,394 | 784 | 843 | 4,178 | 5,021 | 1,811 | 1989/95 | 2/4/1998 | 5 to 40 years | |||||||||||||||||||||||||||||||
| Greensboro-High Point |
NC | 397 | 1,834 | 658 | 397 | 2,492 | 2,889 | 1,087 | 1993 | 2/10/1998 | 5 to 40 years | |||||||||||||||||||||||||||||||
| Lynchburg-Timberlake |
VA | 488 | 1,746 | 716 | 488 | 2,462 | 2,950 | 1,016 | 1990/96 | 2/18/1998 | 5 to 40 years | |||||||||||||||||||||||||||||||
| Titusville |
FL | 492 | 1,990 | 1,163 | 688 | 2,957 | 3,645 | 756 | 1986/90 | 2/25/1998 | 5 to 40 years | |||||||||||||||||||||||||||||||
| Boston-Salem |
MA | 733 | 2,941 | 1,372 | 733 | 4,313 | 5,046 | 1,923 | 1979 | 3/3/1998 | 5 to 40 years | |||||||||||||||||||||||||||||||
| Providence |
RI | 345 | 1,268 | 2,032 | 486 | 3,159 | 3,645 | 1,001 | 1984 | 6/26/1995 | 5 to 40 years | |||||||||||||||||||||||||||||||
| Chattanooga-Lee Hwy |
TN | 384 | 1,371 | 617 | 384 | 1,988 | 2,372 | 903 | 1987 | 3/27/1998 | 5 to 40 years | |||||||||||||||||||||||||||||||
| Chattanooga-Hwy 58 |
TN | 296 | 1,198 | 2,225 | 414 | 3,305 | 3,719 | 1,098 | 1985 | 3/27/1998 | 5 to 40 years | |||||||||||||||||||||||||||||||
| Ft. Oglethorpe |
GA | 349 | 1,250 | 1,737 | 464 | 2,872 | 3,336 | 888 | 1989 | 3/27/1998 | 5 to 40 years | |||||||||||||||||||||||||||||||
| Birmingham-Walt |
AL | 544 | 1,942 | 1,301 | 544 | 3,243 | 3,787 | 1,366 | 1984 | 3/27/1998 | 5 to 40 years | |||||||||||||||||||||||||||||||
| Providence |
RI | 702 | 2,821 | 3,846 | 702 | 6,667 | 7,369 | 1,920 | 1984/88 | 3/26/1998 | 5 to 40 years | |||||||||||||||||||||||||||||||
| Raleigh-Durham |
NC | 775 | 3,103 | 911 | 775 | 4,014 | 4,789 | 1,677 | 1988/91 | 4/9/1998 | 5 to 40 years | |||||||||||||||||||||||||||||||
77
Table of Contents
| Initial Cost to Company | Cost Capitalized Subsequent to Acquisition |
Gross Amount at Which Carried at Close of Period |
||||||||||||||||||||||||||||||||||||||||
| Description |
ST | Encum brance |
Land | Building, Equipment and Impvmts |
Building, Equipment and Impvmts |
Land | Building, Equipment and Impvmts |
Total | Accum. Deprec. |
Date of Const. |
Date Acquired |
Life on which depr in latest income statement is computed |
||||||||||||||||||||||||||||||
| Raleigh-Durham |
NC | 940 | 3,763 | 837 | 940 | 4,600 | 5,540 | 1,965 | 1990/96 | 4/9/1998 | 5 to 40 years | |||||||||||||||||||||||||||||||
| Salem-Policy |
NH | 742 | 2,977 | 532 | 742 | 3,509 | 4,251 | 1,474 | 1980 | 4/7/1998 | 5 to 40 years | |||||||||||||||||||||||||||||||
| Youngstown-Warren |
OH | 522 | 1,864 | 1,382 | 569 | 3,199 | 3,768 | 1,280 | 1986 | 4/22/1998 | 5 to 40 years | |||||||||||||||||||||||||||||||
| Youngstown-Warren |
OH | 512 | 1,829 | 2,031 | 633 | 3,739 | 4,372 | 1,329 | 1986 | 4/22/1998 | 5 to 40 years | |||||||||||||||||||||||||||||||
| Melbourne |
FL | 662 | 2,654 | 1,916 | 662 | 4,570 | 5,232 | 1,230 | 1985 | 6/2/1998 | 5 to 40 years | |||||||||||||||||||||||||||||||
| Jackson |
MS | 744 | 3,021 | 251 | 744 | 3,272 | 4,016 | 1,384 | 1995 | 5/13/1998 | 5 to 40 years | |||||||||||||||||||||||||||||||
| Houston-Katy |
TX | 419 | 1,524 | 3,974 | 419 | 5,498 | 5,917 | 1,347 | 1994 | 5/20/1998 | 5 to 40 years | |||||||||||||||||||||||||||||||
| Hollywood-Sheridan |
FL | 1,208 | 4,854 | 630 | 1,208 | 5,484 | 6,692 | 2,324 | 1988 | 7/1/1998 | 5 to 40 years | |||||||||||||||||||||||||||||||
| Pompano Beach-Atlantic |
FL | 944 | 3,803 | 573 | 944 | 4,376 | 5,320 | 1,941 | 1985 | 7/1/1998 | 5 to 40 years | |||||||||||||||||||||||||||||||
| Pompano Beach-Sample |
FL | 903 | 3,643 | 456 | 903 | 4,099 | 5,002 | 1,756 | 1988 | 7/1/1998 | 5 to 40 years | |||||||||||||||||||||||||||||||
| Boca Raton-18th St |
FL | 1,503 | 6,059 | -1,966 | 851 | 4,745 | 5,596 | 2,027 | 1991 | 7/1/1998 | 5 to 40 years | |||||||||||||||||||||||||||||||
| Vero Beach |
FL | 489 | 1,813 | 1,710 | 584 | 3,428 | 4,012 | 945 | 1997 | 6/12/1998 | 5 to 40 years | |||||||||||||||||||||||||||||||
| Houston-Humble |
TX | 447 | 1,790 | 2,454 | 740 | 3,951 | 4,691 | 1,332 | 1986 | 6/16/1998 | 5 to 40 years | |||||||||||||||||||||||||||||||
| Houston-Webster |
TX | 635 | 2,302 | 235 | 635 | 2,537 | 3,172 | 1,059 | 1997 | 6/19/1998 | 5 to 40 years | |||||||||||||||||||||||||||||||
| Dallas-Fort Worth |
TX | 548 | 1,988 | 394 | 548 | 2,382 | 2,930 | 984 | 1997 | 6/19/1998 | 5 to 40 years | |||||||||||||||||||||||||||||||
| Hollywood-N.21st |
FL | 840 | 3,373 | 598 | 840 | 3,971 | 4,811 | 1,711 | 1987 | 8/3/1998 | 5 to 40 years | |||||||||||||||||||||||||||||||
| San Marcos |
TX | 324 | 1,493 | 2,135 | 324 | 3,628 | 3,952 | 1,179 | 1994 | 6/30/1998 | 5 to 40 years | |||||||||||||||||||||||||||||||
| Austin-McNeil |
TX | 492 | 1,995 | 2,517 | 510 | 4,494 | 5,004 | 1,284 | 1994 | 6/30/1998 | 5 to 40 years | |||||||||||||||||||||||||||||||
| Austin-FM |
TX | 484 | 1,951 | 613 | 481 | 2,567 | 3,048 | 1,051 | 1996 | 6/30/1998 | 5 to 40 years | |||||||||||||||||||||||||||||||
| Dallas-Fort Worth |
TX | 550 | 1,998 | 878 | 550 | 2,876 | 3,426 | 1,083 | 1996 | 9/29/1998 | 5 to 40 years | |||||||||||||||||||||||||||||||
| Dallas-Fort Worth |
TX | 670 | 2,407 | 1,708 | 670 | 4,115 | 4,785 | 1,462 | 1996 | 10/9/1998 | 5 to 40 years | |||||||||||||||||||||||||||||||
| Cincinnati-Batavia |
OH | 390 | 1,570 | 1,167 | 390 | 2,737 | 3,127 | 976 | 1988 | 11/19/1998 | 5 to 40 years | |||||||||||||||||||||||||||||||
| Jackson-N.West |
MS | 460 | 1,642 | 596 | 460 | 2,238 | 2,698 | 1,023 | 1984 | 12/1/1998 | 5 to 40 years | |||||||||||||||||||||||||||||||
| Houston-Katy |
TX | 507 | 2,058 | 1,747 | 507 | 3,805 | 4,312 | 1,262 | 1993 | 12/15/1998 | 5 to 40 years | |||||||||||||||||||||||||||||||
| Providence |
RI | 447 | 1,776 | 946 | 447 | 2,722 | 3,169 | 1,114 | 1986/94 | 2/2/1999 | 5 to 40 years | |||||||||||||||||||||||||||||||
| Lafayette-Pinhook 1 |
LA | 556 | 1,951 | 1,184 | 556 | 3,135 | 3,691 | 1,423 | 1980 | 2/17/1999 | 5 to 40 years | |||||||||||||||||||||||||||||||
| Lafayette-Pinhook2 |
LA | 708 | 2,860 | 1,198 | 708 | 4,058 | 4,766 | 1,338 | 1992/94 | 2/17/1999 | 5 to 40 years | |||||||||||||||||||||||||||||||
| Lafayette-Ambassador |
LA | 314 | 1,095 | 927 | 314 | 2,022 | 2,336 | 911 | 1975 | 2/17/1999 | 5 to 40 years | |||||||||||||||||||||||||||||||
| Lafayette-Evangeline |
LA | 188 | 652 | 1,625 | 188 | 2,277 | 2,465 | 943 | 1977 | 2/17/1999 | 5 to 40 years | |||||||||||||||||||||||||||||||
| Lafayette-Guilbeau |
LA | 963 | 3,896 | 982 | 963 | 4,878 | 5,841 | 1,847 | 1994 | 2/17/1999 | 5 to 40 years | |||||||||||||||||||||||||||||||
| Phoenix-Gilbert |
AZ | 651 | 2,600 | 1,254 | 772 | 3,733 | 4,505 | 1,388 | 1995 | 5/18/1999 | 5 to 40 years | |||||||||||||||||||||||||||||||
| Phoenix-Glendale |
AZ | 565 | 2,596 | 682 | 565 | 3,278 | 3,843 | 1,289 | 1997 | 5/18/1999 | 5 to 40 years | |||||||||||||||||||||||||||||||
| Phoenix-Mesa |
AZ | 330 | 1,309 | 2,557 | 733 | 3,463 | 4,196 | 968 | 1986 | 5/18/1999 | 5 to 40 years | |||||||||||||||||||||||||||||||
| Phoenix-Mesa |
AZ | 339 | 1,346 | 701 | 339 | 2,047 | 2,386 | 771 | 1986 | 5/18/1999 | 5 to 40 years | |||||||||||||||||||||||||||||||
| Phoenix-Mesa |
AZ | 291 | 1,026 | 1,034 | 291 | 2,060 | 2,351 | 716 | 1976 | 5/18/1999 | 5 to 40 years | |||||||||||||||||||||||||||||||
| Phoenix-Mesa |
AZ | 354 | 1,405 | 526 | 354 | 1,931 | 2,285 | 804 | 1986 | 5/18/1999 | 5 to 40 years | |||||||||||||||||||||||||||||||
| Phoenix-Camelback |
AZ | 453 | 1,610 | 953 | 453 | 2,563 | 3,016 | 1,065 | 1984 | 5/18/1999 | 5 to 40 years | |||||||||||||||||||||||||||||||
| Phoenix-Bell |
AZ | 872 | 3,476 | 3,518 | 872 | 6,994 | 7,866 | 1,966 | 1984 | 5/18/1999 | 5 to 40 years | |||||||||||||||||||||||||||||||
| Phoenix-35th Ave |
AZ | 849 | 3,401 | 843 | 849 | 4,244 | 5,093 | 1,676 | 1996 | 5/21/1999 | 5 to 40 years | |||||||||||||||||||||||||||||||
| Portland |
ME | 410 | 1,626 | 1,929 | 410 | 3,555 | 3,965 | 1,238 | 1988 | 8/2/1999 | 5 to 40 years | |||||||||||||||||||||||||||||||
| Cocoa |
FL | 667 | 2,373 | 877 | 667 | 3,250 | 3,917 | 1,313 | 1982 | 9/29/1999 | 5 to 40 years | |||||||||||||||||||||||||||||||
| Dallas-Fort Worth |
TX | 335 | 1,521 | 592 | 335 | 2,113 | 2,448 | 826 | 1985 | 11/9/1999 | 5 to 40 years | |||||||||||||||||||||||||||||||
| Middletown-Monroe |
NY | 276 | 1,312 | 1,277 | 276 | 2,589 | 2,865 | 872 | 1998 | 2/2/2000 | 5 to 40 years | |||||||||||||||||||||||||||||||
| Boston - N. Andover |
MA | 633 | 2,573 | 984 | 633 | 3,557 | 4,190 | 1,267 | 1989 | 2/15/2000 | 5 to 40 years | |||||||||||||||||||||||||||||||
| Houston-Seabrook |
TX | 633 | 2,617 | 446 | 633 | 3,063 | 3,696 | 1,201 | 1996 | 3/1/2000 | 5 to 40 years | |||||||||||||||||||||||||||||||
| Ft. Lauderdale |
FL | 384 | 1,422 | 633 | 384 | 2,055 | 2,439 | 789 | 1994 | 5/2/2000 | 5 to 40 years | |||||||||||||||||||||||||||||||
| Birmingham-Bessemer |
AL | 254 | 1,059 | 1,340 | 254 | 2,399 | 2,653 | 744 | 1998 | 11/15/2000 | 5 to 40 years | |||||||||||||||||||||||||||||||
| Brewster |
NY | 1,716 | 6,920 | 1,543 | 1,981 | 8,198 | 10,179 | 1,627 | 1991/97 | 12/27/2000 | 5 to 40 years | |||||||||||||||||||||||||||||||
| Austin-Lamar |
TX | 837 | 2,977 | 3,527 | 966 | 6,375 | 7,341 | 928 | 1996/99 | 2/22/2001 | 5 to 40 years | |||||||||||||||||||||||||||||||
| Houston |
TX | 733 | 3,392 | 756 | 841 | 4,040 | 4,881 | 1,060 | 1993/97 | 3/2/2001 | 5 to 40 years | |||||||||||||||||||||||||||||||
| Ft.Myers |
FL | 787 | 3,249 | 663 | 902 | 3,797 | 4,699 | 1,001 | 1997 | 3/13/2001 | 5 to 40 years | |||||||||||||||||||||||||||||||
| Boston-Dracut |
MA | 1,035 | 3,737 | 667 | 1,104 | 4,335 | 5,439 | 1,496 | 1986 | 12/1/2001 | 5 to 40 years | |||||||||||||||||||||||||||||||
78
Table of Contents
| Initial Cost to Company | Cost Capitalized Subsequent to Acquisition |
Gross Amount at Which Carried at Close of Period |
||||||||||||||||||||||||||||||||||||||||
| Description |
ST | Encum brance |
Land | Building, Equipment and Impvmts |
Building, Equipment and Impvmts |
Land | Building, Equipment and Impvmts |
Total | Accum. Deprec. |
Date of Const. |
Date Acquired |
Life on which depr in latest income statement is computed |
||||||||||||||||||||||||||||||
| Boston-Methuen |
MA | 1,024 | 3,649 | 751 | 1,091 | 4,333 | 5,424 | 1,439 | 1984 | 12/1/2001 | 5 to 40 years | |||||||||||||||||||||||||||||||
| Columbia |
SC | 883 | 3,139 | 1,359 | 942 | 4,439 | 5,381 | 1,381 | 1985 | 12/1/2001 | 5 to 40 years | |||||||||||||||||||||||||||||||
| Myrtle Beach |
SC | 552 | 1,970 | 1,002 | 588 | 2,936 | 3,524 | 993 | 1984 | 12/1/2001 | 5 to 40 years | |||||||||||||||||||||||||||||||
| Kingsland |
GA | 470 | 1,902 | 3,257 | 666 | 4,963 | 5,629 | 1,271 | 1989 | 12/1/2001 | 5 to 40 years | |||||||||||||||||||||||||||||||
| Saco |
ME | 534 | 1,914 | 417 | 570 | 2,295 | 2,865 | 770 | 1988 | 12/3/2001 | 5 to 40 years | |||||||||||||||||||||||||||||||
| Boston-Plymouth |
MA | 1,004 | 4,584 | 2,340 | 1,004 | 6,924 | 7,928 | 1,933 | 1996 | 12/19/2001 | 5 to 40 years | |||||||||||||||||||||||||||||||
| Boston-Sandwich |
MA | 670 | 3,060 | 545 | 714 | 3,561 | 4,275 | 1,174 | 1984 | 12/19/2001 | 5 to 40 years | |||||||||||||||||||||||||||||||
| Syracuse |
NY | 294 | 1,203 | 1,130 | 327 | 2,300 | 2,627 | 633 | 1987 | 2/5/2002 | 5 to 40 years | |||||||||||||||||||||||||||||||
| Dallas-Fort Worth |
TX | 734 | 2,956 | 792 | 784 | 3,698 | 4,482 | 1,187 | 1984 | 2/13/2002 | 5 to 40 years | |||||||||||||||||||||||||||||||
| Dallas-Fort Worth |
TX | 394 | 1,595 | 411 | 421 | 1,979 | 2,400 | 660 | 1985 | 2/13/2002 | 5 to 40 years | |||||||||||||||||||||||||||||||
| San Antonio-Hunt |
TX | 381 | 1,545 | 3,814 | 618 | 5,122 | 5,740 | 891 | 1980 | 2/13/2002 | 5 to 40 years | |||||||||||||||||||||||||||||||
| Houston-Humble |
TX | 919 | 3,696 | 641 | 919 | 4,337 | 5,256 | 1,348 | 1998/02 | 6/19/2002 | 5 to 40 years | |||||||||||||||||||||||||||||||
| Houston-Pasadena |
TX | 612 | 2,468 | 443 | 612 | 2,911 | 3,523 | 904 | 1999 | 6/19/2002 | 5 to 40 years | |||||||||||||||||||||||||||||||
| Houston-League City |
TX | 689 | 3,159 | 601 | 689 | 3,760 | 4,449 | 1,138 | 1994/97 | 6/19/2002 | 5 to 40 years | |||||||||||||||||||||||||||||||
| Houston-Montgomery |
TX | 817 | 3,286 | 2,210 | 1,119 | 5,194 | 6,313 | 1,428 | 1998 | 6/19/2002 | 5 to 40 years | |||||||||||||||||||||||||||||||
| Houston |
TX | 407 | 1,650 | 270 | 407 | 1,920 | 2,327 | 622 | 1997 | 6/19/2002 | 5 to 40 years | |||||||||||||||||||||||||||||||
| Houston-Beaumont |
TX | 817 | 3,287 | 446 | 817 | 3,733 | 4,550 | 1,188 | 1996 | 6/19/2002 | 5 to 40 years | |||||||||||||||||||||||||||||||
| The Hamptons |
NY | 2,207 | 8,866 | 756 | 2,207 | 9,622 | 11,829 | 2,990 | 1989/95 | 12/16/2002 | 5 to 40 years | |||||||||||||||||||||||||||||||
| The Hamptons |
NY | 1,131 | 4,564 | 584 | 1,131 | 5,148 | 6,279 | 1,556 | 1998 | 12/16/2002 | 5 to 40 years | |||||||||||||||||||||||||||||||
| The Hamptons |
NY | 635 | 2,918 | 432 | 635 | 3,350 | 3,985 | 1,006 | 1997 | 12/16/2002 | 5 to 40 years | |||||||||||||||||||||||||||||||
| The Hamptons |
NY | 1,251 | 5,744 | 493 | 1,252 | 6,236 | 7,488 | 1,876 | 1994/98 | 12/16/2002 | 5 to 40 years | |||||||||||||||||||||||||||||||
| Dallas-Fort Worth |
TX | 1,039 | 4,201 | 218 | 1,039 | 4,419 | 5,458 | 1,273 | 1995/99 | 8/26/2003 | 5 to 40 years | |||||||||||||||||||||||||||||||
| Dallas-Fort Worth |
TX | 827 | 3,776 | 469 | 827 | 4,245 | 5,072 | 1,199 | 1998/01 | 10/1/2003 | 5 to 40 years | |||||||||||||||||||||||||||||||
| Stamford |
CT | 2,713 | 11,013 | 393 | 2,713 | 11,406 | 14,119 | 3,299 | 1998 | 3/17/2004 | 5 to 40 years | |||||||||||||||||||||||||||||||
| Houston-Tomball |
TX | 773 | 3,170 | 1,801 | 773 | 4,971 | 5,744 | 1,319 | 2000 | 5/19/2004 | 5 to 40 years | |||||||||||||||||||||||||||||||
| Houston-Conroe |
TX | 1,195 | 4,877 | 288 | 1,195 | 5,165 | 6,360 | 1,426 | 2001 | 5/19/2004 | 5 to 40 years | |||||||||||||||||||||||||||||||
| Houston-Spring |
TX | 1,103 | 4,550 | 362 | 1,103 | 4,912 | 6,015 | 1,387 | 2001 | 5/19/2004 | 5 to 40 years | |||||||||||||||||||||||||||||||
| Houston-Bissonnet |
TX | 1,061 | 4,427 | 2,848 | 1,061 | 7,275 | 8,336 | 1,802 | 2003 | 5/19/2004 | 5 to 40 years | |||||||||||||||||||||||||||||||
| Houston-Alvin |
TX | 388 | 1,640 | 991 | 388 | 2,631 | 3,019 | 656 | 2003 | 5/19/2004 | 5 to 40 years | |||||||||||||||||||||||||||||||
| Clearwater |
FL | 1,720 | 6,986 | 197 | 1,720 | 7,183 | 8,903 | 1,955 | 2001 | 6/3/2004 | 5 to 40 years | |||||||||||||||||||||||||||||||
| Houston-Missouri City |
TX | 1,167 | 4,744 | 3,537 | 1,566 | 7,882 | 9,448 | 1,771 | 1998 | 6/23/2004 | 5 to 40 years | |||||||||||||||||||||||||||||||
| Chattanooga-Hixson |
TN | 1,365 | 5,569 | 1,603 | 1,365 | 7,172 | 8,537 | 1,925 | 1998/02 | 8/4/2004 | 5 to 40 years | |||||||||||||||||||||||||||||||
| Austin-Round Rock |
TX | 2,047 | 5,857 | 826 | 1,976 | 6,754 | 8,730 | 1,817 | 2000 | 8/5/2004 | 5 to 40 years | |||||||||||||||||||||||||||||||
| Syracuse - Cicero |
NY | 527 | 2,121 | 852 | 527 | 2,973 | 3,500 | 796 | 1988/02 | 3/16/2005 | 5 to 40 years | |||||||||||||||||||||||||||||||
| Long Island-Bayshore |
NY | 1,131 | 4,609 | 209 | 1,131 | 4,818 | 5,949 | 1,221 | 2003 | 3/15/2005 | 5 to 40 years | |||||||||||||||||||||||||||||||
| Boston-Springfield |
MA | 612 | 2,501 | 220 | 612 | 2,721 | 3,333 | 714 | 1965/75 | 4/12/2005 | 5 to 40 years | |||||||||||||||||||||||||||||||
| Stamford |
CT | 1,612 | 6,585 | 240 | 1,612 | 6,825 | 8,437 | 1,791 | 2002 | 4/14/2005 | 5 to 40 years | |||||||||||||||||||||||||||||||
| Houston-Jones |
TX | 1,214 | 4,949 | 270 | 1,215 | 5,218 | 6,433 | 1,294 | 1997/99 | 6/6/2005 | 5 to 40 years | |||||||||||||||||||||||||||||||
| Montgomery-Richard |
AL | 1,906 | 7,726 | 284 | 1,906 | 8,010 | 9,916 | 2,019 | 1997 | 6/1/2005 | 5 to 40 years | |||||||||||||||||||||||||||||||
| Boston-Oxford |
MA | 470 | 1,902 | 1,648 | 470 | 3,550 | 4,020 | 800 | 2002 | 6/23/2005 | 5 to 40 years | |||||||||||||||||||||||||||||||
| Austin-290E |
TX | 537 | 2,183 | -281 | 491 | 1,948 | 2,439 | 545 | 2003 | 7/12/2005 | 5 to 40 years | |||||||||||||||||||||||||||||||
| SanAntonio-Marbach |
TX | 556 | 2,265 | 514 | 556 | 2,779 | 3,335 | 689 | 2003 | 7/12/2005 | 5 to 40 years | |||||||||||||||||||||||||||||||
| Austin-South 1st |
TX | 754 | 3,065 | 219 | 754 | 3,284 | 4,038 | 858 | 2003 | 7/12/2005 | 5 to 40 years | |||||||||||||||||||||||||||||||
| Houston-Pinehurst |
TX | 484 | 1,977 | 1,519 | 484 | 3,496 | 3,980 | 768 | 2002/04 | 7/12/2005 | 5 to 40 years | |||||||||||||||||||||||||||||||
| Atlanta-Marietta |
GA | 811 | 3,397 | 548 | 811 | 3,945 | 4,756 | 988 | 2003 | 9/15/2005 | 5 to 40 years | |||||||||||||||||||||||||||||||
| Baton Rouge |
LA | 719 | 2,927 | 2,536 | 719 | 5,463 | 6,182 | 977 | 1984/94 | 11/15/2005 | 5 to 40 years | |||||||||||||||||||||||||||||||
| Houston-Cypress |
TX | 721 | 2,994 | 2,282 | 721 | 5,276 | 5,997 | 1008 | 2003 | 1/13/2006 | 5 to 40 years | |||||||||||||||||||||||||||||||
| San Marcos-Hwy 35S |
TX | 628 | 2,532 | 595 | 982 | 2,773 | 3,755 | 631 | 2001 | 1/10/2006 | 5 to 40 years | |||||||||||||||||||||||||||||||
| Houston-Baytown |
TX | 596 | 2,411 | 285 | 596 | 2,696 | 3,292 | 614 | 2002 | 1/10/2006 | 5 to 40 years | |||||||||||||||||||||||||||||||
| Rochester |
NY | 937 | 3,779 | 199 | 937 | 3,978 | 4,915 | 916 | 2002/06 | 2/1/2006 | 5 to 40 years | |||||||||||||||||||||||||||||||
| Houston-Jones Rd 2 |
TX | 707 | 2,933 | 2,756 | 707 | 5,689 | 6,396 | 1195 | 2000 | 3/9/2006 | 5 to 40 years | |||||||||||||||||||||||||||||||
| Lafayette |
LA | 411 | 1,621 | 250 | 411 | 1,871 | 2,282 | 469 | 1997 | 4/13/2006 | 5 to 40 years | |||||||||||||||||||||||||||||||
79
Table of Contents
| Initial Cost to Company | Cost Capitalized Subsequent to Acquisition |
Gross Amount at Which Carried at Close of Period |
||||||||||||||||||||||||||||||||||||||||
| Description |
ST | Encum brance |
Land | Building, Equipment and Impvmts |
Building, Equipment and Impvmts |
Land | Building, Equipment and Impvmts |
Total | Accum. Deprec. |
Date of Const. |
Date Acquired |
Life on which depr in latest income statement is computed |
||||||||||||||||||||||||||||||
| Lafayette |
LA | 463 | 1,831 | 188 | 463 | 2,019 | 2,482 | 465 | 2001/04 | 4/13/2006 | 5 to 40 years | |||||||||||||||||||||||||||||||
| Lafayette |
LA | 601 | 2,406 | 1,362 | 601 | 3,768 | 4,369 | 839 | 2002 | 4/13/2006 | 5 to 40 years | |||||||||||||||||||||||||||||||
| Lafayette |
LA | 542 | 1,319 | 2,184 | 542 | 3,503 | 4,045 | 711 | 1997/99 | 4/13/2006 | 5 to 40 years | |||||||||||||||||||||||||||||||
| Manchester |
NH | 832 | 3,268 | 149 | 832 | 3,417 | 4,249 | 785 | 2000 | 4/26/2006 | 5 to 40 years | |||||||||||||||||||||||||||||||
| Nashua |
NH | 617 | 2,422 | 564 | 617 | 2,986 | 3,603 | 664 | 1989 | 6/29/2006 | 5 to 40 years | |||||||||||||||||||||||||||||||
| Clearwater-Largo |
FL | 1,270 | 5,037 | 233 | 1,270 | 5,270 | 6,540 | 1188 | 1998 | 6/22/2006 | 5 to 40 years | |||||||||||||||||||||||||||||||
| Clearwater-Pinellas Park |
FL | 929 | 3,676 | 304 | 929 | 3,980 | 4,909 | 861 | 2000 | 6/22/2006 | 5 to 40 years | |||||||||||||||||||||||||||||||
| Clearwater-Tarpon Springs |
FL | 696 | 2,739 | 172 | 696 | 2,911 | 3,607 | 660 | 1999 | 6/22/2006 | 5 to 40 years | |||||||||||||||||||||||||||||||
| New Orleans |
LA | 1,220 | 4,805 | 215 | 1,220 | 5,020 | 6,240 | 1132 | 2000 | 6/22/2006 | 5 to 40 years | |||||||||||||||||||||||||||||||
| St Louis-Meramec |
MO | 1,113 | 4,359 | 361 | 1,113 | 4,720 | 5,833 | 1051 | 1999 | 6/22/2006 | 5 to 40 years | |||||||||||||||||||||||||||||||
| St Louis-Charles Rock |
MO | 766 | 3,040 | 1,434 | 766 | 4,474 | 5,240 | 752 | 1999 | 6/22/2006 | 5 to 40 years | |||||||||||||||||||||||||||||||
| St Louis-Shackelford |
MO | 828 | 3,290 | 199 | 828 | 3,489 | 4,317 | 785 | 1999 | 6/22/2006 | 5 to 40 years | |||||||||||||||||||||||||||||||
| St Louis-W.Washington |
MO | 734 | 2,867 | 778 | 734 | 3,645 | 4,379 | 857 | 1980/01 | 6/22/2006 | 5 to 40 years | |||||||||||||||||||||||||||||||
| St Louis-Howdershell |
MO | 899 | 3,596 | 298 | 899 | 3,894 | 4,793 | 861 | 2000 | 6/22/2006 | 5 to 40 years | |||||||||||||||||||||||||||||||
| St Louis-Lemay Ferry |
MO | 890 | 3,552 | 397 | 890 | 3,949 | 4,839 | 864 | 1999 | 6/22/2006 | 5 to 40 years | |||||||||||||||||||||||||||||||
| St Louis-Manchester |
MO | 697 | 2,711 | 157 | 697 | 2,868 | 3,565 | 642 | 2000 | 6/22/2006 | 5 to 40 years | |||||||||||||||||||||||||||||||
| Dallas-Fort Worth |
TX | 1,256 | 4,946 | 377 | 1,256 | 5,323 | 6,579 | 1169 | 1998/03 | 6/22/2006 | 5 to 40 years | |||||||||||||||||||||||||||||||
| Dallas-Fort Worth |
TX | 605 | 2,434 | 141 | 605 | 2,575 | 3,180 | 567 | 2004 | 6/22/2006 | 5 to 40 years | |||||||||||||||||||||||||||||||
| Dallas-Fort Worth |
TX | 607 | 2,428 | 177 | 607 | 2,605 | 3,212 | 579 | 2004 | 6/22/2006 | 5 to 40 years | |||||||||||||||||||||||||||||||
| Dallas-Fort Worth |
TX | 1,073 | 4,276 | 77 | 1,073 | 4,353 | 5,426 | 970 | 2003 | 6/22/2006 | 5 to 40 years | |||||||||||||||||||||||||||||||
| Dallas-Fort Worth |
TX | 549 | 2,180 | 1,153 | 549 | 3,333 | 3,882 | 615 | 1998 | 6/22/2006 | 5 to 40 years | |||||||||||||||||||||||||||||||
| Dallas-Fort Worth |
TX | 644 | 2,542 | 136 | 644 | 2,678 | 3,322 | 594 | 1999 | 6/22/2006 | 5 to 40 years | |||||||||||||||||||||||||||||||
| San Antonio-Blanco |
TX | 963 | 3,836 | 195 | 963 | 4,031 | 4,994 | 908 | 2004 | 6/22/2006 | 5 to 40 years | |||||||||||||||||||||||||||||||
| San Antonio-Broadway |
TX | 773 | 3,060 | 1,932 | 773 | 4,992 | 5,765 | 811 | 2000 | 6/22/2006 | 5 to 40 years | |||||||||||||||||||||||||||||||
| San Antonio-Huebner |
TX | 1,175 | 4,624 | 313 | 1,175 | 4,937 | 6,112 | 1060 | 1998 | 6/22/2006 | 5 to 40 years | |||||||||||||||||||||||||||||||
| Chattanooga-Lee Hwy II |
TN | 619 | 2,471 | 141 | 619 | 2,612 | 3,231 | 574 | 2002 | 8/7/2006 | 5 to 40 years | |||||||||||||||||||||||||||||||
| Lafayette |
LA | 699 | 2,784 | 1,993 | 699 | 4,777 | 5,476 | 987 | 1995/99 | 8/1/2006 | 5 to 40 years | |||||||||||||||||||||||||||||||
| Montgomery-E.S.Blvd |
AL | 1,158 | 4,639 | 944 | 1,158 | 5,583 | 6,741 | 1200 | 1996/97 | 9/28/2006 | 5 to 40 years | |||||||||||||||||||||||||||||||
| Auburn-Pepperell Pkwy |
AL | 590 | 2,361 | 446 | 590 | 2,807 | 3,397 | 584 | 1998 | 9/28/2006 | 5 to 40 years | |||||||||||||||||||||||||||||||
| Auburn-Gatewood Dr |
AL | 694 | 2,758 | 252 | 694 | 3,010 | 3,704 | 632 | 2002/03 | 9/28/2006 | 5 to 40 years | |||||||||||||||||||||||||||||||
| Columbus-Williams Rd |
GA | 736 | 2,905 | 239 | 736 | 3,144 | 3,880 | 693 | 2002/04/06 | 9/28/2006 | 5 to 40 years | |||||||||||||||||||||||||||||||
| Columbus-Miller Rd |
GA | 975 | 3,854 | 1,290 | 975 | 5,144 | 6,119 | 807 | 1995 | 9/28/2006 | 5 to 40 years | |||||||||||||||||||||||||||||||
| Columbus-Armour Rd |
GA | 0 | 3,680 | 211 | 0 | 3,891 | 3,891 | 835 | 2004/05 | 9/28/2006 | 5 to 40 years | |||||||||||||||||||||||||||||||
| Columbus-Amber Dr |
GA | 439 | 1,745 | 265 | 439 | 2,010 | 2,449 | 427 | 1998 | 9/28/2006 | 5 to 40 years | |||||||||||||||||||||||||||||||
| Concord |
NH | 813 | 3,213 | 2,009 | 813 | 5,222 | 6,035 | 1007 | 2000 | 10/31/2006 | 5 to 40 years | |||||||||||||||||||||||||||||||
| Buffalo-Langner Rd |
NY | 532 | 2,119 | 2,721 | 532 | 4,840 | 5,372 | 641 | 1993/07 | 3/30/2007 | 5 to 40 years | |||||||||||||||||||||||||||||||
| Buffalo-Transit Rd |
NY | 437 | 1,794 | 669 | 437 | 2,463 | 2,900 | 470 | 1998 | 3/30/2007 | 5 to 40 years | |||||||||||||||||||||||||||||||
| Buffalo-Lake Ave |
NY | 638 | 2,531 | 614 | 638 | 3,145 | 3,783 | 654 | 1997 | 3/30/2007 | 5 to 40 years | |||||||||||||||||||||||||||||||
| Buffalo-Union Rd |
NY | 348 | 1,344 | 280 | 348 | 1,624 | 1,972 | 328 | 1998 | 3/30/2007 | 5 to 40 years | |||||||||||||||||||||||||||||||
| Buffalo-Niagara Falls Blvd |
NY | 323 | 1,331 | 147 | 323 | 1,478 | 1,801 | 308 | 1998 | 3/30/2007 | 5 to 40 years | |||||||||||||||||||||||||||||||
| Buffalo-Young St |
NY | 315 | 2,185 | 998 | 316 | 3,182 | 3,498 | 595 | 1999/00 | 3/30/2007 | 5 to 40 years | |||||||||||||||||||||||||||||||
| Buffalo-Sheridan Dr |
NY | 961 | 3,827 | 2,480 | 961 | 6,307 | 7,268 | 935 | 1999 | 3/30/2007 | 5 to 40 years | |||||||||||||||||||||||||||||||
| Buffalo-Transit Rd |
NY | 375 | 1,498 | 344 | 375 | 1,842 | 2,217 | 414 | 1990/95 | 3/30/2007 | 5 to 40 years | |||||||||||||||||||||||||||||||
| Rochester-Phillips Rd |
NY | 1,003 | 4,002 | 123 | 1,003 | 4,125 | 5,128 | 824 | 1999 | 3/30/2007 | 5 to 40 years | |||||||||||||||||||||||||||||||
| Greenville |
MS | 1,100 | 4,386 | 648 | 1,100 | 5,034 | 6,134 | 1033 | 1994 | 1/11/2007 | 5 to 40 years | |||||||||||||||||||||||||||||||
| Houston-Beaumont |
TX | 929 | 3,647 | 181 | 930 | 3,827 | 4,757 | 795 | 2002/04 | 3/8/2007 | 5 to 40 years | |||||||||||||||||||||||||||||||
| Houston-Beaumont |
TX | 1,537 | 6,018 | 455 | 1,537 | 6,473 | 8,010 | 1298 | 2003/06 | 3/8/2007 | 5 to 40 years | |||||||||||||||||||||||||||||||
| Huntsville-Memorial Pkwy |
AL | 1,607 | 6,338 | 982 | 1,677 | 7,250 | 8,927 | 1352 | 1989/06 | 6/1/2007 | 5 to 40 years | |||||||||||||||||||||||||||||||
| Huntsville-Madison 1 |
AL | 1,016 | 4,013 | 339 | 1,017 | 4,351 | 5,368 | 881 | 1993/07 | 6/1/2007 | 5 to 40 years | |||||||||||||||||||||||||||||||
| Bilox-Gulfport |
MS | 1,423 | 5,624 | 173 | 1,423 | 5,797 | 7,220 | 1142 | 1998/05 | 6/1/2007 | 5 to 40 years | |||||||||||||||||||||||||||||||
80
Table of Contents
| Initial Cost to Company | Cost Capitalized Subsequent to Acquisition |
Gross Amount at Which Carried at Close of Period |
||||||||||||||||||||||||||||||||||||||||
| Description |
ST | Encum brance |
Land | Building, Equipment and Impvmts |
Building, Equipment and Impvmts |
Land | Building, Equipment and Impvmts |
Total | Accum. Deprec. |
Date of Const. |
Date Acquired |
Life on which depr in latest income statement is computed |
||||||||||||||||||||||||||||||
| Huntsville-Hwy 72 |
AL | 1,206 | 4,775 | 288 | 1,206 | 5,063 | 6,269 | 988 | 1998/06 | 6/1/2007 | 5 to 40 years | |||||||||||||||||||||||||||||||
| Mobile-Airport Blvd |
AL | 1,216 | 4,819 | 334 | 1,216 | 5,153 | 6,369 | 1043 | 2000/07 | 6/1/2007 | 5 to 40 years | |||||||||||||||||||||||||||||||
| Bilox-Gulfport |
MS | 1,345 | 5,325 | 62 | 1,301 | 5,431 | 6,732 | 1054 | 2002/04 | 6/1/2007 | 5 to 40 years | |||||||||||||||||||||||||||||||
| Huntsville-Madison 2 |
AL | 1,164 | 4,624 | 265 | 1,164 | 4,889 | 6,053 | 958 | 2002/06 | 6/1/2007 | 5 to 40 years | |||||||||||||||||||||||||||||||
| Foley-Hwy 59 |
AL | 1,346 | 5,474 | 310 | 1,347 | 5,783 | 7,130 | 1154 | 2003/06 | 6/1/2007 | 5 to 40 years | |||||||||||||||||||||||||||||||
| Pensacola 6-Nine Mile |
FL | 1,029 | 4,180 | 171 | 1,029 | 4,351 | 5,380 | 927 | 2003/06 | 6/1/2007 | 5 to 40 years | |||||||||||||||||||||||||||||||
| Auburn-College St |
AL | 686 | 2,732 | 200 | 686 | 2,932 | 3,618 | 598 | 2003 | 6/1/2007 | 5 to 40 years | |||||||||||||||||||||||||||||||
| Biloxi-Gulfport |
MS | 1,811 | 7,152 | 112 | 1,811 | 7,264 | 9,075 | 1400 | 2004/06 | 6/1/2007 | 5 to 40 years | |||||||||||||||||||||||||||||||
| Pensacola 7-Hwy 98 |
FL | 732 | 3,015 | 70 | 732 | 3,085 | 3,817 | 645 | 2006 | 6/1/2007 | 5 to 40 years | |||||||||||||||||||||||||||||||
| Montgomery-Arrowhead |
AL | 1,075 | 4,333 | 196 | 1,076 | 4,528 | 5,604 | 884 | 2006 | 6/1/2007 | 5 to 40 years | |||||||||||||||||||||||||||||||
| Montgomery-McLemore |
AL | 885 | 3,586 | 155 | 885 | 3,741 | 4,626 | 722 | 2006 | 6/1/2007 | 5 to 40 years | |||||||||||||||||||||||||||||||
| San Antonio-Foster |
TX | 676 | 2,685 | 357 | 676 | 3,042 | 3,718 | 625 | 2003/06 | 5/21/2007 | 5 to 40 years | |||||||||||||||||||||||||||||||
| Houston-Beaumont |
TX | 742 | 3,024 | 189 | 742 | 3,213 | 3,955 | 619 | 2002/05 | 11/14/2007 | 5 to 40 years | |||||||||||||||||||||||||||||||
| Hattiesburg-Clasic |
MS | 444 | 1,799 | 163 | 444 | 1,962 | 2,406 | 372 | 1998 | 12/19/2007 | 5 to 40 years | |||||||||||||||||||||||||||||||
| Biloxi-Ginger |
MS | 384 | 1,548 | 103 | 384 | 1,651 | 2,035 | 300 | 2000 | 12/19/2007 | 5 to 40 years | |||||||||||||||||||||||||||||||
| Foley-7905 St Hwy 59 |
AL | 437 | 1,757 | 190 | 437 | 1,947 | 2,384 | 344 | 2000 | 12/19/2007 | 5 to 40 years | |||||||||||||||||||||||||||||||
| Jackson-Ridgeland |
MS | 1,479 | 5,965 | 457 | 1,479 | 6,422 | 7,901 | 1163 | 1997/00 | 1/17/2008 | 5 to 40 years | |||||||||||||||||||||||||||||||
| Jackson-5111 |
MS | 1,337 | 5,377 | 143 | 1,337 | 5,520 | 6,857 | 990 | 2003 | 1/17/2008 | 5 to 40 years | |||||||||||||||||||||||||||||||
| Cincinnati-Robertson |
OH | 852 | 3,409 | 200 | 852 | 3,609 | 4,461 | 564 | 2003/04 | 12/31/2008 | 5 to 40 years | |||||||||||||||||||||||||||||||
| Richmond-Bridge Rd |
VA | 1,047 | 5,981 | 36 | 1,047 | 6,017 | 7,064 | 909 | 2009 | 10/1/2009 | 5 to 40 years | |||||||||||||||||||||||||||||||
| Raleigh-Durham |
NC | 846 | 4,095 | 100 | 846 | 4,195 | 5,041 | 445 | 2000 | 12/28/2010 | 5 to 40 years | |||||||||||||||||||||||||||||||
| Charlotte-Wallace |
NC | 961 | 3,702 | 536 | 961 | 4,238 | 5,199 | 412 | 2008 | 12/29/2010 | 5 to 40 years | |||||||||||||||||||||||||||||||
| Raleigh-Durham |
NC | 574 | 3,975 | 103 | 575 | 4,077 | 4,652 | 427 | 2008 | 12/29/2010 | 5 to 40 years | |||||||||||||||||||||||||||||||
| Charlotte-Westmoreland |
NC | 513 | 5,317 | 36 | 513 | 5,353 | 5,866 | 552 | 2009 | 12/29/2010 | 5 to 40 years | |||||||||||||||||||||||||||||||
| Charlotte-Matthews |
NC | 1,129 | 4,767 | 84 | 1,129 | 4,851 | 5,980 | 514 | 2009 | 12/29/2010 | 5 to 40 years | |||||||||||||||||||||||||||||||
| Raleigh-Durham |
NC | 381 | 3,575 | 46 | 381 | 3,621 | 4,002 | 381 | 2008 | 12/29/2010 | 5 to 40 years | |||||||||||||||||||||||||||||||
| Charlotte-Zeb Morris |
NC | 965 | 3,355 | 57 | 965 | 3,412 | 4,377 | 358 | 2007 | 12/29/2010 | 5 to 40 years | |||||||||||||||||||||||||||||||
| Fair Lawn-Wagaraw |
PA | 796 | 9,467 | 78 | 796 | 9,545 | 10,341 | 881 | 1999 | 7/14/2011 | 5 to 40 years | |||||||||||||||||||||||||||||||
| Elizabeth-Allen |
PA | 885 | 3,073 | 487 | 885 | 3,560 | 4,445 | 277 | 1988 | 7/14/2011 | 5 to 40 years | |||||||||||||||||||||||||||||||
| Saint Louis-High Ridge |
MO | 197 | 2,132 | 37 | 197 | 2,169 | 2,366 | 237 | 2007 | 7/28/2011 | 5 to 40 years | |||||||||||||||||||||||||||||||
| Atlanta-Decatur |
GA | 1,043 | 8,252 | 67 | 1,043 | 8,319 | 9,362 | 719 | 2006 | 8/17/2011 | 5 to 40 years | |||||||||||||||||||||||||||||||
| Houston-Humble |
TX | 825 | 4,201 | 323 | 825 | 4,524 | 5,349 | 413 | 1993 | 9/22/2011 | 5 to 40 years | |||||||||||||||||||||||||||||||
| Dallas-Fort Worth |
TX | 693 | 3,552 | 101 | 693 | 3,653 | 4,346 | 337 | 2001 | 9/22/2011 | 5 to 40 years | |||||||||||||||||||||||||||||||
| Houston-Hwy 6N |
TX | 1,243 | 3,106 | 95 | 1,243 | 3,201 | 4,444 | 304 | 2000 | 9/22/2011 | 5 to 40 years | |||||||||||||||||||||||||||||||
| Austin-Cedar Park |
TX | 1,559 | 2,727 | 64 | 1,559 | 2,791 | 4,350 | 270 | 1998 | 9/22/2011 | 5 to 40 years | |||||||||||||||||||||||||||||||
| Houston-Katy |
TX | 691 | 4,435 | 126 | 691 | 4,561 | 5,252 | 414 | 2000 | 9/22/2011 | 5 to 40 years | |||||||||||||||||||||||||||||||
| Houston-Deer Park |
TX | 1,012 | 3,312 | 164 | 1,012 | 3,476 | 4,488 | 309 | 1998 | 9/22/2011 | 5 to 40 years | |||||||||||||||||||||||||||||||
| Houston-W.Little York |
TX | 575 | 3,557 | 135 | 575 | 3,692 | 4,267 | 356 | 1998 | 9/22/2011 | 5 to 40 years | |||||||||||||||||||||||||||||||
| Houston-Pasadena |
TX | 705 | 4,223 | 146 | 705 | 4,369 | 5,074 | 394 | 2000 | 9/22/2011 | 5 to 40 years | |||||||||||||||||||||||||||||||
| Houston-Friendswood |
TX | 1,168 | 2,315 | 164 | 1,168 | 2,479 | 3,647 | 239 | 1994 | 9/22/2011 | 5 to 40 years | |||||||||||||||||||||||||||||||
| Houston-Spring |
TX | 2,152 | 3,027 | 275 | 2,152 | 3,302 | 5,454 | 314 | 1993 | 9/22/2011 | 5 to 40 years | |||||||||||||||||||||||||||||||
| Houston-W.Sam Houston |
TX | 402 | 3,602 | 187 | 402 | 3,789 | 4,191 | 321 | 1999 | 9/22/2011 | 5 to 40 years | |||||||||||||||||||||||||||||||
| Austin-Pond Springs Rd |
TX | 1,653 | 4,947 | 223 | 1,653 | 5,170 | 6,823 | 448 | 1984 | 9/22/2011 | 5 to 40 years | |||||||||||||||||||||||||||||||
| Houston-Spring |
TX | 1,474 | 4,500 | 67 | 1,474 | 4,567 | 6,041 | 414 | 2006 | 9/22/2011 | 5 to 40 years | |||||||||||||||||||||||||||||||
| Austin-Round Rock |
TX | 177 | 3,223 | 91 | 177 | 3,314 | 3,491 | 305 | 1999 | 9/22/2011 | 5 to 40 years | |||||||||||||||||||||||||||||||
| Houston-Silverado Dr |
TX | 1,438 | 4,583 | 123 | 1,438 | 4,706 | 6,144 | 418 | 2000 | 9/22/2011 | 5 to 40 years | |||||||||||||||||||||||||||||||
| Houston-Sugarland |
TX | 272 | 3,236 | 162 | 272 | 3,398 | 3,670 | 320 | 2001 | 9/22/2011 | 5 to 40 years | |||||||||||||||||||||||||||||||
| Houston-Westheimer Rd |
TX | 536 | 2,687 | 142 | 536 | 2,829 | 3,365 | 258 | 1997 | 9/22/2011 | 5 to 40 years | |||||||||||||||||||||||||||||||
| Houston-Wilcrest Dr |
TX | 1,478 | 4,145 | 141 | 1,478 | 4,286 | 5,764 | 373 | 1999 | 9/22/2011 | 5 to 40 years | |||||||||||||||||||||||||||||||
| Houston-Woodlands |
TX | 1,315 | 6,142 | 195 | 1,315 | 6,337 | 7,652 | 535 | 1997 | 9/22/2011 | 5 to 40 years | |||||||||||||||||||||||||||||||
| Houston-Woodlands |
TX | 3,189 | 3,974 | 147 | 3,189 | 4,121 | 7,310 | 348 | 2000 | 9/22/2011 | 5 to 40 years | |||||||||||||||||||||||||||||||
81
Table of Contents
| Initial Cost to Company | Cost Capitalized Subsequent to Acquisition |
Gross Amount at Which Carried at Close of Period |
||||||||||||||||||||||||||||||||||||||||||
| Description |
ST | Encum brance |
Land | Building, Equipment and Impvmts |
Building, Equipment and Impvmts |
Land | Building, Equipment and Impvmts |
Total | Accum. Deprec. |
Date of Const. |
Date Acquired |
Life on which depr in latest income statement is computed |
||||||||||||||||||||||||||||||||
| Houston-Katy Freeway |
TX | 1,049 | 5,175 | 501 | 1,049 | 5,676 | 6,725 | 486 | 1999 | 9/22/2011 | 5 to 40 years | |||||||||||||||||||||||||||||||||
| Houston-Webster |
TX | 2,127 | 2,054 | 2,138 | 368 | 2,054 | 2,506 | 4,560 | 229 | 1982 | 9/22/2011 | 5 to 40 years | ||||||||||||||||||||||||||||||||
| Newport News-Brick Kiln |
VA | 2,848 | 5,892 | 60 | 2,848 | 5,952 | 8,800 | 527 | 2004 | 9/29/2011 | 5 to 40 years | |||||||||||||||||||||||||||||||||
| Pensacola |
FL | 197 | 4,281 | 158 | 197 | 4,439 | 4,636 | 372 | 1996 | 11/15/2011 | 5 to 40 years | |||||||||||||||||||||||||||||||||
| Miami |
FL | 2,960 | 12,077 | 91 | 2,960 | 12,168 | 15,128 | 796 | 2005 | 5/16/2012 | 5 to 40 years | |||||||||||||||||||||||||||||||||
| Chicago - Lake Forest |
IL | 1,932 | 11,606 | 79 | 1,932 | 11,685 | 13,617 | 770 | 1996/2004 | 6/6/2012 | 5 to 40 years | |||||||||||||||||||||||||||||||||
| Chicago - Schaumburg |
IL | 1,940 | 4,880 | 205 | 1,940 | 5,085 | 7,025 | 346 | 1998 | 6/6/2012 | 5 to 40 years | |||||||||||||||||||||||||||||||||
| Norfolk - East Little Creek |
VA | 911 | 5,862 | 47 | 911 | 5,909 | 6,820 | 393 | 2007 | 6/20/2012 | 5 to 40 years | |||||||||||||||||||||||||||||||||
| Atlanta |
GA | 1,560 | 6,766 | 53 | 1,560 | 6,819 | 8,379 | 443 | 2009 | 7/18/2012 | 5 to 40 years | |||||||||||||||||||||||||||||||||
| Jacksonville - Middleburg |
FL | 664 | 5,719 | 26 | 644 | 5,765 | 6,409 | 343 | 2008 | 9/18/2012 | 5 to 40 years | |||||||||||||||||||||||||||||||||
| Jacksonville - Orange Park |
FL | 772 | 3,882 | 66 | 772 | 3,948 | 4,720 | 240 | 2007 | 9/18/2012 | 5 to 40 years | |||||||||||||||||||||||||||||||||
| St. Augustine |
FL | 739 | 3,858 | 53 | 739 | 3,911 | 4,650 | 242 | 2007 | 9/18/2012 | 5 to 40 years | |||||||||||||||||||||||||||||||||
| Atlanta - NE Expressway |
GA | 1,384 | 9,266 | 46 | 1,384 | 9,312 | 10,696 | 554 | 2009 | 9/18/2012 | 5 to 40 years | |||||||||||||||||||||||||||||||||
| Atlanta - Kennesaw |
GA | 856 | 4,315 | 46 | 856 | 4,361 | 5,217 | 263 | 2008 | 9/18/2012 | 5 to 40 years | |||||||||||||||||||||||||||||||||
| Atlanta - Lawrenceville |
GA | 855 | 3,838 | 76 | 855 | 3,914 | 4,769 | 238 | 2007 | 9/18/2012 | 5 to 40 years | |||||||||||||||||||||||||||||||||
| Atlanta - Woodstock |
GA | 1,342 | 4,692 | 69 | 1,342 | 4,761 | 6,103 | 291 | 2009 | 9/18/2012 | 5 to 40 years | |||||||||||||||||||||||||||||||||
| Raleigh-Durham |
NC | 2,337 | 4,901 | 115 | 2,337 | 5,016 | 7,353 | 299 | 2002 | 9/19/2012 | 5 to 40 years | |||||||||||||||||||||||||||||||||
| Chicago - Lindenhurst |
IL | 1,213 | 3,129 | 89 | 1,213 | 3,218 | 4,431 | 199 | 1999/2006 | 9/27/2012 | 5 to 40 years | |||||||||||||||||||||||||||||||||
| Chicago - Orland Park |
IL | 1,050 | 5,894 | 81 | 1,050 | 5,975 | 7,025 | 331 | 2007 | 12/10/2012 | 5 to 40 years | |||||||||||||||||||||||||||||||||
| Bradenton |
FL | 1,501 | 3,775 | 38 | 1,501 | 3,813 | 5,314 | 199 | 1997 | 12/21/2012 | 5 to 40 years | |||||||||||||||||||||||||||||||||
| Ft. Myers - Cleveland Ave. |
FL | 515 | 2,280 | 56 | 515 | 2,336 | 2,851 | 126 | 1998 | 12/21/2012 | 5 to 40 years | |||||||||||||||||||||||||||||||||
| Clearwater - Drew St. |
FL | 1,234 | 4,018 | 37 | 1,234 | 4,055 | 5,289 | 211 | 2000 | 12/21/2012 | 5 to 40 years | |||||||||||||||||||||||||||||||||
| Clearwater - North Myrtle |
FL | 1,555 | 5,978 | 38 | 1,555 | 6,016 | 7,571 | 313 | 2000 | 12/21/2012 | 5 to 40 years | |||||||||||||||||||||||||||||||||
| Chicago - Aurora |
IL | 269 | 3,126 | 81 | 269 | 3,207 | 3,476 | 166 | 2010 | 12/31/2012 | 5 to 40 years | |||||||||||||||||||||||||||||||||
| Phoenix |
AZ | 910 | 3,656 | 73 | 910 | 3,729 | 4,639 | 206 | 2008 | 12/18/2012 | 5 to 40 years | |||||||||||||||||||||||||||||||||
| Chicago - North Austin |
IL | 2,593 | 5,029 | 144 | 2,593 | 5,173 | 7,766 | 272 | 2005 | 12/20/2012 | 5 to 40 years | |||||||||||||||||||||||||||||||||
| Chicago - North Western |
IL | 1,718 | 6,466 | 295 | 1,718 | 6,761 | 8,479 | 339 | 2005 | 12/20/2012 | 5 to 40 years | |||||||||||||||||||||||||||||||||
| Chicago - West Pershing |
IL | 395 | 3,226 | 68 | 395 | 3,294 | 3,689 | 168 | 2008 | 12/20/2012 | 5 to 40 years | |||||||||||||||||||||||||||||||||
| Austin-Cedar Park |
TX | 1,246 | 5,740 | 54 | 1,246 | 5,794 | 7,040 | 306 | 2006 | 12/27/2012 | 5 to 40 years | |||||||||||||||||||||||||||||||||
| Chicago - North Broadway |
IL | 2,373 | 9,869 | 24 | 2,373 | 9,893 | 12,266 | 505 | 2011 | 12/20/2012 | 5 to 40 years | |||||||||||||||||||||||||||||||||
| Austin-Round Rock |
TX | 774 | 3,327 | 61 | 774 | 3,388 | 4,162 | 177 | 2004 | 12/27/2012 | 5 to 40 years | |||||||||||||||||||||||||||||||||
| Austin-Round Rock |
TX | 632 | 1,985 | 54 | 632 | 2,039 | 2,671 | 121 | 2007 | 12/27/2012 | 5 to 40 years | |||||||||||||||||||||||||||||||||
| San Antonio - Marbach |
TX | 337 | 2,005 | 144 | 337 | 2,149 | 2,486 | 112 | 2005 | 2/11/2013 | 5 to 40 years | |||||||||||||||||||||||||||||||||
| Long Island - Lindenhurst |
NY | 2,122 | 8,735 | 102 | 2,122 | 8,837 | 10,959 | 401 | 2002 | 3/22/2013 | 5 to 40 years | |||||||||||||||||||||||||||||||||
| Boston - Somerville |
MA | 1,553 | 7,186 | 62 | 1,553 | 7,248 | 8,801 | 328 | 2008 | 3/22/2013 | 5 to 40 years | |||||||||||||||||||||||||||||||||
| Long Island - Deer Park |
NY | 1,096 | 8,276 | 90 | 1,096 | 8,366 | 9,462 | 291 | 2009 | 8/29/2013 | 5 to 40 years | |||||||||||||||||||||||||||||||||
| Long Island - Amityville |
NY | 2,224 | 10,102 | 69 | 2,224 | 10,171 | 12,395 | 352 | 2009 | 8/29/2013 | 5 to 40 years | |||||||||||||||||||||||||||||||||
| Colorado Springs - Scarlet |
CO | 629 | 5,201 | 135 | 629 | 5,336 | 5,965 | 170 | 2006 | 9/30/2013 | 5 to 40 years | |||||||||||||||||||||||||||||||||
| Toms River - Route 37 W |
NJ | 1,843 | 6,544 | 92 | 1,843 | 6,636 | 8,479 | 185 | 2007 | 11/26/2013 | 5 to 40 years | |||||||||||||||||||||||||||||||||
| Lake Worth - S Military |
FL | 868 | 5,306 | 80 | 868 | 5,386 | 6,254 | 151 | 2000 | 12/4/2013 | 5 to 40 years | |||||||||||||||||||||||||||||||||
| Austin-Round Rock |
TX | 1,547 | 5,226 | 33 | 1,547 | 5,259 | 6,806 | 145 | 2008 | 12/27/2013 | 5 to 40 years | |||||||||||||||||||||||||||||||||
| Hartford-Bristol |
CT | 1,174 | 8,816 | 65 | 1,174 | 8,881 | 10,055 | 225 | 2004 | 12/30/2013 | 5 to 40 years | |||||||||||||||||||||||||||||||||
| Piscataway - New Brunswick |
NJ | 1,639 | 10,946 | 52 | 1,639 | 10,998 | 12,637 | 277 | 2006 | 12/30/2013 | 5 to 40 years | |||||||||||||||||||||||||||||||||
| Fort Lauderdale - 3rd Ave |
FL | 7,629 | 11,918 | 159 | 7,629 | 12,077 | 19,706 | 307 | 1998 | 1/9/2014 | 5 to 40 years | |||||||||||||||||||||||||||||||||
| West Palm - Mercer |
FL | 15,680 | 17,520 | 396 | 15,680 | 17,916 | 33,596 | 461 | 2000 | 1/9/2014 | 5 to 40 years | |||||||||||||||||||||||||||||||||
| Austin - Manchaca |
TX | 3,999 | 4,297 | 592 | 3,999 | 4,889 | 8,888 | 127 | 1998/2002 | 1/17/2014 | 5 to 40 years | |||||||||||||||||||||||||||||||||
82
Table of Contents
| Initial Cost to Company | Cost Capitalized Subsequent to Acquisition |
Gross Amount at Which Carried at Close of Period |
||||||||||||||||||||||||||||||||||||||||||
| Description |
ST | Encum brance |
Land | Building, Equipment and Impvmts |
Building, Equipment and Impvmts |
Land | Building, Equipment and Impvmts |
Total | Accum. Deprec. |
Date of Const. |
Date Acquired |
Life on which depr in latest income statement is computed |
||||||||||||||||||||||||||||||||
| San Antonio |
TX | 2,235 | 6,269 | 317 | 2,235 | 6,586 | 8,821 | 162 | 2012 | 2/10/2014 | 5 to 40 years | |||||||||||||||||||||||||||||||||
| Portland |
ME | 2,146 | 6,418 | 163 | 2,146 | 6,581 | 8,727 | 156 | 2000 | 2/11/2014 | 5 to 40 years | |||||||||||||||||||||||||||||||||
| Brunswick |
ME | 493 | 5,234 | 66 | 493 | 5,300 | 5,793 | 124 | 2006 | 2/11/2014 | 5 to 40 years | |||||||||||||||||||||||||||||||||
| Chicago - St. Charles |
IL | 1,837 | 6,301 | 499 | 1,837 | 6,800 | 8,637 | 136 | 2004/2013 | 3/31/2014 | 5 to 40 years | |||||||||||||||||||||||||||||||||
| Chicago - Ashland |
IL | 598 | 4,789 | 127 | 598 | 4,916 | 5,514 | 89 | 2014 | 5/5/2014 | 5 to 40 years | |||||||||||||||||||||||||||||||||
| San Antonio - Walzem |
TX | 2,000 | 3,749 | 411 | 2,000 | 4,160 | 6,160 | 82 | 1997 | 5/13/2014 | 5 to 40 years | |||||||||||||||||||||||||||||||||
| St. Louis - Woodson |
MO | 2,444 | 5,966 | 309 | 2,444 | 6,275 | 8,719 | 95 | 1998 | 5/22/2014 | 5 to 40 years | |||||||||||||||||||||||||||||||||
| St. Louis - Mexico |
MO | 638 | 3,518 | 269 | 638 | 3,787 | 4,425 | 59 | 1998 | 5/22/2014 | 5 to 40 years | |||||||||||||||||||||||||||||||||
| St. Louis - Vogel |
MO | 2,010 | 3,544 | 176 | 2,010 | 3,720 | 5,730 | 58 | 2000 | 5/22/2014 | 5 to 40 years | |||||||||||||||||||||||||||||||||
| St. Louis - Pershall |
MO | 292 | 325 | 81 | 292 | 406 | 698 | 8 | 1979 | 5/22/2014 | 5 to 40 years | |||||||||||||||||||||||||||||||||
| St. Louis - Manchester |
MO | 508 | 2,042 | 320 | 508 | 2,362 | 2,870 | 35 | 1996 | 5/22/2014 | 5 to 40 years | |||||||||||||||||||||||||||||||||
| St. Louis - North Highway |
MO | 1,989 | 4,045 | 286 | 1,989 | 4,331 | 6,320 | 68 | 1997 | 5/22/2014 | 5 to 40 years | |||||||||||||||||||||||||||||||||
| St. Louis - Dunn |
MO | 1,538 | 4,510 | 271 | 1,538 | 4,781 | 6,319 | 74 | 2000 | 5/22/2014 | 5 to 40 years | |||||||||||||||||||||||||||||||||
| Trenton |
NJ | 5,161 | 7,063 | 289 | 5,161 | 7,352 | 12,513 | 120 | 1980 | 6/5/2014 | 5 to 40 years | |||||||||||||||||||||||||||||||||
| Fishkill |
NY | 1,741 | 6,006 | 104 | 1,741 | 6,110 | 7,851 | 96 | 2005 | 6/11/2014 | 5 to 40 years | |||||||||||||||||||||||||||||||||
| Atlanta - Peachtree |
GA | 2,263 | 4,931 | 391 | 2,263 | 5,322 | 7,585 | 91 | 2007 | 6/12/2014 | 5 to 40 years | |||||||||||||||||||||||||||||||||
| Paterson |
NJ | 0 | 2,292 | 115 | 0 | 2,407 | 2,407 | 92 | 2000 | 6/12/2014 | 5 to 40 years | |||||||||||||||||||||||||||||||||
| Asbury Park - 1st Ave |
NJ | 819 | 4,734 | 121 | 819 | 4,855 | 5,674 | 63 | 2003 | 6/18/2014 | 5 to 40 years | |||||||||||||||||||||||||||||||||
| Farmingdale - Tinton Falls |
NJ | 1,097 | 5,618 | 197 | 1,097 | 5,815 | 6,912 | 75 | 2004 | 6/18/2014 | 5 to 40 years | |||||||||||||||||||||||||||||||||
| Lakewood - Route 70 |
NJ | 626 | 4,549 | 135 | 626 | 4,684 | 5,310 | 60 | 2003 | 6/18/2014 | 5 to 40 years | |||||||||||||||||||||||||||||||||
| Matawan |
NJ | 1,512 | 9,707 | 235 | 1,512 | 9,942 | 11,454 | 127 | 2005 | 7/10/2014 | 5 to 40 years | |||||||||||||||||||||||||||||||||
| St. Petersburg - Gandy |
FL | 2,958 | 6,904 | 170 | 2,958 | 7,074 | 10,032 | 61 | 2007 | 8/28/2014 | 5 to 40 years | |||||||||||||||||||||||||||||||||
| Chesapeake - Campostella |
VA | 2,349 | 3,875 | 98 | 2,349 | 3,973 | 6,322 | 37 | 2000 | 9/5/2014 | 5 to 40 years | |||||||||||||||||||||||||||||||||
| San Antonio-Castle Hills |
TX | 2,658 | 8,190 | 219 | 2,658 | 8,409 | 11,067 | 71 | 2002 | 9/10/2014 | 5 to 40 years | |||||||||||||||||||||||||||||||||
| Chattanooga - Broad St |
TN | 759 | 5,608 | 173 | 759 | 5,781 | 6,540 | 38 | 2014 | 9/18/2014 | 5 to 40 years | |||||||||||||||||||||||||||||||||
| New Orleans - Kenner |
LA | 5,771 | 10,375 | 346 | 5,771 | 10,721 | 16,492 | 70 | 2008 | 10/10/2014 | 5 to 40 years | |||||||||||||||||||||||||||||||||
| Orlando - Celebration |
FL | 6,091 | 4,641 | 335 | 6,091 | 4,976 | 11,067 | 22 | 2006 | 10/21/2014 | 5 to 40 years | |||||||||||||||||||||||||||||||||
| Austin - Cedar Park |
TX | 4,196 | 8,374 | 349 | 4,196 | 8,723 | 12,919 | 38 | 2003 | 10/28/2014 | 5 to 40 years | |||||||||||||||||||||||||||||||||
| Chicago - Pulaski |
IL | 889 | 4,700 | 301 | 889 | 5,001 | 5,890 | 21 | 2014 | 11/14/2014 | 5 to 40 years | |||||||||||||||||||||||||||||||||
| Houston - Gessner |
TX | 1,599 | 5,813 | 385 | 1,599 | 6,198 | 7,797 | 0 | 2006 | 12/18/2014 | 5 to 40 years | |||||||||||||||||||||||||||||||||
| Construction in Progress |
0 | 0 | 4,761 | 0 | 4,761 | 4,761 | 0 | 2013 | ||||||||||||||||||||||||||||||||||||
| Corporate Office |
NY | 0 | 68 | 24,783 | 1,633 | 23,218 | 24,851 | 13,468 | 2000 | 5/1/2000 | 5 to 40 years | |||||||||||||||||||||||||||||||||
|
|
|
|
|
|
|
|
|
|
|
|
|
|
|
|
|
|||||||||||||||||||||||||||||
| $ | 2,127 | $ | 385,294 | $ | 1,383,414 | $ | 409,275 | $ | 397,642 | $ | 1,780,341 | $ | 2,177,983 | $ | 411,701 | |||||||||||||||||||||||||||||
|
|
|
|
|
|
|
|
|
|
|
|
|
|
|
|
|
|||||||||||||||||||||||||||||
83
Table of Contents
| December 31, 2014 | December 31, 2013 | December 31, 2012 | ||||||||||||||||||||||
| Cost: |
||||||||||||||||||||||||
| Balance at beginning of period |
$ | 1,864,637 | $ | 1,742,354 | $ | 1,525,283 | ||||||||||||||||||
| Additions during period: |
||||||||||||||||||||||||
| Acquisitions through foreclosure |
$ | — | $ | — | $ | — | ||||||||||||||||||
| Other acquisitions |
286,691 | 93,376 | 185,431 | |||||||||||||||||||||
| Improvements, etc |
35,097 | 33,811 | 36,238 | |||||||||||||||||||||
|
|
|
|
|
|
|
|||||||||||||||||||
| 321,788 | 127,187 | 221,669 | ||||||||||||||||||||||
| Deductions during period: |
||||||||||||||||||||||||
| Cost of assets disposed |
(8,442 | ) | (4,904 | ) | (4,598 | ) | ||||||||||||||||||
| Impairment write-down |
— | — | — | |||||||||||||||||||||
| Casualty loss |
— | — | — | |||||||||||||||||||||
| (8,442 | ) | (4,904 | ) | (4,598 | ) | |||||||||||||||||||
|
|
|
|
|
|
|
|||||||||||||||||||
| Balance at close of period |
$ | 2,177,983 | $ | 1,864,637 | $ | 1,742,354 | ||||||||||||||||||
|
|
|
|
|
|
|
|||||||||||||||||||
| Accumulated Depreciation: |
||||||||||||||||||||||||
| Balance at beginning of period |
$ | 366,472 | $ | 324,963 | $ | 289,082 | ||||||||||||||||||
| Additions during period: |
||||||||||||||||||||||||
| Depreciation expense |
$ | 47,656 | $ | 41,929 | $ | 37,226 | ||||||||||||||||||
|
|
|
|
|
|
|
|||||||||||||||||||
| 47,656 | 41,929 | 37,226 | ||||||||||||||||||||||
| Deductions during period: |
||||||||||||||||||||||||
| Accumulated depreciation of assets disposed |
(2,427 | ) | (420 | ) | (1,345 | ) | ||||||||||||||||||
| Accumulated depreciation on impaired asset |
— | — | — | |||||||||||||||||||||
| Accumulated depreciation on casualty loss |
— | — | — | |||||||||||||||||||||
| (2,427 | ) | (420 | ) | (1,345 | ) | |||||||||||||||||||
|
|
|
|
|
|
|
|||||||||||||||||||
| Balance at close of period |
$ | 411,701 | $ | 366,472 | $ | 324,963 | ||||||||||||||||||
|
|
|
|
|
|
|
|||||||||||||||||||
84
Exhibit 12.1
Statement Re: Computation of Earnings to
Combined Fixed Charges and Preferred Stock Dividends
Amounts in thousands
| Year ended December 31, | ||||||||||||||||||||
| 2014 | 2013 | 2012 | 2011 | 2010 | ||||||||||||||||
| Earnings: |
||||||||||||||||||||
| Income from continuing operations before noncontrolling interest in consolidated subsidiaries and income from equity investees |
$ | 86,971 | $ | 69,524 | $ | 47,185 | $ | 27,654 | $ | 30,579 | ||||||||||
| Add: Income tax expense |
927 | 936 | 1,326 | 1,524 | 1,131 | |||||||||||||||
| Add: Fixed charges |
39,024 | 32,720 | 33,547 | 38,848 | 32,007 | |||||||||||||||
| Add: Distributed income of equity investees |
3,123 | 2,630 | 2,184 | 944 | 494 | |||||||||||||||
| Less: Capitalized interest |
(84 | ) | (113 | ) | (149 | ) | (72 | ) | (83 | ) | ||||||||||
| Preferred dividend requirements of consolidated subsidiaries |
— | — | — | — | — | |||||||||||||||
|
|
|
|
|
|
|
|
|
|
|
|||||||||||
| Earnings (1) |
129,961 | 105,697 | 84,093 | 68,898 | 64,128 | |||||||||||||||
| Fixed charges: |
||||||||||||||||||||
| Interest expense |
33,719 | 31,166 | 32,330 | 37,365 | 30,681 | |||||||||||||||
| Amortization of financing fees |
859 | 834 | 836 | 1,184 | 1,030 | |||||||||||||||
| Capitalized interest |
84 | 113 | 149 | 72 | 83 | |||||||||||||||
| Estimate of interest included in rent expense |
4,362 | 607 | 232 | 227 | 213 | |||||||||||||||
| Preferred stock dividends |
— | — | — | — | — | |||||||||||||||
|
|
|
|
|
|
|
|
|
|
|
|||||||||||
| Fixed charges (2) |
$ | 39,024 | $ | 32,720 | $ | 33,547 | $ | 38,848 | $ | 32,007 | ||||||||||
| Ratio of earnings to combined fixed charges and preferred stock dividends (1)/(2) |
3.33 | 3.23 | 2.51 | 1.77 | 2.00 | |||||||||||||||
Exhibit 21.1
Subsidiaries
Sovran Acquisition Limited Partnership, a Delaware limited partnership
Sovran Holdings, Inc., a Delaware Corporation
Locke Sovran I LLC, a New York limited liability company
Locke Sovran II LLC, a New York limited liability company
The Locke Group, LLC, a Delaware limited liability company
Uncle Bob’s Management, LLC, a New York limited liability company
Iskalo Land Holdings, LLC, a New York limited liability company
Sovran Jones Road, LLC, a Delaware limited liability company
Sovran Congress, LLC, a Delaware limited liability company
Sovran Cameron, LLC, a Delaware limited liability company
Sovran Huebner, LLC, a Delaware limited liability company
Sovran Little Road, LLC, a Delaware limited liability company
Sovran Granbury, LLC, a Delaware limited liability company
Sovran Shackelford, LLC, a Delaware limited liability company
Sovran Manchester, LLC, a Delaware limited liability company
Sovran DeGaulle, LLC, a Delaware limited liability company
Sovran Grapevine, LLC, a Delaware limited liability company
Sovran Washington, LLC, a Delaware limited liability company
Sovran Meramac, LLC, a Delaware limited liability company
Sovran Seminole, LLC, a Delaware limited liability company
Exhibit 23.1
Consent of Independent Registered Public Accounting Firm
We consent to the incorporation by reference in the following Registration Statements:
| (1) | Registration Statement (Form S-8 No. 333-21679) of Sovran Self Storage, Inc., |
| (2) | Registration Statement (Form S-8 No. 333-42272) pertaining to the 1995 Award and Option Plan and to the 1995 Outside Directors’ Stock Option Plan, |
| (3) | Registration Statement (Form S-8 No. 333-42270) pertaining to the Deferred Compensation Plan for Directors of Sovran Self Storage, Inc., |
| (4) | Registration Statement (Form S-8 No. 333-73806) pertaining to the 1995 Award and Option Plan, |
| (5) | Registration Statement (Form S-8 No. 333-107464) pertaining to the 1995 Outside Directors’ Stock Option Plan, |
| (6) | Registration Statement (Form S-8 No. 333-138937) pertaining to the 2005 Award and Option Plan, |
| (7) | Registration Statement (Form S-3 No. 333-187351) and related Prospectus of Sovran Self Storage, Inc. for the registration of 3,000,000 shares of its common stock, and |
| (8) | Registration Statement (Form S-3 No. 333-195592) and related Prospectus of Sovran Self Storage, Inc. for the registration of common stock, preferred stock, warrants, debt securities and units. |
of our reports dated February 24, 2015, with respect to the consolidated financial statements and schedule of Sovran Self Storage, Inc., and the effectiveness of internal control over financial reporting of Sovran Self Storage, Inc., included in this Annual Report (Form 10-K) for the year ended December 31, 2014.
| /s/ Ernst & Young LLP |
| Buffalo, New York |
| February 24, 2015 |
Exhibit 31.1
Certification of Chief Executive Officer Pursuant to Rule 13a-14(a) and 15d-14(a) of the Securities Exchange
Act, as amended
I, David L. Rogers, certify that:
| 1. | I have reviewed this report on Form 10-K of Sovran Self Storage, Inc.; |
| 2. | Based on my knowledge, this annual report does not contain any untrue statement of a material fact or omit to state a material fact necessary to make the statements made, in light of the circumstances under which such statements were made, not misleading with respect to the period covered by this annual report; |
| 3. | Based on my knowledge, the financial statements, and other financial information included in this annual report, fairly present in all material respects the financial condition, results of operations and cash flows of the registrant as of, and for, the periods presented in this annual report; |
| 4. | The registrant’s other certifying officers and I are responsible for establishing and maintaining disclosure controls and procedures (as defined in Exchange Act Rules 13a-15(e) and 15d-15(e)) and internal control over financial reporting (as defined in Exchange Act Rules 13a-15(f) and 15d-15(f)), for the registrant and have: |
| a) | designed such disclosure controls and procedures, or caused such disclosure controls and procedures to be designed under our supervision, to ensure that material information relating to the registrant, including its consolidated subsidiaries, is made known to us by others within those entities, particularly during the period in which this annual report is being prepared; |
| b) | designed such internal control over financial reporting, or caused such internal control over financial reporting to be designed under our supervision, to provide reasonable assurance regarding the reliability of financial reporting and the preparation of financial statements for external reporting purposes in accordance with generally accepted accounting principles; |
| c) | evaluated the effectiveness of the registrant’s disclosure controls and procedures and presented in this report our conclusions about the effectiveness of the disclosure controls and procedures, as of the end of the period covered by this report based on such evaluation; and |
| d) | disclosed in this report any change in the registrant’s internal control over financial reporting that occurred during the registrant’s most recent fiscal quarter (the registrant’s fourth fiscal quarter in the case of this annual report) that has materially affected or is reasonably likely to materially affect the registrant’s internal control over financial reporting; and |
| 5. | The registrant’s other certifying officers and I have disclosed, based on our most recent evaluation of internal control over financial reporting, to the registrant’s auditors and the audit committee of the registrant’s board of directors (or persons performing the equivalent functions): |
| a) | all significant deficiencies and material weaknesses in the design or operation of internal controls over financial reporting which are reasonably likely to adversely affect the registrant’s ability to record, process, summarize and report financial information; and |
| b) | any fraud, whether or not material, that involves management or other employees who have a significant role in the registrant’s internal controls over financial reporting. |
Date: February 24, 2015
| /S/ David L. Rogers |
| David L. Rogers |
| Chief Executive Officer |
Exhibit 31.2
Certification of Chief Financial Officer Pursuant to Rule 13a-14(a) and 15d-14(a) of the Securities Exchange
Act, as amended
I, Andrew J. Gregoire, certify that:
| 1. | I have reviewed this report on Form 10-K of Sovran Self Storage, Inc.; |
| 2. | Based on my knowledge, this annual report does not contain any untrue statement of a material fact or omit to state a material fact necessary to make the statements made, in light of the circumstances under which such statements were made, not misleading with respect to the period covered by this annual report; |
| 3. | Based on my knowledge, the financial statements, and other financial information included in this annual report, fairly present in all material respects the financial condition, results of operations and cash flows of the registrant as of, and for, the periods presented in this annual report; |
| 4. | The registrant’s other certifying officers and I are responsible for establishing and maintaining disclosure controls and procedures (as defined in Exchange Act Rules 13a-15(e) and 15d-15(e)) and internal control over financial reporting (as defined in Exchange Act Rules 13a-15(f) and 15d-15(f)), for the registrant and have: |
| a) | designed such disclosure controls and procedures, or caused such disclosure controls and procedures to be designed under our supervision, to ensure that material information relating to the registrant, including its consolidated subsidiaries, is made known to us by others within those entities, particularly during the period in which this annual report is being prepared; |
| b) | designed such internal control over financial reporting, or caused such internal control over financial reporting to be designed under our supervision, to provide reasonable assurance regarding the reliability of financial reporting and the preparation of financial statements for external reporting purposes in accordance with generally accepted accounting principles; |
| c) | evaluated the effectiveness of the registrant’s disclosure controls and procedures and presented in this report our conclusions about the effectiveness of the disclosure controls and procedures, as of the end of the period covered by this report based on such evaluation; and |
| d) | disclosed in this report any change in the registrant’s internal control over financial reporting that occurred during the registrant’s most recent fiscal quarter (the registrant’s fourth fiscal quarter in the case of this annual report) that has materially affected or is reasonably likely to materially affect the registrant’s internal control over financial reporting; and |
| 5. | The registrant’s other certifying officers and I have disclosed, based on our most recent evaluation of internal control over financial reporting, to the registrant’s auditors and the audit committee of the registrant’s board of directors (or persons performing the equivalent functions): |
| a) | all significant deficiencies and material weaknesses in the design or operation of internal controls over financial reporting which are reasonably likely to adversely affect the registrant’s ability to record, process, summarize and report financial information; and |
| b) | any fraud, whether or not material, that involves management or other employees who have a significant role in the registrant’s internal controls over financial reporting. |
Date: February 24, 2015
| /S/ Andrew J. Gregoire |
| Andrew J. Gregoire |
| Secretary, Chief Financial Officer |
Exhibit 32.1
Certification of Chief Executive Officer and Chief Financial Officer Pursuant to 18 U.S.C. Section 1350, as adopted pursuant to Section 906 of the Sarbanes-Oxley Act of 2002
Each of the undersigned of Sovran Self Storage, Inc. (the “Company”) does hereby certify, pursuant to Section 906 of the Sarbanes-Oxley Act of 2002, 18 U.S.C. Section 1350, that:
| 1) | The report on Form 10-K of the Company for the annual period ended December 31, 2014 (the “Report”) fully complies with the requirements of Section 13(a) of the Securities Exchange Act of 1934 (15 U.S.C. 78m); and |
| 2) | The information contained in the Report fairly presents, in all material respects, the financial condition and results of operations of the Company. |
Dated: February 24, 2015
| /S/ David L. Rogers |
| David L. Rogers |
| Chief Executive Officer |
| /S/ Andrew J. Gregoire |
| Andrew J. Gregoire |
| Chief Financial Officer |
Serious News for Serious Traders! Try StreetInsider.com Premium Free!
You May Also Be Interested In
- Vision Marine Technologies Files Patent for Advanced System Communication Encryption in E-Motion Powertrain
- Dividend payment ex-date
- Phillips 66 misses first-quarter profit estimates on weak margins
Create E-mail Alert Related Categories
SEC FilingsSign up for StreetInsider Free!
Receive full access to all new and archived articles, unlimited portfolio tracking, e-mail alerts, custom newswires and RSS feeds - and more!
