

Form 10-K MBIA INC For: Dec 31
 Tweet
Tweet Share
ShareTable of Contents
United States
SECURITIES AND EXCHANGE COMMISSION
Washington, D.C. 20549
Form 10-K
| x | ANNUAL REPORT PURSUANT TO SECTION 13 OR 15(d) OF THE SECURITIES EXCHANGE ACT OF 1934 |
For the fiscal year ended December 31, 2014
or
| ¨ | TRANSITION REPORT PURSUANT TO SECTION 13 OR 15(d) OF THE SECURITIES EXCHANGE ACT OF 1934 |
For the transition period from to
Commission File Number 1-9583
MBIA INC.
(Exact name of registrant as specified in its charter)
| Connecticut | 06-1185706 | |
| (State of incorporation) | (I.R.S. Employer Identification No.) | |
| 1 Manhattanville Road, Suite 301, Purchase, New York |
10577 | |
| (Address of principal executive offices) | (Zip Code) | |
Registrant’s telephone number, including area code: (914) 273-4545
Securities registered pursuant to Section 12(b) of the Act:
| Title of each class |
Name of each exchange on which registered | |
| Common Stock, par value $1 per share | New York Stock Exchange |
Securities registered pursuant to Section 12(g) of the Act:
None
Indicate by check mark if the registrant is a well-known seasoned issuer, as defined in Rule 405 of the Securities Act. Yes x No ¨
Indicate by check mark if the registrant is not required to file reports pursuant to Section 13 or Section 15(d) of the Act. Yes ¨ No x
Indicate by check mark whether the registrant (1) has filed all reports required to be filed by Section 13 or 15(d) of the Securities Exchange Act of 1934 during the preceding 12 months (or for such shorter period that the registrant was required to file such reports), and (2) has been subject to such filing requirements for the past 90 days. Yes x No ¨
Indicate by check mark whether the registrant has submitted electronically and posted on its corporate Web site, if any, every Interactive Data File required to be submitted and posted pursuant to Rule 405 of Regulation S-T (§232.405 of this chapter) during the preceding 12 months (or for such shorter period that the registrant was required to submit and post such files). Yes x No ¨
Indicate by check mark if disclosure of delinquent filers pursuant to Item 405 of Regulation S-K is not contained herein, and will not be contained, to the best of registrant’s knowledge, in definitive proxy or information statements incorporated by reference in Part III of this Form 10-K or any amendment to this Form 10-K. x
Indicate by check mark whether the Registrant is a large accelerated filer, an accelerated filer, a non-accelerated filer, or a smaller reporting company. See definitions of “large accelerated filer,” “accelerated filer” and “smaller reporting company” in Rule 12b-2 of the Exchange Act.
Large accelerated filer x Accelerated filer ¨ Non-accelerated filer ¨ Smaller reporting company ¨
Indicate by check mark whether the Registrant is shell company (as defined in Rule 12b-2 of the Act). Yes ¨ No x
The aggregate market value of the voting stock held by non-affiliates of the Registrant as of June 30, 2014 was $1,563,112,068.
As of February 26, 2015, 185,663,370 shares of Common Stock, par value $1 per share, were outstanding.
Documents incorporated by reference:
Portions of the Definitive Proxy Statement of the Registrant for its 2014 Annual Meeting, which will be filed on or before March 31, 2015, are incorporated by reference into Part III of this Form 10-K.
Table of Contents
Table of Contents
FORWARD-LOOKING AND CAUTIONARY STATEMENTS
This annual report of MBIA Inc. (“MBIA”, the “Company”, “we”, “us” or “our”) includes statements that are not historical or current facts and are “forward-looking statements” made pursuant to the safe harbor provisions of the Private Securities Litigation Reform Act of 1995. The words “believe”, “anticipate”, “project”, “plan”, “expect”, “estimate”, “intend”, “will likely result”, “looking forward”, or “will continue” and similar expressions identify forward-looking statements. These statements are subject to certain risks and uncertainties that could cause actual results to differ materially from historical earnings and those presently anticipated or projected. MBIA cautions readers not to place undue reliance on any such forward-looking statements, which speak only to their respective dates. We undertake no obligation to publicly correct or update any forward-looking statement if the Company later becomes aware that such result is not likely to be achieved.
The following are some of the factors that could affect financial performance or could cause actual results to differ materially from estimates contained in or underlying the Company’s forward-looking statements:
| • | increased credit losses or impairments on public finance obligations we insure issued by state, local and territorial governments and finance authorities that are experiencing fiscal stress; |
| • | the possibility that MBIA Corp. will have inadequate liquidity to pay expected claims as a result of increased losses on certain structured finance transactions, in particular residential mortgage-backed securities transactions that include a substantial number of ineligible mortgage loans, or a delay or failure in collecting expected recoveries; |
| • | the possibility that loss reserve estimates are not adequate to cover potential claims; |
| • | a disruption in the cash flow from our subsidiaries or an inability to access capital and our exposure to significant fluctuations in liquidity and asset values within the global credit markets as a result of collateral posting requirements; |
| • | our ability to fully implement our strategic plan, including our ability to maintain high stable ratings for National Public Finance Guarantee Corporation and generate investor demand for our financial guarantees; |
| • | deterioration in the economic environment and financial markets in the United States or abroad, and adverse developments in European sovereign credit performance, real estate market performance, credit spreads, interest rates and foreign currency levels; |
| • | the effects of governmental regulation, including insurance laws, securities laws, tax laws, legal precedents and accounting rules; and |
| • | uncertainties that have not been identified at this time. |
The above factors provide a summary of and are qualified in their entirety by the risk factors discussed under “Risk Factors” in Part I, Item 1A of this annual report on Form 10-K.
Table of Contents
Part I
As used in this Annual Report on Form 10-K, (i) “MBIA,” the “Company,” “we,” “our” and “us” refer to MBIA Inc., a Connecticut corporation incorporated in 1986 and (ii) unless otherwise indicated or the context otherwise requires, references to “MBIA Insurance Corporation” are to MBIA Insurance Corporation on a stand-alone basis and references to “MBIA Corp.” are to MBIA Insurance Corporation, together with its subsidiaries, MBIA UK Insurance Limited (“MBIA UK”) and MBIA Mexico S.A. de C.V. (“MBIA Mexico”).
OVERVIEW
MBIA’s primary business is to provide financial guarantee insurance to the United States’ public finance markets through our indirect, wholly-owned subsidiary, National Public Finance Guarantee Corporation (“National”).
National’s financial guarantee insurance policy provides investors with unconditional and irrevocable guarantees of the payment of the principal, interest or other amounts owing on insured obligations when due. The principal economic value of our financial guarantee insurance for capital markets issuers is to lower the interest cost of an insured obligation relative to the interest cost on the same obligation issued on an uninsured basis. In addition, for complex financings and for obligations of issuers that are not well-known by investors, insured obligations have historically received greater market acceptance than uninsured obligations. For investors, our insurance provides not only an additional level of credit protection but also the benefit of our portfolio monitoring and remediation skills throughout the life of the insurance policy.
National was established in February of 2009 when we restructured our business through several transactions (“Transformation”) and transferred the ownership of National (then known as “MBIA Insurance Corporation of Illinois”) from a subsidiary of MBIA Inc. to a newly established holding company, “National Public Finance Guarantee Holdings, Inc.,” another wholly-owned subsidiary of MBIA Inc.
We continue to manage the insured portfolio of MBIA Insurance Corporation and its subsidiaries which has been reduced substantially from $331.2 billion as of December 31, 2007 to $55.2 billion as of December 31, 2014. We do not expect MBIA Corp. or its subsidiaries to write any new policies in the foreseeable future in light of their current ratings. As of December 31, 2014, MBIA Corp. had statutory capital of $859 million, approximately $679 million of estimated present value loss payments on its insured credits and outstanding surplus notes with $953 million of outstanding principal and $282 million of accrued and unpaid interest. See “Management’s Discussion and Analysis of Financial Condition and Results of Operations—Capital Resources” in Part II, Item 7 of this Form 10-K for a further discussion of MBIA Corp.’s insurance statutory capital.
Given MBIA Corp.’s capital structure and business prospects, we do not expect the financial performance of MBIA Corp. to have a material impact on MBIA Inc., except for any impact it may have on the consolidated deferred tax asset relating to the Company’s net operating loss carryforwards. See “Note 11: Income Taxes” in the Notes to Consolidated Financial Statements of MBIA Inc. and Subsidiaries in Part II, Item 8 of this Form 10-K for a further discussion of income taxes. We estimate that MBIA Corp. has sufficient capital and liquidity to pay expected future policy claims, but do not expect MBIA Corp. to have sufficient capital to fully pay the outstanding principal and accrued interest on the surplus notes. Furthermore, any payments on the surplus notes would require the prior approval of the New York State Department of Financial Services (the “NYSDFS”). Accordingly, if the NYSDFS does not approve a payment of principal or interest on the surplus notes, then, under the terms of the surplus notes, any failure to make that payment of principal or interest on the surplus notes will not constitute a default under the notes.
MBIA Insurance Corporation owns MBIA UK and MBIA Mexico, the three companies that manage our legacy global structured finance and non-U.S. public finance financial guarantee insurance portfolios. MBIA UK is a financial guarantee insurance company located in the United Kingdom which wrote structured and public finance debt obligations in selected international markets, and MBIA Mexico is a financial guarantee insurance company located in Mexico which wrote a limited number of structured finance policies in Mexico.
We also own MBIA Services Corporation (“MBIA Services”), formerly, “Optinuity Alliance Resources Corporation,” a service company which provides support services such as surveillance, risk management, legal, accounting, treasury and information technology, among others, to our businesses on a fee-for-service basis.
MBIA completed the previously announced sale of its asset management advisory services business operated under Cutwater Holdings LLC, during the first quarter of 2015.
1
Table of Contents
Item 1. Business (continued)
OUR BUSINESS STRATEGY
National Ratings and New Business Opportunities
National is the largest U.S. municipal-only bond insurer in the financial guarantee industry as measured by total gross insured par outstanding of $222.3 billion as of December 31, 2014. Our primary strategy is to insure new issue and secondary market municipal bonds while providing ongoing surveillance of National’s existing insured portfolio. National’s ability to write new business and to compete with other financial guarantors is largely dependent on the financial strength ratings assigned to National by the major rating agencies. As of December 31, 2014, National was rated AA+ with a stable outlook by Kroll Bond Rating Agency (“Kroll”), AA- with a stable outlook by Standard & Poor’s Financial Services LLC (“S&P”), and A3 with a negative outlook by Moody’s Investors Services, Inc. (“Moody’s”).
National seeks to generate shareholder value through appropriate risk adjusted pricing; however, current market conditions and the competitive landscape may limit National’s new business opportunities and its ability to price and underwrite risk with attractive returns. Financial guarantee insurance competes in nearly all instances with the issuer’s alternative of issuing uninsured bonds. If the interest savings from insurance are not greater than the cost of the insurance, the issuer will generally choose to issue bonds without insurance.
MBIA Inc. Capital Management
The stabilization of the liquidity position at the holding company allows the Company more strategic flexibility in deploying its capital.
As part of the overall strategy, the Company is seeking over the next several years to reduce financial leverage at MBIA Inc. by using cash flows it receives primarily from National to pay down MBIA Inc. debt and other liabilities. During the fourth quarters of 2014 and 2013, National declared and paid a dividend of $220 million and $214 million, respectively, to its ultimate parent, MBIA Inc. In addition, during 2014 and the first quarter of 2015, MBIA Inc. received $448 million in cash from an escrow account held by MBIA Inc. under the MBIA group’s tax sharing agreement as described further under “Management’s Discussion and Analysis of Financial Condition and Results of Operations—Liquidity—MBIA Inc. Liquidity”. In 2014 we retired $122 million of debt issued by MBIA Inc. or its subsidiary MBIA Global Funding, LLC (“GFL”) and redeemed $129 million of debt issued by MBIA Inc.’s subsidiary, Meridian Funding Company, LLC (“Meridian”). In addition, $44 million of debt issued by GFL and $110 million of investment agreements matured during 2014.
In the fourth quarter of 2014, the Company’s Board of Directors authorized the repurchase of up to $200 million of its outstanding shares, against which we repurchased 1,247,337 common shares of MBIA Inc. at an average share price of $9.44. Subsequent to December 31, 2014, we repurchased an additional 6,317,901 common shares of MBIA Inc. at an average share price of $8.70 per share. As of February 26, 2015, $133 million remained available to repurchase under this new program.
MBIA Corp. Risk Mitigation
MBIA Corp. has not written a meaningful amount of new business since 2008 as a result of declining financial capacity and ratings downgrades. In addition, since that time it has experienced considerable stress as a result of unprecedented levels of delinquency and loss in its structured finance business, primarily in its residential mortgage-backed securities (“RMBS”), commercial mortgage-backed securities (“CMBS”) pools, commercial real estate (“CRE”) and collateralized debt obligation (“CDO”) portfolios. As a result, since 2008, MBIA Corp.’s strategy has focused on recovering losses on insured RMBS transactions related to the failure of certain RMBS sellers/servicers to honor their contractual obligations to repurchase ineligible mortgage loans from securitizations MBIA Corp. insured, reducing future expected economic losses in the insured portfolio through commutations and other risk mitigation strategies, and managing liquidity.
To date, MBIA has settled the majority of the Company’s claims related to the inclusion of ineligible mortgage loans in insured securitizations, only those against Credit Suisse remain. Since 2008, MBIA Corp. has commuted $94.8 billion of insured exposures, and its insured portfolio has decreased from $331.2 billion as of December 31, 2007 to $55.2 billion as of December 31, 2014. RMBS recoveries and commutation activity are described further under “Note 1: Business Developments and Risks and Uncertainties” in the Notes to Consolidated Financial Statements of MBIA Inc. and Subsidiaries in Part II, Item 8 of this Form 10-K.
2
Table of Contents
Item 1. Business (continued)
Our expected liquidity and capital forecasts for MBIA Insurance Corporation and projected collections of the remaining put-back recoverable and excess spread (the difference between interest inflows on assets and interest outflows on liabilities in our insured RMBS transactions) reflect adequate resources to pay expected claims. However, there are risks to these forecasts, as recoveries from the projected collections of excess spread and the remaining put-back recoverable, and the amount and timing of potential claims from our remaining insured exposures, are potentially volatile. While we believe MBIA Insurance Corporation will have adequate resources to pay expected policy liabilities, if MBIA Corp. experiences higher than expected claim payments or is unable to collect expected recoveries, MBIA Corp. may ultimately have insufficient resources to continue to pay claims, which could cause the NYSDFS to put MBIA Insurance Corporation into a rehabilitation or liquidation proceeding. We do not believe that a rehabilitation or liquidation proceeding of MBIA Insurance Corporation by the NYSDFS would have any significant long-term liquidity impact on MBIA Inc. or result in a liquidation or similar proceeding of MBIA UK. Furthermore, as noted above, we do not expect MBIA Insurance Corporation to have sufficient resources to pay the aggregate amount of accrued and unpaid interest and the outstanding principal amount of the Surplus Notes, if the notes remain outstanding through their maturity in 2033. For a further discussion of MBIA Corp.’s insurance statutory capital see “Management’s Discussion and Analysis of Financial Condition and Results of Operations—Capital Resources” in Part II, Item 7 of this Form 10-K.
OUR INSURANCE OPERATIONS
Our U.S. public finance insurance business is conducted through National, and our international and structured finance insurance portfolios are managed through MBIA Corp. We anticipate that for the foreseeable future virtually all of our new insurance business will be written through National in the U.S. public finance sector. We expect the credit ratings of MBIA Insurance Corporation and its subsidiaries will continue to constrain its ability to write new business in the foreseeable future.
We are compensated for our insurance policies by insurance premiums paid upfront or on an installment basis. Our financial guarantee insurance is offered in both the new issue and secondary markets. Transactions in the new issue market may be sold either through negotiated offerings or competitive bidding. We also issue insurance policies to guarantee the payment of principal and interest on municipal obligations being traded in the secondary market upon the request of a broker or an existing holder of uninsured bonds, where the premium is generally paid by the owner of the obligation. In addition, we have provided financial guarantees or sureties to debt service reserve funds. The primary risk in our insurance operations is that of adverse credit performance in the insured portfolio. We seek to maintain a diversified insured portfolio and have insured transactions with the aim of managing and diversifying risk based on a variety of criteria including revenue source, issue size, type of asset, industry concentrations, type of bond and geographic area. Despite this objective, there can be no assurance that we will avoid losses on multiple credits as a result of a single event or series of events.
Because we generally guarantee to the holder of an underlying obligation the timely payment of amounts due on the obligation in accordance with its original payment schedule, in the case of a default or other triggering event on an insured obligation, payments under the insurance policy generally cannot be accelerated against us unless we consent to the acceleration. In the event of a default, however, we may have the right, in our sole discretion, to accelerate the obligations and pay them in full. Otherwise, we are required to pay principal, interest or other amounts only as scheduled payments come due, even if the holders are permitted by the terms of the insured obligations to have the full amount of principal, accrued interest or other amounts due, declared due and payable immediately in the event of a default.
Our payment obligations after a default vary by deal and by insurance type. Our public finance insurance generally insures scheduled interest and principal. Our structured finance policies generally insure (i) timely interest and ultimate principal; (ii) ultimate principal only at final maturity; or, (iii) payments upon settlement of individual collateral losses as they occur after any deductible or subordination has been exhausted. With respect to the insurance of credit default swap (“CDS”) contracts written in the international and structured finance insurance segment, in certain circumstances, including the occurrence of certain insolvency or payment defaults under the CDS contracts, the CDS contracts may be subject to termination by the counterparty, triggering a claim for the fair value of the contract.
3
Table of Contents
Item 1. Business (continued)
In the event of a default in payment of principal, interest or other insured amounts by an issuer, the insurance company promises to make funds available in the insured amount generally within one to three business days following notification. Longer timeframes may apply for international transactions. Generally, our insurance companies provide for this payment upon receipt of proof of ownership of the obligations due, as well as upon receipt of instruments appointing the insurer as agent for the holders and evidencing the assignment of the rights of the holders with respect to the payments made by the insurer or other appropriate documentation.
National Insured Portfolio
National’s insurance portfolio consists of municipal bonds, including tax-exempt and taxable indebtedness of U.S. political subdivisions, as well as utility districts, airports, health care institutions, higher educational facilities, student loan issuers, housing authorities and other similar agencies and obligations issued by private entities that finance projects that serve a substantial public purpose. Municipal bonds and privately issued bonds used for the financing of public purpose projects are generally supported by taxes, assessments, user fees or tariffs related to the use of these projects, lease payments or other similar types of revenue streams.
National’s portfolio is primarily comprised of (i) MBIA Corp.’s U.S. public finance financial guarantee policies ceded by MBIA Corp. to National pursuant to the Quota Share Reinsurance Agreement, effective January 1, 2009 (the “MBIA Corp. Reinsurance Agreement”), executed in connection with Transformation, and (ii) certain public finance financial guarantee policies of Financial Guaranty Insurance Company (“FGIC”) which were originally reinsured by MBIA Corp. pursuant to the FGIC Reinsurance Agreement, subsequently assigned to and reinsured by National in connection with Transformation, and ultimately novated to National pursuant to a novation agreement between National and FGIC effective August of 2013 (the “FGIC Novation Agreement”).
Portfolio Profile
As of December 31, 2014, National had $222.3 billion of insured gross par outstanding on U.S. public finance obligations covering 11,121 policies and diversified among 5,648 “credits,” which we define as any group of issues supported by the same revenue source. Insurance in force, which includes all insured debt service, as of December 31, 2014 was $361.6 billion.
All of the policies were underwritten on the assumption that the insurance will remain in force until maturity of the insured obligations. National estimates that the average life of its domestic public finance insurance policies in force as of December 31, 2014 was 10 years. The average life was determined by applying a weighted average calculation, using the remaining years to contractual maturity and weighting them on the basis of the remaining debt service insured. No assumptions were made for any future refundings, early redemptions or terminations of insured issues. Average annual insured debt service on the portfolio as of December 31, 2014 was $21.5 billion.
4
Table of Contents
Item 1. Business (continued)
The table below shows the diversification by type of U.S. public finance insurance that was outstanding as of December 31, 2014:
National U.S. Public Finance Gross Par Amount Outstanding by Bond Type as of December 31, 2014
| In millions |
Gross Par Amount |
|||
| Bond Type |
||||
| Public finance: United States |
||||
| General fund obligation |
$ | 79,995 | ||
| General fund obligation—Lease |
18,935 | |||
| Municipal utilities |
39,245 | |||
| Tax backed |
30,294 | |||
| Transportation |
20,874 | |||
| Health care |
5,123 | |||
| Higher education |
12,790 | |||
| Municipal housing |
2,331 | |||
| Military housing |
7,776 | |||
| Investor-owned utilities |
3,653 | |||
| Other |
1,277 | |||
|
|
|
|||
| Total United States—public finance |
$ | 222,293 | ||
|
|
|
|||
National’s underwriting guidelines limit the insurance in force for any one insured credit, and for other categories such as geography. In addition, National is subject to regulatory single-risk limits and its ratings are subject to rating agency single-risk limits with respect to any insured bond issue. See the “Insurance Regulation” section below for a description of these regulatory requirements. As of December 31, 2014, National’s gross par amount outstanding for its ten largest insured U.S. public finance credits totaled $14.6 billion, representing 6.6% of National’s total U.S. public finance gross par amount outstanding.
MBIA Corp. Insured Portfolio
MBIA Corp.’s insured portfolio consists of policies that insure various types of structured finance and international public finance obligations that were sold in the new issue and secondary markets. These obligations include bonds and loans used for the financing of projects or other entities located outside of the U.S.; obligations of sovereign-related and sub-sovereign issuers, such as regions, departments or their equivalent in each jurisdiction as well as sovereign owned entities that are generally supported by a sovereign state, region or department; and structured finance and asset-backed obligations, which are typically secured by undivided interests or collateralized by the related assets or, in the case of certain CDS transactions, reference the underlying assets. Certain policies include payments due under CDS and other derivatives, including termination payments that may become due in certain circumstances, including the occurrence of certain insolvency or payment defaults under the CDS contracts. The inclusion of a large number of ineligible mortgage loans in MBIA Corp.-insured RMBS transactions has caused, and may continue to cause, material losses beyond any stress analyses undertaken at origination; and payments due under credit and other derivatives. At the current time we do not insure any direct sovereign debt.
As of December 31, 2014, MBIA Corp. had 590 policies outstanding in its insured portfolio. In addition, MBIA Corp. had 139 insurance policies outstanding relating to liabilities issued by MBIA Inc. and its subsidiaries, which are described further under the section “Other Financial Obligations” below. MBIA Corp.’s total policies are diversified among 379 “credits,” which we define as any group of issues supported by the same revenue source.
Portfolio Profile
As of December 31, 2014, the gross par amount outstanding of MBIA Corp.’s insured obligations ((excluding $1.7 billion of MBIA insured investment agreements and medium-term notes (“MTNs”)), and $146.4 billion of U.S. public finance debt ceded to National), was $55.2 billion. Insurance in force for the above portfolio, which includes all insured debt service, as of December 31, 2014 was $76.2 billion.
5
Table of Contents
Item 1. Business (continued)
MBIA Corp. underwrote its policies on the assumption that the insurance would remain in force until maturity of the insured obligations. MBIA Corp. estimates that the average life of its international and structured finance insurance policies in force as of December 31, 2014 was 8.7 years. The average life was determined by applying a calculation using the remaining years to contractual maturity for international public finance obligations and estimated maturity for structured finance obligations and weighting them on the basis of the remaining debt service insured. No assumptions were made for any future refundings, early redemptions or terminations of insured issues. Average annual insured debt service on the portfolio as of December 31, 2014 was $5.7 billion.
The table below shows the diversification by type of insurance that was outstanding as of December 31, 2014:
MBIA Corp. Gross Par Amount Outstanding for the International and Structured Finance
Portfolio by Bond Type as of December 31, 2014(1)
| In millions |
Gross Par Amount |
|||
| Bond Type |
||||
| Public finance: non-United States |
||||
| Sovereign-related and sub-sovereign |
$ | 10,013 | ||
| International utilities |
8,215 | |||
| Transportation |
7,082 | |||
| Local governments(2) |
248 | |||
| Tax backed |
80 | |||
|
|
|
|||
| Total public finance—non-United States |
25,638 | |||
|
|
|
|||
| Global structured finance: |
||||
| Collateralized debt obligations(3) |
13,848 | |||
| Mortgage-backed residential |
7,265 | |||
| Mortgage-backed commercial |
519 | |||
| Consumer asset-backed |
1,262 | |||
| Corporate asset-backed(4) |
6,656 | |||
|
|
|
|||
| Total global structured finance |
29,550 | |||
|
|
|
|||
| Total |
$ | 55,188 | ||
|
|
|
|||
(1)—Excludes $1.7 billion relating to investment agreements and MTNs issued by affiliates of the Company and are guaranteed by MBIA Corp.
(2)—Includes municipal-owned entities backed by the sponsoring local government.
(3)—Includes transactions (represented by structured pools of primarily investment grade corporate credit risks, CMBS or other CRE assets) that may not include typical CDO structuring characteristics, such as tranched credit risk, cash flow waterfalls, or interest and over-collateralization coverage tests.
(4)—Includes $3.4 billion of structured insurance securitizations.
MBIA Corp. is subject to regulatory single-risk limits. See the “Insurance Regulation” section below. As of December 31, 2014, MBIA Corp.’s gross par amount outstanding for its ten largest non-U.S. public finance credits insured totaled $12.3 billion, representing 22.2% of MBIA Corp.’s total international and structured finance gross par amount outstanding, and the gross par outstanding for its ten largest structured finance credits (without aggregating issues of common issuers), was $12.4 billion, representing 22.4% of the total.
Other MBIA Inc. Financial Obligations
Prior to 2008 MBIA Inc. and its subsidiaries raised funds for investment through the issuance of customized investment agreements by MBIA Inc. and one of its subsidiaries and the issuance of MTNs with varying maturities issued by our subsidiary, GFL. Each of these obligations is guaranteed by MBIA Corp. GFL lent the proceeds of its GFL MTN issuances to MBIA Inc. (“GFL Loans”). As a result of ratings downgrades of MBIA Corp. MBIA Inc. is required to post collateral for the remaining investment agreements. Since the ratings downgrades of MBIA Corp. that began in 2008, we have not issued MTN’s or investment agreements in connection with this activity. The investment agreements are currently fully collateralized with high quality assets. We believe the outstanding investment agreements and MTN’s and corresponding asset balances will continue to decline over time as the liabilities mature, terminate, or are repurchased by the Company.
6
Table of Contents
Item 1. Business (continued)
Risk Management
Our largest risk is the credit exposure in our insured portfolio. MBIA’s credit risk management and remediation functions are comprised of different committees and units that oversee risks at transaction origination and in ongoing portfolio monitoring, surveillance and remediation. MBIA’s Insured Portfolio Management Division monitors and remediates structured finance and international infrastructure risks while National’s surveillance group performs this function with respect to U.S. public finance transactions. A Restructuring and Remediation Group is responsible for certain transactions that require intensive remediation. National, MBIA Corp. and MBIA UK each have a risk committee to review certain prescribed underwriting decisions. On an enterprise-wide basis, several executive committees provide risk oversight.
The Company’s Risk Oversight Committee (the “Risk Oversight Committee”) reviews transactions not otherwise reviewable by the subsidiary risk committees, firm-wide risk review, policies and decisions related to credit, market, operational, legal, financial and business risks; the Loss Reserve Committees review reserve activity; and the Investment Committees review specific transactions and portfolios.
The Board of Directors and its Committees oversee risks faced by the Company and its subsidiaries. The Board regularly evaluates and discusses risks associated with strategic initiatives. On an annual basis, the Board also evaluates and approves the Company’s risk tolerance guidelines. The purpose of the risk tolerance guidelines is to delineate the types and amounts of risks the Company is prepared to accept. This policy provides the basis upon which risk criteria and procedures are developed and applied consistently across the Company. The Board’s Audit Committee and its Finance and Risk Committee play an important role in overseeing different types of risks.
The Audit Committee oversees risks associated with financial and other reporting, auditing, legal and regulatory compliance, and risks that may otherwise result from the Company’s operations. The Audit Committee oversees these risks by monitoring (i) the integrity of the financial statements of the Company and of other material financial disclosures made by the Company, (ii) the qualifications and independence of the Company’s independent auditor, (iii) the performance of the Company’s internal audit function and independent auditor, (iv) the Company’s compliance policies and procedures and its compliance with legal and regulatory requirements and (v) the performance of the Company’s operational risk management function.
The Finance and Risk Committee oversees the Company’s credit risk governance framework, market risk, liquidity risk and other material financial risks. The Finance and Risk Committee oversees these risks by monitoring the Company’s: (i) proprietary investment portfolios, (ii) capital and liquidity, (iii) exposure to changes in the market value of assets and liabilities, (iv) credit exposures in the Insured Portfolios and (v) financial risk policies and procedures, including regulatory requirements and limits.
The Company’s Risk Oversight Committee has designated a Models Governance Team. Given the significance of models in the Company’s insurance underwriting, surveillance and financial reporting operations, corporate treasury operations, among other activities, the Company has established a Models Risk Governance Policy to enhance the reliability, maintainability and transparency of its models so that models risk can be mitigated on an enterprise-wide basis. The Models Governance Team is responsible for the Models Governance policy as well as other Models Governance related initiatives.
At each regular meeting of the Board, the Chairs of each of these committees report to the full Board regarding the meetings and activities of their respective committees.
7
Table of Contents
Item 1. Business (continued)
Insurance, Monitoring and Remediation
We monitor and remediate our existing insured portfolios on an ongoing basis. Although our monitoring and remediation activities vary somewhat by sector and bond type, in all cases we focus on assessing event risk and possible losses under stress.
| • | U.S. Public Finance: For U.S. public finance, our underwriting at origination and ongoing monitoring focuses on economic and political trends, issuer or project debt and financial management, construction and start up risk, adequacy of historical and anticipated cash flows under stress, satisfactory legal structure and bond security provisions, viable tax and economic bases, including consideration of tax limitations and unemployment trends, adequacy of stressed loss coverage and project feasibility, including satisfactory reports from consulting engineers, traffic advisors and others, if applicable. Depending on the transaction, specialized cash flow analyses may be conducted to understand loss sensitivity. In addition, specialized credit analysts consider the potential event risk of natural disasters or headline events on both single transactions and across a sector, as well as regulatory issues. U.S. public finance transactions are monitored by reviewing trustee, issuer and project financial and operating reports as well as reports provided by technical advisors and counsel. Projects may be periodically visited by National personnel. |
| • | International Public Finance: International public finance transactions are monitored and remediated in a manner relatively consistent with U.S. public finance transactions. In addition, credit analysts consider country risk, including economic and political factors, the type and quality of local regulatory oversight, the strength of the legal framework in each country and the stability of the local institutional framework. Analysts also monitor local accounting and legal requirements, local financial market developments, the impact of exchange rates and local demand dynamics. Furthermore, exposures are reviewed periodically; the frequency and scope of review is often increased when an exposure is downgraded. MBIA personnel may periodically visit projects or issuers to meet with management. |
| • | Structured Finance Transactions: For structured transactions, we focus on the historical and projected cash flows generated by the assets, the credit and operational strength of the originator, servicer, manager and/or operator of the assets, and the nature of the transaction’s structure (including the degree of protection from bankruptcy of the originator or servicer). We may use both probability modeling and cash flow sensitivity analysis (both at the transaction and asset specific levels) to test asset performance assumptions and performance covenants, triggers and remedies. In addition, the Insured Portfolio Management Division may use various quantitative tools and qualitative analyses to test for credit quality, correlation, liquidity and capital sensitivity within the insured portfolio. |
Key to our ongoing monitoring is early detection of deterioration in either transaction credit quality or macroeconomic or market factors that could adversely impact an insured credit. If deterioration is detected, analysts generally evaluate possible remedial actions and, in the event of significant stress, we may involve a dedicated workout unit, the Restructuring and Remediation Group, to assess and monitor the credit and, if necessary, help develop and implement a remediation strategy. The nature of any remedial action is based on the type of insured issue and the nature and scope of the event giving rise to the remediation. In most cases, as part of any such remedial activity, we work with the issuer, trustee, legal counsel, financial advisors, servicer, other creditors, underwriters and/or other related parties to reduce chances of default and the potential severity of loss if a default should occur.
We use an internal credit rating system to monitor credits, with frequency of review based on risk type, internal rating, performance and credit quality. Credits with performance issues are designated as “Caution List-Low,” “Caution List-Medium” or “Caution List-High” based on the nature and extent of our concerns, but these categories do not require establishment of any case basis reserves. In the event we determine that a claim for payment is expected with respect to an insured issue using probability-weighted expected cash flows based on available information, including market data, we place the issue on the “Classified List” and establish a case basis reserve for that insured issue. See “Losses and Reserves” below for information on our loss reserving process.
8
Table of Contents
Item 1. Business (continued)
Credit Risk Models
We use credit risk models to test qualitative judgments, to design appropriate structures and to understand sensitivity within transactions and across broader portfolio exposure concentrations. Models are updated to reflect changes in both portfolio and transaction data and also in expectations of stressed future outcomes. For portfolio monitoring we use internal and third-party models based on individual transaction attributes and customized structures and these models are also used to determine case basis loss reserves and, where applicable, to mark-to-market any insured obligations as may be required for financial reporting. When using third-party models, we generally perform the same review and analyses of the collateral, transaction structure, performance triggers and cash flow waterfalls as when using our internal models. See “Risk Factors—Insured Portfolio Loss Related Risk Factors—Financial modeling contains uncertainty over ultimate outcomes which makes it difficult to estimate liquidity, potential paid claims, loss reserves and mark-to-market” in Part I, Item 1A of this Form 10-K.
Market Risk Assessment
We measure and assess market risk on a consolidated basis and in our operating subsidiaries. Key market risks are changes in interest rates, credit spreads and foreign exchange. We use various models and methodologies to test economic exposure under market stress scenarios, including parallel and non-parallel shifts in the yield curve, changes in credit spreads, stressed liquidity scenarios and stressed counterparty exposures. The analyses are used in testing investment portfolio guidelines. The Risk Oversight Committee and the Finance and Risk Committee of the Company’s Board of Directors receive periodic reports on market risk.
Operational Risk Assessment
The Operational Risk function assesses potential economic loss or reputational impact arising from processes and controls, systems, or staff actions and seeks to identify vulnerabilities to operational disruptions caused by external events. The Operational Risk framework is generally managed using a self-assessment process across our business units, with controls associated with the execution of key processes monitored through Internal Audit reviews. The Operational Risk function reports periodically to the Risk Oversight Committee and the Audit Committee of the Company’s Board of Directors. The Audit Committee reviews the Company’s operational risk profile, risk event activity and ongoing risk mitigation efforts.
Losses and Reserves
Loss and loss adjustment expense (“LAE”) reserves are established by Loss Reserve Committees in each of our major operating insurance companies (National, MBIA Corp. and MBIA UK) and are reviewed by our executive Loss Reserve Committee, which consists of members of senior management. The Company’s loss and LAE reserves as of December 31, 2014 represent case basis reserves and accruals for LAE incurred. Case basis reserves represent the Company’s estimate of expected losses to be paid under an insurance contract, net of potential recoveries and discounted using a current risk-free interest rate, when this amount exceeds unearned premium revenue on the related insurance contract. The Company estimates expected losses net of potential recoveries using the present value of probability-weighted estimated loss payments and recoveries, discounted at a rate equal to the risk-free rate applicable to the currency and weighted average remaining life of the insurance contract as required by accounting principles for financial guarantee contracts. We record case basis loss reserves on insured obligations which have defaulted or are expected to default.
For a further discussion of the methodology used by the Company for determining when a case basis reserve is established, see “Management’s Discussion and Analysis of Financial Condition and Results of Operations—Critical Accounting Estimates—Loss and Loss Adjustment Expense Reserves” in Part II, Item 7 of this Form 10-K. Management believes that our reserves are adequate to cover the ultimate net cost of claims. However, because the reserves are based on management’s judgment and estimates, there can be no assurance that the ultimate liability will not exceed such estimates or that the timing of claims payments and the realization of recoveries will not create liquidity issues for the corresponding insurance company.
9
Table of Contents
Item 1. Business (continued)
Reinsurance
We currently have third-party reinsurance agreements in place covering 2% of our insured par outstanding. At this time we do not intend to utilize reinsurance to a material degree to decrease the insured exposure in our portfolio or increase our capacity to write new business; however, we may, from time to time, look to enter into transactions to reduce risks embedded in our insured portfolios on an individual and portfolio-wide basis.
Intercompany Reinsurance Arrangements
Under the Transformation, MBIA Corp. and National entered into the MBIA Corp. Reinsurance Agreement as well as an assignment agreement under which MBIA Corp. assigned its rights and obligations under the FGIC Reinsurance Agreement. In addition, National entered into second-to-pay policies covering the policies covered by each of these agreements. The FGIC Reinsurance Agreement was terminated in 2013 in connection with the novation of the policies covered by the FGIC Reinsurance Agreement to National pursuant to the FGIC Novation Agreement. Each of these transactions and the terms of those documents are further described under the “Our Insurance Operations—National Insured Portfolio” section above.
MBIA Insurance Corporation has entered into a reinsurance agreement with MBIA UK providing for MBIA Insurance Corporation’s reimbursement of the losses incurred by MBIA UK in excess of a specified threshold in each calendar year, subject to certain contract limitations, and a net worth maintenance agreement in which MBIA Insurance Corporation agrees to maintain a minimum capital and surplus position at MBIA UK at the greater of a specified amount or the amount required by U.K. regulations, subject to certain New York State regulatory requirements as well as certain contract restrictions. MBIA Insurance Corporation has also entered into a reinsurance agreement and net worth maintenance agreement with MBIA Mexico pursuant to which MBIA Insurance Corporation reinsures 100% of the business underwritten by MBIA Mexico and agrees to maintain the amount of capital in MBIA Mexico required by applicable law or regulation, subject to certain New York State regulatory requirements as well as certain contract restrictions.
Insurance Regulation
National and MBIA Insurance Corporation are incorporated and subject to primary insurance regulation and supervision by the State of New York. MBIA UK and MBIA Mexico are organized and subject to primary regulation and supervision in the U.K. and Mexico, respectively. MBIA UK is authorized by the Prudential Regulation Authority (“PRA”) and regulated by the Financial Conduct Authority (“FCA”) and the PRA in the U.K. The Company’s insurance subsidiaries are also licensed to issue financial guarantee policies in multiple jurisdictions as needed to conduct their business activities. During 2013, MBIA UK was placed in run-off and varied its scope of permissions such that it is no longer authorized to write new financial guarantee business. It also filed a related scheme of operations with the PRA and the FCA, which they have approved.
The extent of state and national insurance regulation and supervision varies by jurisdiction, but New York, the U.K., Mexico and most other jurisdictions have laws and regulations prescribing minimum standards of solvency, including minimum capital requirements, and business conduct which must be maintained by insurance companies, and if our insurance companies fail to meet such requirements our regulators may impose certain remedial actions on us. These laws prescribe permitted classes and concentrations of investments. In addition, some state laws and regulations require the approval or filing of policy forms and rates. MBIA Insurance Corporation and National each are required to file detailed annual financial statements with the NYSDFS and similar supervisory agencies in each of the other jurisdictions in which it is licensed. MBIA UK makes similar filings with the PRA and the FCA. The operations and accounts of the insurance companies are subject to examination by these regulatory agencies at regular intervals. In addition to being subject to the insurance laws in the jurisdictions in which we operate, as a condition to obtaining required insurance regulatory approvals to enter into certain transactions and take certain other corporate actions, including the release of excessive contingency reserves in MBIA Insurance Corporation described below under “Contingency Reserves” and entry into the asset swap between MBIA Inc. and National described under “Management’s Discussion and Analysis of Financial Condition and Results of Operations—Liquidity—MBIA Inc. Liquidity” in Part II, Item 7 of this Form 10-K, MBIA Inc. and its insurance subsidiaries have and may in the future agree to provide notice to the NYSDFS or other applicable regulators prior to entering into transactions or taking other corporate actions (such as paying dividends when applicable statutory tests are satisfied) that would not otherwise require regulatory approval.
10
Table of Contents
Item 1. Business (continued)
New York Insurance Regulation
Our domestic insurance companies are licensed to provide financial guarantee insurance under Article 69 of the New York Insurance Law (the “NYIL”). Article 69 defines financial guarantee insurance to include any guarantee under which loss is payable upon proof of occurrence of financial loss to an insured as a result of certain events. These events include the failure of any obligor or any issuer of any debt instrument or other monetary obligation to pay principal, interest, premium, dividend or purchase price of or on such instrument or obligation when due. Under Article 69, our domestic insurance companies are permitted to transact financial guarantee insurance, surety insurance and credit insurance and such other kinds of business to the extent necessarily or properly incidental to the kinds of insurance which they are authorized to transact. In addition, they are empowered to assume or reinsure the kinds of insurance described above. Since 2009, both the NYSDFS and the New York legislature have proposed enhanced regulation of financial guarantee insurers which would impose limits on the manner and amount of business written by the Company. The timing of any amendments to the statutes or regulations governing financial guarantee insurers is uncertain.
New York State Dividend Limitations
The laws of New York regulate the payment of dividends by National and MBIA Corp. and provide that a New York domestic stock property/casualty insurance company may not declare or distribute dividends except out of statutory earned surplus. New York law provides that the sum of (i) the amount of dividends declared or distributed during the preceding 12-month period and (ii) the dividend to be declared may not exceed the lesser of (a) 10% of policyholders’ surplus, as shown by the most recent statutory financial statement on file with the NYSDFS, or (b) 100% of adjusted net investment income for such 12-month period (the net investment income for such 12-month period plus the excess, if any, of net investment income over dividends declared or distributed during the two-year period preceding such 12-month period), unless the New York Superintendent of Insurance approves a greater dividend distribution based upon a finding that the insurer will retain sufficient surplus to support its obligations and writings.
National declared and paid a dividend of $220 million to its ultimate parent, MBIA Inc., in the fourth quarter of 2014 following notice to the NYSDFS. As a condition to the NYSDFS’ approval of the Asset Swap between MBIA Inc. and National, the NYSDFS requested that, until the notional amount of the Asset Swap has been reduced to 5% or less of National’s admitted assets, each of MBIA Inc., MBIA Corp. and National provide the NYSDFS with three months prior notice, or such shorter period as the NYSDFS may permit, of its intent to initiate cash dividends on shares of its common stock.
Due to its significant negative earned surplus, MBIA Corp. has not had the statutory capacity to pay dividends since December 31, 2009 and is not expected to have any statutory capacity to pay any dividends for the foreseeable future. In connection with MBIA Corp. obtaining approval from the NYSDFS to release excessive contingency reserves as of September 30, 2011, December 31, 2011 and March 31, 2012, MBIA Corp. agreed that it would not pay any dividends without prior approval from the NYSDFS.
The foregoing dividend limitations are determined in accordance with statutory accounting principles (“U.S. STAT”), which generally produce statutory earnings in amounts less than earnings computed in accordance with accounting principles generally accepted in the U.S. (“GAAP”). Similarly, policyholders’ surplus, computed on a U.S. STAT basis, will normally be less than net worth computed on a GAAP basis.
Dividend limitations on MBIA UK
MBIA UK’s investment portfolio accounts for over 50% of MBIA Corp.’s investment portfolio as of December 31, 2014. MBIA UK is currently in run-off and would require prior approval from the PRA to pay dividends to MBIA Insurance Corporation. There is no certainty such approval will be given for the foreseeable future.
11
Table of Contents
Item 1. Business (continued)
Contingency Reserves
As financial guarantee insurers, our domestic insurance companies are required by the laws and regulations of New York, California, Connecticut, Florida, Illinois, Iowa, Maryland, New Jersey and Wisconsin to maintain, as applicable, contingency reserves on their municipal bond, asset-backed securities (“ABS”) or other financial guarantee liabilities. Under New Jersey, Illinois and Wisconsin regulations, contributions by an insurance company to its contingency reserves are required to equal 50% of earned premiums on its municipal bond business. Under New York law, a financial guarantee insurance company is required to contribute to contingency reserves 50% of premiums as they are earned on policies written prior to July 1, 1989 (net of reinsurance), and, with respect to policies written on and after July 1, 1989, such an insurer must make contributions over a period of 15 or 20 years (based on issue type), or until the contingency reserve for such insured issues equals the greater of 50% of premiums written for the relevant category of insurance or a percentage of the principal guaranteed, varying from 0.6% to 2.5%, depending upon the type of obligation guaranteed (net of collateral, reinsurance, refunding, refinancings and certain insured securities). California, Connecticut, Florida, Iowa and Maryland laws impose a generally similar requirement, and in California the insurance commissioner can require an insurer to maintain additional reserves if the commissioner determines that the insurer’s reserves are inadequate. The contribution to, and maintenance of, the contingency reserve limit the amount of earned surplus that might otherwise be available for the payment of dividends. In each of these states, our domestic insurance companies may apply for release of portions of their contingency reserves in certain circumstances.
Risk Limits
Insurance laws and regulations also limit both the aggregate and individual securities risks that our domestic insurance companies may insure on a net basis based on the type of obligations insured. The individual limits are generally on the amount of insured par and/or annual debt service for a given insured issue, entity or revenues source and stated as a percentage of the insurer’s policyholders’ surplus and contingency reserves. The aggregate risk limits limit the aggregate amount of insured par to a stated multiple of the insurer’s policyholders’ surplus and contingency reserves based on the types of obligations insured. The aggregate risk limits can range from 300:1 for certain municipal obligations to 50:1 for certain non-municipal obligations.
Currently, National is in compliance with the aggregate risk limits and has one single risk limit overage. In 2014 and 2013, MBIA Corp. reported single risk limit overages to the NYSDFS due to changes in its statutory capital. In addition, MBIA Corp. currently exceeds its aggregate risk limit as of December 31, 2013. MBIA Corp. notified the NYSDFS of the overages and submitted a plan to achieve compliance with the limits in accordance with the NYIL. If MBIA Corp. is not in compliance with its aggregate risk limits, the NYSDFS may prevent MBIA Corp. from transacting any new financial guarantee insurance business until it no longer exceeds the limitations.
Holding Company Regulation
MBIA Inc., National and MBIA Corp. also are subject to regulation under the insurance holding company statutes of New York. The requirements of holding company statutes vary from jurisdiction to jurisdiction but generally require insurance companies that are part of an insurance holding company system to register and file certain reports describing, among other information, their capital structure, ownership and financial condition. The holding company statutes also generally require prior approval of changes in control, of certain dividends and other inter-corporate transfers of assets, and of certain transactions between insurance companies, their parents and affiliates. The holding company statutes impose standards on certain transactions with related companies, which include, among other requirements, that all transactions be fair and reasonable and those transactions not in the ordinary course of business exceeding specified limits receive prior regulatory approval.
12
Table of Contents
Item 1. Business (continued)
Change of Control
Prior approval by the NYSDFS is required for any entity seeking to acquire, directly or indirectly, “control” of National or MBIA Corp. In many states, including New York, “control” is presumed to exist if 10% or more of the voting securities of the insurer are owned or controlled, directly or indirectly, by an entity, although the insurance regulator may find that “control” in fact does or does not exist when an entity owns or controls either a lesser or greater amount of securities. The PRA also has a requirement for prior approval of changes to any controlling person of MBIA Inc., MBIA Insurance Corporation or MBIA UK. MBIA Corp. would require the prior approval of MBIA Mexico’s regulator in order to transfer the shares it currently holds in MBIA Mexico. To the Company’s knowledge, each MBIA Inc. shareholder who owns 10% or more of MBIA Inc.’s outstanding common stock as of December 31, 2014 has received appropriate approvals or determinations of non-control in connection with its investment.
Insurance Guarantee Funds
National and MBIA Corp. are exempt from assessments by the insurance guarantee funds in the majority of the states in which they do business. Guarantee fund laws in most states require insurers transacting business in the state to participate in guarantee associations, which pay claims of policyholders and third-party claimants against impaired or insolvent insurance companies doing business in the state. In most states, insurers licensed to write only municipal bond insurance, financial guarantee insurance and other forms of surety insurance are exempt from assessment by these funds and their policyholders are prohibited from making claims on these funds.
Insured Credit Default Swaps
Certain of our insurance policies guarantee payments due under CDS and other derivatives. In July of 2010, the Dodd-Frank Reform and Consumer Protection Act (the “Dodd-Frank Act”) was signed into law for the purpose of enacting broad financial industry regulatory reform, including by enhancing regulation of the over-the-counter derivatives markets. Among other reforms, the Dodd-Frank Act requires “swap dealers” and “major swap participants” to register with either or both of the Commodity Futures Trading Commission (“CFTC”) and the Securities and Exchange Commission (“SEC”), and to be subject to enhanced regulation, including capital requirements. MBIA Corp. registered with the CFTC as a major swap participant and on an ongoing basis is required to comply with the CFTC’s business conduct rules as applied to portfolios in place prior to the enactment of the Dodd-Frank Act. We expect MBIA Corp. will de-register as a major swap participant in 2015 as the notional amount and fair value of its CDS exposures have declined below the registration thresholds. The CFTC and SEC have promulgated rules to implement this enhanced regulatory framework, including final rules that require the Company to include its legacy insured derivatives in tests used to determine whether it is a major swap participant.
OUR ADVISORY SERVICES
Until January of 2015, we conducted our asset management advisory services business through two registered investment adviser subsidiaries of Cutwater Holdings, LLC (together, “Cutwater”), a wholly-owned subsidiary of MBIA Inc. The Company had $21.3 billion in institutional assets under management as of December 31, 2014, including $10.1 billion from the Company and its subsidiaries. Effective January 1, 2015, we completed the sale of Cutwater to the Bank of New York Mellon Corporation. This transaction had a positive but immaterial impact on the Company’s financial position and results of operations. In connection with the sale, the Company and its subsidiaries entered into investment management agreements for Cutwater to manage their respective fixed-income investment portfolios for the next five years.
Other Advisory Services
In 2014, we exited the advisory and asset management services business in the European Union.
13
Table of Contents
Item 1. Business (continued)
OUR CONDUIT BUSINESS
In 2014, our conduit segment was operated primarily through Meridian. Meridian was used by banks and other financial institutions to raise funds through MTN issuances. The proceeds from these issuances were used to either make loans to customers that were secured by certain assets or to purchase assets from customers. During 2014, we retired Meridian’s remaining $129 million outstanding MTNs, and completed the liquidation of Meridian.
INVESTMENTS AND INVESTMENT POLICY
Investment objectives, policies and guidelines related to the Company’s businesses are generally subject to review and approval by the Finance and Risk Committee of the Board of Directors. Investment objectives, policies and guidelines related to investment activity on behalf of our insurance companies are also subject to review by the respective Investment Committee of their Boards of Directors or similar body.
Cutwater manages the proprietary investment portfolios of the Company and its subsidiaries in accordance with the guidelines adopted for each such portfolio. In connection with the sale of Cutwater, the Company and its subsidiaries entered into investment management agreements with Cutwater (the “Cutwater Agreements”). The Cutwater Agreements provide generally that Cutwater will have the exclusive right to manage the fixed-income investment portfolios of the company and its subsidiaries for a period of five years and guarantee certain minimum revenues thereunder. The Cutwater Agreements are subject to early termination under certain conditions including if certain performance objectives are not met.
To continue to optimize capital resources and provide for claims-paying capabilities, the investment objectives and policies of our insurance operations are tailored to reflect their various strategies and operating conditions. The investment objectives of MBIA Corp. are primarily to maintain adequate liquidity to meet claims-paying and other corporate needs and secondarily to maximize after-tax income within defined investment risk limits. The investment objectives of National set preservation of capital as the primary objective, subject to an appropriate degree of liquidity, and optimization of after-tax income and total return as secondary objectives. The investment objectives of the corporate segment are to provide sufficient liquidity to meet maturing liabilities and, in the case of the investment agreement business collateral posting obligations, while maximizing the net residual value of assets to liabilities in each program. The investment portfolio of each subsidiary is managed by Cutwater under separate investment services agreements.
COMPETITION
National competes with other monoline insurance companies, as well as other forms of credit enhancement, in writing financial guarantee business. We anticipate that for the foreseeable future virtually all of our new insurance business will be written through National in the U.S. public finance sector.
Our ability to attract and compete for U.S. public finance financial guarantee business is largely dependent on the financial strength ratings assigned to National by the major rating agencies. See “Rating Agencies” below for information on the Company’s current financial strength ratings.
There are currently two other bond insurers actively engaged in the U.S. public finance insurance market. We have observed significant competition for business between these financial guarantors, and as a result opportunities to write new business with attractive returns have been limited. In addition, National’s absence from the municipal market for several years and the need to rebuild National’s name recognition has also affected its ability to write new business. We expect the impact of this factor on National’s ability to attract new business to decline as National writes more new business. In addition, the percentage of new public finance issuances with a financial guarantee has decreased significantly since the financial crisis, and the inability of financial guarantee insurers to maintain or achieve high ratings could diminish acceptance of the product and enhance the appeal of other forms of credit enhancement.
14
Table of Contents
Item 1. Business (continued)
Financial guarantee insurance competes with other forms of credit enhancement. Commercial banks provide letters of credit as a means of credit enhancement for municipal securities. In 2014, the use of letters of credit as an alternative to financial guarantee insurance within the U.S. municipal market was far below its peak in 2009; however, letters of credit have remained a presence in the market. Direct lending by banks to municipal issuers also reduces demand for credit enhancement. Other highly rated institutions, including pension funds and government sponsored entities, also offer third-party credit enhancement on municipal obligations. Financial guarantee insurance and other forms of credit enhancement also compete in nearly all instances with the issuer’s alternative of foregoing credit enhancement. If the interest savings from insurance or another form of credit enhancement are not greater than the cost of such credit enhancement, the issuer will generally choose to issue bonds without third-party enhancement. All of these alternative forms of credit enhancement or alternative executions could also affect our ability to write new business with attractive returns.
We expect that MBIA Corp.’s credit ratings will continue to constrain its ability to write new business in the foreseeable future. It remains uncertain how or when the Company may re-engage in the international and structured finance insurance markets.
RATING AGENCIES
Rating agencies perform periodic reviews of our insurance companies and other companies providing financial guarantee insurance. In rating financial guarantee companies, rating agencies focus on qualitative and quantitative characteristics in certain key areas, including: (1) franchise value and business strategy; (2) insurance portfolio characteristics; (3) capital adequacy; (4) profitability; (5) financial flexibility; and (6) risk management framework. Each agency has its own ratings criteria for financial guarantors and employs proprietary models to assess our risk adjusted leverage, risk concentrations and financial performance relative to the agency’s standards. The agencies also assess our corporate governance and factor this into their rating assessment. Currently, S&P, Moodys and Kroll rate the Company and its insurance companies.
Our ability to attract and compete for U.S. public finance financial guarantee business is largely dependent on the financial strength ratings assigned to National by the major rating agencies. In 2014, Kroll assigned National a AA+ with a stable outlook insurer financial strength rating. In addition, S&P upgraded National to AA- with a stable outlook and Moodys upgraded National to A3 and subsequently moved its outlook to negative from stable. With these current ratings National seeks to support the credit enhancement needs of municipal debt issuers across the U.S. We expect that the credit ratings of MBIA Insurance Corporation and its subsidiaries will continue to constrain its ability to write new business for the foreseeable future.
There can be no assurance that National will be able to maintain high ratings. The absence of high ratings from S&P, and Moody’s or alternative rating agencies could adversely impact our ability to write new insurance business and the premiums we can charge, and could diminish the future acceptance of our financial guarantee insurance products. See “Risk Factors—Strategic Plan Related Risk Factors—An inability to achieve high stable insurer financial strength ratings for National or to generate investor demand for our financial guarantees may adversely affect our results of operations and business prospects.” in Part I, Item 1A of this Form 10-K.
National’s, MBIA Insurance Corporation’s and MBIA Inc.’s current financial strength ratings from Kroll, S&P and Moody’s and are summarized below:
| Agency | Rating / Outlook | |||||
| National | MBIA Insurance Corporation | MBIA Inc. | ||||
| Kroll |
AA+ / Stable outlook | |||||
| S&P |
AA- / Stable outlook | B / Stable outlook | A-/ Stable outlook | |||
| Moody’s |
A3 / Negative outlook | B2 / Stable outlook | Ba1 / Negative outlook | |||
15
Table of Contents
Item 1. Business (continued)
CAPITAL FACILITIES
The Company does not currently maintain a capital facility. For a discussion of the Company’s capital resources see “Management’s Discussion and Analysis of Financial Condition and Results of Operations—Capital Resources” in Part II, Item 7 of this Form 10-K.
FINANCIAL INFORMATION
For information on the Company’s financial information by segment and premiums earned by geographic location, see “Note 12: Business Segments” in the Notes to Consolidated Financial Statements of MBIA Inc. and Subsidiaries in Part II, Item 8 of this Form 10-K.
EMPLOYEES
As of December 31, 2014, the Company had 252 employees, including 114 in MBIA Services, 37 in National, 16 in MBIA Corp., 72 in Cutwater and 13 in Trifinium Services Limited, our services company in the U.K. Effective with the Cutwater sale on January 1, 2015, the Company had 180 employees. None of the Company’s employees are covered by collective bargaining agreements. The Company considers its employee relations to be satisfactory.
AVAILABLE INFORMATION
The Company maintains a website at www.mbia.com. The Company is not including the information on its website as a part of, nor is it incorporating such information by reference into, this Form 10-K. The Company makes available through its website under the “SEC Filings” tab, free of charge, all of its SEC filings, including annual reports on Form 10-K, quarterly filings on Form 10-Q, current reports on Form 8-K and amendments to those reports as soon as is reasonably practicable after these materials have been filed with or furnished to the SEC.
As a courtesy, the Company posts on its website under the section “Legal Proceedings,” selected information and documents in reference to selected legal proceedings in which the Company is the plaintiff or the defendant. The Company will not necessarily post all documents for each proceeding and undertakes no obligation to revise or update them to reflect changes in events or expectations. The complete official court docket can be publicly accessed by contacting the clerk’s office of the respective court where each litigation matter is pending.
EXECUTIVE OFFICERS OF THE REGISTRANT
The executive officers of the Company and their present ages and positions with the Company as of March 2, 2015 are set forth below:
| Name |
Age | Position and Term of Office | ||
| Joseph W. Brown |
66 | Chief Executive Officer and Director (officer since February 2008) | ||
| C. Edward Chaplin |
58 | President, Chief Financial Officer and Chief Administrative Officer (officer since June 2006) | ||
| William C. Fallon |
55 | President and Chief Operating Officer (officer since July 2005) | ||
| Ram D. Wertheim |
60 | Executive Vice President, Chief Legal Officer and Secretary (officer since January 2000) | ||
| Anthony McKiernan |
45 | Executive Vice President and Chief Portfolio Officer (officer since August 2011) |
16
Table of Contents
Item 1. Business (continued)
Joseph W. Brown is Chief Executive Officer and a director of the Company. Mr. Brown assumed the roles of Chairman, CEO and director in February of 2008 after having retired as Executive Chairman of MBIA in May of 2007. In May of 2009, the Company’s Board of Directors accepted Mr. Brown’s recommendation to separate the roles of Chairman and CEO and elected Daniel P. Kearney as Non-Executive Chairman, with Mr. Brown continuing in the roles of CEO and director. Mr. Brown also serves as Chairman of MBIA Corp. Until May of 2004, Mr. Brown had served as Chairman and CEO of MBIA and MBIA Corp. Mr. Brown originally joined the Company as CEO in January of 1999 after having been a director since 1986, and became Chairman in May of 1999.
Prior to joining MBIA in 1999, Mr. Brown was Chairman and CEO of Talegen Holdings, Inc., an insurance holding company. Before his election as Chairman and CEO of Talegen, Mr. Brown was President and CEO of Fireman’s Fund Insurance Company. Mr. Brown joined Fireman’s Fund in 1974. He held numerous executive positions including Chief Financial Officer at the time of its IPO in 1985 from American Express and President and Chief Operating Officer at the time of its sale to Allianz AG in 1990.
Mr. Brown served on the board of Oxford Health Plans from 2000 to 2004 and on the Board of Fireman’s Fund Holdings prior to the sale of its insurance subsidiary to Allianz. He served on the Safeco Corporation board from 2001 to September of 2008 and was elected Non-executive Chairman in January of 2006.
The Board of Directors of MBIA Inc. appointed Messrs. Chaplin, Fallon and Wertheim to the offices set forth opposite their names above on November 6, 2008 and appointed Mr. McKiernan to the offices set forth opposite his name above on May 1, 2012.
Prior to being named President, Chief Financial Officer and Chief Administrative Officer, C. Edward Chaplin was Vice President and Chief Financial Officer of the Company. Mr. Chaplin also serves as Chief Financial Officer of MBIA Corp. and President, Chief Executive Officer and Chief Administrative Officer of MBIA Services Corporation. Prior to becoming an officer of the Company in June of 2006, Mr. Chaplin had served as a director of the Company from December of 2002 to May of 2006 and as Senior Vice President and Treasurer of Prudential Financial Inc. since November of 2000, responsible for Prudential’s capital and liquidity management, corporate finance, and banking and cash management. Mr. Chaplin had been with Prudential since 1983.
Prior to being named President and Chief Operating Officer, William C. Fallon was Vice President of the Company and head of the Global Structured Finance Division. Mr. Fallon also serves as President and Chief Executive Officer of National. From July of 2005 to March 1, 2007, Mr. Fallon was Vice President of the Company and head of Corporate and Strategic Planning. Prior to joining the Company in 2005, Mr. Fallon was a partner at McKinsey & Company and co-leader of that firm’s Corporate Finance and Strategy Practice.
Prior to being named Executive Vice President, Chief Legal Officer and Secretary, Ram D. Wertheim was Vice President, General Counsel and Secretary of the Company. Mr. Wertheim also serves as General Counsel and Secretary of MBIA Corp. and MBIA Services Corporation. From February of 1998 until January of 2000, he served in various capacities in the Global Structured Finance Division. Mr. Wertheim was, until February of 1998, the General Counsel of CMAC Holdings Inc.
Prior to being named Executive Vice President and Chief Portfolio Officer on May 1, 2012, Anthony McKiernan was appointed Vice President and Chief Portfolio Officer of the Company on August 3, 2011. Mr. McKiernan is also the President, Chief Operating Officer and Chief Risk Officer of MBIA Corp. Mr. McKiernan joined MBIA in 2000 as a vice president in the Credit Analytics Group, and managed the Corporate Insured Portfolio Management Group prior to becoming the Head of the Structured Finance Insured Portfolio Management Group in 2007. Before working at MBIA, Mr. McKiernan was with Fleet Financial Group where he began his career as a Credit Analyst/ Lender in asset-based lending.
References in the risk factors to the “Company” are to MBIA Inc., together with its domestic and international subsidiaries. References to “we,” “our” and “us” are to MBIA Inc. or the Company, as the context requires. Our risk factors are grouped into categories and are presented in the following order: “Insured Portfolio Loss Related Risk Factors”, “Strategic Plan Related and Other Risk Factors”, “Capital, Liquidity and Market Related Risk Factors” and “MBIA Corp. Risk Factors.” Risk factors are listed in order of significance within each category.
17
Table of Contents
Item 1A. Risk Factors (continued)
Insured Portfolio Loss Related Risk Factors
Some of the state, local and territorial governments and finance authorities that issue public finance obligations we insure are experiencing unprecedented fiscal stress that could result in increased credit losses or impairments on those obligations.
We have historically experienced low levels of defaults in our United States (“U.S.”) public finance insured portfolio, including during the financial crisis that began in mid-2007. Although the financial condition of many state, local and territorial governments and finance authorities that issue the obligations we insure has improved since the financial crisis, some issuers continue to report fiscal stress that has required them to significantly raise taxes or cut spending in order to satisfy their obligations. In particular, certain jurisdictions have significantly underfunded pension liabilities which are placing additional stress on their finances and are particularly challenging to restructure either through negotiation or under Chapter 9 of the United States Bankruptcy Code. If the issuers of the obligations in our public finance portfolio are unable to raise taxes, cut spending, or receive state or federal assistance, we may experience losses or impairments on those obligations, which could materially and adversely affect our business, financial condition and results of operations. This severe financial stress could result in more Chapter 9 proceedings in states where municipal issuers are permitted to seek bankruptcy protection. In these proceedings, which remain rare, the resolution of bondholder claims (and by extension those of bond insurers) remains uncertain and subject to further litigation in several pending cases.
Loss reserve estimates and credit impairments are subject to additional uncertainties and loss reserves may not be adequate to cover potential claims.
The financial guarantees issued by our insurance companies insure the financial performance of the obligations guaranteed over an extended period of time, in some cases over 30 years, under policies that we have, in most circumstances, no right to cancel. We do not use traditional actuarial approaches to determine our loss reserves. The establishment of the appropriate level of loss reserves is an inherently uncertain process involving numerous estimates and subjective judgments by management, and therefore, there can be no assurance that actual paid claims in our insured portfolio will not exceed its loss reserves. If our loss reserves are not adequate to cover actual paid claims, our results of operations and financial condition could be materially adversely affected.
Additionally, we use both internal models as well as models generated by third-party consultants and customized by us to project future paid claims on our insured portfolio and establish loss reserves. Since our insured credit derivatives have similar terms, conditions, risks, and economic profiles to our financial guarantee insurance policies, we evaluate them for impairment periodically in the same way that we estimate loss and LAE for our financial guarantee policies. There can be no assurance that the future loss projections based on these models are accurate.
Small changes in the assumptions underlying these estimates could significantly impact loss expectations. For example, our loss reserves are discounted to a net present value reflecting MBIA’s general obligation to pay claims over time and not on an accelerated basis. Risk-free rates are used to discount our loss reserves under accounting principles generally accepted in the U.S., and the yield-to-maturity of each insurer’s investment portfolio as of year-end is used to discount each insurer’s loss reserves under statutory accounting principles. Accordingly, changes in the risk-free rates or the yield in our insurers’ investment portfolios may materially impact loss reserves.
Political and economic conditions in the United States, the Eurozone and elsewhere may materially adversely affect our business and results of operations.
As a financial guarantee company, our insured exposures and our results of operations can be materially affected by general economic conditions, both in the U.S. and around the world. General global unrest, fraud, terrorism, catastrophic events, natural disasters, pandemics or similar events could disrupt the economy in the U.S. and other countries where we have insured exposure or operate our businesses. In certain jurisdictions outside the U.S. we face higher risks of governmental intervention through nationalization or expropriation of assets, changes in regulation, an inability to enforce our rights in court or otherwise and corruption, which may cause us to incur losses on the exposures we insure or reputational harm. For a discussion of the Company’s exposure to sovereign debt, see “Management’s Discussion and Analysis of Financial Condition and Results of Operations—European Sovereign Debt Exposure” in Part II, Item 7 of this Form 10-K.
18
Table of Contents
Item 1A. Risk Factors (continued)
Budget deficits at all levels of government in the U.S., recessions, increases in corporate, municipal, sovereign, sub-sovereign or consumer default rates and other general economic conditions may adversely impact the Company’s prospects for future business, as well as the performance of our insured portfolios and the Company’s investment portfolio. In addition, we are exposed to correlation risk as a result of the possibility that multiple credits will experience losses as a result of any such event or series of events, in particular exposures that are backed by revenues from business and personal travel, such as aircraft securitizations and bonds backed by hotel taxes and car rental fleet securitizations.
Financial modeling involves uncertainty over ultimate outcomes, which makes it difficult to estimate liquidity, potential paid claims, loss reserves and fair values.
The Company uses third-party and internal financial models to estimate liquidity, potential paid claims, loss reserves and fair values. We use internal financial models to conduct liquidity stress-scenario testing to ensure that we maintain cash and liquid securities in an amount in excess of all stress scenario payment requirements. These measurements are performed on a legal entity and operating segment basis. We also rely on financial models, generated internally and supplemented by models generated by third parties, to estimate factors relating to the highly complex securities we insure, including future credit performance of the underlying assets, and to evaluate structures, rights and our potential obligations over time. We also use internal models for ongoing portfolio monitoring and to estimate case basis loss reserves and, where applicable, to report our obligations under our contracts at fair value. We may supplement such models with third-party models or use third-party experts to consult with our internal modeling specialists. Both internal and external models are subject to model risk and there can be no assurance that these models are accurate or comprehensive in estimating our liquidity, potential future paid claims, related loss reserves and fair values or that they are similar to methodologies employed by our competitors, counterparties or other market participants. Estimates of our future paid claims, in particular, may materially impact our liquidity position. In addition, changes to our paid claims, loss reserve or fair value models have been made recently and may be warranted in the future. These changes could materially impact our financial results.
Our risk management policies and procedures may not detect or prevent future losses.
We assess our risk management policies and procedures on a periodic basis. As a result of such assessment, we may take steps to change our internal risk assessment capabilities and procedures, our portfolio management policies, systems and processes and our policies and procedures for monitoring and assessing the performance of our insured portfolio in changing market conditions. There can be no assurance, however, that these steps will be adequate to avoid future losses. In some cases, losses can be substantial, particularly if a loss occurs on a transaction in which we have a large notional exposure or on a transaction structured with large, bullet-type principal maturities.
Strategic Plan Related and Other Risk Factors
An inability to maintain high stable insurer financial strength ratings for National or to generate investor demand for our financial guarantees may adversely affect our results of operations and business prospects.
There is no assurance that we will be able to maintain or increase National’s ratings. Many requirements imposed by the rating agencies in order for our insurance companies to maintain high insurer financial strength ratings are outside of our control, and such requirements may necessitate that we raise additional capital or take other remedial actions in a relatively short time frame in order to achieve or maintain the ratings necessary to attract new business and compete with other financial guarantee insurers and could make the conduct of the business uneconomical. Our inability to raise capital on favorable terms could therefore materially adversely affect our business prospects. Furthermore, no assurance can be given that we will successfully comply with rating agency requirements, that these requirements or the related models and methodologies will not change or that, even if we comply with these requirements, one or more rating agency will not lower or withdraw its financial strength ratings with respect to any of our insurance companies.
19
Table of Contents
Item 1A. Risk Factors (continued)
In addition, no assurance can be given that investor demand for our guarantees will increase regardless of our ratings. Finally, our inability to come into compliance with the rating agency and regulatory single risk limits that National exceeds may also prevent us from writing future new business in the categories of risks that were exceeded, in the case of the regulatory limits, or result in an inability to achieve or maintain our desired ratings, in the case of rating agency limits, and may adversely affect our business prospects, and our failure to come into compliance with these guidelines and rules increases the risk of experiencing a large single loss or series of losses.
Future demand for financial guarantee insurance depends on market and other factors that we do not control.
The demand for municipal financial guarantee insurance depends upon many factors, some of which are beyond the control of the Company. Our ability to attract and compete for financial guarantee business in the municipal market is largely dependent on the financial strength ratings assigned to National by one or more of the major rating agencies. It is also affected by the overall amount of new municipal bonds issued as well as level of interest rates and the spread between insured and uninsured bonds. In addition, the perceived financial strength of other financial guarantee insurers also affects demand for financial guarantee insurance. The impact of the financial crisis on certain participants in the financial guarantee industry may have eroded investors’ confidence in the benefits of bond insurance. We do not expect the demand for municipal financial guarantee insurance to regain its former levels in the near term, if ever.
We believe that issuers and investors distinguish among financial guarantors on the basis of various factors, including rating agency assessment, capitalization, size, insured portfolio concentration and financial performance. These distinctions may result in differentials in trading levels for securities insured by particular financial guarantors which, in turn, may provide a competitive advantage to those financial guarantors with better trading characteristics. In addition, various investors may, due to regulatory or internal guidelines, lack additional capacity to purchase securities insured by certain financial guarantors, which may provide a competitive advantage to guarantors with fewer insured obligations outstanding. Differentials in trading values or investor capacity constraints that do not favor us would have an adverse effect on our ability to attract new business at appropriate pricing levels.
Competition may have an adverse effect on our businesses.
National faces competition from other financial guarantee insurance companies and other forms of credit enhancement, including senior-subordinated structures, credit derivatives, letters of credit and guarantees (for example, mortgage guarantees where pools of mortgage loans secure debt service payments) provided by banks and other financial institutions. We have observed increased competition for business among the active financial guarantors, and opportunities to write new business with attractive returns may be limited. Increased competition, either in terms of price, alternative structures, or the emergence of new providers of credit enhancement, could have an adverse effect on our insurance companies’ business prospects.
Downgrades of the ratings of securities that we insure may materially adversely affect our business, results of operations and financial condition.
Individual credits in our insured portfolio (including potential new credits) are assessed a rating agency “capital charge” based on a variety of factors, including the nature of the credits’ risk types, underlying ratings, tenor and expected and actual performance. In the event of an actual or perceived deterioration in creditworthiness, a reduction in the underlying rating or a change in the rating agency capital methodology, we may be required to hold more capital in reserve against credits in the insured portfolio, regardless of whether losses actually occur, or against potential new business. Significant reductions in underlying ratings of credits in an insured portfolio can produce significant increases in assessed “capital charges.” There can be no assurance that each of our insurance company’s capital position will be adequate to meet any increased rating agency reserve requirements or that each insurance company will be able to secure additional capital necessary to support increased reserve requirements, especially at a time of actual or perceived deterioration in creditworthiness of new or existing credits. Unless we were able to increase available capital, an increase in capital charges could reduce the amount of capital available to support our ratings and could have an adverse effect on our ability to write new business.
20
Table of Contents
Item 1A. Risk Factors (continued)
Regulatory change could adversely affect our businesses, and regulations limit investors’ ability to effect a takeover or business combination that shareholders might consider in their best interests.
The financial guarantee insurance industry has historically been and will continue to be subject to the direct and indirect effects of governmental regulation, including insurance laws, securities laws, tax laws, legal precedents and accounting rules affecting asset-backed and municipal obligations, as well as changes in those laws. These laws limit investors’ ability to affect a takeover or business combination without the approval of our insurance regulators, and the failure to comply with applicable laws and regulations could expose our insurance companies, their directors or shareholders to fines, the loss of their insurance licenses, and the inability to engage in certain business activity, as the case may be. In addition, future legislative, regulatory or judicial changes could adversely affect National’s ability to pursue business, materially impacting our financial results.
While it is not possible to predict if new laws, regulations or interpretations will be enacted or the impact they would have, any changes to such laws and regulations or the NYSDFS’ interpretation thereof could subject us to further restrictions on the type of business that it is authorized to insure, especially in the structured finance area. Any such restrictions could have a material effect on the amount of premiums that we earn in the future. Additionally, any changes to such laws and regulations could subject our insurance companies to increase reserving and capital requirements or more stringent regulation generally, which could materially adversely affect our financial condition, results of operations and future business. Finally, changes to accounting standards and regulations may require modifications to our accounting methodology, both prospectively and for prior periods; and such changes could have an adverse impact on our reported financial results and/or make it more difficult for investors to understand the economics of our business, and may thus influence the types or volume of business that we may choose to pursue.
Developments in the regulation of derivatives may create additional burdens on the Company.
MBIA Corp. registered with the Commodity Futures Trading Commission (“CFTC”) as a major swap participant and on an ongoing basis is required to comply with the CFTC’s business conduct rules as applied to portfolios in place prior to the enactment of the Dodd Frank Reform and Consumer Protection Act. The CFTC and SEC have promulgated rules to implement this enhanced regulatory framework, including final rules that require the Company to include its legacy insured derivatives in tests used to determine whether it is a major swap participant. Because the CFTC has not yet issued final rules establishing capital requirements for major swap participants, the ultimate impact of such requirements on MBIA Corp. is not yet clear. However, to the extent that MBIA Corp. becomes subject to significant additional capital requirements, it is unlikely that MBIA Corp. will be able to meet those standards. We expect MBIA Corp. to become deregistered as a major swap participant effective as of March 30, 2015. See “Insured Credit Default Swaps” in Part 1, Item 1 of this Form 10-K.
Interruption in telecommunication, information technology and other operational systems, or a failure to maintain the security, confidentiality or privacy of sensitive data residing on such systems, could harm our business.
We depend heavily on our telecommunication, information technology and other operational systems and on the integrity and timeliness of data we use to run our businesses. These systems may fail to operate properly or become disabled as a result of events or circumstances wholly or partly beyond our control. Further, we face the risk of operational and technology failures by others, including various financial intermediaries and of vendors and parties to which we outsource the provision of services or business operations. If these parties do not perform as anticipated, we may experience operational difficulties, increased costs and other adverse effects on our business.
Despite our implementation of a variety of security measures, our information technology and other systems could be subject to physical or electronic break-ins, unauthorized tampering or other security breaches, resulting in a failure to maintain the security, confidentiality or privacy of sensitive data, including personal information relating to clients or transaction counterparties. We recently reported that information related to a specific group of clients at Cutwater had been inappropriately accessed via the internet. We have concluded our investigation of this incident and confirmed that although certain client information was improperly accessed, there were no unauthorized transactions or client account activity. Moreover, the event did not have a material adverse effect on our business.
21
Table of Contents
Item 1A. Risk Factors (continued)
Interruption in telecommunication, information technology and other operational systems, or a failure to maintain the security, confidentiality or privacy of sensitive data residing on such systems, whether due to actions by us or others, could delay or disrupt our ability to do business, harm our reputation, subject us to regulatory sanctions and other claims, lead to a loss of clients and revenues and otherwise adversely affect our business.
Any impairment in the Company’s future taxable income can materially affect the recoverability of our deferred tax assets.
The basis for evaluating the recoverability of a deferred tax asset is the existence of future taxable income of appropriate character. To the extent that the Company’s ability to recognize future taxable income from its existing insurance portfolio through scheduled premium earnings and net investment income becomes impaired, the recoverability of certain deferred tax assets may be materially affected by a corresponding increase to its valuation allowance.
Private litigation claims could materially adversely affect our reputation, business, results of operations and financial condition.
As further set forth in “Note 21: Commitments and Contingencies” in the Notes to Consolidated Financial Statements of MBIA Inc. and Subsidiaries in Part II, Item 8 of this Form 10-K, the Company and/or its subsidiaries are named as defendants in certain litigations, and in the ordinary course of business, may be a defendant in or party to a new or threatened legal action. Although the Company intends to vigorously defend against any current or future action, any adverse ultimate outcome could result in a loss and/or have a material adverse effect on our reputation, business, results of operations or financial condition.
The Company is dependent on key executives and the loss of any of these executives, or its inability to retain other key personnel, could adversely affect its business.
The Company’s success substantially depends upon its ability to attract and retain qualified employees and upon the ability of its senior management and other key employees to implement its business strategy. The Company believes there are only a limited number of available qualified executives in the business lines in which the Company competes. Although the Company is not aware of any planned departures, the Company relies substantially upon the services of Joseph W. Brown, Chief Executive Officer, and other senior executives. There is no assurance that the Company will be able to retain the services of key executives. The loss of the services of any of these individuals or other key members of the Company’s management team could adversely affect the implementation of its business strategy.
A different view of the Internal Revenue Service from our current tax treatment of realized losses relating to insured CDS contracts can adversely affect our financial position.
As part of the Company’s financial guarantee business, we have insured credit derivative contracts that were entered into by LaCrosse Financial Products, LLC with various financial institutions. We treat these insured derivative contracts as insurance contracts for statutory accounting purposes, which is the basis for computing U.S. federal taxable income. As such, the realized losses in connection with an insured event are considered loss reserve activities for tax purposes. Because the federal income tax treatment of CDS contracts is an unsettled area of tax law, in the event that the Internal Revenue Service has a different view with respect to the tax treatment, our results of operations and financial condition could be materially adversely affected.
Ownership Change under Section 382 of the Internal Revenue Code can have adverse tax consequences.
In connection with transactions in our shares from time to time, we may in the future experience an “ownership change” within the meaning of Section 382 of the Internal Revenue Code. In general terms, an ownership change may result from transactions increasing the aggregate ownership of certain stockholders in our stock by more than 50 percentage points over a testing period (generally three years). If an ownership change were to occur, our ability to use certain tax attributes, including certain losses, credits, deductions or tax basis, may be limited. Calculating whether a Section 382 ownership change has occurred is subject to uncertainties, including the complexity and ambiguity of Section 382 and limitations on a publicly traded company’s knowledge as to the ownership of, and transactions in, its securities. The Company performs detailed calculations during each quarter to determine if an ownership change has occurred and, based on the Company’s current methodology of calculation, a Section 382 ownership change has not taken place.
22
Table of Contents
Item 1A. Risk Factors (continued)
Capital, Liquidity and Market Related Risk Factors
We are a holding company and rely to a significant degree on cash flow from our principal operating subsidiaries and access to third party capital. A disruption in the cash flow from our subsidiaries or an inability to access capital could adversely affect our business, operating results and financial condition and ultimately adversely affect liquidity.
As a holding company MBIA Inc. is largely dependent on dividends, payments under our tax sharing agreement and advances in the form of intercompany loans from its subsidiaries to pay principal and interest on our indebtedness, make capital investments in our subsidiaries and pay dividends, to the extent payable, on our capital stock, among other items. We expect that for the foreseeable future National will be the predominant source of dividends and tax sharing agreement payments. National is subject to various statutory and regulatory restrictions, applicable to insurance companies generally, that limit the amount of cash dividends, loans and advances that it may pay to us. See “New York State Dividend Limitations” in Part 1, Item 1 and “Note 14: Insurance Regulations and Dividends” in the Notes to Consolidated Financial Statements of MBIA Inc. and Subsidiaries in Part II, Item 8 of this Form 10-K for a further discussion of dividends.
We may also from time to time seek to raise capital from external sources. The Company’s access to external sources of financing, as well as the cost of such financing, is dependent on various factors, including (i) the long-term debt ratings of the Company, (ii) expected dividends from our subsidiaries, (iii) the insurance financial strength ratings, financial condition and long-term business prospects of our insurance companies, (iv) the perceptions of the financial strength of our insurance companies and MBIA Inc. and (v) the outcome of our undertakings to collect excess spread and recoveries in connection with ineligible mortgage loans in our insured RMBS securitizations. Our debt ratings are influenced by numerous factors, either in absolute terms or relative to our peer group, such as financial leverage, balance sheet strength, capital structure and earnings trends. If we cannot obtain adequate capital on favorable terms or at all, our business, future growth, operating results and financial condition could be adversely affected.
To the extent that we are unable to access external capital, our insurance companies may not have sufficient liquidity to meet their obligations, will have less capacity to write business and may not be able to pay dividends to us without experiencing adverse rating agency action. Consequently, our inability to maintain access to capital on favorable terms could have an adverse impact on our ability to pay losses and debt obligations, to pay dividends on our capital stock, to pay principal and interest on our indebtedness, to pay our operating expenses and to make capital investments in our subsidiaries. In addition, future capital raises for equity or equity-linked securities could result in dilution to the Company’s shareholders. In addition, some securities that the Company could issue, such as preferred stock or securities issued by the Company’s operating subsidiaries may have rights, preferences and privileges that are senior to those of its common shares.
We have substantial indebtedness and may incur substantial additional indebtedness, which could adversely affect our financial condition, and our ability to obtain financing in the future, react to changes in our business and satisfy our obligations.
As of December 31, 2014 and 2013, the combined net debt of MBIA Inc.’s corporate segment, which primarily comprised long-term debt, MTNs, investment agreements and derivative liabilities net of cash and investments at amortized cost and a tax receivable from subsidiaries, totaled $740 million and $1.0 billion, respectively. The Company expects that MBIA Inc. will generate sufficient cash to satisfy its net debt over time from distributions from its operating subsidiaries or by raising third-party capital, although there can be no assurance that such factors will generate sufficient cash to satisfy its net debt. Our substantial indebtedness and other liabilities could have material consequences, including:
| • | our ability to obtain additional financing for working capital, capital expenditures, acquisitions, debt service requirements or general corporate purposes; |
| • | a large portion of MBIA Inc.’s financial resources must be dedicated to the payment of principal and interest on our debt, thereby reducing the funds available to us for other purposes; |
| • | it may be more difficult for us to satisfy our obligations to our creditors, resulting in possible defaults on, and acceleration of, such debt; |
23
Table of Contents
Item 1A. Risk Factors (continued)
| • | we may be more vulnerable to general adverse economic and industry conditions; |
| • | our ability to refinance debt may be limited or the associated costs may increase; |
| • | our flexibility to adjust to changing market conditions could be limited, or we may be prevented from carrying out capital spending that is necessary or important to our growth strategy and efforts to improve operating margins of our businesses; and |
| • | we are exposed to the risk of fluctuations in interest rates and foreign currency exchange rates because a portion of our liabilities are at variable rates of interest or denominated in foreign currencies. |
Adverse developments in the credit markets may materially and adversely affect MBIA Inc.’s ability to post collateral and meet other liquidity needs.
Currently, the majority of the cash and securities of MBIA Inc. is pledged against investment agreement liabilities, intercompany financing arrangements and derivatives, which limit its ability to raise liquidity through asset sales. If market value or rating eligibility of the assets which are pledged against MBIA Inc.’s obligations were to decline, we would be required to pledge additional eligible assets in order to meet minimum required collateral amounts against these liabilities. In such event, we may sell assets, potentially with substantial losses, finance unencumbered assets through intercompany facilities, or use free cash or other assets, although there can be no assurance that these strategies will be available or adequate to meet liquidity requirements.
Changes in interest rates and foreign currency exchange rates could adversely affect our financial condition and future business.
Increases in prevailing interest rate levels can adversely affect the value of MBIA’s investment portfolio and, therefore, our financial condition. In the event that investments must be sold in order to make payments on insured exposures or other liabilities, such investments would likely be sold at discounted prices. Lower interest rates can also result in lower net interest income since a substantial portion of assets are now held in cash and cash equivalents given the increased focus on liquidity. Additionally, in the insurance operations, increasing interest rates could lead to increased credit stress on transactions in our insured portfolio, while a decline in interest rates could result in larger loss reserves on a present value basis.
While we are not currently writing a meaningful amount of new financial guarantee insurance, we expect to do so in the future. Prevailing interest rate levels can affect demand for financial guarantee insurance. Lower interest rates are typically accompanied by narrower spreads between insured and uninsured obligations. The purchase of insurance during periods of relatively narrower interest rate spreads will generally provide lower cost savings to the issuer than during periods of relatively wider spreads. These lower cost savings could be accompanied by a corresponding decrease in demand for financial guarantee insurance. Increased interest rates may decrease attractiveness for issuers to enter into capital markets transactions, resulting in a corresponding decreasing demand for financial guarantee insurance in the future.
In addition, the Company is exposed to foreign currency exchange rate fluctuation risk in respect of assets and liabilities denominated in currencies other than U.S. dollars. In addition to insured liabilities denominated in foreign currencies, some of the remaining liabilities in our corporate segment are denominated in currencies other than U.S. dollars and the assets of our corporate segment are predominantly denominated in U.S. dollars. Accordingly, the weakening of the U.S. dollar versus foreign currencies could substantially increase our potential obligations and statutory capital exposure. Conversely, the Company makes investments denominated in a foreign currency and the weakening of the foreign currency versus the U.S. dollar will diminish the value of such non-U.S. dollar denominated asset. Exchange rates have fluctuated significantly in recent periods and may continue to do so in the future, which could adversely impact the Company’s financial position, results of operations and cash flows.
24
Table of Contents
Item 1A. Risk Factors (continued)
MBIA Corp. Risk Factors
If our insurance companies become subject to regulatory action.
Our insurance companies are subject to various statutory and regulatory restrictions that require them to maintain qualifying investments to support their reserves and minimum surplus. Furthermore, our insurance companies may be restricted from making commutation or other payments if doing so would cause them to fail to meet such requirements, and the NYSDFS may impose other remedial actions on us as described further below to the extent the Company does not meet such requirements.
Additionally, under New York law, the Superintendent of the NYSDFS may apply for an order directing the rehabilitation or liquidation of a domestic insurance company under certain circumstances, including upon the insolvency of the company, if the company has willfully violated its charter or New York law or if the company is found, after examination, to be in such condition that further transaction of business would be hazardous to its policyholders, creditors or the public. The Superintendent of the NYSDFS may also suspend an insurer’s license, restrict its license authority, or limit the amount of premiums written in New York if, after a hearing, the Superintendent of the NYSDFS determines that the insurer’s surplus to policyholders is not adequate in relation to its outstanding liabilities or financial needs. If the Superintendent of the NYSDFS were to take any such action, it would likely result in the reduction or elimination of the payment of dividends to MBIA Inc.
MBIA Corp. insures certain transactions that continue to perform poorly, in particular RMBS transactions that include a substantial number of ineligible mortgage loans, and increased losses or a delay or failure in collecting expected recoveries may materially and adversely affect its financial condition and results of operations.
MBIA Corp. insures certain structured finance transactions that remain volatile and could result in additional losses, which could be substantial, including RMBS, CDOs, CMBS pools and CRE transactions. These transactions are also subject to servicer risk, which relates to problems with the transaction servicer (the entity which is responsible for collecting the cash flow from the asset pool) that could affect the servicing and performance of the underlying assets. Furthermore, MBIA Corp. has recorded expected recoveries on second-lien RMBS, and the timing and amount of those recoveries could change. Increased losses or a delay or failure in collecting expected recoveries may materially and adversely affect MBIA Corp.’s financial condition and results of operations.
With respect to RMBS transactions, MBIA Corp. continues to be exposed to risk of losses as a result of poor performance of ineligible loans included in its insured second-lien RMBS transactions, including transactions where it has reached settlements with the sellers/servicers but continues to insure the transactions. Losses in these transactions and in other transactions due to the inclusion of ineligible loans could continue. MBIA Corp. has also recorded significant loss reserves on its first-lien RMBS and CDO exposures, and there can be no assurance that these reserves will be sufficient, in particular if the economy deteriorates.
With respect to insured CDS contracts that are backed by structured CMBS pools and CRE CDOs, MBIA Corp. has experienced ratings erosion in the total CMBS collateral underlying its insured static pools. During 2013 and 2014, MBIA Corp. paid claims on a CMBS pool transaction which experienced deterioration such that all of the deductible was eliminated, and we expect to experience additional claims on this transaction in the future. Ultimate loss rates on these transactions remain uncertain. It is possible that MBIA Corp. will experience severe losses or near-term liquidity needs on its insured commercial real estate transactions, in particular if the economy does not continue to improve, there is a new recession, increased delinquencies, higher levels of liquidations of delinquent loans, or higher severities of loss upon liquidation.
25
Table of Contents
Item 1A. Risk Factors (continued)
MBIA Corp. has also recorded significant recoveries related to its second-lien RMBS losses, and there can be no assurance as to the timing or amount of collections. As of December 31, 2014, we recorded expected receipts of $523 million (on a present value basis) from excess spread (the difference between interest inflows on assets and interest outflows on liabilities) in our second-lien RMBS transactions, in reimbursement of our past and future expected claims. Of this amount, $496 million is included in “Insurance loss recoverable” and $27 million is included in “Loss and loss adjustment expense reserves” on the Company’s consolidated balance sheets. The amount of excess spread depends on future interest rates, borrower refinancing and defaults and mortgage insurance payments. There can be no assurance that this recovery will be received in its entirety or in the expected timeframe. In addition, the Company is also pursuing claims related to ineligible loans securitized by Credit Suisse and included in a home equity mortgage trust securitization. The Company’s assessment of the ineligibility of individual mortgage loans has been challenged by Credit Suisse in litigation and there is no assurance that the Company’s determinations will prevail, or that the Company will be successful in collecting its estimated recoveries. The litigation may take several years to resolve, during which time we will be required to pay losses on the subject transaction.
Continuing elevated loss payments and delay or failure in realizing expected recoveries on insured RMBS transactions as well as certain other factors may materially and adversely affect MBIA Insurance Corporation’s ability to meet liquidity needs and could cause the NYSDFS to put MBIA Insurance Corporation into a rehabilitation or liquidation proceeding if it is not able to pay expected claims.
As an insurance company, MBIA Insurance Corporation is particularly sensitive to the risk that it will not have sufficient resources to meet contractual payment obligations when due or to make settlement payments in order to terminate insured exposures to avoid losses. Management’s expected liquidity and capital forecasts for MBIA Insurance Corporation for 2014 reflect adequate resources to pay expected claims. However, there is risk to the liquidity forecast as the Company’s remaining insured exposures are potentially volatile. There are risks to the capital forecast due to those potential liabilities, potential volatility in the collection of excess spread and the remaining put-back recoverable, and potential volatility associated with remaining ABS CDO exposures.
Further, the remaining insured portfolio, aside from these exposures, could deteriorate and result in loss reserves and claim payments, including claims on insured exposures that in some cases may require large bullet payments. While management believes MBIA Insurance Corporation will have adequate resources to pay expected claims, if it experiences higher than expected claims payments or is unable collect expected recoveries, it may ultimately have insufficient resources to continue paying claims, which could cause the NYSDFS to put MBIA Insurance Corporation into a rehabilitation or liquidation proceeding. We do not believe that a rehabilitation or liquidation proceeding of MBIA Corp. by NYSDFS would have any significant long-term liquidity impact on MBIA Inc. or result in a liquidation or similar proceeding of MBIA UK. An MBIA Insurance Corporation rehabilitation or liquidation proceeding could accelerate certain of the Company’s other obligations and have other adverse consequences, such as the loss of control of MBIA Insurance Corporation and the imposition of unplanned expenses.
Revenues and liquidity would be adversely impacted by a decline in realization of installment premiums.
Due to the installment nature of a significant percentage of its premium income, MBIA Corp. has an embedded future revenue stream. The amount of installment premiums actually realized by MBIA Corp. could be reduced in the future due to factors such as not insuring new transactions, early termination of insurance contracts, accelerated prepayments of underlying obligations, commutation of existing financial guarantee insurance policies or non-payment. Such a reduction would result in lower revenues and reduced liquidity.
Item 1B. Unresolved Staff Comments
The Company from time to time receives written comments from the staff of the SEC regarding its periodic or current reports under the Securities Exchange Act of 1934, as amended. There are no comments that remain unresolved that the Company received more than 180 days before the end of the year to which this report relates.
26
Table of Contents
The Company maintains office space located in Purchase, New York, in which the Company, National, MBIA Corp., and MBIA Services Corporation have their headquarters. A wholly-owned subsidiary of National owns an office building in Armonk, New York, that the Company is currently seeking to sell in order to reduce operating costs. The Company also leases office space in New York, New York; San Francisco, California; Paris, France; Mexico City, Mexico; and London, England. Cutwater leases office space in Denver, Colorado. The Company generally believes that these facilities are adequate and suitable for its current needs.
For a discussion of the Company’s litigation and related matters, see “Note 21: Commitments and Contingencies” in the Notes to Consolidated Financial Statements of MBIA Inc. and Subsidiaries in Part II, Item 8. In the normal course of operating its businesses, MBIA Inc. may be involved in various legal proceedings. As a courtesy, the Company posts on its website under the section “Legal Proceedings,” selected information and documents in reference to selected legal proceedings in which the Company is the plaintiff or the defendant. The Company will not necessarily post all documents for each proceeding and undertakes no obligation to revise or update them to reflect changes in events or expectations. The complete official court docket can be publicly accessed by contacting the clerk’s office of the respective court where each litigation is pending.
Item 4. Mine Safety Disclosures
Not applicable.
27
Table of Contents
Part II
| Item 5. | Market for Registrant’s Common Equity, Related Stockholder Matters and Issuer Purchases of Equity Securities |
The Company’s common stock is listed on the New York Stock Exchange under the symbol “MBI.” As of February 24, 2015 there were 622 shareholders of record of the Company’s common stock. The Company did not pay cash dividends on its common stock during 2014 or 2013. For information on the ability for certain subsidiaries of the Company to transfer funds to the Company in the form of cash dividends or otherwise, see “Item 1. Business—Insurance Regulation” in this annual report.
The high and low sales stock prices with respect to the Company’s common stock for the last two years are presented below:
| 2014 | 2013 | |||||||||||||||
| Stock Price | Stock Price | |||||||||||||||
| Quarter Ended |
High | Low | High | Low | ||||||||||||
| March 31 |
$ | 15.26 | $ | 10.68 | $ | 13.70 | $ | 7.79 | ||||||||
| June 30 |
14.08 | 10.71 | 16.15 | 8.73 | ||||||||||||
| September 30 |
11.44 | 9.03 | 14.10 | 10.16 | ||||||||||||
| December 31 |
10.54 | 8.41 | 13.20 | 9.58 | ||||||||||||
Repurchases of common stock may be made from time to time in the open market or in private transactions as permitted by securities laws and other legal requirements. We believe that share repurchases can be an appropriate deployment of capital in excess of amounts needed to support our liquidity and maintain the claims-paying ratings of MBIA Corp. and National as well as other business needs.
On February 1, 2007, the Company’s Board of Directors authorized the repurchase of common stock up to $1 billion under a new share repurchase program, which superseded the previously authorized program. During the year ended December 31, 2014, the Company repurchased 2.1 million common shares of MBIA Inc., exhausting any remaining capacity under this share repurchase program. As of December 31, 2014, the Company had repurchased 58.8 million common shares of MBIA Inc. at an average price of $17.02 per share under this share repurchase program.
In the fourth quarter of 2014, the Company’s Board of Directors authorized the repurchase of common stock up to $200 million under a new share repurchase program. During the year ended December 31, 2014, the Company repurchased 1.2 million common shares of MBIA Inc. at an average price of $9.44 per share under this new repurchase program.
The table below presents repurchases made by the Company in each month during the fourth quarter of 2014. See “Item 12. Security Ownership of Certain Beneficial Owners and Management and Related Stockholder Matters” in Part III for a further discussion of securities authorized for issuance under long-term incentive plans.
| Month |
Total Number of Shares Purchased(1) |
Average Price Paid Per Share |
Total Number of Shares Purchased as Part of Publicly Announced Plan |
Maximum Amount That May Be Purchased Under the Plan (in millions)(2) |
||||||||||||
| October |
503 | $ | 9.15 | — | $ | — | ||||||||||
| November |
453 | 10.38 | — | 200 | ||||||||||||
| December |
1,247,851 | 9.44 | 1,247,337 | 188 | ||||||||||||
(1)—Includes 1,470 shares purchased in open market transactions as investments in the Company’s non-qualified deferred compensation plan.
(2)—In the fourth quarter of 2014, the Company’s Board of Directors authorized the repurchase of common stock up to $200 million under a new share repurchase program.
As of December 31, 2014, 281,352,782 shares of Common Stock of the Company, par value $1 per share, were issued and 191,942,895 shares were outstanding.
Stock Performance Graph The following graph compares the cumulative total shareholder return (rounded to the nearest whole dollar) of our common stock, the S&P 500 Index (“S&P 500 Index”) and the S&P 500 Financials Sector Index (“S&P Financials Index”) for the last five fiscal years. The graph assumes a $100 investment at the closing price on December 31, 2009 and reinvestment of dividends in the security/index on the respective dividend payment dates without commissions. This graph does not forecast future performance of our common stock.
28
Table of Contents
| Item 5. | Market for the Registrant’s Common Equity, Related Stockholder Matters and Issuer Purchases of Equity Securities (continued) |
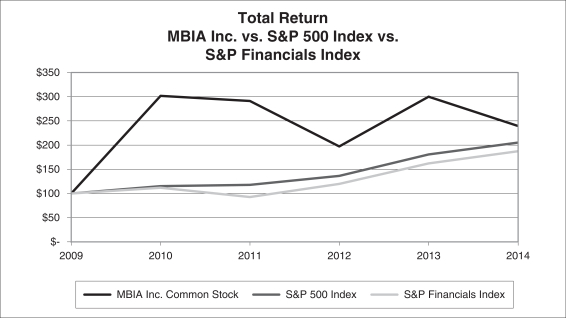
| 2009 | 2010 | 2011 | 2012 | 2013 | 2014 | |||||||||||||||||||
| MBIA Inc. Common Stock |
100.00 | 301.26 | 291.21 | 197.24 | 300.00 | 239.70 | ||||||||||||||||||
| S&P 500 Index |
100.00 | 115.06 | 117.48 | 136.26 | 180.38 | 205.05 | ||||||||||||||||||
| S&P Financials Index |
100.00 | 112.13 | 93.00 | 119.73 | 162.34 | 186.97 | ||||||||||||||||||
Source: Bloomberg Finance L.P.
29
Table of Contents
Item 6. Selected Financial Data
| In millions except per share amounts |
2014 | 2013 | 2012 | 2011 | 2010 | |||||||||||||||
| Summary Statement of Operations Data: |
||||||||||||||||||||
| Premiums earned |
$ | 397 | $ | 457 | $ | 605 | $ | 605 | $ | 594 | ||||||||||
| Net investment income |
179 | 166 | 214 | 383 | 457 | |||||||||||||||
| Net change in fair value of insured derivatives |
459 | 232 | 1,464 | (2,812) | (769) | |||||||||||||||
| Net gains (losses) on financial instruments at fair value and foreign exchange |
78 | 69 | 55 | (99) | 88 | |||||||||||||||
| Net investment losses related to other-than- temporary impairments |
(15) | — | (105) | (101) | (64) | |||||||||||||||
| Revenues of consolidated variable interest entities |
101 | 233 | 134 | 392 | 364 | |||||||||||||||
| Total revenues |
1,270 | 1,209 | 2,435 | (1,557) | 894 | |||||||||||||||
| Losses and loss adjustment |
133 | 117 | 50 | (80) | 232 | |||||||||||||||
| Operating |
195 | 338 | 381 | 308 | 290 | |||||||||||||||
| Interest |
210 | 236 | 284 | 300 | 325 | |||||||||||||||
| Expenses of consolidated variable interest entities |
47 | 56 | 72 | 91 | 83 | |||||||||||||||
| Total expenses |
629 | 793 | 837 | 682 | 989 | |||||||||||||||
| Income (loss) before income taxes |
641 | 416 | 1,598 | (2,239) | (95) | |||||||||||||||
| Net income (loss) |
569 | 250 | 1,234 | (1,319) | 53 | |||||||||||||||
| Net income (loss) per common share: |
||||||||||||||||||||
| Basic |
$ | 2.94 | $ | 1.30 | $ | 6.36 | $ | (6.85) | $ | 0.26 | ||||||||||
| Diluted |
$ | 2.76 | $ | 1.29 | $ | 6.33 | $ | (6.85) | $ | 0.26 | ||||||||||
| Summary Balance Sheet Data: |
||||||||||||||||||||
| Fixed-maturity investments |
$ | 5,744 | $ | 5,615 | $ | 5,172 | $ | 7,015 | $ | 9,669 | ||||||||||
| Short-term investments |
1,069 | 1,204 | 669 | 1,571 | 2,070 | |||||||||||||||
| Other investments |
17 | 16 | 21 | 107 | 188 | |||||||||||||||
| Total assets of consolidated variable interest entities |
5,041 | 5,592 | 8,334 | 10,893 | 14,138 | |||||||||||||||
| Total assets |
16,284 | 16,953 | 21,724 | 26,873 | 32,279 | |||||||||||||||
| Unearned premium revenue |
1,986 | 2,441 | 2,938 | 3,515 | 4,145 | |||||||||||||||
| Loss and loss adjustment expense reserves |
506 | 641 | 853 | 836 | 1,129 | |||||||||||||||
| Investment agreements |
547 | 700 | 944 | 1,578 | 2,005 | |||||||||||||||
| Medium-term notes |
1,201 | 1,427 | 1,598 | 1,656 | 1,740 | |||||||||||||||
| Long-term debt |
1,810 | 1,702 | 1,732 | 1,910 | 1,924 | |||||||||||||||
| Derivative liabilities |
437 | 1,152 | 2,934 | 5,164 | 4,617 | |||||||||||||||
| Total liabilities of consolidated variable interest entities |
4,804 | 5,297 | 7,286 | 9,883 | 13,055 | |||||||||||||||
| Total equity |
3,950 | 3,299 | 3,194 | 1,723 | 2,846 | |||||||||||||||
| Book value per share |
$ | 20.47 | $ | 17.05 | $ | 16.22 | $ | 8.80 | $ | 14.18 | ||||||||||
| Insurance Statistical Data: |
||||||||||||||||||||
| Debt service outstanding |
$ | 437,778 | $ | 554,296 | $ | 679,074 | $ | 840,078 | $ | 1,025,031 | ||||||||||
| Gross par amount outstanding |
277,481 | 357,246 | 449,487 | 551,721 | 672,878 | |||||||||||||||
30
Table of Contents
Item 6. Selected Financial Data (continued)
Quarterly Financial Information (unaudited):
| 2014 | ||||||||||||||||||||
| In millions except per share amounts |
First | Second | Third | Fourth | Full Year(1) | |||||||||||||||
| Premiums earned |
$ | 88 | $ | 89 | $ | 116 | $ | 104 | $ | 397 | ||||||||||
| Net investment income |
50 | 42 | 44 | 43 | 179 | |||||||||||||||
| Net change in fair value of insured derivatives |
469 | (47) | 24 | 13 | 459 | |||||||||||||||
| Net gains (losses) on financial instruments at fair value and foreign exchange |
(55) | 61 | 57 | 15 | 78 | |||||||||||||||
| Net investment losses related to other-than-temporary impairments |
— | — | (14) | (1) | (15) | |||||||||||||||
| Revenues of consolidated variable interest entities |
19 | 36 | 17 | 29 | 101 | |||||||||||||||
| Total revenues |
577 | 187 | 291 | 215 | 1,270 | |||||||||||||||
| Losses and loss adjustment |
50 | 12 | 20 | 51 | 133 | |||||||||||||||
| Operating |
46 | 49 | 46 | 54 | 195 | |||||||||||||||
| Interest |
54 | 52 | 52 | 52 | 210 | |||||||||||||||
| Expenses of consolidated variable interest entities |
13 | 11 | 12 | 11 | 47 | |||||||||||||||
| Total expenses |
173 | 132 | 143 | 181 | 629 | |||||||||||||||
| Income (loss) before income taxes |
404 | 55 | 148 | 34 | 641 | |||||||||||||||
| Net income (loss) |
256 | 120 | 173 | 20 | 569 | |||||||||||||||
| Net income (loss) per common share: |
||||||||||||||||||||
| Basic |
$ | 1.33 | $ | 0.61 | $ | 0.90 | $ | 0.10 | $ | 2.94 | ||||||||||
| Diluted |
$ | 1.32 | $ | 0.45 | $ | 0.80 | $ | 0.10 | $ | 2.76 | ||||||||||
(1)—May not cross-foot due to rounding.
| 2013 | ||||||||||||||||||||
| In millions except per share amounts |
First | Second | Third | Fourth | Full Year(1) | |||||||||||||||
| Premiums earned |
$ | 120 | $ | 124 | $ | 104 | $ | 109 | $ | 457 | ||||||||||
| Net investment income |
38 | 38 | 42 | 48 | 166 | |||||||||||||||
| Net change in fair value of insured derivatives |
(61) | (182) | 257 | 218 | 232 | |||||||||||||||
| Net gains (losses) on financial instruments at fair value and foreign exchange |
63 | (6) | 5 | 7 | 69 | |||||||||||||||
| Revenues of consolidated variable interest entities |
49 | 93 | 30 | 61 | 233 | |||||||||||||||
| Total revenues |
219 | 112 | 420 | 458 | 1,209 | |||||||||||||||
| Losses and loss adjustment |
(194) | 188 | 98 | 25 | 117 | |||||||||||||||
| Operating |
106 | 103 | 71 | 58 | 338 | |||||||||||||||
| Interest |
60 | 60 | 59 | 57 | 236 | |||||||||||||||
| Expenses of consolidated variable interest entities |
16 | 14 | 12 | 14 | 56 | |||||||||||||||
| Total expenses |
4 | 376 | 249 | 164 | 793 | |||||||||||||||
| Income (loss) before income taxes |
215 | (264) | 171 | 294 | 416 | |||||||||||||||
| Net income (loss) |
164 | (178) | 132 | 132 | 250 | |||||||||||||||
| Net income (loss) per common share: |
||||||||||||||||||||
| Basic |
$ | 0.84 | $ | (0.94) | $ | 0.68 | $ | 0.69 | $ | 1.30 | ||||||||||
| Diluted |
$ | 0.84 | $ | (0.94) | $ | 0.52 | $ | 0.68 | $ | 1.29 | ||||||||||
(1)—May not cross-foot due to rounding.
31
Table of Contents
Item 7. Management’s Discussion and Analysis of Financial Condition and Results of Operations
INTRODUCTION
MBIA Inc. (“MBIA”, the “Company”, “we”, “us”, or “our”) operates one of the largest financial guarantee insurance businesses in the industry and engages in several ancillary activities. MBIA manages five operating segments: 1) United States (“U.S.”) public finance insurance; 2) international and structured finance insurance; 3) corporate; 4) advisory services; and 5) conduit. Our U.S. public finance insurance business is primarily operated through National Public Finance Guarantee Corporation and its subsidiaries (“National”), our international and structured finance insurance business is primarily operated through MBIA Insurance Corporation and its subsidiaries (“MBIA Corp.”), and our asset management and advisory services business was operated through Cutwater Holdings, LLC and its subsidiaries (“Cutwater”). Unless otherwise indicated or the context otherwise requires, references to “MBIA Corp.” are to MBIA Insurance Corporation, together with its subsidiaries, MBIA UK Insurance Limited (“MBIA UK”) and MBIA Mexico S.A. de C.V. During the fourth quarter of 2014, we changed the name of our structured finance and international insurance operating segment to international and structured finance insurance.
The primary strategies of our U.S. public finance insurance segment are to generate new insurance business in National, consistent with our portfolio management and return requirements, and to maximize the economics of our existing insured portfolio through effective surveillance and remediation. The primary strategies of our international and structured finance insurance segment are risk reduction, loss mitigation and value preservation. We do not expect to write new business in our international and structured finance insurance segment in the foreseeable future. Our corporate segment manages financing for and provides general support services across the MBIA group. In the second quarter of 2014, we exited our conduit business through the liquidation of Meridian Funding Company, LLC (“Meridian”). Effective in the fourth quarter of 2014, our previously reported asset/liability products segment and our corporate segment are managed and reported as one operating segment referred to as our corporate segment. Effective on January 1, 2015, we exited our advisory services business through the sale of Cutwater. Refer to “Note 12: Business Segments” in the Notes to Consolidated Financial Statements for a discussion of changes to our business segments.
EXECUTIVE OVERVIEW
National
National is the largest U.S. municipal-only bond insurer in the financial guarantee industry as measured by total insured gross par outstanding of $222.3 billion as of December 31, 2014. Our primary strategy is to insure new issue and secondary market municipal bonds while providing ongoing surveillance of National’s existing insured portfolio. National’s ability to write new business and to compete with other financial guarantors is largely dependent on the financial strength ratings assigned to National by major rating agencies. As of December 31, 2014, National was rated AA+ with a stable outlook by Kroll Bond Rating Agency, AA- with a stable outlook by Standard & Poor’s Financial Services LLC (“S&P”), and A3 with a negative outlook by Moody’s Investors Service, Inc. (“Moody’s”). With these current ratings, National seeks to support the credit enhancement needs of municipal debt issuers across the U.S.
National prices new business opportunities in both the competitive and negotiated markets. During the year ended December 31, 2014, National insured $343 million of par, which included approximately $300 million of Detroit Water Supply System Revenue Bonds and Detroit Sewage Disposal Bonds (together, the “DWSD Bonds”) issued through the Michigan Finance Authority. National’s insurance facilitated successful execution of these transactions and provided a lower cost of borrowing for the issuers.
National maintains underwriting criteria for most municipal risk types and expects opportunities for new business across the spectrum of municipal sectors. We expect that the majority of new business will be in the general obligation, tax-backed and revenue bond sectors. In addition to the new issue market, we anticipate opportunities in the secondary market with respect to bonds issued in recent years which were not insured upon issuance and which meet our underwriting criteria.
National seeks to generate shareholder value through appropriate risk adjusted pricing; however, current market conditions and the competitive landscape may limit National’s new business opportunities and its ability to price and underwrite risk with attractive returns. Financial guarantee insurance competes in nearly all instances with the issuer’s alternative of foregoing insurance. If the interest savings from insurance are not greater than the cost of the insurance, the issuer will generally choose to issue bonds without insurance.
32
Table of Contents
Item 7. Management’s Discussion and Analysis of Financial Condition and Results of Operations
EXECUTIVE OVERVIEW (continued)
Prevailing interest rate levels can affect demand for financial guarantee insurance. Higher interest rates and higher levels of issuance of new municipal debt would present more favorable new business opportunities for National in the U.S. public finance market. Lower interest rates are typically accompanied by narrower spreads between insured and uninsured obligations. This is, in part, due to the fact that investors may choose to forego insurance to increase the yield on their investments. Therefore, the purchase of insurance during periods of relatively narrower interest rate spreads will generally provide lower cost savings to the issuer than during periods of relatively wider spreads. These lower cost savings could be accompanied by a corresponding decrease in demand for financial guarantee insurance. As interest rates begin to rise, we expect the demand for financial guarantee insurance to grow.
However, given that National’s insurance policies protect policyholders from potential defaults and guarantee payments of scheduled principal and interest, we believe the recent increase in municipal financial stress will increase the demand for National’s insurance product.
Our U.S. public finance insured portfolio continues to perform satisfactorily against a backdrop of strengthening domestic economic activity. While this trend will generally benefit the tax revenues and fees charged for essential municipal services which secure our insured bond portfolio, some state, local governments and territory obligors we insure remain under financial and budgetary stress. This could lead to an increase in defaults by such entities on the payment of their obligations and losses or impairments on a greater number of our insured transactions. We continue to monitor and analyze these situations and other stressed credits closely, and the overall extent and duration of this stress is uncertain.
Exposure to Puerto Rico
As of December 31, 2014, National had $4.5 billion of gross insured exposure related to the Commonwealth of Puerto Rico and certain of its instrumentalities (“Puerto Rico”). Puerto Rico is experiencing fiscal stress due to, among other things, Puerto Rico’s structural budget imbalance, a stalled local economy, net migration of people and a high debt burden. However, it has attempted to address its significant economic challenges by passing a balanced general fund budget for the fiscal year ending June 30, 2015, passing a comprehensive reform of its employee retirement system and enacting the Fiscal Sustainability Act, which allows the government to exercise emergency powers to deal with its fiscal crisis. Refer to the “U.S. Public Finance Insurance Puerto Rico Exposures” section for additional information on our Puerto Rico exposures.
Exposure to Detroit
National has exposure to the City of Detroit, which filed for Chapter 9 protection in July of 2013. In the fourth quarter of 2014, the City of Detroit entered into a number of settlements with creditors, helping to clear the path toward a bankruptcy exit in December of 2014. In connection with its exit, the City of Detroit issued new unlimited tax general obligation bonds, through the Michigan Finance Authority, to each holder of its then existing unlimited tax obligation bonds on the plan effective date (collectively, the “Restructured UTGO Bonds”). The Restructured UTGO Bonds have the same principal amount, interest rate, maturity and redemption provisions as the City of Detroit’s original UTGO Bonds. Under the settlement between National and the City of Detroit, National will pay a portion of the future debt service of the Restructured UTGO Bonds. The Restructured UTGO Bonds that remain the responsibility of the City of Detroit are secured by (i) a lien, to the extent permitted by law, on the specific voter approved ad valorem tax levy pledged thereto, and (ii) a 4th lien on the Distributable State Aid the City of Detroit receives from Michigan. National continues to insure all of the Restructured UTGO Bonds.
In September of 2014, the City of Detroit agreed not to reduce interest rates and eliminate call protection on the DWSD Bonds insured by National. Instead, the City of Detroit publicly tendered for and ultimately called or refinanced approximately $1.8 billion of DWSD Bonds. In connection with this refinancing, National insured approximately $300 million of new DWSD Bonds, while reducing its total DWSD exposure by approximately $432 million. As of December 31, 2014, National had $1.6 billion of gross insured exposure related to the DWSD Bonds.
33
Table of Contents
Item 7. Management’s Discussion and Analysis of Financial Condition and Results of Operations
EXECUTIVE OVERVIEW (continued)
MBIA Inc.
As of December 31, 2014 and 2013, the liquidity position of MBIA Inc. and its corporate segment, was $498 million and $359 million, respectively. In 2014, positive cash flows to MBIA Inc. consist largely of dividends and releases of escrowed tax payments from National. Positive cash flows enabled debt and share repurchases in addition to covering operating expenses and scheduled debt service. During 2014, $220 million was released to MBIA Inc. under the MBIA group’s tax sharing agreement (the “Tax Escrow Account”) and in January of 2015, $228 million was released. During 2014, National declared and paid a dividend of $220 million to its ultimate parent, MBIA Inc.
In 2014, we repurchased 3.3 million common shares of MBIA Inc. In the fourth quarter of 2014, the Company’s Board of Directors authorized the repurchase of up to $200 million of its outstanding shares. As of February 26, 2015, $133 million remained under this share repurchase authorization. Also, during 2014, we repurchased $122 million of debt issued by MBIA Inc. through its subsidiary MBIA Global Funding, LLC (“GFL”) and retired $129 million of medium-term notes (“MTNs”) issued by our conduit segment. In addition, during 2014 $154 million of GFL MTNs and investment agreements matured. These repurchases and retirements are part of our strategy to bring our leverage down using cash generated from operations. We expect that MBIA Inc. will generate sufficient cash to satisfy its debt obligations and its general corporate needs over time from expected subsidiary dividends, additional anticipated releases from the Tax Escrow Account, investment income and securities issuance; however, there can be no assurance that such sources will generate sufficient cash or that we will have market access when needed. Refer to the “Liquidity—MBIA Inc. Liquidity” section for additional information on MBIA Inc.’s liquidity position.
MBIA Corp.
MBIA Corp.’s primary strategies are maximizing the collection of excess spread and put-back recoveries and mitigating potential losses on MBIA Corp.’s insurance exposures. MBIA Corp. has significant negative earned surplus and accrued and unpaid interest on its outstanding surplus notes, and therefore, has no current capacity to pay dividends. Since July 15, 2012 no payments on MBIA Corp.’s outstanding surplus notes have been approved by the New York State Department of Financial Services (“NYSDFS”) and as of January 15, 2015 there was $286 million of accrued and unpaid interest on MBIA Corp.’s outstanding surplus notes. MBIA Corp. contributes to the Company’s net operating loss carryforward (“NOL”), which is used in the calculation of our consolidated income taxes. We believe it is unlikely that MBIA Corp. will generate sufficient income to use its portion of the NOL. Refer to the “Capital Resources—MBIA Corp.” section for additional information on MBIA Corp.’s surplus notes and statutory capital.
During the year ended December 31, 2014, MBIA Corp. commuted $7.1 billion of gross par exposure, of which $6.8 billion was previously disclosed, primarily comprising structured commercial mortgage-backed securities (“CMBS”) pools, investment grade corporate collateralized debt obligations (“CDOs”), small business securitizations, commercial real estate (“CRE”) CDOs, and asset-backed securities (“ABS”) CDOs. MBIA Corp. may make negotiated settlement payments to counterparties and/or forego its right to all or some termination premiums when it commutes insurance exposures. We continue to evaluate opportunities to commute additional high risk insurance exposures, although our ability to commute is limited by available liquidity and the willingness of counterparties to enter into commutations.
MBIA Corp. continues to successfully manage its liquidity risks and satisfy all payment obligations when due. Historically, liquidity was negatively impacted by claim payments on second-lien residential mortgage-backed securities (“RMBS”). However, during the year ended December 31, 2014, recoveries from excess spread on second-lien RMBS exceeded paid claims and loss adjustment expense (“LAE”). There can be no assurance this trend will continue. Our liquidity forecasts reflect more than adequate resources to pay expected claims, but if MBIA Corp. experiences materially-elevated claims payments or does not substantially collect our projected amounts of excess spread or recovery from Credit Suisse for ineligible mortgages, it could experience liquidity shortfalls.
34
Table of Contents
Item 7. Management’s Discussion and Analysis of Financial Condition and Results of Operations
EXECUTIVE OVERVIEW (continued)
If MBIA Corp. were to experience liquidity shortfalls in the future, it may have insufficient resources to continue to pay claims, which may cause the NYSDFS to put MBIA Insurance Corporation into a rehabilitation or liquidation proceeding. We do not believe that a rehabilitation or liquidation proceeding of MBIA Insurance Corporation by NYSDFS would have any significant long-term liquidity impact on MBIA Inc. or result in a liquidation or similar proceeding of MBIA UK. Refer to the “Liquidity—MBIA Corp. Liquidity” section for additional information on MBIA Corp.’s liquidity position.
Other
In September of 2014, we moved into our new headquarters in Purchase, New York. We had entered into a lease agreement for this facility in March of 2014. Refer to “Note 21: Commitments and Contingencies” in the Notes to Consolidated Financial Statements for a further discussion of this lease agreement.
In October of 2014, the Company signed an agreement to sell Cutwater to a subsidiary of The Bank of New York Mellon Corporation. This transaction, which was effective January 1, 2015, had a positive but immaterial impact on the Company’s financial position and results of operations. In connection with the sale, the Company entered into an agreement for Cutwater to manage its proprietary investment assets for the next several years.
Economic and Financial Market Trends
The U.S. economy developed substantial momentum in 2014, with the last three quarters being the best string of quarterly performances in more than a decade. This momentum was bolstered by the lowest unemployment rate in over six years and falling energy prices which helped to increase consumer spending and business investments. In addition, the housing sector improved and with a continued increase in consumer confidence this should lead to more demand in 2015. The Federal Reserve has indicated that there may be an increase in the federal funds rate in 2015, which would be the first in over five years. If an increase in the federal funds rate occurs, the risk of market volatility will likely remain present given the historic nature of elongated zero interest rate policy changing course. Despite these positive economic results, concerns remain within the U.S. economy primarily related to fiscal policy uncertainties and growing worldwide political and economic conflicts from the effects of terrorist acts and wars. Throughout much of Europe, economic growth and employment have improved, and the European Central Banks’ implementation of Quantitative Easing is intended to facilitate economic growth, however, substantial risk remains. We believe interest rate hikes are approaching and growth today is more durable as global economic risks are less likely to derail expansion. Information concerning our interest rate sensitivity appears in Part II, Item 7A, “Quantitative and Qualitative Disclosures about Market Risk.”
Economic and financial market trends impact MBIA’s business outlook and its financial results. An ongoing low interest rate environment will adversely impact the demand for municipal bond insurance as well as National’s ability to price risk at levels that meet its underwriting objectives and returns. However, the consistent gradual improvement of economic indicators at the state and local levels will benefit the performance of our insured public finance portfolio and could reduce the amount of National’s incurred losses.
Financial Highlights
Our financial results, prepared in accordance with accounting principles generally accepted in the United States of America (“GAAP”), have been volatile as a result of unrealized gains and losses from our insured credit derivatives, as well as a result of insured losses and recoveries on second-lien RMBS. Our economic performance has also been volatile due to changes in our loss estimates based on changes in macroeconomic conditions in the U.S. and abroad and deviations in collateral performance from our expectations.
For the year ended December 31, 2014, we recorded consolidated net income of $569 million or $2.76 per diluted share compared with consolidated net income of $250 million, or $1.29 per diluted share for 2013 and consolidated net income of $1.2 billion, or $6.33 per diluted share, for 2012.
35
Table of Contents
Item 7. Management’s Discussion and Analysis of Financial Condition and Results of Operations
EXECUTIVE OVERVIEW (continued)
For the year ended December 31, 2014, combined operating income (a non-GAAP measure) was $185 million compared with an operating loss of $15 million and operating income of $232 million for 2013 and 2012, respectively. Refer to the following “Results of Operations” section for a description of operating income (loss) and a reconciliation of operating income (loss) to GAAP net income (loss).
Our consolidated shareholders’ equity increased to $3.9 billion as of December 31, 2014 compared with $3.3 billion as of December 31, 2013. Our consolidated book value per share as of December 31, 2014 was $20.47 compared with $17.05 as of December 31, 2013.
As of December 31, 2014, adjusted book value (“ABV”) per share (a non-GAAP measure) was $24.87, up from $24.05 as of December 31, 2013. Refer to the following “Results of Operations” section for a further discussion of ABV and a reconciliation of GAAP book value per share to ABV per share.
A detailed discussion of our financial results is presented within the “Results of Operations” section included herein. Refer to the “Capital Resources—Insurance Statutory Capital” section for a discussion of National’s and MBIA Corp.’s capital positions under statutory accounting principles (“U.S. STAT”).
CRITICAL ACCOUNTING ESTIMATES
We prepare our financial statements in accordance with GAAP, which requires the use of estimates and assumptions. The following accounting estimates are viewed by management to be critical because they require significant judgment on the part of management. Management has discussed and reviewed the development, selection, and disclosure of critical accounting estimates with the Company’s Audit Committee. Financial results could be materially different if other methodologies were used or if management modified its assumptions.
Loss and Loss Adjustment Expense Reserves
Loss and LAE reserves are established by loss reserve committees in each of our major operating insurance companies (National, MBIA Insurance Corporation, and MBIA UK) and reviewed by our executive Loss Reserve Committee, which consists of members of senior management. Loss and LAE reserves include case basis reserves and accruals for LAE incurred with respect to non-derivative financial guarantees. Case basis reserves represent our estimate of expected losses to be paid under insurance contracts, net of expected recoveries, on insured obligations that have defaulted or are expected to default. These reserves require the use of judgment and estimates with respect to the occurrence, timing and amount of paid losses and recoveries on insured obligations. Given that the reserves are based on such estimates and assumptions, there can be no assurance that the actual ultimate losses will not be greater than or less than such estimates resulting in the Company recognizing additional or reversing excess loss and LAE reserves through earnings.
We take into account a number of variables in establishing specific case basis reserves for individual policies that depend primarily on the nature of the underlying insured obligation. These variables include the nature and creditworthiness of the issuers of the insured obligations, expected recovery rates on unsecured obligations, the projected cash flow or market value of any assets pledged as collateral on secured obligations, and the expected rates of recovery, cash flow or market values on such obligations or assets. Factors that may affect the actual ultimate realized losses for any policy include economic conditions and trends, the extent to which sellers/servicers comply with the representations or warranties made in connection therewith, levels of interest rates, rates of inflation, borrower behavior, the default rate and salvage values of specific collateral, and our ability to enforce contractual rights through litigation and otherwise. Our remediation strategy for an insured obligation that has defaulted or is expected to default may also have an impact on our loss reserves.
In establishing case basis loss reserves, we calculate the present value of probability-weighted estimated loss payments, net of estimated recoveries, using a discount rate equal to the risk-free rate applicable to the currency and the weighted average remaining life of the insurance contract. Yields on U.S. Treasury offerings are used to discount loss reserves denominated in U.S. dollars, which represent the majority of our loss reserves. Similarly, yields on foreign government offerings are used to discount loss reserves denominated in currencies other than the U.S. dollar.
36
Table of Contents
Item 7. Management’s Discussion and Analysis of Financial Condition and Results of Operations
CRITICAL ACCOUNTING ESTIMATES (continued)
Refer to “Note 6: Loss and Loss Adjustment Expense Reserves” in the Notes to Consolidated Financial Statements for a comprehensive discussion of our loss reserves and recoveries, including critical accounting estimates used in the determination of these amounts.
Valuation of Financial Instruments
We have categorized our financial instruments measured at fair value into the three-level hierarchy according to accounting guidance for fair value measurements and disclosures based on the significance of pricing inputs to the measurement in its entirety. Fair value measurements of financial instruments that use quoted prices in active markets for identical assets or liabilities are generally categorized as Level 1, fair value measurements of financial instruments that use quoted prices in markets that are not active where significant inputs are observable are generally categorized as Level 2, and fair value measurements of financial instruments where significant inputs are not observable are generally categorized as Level 3. We categorize our financial instruments based on the lowest level category at which we can generate reliable fair values. The determination of reliability requires management to exercise judgment. The degree of judgment used to determine the fair values of financial instruments generally correlates to the degree that pricing is not observable.
The fair value measurements of financial instruments held or issued by the Company are determined through the use of observable market data when available. Market data is obtained from a variety of third-party sources, including dealer quotes. If dealer quotes are not available for an instrument that is infrequently traded, we use alternate valuation methods, including either dealer quotes for similar contracts or modeling using market data inputs. The use of alternate valuation methods generally requires considerable judgment in the application of estimates and assumptions and changes to these variables may produce materially different values.
The fair value pricing of assets and liabilities is a function of many components which include interest rate risk, market risk, liquidity risk and credit risk. For financial instruments that are internally valued by the Company, as well as those for which the Company uses broker quotes or pricing services, credit risk is typically incorporated by using appropriate credit spreads or discount rates as inputs. Substantially all of the Company’s investments carried and reported at fair value are priced by independent third parties, including pricing services and brokers.
Instruments that trade infrequently and, therefore, have little or no price transparency are classified within Level 3 of the fair value hierarchy. Also included in Level 3 are financial instruments that have significant unobservable inputs deemed significant to the instrument’s overall fair value. Level 3 assets represented approximately 20% and 22% of total assets measured at fair value on a recurring basis as of December 31, 2014 and 2013, respectively. Level 3 liabilities represented approximately 35% and 61% of total liabilities measured at fair value on a recurring basis as of December 31, 2014 and 2013, respectively.
Refer to “Note 7: Fair Value of Financial Instruments” in the Notes to Consolidated Financial Statements for further information about the Company’s financial assets and liabilities that are accounted for at fair value, including valuation techniques and significant inputs.
Deferred Income Taxes
Deferred income taxes are recorded with respect to the temporary differences between the tax bases of assets and liabilities and the reported amounts in our consolidated financial statements that will result in deductible or taxable amounts in future years when the reported amounts of assets and liabilities are recovered or settled. Our temporary differences relate principally to premium revenue recognition, deferred acquisition costs, unrealized gains or losses on investments and insured derivatives, asset impairments, deferred cancellation of indebtedness income, and net operating losses.
Valuation allowances are established to reduce deferred tax assets to an amount that more likely than not will be realized. Changes in the amount of a valuation allowance are reflected within our provision for income taxes in our consolidated statements of operations. Determining whether to establish a valuation allowance and, if so, the amount of the valuation allowance requires management to exercise judgment and make assumptions regarding whether such tax benefits will be realized in future periods.
37
Table of Contents
Item 7. Management’s Discussion and Analysis of Financial Condition and Results of Operations
CRITICAL ACCOUNTING ESTIMATES (continued)
All evidence, both positive and negative, needs to be identified and considered in making this determination. Future realization of the existing deferred tax asset ultimately depends on management’s estimate of the future profitability and existence of sufficient taxable income of appropriate character (for example, ordinary income versus capital gain) within the carryforward period available under the tax law. In the event that the Company’s estimate of taxable income is less than that required to utilize the full amount of any deferred tax asset, a valuation allowance is established. During 2014, the Company’s valuation allowance against its deferred tax asset was fully released primarily due to the capital losses generated by the sales of previously impaired assets, which were utilized against current year capital gains. The release was also due to the impact of tax planning strategies which used unrealized gains to absorb any remaining impairment losses. As of December 31, 2013, the Company’s valuation allowance was $93 million which was related to impairments of certain assets characterized as capital losses. Capital losses may only be offset by capital gains and any capital loss not utilized in the year generated can only be carried forward five years.
Refer to “Note 11: Income Taxes” in the Notes to Consolidated Financial Statements for additional information about the Company’s deferred income taxes.
RECENT ACCOUNTING PRONOUNCEMENTS
Refer to “Note 3: Recent Accounting Pronouncements” in the Notes to Consolidated Financial Statements for a discussion of accounting guidance recently adopted by the Company.
RESULTS OF OPERATIONS
Summary of Consolidated Results
The following table presents a summary of our consolidated financial results for the years ended December 31, 2014, 2013 and 2012:
| Years Ended December 31, | ||||||||||||
| In millions except for per share amounts |
2014 | 2013 | 2012 | |||||||||
| Total revenues (losses) |
$ | 1,270 | $ | 1,209 | $ | 2,435 | ||||||
| Total expenses |
629 | 793 | 837 | |||||||||
|
|
|
|
|
|
|
|||||||
| Income (loss) before income taxes |
641 | 416 | 1,598 | |||||||||
| Provision (benefit) for income taxes |
72 | 166 | 364 | |||||||||
|
|
|
|
|
|
|
|||||||
| Net income (loss) |
$ | 569 | $ | 250 | $ | 1,234 | ||||||
|
|
|
|
|
|
|
|||||||
| Net income (loss) per common share: |
||||||||||||
| Basic |
$ | 2.94 | $ | 1.30 | $ | 6.36 | ||||||
| Diluted |
$ | 2.76 | $ | 1.29 | $ | 6.33 | ||||||
| Weighted average number of common shares outstanding: |
||||||||||||
| Basic |
188,171,503 | 189,071,011 | 188,834,626 | |||||||||
| Diluted |
190,898,627 | 190,312,913 | 189,897,021 | |||||||||
Consolidated total revenues for the year ended December 31, 2014 included $459 million of net gains on insured derivatives compared with $232 million and $1.5 billion of net gains for 2013 and 2012, respectively. The net gains on insured derivatives in 2014 were principally the result of commuting derivative liabilities at prices below their fair values, partially offset by settlement and claim payments. The net gains on insured derivatives in 2013 were principally the result of changes in the weighted average life of transactions, commuting derivative liabilities at prices below their fair values and favorable changes in spreads and pricing on collateral, partially offset by the favorable effects of changes in the market’s perception of MBIA Corp.’s nonperformance risk on its derivative liabilities. The net gains on insured derivatives in 2012 were principally associated with the unfavorable effects of changes in the market’s perception of MBIA Corp.’s nonperformance risk on its derivative liabilities, commuting derivative liabilities at prices below their fair values and the result of favorable changes in spreads and pricing on collateral.
38
Table of Contents
Item 7. Management’s Discussion and Analysis of Financial Condition and Results of Operations
RESULTS OF OPERATIONS (continued)
Consolidated total expenses for the year ended December 31, 2014 included $133 million of net insurance loss and LAE compared with $117 million and $50 million for 2013 and 2012, respectively. The increase in net insurance loss and LAE in 2014 when compared with 2013 was principally related to an increase in loss on certain RMBS exposures, partially offset by a decrease in losses related to certain U.S. public finance transactions. The increase in net insurance loss and LAE in 2013 when compared with 2012 was principally related to increases in losses related to certain U.S. public finance transactions.
European Sovereign Debt Exposure
Uncertainties regarding European sovereign debt have affected the global economy. Outside the U.S., financial guarantee insurance has been used by issuers of sovereign-related and sub-sovereign bonds, structured finance securities, utility debt and financing for public purpose projects, among others. MBIA does not insure any direct European sovereign debt. However, we do insure both structured finance and public finance obligations in select international markets. MBIA’s indirect European sovereign insured debt exposure totaled $7.2 billion as of December 31, 2014 and included obligations of sovereign-related and sub-sovereign issuers, such as regions, departments and sovereign-owned entities that are supported by a sovereign state, region or department. Of the $7.2 billion of insured gross par outstanding, $571 million, $363 million, and $225 million related to Spain, Portugal, and Ireland, respectively. The remaining $6.0 billion related to the United Kingdom. We closely monitor our existing insured European portfolios on an ongoing basis. We consider country risk, including economic and political factors, the type and quality of local regulatory oversight, the strength of the legal framework in each country and the stability of the local institutional framework. We also monitor local accounting, regulatory and legal requirements, local financial market developments, the impact of exchange rates and local demand dynamics. A default by one or more sovereign issuers could have an adverse effect on our insured debt exposures. The Company has an immaterial amount of direct and indirect European sovereign debt holdings included in its investment portfolios.
Operating Income (Loss)
In addition to our results prepared in accordance with GAAP, we also analyze the operating performance of the Company using operating income (loss) and operating income (loss) per diluted common share, both non-GAAP measures. We consider operating income (loss) and operating income (loss) per diluted common share fundamental measures of periodic financial performance which we believe is useful for an understanding of our results. Operating income (loss) and operating income (loss) per diluted common share are not substitutes for net income (loss) and net income (loss) per diluted common share determined in accordance with GAAP, and our definitions of operating income (loss) and operating income (loss) per diluted common share may differ from those used by other companies. Previously, we had used adjusted pre-tax income (loss), a non-GAAP measure, to supplement the analysis of our results. As a result of the recognition of the minor impact of shareholder value of the results of our international and structured finance insurance segment, the liquidation of our conduit and advisory services businesses and the realignment of the management of our asset/liability products and our corporate activities, we consider operating income (loss) a better metric than adjusted pre-tax income (loss) to assess our performance. Previous to using adjusted pre-tax income (loss), and before the financial crisis, we used a non-GAAP measure similar to our current operating income (loss) measure.
Operating income (loss) and operating income (loss) per diluted common share include the combined after-tax results of our U.S. public finance insurance and corporate segments and remove the after-tax results of activities that are not part of our ongoing business strategy. This includes the activities of our international and structured finance insurance, advisory services and conduit segments (collectively, “Non-Core Segments”). We consider these segments Non-Core Segments since we do not expect to write new business in our international and structured finance insurance segment in the foreseeable future, we exited our advisory services segment through the sale of Cutwater effective January 1, 2015, and in the second quarter of 2014, we liquidated our conduit segment.
39
Table of Contents
Item 7. Management’s Discussion and Analysis of Financial Condition and Results of Operations
RESULTS OF OPERATIONS (continued)
In addition to removing our Non-Core Segments, operating income (loss) is adjusted for the following:
| • | Elimination of the after-tax impact of mark-to-market gains (losses) on financial instruments that primarily include interest rate swaps and hybrid financial instruments. Also eliminated are the mark-to market gains (losses) on warrants issued by the Company. All of these amounts fluctuate based on market interest rates, credit spreads, MBIA Inc.’s common stock price and other market factors and are not expected to result in an economic gain or loss. |
| • | Elimination of the after-tax impact of foreign exchange gains (losses) on the remeasurement of certain assets and liabilities and transactions in non-functional currencies. Given the possibility of volatility in foreign exchange markets, we exclude the impact of foreign exchange gains (losses) to provide a measurement of comparability of operating income (loss). |
| • | Elimination of the after-tax impact of gains (losses) on the sale of investments and net investment losses related to other-than-temporary impairments (“OTTI”) since the timing of the sales of investments is subject to management’s assessment of market opportunities and liquidity needs and OTTI is assessed by several factors including credit losses and our intention to sell investments before an expected recovery. |
| • | Elimination of the after-tax impact of net gains (losses) on the extinguishment of debt as we believe it is useful to exclude these gains (losses) since they are executed when we believe it is an appropriate deployment of capital in excess of amounts needed to support our liquidity needs. |
| • | Elimination of deferred income tax valuation allowance on these adjustments. |
The following table presents our combined operating income (loss) and operating income (loss) per diluted common share (both non-GAAP measures) and provides reconciliations of GAAP net income (loss) to operating income (loss) and GAAP net income (loss) per diluted common share to operating income (loss) per diluted common share for the years ended December 31, 2014, 2013 and 2012:
| Years Ended December 31, | ||||||||||||
| In millions, except per share amounts |
2014 | 2013 | 2012 | |||||||||
| Net income (loss) |
$ | 569 | $ | 250 | $ | 1,234 | ||||||
| Less: net income of Non-Core Segments, including eliminations |
230 | 192 | 922 | |||||||||
| Less: after-tax adjustments: |
||||||||||||
| Mark-to-market gains (losses) on financial instruments(1) |
(15) | 42 | 24 | |||||||||
| Foreign exchange gains (losses)(1) |
62 | (3) | (4) | |||||||||
| Net gains (losses) on sales of investments(1) |
28 | 15 | 7 | |||||||||
| Net investment losses related to OTTI |
(10) | — | (39) | |||||||||
| Net gains (losses) on extinguishment of debt |
2 | 14 | — | |||||||||
| Tax valuation allowance on adjustments(2) |
87 | 5 | 92 | |||||||||
|
|
|
|
|
|
|
|||||||
| Operating income (loss) |
$ | 185 | $ | (15) | $ | 232 | ||||||
|
|
|
|
|
|
|
|||||||
| Operating income (loss) per diluted common share(3) |
$ | 0.97 | $ | (0.08) | $ | 1.22 | ||||||
|
|
|
|
|
|
|
|||||||
| Weighted average diluted shares used in calculation |
191 | 190 | 190 | |||||||||
(1)—Gross amounts are reported within “Net gains (losses) on financial instruments at fair value and foreign exchange” and the corresponding tax effects are reported within “Provision (benefit) for income taxes” on the Company’s consolidated statements of operations.
(2)—Reported within “Provision (benefit) for income taxes” on the Company’s consolidated statements of operations.
(3)—Operating income (loss) per diluted common share is calculated by taking operating income (loss) divided by GAAP weighted average number of diluted common shares outstanding.
For the year ended December 31, 2014, our combined operating income increased when compared with 2013 primarily as a result of decreases in insurance losses and LAE, operating and interest expense and amortization of deferred acquisition costs, partially offset by lower premiums earned and lower net investment income.
For the year ended December 31, 2013, our combined operating loss increased when compared with 2012 primarily as a result of lower premiums earned, lower net investment income and an increase in insurance losses and LAE. These changes were partially offset by decreases in interest expense and amortization of deferred acquisition costs.
40
Table of Contents
Item 7. Management’s Discussion and Analysis of Financial Condition and Results of Operations
RESULTS OF OPERATIONS (continued)
Adjusted Book Value
In addition to book value per share, we also analyze ABV per share, a non-GAAP measure. We consider ABV a measure of fundamental value of the Company and the change in ABV an important measure of financial performance. ABV adjusts GAAP book value to remove the after-tax results of activities in our Non-Core Segments. In addition, ABV adjusts for certain items which the Company believes will reverse from GAAP book value through GAAP earnings and other comprehensive income, as well as to add in the impact of certain items which the Company believes will be realized in GAAP book value in future periods. The Company has limited such adjustments to those items that it deems to be important to fundamental value and performance and which the likelihood and amount can be reasonably estimated. ABV assumes no new business activity. We have presented ABV to allow investors and analysts to evaluate the Company using the same measure that MBIA’s management regularly uses to measure financial performance and value. ABV is not a substitute for and should not be viewed in isolation of GAAP book value, and our definition of ABV may differ from that used by other companies.
As of December 31, 2014, ABV per share was $24.87, an increase from $24.05 as of December 31, 2013. The increase in ABV per share was primarily driven by net income for 2014 and a decrease in common shares outstanding from the share repurchases made by the Company during 2014.
The following table provides a reconciliation of consolidated book value per share to consolidated ABV per share:
| As of December 31, | ||||||||
| In millions except share and per share amounts |
2014 | 2013 | ||||||
| Total shareholders’ equity of MBIA Inc. |
$ | 3,929 | $ | 3,278 | ||||
| Common shares outstanding |
191,942,895 | 192,249,884 | ||||||
| Book value per share |
$ | 20.47 | $ | 17.05 | ||||
| Reverse book value of Non-Core Segments (after-tax)(1) |
1.16 | 2.45 | ||||||
| Reverse net unrealized (gains) losses included in other comprehensive income (after-tax) |
(0.15) | 0.40 | ||||||
| Add net unearned premium revenue (after-tax)(2)(3) |
3.39 | 4.15 | ||||||
|
|
|
|
|
|||||
| Total adjustments per share |
4.40 | 7.00 | ||||||
|
|
|
|
|
|||||
| Adjusted book value per share |
$ | 24.87 | $ | 24.05 | ||||
|
|
|
|
|
|||||
(1)—The book value for Non-Core Segments, primarily the international and structured finance insurance segment, does not provide significant economic or shareholder value to MBIA Inc. Amounts are net of any deferred taxes available to MBIA Inc.
(2)—Consists of financial guarantee premiums, net of deferred acquisition costs.
(3)—The discount rate on financial guarantee installment premiums was the risk-free rate as defined by the accounting principles for financial guarantee insurance contracts and the discount rate on insured derivative installment revenue and impairments was 5% as of December 31, 2014 and 2013.
Our “Net unearned premium revenue” adjustment to book value per share consists of unearned premium revenue net of prepaid reinsurance premiums related to financial guarantee insurance contracts and the unamortized portion of insurance-related deferred fee revenue.
U.S. Public Finance Insurance
Our U.S. public finance insurance business is primarily conducted through National. The financial guarantees issued by National provide unconditional and irrevocable guarantees of the payment of the principal of, and interest or other amounts owing on, insured obligations when due or, in the event National has exercised, at its discretion, the right to accelerate insured obligations upon default or otherwise. National’s guarantees insure municipal bonds, including tax-exempt and taxable indebtedness of U.S. political subdivisions, as well as utility districts, airports, healthcare institutions, higher educational facilities, student loan issuers, housing authorities and other similar agencies and obligations issued by private entities that finance projects that serve a substantial public purpose. Municipal bonds and privately issued bonds used for the financing of public purpose projects are generally supported by taxes, assessments, user fees or tariffs related to the use of these projects, lease payments or other similar types of revenue streams.
41
Table of Contents
Item 7. Management’s Discussion and Analysis of Financial Condition and Results of Operations
RESULTS OF OPERATIONS (continued)
The following table presents our U.S. public finance insurance segment results for the years ended December 31, 2014, 2013 and 2012:
| Years Ended December 31, | Percent Change | |||||||||||||||||||
| In millions |
2014 | 2013 | 2012 | 2014 vs. 2013 | 2013 vs. 2012 | |||||||||||||||
| Net premiums earned |
$ | 289 | $ | 366 | $ | 492 | -21% | -26% | ||||||||||||
| Net investment income |
119 | 142 | 218 | -16% | -35% | |||||||||||||||
| Fees and reimbursements |
9 | 7 | 6 | 29% | 17% | |||||||||||||||
| Realized gains (losses) and other settlements on insured derivatives |
1 | 3 | 1 | -67% | n/m | |||||||||||||||
| Net gains (losses) on financial instruments at fair value and foreign exchange |
26 | 29 | 121 | -10% | -76% | |||||||||||||||
| Net investment losses related to other-than-temporary impairments |
(15) | — | — | n/m | —% | |||||||||||||||
| Other net realized gains (losses) |
14 | (29) | — | -148% | n/m | |||||||||||||||
|
|
|
|
|
|
|
|
|
|
|
|||||||||||
| Total revenues |
443 | 518 | 838 | -14% | -38% | |||||||||||||||
|
|
|
|
|
|
|
|
|
|
|
|||||||||||
| Losses and loss adjustment |
(10) | 105 | 21 | -110% | n/m | |||||||||||||||
| Amortization of deferred acquisition costs |
61 | 78 | 103 | -22% | -24% | |||||||||||||||
| Operating |
55 | 84 | 145 | -35% | -42% | |||||||||||||||
|
|
|
|
|
|
|
|
|
|
|
|||||||||||
| Total expenses |
106 | 267 | 269 | -60% | —% | |||||||||||||||
|
|
|
|
|
|
|
|
|
|
|
|||||||||||
| Income (loss) before income taxes |
337 | 251 | 569 | 34% | -56% | |||||||||||||||
| Provision (benefit) for income taxes |
115 | 82 | 188 | 40% | -56% | |||||||||||||||
|
|
|
|
|
|
|
|
|
|
|
|||||||||||
| Net income (loss) |
$ | 222 | $ | 169 | $ | 381 | 31% | -56% | ||||||||||||
|
|
|
|
|
|
|
|
|
|
|
|||||||||||
n/m—Percent change not meaningful.
During 2014, National insured $343 million of par, including $300 million relating to the DWSD Bonds. Subsequent to December 31, 2014, National insured an additional $26 million of gross par exposure, through February 26, 2015. Low interest rates, narrow spreads and competitive pricing levels continue to severely limit new business opportunities. As of December 31, 2014, National was rated AA+ with a stable outlook by Kroll Bond Rating Agency, AA- with a stable outlook by S&P and A3 with a negative outlook by Moody’s. With these current ratings, National seeks to support the credit enhancement needs of municipal debt issuers across the U.S. National maintains underwriting criteria for most municipal risk types and expects opportunities for new business across the spectrum of municipal sectors. National’s underwriting criteria does not limit it to particular sectors. We expect that the majority of its new business will be in the general obligation, tax-backed and revenue bond sectors.
OPERATING INCOME (LOSS) In addition to the above results, we also analyze the operating performance of our U.S. public finance insurance segment using operating income (loss), a non-GAAP measure. We believe operating income (loss), as used by management, is useful for an understanding of the results of operations of the Company. Operating income (loss) is not a substitute for net income (loss) determined in accordance with GAAP, and our definition of operating income (loss) may differ from that used by other companies.
42
Table of Contents
Item 7. Management’s Discussion and Analysis of Financial Condition and Results of Operations
RESULTS OF OPERATIONS (continued)
The following table presents a reconciliation of GAAP net income (loss) to operating income (loss) for the years ended December 31, 2014, 2013 and 2012:
| Years Ended December 31, | ||||||||||||
| In millions |
2014 | 2013 | 2012 | |||||||||
| Net income (loss) |
$ | 222 | $ | 169 | $ | 381 | ||||||
| Less: after-tax adjustments: |
||||||||||||
| Net gains (losses) on sales of investments(1) |
11 | 18 | 68 | |||||||||
| Net investment losses related to OTTI |
(10) | — | — | |||||||||
|
|
|
|
|
|
|
|||||||
| Operating income (loss) |
$ | 221 | $ | 151 | $ | 313 | ||||||
|
|
|
|
|
|
|
|||||||
(1)—Gross amounts are reported within “Net gains (losses) on financial instruments at fair value and foreign exchange” and the corresponding tax effects are reported within “Provision (benefit) for income taxes” on the Company’s consolidated statements of operations.
For the year ended December 31, 2014, our U.S. public finance insurance segment’s operating income increased when compared with 2013 primarily as a result of decreases in insurance losses and LAE, consulting fees and legal and litigation related costs and a lower impairment charge on our Armonk, New York facility. These changes were partially offset by lower premiums earned and lower net investment income.
For the year ended December 31, 2013, our U.S. public finance insurance segment’s operating income decreased when compared with 2012 primarily as a result of decreases in net premiums earned and net investment income and an increase in insurance losses and LAE. These changes were partially offset by a decrease in legal and litigation related costs.
NET PREMIUMS EARNED Net premiums earned on financial guarantees represent gross premiums earned net of premiums ceded to reinsurers, and include scheduled premium earnings and premium earnings from refunded issues. The decrease in net premiums earned for 2014 compared with 2013 resulted from decreases in refunded premiums earned of $39 million and scheduled premiums earned of $38 million. The decrease in net premiums earned for 2013 compared with 2012 resulted from decreases in refunded premiums earned of $102 million and $24 million in scheduled premiums earned. Scheduled premium earnings declined due to the refunding and maturity of insured issues within our U.S. public finance portfolio with no material new insurance writings. Refunding activity over the past several years has accelerated premium earnings in prior periods and reduced the amount of scheduled premiums that would have been earned in the current period. Refundings have experienced a decline when compared to the prior period due to an overall decrease in municipal market issuance.
NET INVESTMENT INCOME The decreases in net investment income for 2014 compared with 2013 and 2012 were primarily due to lower yields on investment assets as a result of the repayment of a higher yielding secured loan by MBIA Corp. in May of 2013.
NET GAINS (LOSSES) ON FINANCIAL INSTRUMENTS AT FAIR VALUE AND FOREIGN EXCHANGE The unfavorable change in net gains (losses) on financial instruments at fair value and foreign exchange for 2014 compared with 2013 and 2012 were principally due to decreases in net realized gains from the sales of securities from the ongoing management of our U.S. public finance insurance investment portfolio partially offset by mark-to-market gains on financial instruments.
NET INVESTMENT LOSSES RELATED TO OTHER-THAN-TEMPORARY IMPAIRMENTS Net investment losses related to OTTI for 2014 was primarily related to one impaired security for which a loss was recognized as the difference between its amortized cost and the net present value of its projected cash flows. This OTTI resulted from liquidity concerns, downgrades in credit and other adverse financial conditions of the issuer. Refer to the “Liquidity” section included herein for additional information about impaired investments.
OTHER NET REALIZED GAINS (LOSSES) Other net realized gains (losses) for 2014 included an insurance recovery received on an errors and omissions liability policy of $18 million, partially offset by an additional impairment charge on our Armonk, New York facility of $3 million. Other net realized gains (losses) for 2013 related to an impairment charge of $29 million on our Armonk, New York facility.
43
Table of Contents
Item 7. Management’s Discussion and Analysis of Financial Condition and Results of Operations
RESULTS OF OPERATIONS (continued)
LOSS AND LOSS ADJUSTMENT EXPENSES National’s portfolio surveillance group is responsible for monitoring our U.S. public finance segment’s insured obligations. The level and frequency of monitoring of any insured obligation depends on the type, size, rating and performance of the insured issue.
Refer to “Note 2: Significant Accounting Policies” and “Note 6: Loss and Loss Adjustment Expense Reserves” in the Notes to Consolidated Financial Statements for a description of the Company’s loss reserving policy and additional information related to its loss reserves.
The following table presents information about our U.S. public finance insurance loss and LAE expenses for the years ended December 31, 2014, 2013 and 2012:
| Years Ended December 31, | Percent Change | |||||||||||||||||||
| In millions |
2014 | 2013 | 2012 | 2014 vs. 2013 | 2013 vs. 2012 | |||||||||||||||
| Loss and LAE related to expected payments |
$ | (30) | $ | 29 | $ | 67 | n/m | -57% | ||||||||||||
| Recoveries of expected payments |
20 | 76 | (46) | -74% | n/m | |||||||||||||||
|
|
|
|
|
|
|
|
|
|
|
|||||||||||
| Gross losses incurred |
(10) | 105 | 21 | -110% | n/m | |||||||||||||||
| Reinsurance |
— | — | — | —% | —% | |||||||||||||||
|
|
|
|
|
|
|
|
|
|
|
|||||||||||
| Losses and loss adjustment expenses |
$ | (10) | $ | 105 | $ | 21 | -110% | n/m | ||||||||||||
|
|
|
|
|
|
|
|
|
|
|
|||||||||||
n/m—Percent change not meaningful.
The benefit in losses and LAE for the year ended December 31, 2014 primarily related to decreases in reserves for certain general obligation bonds, partially offset by increases in reserves for Puerto Rico exposures. The losses and LAE for the year ended December 31, 2013 primarily related to certain general obligation bonds and a loss related to the difference in the value of a salvage receivable recorded and the fair market value of the marketable securities received in the third quarter of 2013 in connection with the restructuring of a gaming revenue transaction. Any subsequent change in the fair market value of the marketable securities is accounted for in accordance with available-for-sale (“AFS”) securities. Refer to “Note 2: Significant Accounting Policies” in the Notes to Consolidated Financial Statements included in this Annual Report on Form 10-K for additional information related to AFS securities. For the year ended December 31, 2012, losses and LAE primarily related to certain general obligation bonds and lease transactions.
The following table presents information about our U.S. public finance insurance loss and LAE reserves and recoverables as of December 31, 2014 and 2013:
| In millions |
December 31, 2014 | December 31, 2013 | Percent Change | |||||||||
| Gross loss and LAE reserves |
$ | 70 | $ | 147 | -52% | |||||||
| Expected recoveries on unpaid losses |
(25) | (60) | -58% | |||||||||
|
|
|
|
|
|
|
|||||||
| Loss and LAE reserves |
$ | 45 | $ | 87 | -48% | |||||||
|
|
|
|
|
|
|
|||||||
| Insurance loss recoverable |
$ | 4 | $ | 13 | -69% | |||||||
| Reinsurance recoverable on paid and unpaid losses(1) |
$ | 1 | $ | 1 | —% | |||||||
(1)—Reported within “Other assets” on our consolidated balance sheets.
Loss and LAE reserves as of December 31, 2014 decreased compared with December 31, 2013 primarily as a result of decreases in expected payments on certain general obligation bonds, partially offset by increases in expected payments for Puerto Rico exposures.
44
Table of Contents
Item 7. Management’s Discussion and Analysis of Financial Condition and Results of Operations
RESULTS OF OPERATIONS (continued)
Included in our U.S. public finance loss and LAE reserves are both reserves for insured obligations for which a payment default has occurred and National has already paid a claim and also for which a payment default has not yet occurred, but a claim is expected in the future. The following table includes LAE reserves, but excludes par outstanding, as of December 31, 2014 and 2013 for one issue that had no expected future claim payments, but for which National was obligated to pay LAE incurred in prior periods. As of December 31, 2014 and 2013, loss and LAE reserves comprised the following:
| $ in millions |
Number of Issues(1) | Loss and LAE Reserve | Par Outstanding | |||||||||||||||||||||
| December 31, 2014 |
December 31, 2013 |
December 31, 2014 |
December 31, 2013 |
December 31, 2014 |
December 31, 2013 |
|||||||||||||||||||
| Gross of reinsurance: |
||||||||||||||||||||||||
| Issues with defaults |
4 | 7 | $ | 19 | $ | 74 | $ | 123 | $ | 621 | ||||||||||||||
| Issues without defaults |
7 | 7 | 26 | 13 | 1,501 | 87 | ||||||||||||||||||
|
|
|
|
|
|
|
|
|
|
|
|
|
|||||||||||||
| Total gross of reinsurance |
11 | 14 | $ | 45 | $ | 87 | $ | 1,624 | $ | 708 | ||||||||||||||
|
|
|
|
|
|
|
|
|
|
|
|
|
|||||||||||||
(1)—An “issue” represents the aggregate of financial guarantee policies that share the same revenue source for purposes of making debt service payments.
Par outstanding as of December 31, 2014 increased compared with December 31, 2013 as a result from the addition of a Puerto Rico issue to our “Classified List.”
POLICY ACQUISITION COSTS AND OPERATING EXPENSES U.S. public finance insurance segment expenses for the years ended December 31, 2014, 2013 and 2012 are presented in the following table:
| Years Ended December 31, | Percent Change | |||||||||||||||||||
| In millions |
2014 | 2013 | 2012 | 2014 vs. 2013 | 2013 vs. 2012 | |||||||||||||||
| Gross expenses |
$ | 56 | $ | 84 | $ | 145 | -33% | -42% | ||||||||||||
|
|
|
|
|
|
|
|
|
|
|
|||||||||||
| Amortization of deferred acquisition costs |
$ | 61 | $ | 78 | $ | 103 | -22% | -24% | ||||||||||||
| Operating |
55 | 84 | 145 | -35% | -42% | |||||||||||||||
|
|
|
|
|
|
|
|
|
|
|
|||||||||||
| Total insurance operating expenses |
$ | 116 | $ | 162 | $ | 248 | -28% | -35% | ||||||||||||
|
|
|
|
|
|
|
|
|
|
|
|||||||||||
Gross expenses represent total insurance expenses before the deferral of any policy acquisition costs. Gross expenses decreased for the year ended December 31, 2014 compared with 2013 due to decreases in consulting fees and legal and litigation related costs. Gross expenses decreased for the year ended December 31, 2013 compared with 2012 due to decreases in legal and litigation related costs.
Amortization of deferred acquisition costs decreased for the year ended December 31, 2014 compared with 2013 due to lower refunding activity in 2014. Amortization of deferred acquisition costs decreased for the year ended December 31, 2013 compared with 2012 due to higher refunding activity in 2012. We did not defer a material amount of policy acquisition costs during 2014, 2013 or 2012.
INSURED PORTFOLIO EXPOSURE Financial guarantee insurance companies use a variety of approaches to assess the underlying credit risk profile of their insured portfolios. MBIA uses both an internally developed credit rating system as well as third-party rating sources in the analysis of credit quality measures of its insured portfolio. In evaluating credit risk, we obtain, when available, the underlying rating of the insured obligation before the benefit of its insurance policy from nationally recognized rating agencies, Moody’s and S&P. Other companies within the financial guarantee industry may report credit quality information based upon internal ratings that would not be comparable to our presentation. We maintain internal ratings on our entire portfolio, and our ratings may be higher or lower than the ratings assigned by Moody’s or S&P.
45
Table of Contents
Item 7. Management’s Discussion and Analysis of Financial Condition and Results of Operations
RESULTS OF OPERATIONS (continued)
The following table presents the credit quality distribution of MBIA’s U.S. public finance outstanding gross par insured as of December 31, 2014 and 2013. Capital appreciation bonds (“CABs”) are reported at the par amount at the time of issuance of the insurance policy. All ratings are as of the period presented and represent S&P ratings. If transactions are not rated by S&P, a Moody’s equivalent rating is used. If transactions are not rated by either S&P or Moody’s, an internal equivalent rating is used.
| Gross Par Outstanding | ||||||||||||||||
| In millions | December 31, 2014 | December 31, 2013 | ||||||||||||||
| Rating |
Amount | % | Amount | % | ||||||||||||
| AAA |
$ | 11,364 | 5.1% | $ | 16,293 | 5.9% | ||||||||||
| AA |
107,399 | 48.3% | 133,188 | 48.1% | ||||||||||||
| A |
80,744 | 36.3% | 99,631 | 36.0% | ||||||||||||
| BBB |
17,131 | 7.7% | 23,127 | 8.3% | ||||||||||||
| Below investment grade |
5,655 | 2.6% | 4,607 | 1.7% | ||||||||||||
|
|
|
|
|
|
|
|
|
|||||||||
| Total |
$ | 222,293 | 100.0% | $ | 276,846 | 100.0% | ||||||||||
|
|
|
|
|
|
|
|
|
|||||||||
U.S. Public Finance Insurance Puerto Rico Exposures
The following is a summary of exposures within the insured portfolio of our U.S. public finance insurance segment related to Puerto Rico as of December 31, 2014.
| In millions |
Gross Par Outstanding | National Internal Rating | ||||||
| Puerto Rico Electric Power Authority (PREPA)(1) |
$ | 1,422 | d | |||||
| Puerto Rico Commonwealth GO(1) |
1,114 | bbb3 | ||||||
| Puerto Rico Highway and Transportation Authority Transportation Revenue (PRHTA)(1) |
792 | bb3 | ||||||
| Puerto Rico Sales Tax Financing Corporation (COFINA)(1) |
684 | a3 | ||||||
| Puerto Rico Government Development Bank GO |
267 | bbb3 | ||||||
| Puerto Rico Highway and Transportation Authority Highway Revenue (PRHTA) |
127 | bb2 | ||||||
| University of Puerto Rico System Revenue |
92 | bbb3 | ||||||
| Inter American University of Puerto Rico Inc. |
28 | a3 | ||||||
| Puerto Rico Industrial Development Company |
15 | bbb2 | ||||||
|
|
|
|||||||
| Total |
$ | 4,541 | ||||||
|
|
|
|||||||
(1)—Includes CABs that reflect the gross par amount at the time of issuance of the insurance policy.
In June of 2014, the Governor of Puerto Rico signed into law the Public Corporations Debt Enforcement and Recovery Act (the “Recovery Act”) that established a bankruptcy framework for public corporations including PRHTA (highway authority), PREPA (power authority) and Puerto Rico Aqueduct and Sewer Authority (water and sewer authority). The legislature’s statement of motives for the Recovery Act excludes certain other entities from seeking relief under the Recovery Act, including, among others, Puerto Rico, COFINA, the Government Development Bank of Puerto Rico (“GDB”), the University of Puerto Rico, and the Puerto Rico Industrial Development Company. According to the government, the intent of the Recovery Act was to stabilize the island’s fiscal condition and protect and reinforce Puerto Rico’s credit. The law was immediately challenged on constitutional grounds in U.S. District Court by a number of bondholders. Largely as a result of the Recovery Act being interpreted as an unwillingness to pay, the ratings of the Commonwealth and all other Puerto Rico issuers were downgraded to non-investment grade status except for COFINA. These rating downgrades have limited traditional market access for the Commonwealth and its instrumentalities and caused liquidity constraints. In February of 2015, the Recovery Act was ruled unconstitutional. Following this, an appeal was filed to the U.S. Court of Appeals by Puerto Rico. The appeal is pending.
46
Table of Contents
Item 7. Management’s Discussion and Analysis of Financial Condition and Results of Operations
RESULTS OF OPERATIONS (continued)
While Puerto Rico is experiencing fiscal stress that could lead to defaults on its debt obligations, it has taken steps to address its significant financial challenges by the passage of a balanced general fund budget for the fiscal year ending June 30, 2015, the passing of comprehensive reform of its employee retirement system, and the enactment of the Fiscal Sustainability Act, which allows the government to exercise emergency powers, including steps to lower spending on government operations and labor, to deal with its fiscal crisis.
Although we have downgraded our internal rating of certain Puerto Rico issuers to below investment grade, all of the insured obligations included in the preceding table are presently current on debt service payments.
National’s outstanding gross par exposure to Puerto Rico was reduced by $290 million on July 1, 2014 as a result of debt service payments made by Puerto Rico, including $109 million and $54 million of debt service payments on exposure to PREPA and PRTHA, respectively. Following the July 1 debt service payment date, PREPA announced that it did not make a June 25, 2014 deposit to the bond service account and redemption account used to fund debt service payments on its bonds. PREPA also announced that in order to cover the shortfall in the amounts available to make the July 1 debt service payment, the trustee for the bonds withdrew approximately $41.6 million from the reserve account for the bonds, which amount included approximately $10.6 million in excess of the amount of interest determined by PREPA to be payable on the bonds within the ensuing twelve months. In August of 2014, National, along with other insurers and certain bondholders provided a forbearance and amendment through March 31, 2015. The forbearance and amendment provides PREPA with access to approximately $280 million in its construction fund for payment of current expenses and capital improvements, subject to certain terms and conditions. As part of the conditions to the forbearance, PREPA retained a Chief Restructuring Officer and agreed to certain disclosure covenants, including weekly cash flow forecasts, a report on its accounts receivables, and a draft business plan. PREPA has requested an extension of the forbearance agreement through June of 2015.
Meanwhile, the Governor of Puerto Rico has been pushing legislative steps to restore the financial health of PRHTA and eliminate the recurring need for deficit financing from the GDB. Through October of 2014, National and certain other bond insurers were actively engaged in discussions with the GDB and PRHTA’s advisors regarding legislative steps that would support PRHTA. The legislation was signed into law by the Governor of Puerto Rico in January of 2015 and provides for an increase in the aggregate petroleum products tax from $9.25 per barrel to $15.50 per barrel, the reallocation of a portion of the petroleum products tax to another entity, and allows for transfer of certain PRHTA debts to another entity for repayment. The legislation has undergone amendments since its passage, and it is possible that the legislature may pass further amendments to the bill.
In February of 2015, S&P and Moody’s further downgraded the ratings of all the issuers of Puerto Rico and its instrumentalities, including COFINA, to below investment grade ratings with a negative outlook due to narrowing liquidity, sluggish economic growth and uncertainty regarding the administration’s proposed tax legislation.
International and Structured Finance Insurance
Our international and structured finance insurance portfolio is principally operated through MBIA Corp. The financial guarantees issued by MBIA Corp. generally provide unconditional and irrevocable guarantees of the payment of the principal of, and interest or other amounts owing on, non-U.S. public finance and global structured finance insured obligations when due or, in the event MBIA Corp. has the right, at its discretion, to accelerate insured obligations upon default or otherwise, upon MBIA Corp.’s acceleration. Certain guaranteed investment contracts written by MBIA Inc. are insured by MBIA Corp., and if MBIA Inc. or such subsidiaries were to have insufficient assets to pay amounts due upon maturity or termination, MBIA Corp. would make such payments under its insurance policies. MBIA Corp. also insured debt obligations of other affiliates, including GFL and MBIA Investment Management Corp. (“IMC”). MBIA Corp. has also written insurance policies guaranteeing the obligations under credit default swaps (“CDS”) contracts of an affiliate, LaCrosse Financial Products, LLC (“LaCrosse”), including termination payments that may become due in certain events, including the insolvency or payment defaults of MBIA Corp. or LaCrosse. MBIA Insurance Corporation also provides reinsurance to its insurance subsidiaries.
47
Table of Contents
Item 7. Management’s Discussion and Analysis of Financial Condition and Results of Operations
RESULTS OF OPERATIONS (continued)
MBIA Corp. insures non-U.S. public finance and global structured finance, including asset-backed, obligations. MBIA Corp. has insured sovereign-related and sub-sovereign bonds, utilities, privately issued bonds used for the financing of projects that include toll roads, bridges, airports, public transportation facilities, and other types of infrastructure projects serving a substantial public purpose. Global structured finance and asset-backed obligations typically are securities repayable from expected cash flows generated by a specified pool of assets, such as residential and commercial mortgages, insurance policies, consumer loans, corporate loans and bonds, trade and export receivables, and leases for equipment, aircraft and real estate property. We no longer insure new credit derivative contracts except for transactions related to the reduction of existing derivative exposure.
The following table presents our international and structured finance insurance segment results for the years ended December 31, 2014, 2013 and 2012:
| Years Ended December 31, | Percent Change | |||||||||||||||||||
| In millions |
2014 | 2013 | 2012 | 2014 vs. 2013 | 2013 vs. 2012 | |||||||||||||||
| Net premiums earned |
$ | 144 | $ | 143 | $ | 179 | 1% | -20% | ||||||||||||
| Net investment income |
16 | 14 | 28 | 14% | -50% | |||||||||||||||
| Fees and reimbursements |
87 | 85 | 146 | 2% | -42% | |||||||||||||||
| Change in fair value of insured derivatives: |
||||||||||||||||||||
| Realized gains (losses) and other settlements on insured derivatives |
(445) | (1,548) | (407) | -71% | n/m | |||||||||||||||
| Unrealized gains (losses) on insured derivatives |
903 | 1,777 | 1,870 | -49% | -5% | |||||||||||||||
|
|
|
|
|
|
|
|
|
|
|
|||||||||||
| Net change in fair value of insured derivatives |
458 | 229 | 1,463 | 100% | -84% | |||||||||||||||
| Net gains (losses) on financial instruments at fair value and foreign exchange |
— | 24 | 38 | -100% | -37% | |||||||||||||||
| Net investment losses related to other-than-temporary impairments |
— | — | (45) | —% | -100% | |||||||||||||||
| Other net realized gains (losses) |
12 | — | 1 | n/m | -100% | |||||||||||||||
| Revenues of consolidated VIEs: |
||||||||||||||||||||
| Net investment income |
50 | 51 | 53 | -2% | -4% | |||||||||||||||
| Net gains (losses) on financial instruments at fair value and foreign exchange |
52 | 165 | 8 | -68% | n/m | |||||||||||||||
| Other net realized gains (losses) |
— | 5 | — | -100% | n/m | |||||||||||||||
|
|
|
|
|
|
|
|
|
|
|
|||||||||||
| Total revenues |
819 | 716 | 1,871 | 14% | -62% | |||||||||||||||
|
|
|
|
|
|
|
|
|
|
|
|||||||||||
| Losses and loss adjustment |
143 | 12 | 29 | n/m | -59% | |||||||||||||||
| Amortization of deferred acquisition costs |
78 | 96 | 112 | -19% | -14% | |||||||||||||||
| Operating |
56 | 98 | 135 | -43% | -27% | |||||||||||||||
| Interest |
110 | 160 | 237 | -31% | -32% | |||||||||||||||
| Expenses of consolidated VIEs: |
||||||||||||||||||||
| Operating |
9 | 12 | 20 | -25% | -40% | |||||||||||||||
| Interest |
39 | 40 | 42 | -3% | -5% | |||||||||||||||
|
|
|
|
|
|
|
|
|
|
|
|||||||||||
| Total expenses |
435 | 418 | 575 | 4% | -27% | |||||||||||||||
|
|
|
|
|
|
|
|
|
|
|
|||||||||||
| Income (loss) before income taxes |
384 | 298 | 1,296 | 29% | -77% | |||||||||||||||
| Provision (benefit) for income taxes |
134 | 101 | 432 | 33% | -77% | |||||||||||||||
|
|
|
|
|
|
|
|
|
|
|
|||||||||||
| Net income (loss) |
$ | 250 | $ | 197 | $ | 864 | 27% | -77% | ||||||||||||
|
|
|
|
|
|
|
|
|
|
|
|||||||||||
n/m—Percent change not meaningful.
48
Table of Contents
Item 7. Management’s Discussion and Analysis of Financial Condition and Results of Operations
RESULTS OF OPERATIONS (continued)
For the years ended December 31, 2014, 2013 and 2012, we did not have any new international and structured finance insurance writings. The lack of insurance writings in our international and structured finance insurance segment reflects the insurance financial strength credit ratings assigned to MBIA Corp. by the major rating agencies. We do not expect to write new business in our international and structured finance insurance segment in the foreseeable future and our primary strategies are risk reduction, loss mitigation and value preservation. As of December 31, 2014, MBIA Corp.’s total insured gross par outstanding was $55.2 billion. Since December 31, 2007, our total insured gross par outstanding has decreased approximately 83% from $331.2 billion. Furthermore, MBIA UK is no longer licensed to write new business as a result of being placed in run-off during 2013, and any new financial guarantee insurance would require regulatory approval.
NET PREMIUMS EARNED Our international and structured finance insurance segment generates net premiums from insurance policies accounted for as financial guarantee contracts. Certain premiums may be eliminated in our consolidated financial statements as a result of the Company consolidating variable interest entities (“VIEs”). In addition, we generate net premiums from insured credit derivatives that are included in “Realized gains (losses) and other settlements on insured derivatives” on our consolidated statements of operations. The following table provides net premiums earned from our financial guarantee contracts for the years ended December 31, 2014, 2013 and 2012:
| Years Ended December 31, | Percent Change | |||||||||||||||||||
| In millions |
2014 | 2013 | 2012 | 2014 vs. 2013 | 2013 vs. 2012 | |||||||||||||||
| Net premiums earned: |
||||||||||||||||||||
| Non-U.S. |
$ | 110 | $ | 95 | $ | 117 | 16% | -19% | ||||||||||||
| U.S. |
34 | 48 | 62 | -29% | -23% | |||||||||||||||
|
|
|
|
|
|
|
|
|
|
|
|||||||||||
| Total net premiums earned |
$ | 144 | $ | 143 | $ | 179 | 1% | -20% | ||||||||||||
|
|
|
|
|
|
|
|
|
|
|
|||||||||||
| VIEs (eliminated in consolidation) |
$ | 14 | $ | 15 | $ | 15 | -7% | —% | ||||||||||||
Net premiums earned represent gross premiums earned net of premiums ceded to reinsurers, and include scheduled premium earnings and premium earnings from refunded issues. Net premiums earned increased slightly for 2014 compared with 2013 primarily due to an increase in refunded premiums earned from the termination of a policy, partially offset by decreases in scheduled premiums earned from the maturity and early settlement of insured transactions with no material writings of new insurance policies. Net premiums earned decreased for 2013 compared with 2012 primarily due to the maturity and early settlement of insured transactions with no material writings of new insurance policies.
FEES AND REIMBURSEMENTS The increase in fees and reimbursements for 2014 compared with 2013 was primarily due to an increase in termination and waiver and consent fees related to ongoing management of our international and structured finance insurance business, partially offset by a decrease in ceding commission income from National. The decrease in fees and reimbursements for 2013 compared with 2012 was primarily due to a decrease in waiver and consent fees related to the ongoing management of our international and structured finance insurance business. Due to the transaction-specific nature inherent in fees and reimbursements, these revenues can vary significantly from period to period.
49
Table of Contents
Item 7. Management’s Discussion and Analysis of Financial Condition and Results of Operations
RESULTS OF OPERATIONS (continued)
NET CHANGE IN FAIR VALUE OF INSURED DERIVATIVES The following table presents the net premiums and fees earned related to derivatives and the components of the net change in fair value of insured derivatives for the years ended December 31, 2014, 2013 and 2012:
| Years Ended December 31, | Percent Change | |||||||||||||||||||
| In millions |
2014 | 2013 | 2012 | 2014 vs. 2013 | 2013 vs. 2012 | |||||||||||||||
| Net premiums and fees earned on insured derivatives |
$ | 18 | $ | 35 | $ | 57 | -49% | -39% | ||||||||||||
| Realized gains (losses) on insured derivatives |
(463) | (1,583) | (464) | -71% | n/m | |||||||||||||||
|
|
|
|
|
|
|
|
|
|
|
|||||||||||
| Realized gains (losses) and other settlements on insured derivatives |
(445) | (1,548) | (407) | -71% | n/m | |||||||||||||||
| Unrealized gains (losses) on insured derivatives |
903 | 1,777 | 1,870 | -49% | -5% | |||||||||||||||
|
|
|
|
|
|
|
|
|
|
|
|||||||||||
| Net change in fair value of insured derivatives |
$ | 458 | $ | 229 | $ | 1,463 | 100% | -84% | ||||||||||||
|
|
|
|
|
|
|
|
|
|
|
|||||||||||
n/m—Percent change not meaningful.
The Company no longer insures new credit derivative contracts except in transactions related to the restructuring or reduction of existing derivative exposure. Premiums earned related to insured credit derivatives will decrease over time as a result of settlements prior to maturity and scheduled amortizations. For the year ended December 31, 2014, realized losses on insured derivatives resulted primarily from settlements and claim payments on CMBS transactions.
For the year ended December 31, 2014, unrealized gains on insured derivatives were principally associated with the reversal of unrealized losses from commutations. For the year ended December 31, 2013, unrealized gains on insured derivatives were principally associated with the reversal of unrealized losses from commutations, a decline in the weighted average life on transactions and favorable changes in spread/prices on the underlying collateral, partially offset by the effects of MBIA’s nonperformance risk on its derivative liabilities. For the year ended December 31, 2012, unrealized gains on insured derivatives were principally associated with the reversal of unrealized losses from commutations, the effects of MBIA Corp.’s nonperformance risk on its derivative liabilities and result of favorable movements in spreads and pricing on collateral within transactions, partially offset by collateral erosion.
As of December 31, 2014, MBIA Corp.’s five year CDS cost was 16.71% upfront plus 5% per annum compared with 13.63% upfront plus 5% per annum and 48.75% upfront plus 5% per annum as of December 31, 2013 and 2012, respectively. As of December 31, 2014 and 2013, the fair value of MBIA Corp.’s insured CDS liability was $244 million and $1.2 billion, respectively. Our mark-to-market on insured credit derivatives uses the most appropriate of the one to ten year CDS cost for each transaction, and those costs ranged from 3.68% upfront plus 5% per annum to 18.98% upfront plus 5% per annum as of December 31, 2014. As of December 31, 2013, those costs ranged from 2.00% upfront plus 5% per annum to 19.25% upfront plus 5% per annum. As of December 31, 2012, those costs ranged from 37.50% upfront plus 5% per annum to 50.50% upfront plus 5% per annum.
As of December 31, 2014, MBIA Corp. had $9.5 billion of gross par outstanding on insured credit derivatives compared with $24.0 billion on December 31, 2013. The decrease in gross par outstanding was primarily due to commutations, contractual terminations, amortizations and maturities. During the year ended December 31, 2014, thirteen insured issues, representing $13.5 billion in gross par outstanding, either matured or were contractually terminated. As of December 31, 2014, 19 insured issues remained, of which 10 insured issues with total gross par outstanding of $7.5 billion are scheduled to mature between 2015 and 2016.
50
Table of Contents
Item 7. Management’s Discussion and Analysis of Financial Condition and Results of Operations
RESULTS OF OPERATIONS (continued)
Since our insured credit derivatives have similar terms, conditions, risks, and economic profiles as our financial guarantee insurance policies, we evaluate them for impairment periodically in the same way that we estimate loss and LAE for our financial guarantee policies. Credit impairments on insured derivatives represent actual payments plus the present values of our estimates of expected future claim payments, net of expected future recoveries. MBIA Corp.’s expected future claim payments were discounted using a rate of 5.17%, the same rate used to calculate its statutory loss reserves as of December 31, 2014. MBIA UK used a rate of 2.20% to discount its expected future claim payments and statutory loss reserves. We estimated that additional credit impairments on insured derivatives (excluding LAE) for the year ended December 31, 2014 were $79 million across eight insured issues. As of December 31, 2014, statutory loss and LAE reserves related to credit impairments were $129 million. Refer to the following “Loss and Loss Adjustment Expenses” section for additional information about credit impairments on insured derivatives.
Our estimate of credit impairments, a non-GAAP measure, may differ from the fair values recorded in our consolidated financial statements. The Company believes its disclosure of credit impairments on insured derivatives provides additional meaningful information about potential realized losses on these contracts. The fair value of an insured derivative contract will be influenced by a variety of market and transaction-specific factors that may be unrelated to potential future claim payments. In the absence of credit impairments or the termination of derivatives at losses, the cumulative unrealized losses recorded from insured derivatives should reverse before or at the maturity of the contracts. Contracts also may be settled prior to maturity at amounts that may be more or less than their recorded fair values. Those settlements can result in realized gains or losses, and will result in the reversal of unrealized gains or losses. The Company is not required to post collateral to counterparties of these contracts. Refer to “Risk Factors” in Part I, Item 1A of this Annual Report on Form 10-K for information on legislative changes that could require collateral posting by MBIA Corp. notwithstanding the contract terms.
NET GAINS (LOSSES) ON FINANCIAL INSTRUMENTS AT FAIR VALUE AND FOREIGN EXCHANGE The decreases in net gains on financial instruments at fair value and foreign exchange for 2014 compared with 2013 and 2012 were primarily due to realized losses from foreign currency revaluation related to Chilean Unidad de Fomento and decreases in net realized gains from the sales of securities.
NET INVESTMENT LOSSES RELATED TO OTHER-THAN-TEMPORARY IMPAIRMENTS Net investment losses related to OTTI for 2012 related to impaired securities that were written down to their fair values as it was our intent to sell the securities before an expected recovery of their fair values to their amortized costs. Refer to “Liquidity” section herein for additional information about impaired investments.
OTHER NET REALIZED GAINS (LOSSES) Other net realized gains (losses) for 2014 primarily related to an insurance recovery received on an errors and omissions liability policy.
REVENUES OF CONSOLIDATED VIEs For 2014, total revenues of consolidated VIEs were $102 million compared with total revenues of $217 million for 2013 and $61 million for 2012. The decrease in revenues of consolidated VIEs for 2014 when compared to 2013 was primarily related to a decrease in net gains from second-lien RMBS put-back claims on ineligible mortgage loans. The increase in revenues of consolidated VIEs for 2013 when compared to 2012 was primarily related to an increase in net gains from second-lien RMBS put-back claims on ineligible mortgage loans.
LOSS AND LOSS ADJUSTMENT EXPENSES MBIA’s insured portfolio management group within our international and structured finance insurance business is responsible for monitoring international and structured finance insured obligations. The level and frequency of monitoring of any insured obligation depends on the type, size, rating and performance of the insured issue.
Refer to “Note 6: Loss and Loss Adjustment Expense Reserves” in the Notes to Consolidated Financial Statements for a description of the Company’s loss reserving policy and additional information related to its loss reserves.
51
Table of Contents
Item 7. Management’s Discussion and Analysis of Financial Condition and Results of Operations
RESULTS OF OPERATIONS (continued)
Summary of Financial Guarantee Insurance Losses and LAE
The following table presents information about our financial guarantee insurance losses and LAE recorded in accordance with GAAP for the years ended December 31, 2014, 2013 and 2012:
| Years Ended December 31, | Percent Change | |||||||||||||||||||
| In millions |
2014 | 2013 | 2012 | 2014 vs. 2013 | 2013 vs. 2012 | |||||||||||||||
| Losses and LAE related to expected payments |
$ | 72 | $ | 69 | $ | 412 | 4% | -83% | ||||||||||||
| Recoveries of expected payments |
71 | (56) | (382) | n/m | -85% | |||||||||||||||
|
|
|
|
|
|
|
|
|
|
|
|||||||||||
| Gross losses incurred |
143 | 13 | 30 | n/m | -57% | |||||||||||||||
| Reinsurance |
— | (1) | (1) | -100% | —% | |||||||||||||||
|
|
|
|
|
|
|
|
|
|
|
|||||||||||
| Losses and loss adjustment expenses |
$ | 143 | $ | 12 | $ | 29 | n/m | -59% | ||||||||||||
|
|
|
|
|
|
|
|
|
|
|
|||||||||||
n/m—Percent change not meaningful
For 2014, the increase in losses and LAE related to expected payments of $72 million primarily related to insured first-lien RMBS transactions, high yield corporate CDOs and other activity, partially offset by benefits related to an international road transaction and ABS CDOs. The decrease in recoveries of expected payments of $71 million primarily related to decreases of projected collections from excess spread within insured second-lien RMBS securitizations and expected recoveries on an international road transaction, partially offset by an increase in recoveries of expected payments related to insured first-lien RMBS transactions.
Excess spread is generated by performing loans within insured second-lien RMBS securitizations and is the difference between interest inflows on mortgage loan collateral and interest outflows on insured beneficial interests. The amount of excess spread depends on the future loss trends (which include future delinquency trends, average time to charge-off delinquent loans and the availability of pool mortgage insurance), the future spread between prime and the London Interbank Offered Rate (“LIBOR”) interest rates, and borrower refinancing behavior which results in voluntary prepayments. Minor deviations in loss trends and voluntary prepayments may substantially impact the amounts we collect from excess spread.
For 2013, the increase in losses and LAE related to expected payments of $69 million primarily related to insured second-lien RMBS transactions and other activity. This was partially offset by a benefit related to insured first-lien RMBS transactions. Included in the increase in recoveries of expected payments of $56 million were recoveries primarily resulting from ineligible mortgage loans included in insured exposures and activity related to insured first-lien transactions, partially offset by a reduction in excess spread within the securitizations. In addition, there was a decrease in other activity that related to a reversal of recoveries related to high yield corporate CDOs, partially offset by an increase in recoveries related to an international road transaction.
For 2012, the increase in losses and LAE related to expected payments of $412 million primarily related to insured second-lien RMBS transactions, insured first-lien RMBS transactions and other activity. Included in the increase in recoveries of expected payments of $382 million were recoveries related to second-lien RMBS transactions resulting from ineligible mortgage loans included in insured exposures that were subject to contractual obligations by sellers/servicers to repurchase or replace such mortgage loans. This was partially offset by a reduction in excess spread within the securitizations.
For the years ended December 31, 2014, 2013 and 2012, losses and LAE incurred included the elimination of a $20 million expense, a $56 million benefit and a $140 million expense, respectively, as a result of the consolidation of VIEs. The $20 million expense elimination for the year ended December 31, 2014 included gross losses related to expected payments of $21 million, partially offset by gross recoveries of expected payments of $1 million. The $56 million benefit for the year ended December 31, 2013 included gross recoveries of expected payments of $98 million, partially offset by gross losses related to expected payments of $42 million. The $140 million expense for the year ended December 31, 2012 included gross losses related to expected payments of $100 million and recoveries of expected payments of $40 million.
52
Table of Contents
Item 7. Management’s Discussion and Analysis of Financial Condition and Results of Operations
RESULTS OF OPERATIONS (continued)
The following table presents information about our insurance reserves and recoverable as of December 31, 2014 and 2013. The Company’s insurance loss recoverable represents expected potential recoveries of paid claims based on probability-weighted net cash inflows discounted at applicable risk-free rates as of the measurement date.
| December 31, 2014 |
December 31, 2013 |
|||||||||||
| In millions |
Percent Change | |||||||||||
| Gross loss and LAE reserves |
$ | 583 | $ | 700 | -17% | |||||||
| Expected recoveries on unpaid losses |
(122) | (146) | -16% | |||||||||
|
|
|
|
|
|
|
|||||||
| Loss and LAE reserves |
$ | 461 | $ | 554 | -17% | |||||||
|
|
|
|
|
|
|
|||||||
| Insurance loss recoverable |
$ | 529 | $ | 681 | -22% | |||||||
| Insurance loss recoverable—ceded(1) |
$ | 1 | $ | 5 | -80% | |||||||
| Reinsurance recoverable on paid and unpaid losses(2) |
$ | 6 | $ | 7 | -14% | |||||||
(1)—Reported within “Other liabilities” on our consolidated balance sheets.
(2)—Reported within “Other assets” on our consolidated balance sheets.
Included in MBIA Corp.’s loss and LAE reserves are both reserves for insured obligations for which a payment default has occurred and MBIA Corp. has already paid a claim and also for which a payment default has not yet occurred but a claim is expected in the future. The following table includes LAE reserves, but excludes par outstanding, as of December 31, 2014 and 2013 for two issues and one issue, respectively, that had no expected future claim payments or par outstanding, but for which MBIA Corp. was obligated to pay LAE incurred in prior periods. As of December 31, 2014 and 2013, loss and LAE reserves comprised the following:
| Number of Issues(1) | Loss and LAE Reserve | Par Outstanding | ||||||||||||||||||||||
| $ in millions |
December 31, 2014 |
December 31, 2013 |
December 31, 2014 |
December 31, 2013 |
December 31, 2014 |
December 31, 2013 |
||||||||||||||||||
| Gross of reinsurance: |
||||||||||||||||||||||||
| Issues with defaults |
104 | 103 | $ | 344 | $ | 388 | $ | 4,885 | $ | 6,124 | ||||||||||||||
| Issues without defaults |
7 | 20 | 117 | 166 | 1,492 | 1,029 | ||||||||||||||||||
|
|
|
|
|
|
|
|
|
|
|
|
|
|||||||||||||
| Total gross of reinsurance |
111 | 123 | $ | 461 | $ | 554 | $ | 6,377 | $ | 7,153 | ||||||||||||||
|
|
|
|
|
|
|
|
|
|
|
|
|
|||||||||||||
(1)—An “issue” represents the aggregate of financial guarantee policies that share the same revenue source for purposes of making debt service payments.
As of December 31, 2014, we had loss and LAE reserves related to our remaining insured first and second-lien RMBS exposure of $354 million before eliminating $21 million of loss and LAE reserves related to our consolidated VIEs. The loss and LAE reserves represent the present value of the difference between cash payments we expect to make on the insured transactions and the excess spread we expect from the performing mortgage loans in the securitizations. As payments are made, a portion of those expected future receipts is recorded within “Insurance loss recoverable” on our consolidated balance sheets. The payments that we make virtually all go to reduce the principal balances of the securitizations.
Aggregate Losses and LAE
MBIA Corp. faces significant risks and uncertainties related to potential or actual losses from its first and second-lien RMBS, CDOs and other insured exposures. Continued significant adverse developments and higher than expected payments on these exposures and/or lower than expected recoveries on the RMBS exposures, could result in a decline in the Company’s liquidity and statutory capital position.
The impact of insured exposures on MBIA Corp.’s liquidity position is best understood by assessing the ultimate amount of payments and recoveries with respect to these exposures. In this regard, the Company discloses the discounted expected future net cash flows under all insurance contracts, irrespective of the legal form of the guarantee (i.e., financial guarantee insurance policy or insured derivative contract) or the GAAP accounting basis.
53
Table of Contents
Item 7. Management’s Discussion and Analysis of Financial Condition and Results of Operations
RESULTS OF OPERATIONS (continued)
All amounts presented in the following aggregate losses and LAE tables are calculated in accordance with GAAP, with the exception of those related to insured credit derivative impairments. The amounts reported in aggregate losses and LAE for insured credit derivative impairments are calculated in accordance with U.S. STAT because GAAP does not contain a comparable measurement basis for these contracts. All losses and recoverables reported in the following tables are measured using discounted probability-weighted cash flows. Losses and recoverables on VIEs that are eliminated in consolidation are included because the consolidation of these VIEs does not impact whether or not we will be required to make payments under our insurance contracts. As a result of the different accounting bases of amounts included in the following tables, the total provided in each table represents a non-GAAP measure.
The following tables present the aggregate change in the discounted values of net payments expected to be made on all insurance contracts for the years ended December 31, 2014, 2013 and 2012:
Aggregate Losses and LAE (change in discounted values of net payments)
| Year Ended December 31, 2014 | ||||||||||||||||||||
| In millions |
Second-lien RMBS(1) |
First-lien RMBS |
CDOs(2) | Other(3) | Total | |||||||||||||||
| Increase (decrease) in expected payments |
$ | 16 | $ | 102 | $ | 115 | $ | (56) | $ | 177 | ||||||||||
| (Increase) decrease in expected salvage |
74 | (36) | (3) | 30 | 65 | |||||||||||||||
|
|
|
|
|
|
|
|
|
|
|
|||||||||||
| Total aggregate losses and LAE |
$ | 90 | $ | 66 | $ | 112 | $ | (26) | $ | 242 | ||||||||||
|
|
|
|
|
|
|
|
|
|
|
|||||||||||
(1)—Includes HELOC loans and CES.
(2)—Includes ABS CDOs, CMBS and other CDOs.
(3)—Primarily represents international road and utility transactions.
| Year Ended December 31, 2013 | ||||||||||||||||||||
| In millions |
Second-lien RMBS(1) |
First-lien RMBS |
CDOs(2) | Other(3) | Total | |||||||||||||||
| Increase (decrease) in expected payments |
$ | 154 | $ | (56) | $ | 539 | $ | 81 | $ | 718 | ||||||||||
| (Increase) decrease in expected salvage |
(206) | (10) | 74 | (27) | (169) | |||||||||||||||
|
|
|
|
|
|
|
|
|
|
|
|||||||||||
| Total aggregate losses and LAE |
$ | (52) | $ | (66) | $ | 613 | $ | 54 | $ | 549 | ||||||||||
|
|
|
|
|
|
|
|
|
|
|
|||||||||||
(1)—Includes HELOC loans and CES.
(2)—Includes ABS CDOs, CMBS and other CDOs.
(3)—Primarily represents an international road transaction.
| Year Ended December 31, 2012 | ||||||||||||||||||||
| In millions |
Second-lien RMBS(1) |
First-lien RMBS |
CDOs(2) | Other | Total | |||||||||||||||
| Increase (decrease) in expected payments |
$ | 346 | $ | 146 | $ | 804 | $ | 10 | $ | 1,306 | ||||||||||
| (Increase) decrease in expected salvage |
(333) | 1 | 32 | (8) | (308) | |||||||||||||||
|
|
|
|
|
|
|
|
|
|
|
|||||||||||
| Total aggregate losses and LAE |
$ | 13 | $ | 147 | $ | 836 | $ | 2 | $ | 998 | ||||||||||
|
|
|
|
|
|
|
|
|
|
|
|||||||||||
(1)—Includes HELOC loans and CES.
(2)—Includes ABS CDOs, CMBS and other CDOs.
The decrease in total aggregate losses and LAE for 2014 compared with 2013 was primarily due to decreases in expected payments on CMBS and second-lien RMBS exposures and favorable changes in projected collections from excess spread within insured second-lien RMBS securitizations. These decreases were partially offset by a decrease in recoveries of ineligible mortgage loans included in insured second-lien RMBS exposures.
The decrease in total aggregate losses and LAE for 2013 compared with 2012 was primarily due to decreases in expected payments on CMBS and first and second-lien RMBS exposures, partially offset by a decrease in expected salvage primarily related to lower expected recoveries resulting from excess spread within the RMBS securitizations.
54
Table of Contents
Item 7. Management’s Discussion and Analysis of Financial Condition and Results of Operations
RESULTS OF OPERATIONS (continued)
In addition to the information presented above, the following tables present aggregate losses and LAE for the years ended December 31, 2014, 2013 and 2012 by insurance type:
Aggregate Losses and LAE by Insurance Type (change in discounted values of net payments)
| Year Ended December 31, 2014 | ||||||||||||||||||||
| In millions |
Second-lien RMBS(1) |
First-lien RMBS |
CDOs(2) | Other(3) | Total | |||||||||||||||
| Financial guarantee insurance(4) |
$ | 70 | $ | 65 | $ | 33 | $ | (25) | $ | 143 | ||||||||||
| Financial guarantee insurance related to consolidated VIEs (eliminated in consolidation)(5) |
20 | 2 | (1) | (1) | 20 | |||||||||||||||
| Insured credit derivatives (statutory basis)(6) |
— | (1) | 80 | — | 79 | |||||||||||||||
|
|
|
|
|
|
|
|
|
|
|
|||||||||||
| Total aggregate losses and LAE |
$ | 90 | $ | 66 | $ | 112 | $ | (26) | $ | 242 | ||||||||||
|
|
|
|
|
|
|
|
|
|
|
|||||||||||
(1)—Includes HELOC loans and CES.
(2)—Includes ABS CDOs, CMBS and other CDOs.
(3)—Primarily represents international road and utility transactions.
(4)—Included in “Losses and loss adjustment” as reported on the Company’s consolidated statements of operations.
(5)—Represents losses eliminated upon the consolidation of insured VIEs.
(6)—Represents statutory losses and LAE for insurance contracts accounted for as derivatives. Realized and unrealized gains and losses on these contracts under GAAP are recorded in “Net change in fair value of insured derivatives” on the Company’s consolidated statements of operations.
| Year Ended December 31, 2013 | ||||||||||||||||||||
| In millions |
Second-lien RMBS(1) |
First-lien RMBS |
CDOs(2) | Other(3) | Total | |||||||||||||||
| Financial guarantee insurance(4) |
$ | (2) | $ | (70) | $ | 30 | $ | 54 | $ | 12 | ||||||||||
| Financial guarantee insurance related to consolidated VIEs (eliminated in consolidation)(5) |
(50) | 3 | (9) | — | (56) | |||||||||||||||
| Insured credit derivatives (statutory basis)(6) |
— | 1 | 592 | — | 593 | |||||||||||||||
|
|
|
|
|
|
|
|
|
|
|
|||||||||||
| Total aggregate losses and LAE |
$ | (52) | $ | (66) | $ | 613 | $ | 54 | $ | 549 | ||||||||||
|
|
|
|
|
|
|
|
|
|
|
|||||||||||
(1)—Includes HELOC loans and CES.
(2)—Includes ABS CDOs, CMBS and other CDOs.
(3)—Primarily represents an international road transaction.
(4)—Included in “Losses and loss adjustment” as reported on the Company’s consolidated statements of operations.
(5)—Represents losses eliminated upon the consolidation of insured VIEs.
(6)—Represents statutory losses and LAE for insurance contracts accounted for as derivatives. Realized and unrealized gains and losses on these contracts under GAAP are recorded in “Net change in fair value of insured derivatives” on the Company’s consolidated statements of operations.
| Year Ended December 31, 2012 | ||||||||||||||||||||
| In millions |
Second-lien RMBS(1) |
First-lien RMBS |
CDOs(2) | Other | Total | |||||||||||||||
| Financial guarantee insurance(3) |
$ | (151) | $ | 147 | $ | 31 | $ | 2 | $ | 29 | ||||||||||
| Financial guarantee insurance related to consolidated VIEs (eliminated in consolidation)(4) |
164 | — | (24) | — | 140 | |||||||||||||||
| Insured credit derivatives (statutory basis)(5) |
— | — | 829 | — | 829 | |||||||||||||||
|
|
|
|
|
|
|
|
|
|
|
|||||||||||
| Total aggregate losses and LAE |
$ | 13 | $ | 147 | $ | 836 | $ | 2 | $ | 998 | ||||||||||
|
|
|
|
|
|
|
|
|
|
|
|||||||||||
(1)—Includes HELOC loans and CES.
(2)—Includes ABS CDOs, CMBS and other CDOs.
(3)—Included in “Losses and loss adjustment” as reported on the Company’s consolidated statements of operations.
(4)—Represents losses eliminated upon the consolidation of insured VIEs.
(5)—Represents statutory losses and LAE for insurance contracts accounted for as derivatives. Realized and unrealized gains and losses on these contracts under GAAP are recorded in “Net change in fair value of insured derivatives” on the Company’s consolidated statements of operations.
55
Table of Contents
Item 7. Management’s Discussion and Analysis of Financial Condition and Results of Operations
RESULTS OF OPERATIONS (continued)
POLICY ACQUISITION COSTS AND OPERATING EXPENSES International and structured finance insurance segment expenses for the years ended December 31, 2014, 2013 and 2012 are presented in the following table:
| Years Ended December 31, | Percent Change | |||||||||||||||||||
| In millions |
2014 | 2013 | 2012 | 2014 vs. 2013 | 2013 vs. 2012 | |||||||||||||||
| Gross expenses |
$ | 58 | $ | 104 | $ | 140 | -44% | -26% | ||||||||||||
|
|
|
|
|
|
|
|
|
|
|
|||||||||||
| Amortization of deferred acquisition costs |
$ | 78 | $ | 96 | $ | 112 | -19% | -14% | ||||||||||||
| Operating |
56 | 98 | 135 | -43% | -27% | |||||||||||||||
|
|
|
|
|
|
|
|
|
|
|
|||||||||||
| Total insurance operating expenses |
$ | 134 | $ | 194 | $ | 247 | -31% | -21% | ||||||||||||
|
|
|
|
|
|
|
|
|
|
|
|||||||||||
Gross expenses represent total insurance expenses before the deferral of any policy acquisition costs. Gross expenses decreased for the year ended December 31, 2014 compared with 2013 primarily due to decreases in costs associated with support provided by our corporate segment, compensation expense, consulting fees and legal and litigation related costs. Gross expenses decreased for the year ended December 31, 2013 compared with 2012 primarily due to decreases in legal and litigation related costs.
The decreases in the amortization of deferred acquisition costs for the year ended December 31, 2014 compared with 2013 and 2012 principally reflect the acceleration of deferred costs into earnings in prior periods as policies were terminated. Operating expenses decreased for the year ended December 31, 2014 compared with 2013 and 2012 due to decreases in gross expenses. We did not defer a material amount of policy acquisition costs during the years ended 2014, 2013 or 2012. Policy acquisition costs in these periods were primarily related to commissions and premium taxes on installment policies written in prior periods.
INTEREST EXPENSE Interest expense incurred by our international and structured finance insurance segment decreased for 2014 compared with 2013 and 2012 primarily due to the repayment of a secured loan from National in May of 2013. In addition, during 2013, the interest rate on MBIA Corp.’s surplus notes decreased as a result of the conversion to a floating rate.
EXPENSES OF CONSOLIDATED VIEs For 2014, total expenses of consolidated VIEs were $48 million compared with total expenses of $52 million for 2013 and $62 million for 2012. The decreases in expenses of consolidated VIEs were primarily related to the deconsolidation of VIEs from commutations of insurance policies.
INSURED PORTFOLIO EXPOSURE The credit quality of our international and structured finance insured portfolio is assessed in the same manner as our U.S. public finance insured portfolio. As of December 31, 2014 and 2013, 21% and 23%, respectively, of our international and structured finance insured portfolio, was rated below investment grade, before giving effect to MBIA’s guarantees, based on MBIA’s internal ratings, which are more current than the underlying ratings provided by S&P and Moody’s for this subset of our insured portfolio.
International and Structured Finance Insurance Selected Portfolio Exposures
The following is a summary of selected significant exposures within the insured portfolio of our international and structured finance insurance segment. Many of these sectors are and have been considered volatile over the past several years. We may experience considerable incurred losses and future expected payments in certain of these sectors. There can be no assurance that the loss reserves described below will be sufficient or that we will not experience losses on transactions on which we currently have no loss reserves, in particular if the economy deteriorates.
Residential Mortgage Exposure
MBIA Corp. insures mortgage-backed securities backed by residential mortgage loans, including second-lien RMBS transactions (revolving home equity lines of credit (“HELOC”) loans and closed-end second mortgages (“CES”)). MBIA Corp. also insures MBS backed by first-lien alternative A-paper (“Alt-A”) and subprime mortgage loans directly through RMBS securitizations. There was considerable stress and deterioration in the mortgage market since 2008 reflected by heightened delinquencies and losses, particularly related to Alt-A and subprime mortgage loans originated during 2005, 2006 and 2007.
56
Table of Contents
Item 7. Management’s Discussion and Analysis of Financial Condition and Results of Operations
RESULTS OF OPERATIONS (continued)
The following tables present the gross par outstanding by vintage year of MBIA Corp.’s total direct RMBS insured exposure as of December 31, 2014 and 2013. Amounts include the gross par outstanding related to transactions that the Company consolidates under accounting guidance for VIEs.
| Gross Par Outstanding as of December 31, 2014 | ||||||||||||||||||||||||
| In millions |
Prime First-lien |
Alt-A First-lien |
Subprime First-lien |
HELOC Second-lien |
CES Second-lien |
Total | ||||||||||||||||||
| 2005—2007 |
$ | 13 | $ | 1,300 | $ | 250 | $ | 1,912 | $ | 2,143 | $ | 5,618 | ||||||||||||
| 2004 and prior |
131 | 507 | 588 | 384 | 37 | 1,647 | ||||||||||||||||||
|
|
|
|
|
|
|
|
|
|
|
|
|
|||||||||||||
| Total gross par |
$ | 144 | $ | 1,807 | (1) | $ | 838 | (2) | $ | 2,296 | $ | 2,180 | $ | 7,265 | ||||||||||
|
|
|
|
|
|
|
|
|
|
|
|
|
|||||||||||||
(1)—Includes international exposure of $511 million.
(2)—Includes international exposure of $4 million.
| Gross Par Outstanding as of December 31, 2013 | ||||||||||||||||||||||||
| In millions |
Prime First-lien |
Alt-A First-lien |
Subprime First-lien |
HELOC Second-lien |
CES Second-lien |
Total | ||||||||||||||||||
| 2005—2007 |
$ | 14 | $ | 1,564 | $ | 358 | $ | 2,186 | $ | 2,560 | $ | 6,682 | ||||||||||||
| 2004 and prior |
167 | 648 | 742 | 500 | 49 | 2,106 | ||||||||||||||||||
|
|
|
|
|
|
|
|
|
|
|
|
|
|||||||||||||
| Total gross par |
$ | 181 | $ | 2,212 | (1) | $ | 1,100 | (2) | $ | 2,686 | $ | 2,609 | $ | 8,788 | ||||||||||
|
|
|
|
|
|
|
|
|
|
|
|
|
|||||||||||||
(1)—Includes international exposure of $589 million.
(2)—Includes international exposure of $8 million.
During the year ended December 31, 2014, we collected approximately $12 million, net of reinsurance and $104 million in payments made, on insured second-lien RMBS transactions, or $25 million after eliminating $38 million of payments and $25 million of excess spread collections made on behalf of consolidated VIEs. Through December 31, 2014, we made claim and LAE payments for 37 out of 43 insured second-lien RMBS policies. The total collections of $116 million on our insured second-lien RMBS transactions comprised $98 million of excess spread and $18 million of mortgage insurance. Mortgage insurance is received periodically from the servicers.
Collateralized Debt Obligations and Related Instruments
As part of our international and structured finance insurance activities, MBIA Corp. typically provided guarantees on senior and, in a limited number of cases, mezzanine tranches of CDOs, as well as protection on structured CMBS pools and corporate securities, and CDS referencing such securities. The following discussion, including reported amounts and percentages, includes insured CDO transactions consolidated by the Company as VIEs.
As of December 31, 2014, MBIA Corp.’s $13.8 billion CDO portfolio represented 25% of its total insured gross par outstanding of $55.2 billion. As of December 31, 2013, MBIA Corp.’s $29.7 billion CDO portfolio represented 37% of its total insured gross par outstanding of $80.4 billion. In addition to the below table, MBIA Corp. insures approximately $519 million in CRE loan pools, primarily comprising European assets. The distribution of our insured CDO and related instruments portfolio by collateral type is presented in the following table:
| In billions | Gross Par Outstanding as of | |||||||||||
| Collateral Type |
December 31, 2014 |
December 31, 2013 |
Percent Change |
|||||||||
| Multi-sector CDOs |
$ | 1.0 | $ | 1.5 | -33% | |||||||
| Investment grade corporate CDOs |
6.8 | 15.6 | -56% | |||||||||
| High yield corporate CDOs |
3.7 | 4.3 | -14% | |||||||||
| Structured CMBS pools |
1.5 | 7.1 | -79% | |||||||||
| CRE CDOs |
0.8 | 1.2 | -33% | |||||||||
|
|
|
|
|
|
|
|||||||
| Total |
$ | 13.8 | $ | 29.7 | -54% | |||||||
|
|
|
|
|
|
|
|||||||
57
Table of Contents
Item 7. Management’s Discussion and Analysis of Financial Condition and Results of Operations
RESULTS OF OPERATIONS (continued)
Loss Remediation Transactions
We may seek to purchase, from time to time, directly or indirectly, obligations guaranteed by MBIA or seek to commute policies. The amount of insurance exposure reduced, if any, and the nature of any such actions will depend on market conditions, pricing levels from time to time, and other considerations. In some cases, these activities may result in a reduction of expected loss reserves, but in all cases they are intended to limit our ultimate losses and reduce the future volatility in loss development on the related policies. Our ability to purchase guaranteed obligations and to commute policies will depend on management’s assessment of available liquidity.
U.S. Public Finance and International and Structured Finance Reinsurance
Reinsurance enables the Company to cede exposure for purposes of syndicating risk and increasing its capacity to write new business while complying with its single risk and credit guidelines. When a reinsurer is downgraded by one or more of the rating agencies, less capital credit is given to MBIA under rating agency models and the overall value of the reinsurance to MBIA is reduced. The Company generally retains the right to reassume the business ceded to reinsurers under certain circumstances, including a reinsurer’s rating downgrade below specified thresholds. The following table presents information about our reinsurance agreements as of December 31, 2014 for our U.S. public finance and international and structured finance insurance operations:
| In millions | ||||||||||||||||
| Reinsurers |
Standard & Poor’s Rating (Status) |
Moody’s Rating (Status) | Ceded Par Outstanding |
Letters of Credit/ Trust Accounts |
Reinsurance Recoverable(1) |
|||||||||||
| Assured Guaranty Re Ltd. |
AA (Stable Outlook) |
Baa1 (Negative Outlook) |
$ | 3,634 | $ | 32 | $ | 1 | ||||||||
| Assured Guaranty Corp. |
AA (Stable Outlook) |
A3 (Negative Outlook) |
2,019 | — | 6 | |||||||||||
| Overseas Private |
AA+ (Stable Outlook) |
Aaa (Stable Outlook) |
289 | — | — | |||||||||||
| Others |
A- or above | A2 or above | 145 | 2 | — | |||||||||||
|
|
|
|
|
|
|
|||||||||||
| Total |
$ | 6,087 | $ | 34 | $ | 7 | ||||||||||
|
|
|
|
|
|
|
|||||||||||
(1)—Total reinsurance recoverable is primarily recoverables on unpaid losses.
MBIA requires certain unauthorized reinsurers to maintain bank letters of credit or establish trust accounts to cover liabilities ceded to such reinsurers under reinsurance contracts. The Company remains liable on a primary basis for all reinsured risk, and although MBIA believes that its reinsurers remain capable of meeting their obligations, there can be no assurance of such in the future.
As of December 31, 2014, the aggregate amount of insured par outstanding ceded by MBIA to reinsurers under reinsurance agreements was $6.1 billion compared with $7.1 billion as of December 31, 2013. As of December 31, 2014, $5.1 billion of the ceded par outstanding was ceded from our U.S. public finance insurance segment and $1.0 billion was ceded from our international and structured finance insurance segment. Under National’s reinsurance agreement with MBIA Corp., if a reinsurer of MBIA Corp. is unable to pay claims ceded by MBIA Corp. on U.S. public finance exposure, National will assume liability for such ceded claim payments.
58
Table of Contents
Item 7. Management’s Discussion and Analysis of Financial Condition and Results of Operations
RESULTS OF OPERATIONS (continued)
Corporate
Our corporate segment consists of general corporate activities, including providing general support services to MBIA’s other operations and asset and debt management. General support services are provided by our service company, MBIA Services Corporation (“MBIA Services”), formerly Optinuity Alliance Resources Corporation. MBIA Services provides various support services including, among others, management, legal, accounting, treasury, information technology, and insurance portfolio surveillance, on a fee-for-service basis. Asset and debt management includes activities related to servicing obligations issued by MBIA Inc. and its subsidiaries, IMC and GFL. MBIA Inc. issued debt to finance the operations of the MBIA group. IMC, along with MBIA Inc., provided customized investment agreements, guaranteed by MBIA Corp., for bond proceeds and other public funds for such purposes as construction, loan origination, escrow and debt service or other reserve fund requirements. It also provided customized products for funds that are invested as part of asset-backed or structured product transactions. GFL raised funds through the issuance of MTNs with varying maturities, which were in turn guaranteed by MBIA Corp. GFL lent the proceeds of these MTN issuances to MBIA Inc. The Company ceased issuing these investment agreements and MTNs and the outstanding liability balances and corresponding asset balances have declined over time as liabilities mature, terminate or are retired. All of the debt within the corporate segment is managed collectively and is serviced by the financial resources available to MBIA Inc. Asset management activities support the Company’s funded liabilities, provide for opportunities in investments and provide general liquidity support to MBIA Inc.
The following table summarizes the consolidated results of our corporate segment for the years ended December 31, 2014, 2013 and 2012:
| Years Ended December 31, | Percent Change | |||||||||||||||||||
| In millions |
2014 | 2013 | 2012 | 2014 vs. 2013 | 2013 vs. 2012 | |||||||||||||||
| Net investment income |
$ | 38 | $ | 40 | $ | 57 | -5% | -30% | ||||||||||||
| Fees |
58 | 81 | 158 | -28% | -49% | |||||||||||||||
| Net gains (losses) on financial instruments at fair value and foreign exchange |
53 | 34 | (128) | 56% | -127% | |||||||||||||||
| Net investment losses related to other-than-temporary impairments |
— | — | (60) | —% | -100% | |||||||||||||||
| Net gains (losses) on extinguishment of debt |
3 | 22 | 6 | -86% | n/m | |||||||||||||||
| Other net realized gains (losses) |
1 | — | — | n/m | —% | |||||||||||||||
| Revenues of consolidated VIEs: |
||||||||||||||||||||
| Other net realized gains (losses) |
(5) | (14) | — | -64% | n/m | |||||||||||||||
|
|
|
|
|
|
|
|
|
|
|
|||||||||||
| Total revenues |
148 | 163 | 33 | -9% | n/m | |||||||||||||||
|
|
|
|
|
|
|
|
|
|
|
|||||||||||
| Operating |
94 | 163 | 121 | -42% | 35% | |||||||||||||||
| Interest |
109 | 125 | 160 | -13% | -22% | |||||||||||||||
|
|
|
|
|
|
|
|
|
|
|
|||||||||||
| Total expenses |
203 | 288 | 281 | -30% | 2% | |||||||||||||||
|
|
|
|
|
|
|
|
|
|
|
|||||||||||
| Income (loss) before income taxes |
(55) | (125) | (248) | -56% | -50% | |||||||||||||||
| Provision (benefit) for income taxes |
(173) | (15) | (179) | n/m | -92% | |||||||||||||||
|
|
|
|
|
|
|
|
|
|
|
|||||||||||
| Net income (loss) |
$ | 118 | $ | (110) | $ | (69) | n/m | 59% | ||||||||||||
|
|
|
|
|
|
|
|
|
|
|
|||||||||||
n/m—Percent change not meaningful.
NET INVESTMENT INCOME The decreases in net investment income for 2014 compared with 2013 and 2012 were primarily due to lower average asset balances as investments were sold to generate liquidity and repay or repurchase liabilities.
FEES Fees are generated from support services provided to the Company’s other operating businesses on a fee-for-service basis. Fees for 2014 decreased compared with 2013 and 2012 primarily due to declines in fees paid by our conduit segment for administrative and other services. During the second quarter of 2014, we dissolved our conduit segment.
59
Table of Contents
Item 7. Management’s Discussion and Analysis of Financial Condition and Results of Operations
RESULTS OF OPERATIONS (continued)
NET GAINS (LOSSES) ON FINANCIAL INSTRUMENTS AT FAIR VALUE AND FOREIGN EXCHANGE The favorable change in net gains (losses) on financial instruments at fair value and foreign exchange for 2014 compared with 2013 was primarily due to foreign currency exchange gains on Euro denominated liabilities from changes in the U.S. dollar\Euro foreign exchange rate, an increase in realized gains from asset sales and changes in the fair value of outstanding warrants issued on MBIA Inc. common stock. The changes in the fair value of outstanding warrants were primarily attributable to fluctuations in MBIA Inc.’s stock price and volatility, which are used in the valuation of the warrants. This favorable change was partially offset by losses on fair valuing financial instruments. The favorable change in net gains (losses) on financial instruments at fair value and foreign exchange for 2013 compared with 2012 was primarily due to derivative gains in 2013 compared with losses in 2012 and a decline in losses from the sale of investments. This favorable change was partially offset by an increase of losses on MTNs that are carried at fair value.
NET INVESTMENT LOSSES RELATED TO OTHER-THAN-TEMPORARY IMPAIRMENTS Net investment losses related to OTTI for 2012 related to impaired securities that were written down to their fair values as it was our intent to sell the securities before an expected recovery of their fair values to their amortized costs. Refer to “Liquidity” section herein for additional information about impaired investments.
NET GAINS (LOSSES) ON EXTINGUISHMENT OF DEBT Net gains (losses) on extinguishment of debt was primarily due to gains from terminations of MTNs and investment agreements issued by the Company.
REVENUES OF CONSOLIDATED VIEs For 2014 and 2013, total revenues of consolidated VIEs related to net losses as a result of the deconsolidation of VIEs.
OPERATING EXPENSES Operating expenses for 2014 decreased compared with 2013 primarily due to decreases in expenses related to the settlement with Bank of America that occurred in 2013 and lower compensation expense in 2014. Operating expenses for 2013 increased compared with 2012 primarily due to an increase in compensation expense related to severance and expenses related to the settlement with Bank of America that occurred in 2013.
INTEREST EXPENSE Interest expense incurred by our corporate segment decreased for 2014 compared with 2013 and 2012 primarily due to the continued maturity and repurchases of liabilities by the Company.
PROVISION (BENEFIT) FOR INCOME TAXES The 2014 benefit for income taxes includes a favorable adjustment of $87 million for the release of the full valuation allowance against the deferred tax asset which resulted from the sales of previously impaired investments. In addition for 2014, there was a $61 million reversal in our reserve for uncertain tax positions. The 2013 benefit for income taxes was impacted by an unfavorable increase in the reserve for uncertain tax positions, additional state tax expense and the non deductibility of the valuation on warrants issued by the Company. The 2012 benefit for income taxes was favorably impacted by the release of a portion of the valuation allowance against the deferred tax asset.
OPERATING INCOME (LOSS) In addition to the above results, we also analyze the operating performance of our corporate segment using operating income (loss), a non-GAAP measure. We believe operating income (loss), as used by management, is useful for an understanding of the results of operations of the Company. Operating income (loss) is not a substitute for net income (loss) determined in accordance with GAAP, and our definition of operating income (loss) may differ from that used by other companies.
60
Table of Contents
Item 7. Management’s Discussion and Analysis of Financial Condition and Results of Operations
RESULTS OF OPERATIONS (continued)
The following table presents a reconciliation of GAAP net income (loss) to operating income (loss) for the years ended December 31, 2014, 2013 and 2012:
| Years Ended December 31, | ||||||||||||
| In millions |
2014 | 2013 | 2012 | |||||||||
| Net income (loss) |
$ | 118 | $ | (110) | $ | (69) | ||||||
| Less: after-tax adjustments: |
||||||||||||
| Mark-to-market gains (losses) on financial instruments(1) |
(15) | 42 | 24 | |||||||||
| Foreign exchange gains (losses)(1) |
62 | (3) | (4) | |||||||||
| Net gains (losses) on sales of investments(1) |
17 | (3) | (61) | |||||||||
| Net investment losses related to OTTI |
— | — | (39) | |||||||||
| Net gains (losses) on extinguishment of debt |
2 | 14 | — | |||||||||
| Tax valuation allowance on adjustments(2) |
87 | 5 | 92 | |||||||||
|
|
|
|
|
|
|
|||||||
| Operating income (loss) |
$ | (35) | $ | (165) | $ | (81) | ||||||
|
|
|
|
|
|
|
|||||||
(1)—Gross amounts are reported within “Net gains (losses) on financial instruments at fair value and foreign exchange” and the corresponding tax effects are reported within “Provision (benefit) for income taxes” on the Company’s consolidated statements of operations.
(2)—Reported within “Provision (benefit) for income taxes” on the Company’s consolidated statements of operations.
For the year ended December 31, 2014, our corporate segment’s operating loss decreased when compared with 2013 primarily as a result of decreases in operating and interest expense and an increase in the benefit for income taxes as a result of the release of our valuation allowance against the deferred tax asset from the sales of previously impaired investments and the reversal in our reserve for uncertain tax positions. These changes were partially offset by lower fees paid by our conduit segment for support services.
For the year ended December 31, 2013, our corporate segment’s operating loss increased when compared with 2012 primarily as a result of lower fees paid by our conduit segment and higher operating expenses. These changes were partially offset by lower interest expense and a decrease in the benefit for income taxes.
Advisory Services
Our asset management advisory business was conducted through Cutwater. Cutwater offers advisory services, including cash management, discretionary asset management and structured products on a fee-for-service basis. Cutwater offers these services to public, not-for-profit, corporate and financial services clients, including MBIA Inc. and its other subsidiaries. In October of 2014, the Company entered into an agreement to sell Cutwater to a subsidiary of The Bank of New York Mellon Corporation. Effective with the January 1, 2015 sale of Cutwater, MBIA has no business activities within its advisory services segment.
61
Table of Contents
Item 7. Management’s Discussion and Analysis of Financial Condition and Results of Operations
RESULTS OF OPERATIONS (continued)
The following table summarizes the results and assets under management of our advisory services segment for the years ended December 31, 2014, 2013 and 2012. These results include revenues and expenses from transactions with the Company’s insurance, corporate, and conduit segments.
| Years Ended December 31, | Percent Change | |||||||||||||||||||
| In millions |
2014 | 2013 | 2012 | 2014 vs. 2013 | 2013 vs. 2012 | |||||||||||||||
| Fees |
$ | 34 | $ | 42 | $ | 55 | -19% | -24% | ||||||||||||
| Net gains (losses) on financial instruments at fair value and foreign exchange |
(3) | 1 | (1) | n/m | n/m | |||||||||||||||
| Revenues of consolidated VIEs |
(8) | — | — | n/m | —% | |||||||||||||||
|
|
|
|
|
|
|
|
|
|
|
|||||||||||
| Total revenues |
23 | 43 | 54 | -47% | -20% | |||||||||||||||
| Operating expenses |
48 | 60 | 59 | -20% | 2% | |||||||||||||||
|
|
|
|
|
|
|
|
|
|
|
|||||||||||
| Income (loss) before income taxes |
(25) | (17) | (5) | 47% | n/m | |||||||||||||||
| Provision (benefit) for income taxes |
(6) | (5) | (1) | 20% | n/m | |||||||||||||||
|
|
|
|
|
|
|
|
|
|
|
|||||||||||
| Net income (loss) |
$ | (19) | $ | (12) | $ | (4) | 58% | n/m | ||||||||||||
|
|
|
|
|
|
|
|
|
|
|
|||||||||||
| Ending assets under management: |
||||||||||||||||||||
| Third-party |
$ | 11,251 | $ | 12,741 | $ | 17,599 | -12% | -28% | ||||||||||||
| Insurance |
5,930 | 6,281 | 6,426 | -6% | -2% | |||||||||||||||
| Corporate and conduit |
4,159 | 4,875 | 5,755 | -15% | -15% | |||||||||||||||
|
|
|
|
|
|
|
|
|
|
|
|||||||||||
| Total ending assets under management |
$ | 21,340 | $ | 23,897 | $ | 29,780 | -11% | -20% | ||||||||||||
|
|
|
|
|
|
|
|
|
|
|
|||||||||||
n/m—Percent change not meaningful.
For the year ended December 31, 2014, the unfavorable change in net income (loss) compared with 2013 was primarily due to a loss as a result of the consolidation of VIEs and decreases in fee revenues due to declines in asset balances managed for third parties and our other segments, partially offset by decreases in compensation, legal and consulting expenses.
For the year ended December 31, 2013, the unfavorable change in net income (loss) compared with 2012 was primarily driven by a decrease in fees due to declines in asset balances managed for third parties and our other segments.
Average third-party assets under management for the years ended December 31, 2014, 2013 and 2012 were $12.1 billion, $15.9 billion and $19.1 billion, respectively. These decreases were principally due to declines in our pool products and CDO management business.
Conduit
The Company’s conduit segment was operated through Meridian and administered through MBIA Asset Finance, LLC. Assets financed by Meridian were funded by MTNs. In the second quarter of 2014, we retired the remaining $129 million of outstanding MTNs issued by Meridian and dissolved the conduit segment. Certain of MBIA’s consolidated subsidiaries had received fees for services provided to Meridian.
62
Table of Contents
Item 7. Management’s Discussion and Analysis of Financial Condition and Results of Operations
RESULTS OF OPERATIONS (continued)
The following table presents the results of our conduit segment for the years ended December 31, 2014, 2013 and 2012. These results include revenues and expenses from transactions with the Company’s other segments.
| Years Ended December 31, | Percent Change | |||||||||||||||||||
| In millions |
2014 | 2013 | 2012 | 2014 vs. 2013 | 2013 vs. 2012 | |||||||||||||||
| Revenues of consolidated VIEs: |
||||||||||||||||||||
| Net investment income |
$ | (1) | $ | 3 | $ | 12 | -133% | -75% | ||||||||||||
| Net gains (losses) on financial instruments at fair value and foreign exchange |
— | (3) | — | -100% | n/m | |||||||||||||||
| Net gains (losses) on extinguishment of debt |
4 | 1 | 49 | n/m | -98% | |||||||||||||||
|
|
|
|
|
|
|
|
|
|
|
|||||||||||
| Total revenues |
3 | 1 | 61 | n/m | -98% | |||||||||||||||
|
|
|
|
|
|
|
|
|
|
|
|||||||||||
| Expenses of consolidated VIEs: |
||||||||||||||||||||
| Operating |
9 | 27 | 98 | -67% | -72% | |||||||||||||||
| Interest |
— | 5 | 12 | -100% | -58% | |||||||||||||||
|
|
|
|
|
|
|
|
|
|
|
|||||||||||
| Total expenses |
9 | 32 | 110 | -72% | -71% | |||||||||||||||
|
|
|
|
|
|
|
|
|
|
|
|||||||||||
| Income (loss) before income taxes |
(6) | (31) | (49) | -81% | -37% | |||||||||||||||
| Provision (benefit) for income taxes |
— | (10) | (17) | -100% | -41% | |||||||||||||||
|
|
|
|
|
|
|
|
|
|
|
|||||||||||
| Net income (loss) |
$ | (6) | $ | (21) | $ | (32) | -71% | -34% | ||||||||||||
|
|
|
|
|
|
|
|
|
|
|
|||||||||||
n/m—Percent change not meaningful.
For 2014, total expenses decreased compared with 2013 primarily due to decreases in the fee paid to our corporate segment for administrative and other services and interest expense due to retiring the remaining outstanding debt.
For 2013, total revenues decreased compared with 2012 primarily due to a decrease in net gains on extinguishment of debt. Total expenses decreased compared with 2012 primarily due to decline in fees paid to our corporate segment for administrative and other services.
Taxes
Provision for Income Taxes
The Company’s income taxes and the related effective tax rates for the years ended December 31, 2014, 2013 and 2012 are presented in the following table:
| Years Ended December 31, | ||||||||||||
| In millions |
2014 | 2013 | 2012 | |||||||||
| Income (loss) before income taxes |
$ | 641 | $ | 416 | $ | 1,598 | ||||||
| Provision (benefit) for income taxes |
$ | 72 | $ | 166 | $ | 364 | ||||||
| Effective tax rate |
11.2% | 39.9% | 22.8% | |||||||||
For 2014, our effective tax rate applied to our income (loss) before income taxes was lower than the U.S. statutory tax rate of 35% primarily due to a decrease in our valuation allowance against our deferred tax asset from asset sales of previously impaired assets and a decrease in our reserve for uncertain tax positions.
For 2013, our effective tax rate applied to our income (loss) before income taxes was higher than the U.S. statutory tax rate of 35% primarily due to the provision for deferred taxes on basis differences of certain foreign subsidiaries, non-deductibility of warrants issued by the Company, and the fluctuation of the value of those warrants. These items are partially offset by a benefit for the reduction in the valuation allowance against our deferred tax asset.
63
Table of Contents
Item 7. Management’s Discussion and Analysis of Financial Condition and Results of Operations
RESULTS OF OPERATIONS (continued)
For 2012, our effective tax rate applied to our income (loss) before income taxes was lower than the U.S. statutory tax rate of 35% primarily due the reduction in the valuation allowance against our deferred tax asset and a net tax benefit related to an out-of-period adjustment.
The Company is party to a tax allocation agreement with members of its holding company system effective January 1, 1987. The agreement was amended and restated effective September 8, 2011 to change the method of calculating each domestic insurer’s tax liability to the method permitted by paragraph 3(a) of Department Circular Letter #33 (1979). The agreement was submitted to the NYSDFS for review and non-disapproval pursuant to Section 1505 of the New York Insurance Law (“NYIL”).
Refer to “Note 11: Income Taxes” in the Notes to Consolidated Financial Statements for a further discussion of income taxes, including the Company’s valuation allowance against deferred tax assets and its accounting for tax uncertainties.
CAPITAL RESOURCES
The Company manages its capital resources to minimize its cost of capital while maintaining appropriate claims-paying resources (“CPR”) for National and MBIA Corp. The Company’s capital resources consist of total shareholders’ equity, total debt issued by MBIA Inc. for general corporate purposes, and surplus notes issued by MBIA Corp. Total capital resources were $5.4 billion and $4.8 billion as of December 31, 2014 and 2013, respectively. MBIA Inc. uses its capital resources to support the business activities of its subsidiaries. As of December 31, 2014, MBIA Inc.’s investments in subsidiaries totaled $4.0 billion.
In addition, MBIA Inc. also supports the MTN and investment agreement obligations originally issued by the Company. MBIA Inc. seeks to maintain sufficient liquidity and capital resources to meet its general corporate needs. As of December 31, 2014 and 2013, net debt of MBIA Inc., which primarily comprised long-term debt, MTNs, investment agreements and derivative liabilities net of cash and investments at amortized cost and a tax receivable from subsidiaries, totaled $740 million and $1.0 billion, respectively. The Company expects that MBIA Inc. will generate sufficient cash to satisfy its net debt and its general corporate needs over time from distributions from its operating subsidiaries. In addition, the Company may also consider raising third-party capital. There can be no assurance that the aforementioned factors will generate sufficient cash to satisfy its net debt. Refer to the following “Liquidity—MBIA Inc. Liquidity” section for additional information about MBIA Inc.’s liquidity.
Securities Repurchases
Repurchases of debt and common stock may be made from time to time in the open market or in private transactions as permitted by securities laws and other legal requirements. We may also choose to redeem debt obligations where permitted by the relevant agreements. We believe that debt and share repurchases and redemptions can be an appropriate deployment of capital in excess of amounts needed to support our liquidity while maintaining the CPR of MBIA Corp. and National as well as other business needs.
Equity securities
During 2014, the remaining $23 million available for repurchases under our 2007 share repurchase program was used to repurchase 2,086,737 common shares of MBIA Inc. at an average share price of $11.02 per share.
In the fourth quarter of 2014, the Company’s Board of Directors authorized the repurchase of up to $200 million of its outstanding shares, against which we repurchased 1,247,337 common shares of MBIA Inc. at an average share price of $9.44. Subsequent to December 31, 2014, we repurchased an additional 6,317,901 common shares of MBIA Inc. at an average share price of $8.70 per share. As of February 26, 2015, $133 million remained available to repurchase under this new program.
64
Table of Contents
Item 7. Management’s Discussion and Analysis of Financial Condition and Results of Operations
CAPITAL RESOURCES (continued)
Debt securities
In addition to equity repurchases, MBIA Inc. or its subsidiaries may repurchase or redeem their outstanding debt at prices that we deem to be economically advantageous. During 2014, we retired $129 million par value outstanding of MTNs issued by our conduit segment at a cost of approximately 97% of par value. In addition, we repurchased approximately $122 million par value outstanding of GFL MTNs issued by our corporate segment at a weighted average cost of approximately 98% of par value.
During 2013, the Company redeemed $506 million par value outstanding of MTNs issued by our conduit segment at a cost of 100% of par value. In addition, we also repurchased approximately $192 million par value outstanding of GFL MTNs issued by our corporate segment at a weighted average cost of approximately 91% of par value.
In connection with a settlement with Bank of America in May of 2013, MBIA Corp. received $136 million principal amount of the 5.70% Senior Notes due 2034 as partial consideration for the settlement. These notes were subsequently transferred to National. On a consolidated basis, receipt of these notes reduced the Company’s outstanding debt.
Insurance Statutory Capital
National and MBIA Corp. are incorporated and licensed in, and are subject to primary insurance regulation and supervision by, the State of New York. MBIA UK is authorized by the Prudential Regulation Authority (“PRA”) and regulated by the Financial Conduct Authority and the PRA in the United Kingdom. National and MBIA Corp. each are required to file detailed annual financial statements, as well as interim financial statements, with the NYSDFS and similar supervisory agencies in each of the other jurisdictions in which it is licensed. These financial statements are prepared in accordance with New York State and the National Association of Insurance Commissioners’ statements of U.S. STAT and assist our regulators in evaluating minimum standards of solvency, including minimum capital requirements, and business conduct. MBIA UK is required to file annual regulatory returns with the PRA.
National
Capital and Surplus
National reported total statutory capital of $3.3 billion as of December 31, 2014 and 2013. As of December 31, 2014, statutory capital comprised $1.1 billion of contingency reserves and $2.2 billion of policyholders’ surplus. National had statutory net income of $238 million for the year ended December 31, 2014. As of December 31, 2014, National’s unassigned surplus was $1.6 billion.
In order to maintain its New York State financial guarantee insurance license, National is required to maintain a minimum of $65 million of policyholders’ surplus. National is also required to maintain contingency reserves to provide protection to policyholders in the event of extreme losses in adverse economic events. Refer to the following “MBIA Corp.—Capital and Surplus” section for additional information about contingency reserves under the NYIL. National’s policyholders’ surplus would grow over time from the recognition of unearned premiums and investment income and the expected release of the contingency reserves. Conversely, dividends and incurred losses would reduce policyholders’ surplus. As of December 31, 2014 and 2013, National was not in compliance with certain of its single risk limits but was in compliance with its aggregate risk limits.
NYIL regulates the payment of dividends by financial guarantee insurance companies and provides that such companies may not declare or distribute dividends except out of statutory earned surplus. Under NYIL, the sum of (i) the amount of dividends declared or distributed during the preceding 12-month period and (ii) the dividend to be declared may not exceed the lesser of (a) 10% of policyholders’ surplus, as reported in the latest statutory financial statements or (b) 100% of adjusted net investment income for such 12-month period (the net investment income for such 12-month period plus the excess, if any, of net investment income over dividends declared or distributed during the two-year period preceding such 12-month period), unless the Superintendent of the NYSDFS approves a greater dividend distribution based upon a finding that the insurer will retain sufficient surplus to support its obligations.
65
Table of Contents
Item 7. Management’s Discussion and Analysis of Financial Condition and Results of Operations
CAPITAL RESOURCES (continued)
National had positive earned surplus as of December 31, 2014, which provides National with dividend capacity. As a condition to the NYSDFS’ approval of the simultaneous repurchase and reverse repurchase agreements (“Asset Swap”) between MBIA Inc. and National, the NYSDFS requested that, until the notional amount of the Asset Swap has been reduced to 5% or less of National’s admitted assets, each of MBIA Inc., MBIA Corp. and National provide the NYSDFS with three months prior notice, or such shorter period as the NYSDFS may permit, of its intent to initiate cash dividends on shares of its common stock.
National provided such notice. In October of 2014, National declared and paid a dividend of $220 million to its ultimate parent, MBIA Inc. Declared and paid dividend amounts from National in the foreseeable future will be limited based on net investment income and will be substantially lower than previous dividends.
Claims-Paying Resources (Statutory Basis)
CPR is a key measure of the resources available to National to pay claims under its insurance policies. CPR consists of total financial resources and reserves calculated on a statutory basis. CPR has been a common measure used by financial guarantee insurance companies to report and compare resources and continues to be used by MBIA’s management to evaluate changes in such resources. We have provided CPR to allow investors and analysts to evaluate National using the same measure that MBIA’s management uses to evaluate National’s resources to pay claims under its insurance policies. There is no directly comparable GAAP measure. Our calculation of CPR may differ from the calculation of CPR reported by other companies.
National’s CPR and components thereto, as of December 31, 2014 and 2013 are presented in the following table:
| In millions |
As of December 31, 2014 |
As of December 31, 2013 |
||||||
| Policyholders’ surplus |
$ | 2,190 | $ | 2,086 | ||||
| Contingency reserves |
1,076 | 1,172 | ||||||
|
|
|
|
|
|||||
| Statutory capital |
3,266 | 3,258 | ||||||
| Unearned premium reserve |
1,375 | 1,678 | ||||||
| Present value of installment premiums(1) |
216 | 226 | ||||||
|
|
|
|
|
|||||
| Premium resources(2) |
1,591 | 1,904 | ||||||
| Net loss and LAE reserves(1) |
(13) | (87) | ||||||
| Salvage reserves |
106 | 177 | ||||||
|
|
|
|
|
|||||
| Gross loss and LAE reserve |
93 | 90 | ||||||
|
|
|
|
|
|||||
| Total claims-paying resources |
$ | 4,950 | $ | 5,252 | ||||
|
|
|
|
|
|||||
(1)—Calculated using a discount rate of 2.90% and 3.14% as of December 31, 2014 and 2013, respectively.
(2)—Includes financial guarantee and insured credit derivative related premiums.
MBIA Corp.
Capital and Surplus
MBIA Corp. reported total statutory capital of $859 million as of December 31, 2014 compared with $825 million as of December 31, 2013. As of December 31, 2014, statutory capital comprised $317 million of contingency reserves and $542 million of policyholders’ surplus. For the year ended December 31, 2014, MBIA Corp. had a statutory net loss of $35 million, primarily due to losses and LAE incurred partially offset by net premiums earned. MBIA Corp.’s policyholders’ surplus as of December 31, 2014 included a negative unassigned surplus of $1.5 billion. As of December 31, 2014, MBIA Corp.’s policyholders’ surplus was negatively impacted by $106 million because under NYIL it was not permitted to treat as an admitted asset the portion of its investment in subsidiaries in excess of 60% of net admitted assets less the par value of common and preferred stock and liabilities. This overage was caused by a decrease in MBIA Corp.’s policyholders’ surplus due to insured losses in the past. MBIA Corp.’s policyholders’ surplus may be further negatively impacted if future additional insured losses are incurred and the percentage of its assets invested in subsidiaries continues to increase.
66
Table of Contents
Item 7. Management’s Discussion and Analysis of Financial Condition and Results of Operations
CAPITAL RESOURCES (continued)
As of December 31, 2014, MBIA Corp. recognized estimated recoveries of $365 million, net of reinsurance on a statutory basis related to put-backs of ineligible mortgage loans in its insured transactions and $576 million related to excess spread recoveries on second-lien RMBS, net of reinsurance. These excess spread recoveries represented 67% of MBIA Corp.’s statutory capital as of December 31, 2014. There can be no assurance that we will be successful or that we will not be delayed in realizing these recoveries. Refer to “Note 6: Loss and Loss Adjustment Expense Reserves” in the Notes to Consolidated Financial Statements for additional information about these recoveries.
In order to maintain its New York State financial guarantee insurance license, MBIA Corp. is required to maintain a minimum of $65 million of policyholders’ surplus. MBIA Corp.’s policyholders’ surplus would grow over time from the recognition of unearned premiums and investment income and the expected release of the contingency reserves. In addition, MBIA Corp.’s policyholders’ surplus could be enhanced by the settlement, commutation or repurchase of insured obligations at prices less than its statutory loss reserves for such transactions. Conversely, dividends or incurred losses or an inability to collect on our excess spread recoveries or ineligible mortgage loan put-back claims would reduce policyholders’ surplus.
Under NYIL, MBIA Corp. is also required to establish a contingency reserve to provide protection to policyholders in the event of extreme losses in adverse economic events. The amount of the reserve is based on the percentage of principal insured or premiums earned, depending on the type of obligation (net of collateral, reinsurance, refunding, refinancings and certain insured securities). Reductions in the contingency reserve may be recognized based on excessive reserves and under certain stipulated conditions, subject to the approval of the Superintendent of the NYSDFS. As a result of regulatory approved reductions, MBIA Corp.’s contingency reserves of $317 million as of December 31, 2014 represented reserves on 54 of the 376 outstanding credits insured by MBIA Corp. For risks associated with MBIA Corp.’s failure to meet its contingency reserve requirement, see Part I, Item 1A, “Risk Factors-Capital, Liquidity and Market Related Risk Factors- If our insurance companies fail to meet regulatory capital requirements they may become subject to regulatory action” in this Annual Report on Form 10-K.
Under NYIL, MBIA Corp. is required to invest its minimum surplus and contingency reserves and 50% of its loss reserves and unearned premium reserves in certain qualifying assets. As of December 31, 2014, MBIA Corp. had enough qualifying assets to support its contingency reserves.
In connection with MBIA Corp. obtaining approval from the NYSDFS to release excessive contingency reserves in previous periods, MBIA Corp. agreed that it would not pay any dividends without prior approval from the NYSDFS. Due to its significant negative earned surplus, MBIA Corp. has not had the statutory capacity to pay dividends since December 31, 2009 and is not expected to have any statutory capacity to pay any dividends for the foreseeable future.
As of December 31, 2014, MBIA Corp. was in compliance with its aggregate risk limits under the NYIL. If MBIA Corp. is not in compliance with its aggregate risk limits, the NYSDFS may prevent MBIA Corp. from transacting any new financial guarantee insurance business until it no longer exceeds the limitations. In 2014 and 2013, MBIA Corp. reported additional overages to the NYSDFS with respect to its single risk limits due to changes in its statutory capital.
67
Table of Contents
Item 7. Management’s Discussion and Analysis of Financial Condition and Results of Operations
CAPITAL RESOURCES (continued)
As of December 31, 2014 , the par amount outstanding of MBIA Corp.’s 14% Fixed-to-Floating Rate Surplus Notes due January 15, 2033 (the “Surplus Notes”) was $953 million. Section 1307 of the Insurance Law and the Fiscal Agency Agreement governing the surplus notes (the “Fiscal Agency Agreement”), which was approved as it relates to Section 1307 by the NYSDFS in connection with the issuance of the Surplus Notes, each impose restrictions on the payments of principal and interest (or the redemption price or any make-whole premium) on the Surplus Notes (“Surplus Note Payments”). Section 1307 of the Insurance Law provides that any payments on surplus notes issued by an insurer “shall be repaid only out of free and divisible surplus of such insurer with the approval of the superintendent whenever, in his judgment, the financial condition of such insurer warrants.” The Superintendent has broad discretion in determining whether to allow us to make Surplus Note Payments. We are not aware of any guidelines or interpretations that govern the exercise of the Superintendent’s discretion under Section 1307 in determining whether the financial condition of an insurer warrants the making of such payments. The Fiscal Agency Agreement provides that (a) Surplus Note Payments may be made only with the prior approval of the Superintendent, whenever, in his judgment, the financial condition of MBIA Corp. warrants, and (b) any such Surplus Note Payments may only be made to the extent MBIA Corp. has sufficient “Eligible Surplus” to make such payment. The Fiscal Agency Agreement defines “Eligible Surplus” as MBIA Corp. “surplus as regards policyholders,” less the sum of its “common capital stock” and “preferred capital stock”, as shown on its annual and quarterly statements filed with state insurance regulatory authorities.
While the insurance law does not explicitly set forth the calculation of “free and divisible surplus”, MBIA believes that the calculation of Eligible Surplus, as set forth in the Fiscal Agency Agreement is the appropriate calculation of “free and divisible surplus” and is the commonly accepted calculation of “free and divisible surplus” used in connection with other surplus notes issued by New York domiciled insurance companies. MBIA Corp.’s “free and divisible” surplus, determined as set forth above, was $251 million as of December 31, 2014 representing an increase of $138 million from December 31, 2013. The increase in MBIA Corp.’s “free and divisible” surplus during 2014, primarily resulted from the release of $105 million of contingency reserves associated with policies that matured or were contractually terminated during 2014. MBIA Corp. is required to seek the Superintendent’s approval to make payments of accrued interest and principal when scheduled on the Surplus Notes. There is no assurance the Superintendent will approve Surplus Note Payments. Notwithstanding the sufficiency of MBIA Corp.’s Eligible Surplus available for the payment of Surplus Note Payments, the NYSDFS may deny approval of any Surplus Note Payments if the Superintendent concludes that MBIA Corp.’s financial condition does not warrant such approval.
The NYSDFS has not approved MBIA Corp.’s requests to make interest payments on the Surplus Notes since, and including, the January 15, 2013 interest payment. The NYSDFS has cited both MBIA Corp.’s liquidity and financial condition as well as the availability of “free and divisible surplus” as the basis for such non-approvals. As of January 15, 2015, the scheduled interest payment date, there was $286 million of accrued and unpaid interest on the Surplus Notes. The accrued and unpaid interest on the Surplus Notes will become due on the first business day on or after which MBIA Corp. obtains approval to pay some or all of such accrued and unpaid interest. No interest has been accrued or will accrue on the deferred interest.
Claims-Paying Resources (Statutory Basis)
CPR is a key measure of the resources available to MBIA Corp. to pay claims under its insurance policies. CPR consists of total financial resources and reserves calculated on a statutory basis. CPR has been a common measure used by financial guarantee insurance companies to report and compare resources, and continues to be used by MBIA’s management to evaluate changes in such resources. We have provided CPR to allow investors and analysts to evaluate MBIA Corp., using the same measure that MBIA’s management uses to evaluate MBIA Corp.’s resources to pay claims under its insurance policies. There is no directly comparable GAAP measure. Our calculation of CPR may differ from the calculation of CPR reported by other companies.
68
Table of Contents
Item 7. Management’s Discussion and Analysis of Financial Condition and Results of Operations
CAPITAL RESOURCES (continued)
MBIA Corp.’s CPR and components thereto, as of December 31, 2014 and 2013 are presented in the following table:
| In millions |
As of December 31, 2014 |
As of December 31, 2013 |
||||||
| Policyholders’ surplus |
$ | 542 | $ | 403 | ||||
| Contingency reserves |
317 | 422 | ||||||
|
|
|
|
|
|||||
| Statutory capital |
859 | 825 | ||||||
| Unearned premium reserve |
434 | 535 | ||||||
| Present value of installment premiums(1) |
662 | 850 | ||||||
|
|
|
|
|
|||||
| Premium resources(2) |
1,096 | 1,385 | ||||||
| Net loss and LAE reserves(1) |
(237) | 103 | ||||||
| Salvage reserves(3) |
938 | 1,148 | ||||||
|
|
|
|
|
|||||
| Gross loss and LAE reserve |
701 | 1,251 | ||||||
|
|
|
|
|
|||||
| Total claims-paying resources |
$ | 2,656 | $ | 3,461 | ||||
|
|
|
|
|
|||||
(1)—Calculated using a discount rate of 5.17% and 5.09% as of December 31, 2014 and 2013, respectively.
(2)—Includes financial guarantee and insured credit derivative related premiums.
(3)—This amount primarily consists of expected recoveries related to the Company’s excess spread.
LIQUIDITY
We use a liquidity risk management framework, the primary objective of which is to match liquidity resources to needs. We monitor our cash and liquid asset resources using daily cash forecasting and stress-scenario testing. Members of MBIA’s senior management meet regularly to review liquidity metrics, discuss contingency plans and establish target liquidity levels. We evaluate and manage liquidity on a legal-entity basis to take into account the legal, regulatory and other limitations on available liquidity resources within the enterprise. During the financial crisis and recession, the Company used intercompany lending agreements to match liquidity sources with uses. Today, we believe that our resources include capital market access that largely eliminates the need for such intercompany lending agreements. Below is a discussion of our liquidity resources and requirements for our holding company and our insurance subsidiaries.
Key Lending Agreements
Below is a description of certain ongoing intercompany lending agreements.
Asset Swap
National maintains the Asset Swap with MBIA Inc. which provides MBIA Inc. with eligible assets to pledge under investment agreements and derivative contracts. As of December 31, 2014, the notional amount used under each of these agreements was $443 million and the fair value of collateral pledged by National and MBIA Inc. under these agreements was $458 million and $474 million, respectively. The net average interest rate on these transactions was 0.23%, 0.24% and 0.44% for the years ended December 31, 2014, 2013 and 2012, respectively.
Advances Agreement
MBIA Inc., National, MBIA Corp. and certain other subsidiaries are party to an intercompany advances agreement that was established in 2001. This agreement permits MBIA Corp. to make or accept advances from MBIA Inc., National and other MBIA group companies that are party to the agreement at a rate per annum equal to LIBOR plus 0.25%, in the case of advances to or from MBIA Corp. and National, or LIBOR minus 0.10% in the case of advances from any other MBIA group company. Advances may not exceed 3% of either MBIA Insurance Corporation’s or National’s admitted assets as of the last year end. During 2014 and 2013, there were no amounts drawn under this agreement.
69
Table of Contents
Item 7. Management’s Discussion and Analysis of Financial Condition and Results of Operations
LIQUIDITY (continued)
Corporate Liquidity
Corporate’s liquidity resources support our MBIA Inc. entity. The primary sources of cash within MBIA Inc. available to meet its liquidity needs include:
| • | available cash and liquid assets not subject to collateral posting requirements; |
| • | payments under tax sharing agreements from subsidiaries; |
| • | dividends from subsidiaries; |
| • | principal and interest receipts on assets held in its investment portfolio; and |
| • | access to capital markets. |
The primary uses of cash within MBIA Inc. include:
| • | servicing outstanding corporate debt instruments, investment agreements and the intercompany loans that support MTNs issued by GFL; |
| • | managing collateral requirements under hedging arrangements, investment agreements and the Asset Swap; |
| • | making payments related to interest rate swaps; |
| • | managing investments including investments in subsidiaries; and |
| • | payments of operating expenses. |
We expect that for the foreseeable future National will be the primary source of dividends and tax sharing agreement payments. There can be no assurance as to the amount and timing of any such dividends or payments under the tax sharing agreements. During 2014, National declared and paid a dividend of $220 million to its ultimate parent, MBIA Inc. Declared and paid dividend amounts from National in the foreseeable future will be limited based on net investment income and will be substantially lower than previous dividends. Refer to the “Capital Resources—Insurance Statutory Capital” section for additional information on payments of dividends. We do not expect that liquidity stress at MBIA Corp. would have any direct impact on MBIA Inc. given that we do not expect MBIA Inc. to receive distributions from MBIA Corp. for the foreseeable future.
During 2014, $220 million was released to MBIA Inc. under the MBIA group tax sharing agreement and related escrow agreement. Included in this amount was $160 million that represented National’s liability under the tax sharing agreement for the 2011 tax year, which was released from escrow pursuant to the terms under the tax sharing agreement following the expiration of National’s two-year net operating loss carry-back period under U.S. tax rules. During 2014, National paid to the Tax Escrow Account estimated 2014 taxes of $79 million. As of December 31, 2014, $422 million remained in escrow for the 2012 through the 2014 tax years. In January of 2015, $228 million was released to MBIA Inc. from the Tax Escrow Account related to the 2012 tax year. We expect to release up to $111 million from the Tax Escrow Account related to the 2013 tax year in January of 2016. There can be no assurance that payments under the Tax Escrow Account from subsidiaries will be released to MBIA Inc.
MBIA Inc.’s corporate debt, investment agreements, derivatives and GFL loans and GFL MTNs may be accelerated by the holders of such instruments upon the occurrence of certain events, such as a breach of covenant or representation, and in the following circumstances: (i) for corporate debt, the bankruptcy of MBIA Inc. or, for certain instruments, the filing of an insolvency proceeding with respect to National; (ii) for investment agreements, the bankruptcy of MBIA Inc. or the filing of an insolvency proceeding with respect to MBIA Corp., and in certain circumstances the bankruptcy of MBIA Inc. and the filing of an insolvency proceeding with respect to MBIA Corp.; (iii) for derivatives and GFL Loans to MBIA Inc., the bankruptcy of MBIA Inc.; and (iv) for GFL MTNs, the bankruptcy of GFL or the filing of an insolvency proceeding with respect to MBIA Corp.
Refer to “Note 12: Business Segments” in the Notes to Consolidated Financial Statements for a description of the GFL loans and MTNs. In the event of any acceleration of our obligations, including under our corporate debt, investment agreements, GFL MTNs, or derivatives, we likely would have insufficient resources to pay amounts due.
70
Table of Contents
Item 7. Management’s Discussion and Analysis of Financial Condition and Results of Operations
LIQUIDITY (continued)
MBIA Inc. has a net debt, which comprised long-term debt, GFL loans that support the GFL MTNs, investment agreements and derivative liabilities net of cash and investments at amortized cost (excluding investments in subsidiaries) and a tax receivable from subsidiaries in excess of cash and investments at MBIA Inc., of $740 million as of December 31, 2014. The Company expects that MBIA Inc. will generate sufficient cash to satisfy its net debt and its general corporate needs over time from distributions from its operating subsidiaries, although there can be no assurance that these distributions will generate sufficient cash to satisfy its net debt.
Currently, the majority of the cash and securities of MBIA Inc. is pledged against investment agreement liabilities, derivatives and the Asset Swap, which limit its ability to raise liquidity through asset sales. A significant portion of MBIA Inc.’s assets are pledged against Asset Swap liabilities. If the market value or rating eligibility of the assets which are pledged against MBIA Inc.’s obligations were to decline, we would be required to pledge additional eligible assets in order to meet minimum required collateral amounts against these liabilities. To mitigate these risks, we seek to maintain cash and liquidity resources that we believe will be sufficient to make all payments due on our obligations and to meet other financial requirements, such as posting collateral. Contingent liquidity resources include: (1) accessing the capital markets; (2) sales of invested assets exposed to credit spread stress risk, which may occur at losses and increase MBIA Inc.’s net debt; and (3) termination and settlement of interest rate swap agreements. These actions, if taken, are expected to result in either additional liquidity or reduced exposure to adverse credit spread movements. There can be no assurance that these actions will be sufficient to fully mitigate this risk. Information concerning our credit spread sensitivity appears in Part II, Item 7A, “Quantitative and Qualitative Disclosures about Market Risk.”
As of December 31, 2014 and 2013, the liquidity position of MBIA Inc. comprised cash and liquid assets for general corporate liquidity purposes, excluding the amounts held in escrow under its tax sharing agreement, were $498 million and $359 million, respectively.
MBIA Corp. Liquidity
Liquidity available in our international and structured finance insurance segment is affected by:
| • | loss payments on insured transactions, that fall into four categories; |
| • | scheduled interest and ultimate principal; |
| • | scheduled interest and principal; |
| • | ultimate principal only at final maturity; and |
| • | payments upon settlement of individual collateral losses as they occur after any deductible or subordination has been exhausted, which payments are unscheduled and therefore more difficult to predict, and which category applies to most of the transactions on which we have recorded loss reserves. |
| • | the persistence of installment premiums; |
| • | our ability to collect on recoveries associated with loss payments; |
| • | payments made to commute insured exposures; |
| • | principal and interest related to its surplus notes, to the extent approved by the NYSDFS. Refer to “Capital Resources – Insurance Statutory Capital” for a discussion on the denied requests from the NYSDFS to pay interest on its surplus notes |
| • | operating expenses; |
| • | investment results; or |
| • | the impairment or a significant decline in the fair value of invested assets. |
We may also experience liquidity constraints as a result of NYIL requirements that we maintain specified, high quality assets to back our reserves and surplus.
71
Table of Contents
Item 7. Management’s Discussion and Analysis of Financial Condition and Results of Operations
LIQUIDITY (continued)
Insured transactions that require payment in full of the principal insured at maturity could present liquidity risks for MBIA Corp. since payment of the principal is due at maturity but any salvage could be recovered over time after payment of the principal amount. MBIA Corp. has insured transactions with substantial principal amounts due at maturity that are scheduled to mature in the near term. MBIA Corp. expects the transactions to be repaid on or prior to the maturity date. MBIA Corp. is generally required to satisfy claims within one to three business days, and as a result seeks to identify potential claims in advance through our monitoring process. While our financial guarantee policies generally cannot be accelerated, thereby helping to mitigate liquidity risk, the insurance of CDS contracts may, in certain circumstances, including the occurrence of certain insolvency or payment defaults under the CDS contracts, be subject to termination by the counterparty, triggering a claim for the fair value of the contract. In order to monitor liquidity risk and maintain appropriate liquidity resources, we use the same methodology as we use to monitor credit quality and losses within our insured portfolio, including stress scenarios. Refer to “Note 6: Loss and Loss Adjustment Expense Reserves” in the Notes to Consolidated Financial Statements for a discussion of our loss process.
MBIA Corp. has recorded expected excess spread recoveries of $628 million as of December 31, 2014 associated with insured second-lien RMBS issues, including recoveries related to consolidated VIEs. MBIA Corp. has also recorded expected recoveries related to its claims against Credit Suisse related to ineligible loans included in an MBIA Corp. insured RMBS transaction. There can be no assurance that we will be successful or that we will not be delayed in realizing these recoveries. During 2014, MBIA Corp. collected $116 million of recoveries related to insured second-lien RMBS issues comprising $98 million of excess spread and $18 million of mortgage insurance. Mortgage insurance is received periodically from the servicers. During 2014, recoveries on second-lien RMBS issues exceeded paid claims and LAE by $12 million.
We believe that MBIA Corp.’s liquidity resources, including expected cash inflows, will adequately provide for anticipated cash outflows, including expected future claim payments. The liquidity position of MBIA Corp. has been stressed due to ongoing payments on second-lien RMBS exposures, payments on its remaining CMBS exposures and payments to counterparties in consideration for the commutation of insured transactions, which have resulted in a substantial reduction of exposure and potential loss volatility. Depending on the amount of actual future claims, including claims on insured exposures that in some cases may require large bullet payments, and the amount of future cash inflows, in particular in excess spread and put-back recoverables, MBIA Corp. may not have sufficient liquid assets to pay its claims. While future commutation opportunities will be limited due to the portfolio reduction that has taken place, management’s assessment of available liquidity will be factored in any commutation decision. Also, future commutation payments on insured transactions to counterparties will depend on management’s assessment of available liquidity or ability to secure other sources of financing. In the event that we experience other unexpected liquidity requirements, we may have insufficient resources to meet our obligations or insufficient qualifying assets to support our surplus and reserves, and may seek to increase liquidity through financing transactions. There can be no assurance that we will be successful in generating sufficient cash to meet our obligations.
As of December 31, 2014, MBIA Corp. held cash and AFS investments of $1.2 billion, of which $443 million comprised cash and highly liquid assets that were immediately available to MBIA Corp. Included in the $1.2 billion was $701 million of cash and AFS investments held by MBIA Insurance Corporation’s subsidiaries. As of December 31, 2013, MBIA Corp. held cash and AFS investments of $1.6 billion, of which $827 million comprised cash and highly liquid assets that were immediately available to MBIA Corp. Included in the $1.6 billion was $693 million of cash and AFS investments held by MBIA Insurance Corporation’s subsidiaries.
National Liquidity
We believe that the liquidity position of our U.S. public finance insurance segment is sufficient to meet cash requirements in the ordinary course of business.
Liquidity needs within our U.S. public finance insurance segment are primarily a result of the following:
| • | loss payments on insured transactions; and |
| • | operating expenses and tax payments. |
72
Table of Contents
Item 7. Management’s Discussion and Analysis of Financial Condition and Results of Operations
LIQUIDITY (continued)
The insurance policies issued or reinsured by National provide unconditional and irrevocable guarantees of payments of the principal of, and interest or other amounts owing on, insured obligations when due. In the event of a default in payment of principal, interest or other insured amounts by an issuer, National generally promises to make funds available in the insured amount within one to three business days following notification. In some cases, the amount due can be substantial, particularly if the default occurs on a transaction to which National has a large notional exposure or on a transaction structured with large, bullet-type principal maturities. The fact that the U.S. public finance insurance segment’s financial guarantee contracts generally cannot be accelerated by a party other than the insurer helps to mitigate liquidity risk in this segment.
As of December 31, 2014, National held cash and short-term investments of $595 million, of which $528 million was highly liquid and comprised highly rated commercial paper, money market funds and municipal, U.S. agency and corporate bonds. As of December 31, 2013, National held cash and short-term investments of $665 million, of which $627 million was highly liquid and comprised commercial paper, money market funds, and highly rated municipal, U.S. agency and corporate bonds.
Consolidated Cash Flows
Information about our consolidated cash flows by category is presented on our consolidated statements of cash flows. The following table summarizes our consolidated cash flows for the years ended December 31, 2014, 2013 and 2012:
| Years Ended December 31, | Percent Change | |||||||||||||||||||
| In millions |
2014 | 2013 | 2012 | 2014 vs. 2013 | 2013 vs. 2012 | |||||||||||||||
| Statement of cash flow data: |
||||||||||||||||||||
| Net cash provided (used) by: |
||||||||||||||||||||
| Operating activities |
$ | (333) | $ | 1,829 | $ | (1,027) | -118% | n/m | ||||||||||||
| Investing activities |
812 | (6) | 4,195 | n/m | -100% | |||||||||||||||
| Financing activities |
(892) | (1,566) | (2,811) | -43% | -44% | |||||||||||||||
| Effect of exchange rate changes on cash and cash equivalents |
(8) | 11 | — | n/m | n/m | |||||||||||||||
| Cash and cash equivalents—beginning of year |
1,258 | 990 | 633 | 27% | 56% | |||||||||||||||
| Reclassification to assets held for sale |
(55) | — | — | n/m | n/m | |||||||||||||||
|
|
|
|
|
|
|
|
|
|
|
|||||||||||
| Cash and cash equivalents—end of year |
$ | 782 | $ | 1,258 | $ | 990 | -38% | 27% | ||||||||||||
|
|
|
|
|
|
|
|
|
|
|
|||||||||||
n/m—Percent change not meaningful.
Operating activities
Net cash used by operating activities increased for the year ended December 31, 2014 compared with 2013 primarily due to a decrease in financial guarantee recoveries received of $2.5 billion partially offset by a decrease in financial guarantee losses and LAE paid of $203 million. Net cash provided by operating activities increased in 2013 compared with 2012 primarily due to an increase in financial guarantee recoveries received of $2.4 billion as a result of the Bank of America Settlement and the sale of the Residential Funding Company, LLC Claims, a decrease in payments for losses and LAE of $452 million primarily due to reductions in payments for second-lien RMBS and a gaming related transaction, and a decrease in interest expense paid of $176 million as a result of the NYSDFS’ denial to approve interest payments on the surplus notes. These changes were partially offset by a decrease in cash received from investment income of $168 million due to sales of investments to fund claim and commutation payments.
73
Table of Contents
Item 7. Management’s Discussion and Analysis of Financial Condition and Results of Operations
LIQUIDITY (continued)
Investing activities
Net cash provided by investing activities increased for the year ended December 31, 2014 compared with 2013 primarily due to a decline in purchases of AFS securities of $903 million and an increase in cash due to the consolidation of a VIE of $221 million, partially offset by declines in proceeds from net sales, paydowns and maturities of investments and loans receivables of $390 million. Net cash used by investing activities decreased in 2013 compared with 2012 due to declines in proceeds from net sales, paydowns, and maturities of investments of $5.6 billion for purposes of funding commutation and loss payments, partially offset by a decline in purchases of AFS securities of $689 million and a reduction in collateral posting of $407 million.
Financing activities
Net cash used by financing activities decreased for the year ended December 31, 2014 compared with 2013 primarily due to a decrease in principal paydowns of debt related to financial guarantee VIEs and investment agreements of $596 million and an increase in proceeds from the issuance of VIE notes of $79 million, partially offset by purchases of treasury stock of $32 million. Net cash used by financing activities decreased in 2013 compared with 2012 primarily due to decreases in payments of long-term debt related to our conduit segment of $537 million, drawdowns of investment agreements of $403 million and securities sold under agreements to repurchase of $287 million.
Investments
The following discussion of investments, including references to consolidated investments, excludes investments reported under “Assets of consolidated variable interest entities” on our consolidated balance sheets. Investments of VIEs support the repayment of VIE obligations and are not available to settle obligations of MBIA. In addition, as of December 31, 2014, investments carried at fair value of $6 million within our advisory services segment are also excluded due to the sale of Cutwater in January of 2015. These assets are reported under “Assets held for sale” in our consolidated balance sheet. Our AFS investments comprise high-quality fixed-income securities and short-term investments. The following table presents our investment portfolio as of December 31, 2014 and 2013:
| As of December 31, | ||||||||||||
| In millions |
2014 | 2013 | Percent Change | |||||||||
| Available-for-sale investments: |
||||||||||||
| U.S. public finance insurance |
||||||||||||
| Amortized cost |
$ | 4,390 | $ | 4,640 | -5% | |||||||
| Unrealized net gain (loss) |
(7) | (105) | -93% | |||||||||
|
|
|
|
|
|
|
|||||||
| Fair value |
4,383 | 4,535 | -3% | |||||||||
|
|
|
|
|
|
|
|||||||
| International and structured finance insurance |
||||||||||||
| Amortized cost |
654 | 671 | -3% | |||||||||
| Unrealized net gain (loss) |
20 | 12 | 67% | |||||||||
|
|
|
|
|
|
|
|||||||
| Fair value |
674 | 683 | -1% | |||||||||
|
|
|
|
|
|
|
|||||||
| Corporate |
||||||||||||
| Amortized cost |
1,465 | 1,375 | 7% | |||||||||
| Unrealized net gain (loss) |
49 | (39) | n/m | |||||||||
|
|
|
|
|
|
|
|||||||
| Fair value |
1,514 | 1,336 | 13% | |||||||||
|
|
|
|
|
|
|
|||||||
| Advisory services |
||||||||||||
| Amortized cost |
— | 2 | -100% | |||||||||
| Unrealized net gain (loss) |
— | — | —% | |||||||||
|
|
|
|
|
|
|
|||||||
| Fair value |
— | 2 | -100% | |||||||||
|
|
|
|
|
|
|
|||||||
| Total available-for-sale investments: |
||||||||||||
| Amortized cost |
6,509 | 6,688 | -3% | |||||||||
| Unrealized net gain (loss) |
62 | (132) | -147% | |||||||||
|
|
|
|
|
|
|
|||||||
| Total available-for-sale investments at fair value |
6,571 | 6,556 | —% | |||||||||
|
|
|
|
|
|
|
|||||||
74
Table of Contents
Item 7. Management’s Discussion and Analysis of Financial Condition and Results of Operations
LIQUIDITY (continued)
| As of December 31, | ||||||||||||
| In millions |
2014 | 2013 | Percent Change | |||||||||
| Investments carried at fair value: |
||||||||||||
| U.S. public finance insurance |
||||||||||||
| Amortized cost |
144 | 136 | 6% | |||||||||
| Unrealized net gain (loss) |
(1) | (7) | -86% | |||||||||
|
|
|
|
|
|
|
|||||||
| Fair value |
143 | 129 | 11% | |||||||||
|
|
|
|
|
|
|
|||||||
| International and structured finance insurance |
||||||||||||
| Amortized cost |
— | 27 | -100% | |||||||||
| Unrealized net gain (loss) |
— | 2 | -100% | |||||||||
|
|
|
|
|
|
|
|||||||
| Fair value |
— | 29 | -100% | |||||||||
|
|
|
|
|
|
|
|||||||
| Corporate |
||||||||||||
| Amortized cost |
112 | 112 | —% | |||||||||
| Unrealized net gain (loss) |
— | (1) | -100% | |||||||||
|
|
|
|
|
|
|
|||||||
| Fair value |
112 | 111 | 1% | |||||||||
|
|
|
|
|
|
|
|||||||
| Advisory services |
||||||||||||
| Amortized cost |
— | 5 | -100% | |||||||||
| Unrealized net gain (loss) |
— | — | —% | |||||||||
|
|
|
|
|
|
|
|||||||
| Fair value |
— | 5 | -100% | |||||||||
|
|
|
|
|
|
|
|||||||
| Total investments carried at fair value: |
||||||||||||
| Amortized cost |
256 | 280 | -9% | |||||||||
| Unrealized net gain (loss) |
(1) | (6) | -83% | |||||||||
|
|
|
|
|
|
|
|||||||
| Total investments carried at fair value |
255 | 274 | -7% | |||||||||
|
|
|
|
|
|
|
|||||||
| Other investments at amortized cost: |
||||||||||||
| U.S. public finance insurance |
4 | 4 | —% | |||||||||
| International and structured finance insurance |
— | 1 | -100% | |||||||||
|
|
|
|
|
|
|
|||||||
| Total other investments at amortized cost |
4 | 5 | -20% | |||||||||
|
|
|
|
|
|
|
|||||||
| Consolidated investments at carrying value |
$ | 6,830 | $ | 6,835 | —% | |||||||
|
|
|
|
|
|
|
|||||||
n/m—Percent change not meaningful.
The fair value of the Company’s investments is based on prices which include quoted prices in active markets and prices based on market-based inputs that are either directly or indirectly observable, as well as prices from dealers in relevant markets. Differences between fair value and amortized cost arise primarily as a result of changes in interest rates and general market credit spreads occurring after a fixed-income security is purchased, although other factors may also influence fair value, including specific credit-related changes, supply and demand forces and other market factors. When the Company holds an AFS investment to maturity, any unrealized gain or loss currently recorded in accumulated other comprehensive income (loss) in the shareholders’ equity section of the balance sheet is reversed. As a result, the Company would realize a value substantially equal to amortized cost. However, when investments are sold prior to maturity, the Company will realize any difference between amortized cost and the sale price of an investment as a realized gain or loss within its consolidated statements of operations.
75
Table of Contents
Item 7. Management’s Discussion and Analysis of Financial Condition and Results of Operations
LIQUIDITY (continued)
Credit Quality
The credit quality distribution of the Company’s AFS fixed-maturity investment portfolios, excluding short-term investments, based on ratings from Moody’s as of December 31, 2014 is presented in the following table. Alternate ratings sources, such as S&P or the best estimate of the ratings assigned by the Company, have been used for a small percentage of securities that are not rated by Moody’s.
| U.S. Public Finance Insurance |
International and Structured Finance Insurance |
Corporate | Total | |||||||||||||||||||||||||||||
| In millions |
Fair Value |
% of Fixed- Income Investments |
Fair Value |
% of Fixed- Income Investments |
Fair Value |
% of Fixed- Income Investments |
Fair Value |
% of Fixed- Income Investments |
||||||||||||||||||||||||
| Available-for-sale: |
||||||||||||||||||||||||||||||||
| Aaa |
$ | 1,733 | 45% | $ | 144 | 29% | $ | 226 | 26% | $ | 2,103 | 40% | ||||||||||||||||||||
| Aa |
1,293 | 34% | 258 | 52% | 148 | 17% | 1,699 | 33% | ||||||||||||||||||||||||
| A |
652 | 17% | 75 | 15% | 324 | 37% | 1,051 | 20% | ||||||||||||||||||||||||
| Baa |
123 | 2% | 7 | 1% | 87 | 10% | 217 | 4% | ||||||||||||||||||||||||
| Below investment grade |
24 | 1% | 15 | 3% | 60 | 7% | 99 | 2% | ||||||||||||||||||||||||
| Not rated |
25 | 1% | — | 0% | 31 | 3% | 56 | 1% | ||||||||||||||||||||||||
|
|
|
|
|
|
|
|
|
|
|
|
|
|
|
|
|
|||||||||||||||||
| Total |
$ | 3,850 | 100% | $ | 499 | 100% | $ | 876 | 100% | $ | 5,225 | 100% | ||||||||||||||||||||
| Short-term investments |
524 | 174 | 635 | 1,333 | ||||||||||||||||||||||||||||
| Investments carried at fair value |
143 | — | 112 | 255 | ||||||||||||||||||||||||||||
| Other investments |
13 | 1 | 3 | 17 | ||||||||||||||||||||||||||||
|
|
|
|
|
|
|
|
|
|||||||||||||||||||||||||
| Consolidated investments at carrying value |
$ | 4,530 | $ | 674 | $ | 1,626 | $ | 6,830 | ||||||||||||||||||||||||
|
|
|
|
|
|
|
|
|
|||||||||||||||||||||||||
As of December 31, 2014, the weighted average credit quality of the Company’s AFS investment portfolios, excluding short-term and other investments, as presented in the preceding table are as follows:
| U.S. Public Finance Insurance |
International and Structured Finance Insurance |
Corporate | ||||||||||
| Weighted average credit quality ratings |
Aa | Aa | A | |||||||||
Insured Investments
MBIA’s consolidated investment portfolio includes investments that are insured by various financial guarantee insurers (“Insured Investments”), including investments insured by National and MBIA Corp. (“Company-Insured Investments”). As of December 31, 2014, Insured Investments at fair value represented $498 million or 7% of consolidated investments, of which $312 million or 5% of consolidated investments were Company-Insured Investments. As of December 31, 2014, based on the actual or estimated underlying ratings of our consolidated investment portfolio, without giving effect to financial guarantees, the weighted average rating of only the Insured Investments in the investment portfolio would be in the A range.
In purchasing Insured Investments, the Company independently assesses the underlying credit quality, structure and liquidity of each investment, in addition to the creditworthiness of the insurer. Insured Investments are diverse by sector, issuer and size of holding. The Company assigns underlying ratings to its Insured Investments without giving effect to financial guarantees based on underlying ratings assigned by Moody’s, or another external agency when a rating is not published by Moody’s. When an external underlying rating is not available, the underlying rating is based on the Company’s best estimate of the rating of such investment. A downgrade of a financial guarantee insurer will likely have an adverse effect on the fair value of investments insured by the downgraded financial guarantee insurer. If MBIA determines that declines in the fair values of Insured Investments are other-than-temporary, the Company will record a realized loss through earnings.
76
Table of Contents
Item 7. Management’s Discussion and Analysis of Financial Condition and Results of Operations
LIQUIDITY (continued)
The underlying ratings of the Company-Insured Investments as of December 31, 2014 are reflected in the following table. Amounts represent the fair value of such investments including the benefit of the MBIA guarantee. The ratings in the following table are based on ratings from Moody’s. Alternate ratings sources, such as S&P, have been used for a small percentage of securities that are not rated by Moody’s.
| In millions
Underlying Ratings Scale |
U.S. Public Finance Insurance |
Corporate | Total | |||||||||
| National: |
||||||||||||
| Aa |
$ | — | $ | 24 | $ | 24 | ||||||
| A |
21 | 162 | 183 | |||||||||
|
|
|
|
|
|
|
|||||||
| Total National |
$ | 21 | $ | 186 | $ | 207 | ||||||
|
|
|
|
|
|
|
|||||||
| MBIA Corp.: |
||||||||||||
| Aa |
$ | — | $ | 53 | $ | 53 | ||||||
| Below investment grade |
— | 52 | 52 | |||||||||
|
|
|
|
|
|
|
|||||||
| Total MBIA Corp. |
$ | — | $ | 105 | $ | 105 | ||||||
|
|
|
|
|
|
|
|||||||
| Total Company-Insured Investments |
$ | 21 | $ | 291 | $ | 312 | ||||||
|
|
|
|
|
|
|
|||||||
Without giving effect to the National and MBIA Corp. guarantees of the Company-Insured Investments in the consolidated investment portfolio, as of December 31, 2014, based on actual or estimated underlying ratings, the weighted average rating of the consolidated investment portfolio was in the Aa range. The weighted average rating of only the Company-Insured Investments was in the Baa range, and investments rated below investment grade in the Company-Insured Investments were 2% of the total consolidated investment portfolio.
Impaired Investments
As of December 31, 2014 and 2013, we held impaired AFS investments (investments for which fair value was less than amortized cost) with a fair value of $2.1 billion and $3.5 billion, respectively.
We analyze impaired investments within our investment portfolio for OTTI on a quarterly basis. Key factors considered when assessing OTTI include but are not limited to: (a) structural and economic factors among security types that represent our largest exposure to credit impairment losses; (b) the duration and severity of the unrealized losses (i.e., a decline in the market value of a security by 20% or more at the time of the review, or 5% impaired at the time of review with a fair value below amortized cost for a consecutive 12-month period); and (c) the results of various cash flow modeling techniques. Our cash flow analysis considers all sources of cash, including credit enhancement, that support the payment of amounts owed by an issuer of a security. This includes the consideration of cash expected to be provided by financial guarantors, including MBIA Corp., resulting from an actual or potential insurance policy claim.
Refer to “Note 8: Investments” in the Notes to Consolidated Financial Statements for a detailed discussion about impaired investments.
77
Table of Contents
Item 7. Management’s Discussion and Analysis of Financial Condition and Results of Operations
LIQUIDITY (continued)
Contractual Obligations
The following table summarizes the Company’s future estimated cash payments relating to contractual obligations as of December 31, 2014. Estimating these payments requires management to make estimates and assumptions regarding these obligations. The estimates and assumptions used by management are described below. Since these estimates and assumptions are subjective, actual payments in future periods may vary from those reported in the following table. Refer to “Note 13: Insurance in Force” in the Notes to Consolidated Financial Statements for information about the Company’s exposure under insurance contracts.
| As of December 31, 2014 | ||||||||||||||||||||||||||||
| In millions |
2015 | 2016 | 2017 | 2018 | 2019 | Thereafter | Total | |||||||||||||||||||||
| U.S. public finance insurance segment: |
||||||||||||||||||||||||||||
| Gross insurance claim obligations |
$ | 3 | $ | 4 | $ | 3 | $ | 6 | $ | 5 | $ | 35 | $ | 56 | ||||||||||||||
| Lease liability |
1 | 3 | 3 | 3 | 2 | 31 | 43 | |||||||||||||||||||||
| International and structured finance insurance segment: |
||||||||||||||||||||||||||||
| Surplus notes |
390 | 108 | 108 | 957 | — | — | 1,563 | |||||||||||||||||||||
| Gross insurance claim obligations |
285 | 129 | 21 | 16 | 15 | 967 | 1,433 | |||||||||||||||||||||
| Corporate segment: |
||||||||||||||||||||||||||||
| Long-term debt |
38 | 38 | 38 | 38 | 38 | 802 | 992 | |||||||||||||||||||||
| Investment agreements |
59 | 58 | 73 | 33 | 25 | 619 | 867 | |||||||||||||||||||||
| Medium-term notes |
118 | 133 | 64 | 73 | 74 | 1,248 | 1,710 | |||||||||||||||||||||
| Lease liability |
1 | 1 | 2 | 1 | 1 | 3 | 9 | |||||||||||||||||||||
|
|
|
|
|
|
|
|
|
|
|
|
|
|
|
|||||||||||||||
| Total |
$ | 895 | $ | 474 | $ | 312 | $ | 1,127 | $ | 160 | $ | 3,705 | $ | 6,673 | ||||||||||||||
|
|
|
|
|
|
|
|
|
|
|
|
|
|
|
|||||||||||||||
Gross insurance claim obligations represent the future value of probability-weighted payments MBIA expects to make (before estimated recoveries, reinsurance and the consolidation of VIEs) under insurance policies for which the Company has recorded loss reserves (financial guarantees) or has estimated credit impairments (insured derivatives). The discounted value of estimated payments included in the table, along with probability-weighted estimated recoveries and estimated negotiated early settlements, on policies accounted for as financial guarantee insurance contracts is reported as case basis reserves within “Loss and loss adjustment expense reserves” on the Company’s consolidated balance sheets. Insured derivatives are recorded at fair value and reported within “Derivative liabilities” on the Company’s consolidated balance sheets. Estimated potential claim payments on obligations issued by VIEs consolidated in our international and structured finance insurance segment are included within “Gross insurance claim obligations” in the preceding table. Obligations of these VIEs are collateralized by assets held by the VIEs, and investors in such obligations do not have recourse to the general credit of MBIA. As of December 31, 2014, VIE notes issued by issuer-sponsored consolidated VIEs totaled $4.8 billion, including $2.1 billion recorded at fair value, and are not considered contractual obligations of MBIA beyond MBIA’s insurance claim obligation. The Company’s involvement with VIEs is continually reassessed as required by consolidation guidance, and may result in consolidation or deconsolidation of VIEs in future periods. As the Company consolidates and deconsolidates VIEs, the amount of VIE debt obligations recorded on its balance sheet may change significantly.
Surplus notes, investment agreements, MTNs, and long-term debt include principal and interest and exclude premiums or discounts. Liabilities issued at discounts reflect principal due at maturity. Interest payments on floating rate obligations are estimated using applicable forward rates. Principal and interest on callable obligations or obligations that allow investors to withdraw funds prior to legal maturity are based on the expected call or withdrawal dates of such obligations. Liabilities denominated in foreign currencies are presented in U.S. dollars using applicable exchange rates as of December 31, 2014.
Included in international and structured finance insurance segment’s surplus notes is interest related to the 2013 and 2014 interest payments in which MBIA Corp.’s requests for approval to pay was denied by the NYSDFS. This deferred interest payment will be due on the first business day on or after which MBIA Corp. obtains approval to make such payment. No interest will accrue on the deferred interest. There can be no assurance that the NYSDFS will approve any subsequent payments, or that it will approve any payment by the scheduled interest payment date.
78
Table of Contents
Item 7. Management’s Discussion and Analysis of Financial Condition and Results of Operations
LIQUIDITY (continued)
The repayment of principal on our surplus notes is reflected in 2018, which is the next call date. Principal payments under investment agreements are based on expected withdrawal dates. All other principal payments are based on contractual maturity dates.
Item 7A. Quantitative and Qualitative Disclosures About Market Risk
The Company’s market risk exposures relate to changes in interest rates, foreign exchange rates and credit spreads that affect the fair value of its financial instruments, namely investment securities, investment agreement liabilities, MTNs, debentures and certain derivative transactions. The Company’s investment portfolio holdings are primarily U.S. dollar-denominated fixed-income securities including municipal bonds, U.S. government bonds, MBS, collateralized mortgage obligations, corporate bonds and ABS. In periods of rising and/or volatile interest rates, foreign exchange rates and credit spreads, profitability could be adversely affected should the Company have to liquidate these securities.
MBIA minimizes its exposure to interest rate risk, foreign exchange risk and credit spread movement through active portfolio management to ensure a proper mix of the types of securities held and to stagger the maturities of its fixed-income securities. In addition, the Company enters into various swap agreements that hedge the risk of loss due to interest rate and foreign currency volatility.
Interest Rate Sensitivity
Interest rate sensitivity can be estimated by projecting a hypothetical instantaneous increase or decrease in interest rates. The following table presents the estimated pre-tax change in fair value of the Company’s financial instruments as of December 31, 2014 from instantaneous shifts in interest rates:
| Change in Interest Rates | ||||||||||||||||||||||||
| In millions |
300 Basis Point Decrease |
200 Basis Point Decrease |
100 Basis Point Decrease |
100 Basis Point Increase |
200 Basis Point Increase |
300 Basis Point Increase |
||||||||||||||||||
| Estimated change in fair value |
$ | 240 | $ | 194 | $ | 110 | $ | (122) | $ | (239) | $ | (350) | ||||||||||||
Foreign Exchange Rate Sensitivity
The Company is exposed to foreign exchange rate risk in respect of assets and liabilities denominated in currencies other than U.S. dollars. In addition to our international insurance business, some of the remaining liabilities included in our corporate segment are denominated in currencies other than U.S. dollars. Also, the Company regularly makes investments denominated in foreign currencies. The majority of the Company’s foreign exchange rate risks is with the pound sterling and the euro. Foreign exchange rate sensitivity can be estimated by projecting a hypothetical instantaneous increase or decrease in foreign exchange rates. The following table presents the estimated pre-tax change in fair value of the Company’s financial instruments as of December 31, 2014 from instantaneous shifts in foreign exchange rates:
| Change in Foreign Exchange Rates | ||||||||||||||||
| Dollar Weakens | Dollar Strengthens | |||||||||||||||
| In millions |
20% | 10% | 10% | 20% | ||||||||||||
| Estimated change in fair value |
$ | (9) | $ | (4) | $ | 4 | $ | 9 | ||||||||
Credit Spread Sensitivity
Credit spread sensitivity can be estimated by projecting a hypothetical instantaneous increase or decrease in credit spreads. The following table presents the estimated pre-tax change in fair value of the Company’s financial instruments as of December 31, 2014 from instantaneous shifts in credit spread curves. It was assumed that all credit spreads move by the same amount. It is more likely that the actual changes in credit spreads will vary by security.
79
Table of Contents
Item 7A. Quantitative and Qualitative Disclosures About Market Risk (continued)
National’s investment portfolio would generally be expected to experience lower credit spread volatility than other investment portfolios since National has higher credit quality and portfolio composition in sectors that have been less volatile historically. Because downward movements of these amounts in some cases would result in negative spreads, a floor was assumed for minimum spreads. The changes in fair value reflect partially offsetting effects as the value of the investment portfolios generally changes in an opposite direction from the liability portfolio.
| Change in Credit Spreads | ||||||||||||||||
| In millions |
200 Basis Point Decrease |
50 Basis Point Decrease |
50 Basis Point Increase |
200 Basis Point Increase |
||||||||||||
| Estimated change in fair value |
$ | 25 | $ | 73 | $ | (74) | $ | (306) | ||||||||
Credit Derivatives Sensitivity
MBIA Corp. issued insurance policies insuring payments due on structured credit derivative contracts which are marked-to-market through earnings under the accounting principles for derivatives and hedging activities. The majority of these structured CDSs related to structured finance transactions with underlying reference obligations of cash securities and CDSs referencing liabilities of corporations or of other structured finance securitizations. The asset classes of the underlying reference obligations included corporate, ABS, RMBS and CMBS. These transactions were usually underwritten at or above a triple-A credit rating level. As of December 31, 2014, approximately 73% of the tranches insured by the Company were rated triple-A.
In 2014, MBIA Corp. has observed a widening of its own credit spreads. As changes in fair value can be caused by factors unrelated to the performance of MBIA Corp.’s business and credit portfolio, including general market conditions and perceptions of credit risk, as well as market use of credit derivatives for hedging purposes unrelated to the specific referenced credits in addition to events that affect particular credit derivative exposures, the application of fair value accounting will cause the Company’s earnings to be more volatile than would be suggested by the underlying performance of MBIA’s business operations and credit portfolio.
The following tables reflect sensitivities to changes in credit spreads, credit rating, recovery rates and MBIA Corp.’s upfront credit spreads. Each table stands on its own and should be read independently of each other. Refer to “Note 7: Fair Value of Financial Instruments” in the Notes to Consolidated Financial Statements for further information about the Company’s financial assets and liabilities that are accounted for at fair value, including valuation techniques and disclosures required by GAAP.
Sensitivity to changes in credit spreads can be estimated by projecting a hypothetical instantaneous shift in credit spread curves. The following table presents the estimated pre-tax change in fair value and the cumulative estimated net fair value of MBIA Corp.’s credit derivatives portfolio of instantaneous shifts in credit spreads as of December 31, 2014. In scenarios where credit spreads decreased, a floor of zero was used.
| Change in Credit Spreads | ||||||||||||||||||||||||||||
| (International and Structured Finance Insurance) | ||||||||||||||||||||||||||||
| In millions |
600 Basis Point Decrease |
200 Basis Point Decrease |
50 Basis Point Decrease |
0 Basis Point Change |
50 Basis Point Increase |
200 Basis Point Increase |
600 Basis Point Increase |
|||||||||||||||||||||
| Estimated pre-tax net gains (losses) |
$ | 40 | $ | 16 | $ | 5 | $ | — | $ | (3) | $ | (16) | $ | (60) | ||||||||||||||
| Estimated net fair value |
$ | (204) | $ | (228) | $ | (239) | $ | (244) | $ | (247) | $ | (260) | $ | (304) | ||||||||||||||
Actual shifts in credit spread curves will vary based on the credit quality of the underlying reference obligations. In general, within any asset class, higher credit rated reference obligations will exhibit less credit spread movement than lower credit rated reference obligations. Additionally, the degree of credit spread movement can vary significantly for different asset classes. The basis point change presented in the preceding table, however, represents a fixed basis point change in referenced obligation credit spreads across all credit quality rating categories and asset classes and, therefore, the actual impact of spread changes would vary from this presentation depending on the credit rating and distribution across asset classes, both of which will adjust over time depending on new business written and runoff of the existing portfolio.
80
Table of Contents
Item 7A. Quantitative and Qualitative Disclosures About Market Risk (continued)
The following table presents the estimated pre-tax change in fair value and the cumulative estimated net fair value of MBIA Corp.’s insured credit derivatives portfolio by projecting a hypothetical change in the credit ratings as of December 31, 2014. A notch represents a one-step movement up or down in the credit rating.
| Change in Credit Ratings | ||||||||||||||||||||
| (International and Structured Finance Insurance) | ||||||||||||||||||||
| In millions |
Three Notch Increase |
One Notch Increase |
No Change | One Notch Decrease |
Three Notch Decrease |
|||||||||||||||
| Estimated pre-tax net gains (losses) |
$ | 45 | $ | 5 | $ | — | $ | (34) | $ | (57) | ||||||||||
| Estimated net fair value |
$ | (199) | $ | (239) | $ | (244) | $ | (278) | $ | (301) | ||||||||||
Recovery rates on defaulted collateral are an input into MBIA Corp.’s valuation model. Sensitivity to changes in the recovery rate assumptions used by MBIA Corp. can be estimated by projecting a hypothetical change in these assumptions. The following table presents the estimated pre-tax change in fair value and the cumulative estimated net fair value of MBIA Corp.’s insured credit derivatives portfolio based on a change in the recovery rate assumptions as of December 31, 2014.
| Change in Recovery Rates | ||||||||||||||||||||
| (International and Structured Finance Insurance) | ||||||||||||||||||||
| In millions |
20% Increase | 10% Increase | No Change | 10% Decrease | 20% Decrease | |||||||||||||||
| Estimated pre-tax net gains (losses) |
$ | 17 | $ | 9 | $ | — | $ | (6) | $ | (13) | ||||||||||
| Estimated net fair value |
$ | (227) | $ | (235) | $ | (244) | $ | (250) | $ | (257) | ||||||||||
Accounting principles for fair value measurements require MBIA Corp. to incorporate its own nonperformance risk in its valuation methodology. Sensitivity to changes in MBIA Corp.’s credit spreads can be estimated by projecting a hypothetical change in this assumption. The following table presents the estimated pre-tax change in fair value and the cumulative estimated net fair value of MBIA Corp.’s insured credit derivative portfolio. The actual upfront spread used in the valuation as of December 31, 2014 ranged from 3.68% to 18.98% based on the tenor of each transaction. The below amounts include an additional annual running credit spread of 5%.
| MBIA Corp.’s Upfront Credit Spread | ||||||||||||||||
| (International and Structured Finance Insurance) | ||||||||||||||||
| In millions |
Increase by 15 Percentage Points |
Increase by 7 Percentage Points |
No Change | Decrease to 0 Percentage Points |
||||||||||||
| Estimated pre-tax net gains (losses) |
$ | 46 | $ | 22 | $ | — | $ | (38) | ||||||||
| Estimated net fair value |
$ | (198) | $ | (222) | $ | (244) | $ | (282) | ||||||||
MBIA Corp.’s insurance of structured credit derivatives typically remain in place until the maturity of the derivative. With respect to MBIA Corp.’s insured structured credit derivatives, in the absence of credit impairments or the termination of derivatives at losses, the cumulative unrealized losses should reverse before or at maturity of the contracts. Additionally, in the event of the termination and settlement of a contract prior to maturity, any resulting gain or loss upon settlement will be recorded in our consolidated financial statements.
Warrants Sensitivity
Warrants issued by the Company to purchase shares of MBIA Inc. common stock are recorded at fair value in the Company’s balance sheet and changes in fair value are recorded through earnings. The Company values these warrants using the Black-Scholes model. Refer to “Note 7: Fair Value of Financial Instruments” in the Notes to Consolidated Financial Statements for further information about the valuation of warrants issued by the Company.
While several factors influence the value of the Company’s warrants, including stock price, stock volatility, interest rates and dividends, changes in the value of the Company’s warrants during 2014 were primarily driven by changes in the Company’s stock price. The following table presents the estimated pre-tax change in fair value and the estimated aggregate fair value of the Company’s warrants assuming hypothetical stock price changes as of December 31, 2014.
| Change in Stock Price | ||||||||||||||||||||
| In millions |
25% Increase | 10% Increase | No Change | 10% Decrease | 25% Decrease | |||||||||||||||
| Estimated pre-tax net gains (losses) |
$ | (21) | $ | (8) | $ | — | $ | 6 | $ | 15 | ||||||||||
| Estimated net fair value |
$ | (49) | $ | (36) | $ | (28) | $ | (22) | $ | (13) | ||||||||||
81
Table of Contents
Item 8. Financial Statements and Supplementary Data
MBIA INC. AND SUBSIDIARIES
INDEX TO CONSOLIDATED FINANCIAL STATEMENTS
See “Item 6. Selected Financial Data” for Supplementary Financial Information
82
Table of Contents
Report of Independent Registered Public Accounting Firm
To the Board of Directors and Shareholders of MBIA Inc.:
In our opinion, the accompanying consolidated balance sheets and the related consolidated statements of operations, of comprehensive income (loss), of changes in shareholders’ equity and of cash flows present fairly, in all material respects, the financial position of MBIA Inc. and its subsidiaries at December 31, 2014 and 2013, and the results of their operations and their cash flows for each of the three years in the period ended December 31, 2014 in conformity with accounting principles generally accepted in the United States of America. In addition, in our opinion, the financial statement schedules listed in the index appearing under Item 15(a)(2), present fairly, in all material respects, the information set forth therein when read in conjunction with the related consolidated financial statements. Also in our opinion, the Company maintained, in all material respects, effective internal control over financial reporting as of December 31, 2014, based on criteria established in Internal Control—Integrated Framework (2013) issued by the Committee of Sponsoring Organizations of the Treadway Commission (COSO). The Company’s management is responsible for these financial statements and financial statement schedules, for maintaining effective internal control over financial reporting and for its assessment of the effectiveness of internal control over financial reporting, included in Management’s Report on Internal Control over Financial Reporting appearing under Item 9A. Our responsibility is to express opinions on these financial statements, on the financial statement schedules, and on the Company’s internal control over financial reporting based on our integrated audits. We conducted our audits in accordance with the standards of the Public Company Accounting Oversight Board (United States). Those standards require that we plan and perform the audits to obtain reasonable assurance about whether the financial statements are free of material misstatement and whether effective internal control over financial reporting was maintained in all material respects. Our audits of the financial statements included examining, on a test basis, evidence supporting the amounts and disclosures in the financial statements, assessing the accounting principles used and significant estimates made by management, and evaluating the overall financial statement presentation. Our audit of internal control over financial reporting included obtaining an understanding of internal control over financial reporting, assessing the risk that a material weakness exists, and testing and evaluating the design and operating effectiveness of internal control based on the assessed risk. Our audits also included performing such other procedures as we considered necessary in the circumstances. We believe that our audits provide a reasonable basis for our opinions.
A company’s internal control over financial reporting is a process designed to provide reasonable assurance regarding the reliability of financial reporting and the preparation of financial statements for external purposes in accordance with generally accepted accounting principles. A company’s internal control over financial reporting includes those policies and procedures that (i) pertain to the maintenance of records that, in reasonable detail, accurately and fairly reflect the transactions and dispositions of the assets of the company; (ii) provide reasonable assurance that transactions are recorded as necessary to permit preparation of financial statements in accordance with generally accepted accounting principles, and that receipts and expenditures of the company are being made only in accordance with authorizations of management and directors of the company; and (iii) provide reasonable assurance regarding prevention or timely detection of unauthorized acquisition, use, or disposition of the company’s assets that could have a material effect on the financial statements.
Because of its inherent limitations, internal control over financial reporting may not prevent or detect misstatements. Also, projections of any evaluation of effectiveness to future periods are subject to the risk that controls may become inadequate because of changes in conditions, or that the degree of compliance with the policies or procedures may deteriorate.
/s/ PricewaterhouseCoopers LLP
New York, New York
March 2, 2015
83
Table of Contents
MBIA INC. AND SUBSIDIARIES
(In millions except share and per share amounts)
| December 31, 2014 |
December 31, 2013 |
|||||||
| Assets |
||||||||
| Investments: |
||||||||
| Fixed-maturity securities held as available-for-sale, at fair value (amortized cost $5,036 and $5,064) |
$ | 5,129 | $ | 4,987 | ||||
| Investments carried at fair value |
207 | 204 | ||||||
| Investments pledged as collateral, at fair value (amortized cost $441 and $483) |
408 | 424 | ||||||
| Short-term investments held as available-for-sale, at fair value (amortized cost $1,069 and $1,203) |
1,069 | 1,204 | ||||||
| Other investments (includes investments at fair value of $13 and $11) |
17 | 16 | ||||||
|
|
|
|
|
|||||
| Total investments |
6,830 | 6,835 | ||||||
| Cash and cash equivalents |
729 | 1,161 | ||||||
| Premiums receivable |
875 | 1,051 | ||||||
| Deferred acquisition costs |
217 | 260 | ||||||
| Insurance loss recoverable |
533 | 694 | ||||||
| Assets held for sale |
802 | 29 | ||||||
| Deferred income taxes, net |
1,028 | 1,109 | ||||||
| Other assets |
229 | 222 | ||||||
| Assets of consolidated variable interest entities: |
||||||||
| Cash |
53 | 97 | ||||||
| Investments held-to-maturity, at amortized cost (fair value $2,632 and $2,651) |
2,757 | 2,801 | ||||||
| Investments held as available-for-sale, at fair value (amortized cost $0 and $136) |
— | 136 | ||||||
| Fixed-maturity securities at fair value |
421 | 587 | ||||||
| Loans receivable at fair value |
1,431 | 1,612 | ||||||
| Loan repurchase commitments |
379 | 359 | ||||||
|
|
|
|
|
|||||
| Total assets |
$ | 16,284 | $ | 16,953 | ||||
|
|
|
|
|
|||||
| Liabilities and Equity |
||||||||
| Liabilities: |
||||||||
| Unearned premium revenue |
$ | 1,986 | $ | 2,441 | ||||
| Loss and loss adjustment expense reserves |
506 | 641 | ||||||
| Investment agreements |
547 | 700 | ||||||
| Medium-term notes (includes financial instruments carried at fair value of $197 and $203) |
1,201 | 1,427 | ||||||
| Long-term debt |
1,810 | 1,702 | ||||||
| Derivative liabilities |
437 | 1,152 | ||||||
| Liabilities held for sale |
772 | — | ||||||
| Other liabilities |
271 | 294 | ||||||
| Liabilities of consolidated variable interest entities: |
||||||||
| Variable interest entity notes (includes financial instruments carried at fair value of $2,047 and $2,356) |
4,804 | 5,286 | ||||||
| Derivative liabilities |
— | 11 | ||||||
|
|
|
|
|
|||||
| Total liabilities |
12,334 | 13,654 | ||||||
|
|
|
|
|
|||||
| Commitments and contingencies (See Note 21) |
||||||||
| Equity: |
||||||||
| Preferred stock, par value $1 per share; authorized shares—10,000,000; issued and outstanding—none |
— | — | ||||||
| Common stock, par value $1 per share; authorized shares—400,000,000; issued shares—281,352,782 and 277,812,430 |
281 | 278 | ||||||
| Additional paid-in capital |
3,128 | 3,115 | ||||||
| Retained earnings |
2,858 | 2,289 | ||||||
| Accumulated other comprehensive income (loss), net of tax of $7 and $54 |
21 | (86) | ||||||
| Treasury stock, at cost—89,409,887 and 85,562,546 shares |
(2,359) | (2,318) | ||||||
|
|
|
|
|
|||||
| Total shareholders’ equity of MBIA Inc. |
3,929 | 3,278 | ||||||
| Preferred stock of subsidiary and noncontrolling interest |
21 | 21 | ||||||
|
|
|
|
|
|||||
| Total equity |
3,950 | 3,299 | ||||||
|
|
|
|
|
|||||
| Total liabilities and equity |
$ | 16,284 | $ | 16,953 | ||||
|
|
|
|
|
|||||
The accompanying notes are an integral part of the consolidated financial statements.
84
Table of Contents
MBIA INC. AND SUBSIDIARIES
CONSOLIDATED STATEMENTS OF OPERATIONS
(In millions except share and per share amounts)
| Years Ended December 31, | ||||||||||||
| 2014 | 2013 | 2012 | ||||||||||
| Revenues: |
||||||||||||
| Premiums earned: |
||||||||||||
| Scheduled premiums earned |
$ | 258 | $ | 304 | $ | 372 | ||||||
| Refunding premiums earned |
139 | 153 | 233 | |||||||||
|
|
|
|
|
|
|
|||||||
| Premiums earned (net of ceded premiums of $12, $10 and $14) |
397 | 457 | 605 | |||||||||
| Net investment income |
179 | 166 | 214 | |||||||||
| Fees and reimbursements |
40 | 21 | 61 | |||||||||
| Change in fair value of insured derivatives: |
||||||||||||
| Realized gains (losses) and other settlements on insured derivatives |
(444) | (1,545) | (406) | |||||||||
| Unrealized gains (losses) on insured derivatives |
903 | 1,777 | 1,870 | |||||||||
|
|
|
|
|
|
|
|||||||
| Net change in fair value of insured derivatives |
459 | 232 | 1,464 | |||||||||
| Net gains (losses) on financial instruments at fair value and foreign exchange |
78 | 69 | 55 | |||||||||
| Investment losses related to other-than-temporary impairments: |
||||||||||||
| Investment losses related to other-than-temporary impairments |
(99) | — | (58) | |||||||||
| Other-than-temporary impairments recognized in accumulated other comprehensive income (loss) |
84 | — | (47) | |||||||||
|
|
|
|
|
|
|
|||||||
| Net investment losses related to other-than-temporary impairments |
(15) | — | (105) | |||||||||
| Net gains (losses) on extinguishment of debt |
3 | 60 | — | |||||||||
| Other net realized gains (losses) |
28 | (29) | 7 | |||||||||
| Revenues of consolidated variable interest entities: |
||||||||||||
| Net investment income |
50 | 56 | 67 | |||||||||
| Net gains (losses) on financial instruments at fair value and foreign exchange |
50 | 175 | 18 | |||||||||
| Net gains (losses) on extinguishment of debt |
4 | 1 | 49 | |||||||||
| Other net realized gains (losses) |
(3) | 1 | — | |||||||||
|
|
|
|
|
|
|
|||||||
| Total revenues |
1,270 | 1,209 | 2,435 | |||||||||
| Expenses: |
||||||||||||
| Losses and loss adjustment |
133 | 117 | 50 | |||||||||
| Amortization of deferred acquisition costs |
44 | 46 | 50 | |||||||||
| Operating |
195 | 338 | 381 | |||||||||
| Interest |
210 | 236 | 284 | |||||||||
| Expenses of consolidated variable interest entities: |
||||||||||||
| Operating |
8 | 11 | 17 | |||||||||
| Interest |
39 | 45 | 55 | |||||||||
|
|
|
|
|
|
|
|||||||
| Total expenses |
629 | 793 | 837 | |||||||||
|
|
|
|
|
|
|
|||||||
| Income (loss) before income taxes |
641 | 416 | 1,598 | |||||||||
| Provision (benefit) for income taxes |
72 | 166 | 364 | |||||||||
|
|
|
|
|
|
|
|||||||
| Net income (loss) |
$ | 569 | $ | 250 | $ | 1,234 | ||||||
|
|
|
|
|
|
|
|||||||
| Net income (loss) per common share: |
||||||||||||
| Basic |
$ | 2.94 | $ | 1.30 | $ | 6.36 | ||||||
| Diluted |
$ | 2.76 | $ | 1.29 | $ | 6.33 | ||||||
| Weighted average number of common shares outstanding: |
||||||||||||
| Basic |
188,171,503 | 189,071,011 | 188,834,626 | |||||||||
| Diluted |
190,898,627 | 190,312,913 | 189,897,021 | |||||||||
The accompanying notes are an integral part of the consolidated financial statements.
85
Table of Contents
MBIA INC. AND SUBSIDIARIES
CONSOLIDATED STATEMENTS OF COMPREHENSIVE INCOME (LOSS)
(In millions)
| Years Ended December 31, | ||||||||||||
| 2014 | 2013 | 2012 | ||||||||||
| Net income (loss) |
$ | 569 | $ | 250 | $ | 1,234 | ||||||
| Other comprehensive income (loss): |
||||||||||||
| Unrealized gains (losses) on available-for-sale securities: |
||||||||||||
| Unrealized gains (losses) arising during the period |
254 | (213) | 176 | |||||||||
| Provision (benefit) for income taxes |
83 | (76) | 72 | |||||||||
|
|
|
|
|
|
|
|||||||
| Total |
171 | (137) | 104 | |||||||||
| Reclassification adjustments for (gains) losses included in net income (loss) |
15 | (13) | 39 | |||||||||
| Provision (benefit) for income taxes |
6 | (5) | 14 | |||||||||
|
|
|
|
|
|
|
|||||||
| Total |
9 | (8) | 25 | |||||||||
| Available-for-sale securities with other-than-temporary impairments: |
||||||||||||
| Other-than-temporary impairments and unrealized gains (losses) arising during the period |
(85) | 15 | 50 | |||||||||
| Provision (benefit) for income taxes |
(31) | 6 | 18 | |||||||||
|
|
|
|
|
|
|
|||||||
| Total |
(54) | 9 | 32 | |||||||||
| Reclassification adjustments for (gains) losses included in net income (loss) |
6 | (5) | 69 | |||||||||
| Provision (benefit) for income taxes |
2 | (2) | 24 | |||||||||
|
|
|
|
|
|
|
|||||||
| Total |
4 | (3) | 45 | |||||||||
| Foreign currency translation: |
||||||||||||
| Foreign currency translation gains (losses) |
(40) | 3 | 24 | |||||||||
| Provision (benefit) for income taxes |
(13) | 1 | (2) | |||||||||
|
|
|
|
|
|
|
|||||||
| Total |
(27) | 2 | 26 | |||||||||
| Reclassification adjustments for (gains) losses included in net income (loss) |
4 | (5) | — | |||||||||
|
|
|
|
|
|
|
|||||||
| Total other comprehensive income (loss) |
107 | (142) | 232 | |||||||||
|
|
|
|
|
|
|
|||||||
| Comprehensive income (loss) |
$ | 676 | $ | 108 | $ | 1,466 | ||||||
|
|
|
|
|
|
|
|||||||
The accompanying notes are an integral part of the consolidated financial statements.
86
Table of Contents
MBIA INC. AND SUBSIDIARIES
CONSOLIDATED STATEMENTS OF CHANGES IN SHAREHOLDERS’ EQUITY
For The Years Ended December 31, 2014, 2013 and 2012
(In millions except share amounts)
| Common Stock | Additional Paid-in Capital |
Retained Earnings |
Accumulated Other Comprehensive Income (Loss) |
Treasury Stock | Total Shareholders’ Equity of MBIA Inc. |
Preferred Stock of Subsidiary and Noncontrolling Interest |
Total Equity |
|||||||||||||||||||||||||||||||||||||
| Shares | Amount | Shares | Amount | Shares | Amount | |||||||||||||||||||||||||||||||||||||||
| Balance, January 1, 2012 |
274,896,162 | $ | 275 | $ | 3,072 | $ | 805 | $ | (176) | (81,752,966) | $ | (2,276) | $ | 1,700 | 1,315 | $ | 23 | $ | 1,723 | |||||||||||||||||||||||||
|
|
|
|
|
|
|
|
|
|
|
|
|
|
|
|
|
|
|
|
|
|
|
|||||||||||||||||||||||
| Net income (loss) |
— | — | — | 1,234 | — | — | — | 1,234 | — | — | 1,234 | |||||||||||||||||||||||||||||||||
| Other comprehensive income (loss) |
— | — | — | — | 232 | — | — | 232 | — | — | 232 | |||||||||||||||||||||||||||||||||
| Share-based compensation, net of tax of $7 |
2,508,877 | 2 | 4 | — | — | 19,436 | 1 | 7 | — | — | 7 | |||||||||||||||||||||||||||||||||
| Change in noncontrolling interest in subsidiary |
— | — | — | — | — | — | — | — | — | (2) | (2) | |||||||||||||||||||||||||||||||||
|
|
|
|
|
|
|
|
|
|
|
|
|
|
|
|
|
|
|
|
|
|
|
|||||||||||||||||||||||
| Balance, December 31, 2012 |
277,405,039 | $ | 277 | $ | 3,076 | $ | 2,039 | $ | 56 | (81,733,530) | $ | (2,275) | $ | 3,173 | 1,315 | $ | 21 | $ | 3,194 | |||||||||||||||||||||||||
|
|
|
|
|
|
|
|
|
|
|
|
|
|
|
|
|
|
|
|
|
|
|
|||||||||||||||||||||||
| Net income (loss) |
— | — | — | 250 | — | — | — | 250 | — | — | 250 | |||||||||||||||||||||||||||||||||
| Other comprehensive income (loss) |
— | — | — | — | (142) | — | — | (142) | — | — | (142) | |||||||||||||||||||||||||||||||||
| Share-based compensation, net of tax of $4 |
407,391 | 1 | 39 | — | — | (3,292,641) | (36) | 4 | — | — | 4 | |||||||||||||||||||||||||||||||||
| Treasury shares received for warrant issuance |
— | — | — | — | — | (536,375) | (7) | (7) | — | — | (7) | |||||||||||||||||||||||||||||||||
|
|
|
|
|
|
|
|
|
|
|
|
|
|
|
|
|
|
|
|
|
|
|
|||||||||||||||||||||||
| Balance, December 31, 2013 |
277,812,430 | $ | 278 | $ | 3,115 | $ | 2,289 | $ | (86) | (85,562,546) | $ | (2,318) | $ | 3,278 | 1,315 | $ | 21 | $ | 3,299 | |||||||||||||||||||||||||
|
|
|
|
|
|
|
|
|
|
|
|
|
|
|
|
|
|
|
|
|
|
|
|||||||||||||||||||||||
| Net income (loss) |
— | — | — | 569 | — | — | — | 569 | — | — | 569 | |||||||||||||||||||||||||||||||||
| Other comprehensive income (loss) |
— | — | — | — | 107 | — | — | 107 | — | — | 107 | |||||||||||||||||||||||||||||||||
| Share-based compensation, net of tax of $2 |
3,540,352 | 3 | 13 | — | — | (513,267) | (6) | 10 | — | — | 10 | |||||||||||||||||||||||||||||||||
| Treasury shares acquired under share repurchase program |
|
— |
|
|
— |
|
|
— |
|
|
— |
|
|
— |
|
|
(3,334,074) |
|
|
(35) |
|
|
(35) |
|
|
— |
|
|
— |
|
|
(35) |
| |||||||||||
|
|
|
|
|
|
|
|
|
|
|
|
|
|
|
|
|
|
|
|
|
|
|
|||||||||||||||||||||||
| Balance, December 31, 2014 |
281,352,782 | $ | 281 | $ | 3,128 | $ | 2,858 | $ | 21 | (89,409,887) | $ | (2,359) | $ | 3,929 | 1,315 | $ | 21 | $ | 3,950 | |||||||||||||||||||||||||
|
|
|
|
|
|
|
|
|
|
|
|
|
|
|
|
|
|
|
|
|
|
|
|||||||||||||||||||||||
The accompanying notes are an integral part of the consolidated financial statements.
87
Table of Contents
MBIA INC. AND SUBSIDIARIES
CONSOLIDATED STATEMENTS OF CASH FLOWS
(In millions)
| Years Ended December 31, | ||||||||||||
| 2014 | 2013 | 2012 | ||||||||||
| Cash flows from operating activities: |
||||||||||||
| Premiums, fees and reimbursements received |
$ | 193 | $ | 185 | $ | 281 | ||||||
| Investment income received |
419 | 426 | 594 | |||||||||
| Errors and omissions insurance recoveries received |
30 | — | — | |||||||||
| Insured derivative commutations and losses paid |
(432) | (458) | (464) | |||||||||
| Financial guarantee losses and loss adjustment expenses paid |
(240) | (443) | (895) | |||||||||
| Proceeds from recoveries and reinsurance |
131 | 2,621 | 263 | |||||||||
| Operating and employee related expenses paid |
(238) | (277) | (400) | |||||||||
| Interest paid, net of interest converted to principal |
(179) | (224) | (400) | |||||||||
| Income taxes (paid) received |
(17) | (1) | (6) | |||||||||
|
|
|
|
|
|
|
|||||||
| Net cash provided (used) by operating activities |
(333) | 1,829 | (1,027) | |||||||||
|
|
|
|
|
|
|
|||||||
| Cash flows from investing activities: |
||||||||||||
| Purchases of available-for-sale investments |
(1,494) | (2,397) | (3,086) | |||||||||
| Sales of available-for-sale investments |
757 | 1,726 | 4,658 | |||||||||
| Paydowns and maturities of available-for-sale investments |
484 | 452 | 609 | |||||||||
| Purchases of investments at fair value |
(631) | (371) | (346) | |||||||||
| Sales, paydowns and maturities of investments at fair value |
789 | 595 | 960 | |||||||||
| Sales, paydowns and maturities (purchases) of short-term investments, net |
515 | (358) | 739 | |||||||||
| Sales, paydowns and maturities of held-to-maturity investments |
44 | 28 | 1,014 | |||||||||
| Sales, paydowns and maturities of other investments |
1 | — | — | |||||||||
| Purchases of loans receivable |
(310) | — | — | |||||||||
| Paydowns and maturities of loans receivable |
313 | 280 | 278 | |||||||||
| Consolidation of variable interest entities including cash acquired |
221 | — | — | |||||||||
| Deconsolidation of variable interest entities |
18 | (26) | (51) | |||||||||
| (Payments) proceeds for derivative settlements |
(26) | (54) | (288) | |||||||||
| Collateral (to) from swap counterparty |
144 | 122 | (285) | |||||||||
| Capital expenditures |
(13) | (3) | (7) | |||||||||
|
|
|
|
|
|
|
|||||||
| Net cash provided (used) by investing activities |
812 | (6) | 4,195 | |||||||||
|
|
|
|
|
|
|
|||||||
| Cash flows from financing activities: |
||||||||||||
| Proceeds from investment agreements |
30 | 31 | 36 | |||||||||
| Principal paydowns of investment agreements |
(192) | (285) | (688) | |||||||||
| Principal paydowns of medium-term notes |
(168) | (197) | (102) | |||||||||
| Principal paydowns of variable interest entity notes |
(609) | (1,112) | (1,229) | |||||||||
| Proceeds from issuance of variable interest entity notes |
79 | — | — | |||||||||
| Payments for securities sold under agreements to repurchase |
— | — | (287) | |||||||||
| Payments for retirement of debt |
— | (3) | (540) | |||||||||
| Purchases of treasury stock |
(32) | — | — | |||||||||
| Change in noncontrolling interest and (purchase)/redemption of subsidiary preferred stock |
— | — | (2) | |||||||||
| Restricted stock awards settlements |
— | — | 1 | |||||||||
|
|
|
|
|
|
|
|||||||
| Net cash provided (used) by financing activities |
(892) | (1,566) | (2,811) | |||||||||
|
|
|
|
|
|
|
|||||||
| Effect of exchange rate changes on cash and cash equivalents |
(8) | 11 | — | |||||||||
| Net increase (decrease) in cash and cash equivalents |
(421) | 268 | 357 | |||||||||
| Cash and cash equivalents—beginning of year |
1,258 | 990 | 633 | |||||||||
| Reclassification to assets held for sale |
(55) | — | — | |||||||||
|
|
|
|
|
|
|
|||||||
| Cash and cash equivalents—end of year |
$ | 782 | $ | 1,258 | $ | 990 | ||||||
|
|
|
|
|
|
|
|||||||
| Reconciliation of net income (loss) to net cash provided (used) by operating activities: |
||||||||||||
| Net income (loss) |
$ | 569 | $ | 250 | $ | 1,234 | ||||||
| Adjustments to reconcile net income (loss) to net cash provided (used) by operating activities: |
||||||||||||
| Change in: |
||||||||||||
| Premiums receivable |
138 | 176 | 152 | |||||||||
| Deferred acquisition costs |
43 | 43 | 49 | |||||||||
| Unearned premium revenue |
(412) | (506) | (600) | |||||||||
| Loss and loss adjustment expense reserves |
(133) | (216) | 17 | |||||||||
| Insurance loss recoverable |
162 | 3,637 | (602) | |||||||||
| Accrued interest payable |
106 | 106 | (3) | |||||||||
| Accrued expenses |
(36) | 43 | (23) | |||||||||
| Net investment losses related to other-than-temporary impairments |
15 | — | 105 | |||||||||
| Realized (gains) losses and other settlements on insured derivatives |
30 | — | — | |||||||||
| Unrealized (gains) losses on insured derivatives |
(903) | (1,777) | (1,870) | |||||||||
| Net (gains) losses on financial instruments at fair value and foreign exchange |
(128) | (244) | (73) | |||||||||
| Other net realized (gains) losses |
(25) | 28 | (7) | |||||||||
| Deferred income tax provision (benefit) |
50 | 157 | 365 | |||||||||
| (Gains) losses on extinguishment of debt |
— | (61) | (49) | |||||||||
| Interest on variable interest entities, net |
77 | 90 | 140 | |||||||||
| Other operating |
114 | 103 | 138 | |||||||||
|
|
|
|
|
|
|
|||||||
| Total adjustments to net income (loss) |
(902) | 1,579 | (2,261) | |||||||||
|
|
|
|
|
|
|
|||||||
| Net cash provided (used) by operating activities |
$ | (333) | $ | 1,829 | $ | (1,027) | ||||||
|
|
|
|
|
|
|
|||||||
The accompanying notes are an integral part of the consolidated financial statements.
88
Table of Contents
MBIA Inc. and Subsidiaries
Notes to Consolidated Financial Statements
Note 1: Business Developments and Risks and Uncertainties
Summary
MBIA Inc., together with its consolidated subsidiaries, (collectively, “MBIA” or the “Company”) operates one of the largest financial guarantee insurance businesses in the industry and was a provider of asset management and advisory services. MBIA manages five operating segments: 1) United States (“U.S.”) public finance insurance; 2) international and structured finance insurance; 3) corporate; 4) advisory services; and 5) conduit. The Company’s U.S. public finance insurance business is primarily operated through National Public Finance Guarantee Corporation and its subsidiaries (“National”), its international and structured finance insurance business is primarily operated through MBIA Insurance Corporation and its subsidiaries (“MBIA Corp.”), and its asset management and advisory services business was operated through Cutwater Holdings, LLC and its subsidiaries (“Cutwater”). Unless otherwise indicated or the context otherwise requires, references to “MBIA Corp.” are to MBIA Insurance Corporation, together with its subsidiaries, MBIA UK Insurance Limited (“MBIA UK”) and MBIA Mexico S.A. de C.V. MBIA Inc. and certain of its subsidiaries also manage certain other business activities, the results of which are reported in the corporate and conduit segments.
During the second quarter of 2014, the Company dissolved its conduit segment. During the fourth quarter of 2014, the Company changed the name of its structured finance and international insurance operating segment to international and structured finance insurance. Also during the fourth quarter of 2014, the Company entered into an agreement to sell Cutwater to a subsidiary of The Bank of New York Mellon Corporation. This transaction, which was effective January 1, 2015, had a positive but immaterial impact on the Company’s financial position and results of operations. Effective in the fourth quarter of 2014, the Company’s previously reported asset/liability products segment and its corporate segment are managed and reported as one operating segment referred to as the corporate segment. Refer to “Note 12: Business Segments” for further information about the Company’s operating segments.
Business Developments
National Ratings and New Business Opportunities
National’s ability to write new business and compete with other financial guarantors is largely dependent on the financial strength ratings assigned to National by major rating agencies. As of December 31, 2014, National was rated AA+ with a stable outlook by Kroll Bond Rating Agency, AA- with a stable outlook by Standard & Poor’s Financial Services LLC (“S&P”), and A3 with a negative outlook by Moody’s Investors Service, Inc. (“Moody’s”).
National seeks to generate shareholder value through appropriate risk adjusted pricing; however, current market conditions and the competitive landscape may limit National’s new business opportunities and its abilities to price and underwrite risk with attractive returns. Refer to “Risks and Uncertainties” below for a discussion of business risks related to National’s insured portfolio.
MBIA Corp. Risk Reductions
During 2014, the Company continued to focus on the collection of excess spread and put-back recoveries and the mitigation of MBIA Corp.’s high risk insurance exposures, primarily through commutations of insurance policies. During 2014, MBIA Corp. commuted $7.1 billion of gross par exposure, primarily comprising structured commercial mortgage-backed securities (“CMBS”) pools, investment grade corporate collateralized debt obligations (“CDOs”), small business securitizations, commercial real estate (“CRE”) CDOs and asset-backed securities (“ABS”) CDOs. During 2013, MBIA Corp. commuted $20.0 billion of gross par exposure, including $7.4 billion and $4.2 billion commuted with Bank of America and Societe Generale, respectively, primarily comprising structured CMBS pools, investment grade CDOs, ABS CDOs, first-lien residential mortgage-backed securities (“RMBS”), high yield corporate CDOs, CRE CDOs and structured insurance securities. During 2012, MBIA Corp. commuted $13.4 billion of gross par exposure, primarily comprising structured CMBS pools, CRE CDOs, investment grade CDOs, ABS CDOs, and subprime RMBS transactions. MBIA Corp. may make negotiated settlement payments to counterparties and/or forego its right to all or some termination premiums when it commutes insurance exposures. The difference between the fair values of the Company’s derivative liabilities for the commuted policies and the aggregate cost of the commutation is reflected in earnings.
89
Table of Contents
MBIA Inc. and Subsidiaries
Notes to Consolidated Financial Statements
Note 1: Business Developments and Risks and Uncertainties (continued)
Held For Sale Classifications
Armonk, New York Facility
In the fourth quarter of 2013, the Company approved and initiated a plan to sell its Armonk, New York facility and, since then, has actively marketed the facility for sale. As a result, the facility was classified as held for sale as of December 31, 2014 and 2013 and presented within “Assets held for sale” on the Company’s consolidated balance sheets and measured at the lower of its carrying value or fair value less cost to sell. The Company no longer recognizes depreciation expense on the facility while classified as held for sale. During 2014 and 2013, the Company recorded impairment charges of $3 million and $29 million, respectively, on the Armonk, New York facility to adjust the carrying amount to its estimated fair market value less costs to sell. The fair market value was estimated based on an independent third-party appraisal. The impairment charges were reflected in the results of the Company’s U.S. public finance insurance segment and included in “Other net realized gains (losses)” on the Company’s consolidated statements of operations. Also, during 2014, the Company moved its headquarters from its Armonk, New York facility to a leased facility in Purchase, New York.
Sale of Cutwater Business
As a result of the agreement to sell Cutwater, the assets and liabilities of Cutwater were classified as held for sale as of December 31, 2014 and presented within “Assets held for sale” and “Liabilities held for sale” on the Company’s consolidated balance sheet and measured at the lower of its carrying value or fair value less cost to sell.
Assets and Liabilities Held for Sale by Major Category
The following table summarizes the components of assets and liabilities held for sale as of December 31, 2014 and 2013:
| As of December 31, | ||||||||
| In millions |
2014 | 2013 | ||||||
| Assets |
||||||||
| Investments carried at fair value |
$ | 6 | $ | — | ||||
| Cash and cash equivalents |
15 | — | ||||||
| Facility |
26 | 29 | ||||||
| Other assets |
4 | — | ||||||
| Assets of consolidated variable interest entities: |
||||||||
| Cash |
40 | — | ||||||
| Loans receivable at fair value |
711 | — | ||||||
|
|
|
|
|
|||||
| Total assets held for sale |
$ | 802 | $ | 29 | ||||
|
|
|
|
|
|||||
| Liabilities |
||||||||
| Other liabilities |
$ | 18 | $ | — | ||||
| Liabilities of consolidated variable interest entities: |
||||||||
| Variable interest entity notes |
431 | — | ||||||
| Payable for loans purchased |
323 | — | ||||||
|
|
|
|
|
|||||
| Total liabilities held for sale |
$ | 772 | $ | — | ||||
|
|
|
|
|
|||||
Risks and Uncertainties
The Company’s financial statements include estimates and assumptions that affect the reported amounts of assets, liabilities, revenues and expenses. The outcome of certain significant risks and uncertainties could cause the Company to revise its estimates and assumptions or could cause actual results to differ from the Company’s estimates.
90
Table of Contents
MBIA Inc. and Subsidiaries
Notes to Consolidated Financial Statements
Note 1: Business Developments and Risks and Uncertainties (continued)
While the Company believes it continues to have sufficient capital and liquidity to meet all of its expected obligations, if one or more possible adverse outcomes were to be realized, its financial position, results of operations and cash flows, and its insurance companies’ statutory capital, could be materially and adversely affected. The discussion below highlights the significant risks and uncertainties that could have a material effect on the Company’s financial statements and business objectives in future periods.
U.S. Public Finance Market Conditions
National’s insured portfolio continued to perform satisfactorily against a backdrop of strengthening domestic economic activity. While this trend will generally benefit tax revenues and fees charged for essential municipal services which secure National’s insured bond portfolio, some state and local governments and territory obligors National insures remain under financial and budgetary stress. In addition, a few of these local governments have filed for protection under Chapter 9 of the United States Bankruptcy Code or have entered into state statutory proceedings established to assist municipalities in managing through periods of severe fiscal stress. This could lead to an increase in defaults by such entities on the payment of their obligations and losses or impairments on a greater number of the Company’s insured transactions. The Company monitors and analyzes these situations and other stressed credits closely, and the overall extent and duration of this stress is uncertain.
MBIA Corp. Recoveries and Insured Portfolio
The amount and timing of projected collections from excess spread from second-lien RMBS and the put-back recoverable from Credit Suisse Securities (USA) LLC, DLJ Mortgage Capital, Inc., and Select Portfolio Servicing Inc. (collectively, “Credit Suisse”) and the potential of claims from MBIA Corp.’s remaining insured exposures are uncertain. Further, the remaining insured portfolio, aside from these exposures, could deteriorate and result in additional significant loss reserves and claim payments. Management’s expected liquidity and capital forecasts for MBIA Corp., which include expected put-back recoveries from Credit Suisse and excess spread recoveries, reflect adequate resources to pay claims when due. However, if MBIA Corp. experiences higher than expected claim payments or is unable to terminate the remaining exposures that represent substantial risk to the Company, MBIA Corp. may ultimately have insufficient resources to continue to pay claims, which could cause the New York State Department of Financial Services (“NYSDFS”) to put MBIA Insurance Corporation, exclusive of MBIA UK, into a rehabilitation or liquidation proceeding. The Company does not believe that a rehabilitation or liquidation proceeding of MBIA Insurance Corporation by NYSDFS would have any significant long-term liquidity impact on MBIA Inc. or result in a liquidation or similar proceeding of MBIA UK. Such a proceeding could have material adverse consequences for MBIA Corp., including the termination of insured credit default swaps (“CDS”) contracts for which counterparties may assert market-based claims, the acceleration of debt obligations issued by affiliates and insured by MBIA Corp., the loss of control of MBIA Insurance Corporation to a rehabilitator or liquidator, and unplanned costs.
Refer to “Note 6: Loss and Loss Adjustment Expense Reserves” for information about MBIA Corp.’s loss reserves and recoveries.
Corporate Liquidity
As of December 31, 2014 and 2013, the liquidity position, which comprise cash and liquid assets available for general liquidity purposes, of the Company’s corporate segment was $498 million and $359 million, respectively. During 2014, $220 million was released to MBIA Inc. under the MBIA group’s tax sharing agreement (the “Tax Escrow Account”) and National declared and paid a dividend of $220 million to its ultimate parent, MBIA Inc. Subsequent to December 31, 2014, an additional $228 million was released to MBIA Inc. from the Tax Escrow Account. While MBIA Inc.’s liquidity position improved during 2014 due to the Tax Escrow Account release and dividends received, MBIA Inc. continues to have liquidity risk. If invested asset performance deteriorates or the flow of dividends from subsidiaries is interrupted and/or access to the capital markets is impaired, its liquidity position could be eroded over time.
91
Table of Contents
MBIA Inc. and Subsidiaries
Notes to Consolidated Financial Statements
Note 1: Business Developments and Risks and Uncertainties (continued)
While the Company expects that MBIA Inc. will generate sufficient cash to satisfy its debt obligations and its general corporate needs over time from distributions from its operating subsidiaries and payments under the Tax Escrow Account once the payments become unrestricted, there can be no assurance that such sources will generate sufficient cash. In addition, a failure by MBIA Inc. to settle liabilities that are also insured by MBIA Corp. could result in claims on MBIA Corp.
Note 2: Significant Accounting Policies
Basis of Presentation
The consolidated financial statements have been prepared in accordance with accounting principles generally accepted in the United States of America (“GAAP”). The preparation of financial statements in conformity with GAAP requires management to make estimates and assumptions that affect the reported amounts of assets and liabilities and disclosures of contingent assets and liabilities at the date of the financial statements, and the reported amounts of revenues and expenses during the reporting period. Actual results could differ from those estimates. As additional information becomes available or actual amounts become determinable, the recorded estimates are revised and reflected in operating results.
Certain amounts have been reclassified in prior years’ financial statements to conform to the current presentation. These reclassifications had no impact on total revenues, expenses, assets, liabilities, or shareholders’ equity for all periods presented.
Consolidation
The consolidated financial statements include the accounts of MBIA Inc., its wholly-owned subsidiaries and all other entities in which the Company has a controlling financial interest. All intercompany balances and transactions have been eliminated. The Company determines whether it has a controlling financial interest in an entity by first evaluating whether an entity is a voting interest entity or a variable interest entity (“VIE”).
Voting interest entities are entities in which (i) the total equity investment at risk is sufficient to enable an entity to finance its activities independently and (ii) the equity holders have the obligation to absorb losses, the right to receive residual returns and the right to make decisions about the entity’s activities. Voting interest entities are consolidated when the Company has a majority voting interest.
VIEs are entities that lack one or more of the characteristics of a voting interest entity. The consolidation of a VIE is required if an entity has a variable interest (such as an equity or debt investment, a beneficial interest, a guarantee, a written put option or a similar obligation) and that variable interest or interests give it a controlling financial interest in the VIE. A controlling financial interest is present when an enterprise has both (a) the power to direct the activities of a VIE that most significantly impact the entity’s economic performance and (b) the obligation to absorb losses or the right to receive benefits of the VIE that could potentially be significant to the VIE. The enterprise with the controlling financial interest, known as the primary beneficiary, is required to consolidate the VIE. The Company consolidates all VIEs in which it is the primary beneficiary. Refer to “Note 4: Variable Interest Entities” for additional information. The Company elected to apply the fair value option to all financial assets and financial liabilities of certain consolidated VIEs on a VIE-by-VIE basis.
Investments
The Company classifies its investments as available-for-sale (“AFS”), held-to-maturity (“HTM”), or trading. AFS investments are reported in the consolidated balance sheets at fair value with unrealized gains and losses, net of applicable deferred income taxes, reflected in accumulated other comprehensive income (loss) (“AOCI”) in shareholders’ equity. Investments carried at fair value are reported in the consolidated balance sheet at fair value and changes in fair value and realized gains and losses from the sale of these securities are reflected in earnings as part of “Net gains (losses) on financial instruments at fair value and foreign exchange.” Investments carried at fair value are classified as trading and consist of debt securities held in portfolios that are actively managed and are subject to frequent buying and selling.
92
Table of Contents
MBIA Inc. and Subsidiaries
Notes to Consolidated Financial Statements
Note 2: Significant Accounting Policies (continued)
Short-term investments held as AFS include all fixed-maturity securities with a remaining effective term to maturity of less than one year, commercial paper and money market securities. HTM investments are reported in the consolidated balance sheets at amortized cost. Debt securities are classified as HTM investments when the Company has the ability and intent to hold such investments to maturity. Investment income is recorded as earned. Bond discounts and premiums are amortized using the effective yield method over the remaining term of the securities and reported in “Net investment income.” For mortgage-backed securities (“MBS”) and ABS, discounts and premiums are amortized using the retrospective method. Realized gains and losses represent the difference between the amortized cost value and the sale proceeds.
Other-Than-Temporary Impairments on Investment Securities
The Company’s consolidated statements of operations reflect the full impairment (the difference between a security’s amortized cost basis and fair value) on debt securities that the Company intends to sell or would more likely than not be required to sell before the expected recovery of the amortized cost basis. For AFS and HTM debt securities that management has no intent to sell and believes that it is more likely than not such securities will not be required to be sold prior to recovery, only the credit loss component of the impairment is recognized in earnings. For AFS securities, the remaining fair value loss is recognized in AOCI, net of applicable deferred income taxes.
The Company’s AFS and HTM securities for which the fair value is less than amortized cost are reviewed no less than quarterly in order to determine whether a credit loss exists. This evaluation includes both qualitative and quantitative considerations. In assessing whether a decline in value is related to a credit loss, the Company considers several factors, including but not limited to (a) the magnitude and duration of the decline, (b) credit indicators and the reasons for the decline, such as general interest rate or credit spread movements, credit rating downgrades, issuer-specific changes in credit spreads, and the financial condition of the issuer, and (c) any guarantees associated with a security such as those provided by financial guarantee insurance companies. Credit loss expectations for ABS and CDOs are assessed using discounted cash flow modeling, and the recoverability of amortized cost for corporate obligations is generally assessed using issuer-specific credit analyses.
Cash, Cash Equivalents and Collateral
Cash and cash equivalents include cash on hand, demand deposits, and deposits with banks with original maturities of less than 90 days.
Acquisition Costs
The Company capitalizes and defers acquisition costs that are directly related to the successful acquisition of new or renewal insurance business. Acquisition costs are costs to acquire an insurance contract which result directly from and is essential to the insurance contracts transaction and would not have been incurred by the Company had the contract transaction not occurred. Acquisition costs include compensation of employees involved in underwriting, certain rating agency fees, state premium taxes and certain other underwriting expenses, reduced by ceding commission income on premiums ceded to reinsurers. Acquisition costs also include ceding commissions paid by the Company in connection with assuming business from other financial guarantors. Acquisition costs, net of ceding commissions received, related to non-derivative insured financial guarantee transactions are deferred and amortized over the period in which the related premiums are earned. Acquisition costs related to insured derivative transactions are expensed as incurred.
Property and Equipment
Property and equipment consists of land, buildings, leasehold improvements, furniture, fixtures and equipment and software owned by the Company. All property and equipment held for use is recorded at cost and, except for land, is depreciated over the appropriate useful life of the asset using the straight-line method.
93
Table of Contents
MBIA Inc. and Subsidiaries
Notes to Consolidated Financial Statements
Note 2: Significant Accounting Policies (continued)
Leasehold improvements are amortized over the useful life of the improvement or the remaining term of the lease, whichever is shorter. The cost and related accumulated depreciation applicable to assets sold or retired are removed from the Company’s balance sheet and any gain or loss on disposition is recognized in earnings as a component of “Other net realized gains (losses).” Maintenance and repairs are charged to current earnings as incurred.
Property, leasehold improvements and equipment are tested for potential impairment whenever events or changes in circumstances suggest that an asset’s or asset group’s carrying value may not be fully recoverable. An impairment loss, calculated as the difference between the estimated fair value and the carrying value of an asset or asset group, is recognized if the sum of the expected undiscounted cash flows relating to the asset or asset group is less than the corresponding carrying value.
The Company’s estimated remaining weighted average useful lives of each class of assets held for use as of December 31, 2014 are as follows:
| Leasehold improvements |
15 years | |||
| Furniture and fixtures |
6 years | |||
| Equipment and software |
4 years |
Derivatives
MBIA has entered into derivative transactions as an alternative form of financial guarantee and for purposes of managing risks associated with existing assets and liabilities. All derivative instruments are reported at fair value on the consolidated balance sheets as either assets or liabilities depending on the rights or obligations under the contract, and changes in fair value are reported in the consolidated statements of operations as “Net gains (losses) on financial instruments at fair value and foreign exchange” or “Unrealized gains (losses) on insured derivatives” depending on the nature of the derivative.
The Company elected to record at fair value certain financial instruments that contained an embedded derivative that required bifurcation from the host contract and to be accounted for separately as a derivative instrument. These hybrid financial instruments included certain medium-term notes (“MTNs”) and certain AFS securities. The Company elected to fair value these hybrid financial instruments given the complexity of bifurcating the embedded derivatives.
Refer to “Note 9: Derivative Instruments” for a further discussion of the Company’s use of derivatives and their impact on the Company’s consolidated financial statements and “Note 7: Fair Value of Financial Instruments” for derivative valuation techniques and fair value disclosures.
Offsetting of Fair Value Amounts Related to Derivative Instruments
The Company presents the fair value amounts recognized for eligible derivative contracts executed with the same counterparty on a net basis in the consolidated balance sheets. Accrued receivables and accrued payables which meet the offsetting criteria are netted separately from the derivative amounts and reported in “Other assets” or “Other liabilities.” Cash collateral is offset against amounts recognized as derivative liabilities and the related accrued interest for eligible derivative contracts. Refer to “Note 9: Derivative Instruments” for the impact of offsetting eligible derivative contracts executed with the same counterparty on the consolidated balance sheets.
94
Table of Contents
MBIA Inc. and Subsidiaries
Notes to Consolidated Financial Statements
Note 2: Significant Accounting Policies (continued)
Fair Value Measurements—Definition and Hierarchy
In determining fair value, the Company uses various valuation approaches, including both market and income approaches. The accounting guidance for fair value measurement establishes a hierarchy for inputs used in measuring fair value that maximizes the use of observable inputs and minimizes the use of unobservable inputs by requiring that the most observable inputs be used when available and reliable. Observable inputs are those the Company believes that market participants would use in pricing the asset or liability developed based on market data. Unobservable inputs are those that reflect the Company’s beliefs about the assumptions market participants would use in pricing the asset or liability developed based on the best information available. The hierarchy is broken down into three levels based on the observability and reliability of inputs as follows:
| • | Level 1—Valuations based on quoted prices in active markets for identical assets or liabilities that the Company has the ability to access. Assets utilizing Level 1 inputs generally include U.S. Treasuries, foreign government bonds, money market securities and certain corporate obligations that are highly liquid and actively traded. |
| • | Level 2—Valuations based on quoted prices in markets that are not active or for which all significant inputs are observable, either directly or indirectly. Level 2 assets include debt securities with quoted prices that are traded less frequently than exchange-traded instruments, securities which are priced using observable inputs and derivative contracts whose values are determined using a pricing model with inputs that are observable in the market or can be derived principally from or corroborated by observable market data. |
| • | Level 3—Valuations based on inputs that are unobservable and supported by little or no market activity and that are significant to the overall fair value measurement. Level 3 assets and liabilities include financial instruments whose value is determined using pricing models, discounted cash flow methodologies, or similar techniques, as well as instruments for which the determination of fair value requires significant management judgment or estimation. |
The level of activity in a market contributes to the determination of whether an input is observable. An active market is one in which transactions for an asset or liability occurs with sufficient frequency and volume to provide pricing information on an ongoing basis. In determining whether a market is active or inactive, the Company considers the following traits to be indicative of an active market:
| • | transactions are frequent and observable; |
| • | prices in the market are current; |
| • | price quotes among dealers do not vary significantly over time; and |
| • | sufficient information relevant to valuation is publicly available. |
The availability of observable inputs can vary from product to product and period to period and is affected by a wide variety of factors, including, the type of product, whether the product is new and not yet established in the marketplace, and other characteristics particular to the transaction. To the extent that valuation is based on models or inputs that are less observable or unobservable in the market, the determination of fair value requires more judgment. Accordingly, the degree of judgment exercised by the Company in determining fair value is greatest for instruments categorized in Level 3. In certain cases, the inputs used to measure fair value may fall into different levels of the fair value hierarchy. In such cases, for disclosure purposes the level in the fair value hierarchy within which the fair value measurement in its entirety falls is determined based on the lowest level input that is significant to the fair value measurement in its entirety.
95
Table of Contents
MBIA Inc. and Subsidiaries
Notes to Consolidated Financial Statements
Note 2: Significant Accounting Policies (continued)
Fair value is a market-based measure considered from the perspective of a market participant rather than an entity-specific measure. Therefore, even when market assumptions are not readily available, the Company’s own assumptions are set to reflect those that it believes market participants would use in pricing the asset or liability at the measurement date. The Company uses prices and inputs that are current as of the measurement date, including during periods of market dislocation. In periods of market dislocation, the observability of prices and inputs may be reduced for many instruments. This condition could cause an instrument to be reclassified from Level 1 to Level 2 or from Level 2 to Level 3. The Company has also taken into account its own nonperformance risk and that of its counterparties when measuring fair value.
Refer to “Note 7: Fair Value of Financial Instruments” for additional fair value disclosures.
Loss and Loss Adjustment Expenses
The Company recognizes loss reserves on a contract-by-contract basis when the present value of expected net cash outflows to be paid under the contract discounted using a risk-free rate as of the measurement date exceeds the unearned premium revenue. A loss reserve is subsequently remeasured each reporting period for expected increases or decreases due to changes in the likelihood of default and potential recoveries. Subsequent changes to the measurement of the loss reserves are recognized as loss expense in the period of change. Measurement and recognition of loss reserves are reported gross of any reinsurance. The Company estimates the likelihood of possible claim payments and possible recoveries using probability-weighted expected cash flows based on information available as of the measurement date, including market information. Accretion of the discount on a loss reserve is included in loss expense.
The Company recognizes potential recoveries on paid claims based on probability-weighted net cash inflows present valued at applicable risk-free rates as of the measurement date. Such amounts are reported within “Insurance loss recoverable” on the Company’s consolidated balance sheets. To the extent the Company had recorded potential recoveries in its loss reserves previous to a claim payment, such recoveries are reclassified to “Insurance loss recoverable” upon payment of the related claim and remeasured each reporting period.
The Company’s loss reserve, insurance loss recoverable, and accruals for loss adjustment expense (“LAE”) incurred are disclosed in “Note 6: Loss and Loss Adjustment Expense Reserves.”
Investment Agreements and Medium-Term Notes
Investment agreements and MTNs are carried at the principal amount outstanding plus accrued interest and net of any unamortized premiums or discounts or at fair value for certain MTNs. Interest expense is accrued at the contractual interest rate. Premiums and discounts related to investment agreements and MTNs are amortized and reported as interest expense based on the effective yield method.
Long-term Debt
Long-term debt is carried at the principal amount outstanding plus accrued interest and net of any unamortized discounts.
Financial Guarantee Insurance Premiums
Unearned Premium Revenue and Receivable for Future Premiums
The Company recognizes a liability for unearned premium revenue at the inception of financial guarantee insurance and reinsurance contracts on a contract-by-contract basis. Unearned premium revenue recognized at inception of a contract is measured at the present value of the premium due. For most financial guarantee insurance contracts, the Company receives the entire premium due at the inception of the contract, and recognizes unearned premium revenue liability at that time.
96
Table of Contents
MBIA Inc. and Subsidiaries
Notes to Consolidated Financial Statements
Note 2: Significant Accounting Policies (continued)
For certain other financial guarantee contracts, the Company receives premiums in installments over the term of the contract. Unearned premium revenue and a receivable for future premiums are recognized at the inception of an installment contract, and measured at the present value of premiums expected to be collected over the contract period or expected period using a risk-free discount rate. The expected period is used in the present value determination of unearned premium revenue and receivable for future premiums for contracts where (a) the insured obligation is contractually prepayable, (b) prepayments are probable, (c) the amount and timing of prepayments are reasonably estimable, and (d) a homogenous pool of assets is the underlying collateral for the insured obligation. The Company has determined that substantially all of its installment contracts meet the conditions required to be treated as expected period contracts. The receivable for future premiums is reduced as installment premiums are collected. The Company reports the accretion of the discount on installment premiums receivable as premium revenue and discloses the amount recognized in “Note 5: Insurance Premiums.” The Company assesses the receivable for future premiums for collectability each reporting period, adjusts the receivable for uncollectible amounts and recognizes any write-off as operating expense, and discloses the amount recognized in “Note 5: Insurance Premiums.” As premium revenue is recognized, the unearned premium revenue liability is reduced.
Premium Revenue Recognition
The Company recognizes and measures premium revenue over the period of the contract in proportion to the amount of insurance protection provided. Premium revenue is measured by applying a constant rate to the insured principal amount outstanding in a given period to recognize a proportionate share of the premium received or expected to be received on a financial guarantee insurance contract. A constant rate for each respective financial guarantee insurance contract is calculated as the ratio of (a) the present value of premium received or expected to be received over the period of the contract to (b) the sum of all insured principal amounts outstanding during each period over the term of the contract.
An issuer of an insured financial obligation may retire the obligation prior to its scheduled maturity through refinancing or legal defeasance in satisfaction of the obligation according to its indenture, which results in the Company’s obligation being extinguished under the financial guarantee contract. The Company recognizes any remaining unearned premium revenue on the insured obligation as refunding premiums earned in the period the contract is extinguished to the extent the unearned premium revenue has been collected.
Non-refundable commitment fees are considered insurance premiums and are initially recorded under unearned premium revenue in the consolidated balance sheets when received. Once the related financial guarantee insurance policy is issued, the commitment fees are recognized as premium written and earned using the constant rate method. If the commitment agreement expires before the related financial guarantee is issued, the non-refundable commitment fee is immediately recognized as premium written and earned at that time.
Fee and Reimbursement Revenue Recognition
The Company collects insurance related fees for services performed in connection with certain transactions. In addition, the Company may be entitled to reimbursement of third-party insurance expenses that it incurs in connection with certain transactions. Depending upon the type of fee received and whether it is related to an insurance policy, the fee is either earned when it is received or deferred and earned over the life of the related transaction. Work, waiver and consent, termination, administrative and management fees are earned when the related services are completed and the fee is received. Fees related to investment management services are recognized in earnings over the period that the related services are provided. Asset management fees are typically based on the net asset values of assets under management.
Stock-Based Compensation
The Company recognizes in earnings all stock-based payment transactions at the fair value of the stock-based compensation provided. Refer to “Note 16: Long-term Incentive Plans” for a further discussion regarding the methodology utilized in recognizing employee stock compensation expense.
97
Table of Contents
MBIA Inc. and Subsidiaries
Notes to Consolidated Financial Statements
Note 2: Significant Accounting Policies (continued)
Foreign Currency Translation
Financial statement assets and liabilities denominated in foreign currencies are translated into U.S. dollars generally using rates of exchange prevailing as of the balance sheet date. Operating results are translated at average rates of exchange prevailing during the year. Unrealized gains or losses, net of deferred taxes, resulting from translation of the financial statements of a non-U.S. operation, when the functional currency is other than the U.S. dollar, are included in “Accumulated other comprehensive income (loss)” in shareholders’ equity. Foreign currency remeasurement gains and losses resulting from transactions in non-functional currencies are recorded in earnings. Exchange gains and losses resulting from foreign currency transactions are recorded in earnings.
Income Taxes
Deferred income taxes are recorded with respect to loss carryforwards and temporary differences between the tax bases of assets and liabilities and the reported amounts in the Company’s financial statements that will result in deductible or taxable amounts in future years when the reported amounts of assets and liabilities are recovered or settled. Such temporary differences relate principally to premium revenue recognition, deferred acquisition costs, unrealized gains or losses on investments and insured derivatives, asset impairments, cancellation of indebtedness income, and net operating losses. Valuation allowances are established to reduce deferred tax assets to the amount that more likely than not will be realized. Deferred tax assets and liabilities are adjusted for the effect of changes in tax laws and rates in the period in which changes are approved by the relevant authority.
MBIA Inc. and its eligible U.S. subsidiaries file a consolidated federal income tax return. The U.S. income taxes, which represent a majority of the taxes paid by the Company, are allocated based on the provisions of the Company’s tax sharing agreement which governs the intercompany settlement of tax obligations and benefits. The method of allocation between the members is generally based upon separate-company calculations as if each member filed a separate tax return on its own. As of December 31, 2014, any member with a net operating loss (“NOL”) has not received any payment with respect to stand-alone tax losses contributed to the consolidated group. Each member with an NOL will receive benefits of its tax losses and credits as it is able to earn them out in the future. However, based on current facts and circumstances, MBIA Inc. has advised its subsidiaries that, its intention is not to allow any member’s NOL, capital loss or tax credit carryforward generated by any subsidiary to expire without compensation, to the extent such carryforward is used in consolidation. Such intention is independent of the tax sharing agreement which does not require any such compensation.
In establishing a liability for an unrecognized tax benefit (“UTB”), assumptions may be made in determining whether a tax position is more likely than not to be sustained upon examination by the taxing authority and also in determining the ultimate amount that is likely to be realized. A tax position is recognized only when, based on management’s judgment regarding the application of income tax laws, it is more likely than not that the tax position will be sustained upon examination. The amount of tax benefit recognized is based on the Company’s assessment of the largest amount of benefit that is more likely than not to be realized on ultimate settlement with the taxing authority. This measurement is based on many factors, including whether a tax dispute may be settled through negotiation with the taxing authority or is only subject to review in the courts. As new information becomes available, the Company evaluates its tax positions, and adjusts its UTB, as appropriate. If the tax benefit ultimately realized differs from the amount previously recognized, the Company recognizes an adjustment of the UTB.
Refer to “Note 11: Income Taxes” for additional information about the Company’s income taxes.
98
Table of Contents
MBIA Inc. and Subsidiaries
Notes to Consolidated Financial Statements
Note 3: Recent Accounting Pronouncements
Recently Adopted Accounting Standards
Income Taxes (Topic 740)—Presentation of an Unrecognized Tax Benefit When a Net Operating Loss Carryforward, a Similar Tax Loss, or a Tax Credit Carryforward Exists (ASU 2013-11)
In July of 2013, the Financial Accounting Standards Board (“FASB”) issued Accounting Standards Update (“ASU”) 2013-11, “Income Taxes (Topic 740)—Presentation of an Unrecognized Tax Benefit When a Net Operating Loss Carryforward, a Similar Tax Loss, or a Tax Credit Carryforward Exists.” ASU 2013-11 requires presentation of an UTB as a reduction to a deferred tax asset when a NOL carryforward, a similar tax loss, or a tax credit carryforward exists in the same tax year and jurisdiction as the UTB. ASU 2013-11 does not affect the recognition or measurement of uncertain tax positions under “Income Taxes (Topic 740)” and does not affect any related tax disclosures. ASU 2013-11 was effective for interim and annual periods beginning January 1, 2014. The Company previously presented any UTBs as a reduction to a deferred tax asset in accordance with ASU 2013-11 as all of its UTBs relate to the same tax years and jurisdictions in which NOLs exist, therefore, this accounting pronouncement did not affect the Company’s consolidated financial statements.
The Company has not adopted any other new accounting pronouncements that had a material impact on its consolidated financial statements.
Recent Accounting Developments
Presentation of Financial Statements (Topic 205) and Property, Plant, and Equipment (Topic 360)—Reporting Discontinued Operations and Disclosures of Disposals of Components of an Entity
In April of 2014, the FASB issued ASU 2014-08, “Presentation of Financial Statements (Topic 205) and Property, Plant, and Equipment (Topic 360)-Reporting Discontinued Operations and Disclosures of Disposals of Components of an Entity.” ASU 2014-08 changes the criteria for determining whether a disposal of a component or group of components of an entity qualifies for discontinued operations presentation and requires new disclosures. ASU 2014-08 amends the definition of discontinued operation to a disposal of components of an entity that represent strategic shifts that have, or will have, a major effect on an entity’s operations and financial results. ASU 2014-08 is effective for interim and annual periods beginning January 1, 2015, and with early adoption permitted but only for disposals or classifications as held for sale that have not been reported in previously issued financial statements. The adoption of ASU 2014-08 is not expected to materially impact the Company’s consolidated financial statements.
Revenue from Contracts with Customers (Topic 606) (ASU 2014-09)
In May of 2014, the FASB issued ASU 2014-09, “Revenue from Contracts with Customers (Topic 606).” ASU 2014-09 amends the accounting guidance for recognizing revenue for the transfer of goods or services from contracts with customers unless those contracts are within the scope of other accounting standards. ASU 2014-09 is effective for interim and annual periods beginning January 1, 2017, and is applied on a retrospective or modified retrospective basis. The Company is evaluating the impact of adopting ASU 2014-09.
Transfers and Servicing (Topic 860)—Repurchase-to-Maturity Transactions, Repurchase Financings, and Disclosures (ASU 2014-11)
In June of 2014, the FASB issued ASU 2014-11, “Transfers and Servicing (Topic 860)-Repurchase-to-Maturity Transactions, Repurchase Financings, and Disclosures.” The repurchase agreements and similar transactions guidance is amended by ASU 2014-11 to change the accounting for i.) repurchase-to-maturity transactions to secured borrowing accounting and ii.) linked repurchase financing transactions to secured borrowing accounting. ASU 2014-11 amends disclosure requirements for transfers accounted for as sales, and for repurchase transactions accounted for as secured borrowings. ASU 2014-11 is effective for interim and annual periods beginning January 1, 2015, and is applied on a prospective basis. The adoption of ASU 2014-11 is not expected to materially impact the Company’s consolidated financial statements.
99
Table of Contents
MBIA Inc. and Subsidiaries
Notes to Consolidated Financial Statements
Note 3: Recent Accounting Pronouncements (continued)
Compensation-Stock Compensation (Topic 718)—Accounting for Share-Based Payments When the Terms of an Award Provide That a Performance Target Could Be Achieved after the Requisite Service Period (A Consensus of the FASB Emerging Issues Task Force) (ASU 2014-12)
In June of 2014, the FASB issued ASU 2014-12, “Compensation-Stock Compensation (Topic 718)-Accounting for Share-Based Payments When the Terms of an Award Provide That a Performance Target Could Be Achieved after the Requisite Service Period.” ASU 2014-12 requires that a performance target that affects vesting of share-based payment awards and that could be achieved after an employee’s requisite service period be accounted for as a performance condition. ASU 2014-12 is effective for interim and annual periods beginning January 1, 2016 with early adoption permitted, and is applied on a prospective basis or retrospective basis. The adoption of ASU 2014-12 is not expected to materially impact the Company’s consolidated financial statements.
Consolidation (Topic 810)—Measuring the Financial Assets and the Financial Liabilities of a Consolidated Collateralized Financing Entity (ASU 2014-13)
In August of 2014, the FASB issued ASU 2014-13, “Consolidation (Topic 810)-Measuring the Financial Assets and the Financial Liabilities of a Consolidated Collateralized Financing Entity.” ASU 2014-13 applies to a consolidated collateralized financing entity defined as a consolidated VIE that holds financial assets and issues beneficial interests in those financial assets that are classified as financial liabilities. The Company may elect to measure the financial assets and the financial liabilities of a consolidated collateralized financing entity using a measurement alternative provided in ASU 2014-13. The measurement alternative requires both the financial assets and the financial liabilities of the consolidated collateralized financing entity to be measured using the more observable of the fair value of the financial assets and the fair value of the financial liabilities with the changes in fair value recognized to earnings. Upon adoption, a reporting entity may apply the measurement alternative to existing consolidated collateralized financing entities. ASU 2014-13 is effective for interim and annual periods beginning January 1, 2016 with early adoption permitted. The adoption of ASU 2014-13 is not expected to materially impact the Company’s consolidated financial statements.
Presentation of Financial Statements—Going Concern (Subtopic 205-40): Disclosure of Uncertainties about an Entity’s Ability to Continue as a Going Concern (ASU 2014-15)
In August of 2014, the FASB issued ASU 2014-15, “Presentation of Financial Statements-Going Concern (Subtopic 205-40): Disclosure of Uncertainties about an Entity’s Ability to Continue as a Going Concern.” ASU 2014-15 requires management to evaluate whether there are conditions or events that raise substantial doubt about the entity’s ability to continue as a going concern, and to provide certain disclosures when it is probable that the entity will be unable to meet its obligations as they become due within one year after the date that the financial statements are issued. ASU 2014-15 is effective for the annual period ending December 31, 2016 and for annual periods and interim periods thereafter with early adoption permitted. The adoption of ASU 2014-15 is not expected to materially impact the Company’s consolidated financial statements.
Consolidation (Topic 810)—Amendments to the Consolidation Analysis (ASU 2015-02)
In February of 2015, the FASB issued ASU 2015-02, “Consolidation (Topic 810)—Amendments to the Consolidation Analysis.” ASU 2015-02 amends the accounting guidance for consolidation of legal entities including VIEs. ASU 2015-02 eliminates the specialized consolidation model and guidance for limited partnerships, amends the conditions for evaluating whether a fee paid to a decision maker or a service provider represents a variable interest in a VIE, amends the related party guidance for the determination of the primary beneficiary of a VIE, and requires certain investment funds designed as VIEs, except money market funds, to apply the amended consolidation guidance. ASU 2015-02 is effective for interim and annual periods beginning January 1, 2016 with early adoption permitted, and is applied on a retrospective or modified retrospective basis. The Company is evaluating the impact of adopting ASU 2015-02.
100
Table of Contents
MBIA Inc. and Subsidiaries
Notes to Consolidated Financial Statements
Note 4: Variable Interest Entities
Through MBIA’s international and structured finance insurance segment, the Company provides credit protection to issuers of obligations that may involve issuer-sponsored special purpose entities (“SPE”). An SPE may be considered a VIE to the extent the SPE’s total equity at risk is not sufficient to permit the SPE to finance its activities without additional subordinated financial support or its equity investors lack any one of the following characteristics: (i) the power to direct the activities of the SPE that most significantly impact the entity’s economic performance or (ii) the obligation to absorb the expected losses of the entity or the right to receive the expected residual returns of the entity. A holder of a variable interest or interests in a VIE is required to assess whether it has a controlling financial interest, and thus is required to consolidate the entity as primary beneficiary. An assessment of a controlling financial interest identifies the primary beneficiary as the variable interest holder that has both of the following characteristics: (i) the power to direct the activities of the VIE that most significantly impact the entity’s economic performance and (ii) the obligation to absorb losses of the entity or the right to receive benefits from the entity that could potentially be significant to the VIE. The primary beneficiary is required to consolidate the VIE. An ongoing reassessment of controlling financial interest is required to be performed based on any substantive changes in facts and circumstances involving the VIE and its variable interests.
The Company evaluates issuer-sponsored SPEs initially to determine if an entity is a VIE, and is required to reconsider its initial determination if certain events occur. For all entities determined to be VIEs, MBIA performs an ongoing reassessment to determine whether its guarantee to provide credit protection on obligations issued by VIEs provides the Company with a controlling financial interest. Based on its ongoing reassessment of controlling financial interest, the Company determines whether a VIE is required to be consolidated or deconsolidated.
The Company makes its determination for consolidation based on a qualitative assessment of the purpose and design of a VIE, the terms and characteristics of variable interests of an entity, and the risks a VIE is designed to create and pass through to holders of variable interests. The Company generally provides credit protection on obligations issued by VIEs, and holds certain contractual rights according to the purpose and design of a VIE. The Company may have the ability to direct certain activities of a VIE depending on facts and circumstances, including the occurrence of certain contingent events, and these activities may be considered the activities of a VIE that most significantly impact the entity’s economic performance. The Company generally considers its guarantee of principal and interest payments of insured obligations, given nonperformance by a VIE, to be an obligation to absorb losses of the entity that could potentially be significant to the VIE. At the time the Company determines it has the ability to direct the activities of a VIE that most significantly impact the economic performance of the entity based on facts and circumstances, MBIA is deemed to have a controlling financial interest in the VIE and is required to consolidate the entity as primary beneficiary. The Company performs an ongoing reassessment of controlling financial interest that may result in consolidation or deconsolidation of any VIE.
The Company’s advisory services segment provides asset management and advisory services to VIEs. During 2014, the Company consolidated three VIEs as the primary beneficiary, pursuant to this segment’s activities. As of December 31, 2014, the Company holds approximately $4 million of the subordinated notes issued by one of the VIEs. The Company has no obligation or commitment to provide additional financial support or liquidity to these VIEs. Effective January 1, 2015, the Company completed the sale of its Cutwater business and deconsolidated these VIEs. Refer to “Note 1: Business Developments and Risks and Uncertainties” for additional information about the sale of Cutwater.
The Company’s conduit segment has managed and administered a conduit that invested primarily in debt securities and was funded through the issuance of VIE notes. The Company consolidated the conduit as the primary beneficiary. In 2014, all outstanding VIE notes were repaid by the conduit, and the conduit was subsequently dissolved. The Company no longer provides any related credit protection.
101
Table of Contents
MBIA Inc. and Subsidiaries
Notes to Consolidated Financial Statements
Note 4: Variable Interest Entities (continued)
Nonconsolidated VIEs
Insurance
The following tables present the total assets of nonconsolidated VIEs in which the Company holds a variable interest as of December 31, 2014 and 2013, through its insurance operations. The following tables also present the Company’s maximum exposure to loss for nonconsolidated VIEs and carrying values of the assets and liabilities for its interests in these VIEs as of December 31, 2014 and 2013. The Company has aggregated nonconsolidated VIEs based on the underlying credit exposure of the insured obligation. The nature of the Company’s variable interests in nonconsolidated VIEs is related to financial guarantees, insured CDS contracts and any investments in obligations issued by nonconsolidated VIEs.
| December 31, 2014 | ||||||||||||||||||||||||||||||||
| Carrying Value of Assets | Carrying Value of Liabilities | |||||||||||||||||||||||||||||||
| In millions |
VIE Assets |
Maximum Exposure to Loss |
Investments(1) | Premiums Receivable(2) |
Insurance Loss Recoverable(3) |
Unearned Premium Revenue(4) |
Loss and Loss Adjustment Expense Reserves(5) |
Derivative Liabilities(6) |
||||||||||||||||||||||||
| Insurance: |
||||||||||||||||||||||||||||||||
| Global structured finance: |
||||||||||||||||||||||||||||||||
| Collateralized debt obligations |
$ | 8,613 | $ | 5,623 | $ | 110 | $ | 24 | $ | — | $ | 20 | $ | 70 | $ | 102 | ||||||||||||||||
| Mortgage-backed residential |
14,136 | 7,459 | 9 | 41 | 518 | 39 | 307 | — | ||||||||||||||||||||||||
| Mortgage-backed commercial |
571 | 279 | — | 1 | — | 1 | — | — | ||||||||||||||||||||||||
| Consumer asset-backed |
6,008 | 1,989 | — | 16 | — | 14 | 12 | — | ||||||||||||||||||||||||
| Corporate asset-backed |
6,612 | 4,608 | — | 41 | 6 | 47 | — | — | ||||||||||||||||||||||||
|
|
|
|
|
|
|
|
|
|
|
|
|
|
|
|
|
|||||||||||||||||
| Total global structured finance |
35,940 | 19,958 | 119 | 123 | 524 | 121 | 389 | 102 | ||||||||||||||||||||||||
| Global public finance |
49,686 | 16,698 | — | 179 | — | 211 | — | — | ||||||||||||||||||||||||
|
|
|
|
|
|
|
|
|
|
|
|
|
|
|
|
|
|||||||||||||||||
| Total insurance |
$ | 85,626 | $ | 36,656 | $ | 119 | $ | 302 | $ | 524 | $ | 332 | $ | 389 | $ | 102 | ||||||||||||||||
|
|
|
|
|
|
|
|
|
|
|
|
|
|
|
|
|
|||||||||||||||||
(1)—Reported within “Investments” on MBIA’s consolidated balance sheets.
(2)—Reported within “Premiums receivable” on MBIA’s consolidated balance sheets.
(3)—Reported within “Insurance loss recoverable” on MBIA’s consolidated balance sheets.
(4)—Reported within “Unearned premium revenue” on MBIA’s consolidated balance sheets.
(5)—Reported within “Loss and loss adjustment expense reserves” on MBIA’s consolidated balance sheets.
(6)—Reported within “Derivative liabilities” on MBIA’s consolidated balance sheets.
102
Table of Contents
MBIA Inc. and Subsidiaries
Notes to Consolidated Financial Statements
Note 4: Variable Interest Entities (continued)
| December 31, 2013 | ||||||||||||||||||||||||||||||||
| Carrying Value of Assets | Carrying Value of Liabilities | |||||||||||||||||||||||||||||||
| In millions |
VIE Assets |
Maximum Exposure to Loss |
Investments(1) | Premiums Receivable(2) |
Insurance Loss Recoverable(3) |
Unearned Premium Revenue(4) |
Loss and Loss Adjustment Expense Reserves(5) |
Derivative Liabilities(6) |
||||||||||||||||||||||||
| Insurance: |
||||||||||||||||||||||||||||||||
| Global structured finance: |
||||||||||||||||||||||||||||||||
| Collateralized debt obligations |
$ | 12,565 | $ | 7,693 | $ | 120 | $ | 43 | $ | — | $ | 37 | $ | 21 | $ | 108 | ||||||||||||||||
| Mortgage-backed residential |
21,738 | 9,251 | 10 | 53 | 658 | 51 | 327 | 5 | ||||||||||||||||||||||||
| Mortgage-backed commercial |
1,367 | 447 | — | 1 | — | 1 | — | — | ||||||||||||||||||||||||
| Consumer asset-backed |
7,830 | 2,740 | 9 | 19 | — | 19 | 13 | — | ||||||||||||||||||||||||
| Corporate asset-backed |
13,028 | 7,248 | 2 | 80 | 18 | 96 | — | — | ||||||||||||||||||||||||
|
|
|
|
|
|
|
|
|
|
|
|
|
|
|
|
|
|||||||||||||||||
| Total global structured finance |
56,528 | 27,379 | 141 | 196 | 676 | 204 | 361 | 113 | ||||||||||||||||||||||||
| Global public finance |
52,317 | 20,162 | — | 206 | — | 248 | 5 | — | ||||||||||||||||||||||||
|
|
|
|
|
|
|
|
|
|
|
|
|
|
|
|
|
|||||||||||||||||
| Total insurance |
$ | 108,845 | $ | 47,541 | $ | 141 | $ | 402 | $ | 676 | $ | 452 | $ | 366 | $ | 113 | ||||||||||||||||
|
|
|
|
|
|
|
|
|
|
|
|
|
|
|
|
|
|||||||||||||||||
(1)—Reported within “Investments” on MBIA’s consolidated balance sheets.
(2)—Reported within “Premiums receivable” on MBIA’s consolidated balance sheets.
(3)—Reported within “Insurance loss recoverable” on MBIA’s consolidated balance sheets.
(4)—Reported within “Unearned premium revenue” on MBIA’s consolidated balance sheets.
(5)—Reported within “Loss and loss adjustment expense reserves” on MBIA’s consolidated balance sheets.
(6)—Reported within “Derivative liabilities” on MBIA’s consolidated balance sheets.
The maximum exposure to loss as a result of MBIA’s variable interests in VIEs is represented by insurance in force. Insurance in force is the maximum future payments of principal and interest which may be required under commitments to make payments on insured obligations issued by nonconsolidated VIEs.
Consolidated VIEs
The carrying amounts of assets and liabilities of consolidated VIEs were $5.0 billion and $4.8 billion, respectively, as of December 31, 2014, and $5.6 billion and $5.3 billion, respectively, as of December 31, 2013. The carrying amounts of assets and liabilities are presented separately in “Assets of consolidated variable interest entities” and “Liabilities of consolidated variable interest entities” on the Company’s consolidated balance sheets. The carrying amounts of assets and liabilities of consolidated VIEs in the Company’s advisory services segment were $751 million and $754 million, respectively, as of December 31, 2014, and are presented separately in “Assets held for sale” and “Liabilities held for sale” on the Company’s consolidated balance sheets. Additional VIEs are consolidated or deconsolidated based on an ongoing reassessment of controlling financial interest, when events occur or circumstances arise, and whether the ability to exercise rights that constitute power to direct activities of any VIEs are present according to the design and characteristics of these entities. Three additional VIEs were consolidated during the year ended December 31, 2014 and no additional VIEs were consolidated during the year ended December 31, 2013. Net realized losses recorded for the year ended December 31, 2014 were $3 million related to the consolidation of VIEs.
Holders of insured obligations of issuer-sponsored VIEs related to the Company’s international and structured finance insurance segment do not have recourse to the general assets of MBIA. In the event of nonpayment of an insured obligation issued by a consolidated VIE, the Company is obligated to pay principal and interest, when due, on the respective insured obligation only. The Company’s exposure to consolidated VIEs is limited to the credit protection provided on insured obligations and any additional variable interests held by MBIA.
103
Table of Contents
MBIA Inc. and Subsidiaries
Notes to Consolidated Financial Statements
Note 5: Insurance Premiums
The Company recognizes and measures premiums related to financial guarantee (non-derivative) insurance and reinsurance contracts in accordance with the accounting principles for financial guarantee insurance contracts.
As of December 31, 2014 and 2013, premiums receivable was $875 million and $1.1 billion, respectively, primarily related to installment policies for which premiums will be collected over the estimated term of the contracts. Premiums receivable for an installment policy is initially measured at the present value of premiums expected to be collected over the expected period or contract period of the policy using a risk-free discount rate. Premiums receivable for policies that use the expected period of risk due to expected prepayments are adjusted in subsequent measurement periods when prepayment assumptions change using the risk-free discount rate as of the remeasurement date.
The Company evaluates whether any premiums receivable are uncollectible at each balance sheet date. If the Company determines that premiums are uncollectible, it records a write-off of such amounts in current earnings. The majority of the Company’s premiums receivable consist of the present values of future installment premiums that are not yet billed or due, primarily from structured finance transactions. Given that premiums due to MBIA typically have priority over most other payment obligations of structured finance transactions, the Company determined that the amount of uncollectible premiums as of December 31, 2014 and 2013 was insignificant.
As of December 31, 2014 and 2013, the risk-free rate used to discount future installment premiums was 2.8% and 2.9%, respectively, and the weighted average expected collection term of the premiums receivable was 9.18 years and 9.21 years, respectively. As of December 31, 2014 and 2013, reinsurance premiums payable was $56 million and $51 million, respectively, and is included in “Other liabilities” in the Company’s consolidated balance sheets. The reinsurance premiums payable is accreted and paid to reinsurers as premiums due to MBIA are accreted and collected.
The following tables present a roll forward of the Company’s premiums receivable for the years ended December 31, 2014 and 2013:
| In millions | Adjustments | |||||||||||||||||||||||||
| Premiums Receivable as of December 31, 2013 |
Premium Payments Received |
Premiums from New Business Written |
Changes in Expected Term of Policies |
Accretion of Premiums Receivable Discount |
Other(1) | Premiums Receivable as of December 31, 2014 |
||||||||||||||||||||
| $ | 1,051 | $ | (120) | $ | 6 | $ | (50) | $ | 26 | $ | (38) | $ | 875 | |||||||||||||
|
|
|
|
|
|
|
|
|
|
|
|
|
|
|
|||||||||||||
(1)—Primarily consists of unrealized gains (losses) due to foreign currency exchange rates.
| In millions | Adjustments | |||||||||||||||||||||||||
| Premiums Receivable as of December 31, 2012 |
Premium Payments Received |
Premiums from New Business Written |
Changes in Expected Term of Policies |
Accretion of Premiums Receivable Discount |
Other(1) | Premiums Receivable as of December 31, 2013 |
||||||||||||||||||||
| $ | 1,228 | $ | (135) | $ | — | $ | (45) | $ | 28 | $ | (25) | $ | 1,051 | |||||||||||||
|
|
|
|
|
|
|
|
|
|
|
|
|
|
|
|||||||||||||
(1)—Primarily consists of unrealized gains (losses) due to foreign currency exchange rates.
104
Table of Contents
MBIA Inc. and Subsidiaries
Notes to Consolidated Financial Statements
Note 5: Insurance Premiums (continued)
The following table presents the undiscounted future amount of premiums expected to be collected and the period in which those collections are expected to occur:
| In millions |
Expected Collection of Premiums |
|||
| Three months ended: |
||||
| March 31, 2015 |
$ | 20 | ||
| June 30, 2015 |
32 | |||
| September 30, 2015 |
21 | |||
| December 31, 2015 |
24 | |||
| Twelve months ended: |
||||
| December 31, 2016 |
91 | |||
| December 31, 2017 |
83 | |||
| December 31, 2018 |
73 | |||
| December 31, 2019 | 68 | |||
| Five years ended: |
||||
| December 31, 2024 |
282 | |||
| December 31, 2029 |
204 | |||
| December 31, 2034 and thereafter |
213 | |||
|
|
|
|||
| Total |
$ | 1,111 | ||
|
|
|
|||
The following table presents the unearned premium revenue balance and future expected premium earnings as of and for the periods presented:
| Expected Future Premium Earnings |
||||||||||||||||||||
| In millions |
Unearned Premium Revenue |
Upfront | Installments | Accretion | Total Expected Future Premium Earnings |
|||||||||||||||
| December 31, 2014 |
$ | 1,986 | ||||||||||||||||||
| Three months ended: |
||||||||||||||||||||
| March 31, 2015 |
1,934 | $ | 30 | $ | 22 | $ | 6 | $ | 58 | |||||||||||
| June 30, 2015 |
1,883 | 29 | 22 | 6 | 57 | |||||||||||||||
| September 30, 2015 |
1,834 | 28 | 21 | 6 | 55 | |||||||||||||||
| December 31, 2015 |
1,786 | 27 | 21 | 6 | 54 | |||||||||||||||
| Twelve months ended: |
||||||||||||||||||||
| December 31, 2016 |
1,603 | 102 | 81 | 21 | 204 | |||||||||||||||
| December 31, 2017 |
1,436 | 93 | 74 | 20 | 187 | |||||||||||||||
| December 31, 2018 |
1,286 | 85 | 65 | 18 | 168 | |||||||||||||||
| December 31, 2019 |
1,148 | 78 | 60 | 17 | 155 | |||||||||||||||
| Five years ended: |
||||||||||||||||||||
| December 31, 2024 |
613 | 294 | 241 | 64 | 599 | |||||||||||||||
| December 31, 2029 |
288 | 171 | 154 | 37 | 362 | |||||||||||||||
| December 31, 2034 and thereafter |
— | 146 | 142 | 35 | 323 | |||||||||||||||
|
|
|
|
|
|
|
|
|
|||||||||||||
| Total |
$ | 1,083 | $ | 903 | $ | 236 | $ | 2,222 | ||||||||||||
|
|
|
|
|
|
|
|
|
|||||||||||||
105
Table of Contents
MBIA Inc. and Subsidiaries
Notes to Consolidated Financial Statements
Note 6: Loss and Loss Adjustment Expense Reserves
Loss and Loss Adjustment Expense Process
The Company’s insured portfolio management groups within its U.S. public finance insurance and international and structured finance insurance businesses (collectively, “IPM”) monitor MBIA’s outstanding insured obligations with the objective of minimizing losses. IPM meets this objective by identifying issuers that, because of deterioration in credit quality or changes in the economic, regulatory or political environment, are at a heightened risk of defaulting on debt service of obligations insured by MBIA. In such cases, IPM works with the issuer, trustee, bond counsel, servicer, underwriter and other interested parties in an attempt to alleviate or remedy the problem and avoid defaults on debt service payments. Once an obligation is insured, MBIA typically requires the issuer, servicer (if applicable) and the trustee to furnish periodic financial and asset-related information, including audited financial statements, to IPM for review. IPM also monitors publicly available information related to insured obligations. Potential problems uncovered through this review, such as poor financial results, low fund balances, covenant or trigger violations and trustee or servicer problems, or other events that could have an adverse impact on the insured obligation, could result in an immediate surveillance review and an evaluation of possible remedial actions. IPM also monitors and evaluates the impact on issuers of general economic conditions, current and proposed legislation and regulations, as well as sovereign, state and municipal finances and budget developments.
The frequency and extent of IPM’s monitoring is based on the criteria and categories described below. Insured obligations that are judged to merit more frequent and extensive monitoring or remediation activities due to a deterioration in the underlying credit quality of the insured obligation or the occurrence of adverse events related to the underlying credit of the issuer are assigned to a surveillance category (“Caution List—Low,” “Caution List—Medium,” “Caution List—High” or “Classified List”) depending on the extent of credit deterioration or the nature of the adverse events. IPM monitors insured obligations assigned to a surveillance category more frequently and, if needed, develops a remediation plan to address any credit deterioration.
Remediation actions may involve, among other things, waivers or renegotiations of financial covenants or triggers, waivers of contractual provisions, the granting of consents, transfer of servicing, consideration of restructuring plans, acceleration, security or collateral enforcement, actions in bankruptcy or receivership, litigation and similar actions. The types of remedial actions pursued are based on the insured obligation’s risk type and the nature and scope of the event giving rise to the remediation. As part of any such remedial actions, MBIA seeks to improve its security position and to obtain concessions from the issuer of the insured obligation. From time to time, the issuer of an MBIA-insured obligation may, with the consent of MBIA, restructure the insured obligation by extending the term, increasing or decreasing the par amount or decreasing the related interest rate, with MBIA insuring the restructured obligation.
The Company does not establish any case basis reserves for insured obligations that are assigned to “Caution List—Low,” “Caution List—Medium” or “Caution List—High.” In the event MBIA expects to pay a claim with respect to an insured transaction, it places the insured transaction on its “Classified List” and establishes a case basis reserve. When there are no remaining expected future claim payments, the insured transaction is removed from the “Classified List.” The following provides a description of each surveillance category:
“Caution List—Low”—Includes issuers where debt service protection is adequate under current and anticipated circumstances. However, debt service protection and other measures of credit support and stability may have declined since the transaction was underwritten and the issuer is less able to withstand further adverse events. Transactions in this category generally require more frequent monitoring than transactions that do not appear within a surveillance category. IPM subjects issuers in this category to heightened scrutiny.
“Caution List—Medium”—Includes issuers where debt service protection is adequate under current and anticipated circumstances, although adverse trends have developed and are more pronounced than for “Caution List – Low.” Issuers in this category may have breached one or more covenants or triggers. These issuers are more closely monitored by IPM but generally take remedial action on their own.
106
Table of Contents
MBIA Inc. and Subsidiaries
Notes to Consolidated Financial Statements
Note 6: Loss and Loss Adjustment Expense Reserves (continued)
“Caution List—High”—Includes issuers where more proactive remedial action is needed but where no defaults on debt service payments are expected. Issuers in this category exhibit more significant weaknesses, such as low debt service coverage, reduced or insufficient collateral protection or inadequate liquidity, which could lead to debt service defaults in the future. Issuers in this category may have breached one or more covenants or triggers and have not taken conclusive remedial action. Therefore, IPM adopts a remediation plan and takes more proactive remedial actions.
“Classified List”—Includes all insured obligations where MBIA has paid a claim or where a claim payment is expected. It also includes insured obligations where a significant LAE payment has been made, or is expected to be made, to mitigate a claim payment. This may include property improvements, bond purchases and commutation payments. Generally, IPM is actively remediating these credits where possible, including restructurings through legal proceedings, usually with the assistance of specialist counsel and advisors.
In establishing case basis loss reserves, the Company calculates the present value of probability-weighted estimated loss payments, net of estimated recoveries, using a discount rate equal to the risk-free rate applicable to the currency and the weighted average remaining life of the insurance contract as required by accounting principles for financial guarantee contracts. Yields on U.S. Treasury offerings are used to discount loss reserves denominated in U.S. dollars, which represent the majority of the loss reserves. Similarly, yields on foreign government offerings are used to discount loss reserves denominated in currencies other than the U.S. dollar. If the Company were to apply different discount rates, its case basis reserves may have been higher or lower than those established as of December 31, 2014. For example, a higher discount rate applied to expected future payments would have decreased the amount of a case basis reserve established by the Company and a lower rate would have increased the amount of a reserve established by the Company. Similarly, a higher discount rate applied to the potential future recoveries would have decreased the amount of a loss recoverable established by the Company and a lower rate would have increased the amount of a loss recoverable established by the Company.
U.S. Public Finance Insurance
U.S. public finance insured transactions consist of municipal bonds, including tax-exempt and taxable indebtedness of U.S. political subdivisions, as well as utility districts, airports, health care institutions, higher educational facilities, student loan issuers, housing authorities and other similar agencies and obligations issued by private entities that finance projects that serve a substantial public purpose. The Company estimates future losses by using probability-weighted scenarios that are customized to each insured transaction. Future loss estimates consider debt service due for each insured transaction, which includes par outstanding and interest due.
As of December 31, 2014 and 2013, the Company established loss and LAE reserves totaling $45 million and $87 million, respectively, and insurance loss recoverable of $4 million and $13 million, respectively, related to U.S. public finance issues. For the year ended December 31, 2014, losses and LAE incurred was a benefit of $10 million, primarily related to decreases in reserves for certain general obligation bonds, partially offset by increases in reserves for Puerto Rico exposures.
Certain local governments remain under financial and budgetary stress and a few have filed for protection under the United States Bankruptcy Code, or have entered into state statutory proceedings established to assist municipalities in managing through periods of severe fiscal stress. This could lead to an increase in defaults by such entities on the payment of their obligations and losses or impairments on a greater number of the Company’s insured transactions. The Company monitors and analyzes these situations closely, however, the overall extent and duration of such events are uncertain and the filing for protection under the United States Bankruptcy Code or entering state statutory proceedings does not result in a default or indicate that an ultimate loss will occur. As of December 31, 2014 and 2013, the Company had $98.9 billion and $124.9 billion, respectively, of gross par outstanding on general obligations, of which $152 million and $161 million, respectively, were reflected on the Company’s “Classified List.” Capital appreciation bonds are reported at the par amount at the time of issuance of the insurance policy.
107
Table of Contents
MBIA Inc. and Subsidiaries
Notes to Consolidated Financial Statements
Note 6: Loss and Loss Adjustment Expense Reserves (continued)
International and Structured Finance Insurance
As of December 31, 2014, the majority of the international and structured finance insurance segment’s case basis reserves and insurance loss recoveries recorded in accordance with GAAP were related to insured second and first-lien RMBS transactions. These reserves and recoveries do not include estimates for policies insuring credit derivatives or losses and recoveries on financial guarantee VIEs that are eliminated in consolidation. Policies insuring credit derivative contracts are accounted for as derivatives and carried at fair value under GAAP. The fair values of insured derivative contracts are influenced by a variety of market and transaction-specific factors that may be unrelated to potential future claim payments under the Company’s insurance policies. In the absence of credit impairments on insured derivative contracts or the early termination of such contracts at a loss, the cumulative unrealized losses recorded from these contracts should reverse before or at the maturity of the contracts.
Notwithstanding the difference in accounting under GAAP for financial guarantee policies and the Company’s insured derivatives, insured derivatives have similar terms, conditions, risks, and economic profiles to financial guarantee insurance policies, and therefore, are evaluated by the Company for loss (referred to as credit impairment herein) and LAE periodically in a manner similar to the way that loss and LAE reserves are estimated for financial guarantee insurance policies. Credit impairments represent actual payments and collections plus the present value of estimated expected future claim payments, net of recoveries. MBIA Corp.’s, exclusive of MBIA UK, expected future claim payments for insured derivatives were discounted using a rate of 5.17%, the same rate it used to calculate its statutory loss reserves as of December 31, 2014. MBIA UK used a rate of 2.20% to discount its expected future claim payments and statutory loss reserves. These credit impairments, calculated in accordance with statutory accounting principles (“U.S. STAT”) differ from the fair values recorded in the Company’s consolidated financial statements. The Company considers its credit impairment estimates as critical information for investors as it provides information about loss payments the Company expects to make on insured derivative contracts.
As a result, the following loss and LAE process discussion includes information about loss and LAE activity recorded in accordance with GAAP for financial guarantee insurance policies and credit impairments estimated in accordance with U.S. STAT for insured derivative contracts. Refer to “Note 7: Fair Value of Financial Instruments” included herein for additional information about the Company’s insured credit derivative contracts.
RMBS Case Basis Reserves and Recoveries (Financial Guarantees)
The Company’s RMBS reserves and recoveries relate to financial guarantee insurance policies. The Company calculated RMBS case basis reserves as of December 31, 2014 for both second and first-lien RMBS transactions using a process called the “Roll Rate Methodology.” The Roll Rate Methodology is a multi-step process using a database of loan level information, a proprietary internal cash flow model, and a commercially available model to estimate potential losses and recoveries on insured bonds. “Roll Rate” is defined as the probability that current loans become delinquent and that loans in the delinquent pipeline are charged-off or liquidated. Generally, Roll Rates are calculated for the previous three months and averaged. The loss reserve estimates are based on a probability-weighted average of three scenarios of loan losses (base case, stress case, and an additional stress case).
In calculating ultimate cumulative losses for RMBS, the Company estimates the amount of loans that are expected to be charged-off (deemed uncollectible by servicers of the transactions) or liquidated in the future.
Second-lien RMBS Reserves
The Company’s second-lien RMBS case basis reserves as of December 31, 2014 relate to RMBS backed by home equity lines of credit (“HELOC”) and closed-end second mortgages (“CES”).
108
Table of Contents
MBIA Inc. and Subsidiaries
Notes to Consolidated Financial Statements
Note 6: Loss and Loss Adjustment Expense Reserves (continued)
The Roll Rates for 30-59 day delinquent loans and 60-89 day delinquent loans are calculated on a transaction-specific basis. The Company assumes that the Roll Rate for 90+ day delinquent loans, excluding foreclosures and Real Estate Owned (“REO”) is 95%. The Roll Rates are applied to the amounts in the respective delinquency buckets based on delinquencies as of November 30, 2014 to estimate future losses from loans that are delinquent as of the current reporting period.
Roll Rates for loans that are current as of November 30, 2014 (“Current Roll to Loss”) are also calculated on a transaction-specific basis. A proportion of loans reported current as of November 30, 2014 is assumed to become delinquent every month, at a Current Roll to Loss rate that persists at current levels for a time and subsequently starts to decline. A key assumption in the model is the period of time in which the Company projects current levels of Current Roll to Loss to persist. The three different scenarios, base, stress and additional stress, differ in the period of time for which the current levels of Current Roll to Loss rates persist. Loss reserves are calculated by using a weighted average of these three scenarios, with the majority of the probability assigned to the stress and additional stress scenarios where the current levels of Current Roll to Loss rates persist for six or eighteen months before reverting to historic levels.
In the base case scenario, the Company assumes that the Current Roll to Loss begins to decline immediately and continues to decline over the next six months to 25% of their levels as of November 30, 2014. For example, if the amount of current loans which become 30-59 days delinquent were 10%, and recent performance were to suggest that 30% of those loans will be charged-off, the Current Roll to Loss for the transaction is 3%. In the base case, the Current Roll to Loss will then reduce linearly to 25% of its original value over the next six months (i.e., 3% will linearly reduce to 0.75% over the six months from December 2014 to May 2015). After that six-month period in the base case scenario, the Company further reduces the loss to 0% by late 2015 with the expectation that the performing seasoned loans will eventually result in loan performance reverting to lower levels of default consistent with history. In the stress and additional stress case scenarios, the Current Roll to Loss trends persist for six months and eighteen months, respectively, before reverting to historic trends.
In addition, the Company considers borrower draw rates, voluntary prepayment rates and pool mortgage insurance, that primarily affect the excess spread generated by current loans, which offsets losses and results in reimbursements to the Company. The Company uses the twelve-month average voluntary prepayment rates and the six-month average loss severities to model its loss reserves. For HELOCs, the current three-month average draw rate is generally used to project future draws on the line. Projected cash flows are also based on an assumed constant basis spread between floating rate assets and floating rate insured debt obligations (the difference between Prime and London Interbank Offered Rate (“LIBOR”) interest rates, minus any applicable fees). For all transactions, cash flow models consider allocations and other structural aspects, including managed amortization periods, rapid amortization periods and claims against MBIA Corp.’s insurance policy consistent with such policy’s terms and conditions. The estimated net claims from the procedure above are then discounted using a risk-free rate to a net present value reflecting MBIA’s general obligation to pay claims over time and not on an accelerated basis. The above assumptions represent MBIA’s probability-weighted estimates of how transactions will perform over time.
As of December 31, 2014 and 2013, the Company established loss and LAE reserves totaling $70 million and $126 million, respectively, related to second-lien RMBS issues after the elimination of $21 million and $43 million, respectively, as a result of consolidating VIEs. For the year ended December 31, 2014, the Company incurred $70 million of losses and LAE recorded in earnings related to second-lien RMBS issues after the elimination of a $20 million expense as a result of consolidating VIEs.
The Company monitors portfolio performance on a monthly basis against projected performance, reviewing delinquencies, Roll Rates, and prepayment rates (including voluntary and involuntary). However, loan performance remains difficult to predict and losses may exceed expectations. In the event of a material deviation in actual performance from projected performance, the Company would increase or decrease the case basis reserves accordingly. If actual performance were to remain at the current levels for six additional months compared to the probability-weighted outcome currently used by the Company, the addition to the case basis reserves would be approximately $45 million.
109
Table of Contents
MBIA Inc. and Subsidiaries
Notes to Consolidated Financial Statements
Note 6: Loss and Loss Adjustment Expense Reserves (continued)
Second-lien RMBS Recoveries
The Company primarily records two types of recoveries related to insured second-lien RMBS exposures: “put-back” claims related to those mortgage loans whose inclusion in insured securitizations failed to comply with representations and warranties (“ineligible loans”) and excess spread that is generated from performing loans in the insured transactions.
Excess Spread
As of December 31, 2014 and 2013, the Company recorded estimated recoveries of $523 million and $681 million, respectively, for the reimbursement of past and future expected claims through excess spread in insured second-lien RMBS transactions after the elimination of $137 million and $190 million, respectively, as a result of consolidating VIEs. As of December 31, 2014, $496 million and $27 million were included in “Insurance loss recoverable” and “Loss and loss adjustment expense reserves” on the Company’s consolidated balance sheets, respectively, after the elimination of $132 million and $5 million in “Insurance loss recoverable” and in “Loss and loss adjustment expense reserves”, respectively, as a result of consolidating VIEs. As of December 31, 2013, $647 million and $34 million were included in “Insurance loss recoverable” and “Loss and loss adjustment expense reserves” on the Company’s consolidated balance sheets, respectively, after the elimination of $183 million and $7 million, respectively, as a result of consolidating VIEs.
Excess spread is generated by performing loans within insured second-lien RMBS securitizations and is the difference between interest inflows on mortgage loan collateral and interest outflows on insured beneficial interests. The amount of excess spread depends on the future loss trends (which include future delinquency trends, average time to charge-off delinquent loans, and the availability of pool mortgage insurance), the future spread between Prime and LIBOR interest rates; and borrower refinancing behavior which results in voluntary prepayments. Minor deviations in loss trends and voluntary prepayments may substantially impact the amounts collected from excess spread.
Voluntary prepayment rates generally increased for the year ended December 31, 2014. The use of these average voluntary prepayment rates in the loss projections resulted in a reduction in estimated recoveries.
Ineligible Mortgage Loans
To date, MBIA has settled the majority of the Company’s put-back claims. Only its claims against Credit Suisse remain outstanding. Settlement amounts have been consistent with the put-back recoveries previously included in the Company’s financial statements.
The contract claim remaining with Credit Suisse is related to the inclusion of ineligible mortgage loans in the 2007-2 Home Equity Mortgage Trust (“HEMT”) securitization. Credit Suisse has challenged the Company’s assessment of the ineligibility of individual mortgage loans and the dispute is the subject of litigation for which there is no assurance that the Company will prevail. Refer to “Note 21: Commitments and Contingencies” for additional information about the litigation against Credit Suisse.
As of December 31, 2014 and 2013, the Company recorded estimated recoveries of $379 million and $359 million, respectively, related to its Credit Suisse put-back claims, reflected in “Loan repurchase commitments” presented under the heading “Assets of consolidated variable interest entities” on the Company’s consolidated balance sheets.
The Company believes that it will prevail in enforcing its contractual put-back rights against Credit Suisse. Based on the Company’s assessment of the strength of these claims, its prior settlements with other sellers/servicers, and success of other monolines in litigation against other sellers/servicers, the Company believes it is entitled to collect the full amount of its incurred losses, which totaled $417 million through December 31, 2014. The Company is also entitled to collect interest on amounts paid; it believes that in context of its put-back litigation, the appropriate rate should be the New York State statutory rate. However, the Company currently calculates its put-back recoveries using the contractual interest rate, which is lower than the New York State statutory rate.
110
Table of Contents
MBIA Inc. and Subsidiaries
Notes to Consolidated Financial Statements
Note 6: Loss and Loss Adjustment Expense Reserves (continued)
Notwithstanding the foregoing, uncertainty remains with respect to the ultimate outcome of the litigation with Credit Suisse, which is contemplated in the scenario based-modeling the Company uses. The Credit Suisse recovery scenarios are based on the amount of incurred losses measured against certain probabilities of ultimate resolution of the dispute with Credit Suisse. Most of the probability weight is assigned to partial recovery scenarios and are discounted using the current risk-free discount rates associated with the underlying transaction’s cash flows.
The Company continues to consider all relevant facts and circumstances in developing its assumptions on expected cash inflows, probability of potential recoveries (including the outcome of litigation) and recovery period. The estimated amount and likelihood of potential recoveries are expected to be revised and supplemented to the extent there are developments in the pending litigation and/or changes to the financial condition of Credit Suisse. While the Company believes it will be successful in realizing its recoveries from its contract claims against Credit Suisse, the ultimate amounts recovered may be materially different from those recorded by the Company given the inherent uncertainty of the manner of resolving the claims (e.g., litigation) and the assumptions used in the required estimation process for accounting purposes which are based, in part, on judgments and other information that are not easily corroborated by historical data or other relevant benchmarks.
First-lien RMBS Reserves
The Company’s first-lien RMBS case basis reserves as of December 31, 2014, which primarily relate to RMBS backed by alternative A-paper and subprime mortgage loans, were determined using the Roll Rate Methodology. The Company assumes that the Roll Rate for loans in foreclosure, REO and bankruptcy are 90%, 90% and 75%, respectively. Roll Rates for current, 30-59 day delinquent loans, 60-89 day delinquent loans and 90+ day delinquent loans are calculated on a transaction-specific basis. The Current Roll to Loss rates stay at the November 30, 2014 level for one month before declining to 25% of this level over a 24-month period.
The Company estimates future losses by using three different probability-weighted scenarios: base; stress; and additional stress. The three scenarios differ in the Roll Rates to loss of 90+ day delinquent loans. In the base scenario, the Company uses deal-specific Roll Rates obtained from historic loan level Roll Rate data for 90+ day delinquent loans. In the stress scenario, the Company assumes a 90% Roll Rate for all 90+ day delinquent loans. In the additional stress scenario, the Roll Rates for each deal are an average of the deal-specific Roll Rate used in the base scenario and the 90% rate. The Roll Rates are applied to the amounts in each deal’s respective 90+ delinquency bucket based on delinquencies as of November 30, 2014 in order to estimate future losses from loans that are delinquent as of December 31, 2014.
In calculating ultimate cumulative losses for first-lien RMBS, the Company estimates the amount of loans that are expected to be liquidated through foreclosure or short sale. The time to liquidation for a defaulted loan is specific to the loan’s delinquency bucket, with the latest three-month average loss severities generally used to start the projection for trends in loss severities at loan liquidation. The loss severities are reduced over time to account for reduction in the amount of foreclosure inventory, anticipated future increases in home prices, principal amortization of the loan and government foreclosure moratoriums.
As of December 31, 2014, the Company established loss and LAE reserves totaling $263 million related to first-lien RMBS issues. As of December 31, 2013, the Company established loss and LAE reserves totaling $241 million related to first-lien RMBS issues after the elimination of $2 million as a result of consolidating VIEs. For the year ended December 31, 2014, the Company incurred $65 million of losses and LAE recorded in earnings related to first-lien RMBS issues after the elimination of a $2 million expense as a result of consolidating VIEs.
Multi-sector CDOs, CRE, and High Yield Corporate CDOs
MBIA’s insured multi-sector CDOs are transactions that include a variety of collateral ranging from corporate bonds to structured finance assets (which includes but are not limited to RMBS related collateral, ABS CDOs, corporate CDOs and collateralized loan obligations). These transactions were insured as either financial guarantee insurance policies or credit derivatives with the majority currently insured in the form of financial guarantees.
111
Table of Contents
MBIA Inc. and Subsidiaries
Notes to Consolidated Financial Statements
Note 6: Loss and Loss Adjustment Expense Reserves (continued)
MBIA’s insured CRE transactions comprise structured CMBS pools, CRE CDOs and CRE loan pools. The majority of this portfolio is accounted for as insured credit derivatives and carried at fair value in the Company’s consolidated financial statements. Refer to “Note 9: Derivative Instruments” for a further discussion of the Company’s use of derivatives and their impact on the Company’s consolidated financial statements. Since the Company’s insured credit derivatives have similar terms, conditions, risks, and economic profiles to its financial guarantee insurance policies, the Company evaluates them for impairment in the same way that it estimates loss and LAE for its financial guarantee policies.
MBIA’s high yield corporate CDO portfolio comprises middle-market/special-opportunity corporate loan transactions. These transactions were insured as financial guarantee insurance policies.
The following discussion provides information about the Company’s process for estimating reserves and credit impairments on these policies, determined as the present value of the probability-weighted potential future losses, net of estimated recoveries, across multiple scenarios.
The Company considers several factors when developing the range of potential outcomes and their impact on MBIA. The following approaches require substantial judgments about the future performance of each transaction:
| 1. | Each transaction is evaluated for its commutation potential, which is customized by counterparty and considers historical commutation prices, the level of dialogue with the counterparty and the credit quality and payment profile of the underlying exposure. |
| 2. | A range of loss scenarios is considered under different default and severity rates for each transaction’s collateral. |
The loss severities projected by these approaches vary widely. Actual losses will be a function of the proportion of collateral in the pools that default and the loss severities associated with those defaults.
As of December 31, 2014 and 2013, the Company established loss and LAE reserves totaling $111 million and $127 million, respectively, related to the total CDO financial guarantee insurance portfolio after the elimination of $225 million and $226 million, respectively, as a result of consolidating VIEs. For the year ended December 31, 2014, the Company incurred $33 million of losses and LAE recorded in earnings related to the total CDO financial guarantee insurance portfolio after the elimination of a $1 million benefit as a result of consolidating VIEs. In the event of further deteriorating performance of the collateral referenced or held in total CDO portfolio, the amount of losses estimated by the Company could increase substantially.
Loss and LAE Activity
Financial Guarantee Insurance Losses (Non-Derivative and Non-Consolidated VIEs)
The Company’s financial guarantee insurance losses and LAE, net of reinsurance for the years ended December 31, 2014, 2013 and 2012 are presented in the following table:
| Year Ended December 31, | ||||||||||||
| In millions |
2014 | 2013 | 2012 | |||||||||
| Second-lien RMBS |
$ | 70 | $ | (2) | $ | (151) | ||||||
| First-lien RMBS |
65 | (70) | 147 | |||||||||
| Other(1) |
(2) | 189 | 54 | |||||||||
|
|
|
|
|
|
|
|||||||
| Losses and LAE expense (benefit) |
$ | 133 | $ | 117 | $ | 50 | ||||||
|
|
|
|
|
|
|
|||||||
(1)—Includes ABS CDOs, CMBS, U.S. public finance and other issues.
112
Table of Contents
MBIA Inc. and Subsidiaries
Notes to Consolidated Financial Statements
Note 6: Loss and Loss Adjustment Expense Reserves (continued)
For 2014, the increase in losses and LAE expense, in the preceding table, compared with 2013 primarily related to increases in losses and LAE related to expected payments on insured first-lien RMBS and high yield corporate CDOs and decreases in recoveries of expected payments as a result of lower projected collections from excess spread within insured second-lien RMBS securitizations. Partially offsetting this increase in Loss and LAE were benefits related to a decrease in reserves on an international road transaction, decreases in losses and LAE related to expected payments on ABS CDOs and increases in recoveries of expected payments within insured first-lien RMBS securitizations.
For 2013, the increase in losses and LAE expense, in the preceding table, compared with 2012, primarily related to increases in losses on other issues related to an international road transaction and U.S. public finance transactions and a decrease in recoveries on insured second-lien RMBS transactions, partially offset by a benefit in first-lien RMBS transactions related to previously established reserves and decreases in CMBS and ABS CDO transactions.
Costs associated with remediating insured obligations assigned to the Company’s surveillance categories are recorded as LAE and included in “Losses and loss adjustment” expenses on the Company’s consolidated statements of operations. For the years ended December 31, 2014, 2013 and 2012, gross LAE related to remediating insured obligations were $36 million, $57 million and $137 million, respectively. Decreases in LAE are due to lower litigation expenses as a result of settlements.
The following table provides information about the financial guarantees and related claim liability included in each of MBIA’s surveillance categories as of December 31, 2014:
| Surveillance Categories | ||||||||||||||||||||
| $ in millions |
Caution List Low |
Caution List Medium |
Caution List High |
Classified List |
Total | |||||||||||||||
| Number of policies |
38 | 98 | 4 | 175 | 315 | |||||||||||||||
| Number of issues(1) |
18 | 7 | 3 | 119 | 147 | |||||||||||||||
| Remaining weighted average contract period (in years) |
7.2 | 12.0 | 10.1 | 7.0 | 7.7 | |||||||||||||||
| Gross insured contractual payments outstanding:(2) |
||||||||||||||||||||
| Principal |
$ | 1,757 | $ | 1,372 | $ | 133 | $ | 8,001 | $ | 11,263 | ||||||||||
| Interest |
696 | 819 | 68 | 3,037 | 4,620 | |||||||||||||||
|
|
|
|
|
|
|
|
|
|
|
|||||||||||
| Total |
$ | 2,453 | $ | 2,191 | $ | 201 | $ | 11,038 | $ | 15,883 | ||||||||||
|
|
|
|
|
|
|
|
|
|
|
|||||||||||
| Gross Claim Liability |
$ | — | $ | — | $ | — | $ | 850 | $ | 850 | ||||||||||
| Less: |
||||||||||||||||||||
| Gross Potential Recoveries |
— | — | — | 860 | 860 | |||||||||||||||
| Discount, net(3) |
— | — | — | 14 | 14 | |||||||||||||||
|
|
|
|
|
|
|
|
|
|
|
|||||||||||
| Net claim liability (recoverable) |
$ | — | $ | — | $ | — | $ | (24) | $ | (24) | ||||||||||
|
|
|
|
|
|
|
|
|
|
|
|||||||||||
| Unearned premium revenue |
$ | 63 | $ | 19 | $ | 5 | $ | 80 | $ | 167 | ||||||||||
(1)—An “issue” represents the aggregate of financial guarantee policies that share the same revenue source for purposes of making debt service payments.
(2)—Represents contractual principal and interest payments due by the issuer of the obligations insured by MBIA.
(3)—Represents discount related to Gross Claim Liability and Gross Potential Recoveries.
113
Table of Contents
MBIA Inc. and Subsidiaries
Notes to Consolidated Financial Statements
Note 6: Loss and Loss Adjustment Expense Reserves (continued)
The following table provides information about the financial guarantees and related claim liability included in each of MBIA’s surveillance categories as of December 31, 2013:
| Surveillance Categories | ||||||||||||||||||||
| $ in millions |
Caution List Low |
Caution List Medium |
Caution List High |
Classified List |
Total | |||||||||||||||
| Number of policies |
83 | 19 | 5 | 192 | 299 | |||||||||||||||
| Number of issues(1) |
26 | 14 | 4 | 136 | 180 | |||||||||||||||
| Remaining weighted average contract period (in years) |
11.0 | 4.9 | 11.5 | 9.5 | 9.7 | |||||||||||||||
| Gross insured contractual payments outstanding:(2) |
||||||||||||||||||||
| Principal |
$ | 5,290 | $ | 1,073 | $ | 40 | $ | 7,861 | $ | 14,264 | ||||||||||
| Interest |
3,829 | 253 | 24 | 4,526 | 8,632 | |||||||||||||||
|
|
|
|
|
|
|
|
|
|
|
|||||||||||
| Total |
$ | 9,119 | $ | 1,326 | $ | 64 | $ | 12,387 | $ | 22,896 | ||||||||||
|
|
|
|
|
|
|
|
|
|
|
|||||||||||
| Gross Claim Liability |
$ | — | $ | — | $ | — | $ | 1,235 | $ | 1,235 | ||||||||||
| Less: |
||||||||||||||||||||
| Gross Potential Recoveries |
— | — | — | 1,085 | 1,085 | |||||||||||||||
| Discount, net(3) |
— | — | — | 205 | 205 | |||||||||||||||
|
|
|
|
|
|
|
|
|
|
|
|||||||||||
| Net claim liability (recoverable) |
$ | — | $ | — | $ | — | $ | (55) | $ | (55) | ||||||||||
|
|
|
|
|
|
|
|
|
|
|
|||||||||||
| Unearned premium revenue |
$ | 112 | $ | 19 | $ | — | $ | 96 | $ | 227 | ||||||||||
(1)—An “issue” represents the aggregate of financial guarantee policies that share the same revenue source for purposes of making debt service payments.
(2)—Represents contractual principal and interest payments due by the issuer of the obligations insured by MBIA.
(3)—Represents discount related to Gross Claim Liability and Gross Potential Recoveries.
The gross claim liability in the preceding tables represents the Company’s estimate of undiscounted probability-weighted future claim payments. As of December 31, 2014, the gross claim liability primarily related to insured first and second-lien RMBS issues, high yield corporate CDOs and an international road transaction. As of December 31, 2013, the gross claim liability primarily related to insured first and second-lien RMBS issues, ABS CDOs and an international road transaction.
The gross potential recoveries represent the Company’s estimate of undiscounted probability-weighted recoveries of actual claim payments and recoveries of estimated future claim payments. As of December 31, 2014 and 2013, the gross potential recoveries principally related to insured second-lien RMBS and U.S. public finance issues. The Company’s recoveries have been, and remain based on either salvage rights, the rights conferred to MBIA through the transactional documents (inclusive of the insurance agreement), or subrogation rights embedded within financial guarantee insurance policies. Expected salvage and subrogation recoveries, as well as recoveries from other remediation efforts, reduce the Company’s claim liability. Once a claim payment has been made, the claim liability has been satisfied and MBIA’s right to recovery is no longer considered an offset to future expected claim payments, it is recorded as a salvage asset. The amount of recoveries recorded by the Company is limited to paid claims plus the present value of projected future claim payments. As claim payments are made, the recorded amount of potential recoveries may exceed the remaining amount of the claim liability for a given policy. The gross claim liability and gross potential recoveries reflect the elimination of claim liabilities and potential recoveries related to VIEs consolidated by the Company.
114
Table of Contents
MBIA Inc. and Subsidiaries
Notes to Consolidated Financial Statements
Note 6: Loss and Loss Adjustment Expense Reserves (continued)
The following table presents the components of the Company’s loss and LAE reserves and insurance loss recoverable as reported on the Company’s consolidated balance sheets as of December 31, 2014 and 2013 for insured obligations within MBIA’s “Classified List.” The loss reserves (claim liability) and insurance claim loss recoverable included in the following table represent the present value of the probability-weighted future claim payments and recoveries reported in the preceding tables.
| In millions |
As of December 31, 2014 |
As of December 31, 2013 |
||||||
| Loss reserves (claim liability) |
$ | 464 | $ | 580 | ||||
| LAE reserves |
42 | 61 | ||||||
|
|
|
|
|
|||||
| Loss and LAE reserves |
$ | 506 | $ | 641 | ||||
|
|
|
|
|
|||||
| Insurance claim loss recoverable |
$ | (533) | $ | (694) | ||||
| LAE insurance loss recoverable |
— | — | ||||||
|
|
|
|
|
|||||
| Insurance loss recoverable |
$ | (533) | $ | (694) | ||||
|
|
|
|
|
|||||
| Reinsurance recoverable on unpaid losses |
$ | 6 | $ | 7 | ||||
| Reinsurance recoverable on unpaid LAE reserves |
1 | 1 | ||||||
|
|
|
|
|
|||||
| Reinsurance recoverable on paid and unpaid losses |
$ | 7 | $ | 8 | ||||
|
|
|
|
|
|||||
As of December 31, 2014, loss and LAE reserves include $653 million of reserves for expected future payments, partially offset by expected recoveries of such future payments of $147 million. As of December 31, 2013, loss and LAE reserves included $847 million of reserves for expected future payments, partially offset by expected recoveries of such future payments of $206 million.
As of December 31, 2014 and 2013, the insurance loss recoverable primarily related to expected future recoveries on second-lien RMBS transactions resulting from excess spread generated by performing loans in such transactions. The decrease in insurance loss recoverable was primarily due to decreases in projected collections from excess spread within insured second-lien RMBS securitizations.
The following table presents the amounts of the Company’s second-lien RMBS exposure, gross undiscounted claim liability and potential recoveries related to non-consolidated VIEs and consolidated VIEs, included in the Company’s “Classified List,” as of December 31, 2014:
| Second-lien RMBS Exposure | Outstanding | Gross Undiscounted | ||||||||||||||
| In billions |
Gross Principal |
Gross Interest |
Claim Liability |
Potential Recoveries |
||||||||||||
| Non-consolidated VIEs |
$ | 2.9 | $ | 0.9 | $ | 0.1 | $ | 0.6 | ||||||||
| Consolidated VIEs |
$ | 1.5 | $ | 0.4 | $ | — | $ | 0.5 | ||||||||
115
Table of Contents
MBIA Inc. and Subsidiaries
Notes to Consolidated Financial Statements
Note 6: Loss and Loss Adjustment Expense Reserves (continued)
The following tables present changes in the Company’s loss and LAE reserves for the years ended December 31, 2014 and 2013. Changes in the loss reserves attributable to the accretion of the claim liability discount, changes in discount rates, changes in the timing and amounts of estimated payments and recoveries, changes in assumptions and changes in LAE reserves are recorded in “Losses and loss adjustment” expenses in the Company’s consolidated statements of operations. As of December 31, 2014 and 2013, the weighted average risk-free rate used to discount the Company’s loss reserves (claim liability) was 1.72% and 2.37%, respectively. LAE reserves are generally expected to be settled within a one-year period and are not discounted.
| In millions |
Changes in Loss and LAE Reserves for the Year Ended December 31, 2014 | |||||||||||||||||||||||||||||||
| Gross Loss and LAE Reserves as of December 31, 2013 |
Loss Payments for Cases with Reserves |
Accretion of Claim Liability Discount |
Changes in Discount Rates |
Changes in Assumptions |
Changes in Unearned Premium Revenue |
Changes in LAE Reserves |
Other(1) | Gross Loss and LAE Reserves as of December 31, 2014 |
||||||||||||||||||||||||
| $641 |
$ | (157) | $ | 14 | $ | 79 | $ | (35) | $ | 14 | $ | (19) | $ | (31) | $ | 506 | ||||||||||||||||
|
|
|
|
|
|
|
|
|
|
|
|
|
|
|
|
|
|
||||||||||||||||
(1)—Primarily changes in amount and timing of payments.
The decrease in the Company’s gross loss and LAE reserves reflected in the preceding table was primarily related to loss payments and changes in assumptions on ABS CDOs and an international road transaction. These were partially offset by increases in reserves due to changes in discount rates, primarily on ABS CDOs and insured first and second-lien RMBS issues outstanding as of December 31, 2013, and changes in assumptions related to high yield corporate CDOs.
| In millions |
Changes in Loss and LAE Reserves for the Year Ended December 31, 2013 | |||||||||||||||||||||||||||||||
| Gross
Loss |
Loss Payments for Cases with Reserves |
Accretion of Claim Liability Discount |
Changes in Discount Rates |
Changes in Assumptions |
Changes in Unearned Premium Revenue |
Changes in LAE Reserves |
Other(1) | Gross Loss and LAE Reserves as of December 31, 2013 |
||||||||||||||||||||||||
| $853 |
$ | (337) | $ | 13 | $ | (92) | $ | 141 | $ | 12 | $ | (2) | $ | 53 | $ | 641 | ||||||||||||||||
|
|
|
|
|
|
|
|
|
|
|
|
|
|
|
|
|
|
||||||||||||||||
(1)—Primarily changes in amount and timing of payments.
The decrease in the Company’s gross loss and LAE reserves reflected in the preceding table was primarily related to loss payments on insured first and second-lien RMBS and U.S. public finance issues, partially offset by changes in assumptions.
Current period changes in the Company’s estimate of potential recoveries may be recorded as an insurance loss recoverable asset, netted against the gross loss and LAE reserve liability, or both. The following tables present changes in the Company’s insurance loss recoverable and changes in recoveries on unpaid losses reported within the Company’s claim liability for the years ended December 31, 2014 and 2013. Changes in insurance loss recoverable attributable to the accretion of the discount on the recoverable, changes in discount rates, changes in amount and timing of estimated collections, changes in assumptions and changes in LAE recoveries are recorded in “Losses and loss adjustment” expenses in the Company’s consolidated statements of operations.
| As of December 31, 2013 |
Changes in Insurance Loss Recoverable and Recoveries on Unpaid Losses for the Year Ended December 31, 2014 |
As of December 31, 2014 |
||||||||||||||||||||||||||||||
| In millions |
Collections for Cases with Recoveries |
Accretion of Recoveries |
Changes in Discount Rates |
Changes in Assumptions |
Changes in LAE Recoveries |
Other(1) | ||||||||||||||||||||||||||
| Insurance loss recoverable |
$ | 694 | $ | (108) | $ | 13 | $ | 18 | $ | (77) | $ | — | $ | (7) | $ | 533 | ||||||||||||||||
| Recoveries on unpaid losses |
206 | — | 4 | 15 | (79) | 1 | — | 147 | ||||||||||||||||||||||||
|
|
|
|
|
|
|
|
|
|
|
|
|
|
|
|
|
|||||||||||||||||
| Total |
$ | 900 | $ | (108) | $ | 17 | $ | 33 | $ | (156) | $ | 1 | $ | (7) | $ | 680 | ||||||||||||||||
|
|
|
|
|
|
|
|
|
|
|
|
|
|
|
|
|
|||||||||||||||||
(1) Primarily changes in amount and timing of collections.
116
Table of Contents
MBIA Inc. and Subsidiaries
Notes to Consolidated Financial Statements
Note 6: Loss and Loss Adjustment Expense Reserves (continued)
The decrease in the Company’s insurance loss recoverable and recoveries on unpaid losses during 2014 was primarily due to collections associated with issues outstanding as of December 31, 2013, changes in assumptions due to lower LIBOR forward rates on second-lien RMBS issues and changes in assumptions on an international road transaction and U.S. public finance issues.
| Gross Reserve as of December 31, 2012 |
Changes in Insurance Loss Recoverable and Recoveries on Unpaid Losses for the Year Ended December 31, 2013 |
Gross Reserve as of December 31, 2013 |
||||||||||||||||||||||||||||||
| In millions |
Collections for Cases with Recoveries |
Accretion of Recoveries |
Changes in Discount Rates |
Changes in Assumptions |
Changes in LAE Recoveries |
Other(1) | ||||||||||||||||||||||||||
| Insurance loss recoverable |
$ | 3,648 | $ | (3,011) | $ | 19 | $ | (33) | $ | 126 | $ | (38) | $ | (17) | $ | 694 | ||||||||||||||||
| Recoveries on unpaid losses |
332 | — | 6 | (38) | (91) | (3) | — | 206 | ||||||||||||||||||||||||
|
|
|
|
|
|
|
|
|
|
|
|
|
|
|
|
|
|||||||||||||||||
| Total |
$ | 3,980 | $ | (3,011) | $ | 25 | $ | (71) | $ | 35 | $ | (41) | $ | (17) | $ | 900 | ||||||||||||||||
|
|
|
|
|
|
|
|
|
|
|
|
|
|
|
|
|
|||||||||||||||||
(1) Primarily changes in amount and timing of collections.
The Company’s insurance loss recoverable decreased during 2013 primarily due to recoveries associated with issues outstanding as of December 31, 2012, which related to a settlement on the ineligible mortgage loans included in insured second-lien residential mortgage securitization exposures that were subject to contractual obligations by sellers/servicers to repurchase or replace such mortgages. Recoveries on unpaid losses decreased primarily due to changes in assumptions as a result of the reduction of excess spread related to first and second-lien RMBS transactions and changes in discount rates.
Note 7: Fair Value of Financial Instruments
Fair Value Measurement
Fair value is a market-based measurement considered from the perspective of a market participant. Therefore, even when market assumptions are not readily available, the Company’s own assumptions are set to reflect those which it believes market participants would use in pricing an asset or liability at the measurement date. The fair value measurement of financial instruments held or issued by the Company are determined through the use of observable market data when available. Market data is obtained from a variety of third-party sources, including dealer quotes. If dealer quotes are not available for an instrument that is infrequently traded, the Company uses alternate valuation methods, including either dealer quotes for similar instruments or modeling using market data inputs.
The use of alternate valuation methods generally requires considerable judgment in the application of estimates and assumptions and changes to such estimates and assumptions may produce materially different fair values.
The accounting guidance for fair value measurement establishes a hierarchy for inputs used in measuring fair value that maximizes the use of observable inputs and minimizes the use of unobservable inputs by requiring that the most observable inputs be used when available and reliable. Observable inputs are those the Company believes that market participants would use in pricing an asset or liability based on available market data. Unobservable inputs are those that reflect the Company’s beliefs about the assumptions market participants would use in pricing an asset or liability based on available information. The fair value hierarchy is categorized into three levels based on the observability and reliability of inputs, as follows:
| • | Level 1—Valuations based on quoted prices in active markets for identical assets or liabilities that the Company can access. Valuations are based on quoted prices that are readily and regularly available in an active market, with significant trading volumes. |
| • | Level 2—Valuations based on quoted prices in markets that are not active or for which all significant inputs are observable, either directly or indirectly. Level 2 assets include debt securities with quoted prices that are traded less frequently than exchange-traded instruments, securities which are priced using observable inputs and derivative contracts whose values are determined using a pricing model with inputs that are observable in the market or can be derived principally from or corroborated by observable market data. |
117
Table of Contents
MBIA Inc. and Subsidiaries
Notes to Consolidated Financial Statements
Note 7: Fair Value of Financial Instruments (continued)
| • | Level 3—Valuations based on inputs that are unobservable and supported by little or no market activity and that are significant to the overall fair value measurement. Level 3 assets and liabilities include financial instruments whose value is determined using pricing models, discounted cash flow methodologies, or similar techniques where significant inputs are unobservable, as well as instruments for which the determination of fair value requires significant management judgment or estimation. |
The availability of observable inputs can vary from financial instrument to financial instrument and period to period and is affected by a wide variety of factors, including, for example, the type of product, whether the product is new and not yet established in the marketplace, and other characteristics particular to the product. In certain cases, the inputs used to measure fair value may fall into different levels of the fair value hierarchy. In such cases, the Company assigns the level in the fair value hierarchy for which the fair value measurement in its entirety falls, based on the least observable input that is significant to the fair value measurement.
Financial Assets (excluding derivative assets)
Financial assets, excluding derivative assets, held by the Company primarily consist of investments in debt securities. Substantially all of the Company’s investments are priced by independent third parties, including pricing services and brokers. Typically, the Company receives one pricing service value or broker quote for each instrument, which represents a non-binding indication of value. The Company reviews the assumptions, inputs and methodologies used by pricing services and brokers to obtain reasonable assurance that the prices used in its valuations reflect fair value. When the Company believes a third-party quotation differs significantly from its internally developed expectation of fair value, whether higher or lower, the Company reviews its data or assumptions with the provider. This review includes comparing significant assumptions such as prepayment speeds, default ratios, forward yield curves, credit spreads and other significant quantitative inputs to internal assumptions, and working with the price provider to reconcile the differences. The price provider may subsequently provide an updated price. In the event that the price provider does not update its price, and the Company still does not agree with the price provided, the Company will obtain a price from another third-party provider or use an internally developed price which it believes represents the fair value of the investment. The fair values of investments for which internal prices were used were not significant to the aggregate fair value of the Company’s investment portfolio as of December 31, 2014 or 2013. All challenges to third-party prices are reviewed by staff of the Company with relevant expertise to ensure reasonableness of assumptions.
Financial Liabilities (excluding derivative liabilities)
Financial liabilities, excluding derivative liabilities, issued by the Company primarily consist of investment agreements, MTNs and debt issued for general corporate purposes within its corporate segment, debt in VIEs and warrants. Investment agreements, MTNs, and corporate debt are typically recorded at face value adjusted for premiums or discounts. The majority of the financial liabilities that the Company has elected to fair value or that require fair value reporting or disclosures are valued based on the estimated value of the underlying collateral, the Company’s or a third-party’s estimate of discounted cash flow model estimates, or quoted market values for similar products. These valuations include adjustments for expected nonperformance risk of the Company.
Derivative Liabilities
The Company’s derivative liabilities are primarily insured credit derivatives that reference structured pools of cash securities and CDSs. The Company generally insured the most senior liabilities of such transactions, and at the inception of transactions its exposure generally had more subordination than needed to achieve triple-A ratings from credit rating agencies. The types of collateral underlying its insured derivatives consist of cash securities and CDSs referencing primarily corporate obligations, ABS, RMBS, CMBS, CRE loans, and CDOs.
118
Table of Contents
MBIA Inc. and Subsidiaries
Notes to Consolidated Financial Statements
Note 7: Fair Value of Financial Instruments (continued)
The Company’s insured credit derivative contracts are non-traded structured credit derivative transactions. Since insured derivatives are highly customized and there is generally no observable market for these derivatives, the Company estimates their fair values in a hypothetical market based on internal and third-party models simulating what a similar company would charge to assume the Company’s position in the transaction at the measurement date. This pricing would be based on the expected loss of the exposure. The Company reviews its valuation model results on a quarterly basis to assess the appropriateness of the assumptions and results in light of current market activity and conditions. This review is performed by internal staff with relevant expertise. If live market spreads or securities prices are observable for similar transactions, those spreads are an integral part of the analysis. New insured transactions that resemble existing (previously insured) transactions, if any, would be considered, as well as negotiated settlements of existing transactions.
The Company may from time to time make changes in its valuation techniques if the change results in a measurement that it believes is equally or more representative of fair value under current circumstances.
Internal Review Process
All significant financial assets and liabilities are reviewed by committees created by the Company to ensure compliance with the Company’s policies and risk procedures in the development of fair values of financial assets and liabilities. These valuation committees review, among other things, key assumptions used for internally developed prices, significant changes in sources and uses of inputs, including changes in model approaches, and any adjustments from third-party inputs or prices to internally developed inputs or prices. The committees also review any significant impairment or improvements in fair values of the financial instruments from prior periods. From time to time, these committees will consult with the Company’s valuation experts to better understand key methods and assumptions used for the determination of fair value, including understanding significant changes in fair values. These committees are comprised of senior finance team members with the relevant experience in the financial instruments their committee is responsible for. For each quarter, these committees document their agreement with the fair values developed by management of the Company as reported in the quarterly and annual financial statements.
Valuation Techniques
Valuation techniques for financial instruments measured at fair value or disclosed at fair value are described below.
Fixed-Maturity Securities (including short-term investments) Held as Available-For-Sale, Investments Carried at Fair Value, Investments Pledged as Collateral, Investments Held-to-Maturity, and Other Investments
These investments include investments in U.S. Treasury and government agencies, state and municipal bonds, foreign governments, corporate obligations, MBS, ABS, money market securities, and perpetual debt and equity securities.
These investments are generally valued based on recently executed transaction prices or quoted market prices. When quoted market prices are not available, fair value is generally determined using quoted prices of similar investments or a valuation model based on observable and unobservable inputs. Inputs vary depending on the type of investment. Observable inputs include contractual cash flows, interest rate yield curves, CDS spreads, prepayment and volatility scores, diversity scores, cross-currency basis index spreads, and credit spreads for structures similar to the financial instrument in terms of issuer, maturity and seniority. Unobservable inputs include cash flow projections and the value of any credit enhancement.
The fair value of the HTM investments is determined using discounted cash flow models. Key inputs include unobservable cash flows projected over the expected term of the investment discounted using observable interest rate yield curves of similar securities.
119
Table of Contents
MBIA Inc. and Subsidiaries
Notes to Consolidated Financial Statements
Note 7: Fair Value of Financial Instruments (continued)
Investments based on quoted market prices of identical investments in active markets are classified as Level 1 of the fair value hierarchy. Level 1 investments generally consist of U.S. Treasury and government agency, foreign government and money market investments. Quoted market prices of investments in less active markets, as well as investments which are valued based on other than quoted prices for which the inputs are observable, such as interest rate yield curves, are categorized in Level 2 of the fair value hierarchy. Investments that contain significant inputs that are not observable are categorized as Level 3.
Cash and Cash Equivalents, Receivable for Investments Sold, Net Cash Collateral Pledged to Swap Counterparties, Payable for Investments Purchased, Payable for Loans Purchased and Accrued Investment Income
The carrying amounts of cash and cash equivalents, receivable for investments sold, net cash collateral pledged to swap counterparties, payable for investments purchased, payable for loans purchased, and accrued investment income approximate fair values due to the short-term nature and credit worthiness of these instruments. These items are categorized in Level 1 or Level 2 of the fair value hierarchy.
Loans Receivable at Fair Value
Loans receivable at fair value are comprised of loans held by consolidated VIEs consisting of corporate and residential mortgage loans. Fair values of commercial loans are obtained from a pricing service and determined using actively quoted prices obtained from multiple market participants. Fair values of residential mortgage loans are determined using quoted prices for MBS issued by the respective VIE and adjustments for the fair values of the financial guarantees provided by MBIA Corp. on the related MBS. Loans receivable at fair value are categorized in Level 2 or Level 3 of the fair value hierarchy based on the input that is significant to the fair value measurement in its entirety.
Loan Repurchase Commitments
Loan repurchase commitments are obligations owed by the sellers/servicers of mortgage loans to either MBIA as reimbursement of paid claims or to the RMBS trusts as defined in the transaction documents. Loan repurchase commitments are assets of the consolidated VIEs. This asset represents the rights of MBIA against the sellers/servicers for breaches of representations and warranties that the securitized residential mortgage loans sold to the trust to comply with stated underwriting guidelines and for the sellers/servicers to cure, replace, or repurchase mortgage loans. Fair value measurements of loan repurchase commitments represent the amounts owed by the sellers/servicers to MBIA as reimbursement of paid claims. Loan repurchase commitments are not securities and no quoted prices or comparable market transaction information are observable or available. Loan repurchase commitments at fair value are categorized in Level 3 of the fair value hierarchy. Fair values of loan repurchase commitments are determined using discounted cash flow techniques based on inputs including:
| • | breach rates representing the rate at which the sellers/servicers failed to comply with stated representations and warranties; |
| • | recovery rates representing the estimates of future cash flows for the asset, including estimates about possible variations in the amount of cash flows expected to be collected; |
| • | expectations about possible variations in the timing of collections of the cash flows; and |
| • | time value of money, represented by the rate on risk-free monetary assets. |
Investment Agreements
The fair values of investment agreements are determined using discounted cash flow techniques based on contractual cash flows and observable interest rates currently being offered for similar agreements with comparable maturity dates. Investment agreements contain collateralization and termination agreements that substantially mitigate the nonperformance risk of the Company. As the terms of the notes are private, and the timing and amount of contractual cash flows are not observable, these investment agreements are categorized as Level 3 of the fair value hierarchy.
120
Table of Contents
MBIA Inc. and Subsidiaries
Notes to Consolidated Financial Statements
Note 7: Fair Value of Financial Instruments (continued)
Medium-Term Notes
The fair values of certain MTNs are based on quoted market prices provided by third-party sources, where available. When quoted market prices are not available, the Company applies a matrix pricing grid based on the quoted market prices received and the MTNs’ stated maturity and interest rate to determine fair value. Nonperformance risk is included in the quoted market prices and the matrix pricing grid. The Company has elected to record these MTNs at fair value as they contain embedded derivatives which cannot accurately be separated from the host debt instrument and fair valued separately, therefore, these MTNs are carried at fair value with changes in fair value reflected in earnings. The remaining MTNs, which are not carried at fair value, do not contain embedded derivatives. As these MTNs are illiquid and the prices reflect significant unobservable inputs, they are categorized as Level 3 of the fair value hierarchy.
Long-term Debt
Long-term debt consists of notes, debentures, surplus notes and accrued interest on this debt. The fair value of long-term notes, debentures and surplus notes are estimated based on quoted prices for the identical or similar securities. The fair value of the accrued interest expense on the surplus notes due in 2033 is determined based on the scheduled interest payments discounted by the market’s perception of the credit risk related to the repayment of the surplus notes. The credit risk related to the repayment of the surplus notes is based on recent trades of the surplus notes. The deferred interest payment will be due on the first business day on or after which the Company obtains approval to make such payment.
The carrying amounts of accrued interest expense on all other long-term debt approximate fair value due to the short-term nature of these instruments. Long-term debt is categorized as Level 2 of the fair value hierarchy.
Variable Interest Entity Notes
The fair values of VIE notes are determined based on recently executed transaction prices or quoted prices where observable. When position-specific quoted prices are not observable, fair values are based on quoted prices of similar securities. Fair values based on quoted prices of similar securities may be adjusted for factors unique to the securities, including any credit enhancement. When observable quoted prices are not available, fair value is determined based on discounted cash flow techniques of the underlying collateral using observable and unobservable inputs. Observable inputs include interest rate yield curves and bond spreads of similar securities. Unobservable inputs include the value of any credit enhancement. VIE notes are categorized in Level 2 or Level 3 of the fair value hierarchy based on the lowest level input that is significant to the fair value measurement in its entirety.
Variable Interest Entity Derivatives
The VIEs have entered into derivative transactions consisting of cross currency swaps and interest rate caps. Fair values of OTC derivatives are determined using valuation models based on observable and/or unobservable inputs. These observable and market-based inputs include interest rates and volatilities. These derivatives are categorized in Level 2 or Level 3 of the fair value hierarchy based on the input that is significant to the fair value measurement in its entirety.
Derivatives
The corporate segment has entered into derivative transactions primarily consisting of interest rate swaps. Fair values of OTC derivatives are determined using valuation models based on observable inputs, nonperformance risk of the Company’s own credit and nonperformance risk of the counterparties. Observable and market-based inputs include interest rate yields, credit spreads and volatilities. These derivatives are categorized in Level 2 or Level 3 of the fair value hierarchy based on the lowest level input that is significant to the fair value measurement in its entirety.
121
Table of Contents
MBIA Inc. and Subsidiaries
Notes to Consolidated Financial Statements
Note 7: Fair Value of Financial Instruments (continued)
The Company has policies and procedures in place regarding counterparties, including review and approval of the counterparty and the Company’s exposure limit, collateral posting requirements, collateral monitoring and margin calls on collateral. The Company manages counterparty credit risk on an individual counterparty basis through master netting agreements covering derivative transactions in the corporate segment as of December 31, 2014. These agreements allow the Company to contractually net amounts due from a counterparty with those amounts due to such counterparty when certain triggering events occur. The Company only executes swaps under master netting agreements, which typically contain mutual credit downgrade provisions that generally provide the ability to require assignment or termination in the event either the Company or the counterparty is downgraded below a specified credit rating. The netting agreements minimize the potential for losses related to credit exposure and thus serve to mitigate the Company’s nonperformance risk under these derivatives.
In certain cases, the Company also manages credit risk through collateral agreements that give the Company the right to hold or the obligation to provide collateral when the current market value of derivative contracts exceeds an exposure threshold. Under these agreements, the Company may provide U.S. Treasury and other highly rated securities or cash to secure the derivative. The delivery of high-quality collateral can minimize credit exposure and mitigate the potential for nonperformance risk impacting the fair values of the derivatives.
Derivatives—Insurance
The derivative contracts insured by the Company cannot be legally traded and generally do not have observable market prices. The Company determines the fair values of insured credit derivatives using valuation models. The valuation models are consistently applied from period to period, with refinements to the fair value estimation approach being applied as and when the information becomes available. Negotiated settlements are also considered when determining fair value to validate the fair value estimates determined by the valuation models and to determine the best available estimate of fair value from the perspective of a market participant.
Approximately 93% of the balance sheet fair value of insured credit derivatives as of December 31, 2014 was valued based on the Binomial Expansion Technique (“BET”) Model. Approximately 7% of the balance sheet fair value of insured credit derivatives as of December 31, 2014 was valued based on the internally developed Direct Price Model and the Dual Default model. The valuation of insured derivatives includes the impact of its credit standing. All of these derivatives are categorized as Level 3 of the fair value hierarchy as their fair value is derived using significant unobservable inputs.
The Company has also entered into a derivative contract as a result of a commutation. The fair value of the derivative is determined using a discounted cash flow model. Key inputs include unobservable cash flows projected over the expected term of the derivative, discounted using observable discount rates and CDS spreads.
Description of the BET Model
Valuation Model Overview
The Company uses the BET Model to estimate what a bond insurer would charge to guarantee a transaction at the measurement date, based on the market-implied default risk of the underlying collateral and the remaining structural protection in a deductible or subordination.
Inputs to the process of determining fair value for structured transactions using the BET Model include estimates of collateral loss, allocation of loss to separate tranches of the capital structure, and calculation of the change in value.
122
Table of Contents
MBIA Inc. and Subsidiaries
Notes to Consolidated Financial Statements
Note 7: Fair Value of Financial Instruments (continued)
Model Strengths and Weaknesses
The primary strengths of the BET Model:
| • | The model takes account of transaction structure and key drivers of fair value. Transaction structure includes par insured, weighted average life, level of deductible or subordination (if any), and composition of collateral. |
| • | The model is a consistent approach to marking positions that minimizes the level of subjectivity. The Company has also developed a hierarchy for usage of various market-based spread inputs that reduces the level of subjectivity, especially during periods of high illiquidity. |
| • | The model uses market-based inputs including credit spreads for underlying reference collateral, recovery rates specific to the type and credit rating of reference collateral, diversity score of the entire collateral pool, and MBIA’s CDS and derivative recovery rate level. |
The primary weaknesses of the BET Model:
| • | As of December 31, 2014, some of the model inputs were either unobservable or derived from illiquid markets which might adversely impact the model’s reliability. |
| • | The BET Model requires an input for collateral spreads. However, some securities are quoted only in price terms. For securities that trade substantially below par, the calculation of spreads from price to spread can be subjective. |
| • | Results may be affected by using average spreads and a single diversity factor, rather than using specific spreads for each piece of underlying collateral and collateral-specific correlations. |
BET Model Inputs
a. Credit spreads
The average spread of collateral is a key input as the Company assumes credit spreads reflect the market’s assessment of default probability. Collateral assets are generally considered on an average basis rather than being modeled on an individual basis. Spreads are obtained from market data sources published by third parties (e.g., dealer spread tables for assets most closely resembling collateral within the Company’s transactions) as well as collateral-specific spreads on the underlying reference obligations provided by trustees or market sources. The Company also calculates spreads based on quoted prices and on internal assumptions about expected life, when pricing information is available and spread information is not.
Over time, the data inputs change as new sources become available, existing sources are discontinued or are no longer considered to be reliable or the most appropriate. It is the Company’s preference to use more observable spread inputs defined above. However, the Company may on occasion move to less observable spread inputs due to the discontinuation of data sources or due to the Company considering certain spread inputs no longer representative of market spreads.
b. Diversity Scores
Diversity scores are a means of estimating the diversification in a portfolio. The diversity score estimates the number of uncorrelated assets that are assumed to have the same loss distribution as the actual portfolio of correlated assets. While diversity score is a required input into the BET model, due to current high levels of default within the collateral of the structures, diversity score does not have a significant impact on valuation.
123
Table of Contents
MBIA Inc. and Subsidiaries
Notes to Consolidated Financial Statements
Note 7: Fair Value of Financial Instruments (continued)
c. Recovery Rate
The recovery rate represents the percentage of par expected to be recovered after an asset defaults, indicating the severity of a potential loss. MBIA generally uses rating agency recovery assumptions which may be adjusted to account for differences between the collateral used by the rating agencies and the actual collateral in MBIA-insured transactions. The Company may also adjust rating agency assumptions based on the performance of the collateral manager and on empirical market data.
d. Nonperformance Risk
The Company’s valuation methodology for insured credit derivative liabilities incorporates MBIA Corp.’s own nonperformance risk. The Company calculates the fair value by discounting the market value loss estimated through the BET Model at discount rates which include MBIA Corp.’s CDS spreads as of December 31, 2014. The CDS spreads assigned to each deal are based on the weighted average life of the deal. The Company limits the nonperformance impact so that the derivative liability could not be lower than MBIA Corp.’s recovery derivative price multiplied by the unadjusted derivative liability.
Overall Model Results
As of December 31, 2014 and 2013, the Company’s net insured CDS derivative liability was $244 million and $1.2 billion, respectively, based on the results of the aforementioned models. A significant driver of changes in fair value is MBIA Corp.’s nonperformance risk. In aggregate, the nonperformance calculation resulted in a pre-tax net insured derivative liability that was $92 million and $394 million lower than the net liability that would have been estimated if MBIA Corp. excluded nonperformance risk in its valuation as of December 31, 2014 and 2013, respectively. Nonperformance risk is a fair value concept and does not contradict MBIA Corp.’s internal view, based on fundamental credit analysis of MBIA Corp.’s economic condition, that MBIA Corp. will be able to pay all claims when due.
Warrants
Stock warrants issued by the Company are valued using the Black-Scholes model and are recorded at fair value. Inputs into the warrant valuation include the Company’s stock price, a volatility parameter, interest rates, and dividend data. As all significant inputs are market-based and observable, warrants are categorized as Level 2 of the fair value hierarchy.
Facility
In the fourth quarter of 2013, the Company approved and initiated a plan to sell its Armonk, New York facility. As a result, the facility was classified as held for sale as of December 31, 2014 and 2013 and presented within “Assets held for sale” on the Company’s consolidated balance sheets and measured at the lower of its carrying value or its fair value less cost to sell. The fair market value was estimated based on an independent third-party appraisal. This item is categorized as Level 2 of the fair value hierarchy.
Financial Guarantees
Gross Financial Guarantees—The fair value of gross financial guarantees is determined using discounted cash flow techniques based on inputs that include (i) assumptions of expected losses on financial guarantee policies where loss reserves have not been recognized, (ii) amount of losses expected on financial guarantee policies where loss reserves have been established, net of expected recoveries, (iii) the cost of capital reserves required to support the financial guarantee liability, (iv) operating expenses, and (v) discount rates. The MBIA Corp. CDS spread and recovery rate are used as the discount rate for MBIA Corp., while the CDS spread and recovery rate of a similar municipal bond insurance company are used as the discount rate for National, as National does not have a published CDS spread and recovery rate.
124
Table of Contents
MBIA Inc. and Subsidiaries
Notes to Consolidated Financial Statements
Note 7: Fair Value of Financial Instruments (continued)
The carrying value of the Company’s gross financial guarantees consists of unearned premium revenue and loss and LAE reserves, net of the insurance loss recoverable as reported on MBIA’s consolidated balance sheets.
Ceded Financial Guarantees—The fair value of ceded financial guarantees is determined by applying the percentage ceded to reinsurers to the related fair value of the gross financial guarantees. The carrying value of ceded financial guarantees consists of prepaid reinsurance premiums and reinsurance recoverable on paid and unpaid losses as reported within “Other assets” on the Company’s consolidated balance sheets.
Significant Unobservable Inputs
The following tables provide quantitative information regarding the significant unobservable inputs used by the Company for assets and liabilities measured at fair value on a recurring basis as of December 31, 2014 and 2013. These tables exclude inputs used to measure fair value that are not developed by the Company, such as broker prices and other third-party pricing service valuations.
| In millions |
Fair Value as of December 31, 2014 |
Valuation Techniques |
Unobservable Input |
Range (Weighted Average) |
||||||||
| Assets of consolidated VIEs: |
||||||||||||
| Loans receivable at fair value |
$ | 1,431 | Market prices adjusted for financial guarantees provided to VIE obligations | Impact of financial guarantee | 0%—10%(2%) | |||||||
| Loan repurchase commitments |
379 | Discounted cash flow | Recovery rates(1) | |||||||||
| Breach rates(1) |
||||||||||||
| Liabilities of consolidated VIEs: |
||||||||||||
| Variable interest entity notes |
735 | Market prices of VIE assets adjusted for financial guarantees provided | Impact of financial guarantee | 0%—35%(16%) | ||||||||
| Credit derivative liabilities, net: |
||||||||||||
| CMBS |
224 | BET Model | Recovery rates | 25%—90%(59%) | ||||||||
| Nonperformance risk |
12%—29%(25%) | |||||||||||
| Weighted average life (in years) |
1.3—3.2(2.3) | |||||||||||
| CMBS spreads | 0%—41%(19%) | |||||||||||
| Multi-sector CDO |
9 | Direct Price Model | Nonperformance risk | 53%—53%(53%) | ||||||||
| Other |
11 | BET Model and Dual Default | Recovery rates | 42%—45%(45%) | ||||||||
| Nonperformance risk |
41%—51%(50%) | |||||||||||
| Weighted average life (in years) |
0.2—7.9(1.1) | |||||||||||
| Other derivative liabilities |
24 | Discounted cash flow |
Cash flows |
$ | 0—$83($42)(2) | |||||||
(1)—Recovery rates and breach rates include estimates about potential variations in the outcome of litigation with a counterparty.
(2)—Midpoint of cash flows are used for the weighted average.
125
Table of Contents
MBIA Inc. and Subsidiaries
Notes to Consolidated Financial Statements
Note 7: Fair Value of Financial Instruments (continued)
| In millions |
Fair Value as of December 31, 2013 |
Valuation Techniques |
Unobservable Input |
Range (Weighted Average) |
||||||||
| Assets of consolidated VIEs: |
||||||||||||
| Loans receivable at fair value |
$ | 1,612 | Market prices adjusted for financial guarantees provided to VIE obligations | Impact of financial guarantee | 0%—17%(3%) | |||||||
| Loan repurchase commitments |
359 | Discounted cash flow | Recovery rates(1) | |||||||||
| Breach rates(1) |
||||||||||||
| Liabilities of consolidated VIEs: |
||||||||||||
| Variable interest entity notes |
940 | Market prices of VIE assets adjusted for financial guarantees provided | Impact of financial guarantee | 0%—25%(12%) | ||||||||
| Credit derivative liabilities, net: |
||||||||||||
| CMBS |
1,050 | BET Model | Recovery rates | 25%—90%(60%) | ||||||||
| Nonperformance risk |
8%—57%(25%) | |||||||||||
| Weighted average life (in years) |
1.1-28.0(3.3) | |||||||||||
| CMBS spreads | 1%—29%(13%) | |||||||||||
| Multi-sector CDO |
12 | Direct Price Model | Nonperformance risk | 57%-57%(57%) | ||||||||
| Other |
85 | BET Model and Dual Default | Recovery rates | 42%-90%(45%) | ||||||||
| Nonperformance risk |
13%—54%(25%) | |||||||||||
| Weighted average life (in years) |
0.2—8.7(2.3) | |||||||||||
(1)—Recovery rates and breach rates include estimates about potential variations in the outcome of litigation with a counterparty.
Sensitivity of Significant Unobservable Inputs
The significant unobservable input used in the fair value measurement of the Company’s loans receivable at fair value of consolidated VIEs is the impact of the financial guarantee. The fair value of loans receivable is calculated by subtracting the value of the financial guarantee from the market value of VIE liabilities. The value of a financial guarantee is estimated by the Company as the present value of expected cash payments under the policy. As expected cash payments provided by the Company under the insurance policy increase, there is a lower expected cash flow on the underlying loans receivable of the VIE. This results in a lower fair value of the loans receivable in relation to the obligations of the VIE.
The significant unobservable inputs used in the fair value measurement of the Company’s loan repurchase commitments of consolidated VIEs are the recovery rates and breach rates. Recovery rates reflect the estimates of future cash flows reduced for litigation delays and risks and/or potential financial distress of the sellers/servicers. The estimated recoveries of the loan repurchase commitments may differ from the actual recoveries that may be received in the future. Breach rates represent the rate at which mortgages fail to comply with stated representations and warranties of the sellers/servicers. Significant increases or decreases in the recovery rates and the breach rates would result in significantly higher or lower fair values of the loan repurchase commitments, respectively. Additionally, changes in the legal environment and the ability of the counterparties to pay would impact the recovery rate assumptions, which could significantly impact the fair value measurement. Any significant challenges by the counterparties to the Company’s determination of breaches of representations and warranties could significantly adversely impact the fair value measurement. Recovery rates and breach rates are determined independently. Changes in one input will not necessarily have any impact on the other input.
126
Table of Contents
MBIA Inc. and Subsidiaries
Notes to Consolidated Financial Statements
Note 7: Fair Value of Financial Instruments (continued)
The significant unobservable input used in the fair value measurement of the Company’s VIE notes of consolidated VIEs is the impact of the financial guarantee. The fair value of VIE notes is calculated by adding the value of the financial guarantee to the market value of VIE assets.
The value of a financial guarantee is estimated by the Company as the present value of expected cash payments under the policy. As the value of the guarantee provided by the Company to the obligations issued by the VIE increases, the credit support adds value to the liabilities of the VIE. This results in an increase in the fair value of the liabilities of the VIE.
The significant unobservable inputs used in the fair value measurement of MBIA Corp.’s CMBS credit derivatives, which are valued using the BET Model, are CMBS spreads, recovery rates, nonperformance risk and weighted average life. The CMBS spread is an indicator of credit risk of the collateral securities. The recovery rate represents the percentage of notional expected to be recovered after an asset defaults, indicating the severity of a potential loss. The nonperformance risk is an assumption of MBIA Corp.’s own ability to pay and whether MBIA Corp. will have the necessary resources to pay the obligations as they come due. Weighted average life is based on the Company’s estimate of when the principal of the underlying collateral of the CMBS structure will be repaid. A significant increase or decrease in CMBS spreads would result in an increase or decrease in the fair value of the derivative liability, respectively. A significant increase in weighted average life can result in an increase or decrease in the fair value of the derivative liability, depending on the discount rate and the timing of significant losses. Any significant increase or decrease in recovery rates, or MBIA Corp.’s nonperformance risk would result in a decrease or increase in the fair value of the derivative liabilities, respectively. CMBS spreads, recovery rates, nonperformance risk and weighted average lives are determined independently. Changes in one input will not necessarily have any impact on the other inputs.
The significant unobservable input used in the fair value measurement of MBIA Corp.’s multi-sector CDO credit derivatives, which are valued using the Direct Price Model, is nonperformance risk. The nonperformance risk is an assumption of MBIA Corp.’s own ability to pay and whether MBIA Corp. will have the necessary resources to pay the obligations as they come due. Any significant increase or decrease in MBIA Corp.’s nonperformance risk would result in a decrease or increase in the fair value of the derivative liabilities, respectively.
The significant unobservable inputs used in the fair value measurement of MBIA Corp.’s other credit derivatives, which are valued using the BET Model and Dual Default, are recovery rates, nonperformance risk and weighted average life. The recovery rate represents the percentage of notional expected to be recovered after an asset defaults, indicating the severity of a potential loss. The nonperformance risk is an assumption of MBIA Corp.’s own ability to pay and whether MBIA Corp. will have the necessary resources to pay the obligations as they come due. Weighted average life is based on MBIA Corp.’s estimate of when the principal of the underlying collateral will be repaid. A significant increase in weighted average life can result in an increase or decrease in the fair value of the derivative liability, depending on the discount rate and the timing of significant losses. Any significant increase or decrease in recovery rates or MBIA Corp.’s nonperformance risk would result in a decrease or increase in the fair value of the derivative liabilities, respectively. Recovery rates, nonperformance risk and weighted average lives are determined independently. Changes in one input will not necessarily have any impact on the other inputs.
The significant unobservable input used in the fair value measurement of MBIA Corp.’s other derivatives, which are valued using a discounted cash flow model, is the estimates of future cash flows discounted using market rates and CDS spreads. Any significant increase or decrease in future cash flows would result in an increase or decrease in the fair value of the derivative liability, respectively.
127
Table of Contents
MBIA Inc. and Subsidiaries
Notes to Consolidated Financial Statements
Note 7: Fair Value of Financial Instruments (continued)
Fair Value Measurements
The following tables present the fair value of the Company’s assets (including short-term investments) and liabilities measured and reported at fair value on a recurring basis as of December 31, 2014 and 2013:
| Fair Value Measurements at Reporting Date Using | ||||||||||||||||||||
| In millions |
Quoted Prices in Active Markets for Identical Assets (Level 1) |
Significant Other Observable Inputs (Level 2) |
Significant Unobservable Inputs (Level 3) |
Counterparty and Cash Collateral Netting |
Balance as of December 31, 2014 |
|||||||||||||||
| Assets: |
||||||||||||||||||||
| Fixed-maturity investments: |
||||||||||||||||||||
| U.S. Treasury and government agency |
$ | 573 | $ | 118 | $ | — | $ | — | $ | 691 | ||||||||||
| State and municipal bonds |
— | 1,724 | 8 | (1) | — | 1,732 | ||||||||||||||
| Foreign governments |
221 | 63 | 6 | (1) | — | 290 | ||||||||||||||
| Corporate obligations |
— | 2,048 | 10 | (1) | — | 2,058 | ||||||||||||||
| Mortgage-backed securities: |
||||||||||||||||||||
| Residential mortgage-backed agency |
— | 1,162 | — | — | 1,162 | |||||||||||||||
| Residential mortgage-backed non-agency |
— | 56 | — | — | 56 | |||||||||||||||
| Commercial mortgage-backed |
— | 20 | 2 | (1) | — | 22 | ||||||||||||||
| Asset-backed securities: |
||||||||||||||||||||
| Collateralized debt obligations |
— | 6 | 87 | (1) | — | 93 | ||||||||||||||
| Other asset-backed |
— | 156 | 85 | (1) | — | 241 | ||||||||||||||
|
|
|
|
|
|
|
|
|
|
|
|||||||||||
| Total fixed-maturity investments |
794 | 5,353 | 198 | — | 6,345 | |||||||||||||||
| Money market securities |
428 | — | — | — | 428 | |||||||||||||||
| Perpetual debt and equity securities |
22 | 31 | — | — | 53 | |||||||||||||||
| Cash and cash equivalents |
729 | — | — | — | 729 | |||||||||||||||
| Derivative assets: |
||||||||||||||||||||
| Non-insured derivative assets: |
||||||||||||||||||||
| Interest rate derivatives |
— | 83 | — | (81) | 2 | |||||||||||||||
| Assets held for sale: |
||||||||||||||||||||
| Equity securities |
6 | — | — | — | 6 | |||||||||||||||
| Loans receivable at fair value |
— | 711 | — | — | 711 | |||||||||||||||
| Cash and cash equivalents |
55 | — | — | — | 55 | |||||||||||||||
128
Table of Contents
MBIA Inc. and Subsidiaries
Notes to Consolidated Financial Statements
Note 7: Fair Value of Financial Instruments (continued)
| Fair Value Measurements at Reporting Date Using | ||||||||||||||||||||||||
| In millions |
Quoted Prices in Active Markets for Identical Assets (Level 1) |
Significant Other Observable Inputs (Level 2) |
Significant Unobservable Inputs (Level 3) |
Counterparty and Cash Collateral Netting |
Balance as of December 31, 2014 |
|||||||||||||||||||
| Assets of consolidated VIEs: |
||||||||||||||||||||||||
| Corporate obligations |
— | 10 | 55 | (1) | — | 65 | ||||||||||||||||||
| Mortgage-backed securities: |
||||||||||||||||||||||||
| Residential mortgage-backed non-agency |
— | 194 | 3 | (1) | — | 197 | ||||||||||||||||||
| Commercial mortgage-backed |
— | 86 | — | — | 86 | |||||||||||||||||||
| Asset-backed securities: |
||||||||||||||||||||||||
| Collateralized debt obligations |
— | 7 | 5 | (1) | — | 12 | ||||||||||||||||||
| Other asset-backed |
— | 35 | 26 | (1) | — | 61 | ||||||||||||||||||
| Cash |
53 | — | — | — | 53 | |||||||||||||||||||
| Loans receivable at fair value: |
||||||||||||||||||||||||
| Residential loans receivable |
— | — | 1,431 | — | 1,431 | |||||||||||||||||||
| Loan repurchase commitments |
— | — | 379 | — | 379 | |||||||||||||||||||
|
|
|
|
|
|
|
|
|
|
|
|||||||||||||||
| Total assets |
$ | 2,087 | $ | 6,510 | $ | 2,097 | $ | (81) | $ | 10,613 | ||||||||||||||
|
|
|
|
|
|
|
|
|
|
|
|||||||||||||||
| Liabilities: |
||||||||||||||||||||||||
| Medium-term notes |
$ | — | $ | — | $ | 197 | (1) | $ | — | $ | 197 | |||||||||||||
| Derivative liabilities: |
||||||||||||||||||||||||
| Insured derivatives: |
||||||||||||||||||||||||
| Credit derivatives |
— | 2 | 244 | — | 246 | |||||||||||||||||||
| Non-insured derivatives: |
||||||||||||||||||||||||
| Interest rate derivatives |
— | 248 | — | (81) | 167 | |||||||||||||||||||
| Other |
— | — | 24 | — | 24 | |||||||||||||||||||
| Liabilities held for sale: |
||||||||||||||||||||||||
| Variable interest entity notes |
— | 431 | — | — | 431 | |||||||||||||||||||
| Payable for loans purchased |
— | 323 | — | — | 323 | |||||||||||||||||||
| Other liabilities: |
||||||||||||||||||||||||
| Warrants |
— | 28 | — | — | 28 | |||||||||||||||||||
| Liabilities of consolidated VIEs: |
||||||||||||||||||||||||
| Variable interest entity notes |
— | 1,312 | 735 | — | 2,047 | |||||||||||||||||||
|
|
|
|
|
|
|
|
|
|
|
|||||||||||||||
| Total liabilities |
$ | — | $ | 2,344 | $ | 1,200 | $ | (81) | $ | 3,463 | ||||||||||||||
|
|
|
|
|
|
|
|
|
|
|
|||||||||||||||
(1)—Unobservable inputs are either not developed by the Company or do not significantly impact the overall fair values of the aggregate financial assets and liabilities.
129
Table of Contents
MBIA Inc. and Subsidiaries
Notes to Consolidated Financial Statements
Note 7: Fair Value of Financial Instruments (continued)
| Fair Value Measurements at Reporting Date Using | ||||||||||||||||||||||||
| In millions |
Quoted Prices in Active Markets for Identical Assets (Level 1) |
Significant Other Observable Inputs (Level 2) |
Significant Unobservable Inputs (Level 3) |
Counterparty and Cash Collateral Netting |
Balance as of December 31, 2013 |
|||||||||||||||||||
| Assets: |
||||||||||||||||||||||||
| Fixed-maturity investments: |
||||||||||||||||||||||||
| U.S. Treasury and government agency |
$ | 397 | $ | 156 | $ | — | $ | — | $ | 553 | ||||||||||||||
| State and municipal bonds |
— | 1,765 | 19 | (1) | — | 1,784 | ||||||||||||||||||
| Foreign governments |
112 | 65 | 12 | (1) | — | 189 | ||||||||||||||||||
| Corporate obligations |
— | 1,776 | 48 | (1) | — | 1,824 | ||||||||||||||||||
| Mortgage-backed securities: |
||||||||||||||||||||||||
| Residential mortgage-backed agency |
— | 1,173 | — | — | 1,173 | |||||||||||||||||||
| Residential mortgage-backed non-agency |
— | 86 | 6 | (1) | — | 92 | ||||||||||||||||||
| Commercial mortgage-backed |
— | 25 | 14 | (1) | — | 39 | ||||||||||||||||||
| Asset-backed securities: |
||||||||||||||||||||||||
| Collateralized debt obligations |
— | 72 | 82 | (1) | — | 154 | ||||||||||||||||||
| Other asset-backed |
— | 130 | 58 | (1) | — | 188 | ||||||||||||||||||
|
|
|
|
|
|
|
|
|
|
|
|||||||||||||||
| Total fixed-maturity investments |
509 | 5,248 | 239 | — | 5,996 | |||||||||||||||||||
| Money market securities |
783 | — | — | — | 783 | |||||||||||||||||||
| Perpetual debt and equity securities |
27 | 13 | 11 | (1) | — | 51 | ||||||||||||||||||
| Cash and cash equivalents |
1,161 | — | — | — | 1,161 | |||||||||||||||||||
| Derivative assets: |
||||||||||||||||||||||||
| Non-insured derivative assets: |
||||||||||||||||||||||||
| Interest rate derivatives |
— | 46 | — | (42) | 4 | |||||||||||||||||||
130
Table of Contents
MBIA Inc. and Subsidiaries
Notes to Consolidated Financial Statements
Note 7: Fair Value of Financial Instruments (continued)
| Fair Value Measurements at Reporting Date Using | ||||||||||||||||||||||||
| In millions |
Quoted Prices in Active Markets for Identical Assets (Level 1) |
Significant Other Observable Inputs (Level 2) |
Significant Unobservable Inputs (Level 3) |
Counterparty and Cash Collateral Netting |
Balance as of December 31, 2013 |
|||||||||||||||||||
| Assets of consolidated VIEs: |
||||||||||||||||||||||||
| Corporate obligations |
— | 41 | 48 | (1) | — | 89 | ||||||||||||||||||
| Mortgage-backed securities: |
||||||||||||||||||||||||
| Residential mortgage-backed non-agency |
— | 255 | 4 | (1) | — | 259 | ||||||||||||||||||
| Commercial mortgage-backed |
— | 102 | 3 | (1) | — | 105 | ||||||||||||||||||
| Asset-backed securities: |
||||||||||||||||||||||||
| Collateralized debt obligations |
— | 14 | 22 | (1) | — | 36 | ||||||||||||||||||
| Other asset-backed |
— | 44 | 54 | (1) | — | 98 | ||||||||||||||||||
| Money market securities |
136 | — | — | — | 136 | |||||||||||||||||||
| Cash |
97 | — | — | — | 97 | |||||||||||||||||||
| Loans receivable at fair value |
— | — | 1,612 | — | 1,612 | |||||||||||||||||||
| Loan repurchase commitments |
— | — | 359 | — | 359 | |||||||||||||||||||
|
|
|
|
|
|
|
|
|
|
|
|||||||||||||||
| Total assets |
$ | 2,713 | $ | 5,763 | $ | 2,352 | $ | (42) | $ | 10,786 | ||||||||||||||
|
|
|
|
|
|
|
|
|
|
|
|||||||||||||||
| Liabilities: |
||||||||||||||||||||||||
| Medium-term notes |
$ | — | $ | — | $ | 203 | (1) | $ | — | $ | 203 | |||||||||||||
| Derivative liabilities: |
||||||||||||||||||||||||
| Insured derivatives: |
||||||||||||||||||||||||
| Credit derivatives |
— | 5 | 1,147 | — | 1,152 | |||||||||||||||||||
| Non-insured derivatives: |
||||||||||||||||||||||||
| Interest rate derivatives |
— | 165 | — | (165) | — | |||||||||||||||||||
| Other liabilities: |
||||||||||||||||||||||||
| Warrants |
— | 59 | — | — | 59 | |||||||||||||||||||
| Liabilities of consolidated VIEs: |
||||||||||||||||||||||||
| Variable interest entity notes |
— | 1,416 | 940 | — | 2,356 | |||||||||||||||||||
| Derivative liabilities: |
||||||||||||||||||||||||
| Currency derivatives |
— | — | 11 | (1) | — | 11 | ||||||||||||||||||
|
|
|
|
|
|
|
|
|
|
|
|||||||||||||||
| Total liabilities |
$ | — | $ | 1,645 | $ | 2,301 | $ | (165) | $ | 3,781 | ||||||||||||||
|
|
|
|
|
|
|
|
|
|
|
|||||||||||||||
(1)—Unobservable inputs are either not developed by the Company or do not significantly impact the overall fair values of the aggregate financial assets and liabilities.
Level 3 assets at fair value as of December 31, 2014 and 2013 represented approximately 20% and 22%, respectively, of total assets measured at fair value. Level 3 liabilities at fair value as of December 31, 2014 and 2013 represented approximately 35% and 61%, respectively, of total liabilities measured at fair value.
131
Table of Contents
MBIA Inc. and Subsidiaries
Notes to Consolidated Financial Statements
Note 7: Fair Value of Financial Instruments (continued)
The following tables present the fair values and carrying values of the Company’s assets and liabilities that are disclosed at fair value but not reported at fair value on the Company’s consolidated balance sheets as of December 31, 2014 and 2013:
| Fair Value Measurements at Reporting Date Using | ||||||||||||||||||||
| In millions |
Quoted Prices in Active Markets for Identical Assets (Level 1) |
Significant Other Observable Inputs (Level 2) |
Significant Unobservable Inputs (Level 3) |
Fair Value Balance as of December 31, 2014 |
Carry Value Balance as of December 31, 2014 |
|||||||||||||||
| Assets: |
||||||||||||||||||||
| Other investments |
$ | — | $ | — | $ | 4 | $ | 4 | $ | 4 | ||||||||||
| Accrued investment income(1) |
— | 43 | — | 43 | 43 | |||||||||||||||
| Receivable for investments sold(1) |
— | 69 | — | 69 | 69 | |||||||||||||||
| Assets held for sale: |
||||||||||||||||||||
| Facility |
— | 26 | — | 26 | 26 | |||||||||||||||
| Assets of consolidated VIEs: |
||||||||||||||||||||
| Investments held-to-maturity |
— | — | 2,632 | 2,632 | 2,757 | |||||||||||||||
|
|
|
|
|
|
|
|
|
|
|
|||||||||||
| Total assets |
$ | — | $ | 138 | $ | 2,636 | $ | 2,774 | $ | 2,899 | ||||||||||
|
|
|
|
|
|
|
|
|
|
|
|||||||||||
| Liabilities: |
||||||||||||||||||||
| Investment agreements |
$ | — | $ | — | $ | 705 | $ | 705 | $ | 547 | ||||||||||
| Medium-term notes |
— | — | 801 | 801 | 1,004 | |||||||||||||||
| Long-term debt |
— | 1,172 | — | 1,172 | 1,810 | |||||||||||||||
| Payable for investments purchased(2) |
— | 42 | — | 42 | 42 | |||||||||||||||
| Liabilities of consolidated VIEs: |
||||||||||||||||||||
| Variable interest entity notes |
— | — | 2,779 | 2,779 | 2,757 | |||||||||||||||
|
|
|
|
|
|
|
|
|
|
|
|||||||||||
| Total liabilities |
$ | — | $ | 1,214 | $ | 4,285 | $ | 5,499 | $ | 6,160 | ||||||||||
|
|
|
|
|
|
|
|
|
|
|
|||||||||||
| Financial Guarantees: |
||||||||||||||||||||
| Gross |
$ | — | $ | — | $ | 4,051 | $ | 4,051 | $ | 1,959 | ||||||||||
| Ceded |
— | — | 109 | 109 | 65 | |||||||||||||||
(1)—Reported within “Other assets” on MBIA’s consolidated balance sheets.
(2)—Reported within “Other liabilities” on MBIA’s consolidated balance sheets.
132
Table of Contents
MBIA Inc. and Subsidiaries
Notes to Consolidated Financial Statements
Note 7: Fair Value of Financial Instruments (continued)
| Fair Value Measurements at Reporting Date Using | ||||||||||||||||||||
| In millions |
Quoted Prices in Active Markets for Identical Assets (Level 1) |
Significant Other Observable Inputs (Level 2) |
Significant Unobservable Inputs (Level 3) |
Fair Value Balance as of December 31, 2013 |
Carry Value Balance as of December 31, 2013 |
|||||||||||||||
| Assets: |
||||||||||||||||||||
| Other investments |
$ | — | $ | — | $ | 4 | $ | 4 | $ | 5 | ||||||||||
| Accrued investment income(1) |
— | 52 | — | 52 | 52 | |||||||||||||||
| Receivable for investments sold(1) |
— | 22 | — | 22 | 22 | |||||||||||||||
| Net cash collateral pledged(1) |
24 | — | — | 24 | 24 | |||||||||||||||
| Assets held for sale |
||||||||||||||||||||
| Facility |
— | 29 | — | 29 | 29 | |||||||||||||||
| Assets of consolidated VIEs: |
||||||||||||||||||||
| Investments held-to-maturity |
— | — | 2,651 | 2,651 | 2,801 | |||||||||||||||
|
|
|
|
|
|
|
|
|
|
|
|||||||||||
| Total assets |
$ | 24 | $ | 103 | $ | 2,655 | $ | 2,782 | $ | 2,933 | ||||||||||
|
|
|
|
|
|
|
|
|
|
|
|||||||||||
| Liabilities: |
||||||||||||||||||||
| Investment agreements |
$ | — | $ | — | $ | 814 | $ | 814 | $ | 700 | ||||||||||
| Medium-term notes |
— | — | 927 | 927 | 1,224 | |||||||||||||||
| Long-term debt |
— | 1,412 | — | 1,412 | 1,702 | |||||||||||||||
| Payable for investments purchased(2) |
— | 31 | — | 31 | 31 | |||||||||||||||
| Liabilities of consolidated VIEs: |
||||||||||||||||||||
| Variable interest entity notes |
— | — | 2,751 | 2,751 | 2,930 | |||||||||||||||
|
|
|
|
|
|
|
|
|
|
|
|||||||||||
| Total liabilities |
$ | — | $ | 1,443 | $ | 4,492 | $ | 5,935 | $ | 6,587 | ||||||||||
|
|
|
|
|
|
|
|
|
|
|
|||||||||||
| Financial Guarantees: |
||||||||||||||||||||
| Gross |
$ | — | $ | — | $ | 2,843 | $ | 2,843 | $ | 2,388 | ||||||||||
| Ceded |
— | — | 71 | 71 | 76 | |||||||||||||||
(1)—Reported within “Other assets” on MBIA’s consolidated balance sheets.
(2)—Reported within “Other liabilities” on MBIA’s consolidated balance sheets.
133
Table of Contents
MBIA Inc. and Subsidiaries
Notes to Consolidated Financial Statements
Note 7: Fair Value of Financial Instruments (continued)
The following tables present information about changes in Level 3 assets (including short-term investments) and liabilities measured at fair value on a recurring basis for the years ended December 31, 2014 and 2013:
Changes in Level 3 Assets and Liabilities Measured at Fair Value on a Recurring Basis for the Year Ended December 31, 2014
| In millions |
Balance, Beginning of Year |
Realized Gains / (Losses) |
Unrealized Gains / (Losses) Included in Earnings |
Unrealized Gains / (Losses) Included in OCI |
Foreign Exchange Recognized in OCI or Earnings |
Purchases | Issuances | Settlements | Sales | Transfers into Level 3(1) |
Transfers out of Level 3(1) |
Ending Balance |
Change in Unrealized Gains (Losses) for the Period Included in Earnings for Assets still held as of December 31, 2014 |
|||||||||||||||||||||||||||||||||||||||
| Assets: |
||||||||||||||||||||||||||||||||||||||||||||||||||||
| Foreign governments |
$ | 12 | $ | — | $ | — | $ | — | $ | — | $ | — | $ | — | $ | (15) | $ | — | $ | 9 | $ | — | $ | 6 | $ | — | ||||||||||||||||||||||||||
| Corporate obligations |
48 | 2 | 3 | (3) | (1) | 10 | — | (7) | (48) | 7 | (1) | 10 | — | |||||||||||||||||||||||||||||||||||||||
| Residential mortgage- backed agency |
— | — | — | — | — | — | — | (8) | — | 37 | (29) | — | — | |||||||||||||||||||||||||||||||||||||||
| Residential mortgage- backed non-agency |
6 | — | — | (1) | — | — | — | — | — | — | (5) | — | — | |||||||||||||||||||||||||||||||||||||||
| Commercial mortgage-backed |
14 | — | — | — | — | — | — | (14) | — | 3 | (1) | 2 | — | |||||||||||||||||||||||||||||||||||||||
| Collateralized debt obligations |
82 | (2) | 1 | 28 | — | 5 | — | (15) | (41) | 36 | (7) | 87 | — | |||||||||||||||||||||||||||||||||||||||
| Other asset-backed |
58 | — | — | 4 | — | 11 | — | (12) | (1) | 52 | (27) | 85 | — | |||||||||||||||||||||||||||||||||||||||
| State and municipal bonds |
19 | — | — | 3 | — | — | — | (4) | (4) | 46 | (52) | 8 | — | |||||||||||||||||||||||||||||||||||||||
| Perpetual debt and equity securities |
11 | — | 2 | — | — | — | — | — | (13) | 4 | (4) | — | — | |||||||||||||||||||||||||||||||||||||||
| Assets of consolidated VIEs: |
||||||||||||||||||||||||||||||||||||||||||||||||||||
| Corporate obligations |
48 | — | (10) | — | — | — | — | (5) | (3) | 25 | — | 55 | — | |||||||||||||||||||||||||||||||||||||||
| Residential mortgage- backed non-agency |
4 | — | (1) | — | — | — | — | (1) | — | 2 | (1) | 3 | — | |||||||||||||||||||||||||||||||||||||||
| Commercial mortgage-backed |
3 | — | (3) | — | — | — | — | — | — | — | — | — | — | |||||||||||||||||||||||||||||||||||||||
| Collateralized debt obligations |
22 | — | (10) | — | — | — | — | (5) | — | 1 | (3) | 5 | 1 | |||||||||||||||||||||||||||||||||||||||
| Other asset-backed |
54 | — | (26) | — | — | — | — | (10) | — | 18 | (10) | 26 | (9) | |||||||||||||||||||||||||||||||||||||||
| Loans receivable |
1,612 | — | 39 | — | — | — | — | (220) | — | — | — | 1,431 | 39 | |||||||||||||||||||||||||||||||||||||||
| Loan repurchase commitments |
359 | — | 20 | — | — | — | — | — | — | — | — | 379 | 20 | |||||||||||||||||||||||||||||||||||||||
|
|
|
|
|
|
|
|
|
|
|
|
|
|
|
|
|
|
|
|
|
|
|
|
|
|
|
|||||||||||||||||||||||||||
| Total assets |
$ | 2,352 | $ | — | $ | 15 | $ | 31 | $ | (1) | $ | 26 | $ | — | $ | (316) | $ | (110) | $ | 240 | $ | (140) | $ | 2,097 | $ | 51 | ||||||||||||||||||||||||||
|
|
|
|
|
|
|
|
|
|
|
|
|
|
|
|
|
|
|
|
|
|
|
|
|
|
|
|||||||||||||||||||||||||||
| In millions |
Balance, Beginning of Year |
Realized (Gains) / Losses |
Unrealized (Gains) / Losses Included in Earnings |
Unrealized (Gains) / Losses Included in OCI |
Foreign Exchange Recognized in OCI or Earnings |
Purchases | Issuances | Settlements | Sales | Transfers into Level 3(1) |
Transfers out of Level 3(1) |
Ending Balance |
Change in Unrealized (Gains) Losses for the Period Included in Earnings for Liabilities still held as of December 31, 2014 |
|||||||||||||||||||||||||||||||||||||||
| Liabilities: |
||||||||||||||||||||||||||||||||||||||||||||||||||||
| Medium-term notes |
$ | 203 | $ | — | $ | 20 | $ | — | $ | (26) | $ | — | $ | — | $ | — | $ | — | $ | — | $ | — | $ | 197 | $ | (6) | ||||||||||||||||||||||||||
| Credit derivatives, net |
1,147 | 415 | (903) | — | — | — | — | (415) | — | — | — | 244 | (20) | |||||||||||||||||||||||||||||||||||||||
| Other derivatives, net |
— | 30 | (6) | — | — | — | — | — | — | — | — | 24 | (6) | |||||||||||||||||||||||||||||||||||||||
| Liabilities of consolidated VIEs: |
||||||||||||||||||||||||||||||||||||||||||||||||||||
| VIE notes |
940 | — | 46 | — | — | — | 3 | (211) | (43) | — | — | 735 | 42 | |||||||||||||||||||||||||||||||||||||||
| Currency derivatives, net |
11 | — | (5) | — | (6) | — | — | — | — | — | — | — | (11) | |||||||||||||||||||||||||||||||||||||||
|
|
|
|
|
|
|
|
|
|
|
|
|
|
|
|
|
|
|
|
|
|
|
|
|
|
|
|||||||||||||||||||||||||||
| Total liabilities |
$ | 2,301 | $ | 445 | $ | (848) | $ | — | $ | (32) | $ | — | $ | 3 | $ | (626) | $ | (43) | (2) | $ | — | $ | — | $ | 1,200 | $ | (1) | |||||||||||||||||||||||||
|
|
|
|
|
|
|
|
|
|
|
|
|
|
|
|
|
|
|
|
|
|
|
|
|
|
|
|||||||||||||||||||||||||||
(1)—Transferred in and out at the end of the period.
(2)—Primarily relates to the deconsolidation of VIEs.
134
Table of Contents
MBIA Inc. and Subsidiaries
Notes to Consolidated Financial Statements
Note 7: Fair Value of Financial Instruments (continued)
Changes in Level 3 Assets and Liabilities Measured at Fair Value on a Recurring Basis for the Year Ended December 31, 2013
| In millions |
Balance, Beginning of Year |
Realized Gains / (Losses) |
Unrealized Gains / (Losses) Included in Earnings |
Unrealized Gains / (Losses) Included in OCI |
Foreign Exchange Recognized in OCI or Earnings |
Purchases | Issuances | Settlements | Sales | Transfers into Level 3(1) |
Transfers out of Level 3(1) |
Ending Balance |
Change in Unrealized Gains (Losses) for the Period Included in Earnings for Assets still held as of December 31, 2013 |
|||||||||||||||||||||||||||||||||||||||
| Assets: |
||||||||||||||||||||||||||||||||||||||||||||||||||||
| Foreign governments |
$ | 3 | $ | — | $ | — | $ | — | $ | — | $ | 10 | $ | — | $ | (16) | $ | — | $ | 18 | $ | (3) | $ | 12 | $ | — | ||||||||||||||||||||||||||
| Corporate obligations |
76 | (5) | 7 | 13 | — | 1 | — | (16) | (28) | 1 | (1) | 48 | 7 | |||||||||||||||||||||||||||||||||||||||
| Residential mortgage-backed agency |
— | — | — | — | — | — | — | (1) | — | 20 | (19) | — | — | |||||||||||||||||||||||||||||||||||||||
| Residential mortgage-backed non-agency |
4 | — | — | — | — | — | — | (2) | — | 5 | (1) | 6 | — | |||||||||||||||||||||||||||||||||||||||
| Commercial mortgage-backed |
28 | — | — | 4 | — | — | — | (1) | (19) | 3 | (1) | 14 | — | |||||||||||||||||||||||||||||||||||||||
| Collateralized debt obligations |
31 | (2) | 1 | 12 | — | 61 | — | (17) | (5) | 31 | (30) | 82 | 1 | |||||||||||||||||||||||||||||||||||||||
| Other asset-backed |
26 | — | — | (3) | — | 3 | — | (10) | — | 47 | (5) | 58 | — | |||||||||||||||||||||||||||||||||||||||
| State and municipal bonds |
103 | 2 | — | (1) | — | — | — | (5) | (13) | 42 | (109) | 19 | — | |||||||||||||||||||||||||||||||||||||||
| Perpetual debt and equity securities |
14 | — | — | — | — | — | — | — | — | — | (3) | 11 | — | |||||||||||||||||||||||||||||||||||||||
| Assets of consolidated VIEs: |
||||||||||||||||||||||||||||||||||||||||||||||||||||
| Corporate obligations |
78 | (4) | (7) | 6 | — | — | — | (4) | (24) | 3 | — | 48 | — | |||||||||||||||||||||||||||||||||||||||
| Residential mortgage-backed non-agency |
6 | — | 6 | — | — | — | — | (7) | — | 3 | (4) | 4 | — | |||||||||||||||||||||||||||||||||||||||
| Commercial mortgage-backed |
7 | — | — | — | — | — | — | — | (24) | 20 | — | 3 | 1 | |||||||||||||||||||||||||||||||||||||||
| Collateralized debt obligations |
125 | — | (8) | 5 | — | — | — | (5) | (85) | 4 | (14) | 22 | 1 | |||||||||||||||||||||||||||||||||||||||
| Other asset-backed |
64 | — | (9) | — | — | — | — | (14) | (2) | 21 | (6) | 54 | 2 | |||||||||||||||||||||||||||||||||||||||
| Loans receivable |
1,881 | — | 180 | — | — | — | — | (275) | (174) | — | — | 1,612 | 166 | |||||||||||||||||||||||||||||||||||||||
| Loan repurchase commitments |
1,086 | — | 172 | — | — | — | — | (899) | — | — | — | 359 | 172 | |||||||||||||||||||||||||||||||||||||||
|
|
|
|
|
|
|
|
|
|
|
|
|
|
|
|
|
|
|
|
|
|
|
|
|
|
|
|||||||||||||||||||||||||||
| Total assets |
$ | 3,532 | $ | (9) | $ | 342 | $ | 36 | $ | — | $ | 75 | $ | — | $ | (1,272) | $ | (374) | $ | 218 | $ | (196) | $ | 2,352 | $ | 350 | ||||||||||||||||||||||||||
|
|
|
|
|
|
|
|
|
|
|
|
|
|
|
|
|
|
|
|
|
|
|
|
|
|
|
|||||||||||||||||||||||||||
| In millions |
Balance, Beginning of Year |
Realized (Gains) / Losses |
Unrealized (Gains) / Losses Included in Earnings |
Unrealized (Gains) / Losses Included in OCI |
Foreign Exchange Recognized in OCI or Earnings |
Purchases | Issuances | Settlements | Sales | Transfers into Level 3(1) |
Transfers out of Level 3(1) |
Ending Balance |
Change in Unrealized (Gains) Losses for the Period Included in Earnings for Liabilities still held as of December 31, 2013 |
|||||||||||||||||||||||||||||||||||||||
| Liabilities: |
||||||||||||||||||||||||||||||||||||||||||||||||||||
| Medium-term notes |
$ | 165 | $ | — | $ | 29 | $ | — | $ | 9 | $ | — | $ | — | $ | — | $ | $ | — | $ | — | $ | 203 | $ | 38 | |||||||||||||||||||||||||||
| Credit derivatives, net |
2,921 | 1,548 | (1,778) | — | — | — | — | (1,548) | — | 4 | — | 1,147 | 87 | |||||||||||||||||||||||||||||||||||||||
| Interest rate derivatives, net |
(1) | — | 2 | — | — | — | — | — | — | — | (1) | — | (18) | |||||||||||||||||||||||||||||||||||||||
| Currency derivatives, net |
1 | — | — | — | — | — | — | — | — | — | (1) | — | — | |||||||||||||||||||||||||||||||||||||||
| Liabilities of consolidated VIEs: |
||||||||||||||||||||||||||||||||||||||||||||||||||||
| VIE notes |
1,932 | — | 180 | — | — | — | — | (277) | (1,076) | 181 | — | 940 | 92 | |||||||||||||||||||||||||||||||||||||||
| Currency derivatives, net |
21 | — | (10) | — | — | — | — | — | — | — | — | 11 | (10) | |||||||||||||||||||||||||||||||||||||||
|
|
|
|
|
|
|
|
|
|
|
|
|
|
|
|
|
|
|
|
|
|
|
|
|
|
|
|||||||||||||||||||||||||||
| Total liabilities |
$ | 5,039 | $ | 1,548 | $ | (1,577) | $ | — | $ | 9 | $ | — | $ | — | $ | (1,825) | $ | (1,076) | (2) | $ | 185 | $ | (2) | $ | 2,301 | $ | 189 | |||||||||||||||||||||||||
|
|
|
|
|
|
|
|
|
|
|
|
|
|
|
|
|
|
|
|
|
|
|
|
|
|
|
|||||||||||||||||||||||||||
(1)—Transferred in and out at the end of the period.
(2)—Primarily relates to the deconsolidation of VIEs.
Transfers into and out of Level 3 were $240 million and $140 million, respectively, for the year ended December 31, 2014. Transfers into and out of Level 2 were $140 million and $240 million, respectively, for the year ended December 31, 2014. Transfers into Level 3 were principally related to other ABS, state and municipal bonds, RMBS agency, CDOs, and corporate obligations, where inputs, which are significant to their valuation, became unobservable during the period.
135
Table of Contents
MBIA Inc. and Subsidiaries
Notes to Consolidated Financial Statements
Note 7: Fair Value of Financial Instruments (continued)
State and municipal bonds, other ABS and RMBS agency comprised the majority of the transferred instruments out of Level 3 where inputs, which are significant to their valuation, became observable during the period. These inputs included spreads, prepayment speeds, default speeds, default severities, yield curves observable at commonly quoted intervals, and market corroborated inputs. There were no transfers into or out of Level 1.
Transfers into and out of Level 3 were $403 million and $198 million, respectively, for the year ended December 31, 2013. Transfers into and out of Level 2 were $198 million and $403 million, respectively, for the year ended December 31, 2013. Transfers into Level 3 were principally related to VIE notes, other ABS, state and municipal bonds, CDOs, CMBS and RMBS agency where inputs, which are significant to their valuation, became unobservable during the period. State and municipal bonds, CDOs and RMBS agency comprised the majority of the transferred instruments out of Level 3 where inputs, which are significant to their valuation, became observable during the period. These inputs included spreads, prepayment speeds, default speeds, default severities, yield curves observable at commonly quoted intervals, and market corroborated inputs. There were no transfers into or out of Level 1.
All Level 1, 2 and 3 designations are made at the end of each accounting period.
Gains and losses (realized and unrealized) included in earnings relating to Level 3 assets and liabilities for the years ended December 31, 2014 and 2013 are reported on the Company’s consolidated statements of operations as follows:
| In millions |
Total Gains (Losses) Included in Earnings |
Change in Unrealized Gains (Losses) for the Period Included in Earnings for Assets and Liabilities still held as of December 31, |
||||||||||||||||||||||
| 2014 | 2013 | 2012 | 2014 | 2013 | 2012 | |||||||||||||||||||
| Revenues: |
||||||||||||||||||||||||
| Unrealized gains (losses) on insured derivatives |
$ | 903 | $ | 1,778 | $ | 1,869 | $ | 20 | $ | (87) | $ | 927 | ||||||||||||
| Realized gains (losses) and other settlements on insured derivatives |
(445) | (1,548) | (407) | — | — | — | ||||||||||||||||||
| Net gains (losses) on financial instruments at fair value and foreign exchange |
18 | (37) | 13 | 12 | (12) | (6) | ||||||||||||||||||
| Net investment losses related to other-than-temporary impairments |
— | — | (68) | — | — | — | ||||||||||||||||||
| Revenues of consolidated VIEs: |
||||||||||||||||||||||||
| Net gains (losses) on financial instruments at fair value and foreign exchange |
(32) | 160 | (376) | 20 | 260 | (271) | ||||||||||||||||||
|
|
|
|
|
|
|
|
|
|
|
|
|
|||||||||||||
| Total |
$ | 444 | $ | 353 | $ | 1,031 | $ | 52 | $ | 161 | $ | 650 | ||||||||||||
|
|
|
|
|
|
|
|
|
|
|
|
|
|||||||||||||
136
Table of Contents
MBIA Inc. and Subsidiaries
Notes to Consolidated Financial Statements
Note 7: Fair Value of Financial Instruments (continued)
Fair Value Option
The Company elected to record at fair value certain financial instruments that have been consolidated in connection with the adoption of the accounting guidance for consolidation of VIEs, among others.
The following table presents the changes in fair value included in the Company’s consolidated statements of operations for the years ended December 31, 2014, 2013 and 2012 for financial instruments for which the fair value option was elected:
| Years Ended December 31, | ||||||||||||
| In millions |
2014 | 2013 | 2012 | |||||||||
| Investments carried at fair value(1) |
$ | 2 | $ | 8 | $ | 10 | ||||||
| Fixed-maturity securities held at fair value-VIE(2) |
(104) | (74) | (55) | |||||||||
| Loans receivable at fair value: |
||||||||||||
| Residential mortgage loans(2) |
(182) | (107) | (107) | |||||||||
| Other loans(2) |
10 | 13 | (56) | |||||||||
| Loan repurchase commitments(2) |
20 | 172 | 9 | |||||||||
| Medium-term notes(1) |
6 | 38 | — | |||||||||
| Variable interest entity notes(2) |
269 | 155 | 107 | |||||||||
(1)—Reported within “Net gains (losses) on financial instruments at fair value and foreign exchange” on MBIA’s consolidated statements of operations.
(2)—Reported within “Net gains (losses) on financial instruments at fair value and foreign exchange-VIE” on MBIA’s consolidated statements of operations.
The following table reflects the difference between the aggregate fair value and the aggregate remaining contractual principal balance outstanding as of December 31, 2014 and 2013 for loans and notes for which the fair value option was elected:
| As of December 31, 2014 | As of December 31, 2013 | |||||||||||||||||||||||
| In millions |
Contractual Outstanding Principal |
Fair Value |
Difference | Contractual Outstanding Principal |
Fair Value |
Difference | ||||||||||||||||||
| Loans receivable at fair value: |
||||||||||||||||||||||||
| Residential mortgage loans |
$ | 1,554 | $ | 1,377 | $ | 177 | $ | 1,846 | $ | 1,562 | $ | 284 | ||||||||||||
| Residential mortgage loans (90 days or more past due) |
227 | 54 | 173 | 231 | 50 | 181 | ||||||||||||||||||
| Other loans |
721 | 711 | 10 | — | — | — | ||||||||||||||||||
|
|
|
|
|
|
|
|
|
|
|
|
|
|||||||||||||
| Total loans receivable at fair value |
$ | 2,502 | $ | 2,142 | $ | 360 | $ | 2,077 | $ | 1,612 | $ | 465 | ||||||||||||
| Variable interest entity notes |
$ | 3,584 | $ | 2,479 | $ | 1,105 | $ | 3,787 | $ | 2,356 | $ | 1,431 | ||||||||||||
| Medium-term notes |
$ | 242 | $ | 197 | $ | 45 | $ | 276 | $ | 203 | $ | 73 | ||||||||||||
Substantially all gains and losses included in earnings during the periods ended December 31, 2014 and 2013 on loans receivable and VIE notes reported in the preceding table are attributable to credit risk. This is primarily due to the high rate of defaults on loans and the collateral supporting the VIE notes, resulting in depressed pricing of the financial instruments.
137
Table of Contents
MBIA Inc. and Subsidiaries
Notes to Consolidated Financial Statements
Note 8: Investments
Investments, excluding those elected under the fair value option, include debt and equity securities classified as either AFS or HTM. Other AFS investments primarily comprised money market funds.
The following tables present the amortized cost, fair value, corresponding gross unrealized gains and losses and other-than-temporary impairments (“OTTI”) for AFS and HTM investments in the Company’s consolidated investment portfolio as of December 31, 2014 and 2013:
| December 31, 2014 | ||||||||||||||||||||
| In millions |
Amortized Cost |
Gross Unrealized Gains |
Gross Unrealized Losses |
Fair Value |
Other-Than- Temporary Impairments(1) |
|||||||||||||||
| AFS Investments |
||||||||||||||||||||
| Fixed-maturity investments: |
||||||||||||||||||||
| U.S. Treasury and government agency |
$ | 631 | $ | 39 | $ | (3) | $ | 667 | $ | — | ||||||||||
| State and municipal bonds |
1,644 | 94 | (8) | 1,730 | — | |||||||||||||||
| Foreign governments |
283 | 7 | — | 290 | — | |||||||||||||||
| Corporate obligations |
1,984 | 44 | (92) | 1,936 | (86) | |||||||||||||||
| Mortgage-backed securities: |
||||||||||||||||||||
| Residential mortgage-backed agency |
1,116 | 17 | (7) | 1,126 | — | |||||||||||||||
| Residential mortgage-backed non-agency |
54 | 3 | (4) | 53 | (4) | |||||||||||||||
| Commercial mortgage-backed |
19 | 1 | — | 20 | — | |||||||||||||||
| Asset-backed securities: |
||||||||||||||||||||
| Collateralized debt obligations |
113 | — | (21) | 92 | — | |||||||||||||||
| Other asset-backed |
231 | 3 | (12) | 222 | — | |||||||||||||||
|
|
|
|
|
|
|
|
|
|
|
|||||||||||
| Total fixed-maturity investments |
6,075 | 208 | (147) | 6,136 | (90) | |||||||||||||||
| Money market securities |
422 | — | — | 422 | — | |||||||||||||||
| Perpetual debt and equity securities |
12 | 1 | — | 13 | — | |||||||||||||||
|
|
|
|
|
|
|
|
|
|
|
|||||||||||
| Total AFS investments |
$ | 6,509 | $ | 209 | $ | (147) | $ | 6,571 | $ | (90) | ||||||||||
|
|
|
|
|
|
|
|
|
|
|
|||||||||||
| HTM Investments |
||||||||||||||||||||
| Assets of consolidated VIEs: |
||||||||||||||||||||
| Corporate obligations |
$ | 2,757 | $ | 77 | $ | (202) | $ | 2,632 | $ | — | ||||||||||
|
|
|
|
|
|
|
|
|
|
|
|||||||||||
| Total HTM investments |
$ | 2,757 | $ | 77 | $ | (202) | $ | 2,632 | $ | — | ||||||||||
|
|
|
|
|
|
|
|
|
|
|
|||||||||||
(1)—Represents unrealized gains or losses on OTTI securities recognized in AOCI, which includes the non-credit component of impairments, as well as all subsequent changes in fair value of such impaired securities reported in AOCI.
138
Table of Contents
MBIA Inc. and Subsidiaries
Notes to Consolidated Financial Statements
Note 8: Investments (continued)
| December 31, 2013 | ||||||||||||||||||||
| In millions |
Amortized Cost |
Gross Unrealized Gains |
Gross Unrealized Losses |
Fair Value |
Other-Than- Temporary Impairments(1) |
|||||||||||||||
| AFS Investments |
||||||||||||||||||||
| Fixed-maturity investments: |
||||||||||||||||||||
| U.S. Treasury and government agency |
$ | 528 | $ | 16 | $ | (9) | $ | 535 | $ | — | ||||||||||
| State and municipal bonds |
1,831 | 22 | (73) | 1,780 | — | |||||||||||||||
| Foreign governments |
184 | 5 | — | 189 | — | |||||||||||||||
| Corporate obligations |
1,682 | 24 | (38) | 1,668 | — | |||||||||||||||
| Mortgage-backed securities: |
||||||||||||||||||||
| Residential mortgage-backed agency |
1,167 | 10 | (31) | 1,146 | — | |||||||||||||||
| Residential mortgage-backed non-agency |
79 | 13 | (5) | 87 | 4 | |||||||||||||||
| Commercial mortgage-backed |
34 | 1 | (1) | 34 | — | |||||||||||||||
| Asset-backed securities: |
||||||||||||||||||||
| Collateralized debt obligations |
205 | 3 | (57) | 151 | (14) | |||||||||||||||
| Other asset-backed |
187 | 2 | (15) | 174 | — | |||||||||||||||
|
|
|
|
|
|
|
|
|
|
|
|||||||||||
| Total fixed-maturity investments |
5,897 | 96 | (229) | 5,764 | (10) | |||||||||||||||
| Money market securities |
781 | — | — | 781 | — | |||||||||||||||
| Perpetual debt and equity securities |
10 | 1 | — | 11 | — | |||||||||||||||
| Assets of consolidated VIEs: |
||||||||||||||||||||
| Money market securities |
136 | — | — | 136 | — | |||||||||||||||
|
|
|
|
|
|
|
|
|
|
|
|||||||||||
| Total AFS investments |
$ | 6,824 | $ | 97 | $ | (229) | $ | 6,692 | $ | (10) | ||||||||||
|
|
|
|
|
|
|
|
|
|
|
|||||||||||
| HTM Investments |
||||||||||||||||||||
| Assets of consolidated VIEs: |
||||||||||||||||||||
| Corporate obligations |
$ | 2,801 | $ | 31 | $ | (181) | $ | 2,651 | $ | — | ||||||||||
|
|
|
|
|
|
|
|
|
|
|
|||||||||||
| Total HTM investments |
$ | 2,801 | $ | 31 | $ | (181) | $ | 2,651 | $ | — | ||||||||||
|
|
|
|
|
|
|
|
|
|
|
|||||||||||
(1)—Represents unrealized gains or losses on OTTI securities recognized in AOCI, which includes the non-credit component of impairments, as well as all subsequent changes in fair value of such impaired securities reported in AOCI.
The following table presents the distribution by contractual maturity of AFS and HTM fixed-maturity securities at amortized cost and fair value as of December 31, 2014. Contractual maturity may differ from expected maturity as borrowers may have the right to call or prepay obligations.
| AFS Securities | HTM Securities | |||||||||||||||
| Consolidated VIEs | ||||||||||||||||
| In millions |
Amortized Cost |
Fair Value |
Amortized Cost |
Fair Value |
||||||||||||
| Due in one year or less |
$ | 806 | $ | 806 | $ | — | $ | — | ||||||||
| Due after one year through five years |
1,388 | 1,412 | — | — | ||||||||||||
| Due after five years through ten years |
889 | 914 | — | — | ||||||||||||
| Due after ten years |
1,459 | 1,491 | 2,757 | 2,632 | ||||||||||||
| Mortgage-backed and asset-backed |
1,533 | 1,513 | — | — | ||||||||||||
|
|
|
|
|
|
|
|
|
|||||||||
| Total fixed-maturity investments |
$ | 6,075 | $ | 6,136 | $ | 2,757 | $ | 2,632 | ||||||||
|
|
|
|
|
|
|
|
|
|||||||||
Deposited and Pledged Securities
The fair value of securities on deposit with various regulatory authorities as of December 31, 2014 and 2013 was $10 million for both periods. These deposits are required to comply with state insurance laws.
139
Table of Contents
MBIA Inc. and Subsidiaries
Notes to Consolidated Financial Statements
Note 8: Investments (continued)
Investment agreement obligations require the Company to pledge securities as collateral. Securities pledged in connection with investment agreements may not be repledged by the investment agreement counterparty. As of December 31, 2014 and 2013, the fair value of securities pledged as collateral for these investment agreements approximated $532 million and $735 million, respectively. The Company’s collateral as of December 31, 2014 consisted principally of RMBS and U.S. Treasury and government agency bonds, and was primarily held with major U.S. banks. Additionally, the Company pledged cash and money market securities as collateral under investment agreements in the amount of $26 million and $22 million as of December 31, 2014 and 2013, respectively.
Impaired Investments
The following tables present the gross unrealized losses related to AFS and HTM investments as of December 31, 2014 and 2013:
| December 31, 2014 | ||||||||||||||||||||||||
| Less than 12 Months | 12 Months or Longer | Total | ||||||||||||||||||||||
| In millions |
Fair Value |
Unrealized Losses |
Fair Value |
Unrealized Losses |
Fair Value |
Unrealized Losses |
||||||||||||||||||
| AFS Investments |
||||||||||||||||||||||||
| Fixed-maturity investments: |
||||||||||||||||||||||||
| U.S. Treasury and government agency |
$ | 197 | $ | — | $ | 175 | $ | (3) | $ | 372 | $ | (3) | ||||||||||||
| State and municipal bonds |
60 | (1) | 257 | (7) | 317 | (8) | ||||||||||||||||||
| Foreign governments |
20 | — | — | — | 20 | — | ||||||||||||||||||
| Corporate obligations |
468 | (1) | 251 | (91) | 719 | (92) | ||||||||||||||||||
| Mortgage-backed securities: |
||||||||||||||||||||||||
| Residential mortgage-backed agency |
16 | — | 387 | (7) | 403 | (7) | ||||||||||||||||||
| Residential mortgage-backed non-agency |
10 | — | 19 | (4) | 29 | (4) | ||||||||||||||||||
| Commercial mortgage-backed |
4 | — | 6 | — | 10 | — | ||||||||||||||||||
| Asset-backed securities: |
||||||||||||||||||||||||
| Collateralized debt obligations |
1 | — | 81 | (21) | 82 | (21) | ||||||||||||||||||
| Other asset-backed |
69 | — | 44 | (12) | 113 | (12) | ||||||||||||||||||
|
|
|
|
|
|
|
|
|
|
|
|
|
|||||||||||||
| Total fixed-maturity investments |
845 | (2) | 1,220 | (145) | 2,065 | (147) | ||||||||||||||||||
| Perpetual debt and equity securities |
6 | — | — | — | 6 | — | ||||||||||||||||||
|
|
|
|
|
|
|
|
|
|
|
|
|
|||||||||||||
| Total AFS investments |
$ | 851 | $ | (2) | $ | 1,220 | $ | (145) | $ | 2,071 | $ | (147) | ||||||||||||
|
|
|
|
|
|
|
|
|
|
|
|
|
|||||||||||||
| HTM Investments |
||||||||||||||||||||||||
| Assets of consolidated VIEs: |
||||||||||||||||||||||||
| Corporate obligations |
$ | — | $ | — | $ | 373 | $ | (202) | $ | 373 | $ | (202) | ||||||||||||
|
|
|
|
|
|
|
|
|
|
|
|
|
|||||||||||||
| Total HTM investments |
$ | — | $ | — | $ | 373 | $ | (202) | $ | 373 | $ | (202) | ||||||||||||
|
|
|
|
|
|
|
|
|
|
|
|
|
|||||||||||||
140
Table of Contents
MBIA Inc. and Subsidiaries
Notes to Consolidated Financial Statements
Note 8: Investments (continued)
| December 31, 2013 | ||||||||||||||||||||||||
| Less than 12 Months | 12 Months or Longer | Total | ||||||||||||||||||||||
| In millions |
Fair Value |
Unrealized Losses |
Fair Value |
Unrealized Losses |
Fair Value |
Unrealized Losses |
||||||||||||||||||
| AFS Investments |
||||||||||||||||||||||||
| Fixed-maturity investments: |
||||||||||||||||||||||||
| U.S. Treasury and government agency |
$ | 269 | $ | (9) | $ | 1 | $ | — | $ | 270 | $ | (9) | ||||||||||||
| State and municipal bonds |
1,112 | (65) | 49 | (8) | 1,161 | (73) | ||||||||||||||||||
| Foreign governments |
36 | — | — | — | 36 | — | ||||||||||||||||||
| Corporate obligations |
788 | (30) | 82 | (8) | 870 | (38) | ||||||||||||||||||
| Mortgage-backed securities: |
||||||||||||||||||||||||
| Residential mortgage-backed agency |
713 | (23) | 144 | (8) | 857 | (31) | ||||||||||||||||||
| Residential mortgage-backed non-agency |
17 | — | 22 | (5) | 39 | (5) | ||||||||||||||||||
| Commercial mortgage-backed |
11 | (1) | — | — | 11 | (1) | ||||||||||||||||||
| Asset-backed securities: |
||||||||||||||||||||||||
| Collateralized debt obligations |
6 | — | 124 | (57) | 130 | (57) | ||||||||||||||||||
| Other asset-backed |
21 | — | 57 | (15) | 78 | (15) | ||||||||||||||||||
|
|
|
|
|
|
|
|
|
|
|
|
|
|||||||||||||
| Total fixed-maturity investments |
2,973 | (128) | 479 | (101) | 3,452 | (229) | ||||||||||||||||||
| Perpetual debt and equity securities |
5 | — | — | — | 5 | — | ||||||||||||||||||
|
|
|
|
|
|
|
|
|
|
|
|
|
|||||||||||||
| Total AFS investments |
$ | 2,978 | $ | (128) | $ | 479 | $ | (101) | $ | 3,457 | $ | (229) | ||||||||||||
|
|
|
|
|
|
|
|
|
|
|
|
|
|||||||||||||
| HTM Investments |
||||||||||||||||||||||||
| Assets of consolidated VIEs: |
||||||||||||||||||||||||
| Corporate obligations |
$ | — | $ | — | $ | 1,244 | $ | (181) | $ | 1,244 | $ | (181) | ||||||||||||
|
|
|
|
|
|
|
|
|
|
|
|
|
|||||||||||||
| Total HTM investments |
$ | — | $ | — | $ | 1,244 | $ | (181) | $ | 1,244 | $ | (181) | ||||||||||||
|
|
|
|
|
|
|
|
|
|
|
|
|
|||||||||||||
Gross unrealized losses on AFS securities decreased as of December 31, 2014 compared with December 31, 2013 primarily due to market price appreciation caused by declining interest rates. Gross unrealized losses on HTM securities increased as of December 31, 2014 compared with December 31, 2013 primarily due to market price depreciation caused by the widening of credit spreads.
With the weighting applied on the fair value of each security relative to the total fair value, the weighted average contractual maturity of securities in an unrealized loss position as of December 31, 2014 and 2013 was 13 and 18 years, respectively. As of December 31, 2014 and 2013, there were 143 and 77 securities, respectively, that were in an unrealized loss position for a continuous twelve-month period or longer, of which the fair values of 23 and 50 securities, respectively, were below book value by more than 5%.
The following table presents the distribution of securities in an unrealized loss position for a continuous twelve-month period or longer where fair value was below book value by more than 5% as of December 31, 2014:
| AFS Securities | HTM Securities | |||||||||||||||||||||||
| Percentage of Fair Value |
Number of Securities |
Book Value (in millions) |
Fair Value (in millions) |
Number of Securities |
Book Value (in millions) |
Fair Value (in millions) |
||||||||||||||||||
| > 5% to 15% |
12 | $ | 58 | $ | 53 | — | $ | — | $ | — | ||||||||||||||
| > 15% to 25% |
5 | 78 | 61 | — | — | — | ||||||||||||||||||
| > 25% to 50% |
2 | 1 | 1 | 1 | 575 | 373 | ||||||||||||||||||
| > 50% |
3 | 129 | 25 | — | — | — | ||||||||||||||||||
|
|
|
|
|
|
|
|
|
|
|
|
|
|||||||||||||
| Total |
22 | $ | 266 | $ | 140 | 1 | $ | 575 | $ | 373 | ||||||||||||||
|
|
|
|
|
|
|
|
|
|
|
|
|
|||||||||||||
141
Table of Contents
MBIA Inc. and Subsidiaries
Notes to Consolidated Financial Statements
Note 8: Investments (continued)
The following table presents the fair value and gross unrealized loss by credit rating category of ABS, MBS and corporate obligations included in the Company’s consolidated AFS investment portfolio as of December 31, 2014 for which fair value was less than amortized cost. The credit ratings are based on ratings from Moody’s as of December 31, 2014 or an alternate ratings source, such as S&P, when a security is not rated by Moody’s. For investments that are insured by various third-party guarantee insurers, the credit rating reflects the higher of the insurer’s rating or the underlying bond’s rating.
| In millions |
Aaa | Aa | A | Baa | Below Investment Grade |
Not Rated | Total | |||||||||||||||||||||||||||||||||||||||||||||||||
| Asset Type |
Fair Value |
Unrealized Loss |
Fair Value |
Unrealized Loss |
Fair Value |
Unrealized Loss |
Fair Value |
Unrealized Loss |
Fair Value |
Unrealized Loss |
Fair Value |
Unrealized Loss |
Fair Value |
Unrealized Loss |
||||||||||||||||||||||||||||||||||||||||||
| ABS |
$ | 58 | $ | — | $ | 55 | $ | (2) | $ | 9 | $ | — | $ | 4 | $ | — | $ | 69 | $ | (31) | $ | — | $ | — | $ | 195 | $ | (33) | ||||||||||||||||||||||||||||
| MBS |
412 | (7) | 2 | — | 1 | — | 3 | — | 9 | — | 15 | (4) | 442 | (11) | ||||||||||||||||||||||||||||||||||||||||||
| Corporate obligations |
249 | — | 201 | (2) | 203 | (3) | 40 | (1) | 3 | — | 23 | (86) | 719 | (92) | ||||||||||||||||||||||||||||||||||||||||||
|
|
|
|
|
|
|
|
|
|
|
|
|
|
|
|
|
|
|
|
|
|
|
|
|
|
|
|
|
|||||||||||||||||||||||||||||
| Total |
$ | 719 | $ | (7) | $ | 258 | $ | (4) | $ | 213 | $ | (3) | $ | 47 | $ | (1) | $ | 81 | $ | (31) | $ | 38 | $ | (90) | $ | 1,356 | $ | (136) | ||||||||||||||||||||||||||||
|
|
|
|
|
|
|
|
|
|
|
|
|
|
|
|
|
|
|
|
|
|
|
|
|
|
|
|
|
|||||||||||||||||||||||||||||
The total ABS, MBS and corporate obligations reported in the preceding table include those which are guaranteed by financial guarantors. In addition, the following table presents information on ABS and MBS guaranteed by the Company and third-party financial guarantors.
| Insured Securities Rated Below Investment Grade without the Effect of Guarantee |
||||||||||||
| Asset Type |
Average Credit Rating with the Effect of Guarantee |
Average Credit Rating without the Effect of Guarantee |
(in millions) | Percentage | ||||||||
| Fair Value | ||||||||||||
| ABS |
Baa | Below Investment Grade | $ | 67 | 56% | |||||||
| MBS |
Below Investment Grade | Below Investment Grade | 5 | 100% | ||||||||
Refer to the table in the “Determination of Credit Loss Guaranteed by the Company and Other Third-Party Guarantors” section within the OTTI section of this note for information on the insured securities included in the table above.
The Company concluded that it does not have the intent to sell securities in an unrealized loss position and it is more likely than not, that it would not have to sell these securities before recovery of their cost basis. In making this conclusion, the Company examined the cash flow projections for its investment portfolios, the potential sources and uses of cash in its businesses, and the cash resources available to its business other than sales of securities. It also considered the existence of any risk management or other plans as of December 31, 2014 that would require the sale of impaired securities. Impaired securities that the Company intends to sell before the expected recovery of such securities’ fair values have been written down to fair value.
Other-Than-Temporary Impairments
Evaluating AFS Securities for OTTI
The Company has an ongoing review process for all securities in its investment portfolio, including a quarterly assessment of OTTI. This evaluation includes both qualitative and quantitative considerations. In assessing whether a decline in value is related to a credit loss, the Company considers several factors, including but not limited to (i) the magnitude and duration of declines in fair value; (ii) the reasons for the declines in fair value, such as general credit spread movements in each asset-backed sector, transaction-specific changes in credit spreads, credit rating downgrades, modeled defaults, and principal and interest payment priorities within each investment structure; and (iii) any guarantees associated with a security such as those provided by financial guarantee insurance companies, including MBIA Corp. and National.
In calculating credit-related losses, the Company utilizes cash flow modeling based on the type of security. The Company’s cash flow analysis considers all sources of cash, including credit enhancement, that support the payment of amounts owed by an issuer of a security.
142
Table of Contents
MBIA Inc. and Subsidiaries
Notes to Consolidated Financial Statements
Note 8: Investments (continued)
This includes the consideration of cash expected to be provided by financial guarantors, including MBIA Corp., resulting from an actual or potential insurance policy claim. In general, any change in the amount and/or timing of cash flows received or expected to be received, whether or not such cash flows are contractually defined, is reflected in the Company’s cash flow analysis for purposes of assessing an OTTI loss on an impaired security.
Each quarter, an internal committee, comprising staff that is independent of the Company’s evaluation process for determining OTTI of securities, reviews and approves the valuation of investments. Among other responsibilities, this committee ensures that the Company’s process for identifying and calculating OTTI, including the use of models and assumptions, is reasonable and complies with the Company’s internal policy.
Determination of Credit Loss on ABS, MBS and Corporate Obligations
ABS investments are evaluated for OTTI using historical collateral performance, deal waterfall and structural protections, credit ratings, and forward looking projections of collateral performance based on business and economic conditions specific to each collateral type and risk. The underlying collateral is evaluated to identify any specific performance concerns, and stress scenarios are considered in forecasting ultimate returns of principal. Based on this evaluation, if a principal default is projected for a security, estimated future cash flows are discounted at the security’s interest rate used to recognize interest income on the security. For CDO investments, the Company utilizes the same tools as its RMBS investments discussed below, aggregating the bond level cash flows to the CDO investment level. If the present value of cash flows is less than the Company’s amortized cost for the security, the difference is recorded as an OTTI loss.
RMBS investments are evaluated for OTTI using several quantitative tools. Loan level data is obtained and analyzed in a model that produces prepayment, default, and severity vectors. The model utilizes macro inputs, including housing price assumptions and interest rates. The vector outputs are used as inputs to a third-party cash flow model, which considers deal waterfall dynamics and structural features, to generate cash flows for an RMBS investment. The expected cash flows of the security are then discounted at the interest rate used to recognize interest income of the security to arrive at a present value amount. If the present value of the cash flows is less than the Company’s amortized cost for the investment, the difference is recorded as an OTTI loss.
Corporate obligation investments are evaluated for OTTI using credit analysis techniques. The Company’s analysis includes a detailed review of a number of quantitative and qualitative factors impacting the value of an individual security. These factors include the interest rate of the security (fixed or floating), the security’s current market spread, any collateral supporting the security, the security’s position in the issuer’s capital structure, and credit rating upgrades or downgrades. Additionally, these factors include an assessment of various issuer-related credit metrics including market capitalization, earnings, cash flow, capitalization, interest coverage, leverage, liquidity, management and a third-party quantitative default probability model. The Company’s analysis is augmented by comparing market prices for similar securities of other issuers in the same sector, as well as any recent corporate or government actions that may impact the ultimate return of principal. If the Company determines that a principal default is projected, a recovery analysis is performed using the above data. If the Company’s estimated recovery value for the security is less than its amortized cost, the difference is recorded as an OTTI loss.
Determination of Credit Loss Guaranteed by the Company and Other Third-Party Guarantors
The Company does not record OTTI related to credit concerns about issuers of securities insured by MBIA Corp. and National since investors in these securities, including MBIA, are guaranteed payment of principal and interest when due by MBIA. Securities insured by the Company, whether or not owned by the Company, are evaluated for impairment as part of its insurance surveillance process and, therefore, losses on securities insured by the Company are recorded in accordance with its loss reserving policy. Refer to “Note 2: Significant Accounting Policies” included herein for information about the Company’s loss reserving policy and “Note 6: Loss and Loss Adjustment Expense Reserves” for information about loss reserves.
143
Table of Contents
MBIA Inc. and Subsidiaries
Notes to Consolidated Financial Statements
Note 8: Investments (continued)
In considering cash expected to be provided from other third-party financial guarantors, the Company assesses the financial guarantor’s ability to make claim payments under a variety of scenarios that test the guarantor’s ultimate claims paying ability. The weighted average outcome of these scenarios, combined with the cash flows provided by the insured security, are used to determine the recoverability of the Company’s amortized cost.
The following table provides information about securities held by the Company as of December 31, 2014 that were in an unrealized loss position and insured by a financial guarantor, along with the amount of insurance loss reserves corresponding to the par amount owned by the Company:
| In millions |
Fair Value | Unrealized Loss |
Insurance Loss Reserve(2) |
|||||||||
| Asset-backed: |
||||||||||||
| MBIA(1) |
$ | 113 | $ | (31) | $ | 38 | ||||||
| Other |
8 | (2) | — | |||||||||
|
|
|
|
|
|
|
|||||||
| Total asset-backed |
121 | (33) | 38 | |||||||||
| Mortgage-backed: |
||||||||||||
| MBIA(1) |
4 | — | 1 | |||||||||
| Other |
1 | — | — | |||||||||
|
|
|
|
|
|
|
|||||||
| Total mortgage-backed |
5 | — | 1 | |||||||||
| Other: |
||||||||||||
| MBIA(1) |
21 | (4) | — | |||||||||
|
|
|
|
|
|
|
|||||||
| Total other |
21 | (4) | — | |||||||||
|
|
|
|
|
|
|
|||||||
| Total |
$ | 147 | $ | (37) | $ | 39 | ||||||
|
|
|
|
|
|
|
|||||||
(1)—Includes investments insured by MBIA Corp. and National.
(2)—Insurance loss reserve estimates are based on the proportion of par value owned to the total amount of par value insured.
144
Table of Contents
MBIA Inc. and Subsidiaries
Notes to Consolidated Financial Statements
Note 8: Investments (continued)
Credit Loss Rollforward
The portion of certain OTTI losses on fixed-maturity securities that does not represent credit losses is recognized in AOCI. For these impairments, the net amount recognized in earnings represents the difference between the amortized cost of the security and the net present value of its projected future discounted cash flows prior to impairment. Any remaining difference between the fair value and amortized cost is recognized in AOCI. The following table presents the amount of credit loss impairments recognized in earnings on fixed-maturity securities held by MBIA as of the dates indicated, for which a portion of the OTTI losses was recognized in AOCI, and the corresponding changes in such amounts. For 2014, the Company recognized additional credit loss impairments by discounting the projected cash flows to estimate the portion of loss in value attributable to the credit. This OTTI loss was primarily related to a corporate obligation security that incurred liquidity concerns, downgrades in credit and other adverse financial conditions. The additional credit loss impairment in 2012 primarily related to CDOs that the Company considered the fair value to be the most relevant indicator of the recovery value.
| In millions |
Years Ended December 31, | |||||||||||
| Credit Losses Recognized in Earnings Related to OTTI |
2014 | 2013 | 2012 | |||||||||
| Beginning balance |
$ | 175 | $ | 197 | $ | 341 | ||||||
| Additions for credit loss impairments recognized in the current period on securities not previously impaired |
15 | — | — | |||||||||
| Additions for credit loss impairments recognized in the current period on securities previously impaired |
1 | — | 8 | |||||||||
| Reductions for credit loss impairments previously recognized on securities sold during the period |
(174) | (16) | (41) | |||||||||
| Reductions for credit loss impairments previously recognized on securities impaired to fair value during the period(1) |
— | — | (111) | |||||||||
| Reductions for increases in cash flows expected to be collected over the remaining life of the security |
(1) | (6) | — | |||||||||
|
|
|
|
|
|
|
|||||||
| Ending balance |
$ | 16 | $ | 175 | $ | 197 | ||||||
|
|
|
|
|
|
|
|||||||
(1)—Represents circumstances where the Company determined in the current period that it intends to sell the security or it is more likely than not that it will be required to sell the security before recovery of the security’s amortized cost.
Sales of Available-for-Sale Investments
Gross realized gains and losses are recorded within “Net gains (losses) on financial instruments at fair value and foreign exchange” on the Company’s consolidated statements of operations. The proceeds and the gross realized gains and losses from sales of fixed-maturity securities held as AFS for years ended December 31, 2014, 2013 and 2012 are as follows:
| Years Ended December 31, | ||||||||||||
| In millions |
2014 | 2013 | 2012 | |||||||||
| Proceeds from sales |
$ | 757 | $ | 1,726 | $ | 4,658 | ||||||
| Gross realized gains |
$ | 66 | $ | 57 | $ | 196 | ||||||
| Gross realized losses |
$ | (15) | $ | (29) | $ | (127) | ||||||
145
Table of Contents
MBIA Inc. and Subsidiaries
Notes to Consolidated Financial Statements
Note 9: Derivative Instruments
Overview
MBIA has entered into derivative instruments through its financial guarantee of CDS and for purposes of managing risks associated with existing assets and liabilities. In certain instances, the Company purchased or issued securities that contain embedded derivatives that were separated from the host contract and accounted for as derivative instruments. In accordance with the accounting guidance for derivative instruments and hedging activities, the balance sheet location of the Company’s embedded derivative instruments is determined by the location of the related security. Derivative instruments are recorded at fair value on the Company’s consolidated balance sheets with the changes in fair value recorded on the Company’s consolidated statements of operations within “Unrealized gains (losses) on insured derivatives,” for the insured derivatives, or “Net gains (losses) on financial instruments at fair value and foreign exchange” for the embedded derivatives. Refer to “Note 7: Fair Value of Financial Instruments” for the method of determining the fair value of derivative instruments.
U.S. Public Finance Insurance
The Company’s derivative exposure within its U.S. public finance insurance operations primarily consists of insured interest rate and inflation-linked swaps related to insured U.S. public finance debt issues. These derivatives do not qualify for the financial guarantee scope exception and are accounted for as derivative instruments.
International and Structured Finance Insurance
The Company entered into derivative instruments that it viewed as an extension of its core financial guarantee business that do not qualify for the financial guarantee scope exception and, therefore, are accounted for as derivative instruments. These insured CDS contracts, primarily referencing corporate, asset-backed, residential mortgage-backed, commercial mortgage-backed, CRE loans and CDO securities, are intended to be held for the entire term of the contract absent a negotiated settlement with the counterparty.
Changes in the fair value of derivatives, excluding insured derivatives, are recorded each period in current earnings within “Net gains (losses) on financial instruments at fair value and foreign exchange.” Changes in the fair value of insured derivatives are recorded each period in current earnings within “Net change in fair value of insured derivatives.” The net change in the fair value of the Company’s insured derivatives has two primary components: (i) realized gains (losses) and other settlements on insured derivatives and (ii) unrealized gains (losses) on insured derivatives. “Realized gains (losses) and other settlements on insured derivatives” include (i) premiums received and receivable on sold CDS contracts, (ii) premiums paid and payable to reinsurers in respect to CDS contracts, (iii) net amounts received or paid on reinsurance commutations, (iv) losses paid and payable to CDS contract counterparties due to the occurrence of a credit event or settlement agreement, (v) losses recovered and recoverable on purchased CDS contracts due to the occurrence of a credit event or settlement agreement and (vi) fees relating to CDS contracts. The “Unrealized gains (losses) on insured derivatives” include all other changes in fair value of the insured derivative contracts.
The Company has also entered into a derivative contract as a result of a commutation occurring in 2014. Changes in the fair value of the Company’s non-insured derivative are included in “Net gains (losses) on financial instruments at fair value and foreign exchange” on the Company’s consolidated statements of operations.
Variable Interest Entities
VIEs consolidated by the Company have entered into derivative instruments consisting of interest rate caps and cross currency swaps. Interest rate caps are entered into to mitigate the risks associated with fluctuations in interest rates or fair values of certain contracts. Cross currency swaps are entered into to manage the variability in cash flows resulting from fluctuations in foreign currency rates.
146
Table of Contents
MBIA Inc. and Subsidiaries
Notes to Consolidated Financial Statements
Note 9: Derivative Instruments (continued)
Corporate
The Company has entered into derivative instruments primarily consisting of interest rate swaps. Interest rate swaps are entered into to manage the risks associated with fluctuations in interest rates or fair values of certain contracts.
Changes in the fair value of these derivatives are recorded on the Company’s consolidated statements of operations within “Net gains (losses) on financial instruments at fair value and foreign exchange.”
Credit Derivatives Sold
The following tables present information about credit derivatives sold by the Company’s insurance operations that were outstanding as of December 31, 2014 and 2013. Credit ratings represent the lower of underlying ratings assigned to the collateral by Moody’s, S&P or MBIA.
| $ in millions |
As of December 31, 2014 | |||||||||||||||||||||||||||||||
| Notional Value | ||||||||||||||||||||||||||||||||
| Credit Derivatives Sold |
Weighted Average Remaining Expected Maturity |
AAA | AA | A | BBB | Below Investment Grade |
Total Notional |
Fair Value Asset (Liability) |
||||||||||||||||||||||||
| Insured credit default swaps |
1.6 Years | $ | 6,914 | $ | 246 | $ | 968 | $ | 193 | $ | 1,160 | $ | 9,481 | $ | (244) | |||||||||||||||||
| Insured swaps |
16.7 Years | — | 117 | 2,935 | 970 | 22 | 4,044 | (2) | ||||||||||||||||||||||||
|
|
|
|
|
|
|
|
|
|
|
|
|
|
|
|||||||||||||||||||
| Total notional |
$ | 6,914 | $ | 363 | $ | 3,903 | $ | 1,163 | $ | 1,182 | $ | 13,525 | ||||||||||||||||||||
|
|
|
|
|
|
|
|
|
|
|
|
|
|||||||||||||||||||||
| Total fair value |
$ | (2) | $ | — | $ | (2) | $ | (2) | $ | (240) | $ | (246) | ||||||||||||||||||||
|
|
|
|
|
|
|
|
|
|
|
|
|
|||||||||||||||||||||
| $ in millions |
As of December 31, 2013 | |||||||||||||||||||||||||||||||
| Notional Value | ||||||||||||||||||||||||||||||||
| Credit Derivatives Sold |
Weighted Average Remaining Expected Maturity |
AAA | AA | A | BBB | Below Investment Grade |
Total Notional |
Fair Value Asset (Liability) |
||||||||||||||||||||||||
| Insured credit default swaps |
2.6 Years | $ | 7,406 | $ | 1,972 | $ | 1,068 | $ | 7,552 | $ | 5,956 | $ | 23,954 | $ | (1,132) | |||||||||||||||||
| Insured swaps |
18.5 Years | — | 77 | 3,282 | 1,586 | — | 4,945 | (5) | ||||||||||||||||||||||||
| All others |
28.0 Years | — | — | — | — | 36 | 36 | (15) | ||||||||||||||||||||||||
|
|
|
|
|
|
|
|
|
|
|
|
|
|
|
|||||||||||||||||||
| Total notional |
$ | 7,406 | $ | 2,049 | $ | 4,350 | $ | 9,138 | $ | 5,992 | $ | 28,935 | ||||||||||||||||||||
|
|
|
|
|
|
|
|
|
|
|
|
|
|||||||||||||||||||||
| Total fair value |
$ | (2) | $ | — | $ | (3) | $ | (78) | $ | (1,069) | $ | (1,152) | ||||||||||||||||||||
|
|
|
|
|
|
|
|
|
|
|
|
|
|||||||||||||||||||||
Internal credit ratings assigned by MBIA on the underlying collateral are derived by the Company’s surveillance group. In assigning an internal rating, current status reports from issuers and trustees, as well as publicly available transaction-specific information, are reviewed. Also, where appropriate, cash flow analyses and collateral valuations are considered. The maximum potential amount of future payments (undiscounted) on CDS contracts are estimated as the notional value plus any additional debt service costs, such as interest or other amounts owing on CDS contracts. The maximum amount of future payments that MBIA may be required to make under these guarantees as of December 31, 2014 is $9.7 billion. This amount is net of $13 million of insured derivatives ceded under reinsurance agreements in which MBIA economically hedges a portion of the credit and market risk associated with its insured derivatives and offsetting agreements with a counterparty. The maximum potential amount of future payments (undiscounted) on insured swaps are estimated as the notional value of such contracts.
MBIA may hold recourse provisions with third parties in derivative instruments through both reinsurance and subrogation rights. MBIA’s reinsurance arrangements provide that in the event MBIA pays a claim under a guarantee of a derivative contract, MBIA has the right to collect amounts from any reinsurers that have reinsured the guarantee on either a proportional or non-proportional basis, depending upon the underlying reinsurance agreement. MBIA may also have recourse through subrogation rights whereby if MBIA makes a claim payment, it may be entitled to any rights of the insured counterparty, including the right to any assets held as collateral.
147
Table of Contents
MBIA Inc. and Subsidiaries
Notes to Consolidated Financial Statements
Note 9: Derivative Instruments (continued)
Counterparty Credit Risk
The Company manages counterparty credit risk on an individual counterparty basis through master netting agreements covering derivative instruments in the corporate segment. These agreements allow the Company to contractually net amounts due from a counterparty with those amounts due to such counterparty when certain triggering events occur. The Company only executes swaps under master netting agreements, which typically contain mutual credit downgrade provisions that generally provide the ability to require assignment or termination in the event either MBIA or the counterparty is downgraded below a specified credit rating.
Under these agreements, the Company may receive or provide U.S. Treasury and other highly rated securities or cash to secure counterparties’ exposure to the Company or its exposure to counterparties, respectively. Such collateral is available to the holder to pay for replacing the counterparty in the event that the counterparty defaults. As of December 31, 2014, the Company did not hold cash collateral to derivative counterparties but posted cash collateral to derivative counterparties of $12 million. All of the $12 million is included within “Other liabilities” as cash collateral netted against accrued interest on derivative liabilities. As of December 31, 2013, the Company did not hold cash collateral to derivative counterparties but posted cash collateral to derivative counterparties of $160 million. Of this amount, $123 million is netted within “Derivative liabilities”, $16 million is included within “Other liabilities” as cash collateral netted against accrued interest on derivative liabilities and an additional $21 million is included in “Other assets” on the Company’s consolidated balance sheets. As of December 31, 2014, the Company had securities with a fair value of $198 million posted to derivative counterparties and this amount is included within “Fixed-maturity securities held as available-for-sale, at fair value” on the Company’s consolidated balance sheet. As of December 31, 2013, the Company had securities with a fair value of $42 million posted to derivative counterparties and this amount is included within “Fixed-maturity securities held as available-for-sale, at fair value” on the Company’s consolidated balance sheet.
As of December 31, 2014 and 2013, the fair value on one Credit Support Annex (“CSA”) was $2 and $4 million, respectively. This CSA governs collateral posting requirements between MBIA and its derivative counterparties. The Company did not receive collateral due to the Company’s credit rating, which was below the CSA minimum credit ratings level for holding counterparty collateral. As of December 31, 2014 and 2013, the counterparty was rated A2 by Moody’s and A by S&P.
Financial Statement Presentation
The fair value of amounts recognized for eligible derivative contracts executed with the same counterparty under a master netting agreement, including any cash collateral that may have been received or posted by the Company, is presented on a net basis in accordance with accounting guidance for the offsetting of fair value amounts related to derivative instruments. Insured CDSs and insured swaps are not subject to master netting agreements. VIE derivative assets and liabilities are not presented net of any master netting agreements. Counterparty netting of derivative assets and liabilities offsets balances in “Interest rate swaps” as of December 31, 2014 and 2013.
As of December 31, 2014, the total fair value of the Company’s derivative assets, after counterparty netting of $81 million, was $10 million, of which $2 million was reported within “Other assets” on the Company’s consolidated balance sheets. Embedded derivatives of $8 million were reported within “Medium-term notes” on the Company’s consolidated balance sheets.
As of December 31, 2014, the total fair value of the Company’s derivative liabilities, after counterparty netting of $81 million was $456 million, of which $437 million was reported within “Derivative liabilities” and “Derivative liabilities” presented under “Liabilities of consolidated variable interest entities” on the Company’s consolidated balance sheets. Embedded derivatives of $19 million were reported within “Medium-term notes” on the Company’s consolidated balance sheets.
148
Table of Contents
MBIA Inc. and Subsidiaries
Notes to Consolidated Financial Statements
Note 9: Derivative Instruments (continued)
The following table presents the total fair value of the Company’s derivative assets and liabilities by instrument and balance sheet location, before counterparty netting and posting of cash collateral, as of December 31, 2014:
| In millions |
Derivative Assets(1) |
Derivative Liabilities(1) |
||||||||||||||
| Derivative Instruments |
Notional Amount Outstanding |
Balance Sheet |
Fair Value |
Balance Sheet Location |
Fair Value |
|||||||||||
| Not designated as hedging instruments: |
||||||||||||||||
| Insured credit default swaps |
$ | 9,481 | Other assets | $ | — | Derivative liabilities | $ | (244) | ||||||||
| Insured swaps |
4,044 | Other assets | — | Derivative liabilities | (2) | |||||||||||
| Interest rate swaps |
1,450 | Other assets | 83 | Derivative liabilities | (248) | |||||||||||
| Interest rate swaps-embedded |
437 | Medium-term notes | 8 | Medium-term notes | (19) | |||||||||||
| Currency swaps-VIE |
91 | Other assets-VIE | — | Derivative liabilities-VIE | — | |||||||||||
| All other |
83 | Other assets | — | Derivative liabilities | (24) | |||||||||||
| All other-VIE |
241 | Other assets-VIE | — | Derivative liabilities-VIE | — | |||||||||||
| All other-embedded |
12 | Other investments | — | Other investments | — | |||||||||||
|
|
|
|
|
|
|
|||||||||||
| Total non-designated derivatives |
$ | 15,839 | $ | 91 | $ | (537) | ||||||||||
|
|
|
|
|
|
|
|||||||||||
(1)—In accordance with the accounting guidance for derivative instruments and hedging activities, the balance sheet location of the Company’s embedded derivative instruments is determined by the location of the related host contract.
As of December 31, 2013, the total fair value of the Company’s derivative assets, after counterparty netting of $42 million, was $13 million, of which $4 million was reported within “Other assets” on the Company’s consolidated balance sheets. Embedded derivatives of $9 million were reported within “Medium-term notes” on the Company’s consolidated balance sheets.
As of December 31, 2013, the total fair value of the Company’s derivative liabilities, after counterparty netting of $42 million and cash collateral posted by the Company of $123 million, was $1.2 billion which was reported within “Derivative liabilities” and “Derivative liabilities” presented under “Liabilities of consolidated variable interest entities” on the Company’s consolidated balance sheets. Embedded derivatives of $19 million were reported within “Medium-term notes” and “Other investments” on the Company’s consolidated balance sheets.
The following table presents the total fair value of the Company’s derivative assets and liabilities by instrument and balance sheet location, before counterparty netting and posting of cash collateral, as of December 31, 2013:
| In millions |
Derivative Assets(1) | Derivative Liabilities(1) | ||||||||||||||
| Derivative Instruments |
Notional Amount Outstanding |
Balance Sheet Location | Fair Value |
Balance Sheet Location | Fair Value |
|||||||||||
| Not designated as hedging instruments: |
||||||||||||||||
| Insured credit default swaps |
$ | 23,954 | Other assets | $ | — | Derivative liabilities | $ | (1,132) | ||||||||
| Insured swaps |
4,945 | Other assets | — | Derivative liabilities | (5) | |||||||||||
| Interest rate swaps |
1,495 | Other assets | 46 | Derivative liabilities | (165) | |||||||||||
| Interest rate swaps-embedded |
496 | Medium-term notes | 9 | Medium-term notes | (19) | |||||||||||
| Currency swaps-VIE |
99 | Other assets-VIE | — | Derivative liabilities-VIE | (11) | |||||||||||
| All other |
36 | Other assets | — | Derivative liabilities | (15) | |||||||||||
| All other-VIE |
280 | Other assets-VIE | — | Derivative liabilities-VIE | — | |||||||||||
| All other-embedded |
11 | Other investments | — | Other investments | — | |||||||||||
|
|
|
|
|
|
|
|||||||||||
| Total non-designated derivatives |
$ | 31,316 | $ | 55 | $ | (1,347) | ||||||||||
|
|
|
|
|
|
|
|||||||||||
(1)—In accordance with the accounting guidance for derivative instruments and hedging activities, the balance sheet location of the Company’s embedded derivative instruments is determined by the location of the related host contract.
149
Table of Contents
MBIA Inc. and Subsidiaries
Notes to Consolidated Financial Statements
Note 9: Derivative Instruments (continued)
The following table presents the effect of derivative instruments on the consolidated statements of operations for the year ended December 31, 2014:
| In millions |
||||||
| Derivatives Not Designated as Hedging |
Location of Gain (Loss) Recognized in Income
on |
Net Gain (Loss) Recognized in Income |
||||
| Insured credit default swaps |
Unrealized gains (losses) on insured derivatives | $ | 888 | |||
| Insured credit default swaps |
Realized gains (losses) and other settlements on insured derivatives | (413) | ||||
| Interest rate swaps |
Net gains (losses) on financial instruments at fair value and foreign exchange | (78) | ||||
| Currency swaps-VIE |
Net gains (losses) on financial instruments at fair value and foreign exchange-VIE | 11 | ||||
| All other |
Unrealized gains (losses) on insured derivatives | 15 | ||||
| All other |
Net gains (losses) on financial instruments at fair value and foreign exchange | 6 | ||||
| All other |
Realized gains (losses) and other settlements on insured derivatives | (31) | ||||
|
|
|
|||||
| Total |
$ | 398 | ||||
|
|
|
|||||
The following table presents the effect of derivative instruments on the consolidated statements of operations for the year ended December 31, 2013:
| In millions |
||||||
| Derivatives Not Designated as Hedging |
Location of Gain (Loss) Recognized in Income
on |
Net Gain (Loss) Recognized in Income |
||||
| Insured credit default swaps |
Unrealized gains (losses) on insured derivatives | $ | 1,725 | |||
| Insured credit default swaps |
Realized gains (losses) and other settlements on insured derivatives | (1,545) | ||||
| Interest rate swaps |
Net gains (losses) on financial instruments at fair value and foreign exchange | 65 | ||||
| Interest rate swaps-VIE |
Net gains (losses) on financial instruments at fair value and foreign exchange-VIE | 17 | ||||
| Currency swaps |
Net gains (losses) on financial instruments at fair value and foreign exchange | 1 | ||||
| Currency swaps-VIE |
Net gains (losses) on financial instruments at fair value and foreign exchange-VIE | 10 | ||||
| All other |
Unrealized gains (losses) on insured derivatives | 52 | ||||
|
|
|
|||||
| Total |
$ | 325 | ||||
|
|
|
|||||
150
Table of Contents
MBIA Inc. and Subsidiaries
Notes to Consolidated Financial Statements
Note 9: Derivative Instruments (continued)
The following table presents the effect of derivative instruments on the consolidated statements of operations for the year ended December 31, 2012:
| In millions |
||||||
| Derivatives Not Designated as Hedging |
Location of Gain (Loss) Recognized in Income
on |
Net Gain (Loss) Recognized in Income |
||||
| Insured credit default swaps |
Unrealized gains (losses) on insured derivatives | $ | 1,847 | |||
| Insured credit default swaps |
Realized gains (losses) and other settlements on insured derivatives | (406) | ||||
| Insured swaps |
Unrealized gains (losses) on insured derivatives | 1 | ||||
| Non-insured credit default swaps |
Net gains (losses) on financial instruments at fair value and foreign exchange | (1) | ||||
| Non-insured credit default swaps-VIE |
Net gains (losses) on financial instruments at fair value and foreign exchange-VIE | (1) | ||||
| Interest rate swaps |
Net gains (losses) on financial instruments at fair value and foreign exchange | (75) | ||||
| Interest rate swaps-VIE |
Net gains (losses) on financial instruments at fair value and foreign exchange-VIE | 55 | ||||
| Currency swaps |
Net gains (losses) on financial instruments at fair value and foreign exchange | (2) | ||||
| Currency swaps-VIE |
Net gains (losses) on financial instruments at fair value and foreign exchange-VIE | (4) | ||||
| All other |
Unrealized gains (losses) on insured derivatives | 22 | ||||
| All other |
Net gains (losses) on financial instruments at fair value and foreign exchange | 11 | ||||
| All other-VIE |
Net gains (losses) on financial instruments at fair value and foreign exchange-VIE | (2) | ||||
|
|
|
|||||
| Total |
$ | 1,445 | ||||
|
|
|
|||||
Note 10: Debt
Long-Term Debt
The Company’s long-term debt consists of notes and debentures including accrued interest as follows:
| As of December 31, | ||||||||
| In millions |
2014 | 2013 | ||||||
| 6.400% Senior Notes due 2022(1) |
$ | 266 | $ | 266 | ||||
| 7.000% Debentures due 2025 |
56 | 56 | ||||||
| 7.150% Debentures due 2027 |
100 | 100 | ||||||
| 6.625% Debentures due 2028 |
141 | 141 | ||||||
| 5.700% Senior Notes due 2034(2) |
21 | 21 | ||||||
| Accrued interest |
8 | 8 | ||||||
|
|
|
|
|
|||||
| 592 | 592 | |||||||
| 14% Surplus Notes due 2033(3) |
940 | 940 | ||||||
| Accrued interest |
278 | 170 | ||||||
|
|
|
|
|
|||||
| Total |
$ | 1,810 | $ | 1,702 | ||||
|
|
|
|
|
|||||
(1)—Callable on or after August 15, 2006 at 100.00.
(2)—Callable anytime at the greater of 100.00 or the present value of the remaining scheduled payments of principal and interest.
(3)—Callable on or after January 15, 2018 and every fifth anniversary thereafter at 100.00.
151
Table of Contents
MBIA Inc. and Subsidiaries
Notes to Consolidated Financial Statements
Note 10: Debt (continued)
In addition to the preceding table, as of December 31, 2014, National owned $136 million principal amount of the 5.700% Senior Notes due 2034 that are eliminated on a consolidated basis.
The Company’s long-term debt presented in the preceding table is subject to certain restrictive covenants, none of which significantly restrict the Company’s operating activities or dividend-paying ability. As of December 31, 2014 and 2013, the Company was in compliance with all debt covenants as there was no occurrence of any event of default with respect to the above securities. Key events of default include: (i) default in the payment of any interest or principal when it becomes due and payable, (ii) default in the performance, or breach, of any covenant or warranty of MBIA, (iii) in the case of certain long-term debt, MBIA Inc.’s failure to make a payment on certain indebtedness in an amount in excess of $10 million, (iv) in the case of certain series of long-term debt, the Company’s default with respect to certain indebtedness that results in the acceleration of certain indebtedness in an amount in excess of $10 million, (v) entry by a court having jurisdiction in the premises of a decree or order for relief in respect of MBIA, or in the case of certain long-term debt, National, in an involuntary case or proceeding under any applicable federal or state bankruptcy, insolvency, reorganization or other similar law, and (vi) commencement by MBIA of a voluntary case or proceeding under any applicable federal or state bankruptcy, insolvency, reorganization or other similar law.
On January 16, 2008, MBIA Corp. issued $1.0 billion of 14% fixed-to-floating rate surplus notes due January 15, 2033. As of December 31, 2014, MBIA Corp. has repurchased a total of $47 million par value outstanding of its surplus notes at a weighted average price of $77.08 and in addition, MBIA Inc., through its corporate segment, owned $13 million of MBIA Corp. surplus notes. The surplus notes had an initial interest rate of 14% until January 15, 2013 and thereafter have an interest rate of three-month LIBOR plus 11.26%. Interest and principal payments on the surplus notes are subject to prior approval by the Superintendent of the NYSDFS. From the January 15, 2013 interest payment to the present, MBIA Corp.’s requests for approval of the note interest payments have been denied by the NYSDFS. MBIA Corp. provided notice to the Fiscal Agent that it has not made a scheduled interest payment. The deferred interest payment will become due on the first business day on or after which MBIA Corp. obtains approval to make such payment. No interest will accrue on the deferred interest. The surplus notes were callable at par at the option of MBIA Corp. on the fifth anniversary of the date of issuance, and are callable at par on January 15, 2018 and every fifth anniversary thereafter and are callable on any other date at par plus a make-whole amount, subject to prior approval by the Superintendent and other restrictions. The cash received from the issuance of surplus notes was used for general business purposes and the deferred debt issuance costs are being amortized over the term of the surplus notes.
The aggregate maturities of principal payments of long-term debt obligations in each of the next five years ending December 31, and thereafter, are as follows:
| In millions |
2015 | 2016 | 2017 | 2018 | 2019 | Thereafter | Total | |||||||||||||||||||||
| Corporate debt |
$ | — | $ | — | $ | — | $ | — | $ | — | $ | 584 | $ | 584 | ||||||||||||||
| 14% Surplus Notes due 2033(1) |
— | — | — | 940 | — | — | 940 | |||||||||||||||||||||
|
|
|
|
|
|
|
|
|
|
|
|
|
|
|
|||||||||||||||
| Total debt obligations due |
$ | — | $ | — | $ | — | $ | 940 | $ | — | $ | 584 | $ | 1,524 | ||||||||||||||
|
|
|
|
|
|
|
|
|
|
|
|
|
|
|
|||||||||||||||
(1)—Callable on or after January 15, 2018 and every fifth anniversary thereafter at 100.00.
Investment Agreements
Obligations under investment agreement contracts are recorded as liabilities on the Company’s consolidated balance sheets based upon proceeds received plus unpaid accrued interest at the balance sheet date. Upon the occurrence of certain contractually agreed-upon events, some of these funds may be withdrawn by the investor prior to their contractual maturity dates. All of the investment agreements have been collateralized in accordance with the contractual terms. Additionally, certain investment agreements provide for early termination, including, in some cases, with make-whole payments, upon certain other events including the bankruptcy of MBIA Inc. or the commencement of an insolvency proceeding with respect to MBIA Corp.
152
Table of Contents
MBIA Inc. and Subsidiaries
Notes to Consolidated Financial Statements
Note 10: Debt (continued)
Investment agreements have been issued with either fixed or floating interest rates in U.S. dollars. As of December 31, 2014, the annual interest rates on these agreements ranged from 3.48% to 7.38% and the weighted average interest rate was 5.50%. As of December 31, 2013, the annual interest rates on these agreements ranged from 0.21% to 7.38% and the weighted average interest rate was 5.10%. Expected principal payments due under these investment agreements in each of the next five years ending December 31 and thereafter, based upon contractual maturity dates, are as follows:
| In millions |
Principal Amount | |||
| Maturity date: |
||||
| 2015 |
$ | 39 | ||
| 2016 |
40 | |||
| 2017 |
56 | |||
| 2018 |
17 | |||
| 2019 |
8 | |||
| Thereafter |
455 | |||
|
|
|
|||
| Total expected principal payments(1) |
$ | 615 | ||
| Less discount and other adjustments(2) |
68 | |||
|
|
|
|||
| Total |
$ | 547 | ||
|
|
|
|||
(1)—Amounts reflect principal due at maturity for investment agreements issued at a discount.
(2)—Includes discounts of $75 million on investment agreements, net of accrued interest of $7 million.
Medium-Term Notes
MTNs are recorded as liabilities on the Company’s balance sheets based upon proceeds received, net of unamortized discounts and premiums, plus unpaid accrued interest at the balance sheet date. Certain MTNs are measured at fair value in accordance with the accounting guidance for hybrid financial instruments. MTNs are issued by MBIA Global Funding, LLC (“GFL”) with either fixed or floating interest rates and in U.S. dollars and foreign currencies. During the year ended December 31, 2014, the Company retired the remaining $129 million of outstanding MTNs issued by the Company’s conduit segment at a cost of 97% of par value and completed the liquidation this business. The Company also repurchased approximately $122 million par value outstanding of GFL MTNs issued by the Company’s corporate segment at a weighted average cost of approximately 98% of par value. As of December 31, 2014, the interest rates of the MTNs ranged from 0% to 9.08% and the weighted average interest rate was 2.44%. As of December 31, 2013, the interest rates of the MTNs ranged from 0% to 8.93% and the weighted average interest rate was 2.67%. Expected principal payments due under MTN obligations based on their contractual maturity dates are as follows:
| In millions |
Principal Amount | |||
| Maturity date: |
||||
| 2015 |
$ | 102 | ||
| 2016 |
119 | |||
| 2017 |
53 | |||
| 2018 |
59 | |||
| 2019 |
61 | |||
| Thereafter |
1,152 | |||
|
|
|
|||
| Total expected principal payments(1) |
$ | 1,546 | ||
| Less discount and other adjustments(2) |
345 | |||
|
|
|
|||
| Total |
$ | 1,201 | ||
|
|
|
|||
(1)—Amounts reflect principal due at maturity for notes issued at a discount or premium.
(2)—Includes discounts of $306 million, fair value adjustments of $45 million, net of accrued interest of $6 million.
153
Table of Contents
MBIA Inc. and Subsidiaries
Notes to Consolidated Financial Statements
Note 10: Debt (continued)
The Company may buy back and extinguish debt originally issued by either MBIA Inc. or its subsidiaries. Purchase prices are generally negotiated through dealers, similar to buying or selling an asset in the open market. The Company repurchases its debt in an effort to improve its own economic position while also providing liquidity to investors of MBIA debt. In all cases, debt buybacks were executed in response to investor or dealer inquiries.
Variable Interest Entity Notes
VIE notes are variable interest rate debt instruments that were issued primarily in U.S. dollars by consolidated VIEs within the Company’s international and structured finance insurance segment. These VIE notes consist of debt instruments issued by issuer-sponsored consolidated VIEs collateralized by assets held by those consolidated VIEs. In addition, as of December 31, 2014, the Company’s advisory services segment had $431 million of VIE notes that are presented separately in “Liabilities held for sale” on the Company’s consolidated balance sheets. Effective January 1, 2015, the Company completed the sale of its Cutwater business and deconsolidated these VIEs. Refer to “Note 1: Business Developments and Risks and Uncertainties” for additional information about the sale of Cutwater.
The maturity of the Company’s international and structured finance insurance segment’s VIE notes, as of December 31, 2014 is presented in the following table:
| In millions |
||||
| Maturity date: |
||||
| 2015 |
$ | 471 | ||
| 2016 |
336 | |||
| 2017 |
346 | |||
| 2018 |
321 | |||
| 2019 |
299 | |||
| Thereafter |
3,031 | |||
|
|
|
|||
| Total |
$ | 4,804 | (1) | |
|
|
|
|||
(1)—Includes $2.0 billion of VIE notes accounted for at fair value as of December 31, 2014.
Note 11: Income Taxes
Income (loss) from operations before provision (benefit) for income taxes consisted of:
| Years Ended December 31, | ||||||||||||
| In millions |
2014 | 2013 | 2012 | |||||||||
| Domestic |
$ | 574 | $ | 435 | $ | 1,486 | ||||||
| Foreign |
67 | (19) | 112 | |||||||||
|
|
|
|
|
|
|
|||||||
| Income (loss) before income taxes |
$ | 641 | $ | 416 | $ | 1,598 | ||||||
|
|
|
|
|
|
|
|||||||
154
Table of Contents
MBIA Inc. and Subsidiaries
Notes to Consolidated Financial Statements
Note 11: Income Taxes (continued)
The Company files a consolidated tax return that includes all of its U.S. subsidiaries and foreign branches. The Company also files tax returns in the United Kingdom, France, Spain, and various state and local jurisdictions. Income tax expense (benefit) on income (loss) and shareholders’ equity consisted of:
| Years Ended December 31, | ||||||||||||
| In millions |
2014 | 2013 | 2012 | |||||||||
| Current taxes: |
||||||||||||
| Federal |
$ | — | $ | — | $ | 3 | ||||||
| State |
10 | 8 | 2 | |||||||||
| Foreign |
12 | 1 | (6) | |||||||||
| Deferred taxes: |
||||||||||||
| Federal |
48 | 165 | 350 | |||||||||
| Foreign |
2 | (8) | 15 | |||||||||
|
|
|
|
|
|
|
|||||||
| Provision (benefit) for income taxes |
72 | 166 | 364 | |||||||||
|
|
|
|
|
|
|
|||||||
| Income taxes charged (credited) to shareholders’ equity related to: |
||||||||||||
| Change in unrealized gains (losses) on AFS securities |
89 | (81) | 86 | |||||||||
| Change in AFS securities with OTTI |
(29) | 4 | 42 | |||||||||
| Change in foreign currency translation |
(13) | 1 | (2) | |||||||||
| Share-based compensation |
2 | 4 | 7 | |||||||||
|
|
|
|
|
|
|
|||||||
| Total income taxes charged (credited) to shareholders’ equity |
49 | (72) | 133 | |||||||||
|
|
|
|
|
|
|
|||||||
| Total effect of income taxes |
$ | 121 | $ | 94 | $ | 497 | ||||||
|
|
|
|
|
|
|
|||||||
A reconciliation of the U.S. federal statutory tax rate of 35% to the Company’s effective income tax rate for the years ended December 31, 2014, 2013 and 2012 is presented in the following table:
| Years Ended December 31, | ||||||||||||
| 2014 | 2013 | 2012 | ||||||||||
| Federal income tax computed at the statutory rate |
35.0% | 35.0% | 35.0% | |||||||||
| Increase (reduction) in taxes resulting from: |
||||||||||||
| Tax-exempt interest |
(0.5)% | (1.1)% | (0.7)% | |||||||||
| Mark-to-market on warrants |
(1.6)% | 3.8% | (0.7)% | |||||||||
| Change in valuation allowance |
(13.5)% | (12.6)% | (5.6)% | |||||||||
| Change in uncertain tax positions |
(9.1)% | 2.8% | (0.1)% | |||||||||
| State income tax, net of federal benefit |
0.5% | 2.0% | 0.1% | |||||||||
| Out-of-period adjustment |
0.0% | 0.0% | (3.8)% | |||||||||
| Foreign taxes |
(0.5)% | (0.8)% | (1.2)% | |||||||||
| Basis difference in foreign subsidiary |
0.0% | 11.4% | 0.0% | |||||||||
| Other |
0.9% | (0.6)% | (0.2)% | |||||||||
|
|
|
|
|
|
|
|||||||
| Effective tax rate |
11.2% | 39.9% | 22.8% | |||||||||
Deferred Tax Asset, Net of Valuation Allowance
The Company recognizes deferred tax assets and liabilities for the expected future tax consequences of events that have been included in the financial statements or tax returns. Deferred tax assets and liabilities are determined based on the differences between the financial statement and tax bases of assets and liabilities using enacted tax rates in effect for the year in which the differences are expected to reverse. The effect of a change in tax rates on tax assets and liabilities is recognized in income in the period that includes the enactment date.
155
Table of Contents
MBIA Inc. and Subsidiaries
Notes to Consolidated Financial Statements
Note 11: Income Taxes (continued)
The tax effects of temporary differences that give rise to deferred tax assets and liabilities as of December 31, 2014 and 2013 are presented in the following table:
| As of December 31, | ||||||||
| In millions |
2014 | 2013 | ||||||
| Deferred tax liabilities: |
||||||||
| Unearned premium revenue |
$ | 196 | $ | 220 | ||||
| Deferral of cancellation of indebtedness income |
91 | 114 | ||||||
| Deferred acquisition costs |
72 | 87 | ||||||
| Net unrealized gains in accumulated other comprehensive income |
4 | — | ||||||
| Basis difference in foreign subsidiaries |
59 | 48 | ||||||
| Other |
1 | 9 | ||||||
|
|
|
|
|
|||||
| Total gross deferred tax liabilities |
423 | 478 | ||||||
|
|
|
|
|
|||||
| Deferred tax assets: |
||||||||
| Compensation and employee benefits |
30 | 31 | ||||||
| Loss and loss adjustment expense reserves |
69 | 85 | ||||||
| Net operating loss and tax credit carryforwards |
1,150 | 917 | ||||||
| Capital loss carryforward and other-than-temporary impairments |
6 | 93 | ||||||
| Net unrealized losses on insured derivatives |
93 | 400 | ||||||
| Net losses on financial instruments at fair value and foreign exchange |
37 | 47 | ||||||
| Net unrealized losses in accumulated other comprehensive income |
— | 30 | ||||||
| Alternative minimum tax credit carryforward |
22 | 22 | ||||||
| Net deferred taxes on VIEs |
25 | 55 | ||||||
|
|
|
|
|
|||||
| Total gross deferred tax assets |
1,432 | 1,680 | ||||||
|
|
|
|
|
|||||
| Valuation allowance |
— | 93 | ||||||
|
|
|
|
|
|||||
| Net deferred tax asset |
$ | 1,009 | $ | 1,109 | ||||
|
|
|
|
|
|||||
The Company establishes a valuation allowance against its deferred tax asset when it is more likely than not that all or a portion of the deferred tax asset will not be realized. All evidence, both positive and negative, needs to be identified and considered in making the determination. Future realization of the existing deferred tax asset ultimately depends, in part, on the generation of sufficient taxable income of appropriate character (for example, ordinary income versus capital gains) within the carryforward period available under the tax law.
As of December 31, 2014, the Company reported a net deferred tax asset of $1.0 billion, with no valuation allowance. As of December 31, 2013, there was a valuation allowance of $93 million against a portion of the deferred tax asset. The valuation allowance related to losses from asset impairments. The decrease in the valuation allowance was primarily due to the sales of previously impaired assets and a tax planning strategy to use unrealized gains that are included in “Accumulated other comprehensive income (loss)” on the Company’s consolidated balance sheets against any remaining asset impairments.
In accordance with ASU 2013-11, the netting of deferred taxes between different taxpaying jurisdictions is not permitted. As of December 31, 2014, there was also a non U.S. deferred tax liability of $18 million included in “Other liabilities” on the Company’s consolidated balance sheet.
Tax Sharing Agreement
The Company has a tax sharing agreement among its members effective January 1, 1987. The agreement was amended and restated effective September 8, 2011 to change the method of calculating each domestic insurer’s tax liability to the method permitted by paragraph 3(a) of Department Circular Letter #33 (1979). The agreement was submitted to the NYSDFS for review and non-disapproval pursuant to Section 1505 of the New York Insurance Law (“NYIL”). The Company’s tax sharing agreement is filed as an exhibit to this Form 10-K for informational purposes only. Refer to “Note 2: Significant Accounting Policies” for further discussion on the Company’s tax sharing agreement.
156
Table of Contents
MBIA Inc. and Subsidiaries
Notes to Consolidated Financial Statements
Note 11: Income Taxes (continued)
Out-of-Period Adjustment
During the fourth quarter of 2012, the Company completed a balance sheet focused analysis to enhance efficiency and accuracy with its deferred income tax balances, and as a result, identified errors to the current and deferred income tax balances. The Company evaluated the materiality of these errors in accordance with SEC Staff Accounting Bulletin No. 99, Materiality, and SEC Staff Accounting Bulletin No. 108, Considering the Effects of Prior Year Misstatements When Quantifying Misstatements in Current Year Financial Statements, and concluded that these errors, individually and in the aggregate, were immaterial to the year ended December 31, 2012 and all prior periods to which these errors relate. Accordingly, the Company recorded these adjustments in its consolidated financial statements for the year ended December 31, 2012 by increasing “Net income (loss)” by $60 million.
Treatment of Undistributed Earnings of Certain Foreign Subsidiaries—“Accounting for Income Taxes—Special Areas”
In the fourth quarter of 2013, U.S. deferred income taxes were provided on the differences in the book and tax basis in the Company’s carrying value of MBIA UK and certain other entities since the Company no longer intends to permanently reinvest these earnings. The impact is reflected in the Company’s 2013 tax provision.
Accounting for Uncertainty in Income Taxes
The Company’s policy is to record and disclose any change in UTB and related interest and/or penalties to income tax in the consolidated statements of operations. The Company includes interest as a component of income tax expense. All amounts below are reflected before any applicable tax benefit.
| In millions |
||||
| Unrecognized tax benefit as of January 1, 2012 |
$ | 47 | ||
| The gross amount of the increase/(decrease) in the UTB as a result of tax positions taken: |
||||
| During a prior year |
26 | |||
| The amounts of decreases in the UTB as a result of the applicable statute of limitations |
(26) | |||
|
|
|
|||
| Unrecognized tax benefit as of December 31, 2012 |
$ | 47 | ||
| The gross amount of the increase/(decrease) in the UTB as a result of tax positions taken: |
||||
| During the current year |
18 | |||
| The amounts of decreases in the UTB related to settlements with taxing authorities |
— | |||
|
|
|
|||
| Unrecognized tax benefit as of December 31, 2013 |
$ | 65 | ||
| The gross amount of the increase/(decrease) in the UTB as a result of tax positions taken: |
||||
| During a prior year |
(61) | |||
| During the current year |
— | |||
| The amounts of decreases in the UTB related to settlements with taxing authorities |
(4) | |||
| The reduction in the UTB as a result of the applicable statute of limitations |
— | |||
|
|
|
|||
| Unrecognized tax benefit as of December 31, 2014 |
$ | — | ||
|
|
|
|||
The Company does not anticipate any additional amount to reverse in the next twelve months based on settling certain issues.
MBIA and its U.S. subsidiaries file a U.S. consolidated federal income tax return. Federal income tax returns for 2011 through 2013 are subject to examination. The reserve for UTB has decreased during 2014 based on certain positive developments, including the conclusion from an Internal Revenue Service initiated survey of the 2011 consolidated return of MBIA Inc. and its subsidiaries, which has resulted in no change to taxable income. In the fourth quarter of 2014, the Company settled certain state and local examinations which further decreased the reserve.
157
Table of Contents
MBIA Inc. and Subsidiaries
Notes to Consolidated Financial Statements
Note 11: Income Taxes (continued)
The tax authorities in the United Kingdom are currently auditing MBIA UK for tax years 2005 through 2012. On January 24, 2014, the Company provided an independent report to HM Revenue & Customs (“HMRC”). On April 8, 2014, HMRC responded with comments. On June 2, 2014, the Company responded to HMRC’s letter dated April 8, 2014. As of December 31, 2014, no response has been received from HMRC and there has been no resolution.
During 2013, the Company met with New York State Department of Taxation and Finance to discuss the Company’s respective tax positions regarding certain issues related to the 2008 tax year. In the fourth quarter of 2014, the Company settled with the state.
As of December 31, 2014, the Company’s NOL is approximately $3.2 billion. The NOL will expire between tax years 2029 through 2034. As of December 31, 2014, the Company has an alternative minimum tax credit carryforward of $22 million, which does not expire.
Note 12: Business Segments
As defined by segment reporting, an operating segment is a component of a company (i) that engages in business activities from which it earns revenue and incurs expenses, (ii) whose operating results are regularly reviewed by the Chief Operating Decision Maker to assess the performance of the segment and to make decisions about the allocation of resources to the segment and, (iii) for which discrete financial information is available.
The Company manages its businesses across five operating segments: 1) U.S. public finance insurance; 2) international and structured finance insurance; 3) corporate; 4) advisory services; and 5) conduit. The Company’s U.S. public finance insurance business is operated through National, its international and structured finance insurance business is operated through MBIA Corp. and its advisory services business is primarily operated through Cutwater. During 2014, the Company dissolved its conduit segment by extinguishing the remaining liabilities of the segment and liquidating the Company’s remaining conduit, Meridian Funding Company, LLC (“Meridian”). In addition, in the fourth quarter of 2014, the Company entered into an agreement to sell Cutwater to a subsidiary of The Bank of New York Mellon Corporation. This transaction was effective on January 1, 2015 in which, the Company exited its advisory services business.
The Company regularly evaluates its business segment reporting to ensure it reflects management’s perspective and provides discrete financial information on which to assess segment performance. During 2014, the Company continued to realize its business strategy, which included the liquidation of its conduit and advisory services businesses and realigning the management of its asset/liability products and corporate activities. Effective in the fourth quarter of 2014, the Company’s previously reported asset/liability products segment and its corporate segment are managed and reported as a single operating segment referred to as the corporate segment since 1) the previous asset/liability products segment did not represent a future business prospect for the Company and is in wind-down; 2) the Company manages and reports the invested assets and debt obligation liabilities as a single activity; 3) the activities are economically similar as the servicing of the debt obligation liabilities are funded by the same financial resources; and 4) the Company evaluates the performance and resource needs of these activities collectively.
The Company’s new segment reporting structure is reflected in its reporting to its Chief Operating Decision Maker, as well as the senior management team and Board of Directors, who use this information to make key business decisions, assess performance and allocate resources to its segments. Certain prior period amounts within the corporate segment results have been retrospectively revised to reflect the changes in the Company’s reportable segments. Such revisions have no impact on total consolidated revenues, expenses, assets, liabilities, shareholders’ equity, operating cash flows, investing cash flows, or financing cash flows for all periods presented.
158
Table of Contents
MBIA Inc. and Subsidiaries
Notes to Consolidated Financial Statements
Note 12: Business Segments (continued)
The following sections provide a description of each of the Company’s reportable operating segments.
U.S. Public Finance Insurance
The Company’s U.S. public finance insurance segment is principally conducted through National. The financial guarantees issued by National provide unconditional and irrevocable guarantees of the payment of the principal of, and interest or other amounts owing on, U.S. public finance insured obligations when due. The obligations are not subject to acceleration, except that National may have the right, at its discretion, to accelerate insured obligations upon default or otherwise. National issues financial guarantees for municipal bonds, including tax-exempt and taxable indebtedness of U.S. political subdivisions, as well as utility districts, airports, health care institutions, higher educational facilities, student loan issuers, housing authorities and other similar agencies and obligations issued by private entities that finance projects that serve a substantial public purpose. Municipal bonds and privately issued bonds used for the financing of public purpose projects are generally supported by taxes, assessments, fees or tariffs related to the use of these projects, lease payments or other similar types of revenue streams.
International and Structured Finance Insurance
The Company’s international and structured finance insurance segment is principally conducted through MBIA Corp. The financial guarantees issued by MBIA Corp. generally provide unconditional and irrevocable guarantees of the payment of principal of, and interest or other amounts owing on, non-U.S. public finance and global structured finance insured obligations when due, or in the event MBIA Corp. has the right, at its discretion, to accelerate insured obligations upon default or otherwise, upon MBIA Corp.’s acceleration. Certain guaranteed investment contracts written by MBIA Inc. are insured by MBIA Corp., and if MBIA Inc. were to have insufficient assets to pay amounts due upon maturity or termination, MBIA Corp. would make such payments. MBIA Corp. also insures debt obligations of the following affiliates:
| • | MBIA Inc.; |
| • | GFL; |
| • | MBIA Investment Management Corp. (“IMC”); and |
| • | LaCrosse Financial Products, LLC, a wholly-owned affiliate, in which MBIA Corp. has written insurance policies guaranteeing the obligations under CDS, including termination payments that may become due upon certain events including the insolvency or payment default of the financial guarantor or the CDS issuer. |
MBIA Corp. insures non-U.S. public finance and global structured finance, including asset-backed obligations. MBIA Corp. has insured sovereign-related and sub-sovereign bonds, utilities, privately issued bonds used for the financing of projects that include toll roads, bridges, airports, public transportation facilities, and other types of infrastructure projects serving a substantial public purpose. Global structured finance and asset-backed obligations typically are securities repayable from expected cash flows generated by a specified pool of assets, such as residential and commercial mortgages, insurance policies, consumer loans, corporate loans and bonds, trade and export receivables, and leases for equipment, aircraft and real estate property. The Company is no longer insuring new credit derivative contracts except for transactions related to the reduction of existing derivative exposure. MBIA Corp. has not written any meaningful amount of business since 2008.
159
Table of Contents
MBIA Inc. and Subsidiaries
Notes to Consolidated Financial Statements
Note 12: Business Segments (continued)
Corporate
The Company’s corporate segment consists of general corporate activities, including providing general support services to MBIA’s other operating businesses and asset and debt management. General support services are provided by the Company’s service company, MBIA Services Corporation (“MBIA Services”), formerly Optinuity Alliance Resources Corporation. MBIA Services provides various support services including, among others, management, legal, accounting, treasury, information technology, and insurance portfolio surveillance, on a fee-for-service basis. Debt management includes activities related to servicing obligations issued by MBIA Inc. and its subsidiaries, IMC and GFL. MBIA Inc. issued debt to finance the operations of the MBIA group. IMC, along with MBIA Inc., provided customized investment agreements, guaranteed by MBIA Corp., for bond proceeds and other public funds for such purposes as construction, loan origination, escrow and debt service or other reserve fund requirements. It also provided customized products for funds that are invested as part of asset-backed or structured product transactions. GFL raised funds through the issuance of MTNs with varying maturities, which were in turn guaranteed by MBIA Corp. GFL lent the proceeds of these MTN issuances to MBIA Inc. The company ceased issuing these investment agreements and MTNs and the outstanding liability balances and corresponding asset balances have declined over time as liabilities mature, terminate or are retired. All of the debt within the corporate segment is managed collectively and is serviced by the financial resources available to MBIA Inc. Asset management activities support the Company’s funded liabilities, provide for opportunities in investments and provide general liquidity support to MBIA Inc.
Advisory Services
The advisory services segment primarily consists of the operations of Cutwater Investor Services Corp. (“Cutwater-ISC”) and Cutwater Asset Management Corp. (“Cutwater-AMC”) and is a fee-for-service investment management business focused on fixed-income markets. Cutwater-ISC and Cutwater-AMC are Securities and Exchange Commission registered investment advisers. In October of 2014, the Company entered into an agreement to sell Cutwater to a subsidiary of The Bank of New York Mellon Corporation. Effective with the January 1, 2015 sale of Cutwater, MBIA has no business activities within its advisory services segment.
Conduit
The Company’s conduit segment was operated through Meridian and administered through MBIA Asset Finance, LLC. Assets financed by Meridian were funded by MTNs. In 2014, the Company extinguished the remaining liabilities of this segment and liquidated Meridian.
160
Table of Contents
MBIA Inc. and Subsidiaries
Notes to Consolidated Financial Statements
Note 12: Business Segments (continued)
Segments Results
The following tables provide the Company’s segment results for the years ended December 31, 2014, 2013 and 2012:
| Year Ended December 31, 2014 | ||||||||||||||||||||||||||||
| In millions |
U.S. Public Finance Insurance |
International and Structured Finance Insurance |
Corporate | Advisory Services |
Conduit | Eliminations | Consolidated | |||||||||||||||||||||
| Revenues(1) |
$ | 373 | $ | 189 | $ | 42 | $ | 12 | $ | — | $ | — | $ | 616 | ||||||||||||||
| Net change in fair value of insured derivatives |
1 | 458 | — | — | — | — | 459 | |||||||||||||||||||||
| Net gains (losses) on financial instruments at fair value and foreign exchange |
26 | — | 55 | (3) | — | — | 78 | |||||||||||||||||||||
| Net investment losses related to other-than-temporary impairments |
(15) | — | — | — | — | — | (15) | |||||||||||||||||||||
| Net gains (losses) on extinguishment of debt |
— | — | 3 | — | — | — | 3 | |||||||||||||||||||||
| Other net realized gains (losses) |
14 | 12 | 2 | — | — | — | 28 | |||||||||||||||||||||
| Revenues of consolidated VIEs |
— | 105 | — | (8) | 4 | — | 101 | |||||||||||||||||||||
| Inter-segment revenues(2) |
44 | 55 | 46 | 22 | (1) | (166) | — | |||||||||||||||||||||
|
|
|
|
|
|
|
|
|
|
|
|
|
|
|
|||||||||||||||
| Total revenues |
443 | 819 | 148 | 23 | 3 | (166) | 1,270 | |||||||||||||||||||||
| Losses and loss adjustment |
(10) | 143 | — | — | — | — | 133 | |||||||||||||||||||||
| Operating |
38 | 72 | 87 | 42 | — | — | 239 | |||||||||||||||||||||
| Interest |
— | 109 | 101 | — | — | — | 210 | |||||||||||||||||||||
| Expenses of consolidated VIEs |
— | 47 | — | — | — | — | 47 | |||||||||||||||||||||
| Inter-segment expenses(2) |
78 | 64 | 15 | 6 | 9 | (172) | — | |||||||||||||||||||||
|
|
|
|
|
|
|
|
|
|
|
|
|
|
|
|||||||||||||||
| Total expenses |
106 | 435 | 203 | 48 | 9 | (172) | 629 | |||||||||||||||||||||
|
|
|
|
|
|
|
|
|
|
|
|
|
|
|
|||||||||||||||
| Income (loss) before income taxes |
337 | 384 | (55) | (25) | (6) | 6 | 641 | |||||||||||||||||||||
| Provision (benefit) for income taxes |
115 | 134 | (173) | (6) | — | 2 | 72 | |||||||||||||||||||||
|
|
|
|
|
|
|
|
|
|
|
|
|
|
|
|||||||||||||||
| Net income (loss) |
$ | 222 | $ | 250 | $ | 118 | $ | (19) | $ | (6) | $ | 4 | $ | 569 | ||||||||||||||
|
|
|
|
|
|
|
|
|
|
|
|
|
|
|
|||||||||||||||
| Identifiable assets |
$ | 5,887 | $ | 10,086 | $ | 2,846 | $ | 793 | $ | — | $ | (3,328) | (3) | $ | 16,284 | |||||||||||||
|
|
|
|
|
|
|
|
|
|
|
|
|
|
|
|||||||||||||||
(1)—Represents the sum of third-party financial guarantee net premiums earned, net investment income, insurance-related fees and reimbursements, investment management fees and other fees.
(2)—Represents intercompany premium income and expense, intercompany asset management fees and expenses, intercompany interest income and expense pertaining to intercompany receivables and payables and intercompany loans.
(3)—Consists of intercompany reinsurance balances, repurchase agreements and deferred income taxes.
161
Table of Contents
MBIA Inc. and Subsidiaries
Notes to Consolidated Financial Statements
Note 12: Business Segments (continued)
| Year Ended December 31, 2013 | ||||||||||||||||||||||||||||
| In millions |
U.S. Public Finance Insurance |
International and Structured Finance Insurance |
Corporate | Advisory Services |
Conduit | Eliminations | Consolidated | |||||||||||||||||||||
| Revenues(1) |
$ | 425 | $ | 148 | $ | 55 | $ | 16 | $ | — | $ | — | $ | 644 | ||||||||||||||
| Net change in fair value of insured derivatives |
3 | 229 | — | — | — | — | 232 | |||||||||||||||||||||
| Net gains (losses) on financial instruments at fair value and foreign exchange |
29 | 24 | 15 | 1 | — | — | 69 | |||||||||||||||||||||
| Net gains (losses) on extinguishment of debt |
— | — | 22 | — | — | 38 | (3) | 60 | ||||||||||||||||||||
| Other net realized gains (losses) |
(29) | — | — | — | — | — | (29) | |||||||||||||||||||||
| Revenues of consolidated VIEs |
— | 237 | (14) | — | 10 | — | 233 | |||||||||||||||||||||
| Inter-segment revenues(2) |
90 | 78 | 85 | 26 | (9) | (270) | — | |||||||||||||||||||||
|
|
|
|
|
|
|
|
|
|
|
|
|
|
|
|||||||||||||||
| Total revenues |
518 | 716 | 163 | 43 | 1 | (232) | 1,209 | |||||||||||||||||||||
| Losses and loss adjustment |
105 | 12 | — | — | — | — | 117 | |||||||||||||||||||||
| Operating |
66 | 108 | 157 | 53 | — | — | 384 | |||||||||||||||||||||
| Interest |
— | 112 | 124 | — | — | — | 236 | |||||||||||||||||||||
| Expenses of consolidated VIEs |
— | 50 | — | — | 6 | — | 56 | |||||||||||||||||||||
| Inter-segment expenses(2) |
96 | 136 | 7 | 7 | 26 | (272) | — | |||||||||||||||||||||
|
|
|
|
|
|
|
|
|
|
|
|
|
|
|
|||||||||||||||
| Total expenses |
267 | 418 | 288 | 60 | 32 | (272) | 793 | |||||||||||||||||||||
|
|
|
|
|
|
|
|
|
|
|
|
|
|
|
|||||||||||||||
| Income (loss) before income taxes |
251 | 298 | (125) | (17) | (31) | 40 | 416 | |||||||||||||||||||||
| Provision (benefit) for income taxes |
82 | 101 | (15) | (5) | (10) | 13 | 166 | |||||||||||||||||||||
|
|
|
|
|
|
|
|
|
|
|
|
|
|
|
|||||||||||||||
| Net income (loss) |
$ | 169 | $ | 197 | $ | (110) | $ | (12) | $ | (21) | $ | 27 | $ | 250 | ||||||||||||||
|
|
|
|
|
|
|
|
|
|
|
|
|
|
|
|||||||||||||||
| Identifiable assets |
$ | 6,056 | $ | 11,687 | $ | 2,641 | $ | 44 | $ | 177 | $ | (3,652) | (4) | $ | 16,953 | |||||||||||||
|
|
|
|
|
|
|
|
|
|
|
|
|
|
|
|||||||||||||||
| (1)—Represents | the sum of third-party financial guarantee net premiums earned, net investment income, insurance-related fees and reimbursements, investment management fees and other fees. |
| (2)—Represents | intercompany premium income and expense, intercompany asset management fees and expenses, intercompany interest income, expenses pertaining to intercompany receivables and payables and intercompany loans. |
| (3)—Represents | the gain on the debt received as consideration in connection with the settlement with Bank of America. |
| (4)—Consists | of intercompany reinsurance balances, repurchase agreements and deferred income taxes. |
162
Table of Contents
MBIA Inc. and Subsidiaries
Notes to Consolidated Financial Statements
Note 12: Business Segments (continued)
| Year Ended December 31, 2012 | ||||||||||||||||||||||||||||
| In millions |
U.S. Public Finance Insurance |
International and Structured Finance Insurance |
Corporate | Advisory Services |
Conduit | Eliminations | Consolidated | |||||||||||||||||||||
| Revenues(1) |
$ | 548 | $ | 243 | $ | 68 | $ | 21 | $ | — | $ | — | $ | 880 | ||||||||||||||
| Net change in fair value of insured derivatives |
1 | 1,463 | — | — | — | — | 1,464 | |||||||||||||||||||||
| Net gains (losses) on financial instruments at fair value and foreign exchange |
121 | 93 | (158) | (1) | — | — | 55 | |||||||||||||||||||||
| Net investment losses related to other-than-temporary impairments |
— | (45) | (60) | — | — | — | (105) | |||||||||||||||||||||
| Other net realized gains (losses) |
— | 1 | 6 | — | — | — | 7 | |||||||||||||||||||||
| Revenues of consolidated VIEs |
— | 71 | — | — | 63 | — | 134 | |||||||||||||||||||||
| Inter-segment revenues(2) |
168 | 45 | 177 | 34 | (2) | (422) | — | |||||||||||||||||||||
|
|
|
|
|
|
|
|
|
|
|
|
|
|
|
|||||||||||||||
| Total revenues |
838 | 1,871 | 33 | 54 | 61 | (422) | 2,435 | |||||||||||||||||||||
| Losses and loss adjustment |
21 | 29 | — | — | — | — | 50 | |||||||||||||||||||||
| Operating |
124 | 147 | 114 | 46 | — | — | 431 | |||||||||||||||||||||
| Interest |
— | 132 | 152 | — | — | — | 284 | |||||||||||||||||||||
| Expenses of consolidated VIEs |
— | 59 | — | — | 13 | — | 72 | |||||||||||||||||||||
| Inter-segment expenses(2) |
124 | 208 | 15 | 13 | 97 | (457) | — | |||||||||||||||||||||
|
|
|
|
|
|
|
|
|
|
|
|
|
|
|
|||||||||||||||
| Total expenses |
269 | 575 | 281 | 59 | 110 | (457) | 837 | |||||||||||||||||||||
|
|
|
|
|
|
|
|
|
|
|
|
|
|
|
|||||||||||||||
| Income (loss) before income taxes |
569 | 1,296 | (248) | (5) | (49) | 35 | 1,598 | |||||||||||||||||||||
| Provision (benefit) for income taxes |
188 | 432 | (179) | (1) | (17) | (59) | 364 | |||||||||||||||||||||
|
|
|
|
|
|
|
|
|
|
|
|
|
|
|
|||||||||||||||
| Net income (loss) |
$ | 381 | $ | 864 | $ | (69) | $ | (4) | $ | (32) | $ | 94 | $ | 1,234 | ||||||||||||||
|
|
|
|
|
|
|
|
|
|
|
|
|
|
|
|||||||||||||||
| Identifiable assets |
$ | 6,887 | $ | 17,248 | $ | 2,721 | $ | 44 | $ | 694 | $ | (5,870) | (3) | $ | 21,724 | |||||||||||||
|
|
|
|
|
|
|
|
|
|
|
|
|
|
|
|||||||||||||||
(1)—Represents the sum of third-party financial guarantee net premiums earned, net investment income, insurance-related fees and reimbursements, investment management fees and other fees.
(2)—Represents intercompany premium income and expense, intercompany asset management fees and expenses, and intercompany interest income and expense pertaining to intercompany receivables and payables.
(3)—Consists of intercompany reinsurance balances, repurchase agreements and loans.
Premiums on financial guarantees and insured derivatives reported within the Company’s insurance segments are generated within and outside the U.S. The following table summarizes premiums earned on financial guarantees and insured derivatives by geographic location of risk for the years ended December 31, 2014, 2013 and 2012:
| Years Ended December 31, | ||||||||||||
| In millions |
2014 | 2013 | 2012 | |||||||||
| Total premiums earned: |
||||||||||||
| United States |
$ | 299 | $ | 391 | $ | 530 | ||||||
| United Kingdom |
36 | 34 | 36 | |||||||||
| Europe (excluding United Kingdom) |
7 | 11 | 15 | |||||||||
| Internationally diversified |
9 | 9 | 16 | |||||||||
| Central and South America |
49 | 36 | 48 | |||||||||
| Asia |
4 | 4 | 5 | |||||||||
| Other |
12 | 9 | 11 | |||||||||
|
|
|
|
|
|
|
|||||||
| Total |
$ | 416 | $ | 494 | $ | 661 | ||||||
|
|
|
|
|
|
|
|||||||
Note 13: Insurance in Force
MBIA guarantees the payment of principal of, and interest or other amounts owing on, municipal, asset-backed, mortgage-backed and other non-municipal securities. Additionally, MBIA Corp. has insured CDS primarily on pools of collateral, which it previously considered part of its core financial guarantee business. The pools of collateral are made up of corporate obligations, but also include commercial and RMBS-related assets and ABS securities. MBIA’s insurance in force represents the aggregate amount of the insured principal of, and interest or other amounts owing on, insured obligations. MBIA’s ultimate exposure to credit loss in the event of nonperformance by the issuer of the insured obligation is represented by the insurance in force in the tables that follow.
163
Table of Contents
MBIA Inc. and Subsidiaries
Notes to Consolidated Financial Statements
Note 13: Insurance in Force (continued)
The financial guarantees issued by MBIA provide unconditional and irrevocable guarantees of the payment of the principal of, and interest or other amounts owing on, insured obligations when due. The obligations are generally not subject to acceleration, except that MBIA may have the right, at its discretion, to accelerate insured obligations upon default or otherwise. Certain guaranteed investment contracts written by MBIA Inc. and guaranteed by MBIA Corp. are terminable based upon the credit ratings downgrades of MBIA Corp. and if MBIA Inc. were to have insufficient assets to pay the termination payments, MBIA Corp.’s insurance coverage would be drawn on to make such payments. These amounts have been excluded in the tables that follow.
The creditworthiness of each insured obligation is evaluated prior to the issuance of insurance, and each insured obligation must comply with National’s or MBIA Corp.’s underwriting guidelines. Further, the payments to be made by the issuer on the bonds or notes may be backed by a pledge of revenues, reserve funds, letters of credit, investment contracts or collateral in the form of mortgages or other assets. The right to such funds or collateral would typically become National’s or MBIA Corp.’s upon the payment of a claim by either National or MBIA Corp.
National and MBIA Corp. maintain underwriting guidelines based on those aspects of credit quality that it deems important for each category of obligation considered for insurance.
As of December 31, 2014, insurance in force, which represents principal and interest or other amounts owing on insured obligations, had an expected maturity range of 1 to 43 years. The distribution of MBIA Corp.’s and National’s combined insurance in force by geographic location, excluding $2.6 billion and $3.5 billion relating to transactions guaranteed by MBIA Corp. on behalf of various investment management services affiliated companies as of December 31, 2014 and 2013, respectively, is presented in the following table:
| As of December 31, | ||||||||||||||||
| $ in billions |
2014 | 2013 | ||||||||||||||
| Geographic Location |
Insurance in Force |
% of Insurance in Force |
Insurance in Force |
% of Insurance in Force |
||||||||||||
| California |
$ | 73.8 | 16.9% | $ | 88.7 | 16.0% | ||||||||||
| New York |
29.8 | 6.8% | 38.1 | 6.9% | ||||||||||||
| Illinois |
25.4 | 5.8% | 29.6 | 5.3% | ||||||||||||
| Florida |
24.1 | 5.5% | 29.2 | 5.3% | ||||||||||||
| Texas |
21.1 | 4.8% | 28.0 | 5.0% | ||||||||||||
| New Jersey |
16.8 | 3.9% | 20.2 | 3.6% | ||||||||||||
| Michigan |
12.3 | 2.8% | 15.3 | 2.8% | ||||||||||||
| Puerto Rico |
10.1 | 2.3% | 10.9 | 2.0% | ||||||||||||
| Pennsylvania |
9.3 | 2.1% | 11.8 | 2.1% | ||||||||||||
| Washington |
9.1 | 2.1% | 11.5 | 2.1% | ||||||||||||
|
|
|
|
|
|
|
|
|
|||||||||
| Subtotal |
231.8 | 53.0% | 283.3 | 51.1% | ||||||||||||
| Nationally diversified |
38.9 | 8.9% | 53.6 | 9.7% | ||||||||||||
| Other states |
123.6 | 28.2% | 155.8 | 28.1% | ||||||||||||
|
|
|
|
|
|
|
|
|
|||||||||
| Total United States |
394.3 | 90.1% | 492.7 | 88.9% | ||||||||||||
|
|
|
|
|
|
|
|
|
|||||||||
| Internationally diversified |
2.8 | 0.6% | 12.8 | 2.3% | ||||||||||||
| Country specific |
40.7 | 9.3% | 48.8 | 8.8% | ||||||||||||
|
|
|
|
|
|
|
|
|
|||||||||
| Total non-United States |
43.5 | 9.9% | 61.6 | 11.1% | ||||||||||||
|
|
|
|
|
|
|
|
|
|||||||||
| Total |
$ | 437.8 | 100.0% | $ | 554.3 | 100.0% | ||||||||||
|
|
|
|
|
|
|
|
|
|||||||||
164
Table of Contents
MBIA Inc. and Subsidiaries
Notes to Consolidated Financial Statements
Note 13: Insurance in Force (continued)
The insurance in force by type of bond, excluding transactions guaranteed by MBIA Corp. on behalf of various investment management services affiliated companies, is presented in the following table:
| As of December 31, | ||||||||||||||||
| $ in billions |
2014 | 2013 | ||||||||||||||
| Bond type |
Insurance in Force |
% of Insurance in Force |
Insurance in Force |
% of Insurance in Force |
||||||||||||
| Global public finance—United States: |
||||||||||||||||
| General obligation |
$ | 122.8 | 28.0% | $ | 153.5 | 27.7% | ||||||||||
| General obligation—lease |
27.9 | 6.4% | 34.1 | 6.2% | ||||||||||||
| Municipal utilities |
60.5 | 13.8% | 78.0 | 14.1% | ||||||||||||
| Tax-backed |
53.6 | 12.2% | 66.1 | 11.9% | ||||||||||||
| Transportation |
38.4 | 8.8% | 46.2 | 8.3% | ||||||||||||
| Higher education |
19.5 | 4.5% | 24.1 | 4.3% | ||||||||||||
| Health care |
8.4 | 1.9% | 9.5 | 1.7% | ||||||||||||
| Military housing |
18.4 | 4.2% | 19.2 | 3.5% | ||||||||||||
| Investor-owned utilities(1) |
6.1 | 1.4% | 7.2 | 1.3% | ||||||||||||
| Municipal housing |
3.6 | 0.8% | 4.8 | 0.9% | ||||||||||||
| Other(2) |
2.4 | 0.6% | 3.0 | 0.5% | ||||||||||||
|
|
|
|
|
|
|
|
|
|||||||||
| Total United States |
361.6 | 82.6% | 445.7 | 80.4% | ||||||||||||
|
|
|
|
|
|
|
|
|
|||||||||
| Global public finance—non-United States: |
||||||||||||||||
| International utilities |
13.4 | 3.1% | 15.9 | 2.9% | ||||||||||||
| Sovereign-related and sub-sovereign(3) |
15.5 | 3.5% | 17.3 | 3.1% | ||||||||||||
| Transportation |
9.7 | 2.2% | 12.2 | 2.2% | ||||||||||||
| Local governments(4) |
0.3 | 0.1% | 0.4 | 0.1% | ||||||||||||
| Tax-backed |
0.2 | 0.0% | 0.2 | 0.0% | ||||||||||||
|
|
|
|
|
|
|
|
|
|||||||||
| Total non-United States |
39.1 | 8.9% | 46.0 | 8.3% | ||||||||||||
|
|
|
|
|
|
|
|
|
|||||||||
| Total global public finance |
400.7 | 91.5% | 491.7 | 88.7% | ||||||||||||
|
|
|
|
|
|
|
|
|
|||||||||
| Global structured finance: |
||||||||||||||||
| Collateralized debt obligations(5) |
14.7 | 3.4% | 31.7 | 5.7% | ||||||||||||
| Mortgage-backed residential |
9.9 | 2.3% | 12.4 | 2.2% | ||||||||||||
| Mortgage-backed commercial |
1.1 | 0.3% | 1.6 | 0.3% | ||||||||||||
| Consumer asset-backed |
1.9 | 0.4% | 2.8 | 0.5% | ||||||||||||
| Corporate asset-backed(6) |
9.5 | 2.1% | 14.1 | 2.6% | ||||||||||||
|
|
|
|
|
|
|
|
|
|||||||||
| Total global structured finance |
37.1 | 8.5% | 62.6 | 11.3% | ||||||||||||
|
|
|
|
|
|
|
|
|
|||||||||
| Total |
$ | 437.8 | 100.0% | $ | 554.3 | 100.0% | ||||||||||
|
|
|
|
|
|
|
|
|
|||||||||
(1)—Includes investor owned utilities, industrial development and pollution control revenue bonds.
(2)—Includes certain non-profit enterprises, stadium related financing and student loans.
(3)—Includes regions, departments or their equivalent in each jurisdiction as well as sovereign owned entities that are supported by a sovereign state, region or department.
(4)—Includes municipal owned entities backed by sponsoring local government.
(5)—Includes transactions (represented by structured pools of primarily investment grade corporate credit risks or CRE assets) that do not include typical CDO structuring characteristics, such as tranched credit risk, cash flow waterfalls, or interest and over-collateralization coverage tests.
(6)—Includes $5.3 billion and $5.5 billion of structured insurance securitizations as of December 31, 2014 and 2013, respectively.
165
Table of Contents
MBIA Inc. and Subsidiaries
Notes to Consolidated Financial Statements
Note 13: Insurance in Force (continued)
The insurance operations have entered into certain guarantees of derivative contracts, included in the preceding tables, which are accounted for as derivative instruments. MBIA generally guarantees the timely payment of principal and interest related to these derivatives upon the occurrence of a credit event with respect to a referenced obligation. The maximum amount of future payments that MBIA may be required to make under these guarantees is $10.1 billion.
MBIA’s guarantees of derivative contracts have a legal maximum maturity range of 1 to 68 years. A small number of insured credit derivative contracts have long-dated maturities, which comprise the longest maturity dates of the underlying collateral. However, the expected maturities of such contracts are much shorter due to amortizations and prepayments in the underlying collateral pools. The fair values of these guarantees as of December 31, 2014 and 2013 are recorded on the consolidated balance sheets as derivative liabilities, representing gross losses, of $246 million and $1.2 billion, respectively.
Investment agreement contracts and MTNs issued by the Company’s corporate segment are insured by MBIA Corp. and are not included in the previous tables. If MBIA Inc. or these subsidiaries were to have insufficient assets to pay amounts due, MBIA Corp. would make such payments under its insurance policies. As of December 31, 2014, the maximum amount of future payments that MBIA Corp. could be required to make under these guarantees is $2.6 billion. These guarantees, which have a maximum maturity range of 1 to 27 years, were entered into on an arm’s length basis. MBIA Corp. has both direct recourse provisions and subrogation rights in these transactions. If MBIA Corp. is required to make a payment under any of these affiliate guarantees, it would have the right to seek reimbursement from such affiliate and to liquidate any collateral to recover amounts paid under the guarantee.
Reinsured Exposure
Reinsurance enables the Company to cede exposure for purposes of syndicating risk and increasing its capacity to write new business while complying with its single risk and credit guidelines. When a reinsurer is downgraded by one or more of the rating agencies, less capital credit is given to MBIA under rating agency models and the overall value of the reinsurance to MBIA is reduced. The Company generally retains the right to reassume the business ceded to reinsurers under certain circumstances, including a reinsurer’s rating downgrade below specified thresholds. As of December 31, 2014, the use of reinsurance was immaterial to the insurance operations business and the Company expects that it will continue to be immaterial in the future.
MBIA requires certain unauthorized reinsurers to maintain bank letters of credit or establish trust accounts to cover liabilities ceded to such reinsurers under reinsurance contracts. As of December 31, 2014, the total amount available under these letters of credit and trust arrangements was $34 million. The Company remains liable on a primary basis for all reinsured risk, and although MBIA believes that its reinsurers remain capable of meeting their obligations, there can be no assurance of such in the future.
The aggregate amount of insurance in force ceded by MBIA to reinsurers was $11.1 billion and $12.7 billion as of December 31, 2014 and 2013, respectively.
166
Table of Contents
MBIA Inc. and Subsidiaries
Notes to Consolidated Financial Statements
Note 13: Insurance in Force (continued)
As of December 31, 2014, the aggregate amount of insured par outstanding ceded by MBIA to reinsurers under reinsurance agreements was $6.1 billion compared with $7.1 billion as of December 31, 2013. The following table presents information about the Company’s reinsurance agreements as of December 31, 2014 for its U.S. public finance and international and structured finance insurance operations.
| In millions |
||||||||||||||||||||
| Reinsurers |
Standard & Poor’s Rating (Status) |
Moody’s Rating (Status) | Ceded Par Outstanding |
Letters of Credit/Trust Accounts |
Reinsurance Recoverable(1) |
|||||||||||||||
| Assured Guaranty Re Ltd. |
AA | Baa1 | $ | 3,634 | $ | 32 | $ | 1 | ||||||||||||
| (Stable Outlook) | (Negative Outlook) | |||||||||||||||||||
| Assured Guaranty Corp. |
AA | A3 | 2,019 | — | 6 | |||||||||||||||
| (Stable Outlook) | (Negative Outlook) | |||||||||||||||||||
| Overseas Private |
AA+ | Aaa | 289 | — | — | |||||||||||||||
| Investment Corporation |
(Stable Outlook) | (Stable Outlook) | ||||||||||||||||||
| Others |
A- or above | A2 or above | 145 | 2 | — | |||||||||||||||
|
|
|
|
|
|
|
|||||||||||||||
| Total |
$ | 6,087 | $ | 34 | $ | 7 | ||||||||||||||
|
|
|
|
|
|
|
|||||||||||||||
| (1)—Total | reinsurance recoverable is primarily related to recoverables on unpaid losses. |
Premium Summary
The components of financial guarantee net premiums earned, including premiums assumed from and ceded to other companies, are presented in the following table:
| Years Ended December 31, | ||||||||||||
| In millions |
2014 | 2013 | 2012 | |||||||||
| Net premiums earned: |
||||||||||||
| Direct |
$ | 407 | $ | 400 | $ | 489 | ||||||
| Assumed |
2 | 67 | 130 | |||||||||
|
|
|
|
|
|
|
|||||||
| Gross |
409 | 467 | 619 | |||||||||
| Ceded |
(12) | (10) | (14) | |||||||||
|
|
|
|
|
|
|
|||||||
| Net |
$ | 397 | $ | 457 | $ | 605 | ||||||
|
|
|
|
|
|
|
|||||||
For the year ended December 31, 2014, total salvage paid for financial guarantee policies under reinsurance contracts was $5 million. For the years ended December 31, 2013 and 2012, recoveries received on claims for financial guarantee policies under reinsurance contracts totaled $4 million and $4 million, respectively. Ceding commissions from reinsurance, before deferrals and net of returned ceding commissions, were $2 million, $2 million and $3 million for the years ended December 31, 2014, 2013, and 2012, respectively.
167
Table of Contents
MBIA Inc. and Subsidiaries
Notes to Consolidated Financial Statements
Note 14: Insurance Regulations and Dividends
MBIA Insurance Corporation and National are subject to insurance regulations and supervision of the State of New York (their state of incorporation) and all U.S. and non-U.S. jurisdictions in which they are licensed to conduct insurance business. In order to maintain their New York State financial guarantee insurance license, MBIA Insurance Corporation and National are required to maintain a minimum of $65 million of policyholders’ surplus. MBIA UK is authorized by the Prudential Regulation Authority and regulated by the Financial Conduct Authority and the Prudential Regulation Authority in the United Kingdom. The extent of insurance regulation and supervision varies by jurisdiction, but New York and most other jurisdictions have laws and regulations prescribing minimum standards of solvency and business conduct, which must be maintained by insurance companies. Among other things, these laws prescribe permitted classes and concentrations of investments and limit both the aggregate and individual securities risks that MBIA Insurance Corporation and National may insure on a net basis based on the type of obligations insured. In addition, some insurance laws and regulations require the approval or filing of policy forms and rates. MBIA Insurance Corporation and National are required to file detailed annual financial statements with the NYSDFS and similar supervisory agencies in other jurisdictions in which it is licensed. The operations and accounts of MBIA Insurance Corporation and National are subject to examination by regulatory agencies at regular intervals.
NYIL regulates the payment of dividends by financial guarantee insurance companies and provides that such companies may not declare or distribute dividends except out of statutory earned surplus. Under the NYIL, the sum of (i) the amount of dividends declared or distributed during the preceding 12-month period and (ii) the dividend to be declared may not exceed the lesser of (a) 10% of policyholders’ surplus, as reported in the latest statutory financial statements and (b) 100% of adjusted net investment income for such 12-month period (the net investment income for such 12-month period plus the excess, if any, of net investment income over dividends declared or distributed during the two-year period preceding such 12-month period), unless the Superintendent of the NYSDFS approves a greater dividend distribution based upon a finding that the insurer will retain sufficient surplus to support its obligations.
In 2014, MBIA Insurance Corporation did not declare or pay any dividends to MBIA Inc. or the holders of its preferred stock. MBIA Insurance Corporation is currently unable to pay dividends, including those related to its preferred stock, as a result of its earned surplus deficit as of December 31, 2014 and is not expected to have any statutory capacity to pay any dividends in the near term. In connection with MBIA Insurance Corporation obtaining approval from the NYSDFS to release excessive contingency reserves in prior periods, as described below, MBIA Insurance Corporation agreed that it would not pay any dividends without prior approval from the NYSDFS.
As a condition to the NYSDFS’ approval of the simultaneous repurchase and reverse repurchase agreements (“Asset Swap”) between MBIA Inc. and National, the NYSDFS requested that, until the notional amount of the Asset Swap has been reduced to 5% or less of National’s admitted assets, each of MBIA Inc., MBIA Insurance Corporation and National provide the NYSDFS with three months prior notice, or such shorter period as the NYSDFS may permit, of its intent to initiate cash dividends on shares of its common stock. National declared and paid a dividend of $220 million to its ultimate parent, MBIA Inc. in the fourth quarter of 2014 following notice to the NYSDFS.
As a result of the establishment of National, National and MBIA Insurance Corporation exceeded as of the closing date certain single and aggregate risk limits under the NYIL. These insurers obtained waivers from the NYSDFS of such limits. In connection with the waivers, they submitted a plan to the NYSDFS to achieve compliance with the applicable regulatory limits. Under the plans, they agreed not to write new financial guarantee insurance for certain issuers, and in MBIA Insurance Corporation’s case, in certain categories of business, until they were in compliance with their single risk limits and agreed to take commercially reasonable steps, including considering reinsurance, the addition of capital and other risk mitigation strategies, in order to comply with the regulatory single and aggregate risk limits. As a condition to granting the waiver, the NYSDFS required that, in addition to complying with these plans, upon written notice from the NYSDFS, MBIA Insurance Corporation and National, as applicable, would cease writing new financial guarantee insurance if it were not in compliance with the risk limitation requirements by December 31, 2009. National came into compliance with its aggregate risk limits in 2011 and has a de minimis number of single risk limits overages remaining.
168
Table of Contents
MBIA Inc. and Subsidiaries
Notes to Consolidated Financial Statements
Note 14: Insurance Regulations and Dividends (continued)
As of December 31, 2014, MBIA Insurance Corporation was in compliance with its aggregate risk limits under the NYIL. If MBIA Insurance Corporation is not in compliance with its aggregate risk limits, the NYSDFS may prevent MBIA Insurance Corporation from transacting any new financial guarantee insurance business until it no longer exceeds the limitations. During 2013, MBIA Insurance Corporation exceeded its aggregate risk limits. In 2014 and 2013, MBIA Insurance Corporation reported additional overages to the NYSDFS with respect to its single risk limits due to changes in its statutory capital.
Under the NYIL, MBIA Insurance Corporation is also required to establish a contingency reserve to provide protection to policyholders in the event of extreme losses in adverse economic events. The amount of the reserve is based on the percentage of principal insured or premiums earned, depending on the type of obligation (net of collateral, reinsurance, refunding, refinancings and certain insured securities). Under the NYIL, MBIA Insurance Corporation is required to invest its minimum surplus and contingency reserves, and 50% of its loss reserves and unearned premium reserves, in certain qualifying assets. Reductions in the contingency reserve may be recognized based on excess reserves and under certain stipulated conditions, subject to the approval of the Superintendent of the NYSDFS.
Prior to September 30, 2012, MBIA Corp. released to surplus an aggregate of $1.1 billion of contingency reserves pursuant to approvals granted by the NYSDFS in accordance with the NYIL during 2011 and 2012. Absent these releases MBIA Corp. would have had deficits of qualifying assets to meet its contingency reserve requirements. While MBIA Insurance Corporation currently satisfies its contingency reserve requirement, it had a deficit of qualifying assets required to support its contingency reserves as of September 30, 2014. The deficit was caused by the sale of liquid assets in order to make claim payments and the failure of certain RMBS sellers/servicers to honor their contractual obligations to repurchase ineligible mortgage loans from securitizations the Company insured. The deficit may occur again in the future as MBIA Insurance Corporation depletes qualifying assets to make claims and commutation payments.
As of 2014, MBIA Insurance Corporation’s policyholders’ surplus was negatively impacted by $106 million because under NYIL it was not permitted to treat as an admitted asset the portion of its investment in subsidiaries in excess of the greater of 50% of policyholders’ surplus or 60% of net admitted assets less the par value of common, preferred stock and liabilities. This overage was caused by a decrease in MBIA Insurance Corporation’s policyholders’ surplus due to insured losses in the past. MBIA Insurance Corporation’s policyholders’ surplus may be further negatively impacted if future additional insured losses are incurred and the percentage of its assets invested in subsidiaries continues to increase.
Results of operations for MBIA Insurance Corporation determined in accordance with statutory accounting practices for the years ended December 31, 2014 and 2013 were net losses of $35 million and $494 million, respectively. As of December 31, 2014, MBIA Insurance Corporation’s statutory capital was $859 million, consisting of policyholders’ surplus of $542 million and contingency reserve of $317 million. As of December 31, 2013, MBIA Insurance Corporation had statutory capital of $825 million.
For the years ended December 31, 2014 and 2013, National had statutory net income of $238 million and $256 million, respectively. As of December 31, 2014, National’s statutory capital was $3.3 billion, consisting of policyholders’ surplus of $2.2 billion and contingency reserves of $1.1 billion. As of December 31, 2013, National had statutory capital of $3.3 billion.
Note 15: Pension and Profit Sharing Plans
The Company maintains a qualified non-contributory defined contribution pension plan to which the Company contributes 10% of each eligible employee’s annual compensation. Annual compensation for determining such contributions consists of base salary, bonus and commissions, as applicable, up to a maximum of $1.5 million. Pension benefits vest over a five-year period with 20% vested after two years, 60% vested after three years, 80% vested after four years and 100% vested after five years. The Company funds the annual pension contribution by the following February of each applicable year. Pension expense related to the Company’s qualified pension plan for the years ended December 31, 2014, 2013 and 2012 was $4 million, $4 million, and $7 million, respectively.
169
Table of Contents
MBIA Inc. and Subsidiaries
Notes to Consolidated Financial Statements
Note 15: Pension and Profit Sharing Plans (continued)
The Company also maintains a qualified profit sharing/401(k) plan. The plan is a voluntary contributory plan that allows eligible employees to defer compensation for federal income tax purposes under Section 401(k) of the Internal Revenue Code of 1986, as amended. Employees may contribute, through payroll deductions, up to 25% of eligible compensation. The Company matches employee contributions up to the first 5% of such compensation. The 401(k) matching contributions are made in the form of cash, whereby participants may direct the Company match to an investment of their choice. The benefit of the Company’s contributions vest over a five-year period with 20% vested after two years, 60% vested after three years, 80% vested after four years and 100% vested after five years. Generally, a participating employee is entitled to distributions from the plans upon termination of employment, retirement, death or disability. Participants who qualify for distribution may receive a single lump sum, transfer the assets to another qualified plan or individual retirement account, or receive a series of specified installment payments. Profit sharing/401(k) expense related to the Company’s qualified plan for the years ended December 31, 2014, 2013 and 2012 was $2 million, $3 million, and $3 million, respectively.
In addition to the above two plans, the Company maintains a non-qualified deferred compensation plan. Contributions to the above qualified plans that exceed limitations established by federal regulations are then contributed to the non-qualified deferred compensation plan. The non-qualified pension expense for the years ended December 31, 2014, 2013 and 2012 was $2 million for each applicable year. The non-qualified profit sharing/401(k) expense for each of the years ended December 31, 2014, 2013 and 2012 was $1 million for each applicable year.
Note 16: Long-term Incentive Plans
Plan Description
The Company maintains the MBIA Inc. 2005 Omnibus Incentive Plan (the “Omnibus Plan”). Under the Omnibus Plan a maximum of 10,000,000 shares of the Company’s common stock can be used for any type of award including stock options, performance shares, performance units, restricted stock, restricted stock units and dividend equivalents. On May 1, 2012, the Company’s shareholders approved an increase in the total number of shares of common stock reserved and available for issuance under the Omnibus Plan from 10,000,000 shares to 14,000,000. Any shares issued under the Omnibus Plan in connection with stock options shall be counted against this limit as one share covered by such option. For all awards other than stock options, any shares issued shall be counted against this limit as 1.28 shares for every share issued after the May 1, 2012 amendment and two shares for every share issued prior to the May 1, 2012 amendment.
The stock option component of the Omnibus Plan enables key employees of the Company and its subsidiaries to acquire shares of common stock of the Company or to benefit from appreciation in the price of the common stock of the Company. The stock option grants, which may be awarded every year, provide the right to purchase shares of common stock at the fair value of the stock on the date of the grant. Options granted will either be Incentive Stock Options (“ISOs”) that qualify under Section 422(a) of the Internal Revenue Code, or Non-Qualified Stock Options (“NQSOs”). ISOs and NQSOs are granted at a price not less than 100% of the fair value, defined as the closing price on the grant date, of the Company’s common stock. Options are exercisable as specified at the time of grant depending on the level of the recipient (generally four or five years) and expire either seven or ten years from the date of grant (or shorter if specified or following termination of employment).
Under the restricted stock component of the Omnibus Plan, certain employees are granted restricted shares of the Company’s common stock. These awards have a restriction period lasting three to five years depending on the type of award, after which time the awards fully vest. During the vesting period, these shares may not be sold. Restricted stock may be granted to all employees.
Following the effective date of the Omnibus Plan, no new options or awards were granted under any of the prior plans authorized by the shareholders and all shares authorized but unissued were canceled. All stock awards granted under the prior plans and subsequently canceled or expired after the effective date of the Omnibus Plan, become available for grant under the Omnibus Plan.
170
Table of Contents
MBIA Inc. and Subsidiaries
Notes to Consolidated Financial Statements
Note 16: Long-term Incentive Plans (continued)
There were 6,056,168 shares available for future grants under the Omnibus Plan as of December 31, 2014.
In accordance with accounting guidance for share-based payments, the Company expenses the fair value of employee stock options and other forms of stock-based compensation. In addition, the guidance classifies share-based payment awards as either liability awards, which are remeasured at fair value at each balance sheet date, or equity awards, which are measured on the grant date and not subsequently remeasured. Generally, awards with cash-based settlement repurchase features or that are settled at a fixed dollar amount are classified as liability awards, and changes in fair value will be reported in earnings. Awards with net-settlement features or that permit a cashless exercise with third-party brokers are classified as equity awards and changes in fair value are not reported in earnings. The Company’s long-term incentive plans include features which result in equity awards. In addition, the guidance requires the use of a forfeiture estimate. The Company uses historical employee termination information to estimate the forfeiture rate applied to current stock-based awards.
The Company maintains voluntary retirement benefits, which provide certain benefits to eligible employees of the Company upon retirement. A description of these benefits is included in the Company’s proxy statement. One of the components of the retirement program for those employees that are retirement eligible is to continue to vest all performance-based stock options and restricted share awards beyond the retirement date in accordance with the original vesting terms and to immediately vest all outstanding time-based stock options and restricted share grants. The accounting guidance for share-based payment requires compensation costs for those employees to be recognized from the date of grant through the retirement eligible date, unless there is a risk of forfeiture, in which case the compensation cost is recognized in accordance with the original vesting schedule. Accelerated expense, if any, relating to this retirement benefit for both stock option awards and restricted stock awards has been included in the compensation expense amounts.
Restricted Stock
The fair value of the restricted shares awarded, determined on the grant date, was $39 million and $6 million, and the fair value of the restricted shares canceled were $1 million each for 2014 and 2013. Restricted shares have been recorded as unearned compensation, which is a component of paid-in capital within shareholders’ equity on the Company’s consolidated balance sheets and have been included in “Share-based compensation” on the Company’s consolidated statements of changes in shareholders’ equity. The amount of unearned compensation, net of estimated forfeitures, was $35 million as of December 31, 2014, which is expected to be recognized as expense over a weighted average period of 1.83 years. Unearned compensation is amortized to expense over the appropriate three to five-year vesting period (except for a minor portion granted to members of the MBIA Inc. Board of Directors which is amortized over a ten-year period).
Compensation expense related to the restricted shares, net of estimated forfeitures, was $18 million, $11 million and $11 million for the years ended December 31, 2014, 2013 and 2012, respectively. The tax benefit related to the restricted share awards during 2014, 2013 and 2012 was $2 million, $1 million and $1 million, respectively.
A summary of the Company’s restricted shares outstanding as of December 31, 2014, 2013 and 2012, and changes during the years ended on those dates, is presented in the following table:
| Restricted Share Activity | ||||||||||||||||||||||||
| 2014 | 2013 | 2012 | ||||||||||||||||||||||
| Number of Shares |
Weighted Average Price Per Share |
Number of Shares |
Weighted Average Price Per Share |
Number of Shares |
Weighted Average Price Per Share |
|||||||||||||||||||
| Outstanding at beginning of year |
3,832,115 | $ | 7.6438 | 7,320,110 | $ | 6.8017 | 4,881,782 | $ | 6.4134 | |||||||||||||||
| Granted |
3,263,472 | 12.0284 | 449,931 | 13.0741 | 2,689,542 | 7.9299 | ||||||||||||||||||
| Vested |
(613,641) | 5.9661 | (969,396) | 9.8408 | (70,549) | 16.7909 | ||||||||||||||||||
| Forfeited |
(123,120) | 10.2942 | (2,968,530) | 5.6724 | (180,665) | 9.2860 | ||||||||||||||||||
|
|
|
|
|
|
|
|
|
|
|
|
|
|||||||||||||
| Outstanding at end of year |
6,358,826 | $ | 10.0047 | 3,832,115 | $ | 7.6438 | 7,320,110 | $ | 6.8017 | |||||||||||||||
|
|
|
|
|
|
|
|
|
|
|
|
|
|||||||||||||
171
Table of Contents
MBIA Inc. and Subsidiaries
Notes to Consolidated Financial Statements
Note 16: Long-term Incentive Plans (continued)
Stock Options
The Company determines the fair value for stock option awards at the date of grant and is estimated using the Black-Scholes option pricing model. This model was developed for use in estimating the fair value of traded options that have no vesting restrictions, are fully transferable, and contain both service and some performance conditions. In addition, option valuation models require the input of highly subjective assumptions including the expected stock price volatility.
Employee stock option compensation expense, net of estimated forfeitures, for the year ended December 31, 2014 was immaterial. Employee stock option compensation expense, net of estimated forfeitures, for the years ended December 31, 2013, and 2012 totaled $2 million and $3 million, respectively. During 2014, 2013, and 2012, there were no stock option awards granted. During 2014, 2013, and 2012, the Company expensed deferred tax assets of $4 million, $5 million and $6 million, respectively, related to the stock option awards as a charge to paid-in capital. As of December 31, 2014, there was an immaterial amount of total unrecognized compensation cost related to non-vested stock options.
A summary of the Company’s stock options outstanding as of December 31, 2014, 2013 and 2012, and changes during the years ended on those dates, is presented in the following tables:
| 2014 | 2013 | 2012 | ||||||||||||||||||||||
| Options |
Number of Shares |
Weighted Average Price Per Share |
Number of Shares |
Weighted Average Price Per Share |
Number of Shares |
Weighted Average Price Per Share |
||||||||||||||||||
| Outstanding at beginning of year |
3,715,406 | $ | 20.6883 | 5,963,268 | $ | 19.0485 | 6,425,073 | $ | 21.3330 | |||||||||||||||
| Exercised |
(400,000) | 4.0200 | — | — | — | — | ||||||||||||||||||
| Expired or forfeited |
(767,406) | 61.5815 | (2,247,862) | 16.3382 | (461,805) | 50.8330 | ||||||||||||||||||
|
|
|
|
|
|
|
|
|
|
|
|
|
|||||||||||||
| Outstanding at end of year |
2,548,000 | $ | 10.9888 | 3,715,406 | $ | 20.6883 | 5,963,268 | $ | 19.0485 | |||||||||||||||
|
|
|
|
|
|
|
|
|
|
|
|
|
|||||||||||||
| Exercisable at end of year |
1,798,000 | $ | 13.4660 | 1,752,311 | $ | 38.5120 | 1,751,173 | $ | 45.0174 | |||||||||||||||
The following table summarizes information about outstanding stock options as of December 31, 2014:
| Stock Options Outstanding | Stock Options Exercisable | |||||||||||||||||||||||||||||||
| Range of Average Exercise Price |
Number of Options |
Weighted Average Remaining Contractual Life in Years |
Weighted Average Exercise Price |
Aggregate Intrinsic Value (in millions) |
Number of Options |
Weighted Average Remaining Contractual Life in Years |
Weighted Average Exercise Price |
Aggregate Intrinsic Value (in millions) |
||||||||||||||||||||||||
| $4.02-$57.71 |
2,287,500 | 1.70 | $ | 5.3922 | $ | 11 | 1,537,500 | 1.47 | $ | 5.5591 | $ | 8 | ||||||||||||||||||||
| $58.84-$70.86 |
260,500 | 0.55 | 60.1333 | — | 260,500 | 0.55 | 60.1333 | — | ||||||||||||||||||||||||
|
|
|
|
|
|
|
|
|
|||||||||||||||||||||||||
| Total |
2,548,000 | 1.58 | $ | 10.9888 | $ | 11 | 1,798,000 | 1.34 | $ | 13.4660 | $ | 8 | ||||||||||||||||||||
|
|
|
|
|
|
|
|
|
|||||||||||||||||||||||||
Performance Based Awards
During 2014 and 2012, the Company granted three million and two million restricted shares, respectively, to certain key employees which have a vesting schedule dependent on the achievement of certain stock price targets of the Company. The grants and corresponding compensation expense have been included in the above restricted stock disclosures. As permitted by the accounting guidance for share-based payments, the Company estimates the fair value of awards that contain market performance conditions at the date of grant using a binomial lattice model with a Monte Carlo simulation. The binomial lattice model can better incorporate assumptions about a stock price path because the model can accommodate a large number of potential stock prices over the award’s term in comparison to the Black-Scholes model.
172
Table of Contents
MBIA Inc. and Subsidiaries
Notes to Consolidated Financial Statements
Note 16: Long-term Incentive Plans (continued)
During 2010, the Board of Managers of Cutwater established the Cutwater Asset Management Equity Participation Plan (“the Plan”). The purpose of the Plan is to promote the interests of Cutwater and its equity security holders and is designed to provide compensation tied to the value of Cutwater by the grant of equity participation units. Each unit represents the contractual right to receive cash payments based on the value of Cutwater. These grants have a restriction period lasting five years, after which time the awards fully vest providing the participant is continuously employed by Cutwater or one of its affiliates during that period. The maximum number of units available for grant under the Plan is 350,000. During 2014, no new units were granted and 38,000 units were canceled. As of December 31, 2014, 185,312 units vested with no value. In accordance with the accounting guidance for awards that include a cash-based settlement feature, the Plan is classified as a liability award. The original value of the award was determined on the date of grant and remeasured at each balance sheet date. A liability is accrued over the vesting period of the Plan and reflects the present value of the award as of each balance sheet date. Any change is reflected in earnings. For the years ended December 31, 2014, 2013 and 2012, no compensation cost related to the Plan was recorded as a result of the decline in the value of the awards.
Note 17: Earnings Per Share
Earnings per share is calculated using the two-class method in which earnings are allocated to common stock and participating securities based on their rights to receive nonforfeitable dividends or dividend equivalents. The Company grants restricted stock and restricted stock units to certain employees and non-employee directors in accordance with the Company’s long-term incentive programs, which entitle the participants to receive nonforfeitable dividends or dividend equivalents during the vesting period on the same basis as those dividends are paid to common shareholders. These unvested stock awards represent participating securities. During periods of net income, the calculation of earnings per share exclude the income attributable to participating securities in the numerator and the dilutive impact of these securities from the denominator. During periods of net loss, no effect is given to participating securities in the numerator and the denominator excludes the dilutive impact of these securities since they do not share in the losses of the Company.
Basic earnings per share excludes dilution and is computed by dividing net income available to common shareholders by the weighted average number of common shares outstanding during the period. Diluted earnings per share reflects the dilutive effect of all stock options, warrants and unvested restricted stock outstanding during the period that could potentially result in the issuance of common stock.
The dilution from stock options, warrants and unvested restricted stock are calculated by applying the two-class method and using the treasury stock method. The treasury stock method assumes the proceeds from the exercise of stock options and warrants or the unrecognized compensation expense from unvested restricted stock will be used to purchase shares of the Company’s common stock at the average market price during the period. For the years ended December 31, 2014, 2013 and 2012, there were 31,907,852, 43,210,917 and 33,743,884, respectively, of stock options, warrants and unvested restricted stock outstanding that were antidilutive.
173
Table of Contents
MBIA Inc. and Subsidiaries
Notes to Consolidated Financial Statements
Note 17: Earnings Per Share (continued)
The following table presents the computation of basic and diluted earnings per share for the years ended December 31, 2014, 2013 and 2012:
| Years Ended December 31, | ||||||||||||
| $ in millions except share and per share amounts |
2014 | 2013 | 2012 | |||||||||
| Basic earnings per share: |
||||||||||||
| Net income (loss) |
$ | 569 | $ | 250 | $ | 1,234 | ||||||
| Less: undistributed earnings allocated to participating securities |
16 | 5 | 32 | |||||||||
|
|
|
|
|
|
|
|||||||
| Net income (loss) available to common shareholders |
553 | 245 | 1,202 | |||||||||
|
|
|
|
|
|
|
|||||||
| Basic weighted average shares (1) |
188,171,503 | 189,071,011 | 188,834,626 | |||||||||
| Net income (loss) per basic common share |
$ | 2.94 | $ | 1.30 | $ | 6.36 | ||||||
|
|
|
|
|
|
|
|||||||
| Diluted earnings per share: |
||||||||||||
| Net income (loss) |
569 | 250 | 1,234 | |||||||||
| Less: undistributed earnings allocated to participating securities |
15 | 5 | 32 | |||||||||
| Less: mark-to-market gain (loss) on warrants |
28 | — | — | |||||||||
|
|
|
|
|
|
|
|||||||
| Net income (loss) available to common shareholders |
526 | 245 | 1,202 | |||||||||
|
|
|
|
|
|
|
|||||||
| Basic weighted average shares (1) |
188,171,503 | 189,071,011 | 188,834,626 | |||||||||
| Effect of common stock equivalents: |
||||||||||||
| Stock options |
1,104,247 | 1,241,902 | 1,062,395 | |||||||||
| Warrants |
1,622,877 | — | — | |||||||||
|
|
|
|
|
|
|
|||||||
| Diluted weighted average shares |
190,898,627 | 190,312,913 | 189,897,021 | |||||||||
|
|
|
|
|
|
|
|||||||
| Net income (loss) per diluted common share |
$ | 2.76 | $ | 1.29 | $ | 6.33 | ||||||
|
|
|
|
|
|
|
|||||||
(1) Includes 412,769, 629,896 and 506,714 of participating securities that met the service condition and were eligible to receive nonforfeitable dividends or dividend equivalents for the years ended December 31, 2014, 2013 and 2012, respectively.
Note 18: Common and Preferred Stock
Common Stock
Stock Warrants
During 2008, the Company granted Warburg Pincus warrants to purchase 11.5 million shares of MBIA common stock at an exercise price of $30.25 per share, “B” warrant, which, upon obtaining certain approvals, will become exercisable to purchase 9.8 million shares at a price of $30.25 per share, and “B2” warrant to purchase 4 million shares at a price of $16.20 per share.
In August of 2013, pursuant to the anti-dilution provisions of warrants issued by MBIA to Warburg Pincus, the terms of the warrants issued to Warburg Pincus in 2008 were amended, which resulted in (a) Warburg Pincus’ warrant to purchase 11.5 million shares exercisable at $30.25 per share was revised to 11.8 million shares at $29.44 per share; (b) Warburg Pincus’ B warrant to purchase 9.8 million shares exercisable at $30.25 per share was revised to 10.1 million shares at $29.44 per share; and (c) Warburg Pincus’ B2 warrant to purchase 4 million shares exercisable at $16.20 per share was revised to 4,004,945 shares at $16.18 per share. In addition, under the agreement, Warburg Pincus has certain gross up rights that are triggered in connection with the offering by the Company of any equity securities. As such, MBIA issued Warburg Pincus a five-year warrant to purchase 1.91 million shares of MBIA common stock at an exercise price of $9.59 per share.
In February of 2015, the Company reported the expiration of the Warburg Pincus’ warrant to purchase 11.8 million shares at $29.44 per share, the Warburg Pincus’ B warrant to purchase 10.1 million shares at $29.44 per share and the Warburg Pincus’ B2 warrant to purchase 4,004,945 shares at $16.18 per share.
174
Table of Contents
MBIA Inc. and Subsidiaries
Notes to Consolidated Financial Statements
Note 18: Common and Preferred Stock (continued)
In May of 2013, MBIA Inc. issued Blue Ridge Investments, L.L.C., an affiliate of Bank of America, a five-year warrant to purchase 9.94 million shares of MBIA Inc. common stock at an exercise price of $9.59 per share.
Stock warrants are recorded as liabilities and reported within “Other liabilities” on the consolidated balance sheets due to terms and conditions in the agreements that could require net cash settlement. As of December 31, 2014 and 2013, the fair value of the warrants was $28 million and $59 million, respectively.
Repurchase Program
Repurchases of common stock may be made from time to time in the open market or in private transactions as permitted by securities laws and other legal requirements. The Company believes that share repurchases can be an appropriate deployment of capital in excess of amounts needed to support the Company’s liquidity while maintaining the claims-paying resources of MBIA Corp. and National, as well as other business needs.
On February 1, 2007, the Company’s Board of Directors authorized the repurchase of common stock up to $1 billion under a share repurchase program. During the year ended December 31, 2014, the Company repurchased 2.1 million common shares of MBIA Inc., exhausting any remaining capacity under this share repurchase program. As of December 31, 2014, the Company had repurchased 58.8 million common shares of MBIA Inc. at an average price of $17.02 per share under this share repurchase program.
In the fourth quarter of 2014, the Company’s Board of Directors authorized the repurchase of common stock up to $200 million under a new share repurchase program. During the year ended December 31, 2014, the Company repurchased 1.2 million common shares of MBIA Inc. at an average price of $9.44 per share under this new repurchase program.
During 2014 and 2013, 529,246 and 392,056 shares, respectively, were purchased by the Company for settling awards under the Company’s long-term incentive plans.
Preferred Stock
As of December 31, 2014, MBIA Insurance Corporation had 2,759 shares of preferred stock issued and outstanding with a carrying value of $28 million, including 1,444 shares held by MBIA Inc. that were purchased at a weighted average price of $10,900 per share or 10.9% of face value and 1,315 shares held by unaffiliated investors. During 2014, MBIA Inc. did not repurchase any additional shares.
In accordance with MBIA’s fixed-rate election, the dividend rate on the preferred stock was determined using a fixed-rate equivalent of LIBOR plus 200 basis points. Each share of preferred stock has a par value of $1,000 with a liquidation preference of $100,000. The holders of the preferred stock are generally not entitled to any voting rights. Subject to certain requirements, the preferred stock may be redeemed, in whole or in part, at the option of MBIA Corp. at any time or from time to time for cash at a redemption price equal to the liquidation preference per share plus any accrued and unpaid dividends thereon at the date of redemption for the then current dividend period and any previously accumulated dividends payable without interest on such unpaid dividends. As of December 31, 2014 and 2013, there were no dividends declared on the preferred stock. Payment of dividends on MBIA Corp.’s preferred stock is subject to the same restrictions that apply to dividends on common stock under NYIL.
175
Table of Contents
MBIA Inc. and Subsidiaries
Notes to Consolidated Financial Statements
Note 19: Accumulated Other Comprehensive Income
The following table presents the changes in the components of AOCI for the years ended December 31, 2014, 2013, and 2012:
| In millions |
Unrealized Gains (Losses) on AFS Securities, Net |
Foreign Currency Translation, Net |
Total | |||||||||
| Balance, January 1, 2012 |
$ | (163) | $ | (13) | $ | (176) | ||||||
| Other comprehensive income (loss) before reclassifications |
136 | 26 | 162 | |||||||||
| Amounts reclassified from AOCI |
70 | — | 70 | |||||||||
|
|
|
|
|
|
|
|||||||
| Net period other comprehensive income (loss) |
206 | 26 | 232 | |||||||||
| Balance, December 31, 2012 |
43 | 13 | 56 | |||||||||
|
|
|
|
|
|
|
|||||||
| Other comprehensive income (loss) before reclassifications |
(128) | 2 | (126) | |||||||||
| Amounts reclassified from AOCI |
(11) | (5) | (16) | |||||||||
|
|
|
|
|
|
|
|||||||
| Net period other comprehensive income (loss) |
(139) | (3) | (142) | |||||||||
| Balance, December 31, 2013 |
(96) | 10 | (86) | |||||||||
|
|
|
|
|
|
|
|||||||
| Other comprehensive income (loss) before reclassifications |
117 | (27) | 90 | |||||||||
| Amounts reclassified from AOCI |
13 | 4 | 17 | |||||||||
|
|
|
|
|
|
|
|||||||
| Total other comprehensive income (loss) |
130 | (23) | 107 | |||||||||
|
|
|
|
|
|
|
|||||||
| Balance, December 31, 2014 |
$ | 34 | $ | (13) | $ | 21 | ||||||
|
|
|
|
|
|
|
|||||||
The following table presents the details of the reclassifications from AOCI for the years ended December 31, 2014, 2013, and 2012:
| In millions |
Amounts Reclassified from AOCI Years Ended December 31, |
|||||||||||||
| Details about AOCI Components |
2014 | 2013 | 2012 | Affected Line Item on the Consolidated Statements | ||||||||||
| Unrealized gains (losses) on AFS securities: |
||||||||||||||
| Realized gain (loss) on sale of securities |
$ | (17) | $ | 23 | $ | (4) | Net gains (losses) on financial instruments at fair value and foreign exchange | |||||||
| Amortization on securities |
(4) | (5) | (104) | Net investment income | ||||||||||
|
|
|
|
|
|
|
|||||||||
| (21) | 18 | (108) | Income (loss) before income taxes | |||||||||||
| (8) | 7 | (38) | Provision (benefit) for income taxes | |||||||||||
|
|
|
|
|
|
|
|||||||||
| (13) | 11 | (70) | Net income (loss) | |||||||||||
| Foreign currency translation: |
||||||||||||||
| Realized gain (loss) on liquidation of foreign entity |
(4) | 5 | — | Net gains (losses) on financial instruments at fair value and foreign exchange | ||||||||||
|
|
|
|
|
|
|
|||||||||
| Total reclassifications for the period |
$ | (17) | $ | 16 | $ | (70) | Net income (loss) | |||||||
|
|
|
|
|
|
|
|||||||||
Note 20: Related Party Transactions
Related parties are defined as the following:
| • | Affiliates of the Company: An affiliate is a party that directly or indirectly controls, is controlled by or is under common control with the Company. Control is defined as having, either directly or indirectly, the power to direct the management and operating policies of a company through ownership, by contract or otherwise. |
| • | Entities for which investments are accounted for using the equity method by the Company. |
| • | Trusts for the benefit of employees, such as pension and profit sharing trusts that are managed by or under the trusteeship of management. |
176
Table of Contents
MBIA Inc. and Subsidiaries
Notes to Consolidated Financial Statements
Note 20: Related Party Transactions (continued)
| • | Principal owners of the Company defined as owners of record or known beneficial owners of more than 10% of the voting interests of the Company. |
| • | Management of the Company which includes persons who are responsible for achieving the objectives of the Company and who have the authority to establish policies and make decisions by which those objectives are to be pursued. Management normally includes members of the Board of Directors, the Chief Executive Officer, Chief Operating Officer, Vice President in charge of principal business functions and other persons who perform similar policymaking functions. |
| • | Members of the immediate families of principal owners of the Company and its management. This includes family members whom a principal owner or a member of management might control or influence or by whom they may be controlled or influenced because of the family relationship. |
| • | Other parties with which the Company may deal if one party controls or can significantly influence the management or policies of the other to an extent that one of the transacting parties might be prevented from fully pursuing its own separate interests. |
| • | Other parties that can significantly influence the management or policies of the transacting parties or that have an ownership interest in one of the transacting parties and can significantly influence the other to the extent that one or more of the transacting parties might be prevented from fully pursuing its own separate interests. |
Since 1989, MBIA Corp. has executed five surety bonds to guarantee the payment obligations of the members of the Municipal Bond Insurance Association (the “Association”), a voluntary unincorporated association of insurers writing municipal bond and note insurance as agents for the member insurance companies that had their S&P claims-paying rating downgraded from AAA on their previously issued Association policies. In the event that the Association does not meet their policy payment obligations, MBIA Corp. will pay the required amounts directly to the paying agent. The aggregate outstanding exposure on these surety bonds as of December 31, 2014 was $340 million.
MBIA, through its subsidiaries, is responsible for providing investment advisory and certain related administrative services to the Managed Duration Investment Grade Municipal Fund (“the Fund”). MBIA earned investment management, accounting, administration and service fees related to the Fund, net of underwriting fees paid to a third party, and are included in “Fees and reimbursements” in the Company’s consolidated statements of operations. These amounts were not significant for the years ended December 31, 2014, 2013 and 2012.
In August of 2013, pursuant to the anti-dilution provisions of warrants issued by MBIA to Warburg Pincus, the terms of the warrants issued to Warburg Pincus in 2008 were amended, which resulted in a decrease in the exercise price and an increase in the aggregate number of shares of MBIA common stock to be issued upon exercise. In addition, under the agreement, Warburg Pincus has certain gross up rights that are triggered in connection with the offering by the Company of any equity securities. As such, MBIA issued Warburg Pincus a five-year warrant to purchase 1.91 million shares of MBIA common stock at an exercise price of $9.59 per share. Refer to “Note 18: Common and Preferred Stock” for information about Warburg Pincus’ warrants.
As of December 31, 2014 and 2013, the Company had no loans outstanding to any executive officers or directors.
Note 21: Commitments and Contingencies
MBIA has received subpoenas or informal inquiries from a variety of regulators, regarding a variety of subjects. MBIA has cooperated fully with each of these regulators and has or is in the process of satisfying all such requests. MBIA may receive additional inquiries from these or other regulators and expects to provide additional information to such regulators regarding their inquiries in the future.
177
Table of Contents
MBIA Inc. and Subsidiaries
Notes to Consolidated Financial Statements
Note 21: Commitments and Contingencies (continued)
On December 14, 2009, MBIA Corp. commenced an action in New York State Supreme Court, New York County, against Credit Suisse. The complaint seeks damages for fraud and breach of contractual obligations in connection with the procurement of financial guarantee insurance on the HEMT Series 2007-2 securitization. On January 30, 2013, MBIA Corp. filed an amended complaint. The amended complaint alleges, among other claims, that Credit Suisse falsely represented: (i) the attributes of the securitized loans; (ii) that the loans complied with the governing underwriting guidelines; and (iii) that Credit Suisse had conducted extensive due diligence on and quality control reviews of the securitized loans to ensure compliance with the underwriting guidelines. The complaint further alleges that the defendants breached their contractual obligations to cure or repurchase loans found to be in breach of the representations and warranties applicable thereto and denied MBIA the requisite access to all records and documents regarding the securitized loans. On August 13, 2014, the court issued an order scheduling expert discovery to run through the middle of 2015.
On September 14, 2012, MBIA Insurance Corporation filed a complaint alleging fraud against J.P. Morgan Securities LLC (f/k/a Bear, Stearns & Co. Inc.) relating to Bear, Stearns & Co. Inc.’s role as lead securities underwriter on the GMAC Mortgage Corporation Home Equity Loan Trust 2006-HE4. MBIA filed its amended complaint on September 29, 2014. J.P. Morgan filed its answer to the amended complaint on October 10, 2014.
On July 23, 2008, the City of Los Angeles filed a complaint in the Superior Court of the State of California, County of Los Angeles, against a number of financial guarantee insurers, including MBIA. At the same time and subsequently, additional complaints against MBIA and nearly all of the same co-defendants were filed by various municipal entities and quasi-municipal entities, mostly in California. These cases are part of a coordination proceeding in Superior Court, San Francisco County, before Judge Richard A. Kramer, referred to as the Ambac Bond Insurance Cases. In August of 2011, the plaintiffs filed amended versions of their respective complaints. The claims allege violation of California’s antitrust laws through maintaining a dual credit rating scale that misstated the credit default risk of certain issuers, thereby creating market demand for bond insurance. The plaintiffs also allege that the individual bond insurers participated in risky financial transactions in other lines of business that damaged each bond insurer’s financial condition, and failure to adequately disclose the impact of those transactions on their financial condition. The plaintiffs also assert common law claims of breach of contract and fraud. The non-municipal plaintiffs also allege a California unfair competition cause of action. An appeal of the dismissal of the plaintiff’s antitrust claim under California’s Cartwright Act is pending. An appeal is also pending of the March 26, 2014 decision granting in part the Bond Insurer defendants’ motions for reimbursement of legal fees incurred in connection with the motion to strike pursuant to California’s Anti-SLAPP statute.
On July 23, 2008, the City of Los Angeles filed a complaint in the Superior Court, County of Los Angeles, naming as defendants MBIA and other financial institutions, and alleging fraud and violations of California’s antitrust laws through bid-rigging in the sale of guaranteed investment contracts and what plaintiffs call “municipal derivatives” to municipal bond issuers. The case was removed to federal court and transferred by order dated November 26, 2008 to the Southern District of New York for inclusion in the multidistrict litigation, Municipal Derivatives Antitrust Litigation, M.D.L. No. 1950. Complaints making the same allegations against MBIA and nearly all of the same co-defendants were then, or subsequently, filed by municipal entities and quasi-municipal entities, mostly in California, and three not-for-profit retirement community operators. These cases have all been added to the multidistrict litigation. The plaintiffs in all of the cases assert federal and either California, West Virginia or New York state antitrust claims. As of May 31, 2011, MBIA has answered all of the existing complaints.
National and Assured Guaranty Municipal Corp. commenced an adversary proceeding against the City of Detroit and certain individuals employees/managers in the City of Detroit’s Chapter 9 case. The amended complaint sought a declaratory judgment that the City of Detroit and its employees comply with Michigan law in the collection, segregation and use of ad valorem tax proceeds pledged to repay several series of unlimited tax general obligation bonds as well as declaratory relief with respect to National’s and Assured Guaranty Municipal Corp.’s rights and interests in the ad valorem tax proceeds. In April of 2014, National reached a settlement with the City of Detroit regarding its enhanced Unlimited Tax General Obligation bonds, which was approved when the City of Detroit’s Eighth Amended Plan went effective on December 10, 2014.
178
Table of Contents
MBIA Inc. and Subsidiaries
Notes to Consolidated Financial Statements
Note 21: Commitments and Contingencies (continued)
On January 30, 2013, MBIA Insurance Corporation and National filed a petition in Texas state court seeking an order requiring the Harris County-Houston Sports Authority to impose higher taxes as well as damages for other alleged breaches of contract. On December 30, 2014, the litigation was resolved in connection with a refinancing transaction.
The Company is defending against the aforementioned actions in which it is a defendant and expects ultimately to prevail on the merits. There is no assurance, however, that the Company will prevail in these actions. Adverse rulings in these actions could have a material adverse effect on the Company’s ability to implement its strategy and on its business, results of operations, cash flows and financial condition. At this stage of the litigation, there has not been a determination as to the amount, if any, of damages. Accordingly, the Company is not able to estimate any amount of loss or range of loss.
There are no other material lawsuits pending or, to the knowledge of the Company, threatened, to which the Company or any of its subsidiaries is a party.
Headquarters Lease Agreement
In September of 2014, the Company moved its headquarters to Purchase, New York, for which the Company had previously entered into a lease agreement as part of the Company’s cost reduction measures that included the plan to sell the Armonk, New York facility. The initial lease term expires in 2030 with the option to terminate the lease in 2025 upon the payment of a termination amount. At the end of the initial lease term, the Company has the option to extend the term of the lease for two additional terms of five years at a fixed annual rent based on the fair market rent at the time of any extension. The total future minimum lease payments over the initial lease term are $42 million. The Company received a lease incentive amount of $6 million from the property owner to fund certain leasehold improvements. The total future minimum lease payments include annual rent escalation amounts and a free rent period and exclude the lease incentive amount. The lease agreement has been classified as an operating lease, and operating rent expense has been recognized on a straight-line basis since the second quarter of 2014.
Note 22: Subsequent Events
Refer to “Note 21: Commitments and Contingencies” for information about legal proceedings that occurred after December 31, 2014.
179
Table of Contents
Item 9. Changes in and Disagreements with Accountants on Accounting and Financial Disclosure
None.
Item 9A. Controls and Procedures
Evaluation of Disclosure Controls and Procedures
As of the end of the period covered by this report, an evaluation of the effectiveness of the design and operation of the Company’s disclosure controls and procedures (as defined in Rule 13a-15(e) under the Securities Exchange Act of 1934) was performed under the supervision and with the participation of the Company’s senior management, including the Chief Executive Officer and the Chief Financial Officer. Based on that evaluation, the Company’s management, including the Chief Executive Officer and the Chief Financial Officer, concluded that the Company’s disclosure controls and procedures were effective as of the end of the period covered by this report.
Changes in Internal Control over Financial Reporting
As required by Rule 13a-15(d) under the Exchange Act, the Company’s management, including its Chief Executive Officer and Chief Financial Officer, has evaluated the Company’s internal control over financial reporting to determine whether any changes occurred during the fourth fiscal quarter covered by this annual report that have materially affected or are reasonably likely to materially affect, our internal control over financial reporting. Based on that evaluation, there has been no such change during the fourth fiscal quarter of 2014.
Management’s Report on Internal Control over Financial Reporting
Management of MBIA Inc. and its subsidiaries is responsible for establishing and maintaining adequate internal control over financial reporting. The Company’s internal control over financial reporting is a process designed under the supervision of the Company’s principal executive and principal financial officers to provide reasonable assurance regarding the reliability of financial reporting and the preparation of financial statements for external reporting purposes in accordance with accounting principles generally accepted in the United States of America.
MBIA’s internal control over financial reporting includes policies and procedures that (1) pertain to the maintenance of records that, in reasonable detail, accurately and fairly reflect transactions and dispositions of assets; (2) provide reasonable assurances that transactions are recorded as necessary to permit preparation of financial statements in accordance with accounting principles generally accepted in the United States of America, and that receipts and expenditures are being made only in accordance with authorizations of management and the directors of the Company; and, (3) provide reasonable assurance regarding prevention or timely detection of unauthorized acquisition, use or disposition of the Company’s assets that could have a material effect on the Company’s financial statements.
Because of its inherent limitations, internal control over financial reporting may not prevent or detect misstatements. Also, projections of any evaluation of effectiveness to future periods are subject to the risk that controls may become inadequate because of changes in conditions, or that the degree of compliance with the policies or procedures may deteriorate.
Management has assessed the effectiveness of MBIA Inc. internal control over financial reporting as of December 31, 2014. In making its assessment, management conducted an assessment of the effectiveness of the Company’s internal control over financial reporting based on the framework established in Internal Control—Integrated Framework (2013) issued by the Committee of Sponsoring Organizations of the Treadway Commission (COSO). Based on this assessment and those criteria, management has determined that the Company’s internal control over financial reporting as of December 31, 2014 was effective.
The effectiveness of the Company’s internal control over financial reporting as of December 31, 2014 has been audited by PricewaterhouseCoopers LLP, an independent registered public accounting firm, as stated in their report, which is included in Item 8, “Financial Statements and Supplementary Data.”
180
Table of Contents
Disclosure pursuant to Section 13(r) of the Securities Exchange Act of 1934
Pursuant to Section 13(r) of the Securities Exchange Act of 1934, we may be required to disclose in our annual and quarterly reports to the Securities and Exchange Commission (the “SEC”), whether we or any of our “affiliates” knowingly engaged in certain activities, transactions or dealings relating to Iran or with certain individuals or entities targeted by US economic sanctions. Disclosure is generally required even where the activities, transactions or dealings were conducted in compliance with applicable law. Because the SEC defines the term “affiliate” broadly, it includes any entity under common “control” with us (and the term “control” is also construed broadly by the SEC).
The description of the activities below has been provided to the Company by Warburg Pincus LLC (“WP”), affiliates of which: (i) beneficially own more than 10% of our outstanding common stock and are members of our board of directors and (ii) beneficially own more than 10% of the equity interests of, and have the right to designate members of the board of directors of, Endurance International Group (“EIG”) and Santander Asset Management Investment Holdings Limited (“SAMIH”). EIG and SAMIH may therefore be deemed to be under common “control” with MBIA Inc.; however, this statement is not meant to be an admission that common control exists.
The disclosure below relates solely to activities conducted by EIG and SAMIH and its non-U.S. affiliates that may be deemed to be under common “control” with the Company. The disclosure does not relate to any activities conducted by the Company or by WP and does not involve our or WP’s management. Neither the Company nor WP has had any involvement in or control over the disclosed activities of SAMIH, and neither the Company nor WP has independently verified or participated in the preparation of the disclosure. Neither the Company nor WP is representing as to the accuracy or completeness of the disclosure nor do the Company or WP undertake any obligation to correct or update it.
As to EIG:
The Company understands that EIG’s affiliates intend to disclose in their next annual or quarterly SEC report that:
“On July 2, 2013, the billing information for a subscriber account, or the Subscriber Account was updated to include Seyed Mahmoud Mohaddes, or Mohaddes. On September 16, 2013, the Office of Foreign Assets Control, or OFAC, designated Mohaddes as a Specially Designated National, or SDN, pursuant to 31 C.F.R. Part 560.304. On or around September 26, 2014, during a routine compliance scan of new and existing subscriber accounts, EIG discovered that Mohaddes, a SDN, was named as an account contact for the Subscriber Account. EIG promptly suspended the Subscriber Account, locked the domain name IOCUKLTD.COM, which was registered to the Subscriber Account, and reported the domain name to OFAC as potentially the property of a SDN subject to blocking pursuant to Executive Order 13599. Since September 16, 2013, when Mohaddes was added to the SDN list, charges in the total amount of $120.35 were made to the Subscriber Account for web hosting and domain privacy services. EIG has ceased billing for the Subscriber Account. To date, EIG has not received any correspondence from OFAC regarding this matter.
On July 10, 2014, OFAC designated each of Stars Group Holding, or Stars, and Teleserve Plus SAL, or Teleserve, as SDNs under Executive Order 13224, and their property became subject to blocking pursuant to the Global Terrorism Sanctions Regulations, 31 C.F.R. Part 594. On July 15, 2014, as part of EIG’s compliance review processes, EIG discovered that the domain names associated with each of Stars, STARSCOM.NET, and Teleserve, TELESERVEPLUS.COM, or collectively, the Stars/Teleserve Domain Names, were registered through EIG’s platform. EIG immediately took steps to suspend and lock the Stars/Teleserve Domain Names to prevent them from being transferred or resolving to a website, and EIG promptly reported the Domain Names as potentially blocked property to OFAC. EIG did not generate any revenue from the Stars/Teleserve Domain Names between when they were added to the SDN list on July 10, 2014 and when EIG discovered that they were registered through EIG’s platform on July 15, 2014. To date, EIG has not received any correspondence from OFAC regarding the matter.
181
Table of Contents
Item 9B. Other Information (continued)
On July 15, 2014 during a compliance scan of all domain names on one of our platforms, EIG identified the domain name KAHANETZADAK.COM, or the Domain Name, which was listed as an ‘also known as,’ or AKA, of the entity Kahane Chai which operates as the American Friends of the United Yeshiva. Kahane Chai was designated as a SDN on November 2, 2001 pursuant to Executive Order 13224. Because the Domain Name was transferred into a customer account of one of EIG’s resellers, there was no direct financial transaction between EIG and the registered owner of the Domain Name. The Domain Name was suspended upon EIG’s discovering it on EIG’s platform, and EIG reported the Domain Name to OFAC as potentially the property of a SDN. To date, EIG have not received any correspondence from OFAC regarding the matter.”
As to SAMIH:
The Company understands that SAMIH’s affiliates intend to disclose in their next annual or quarterly SEC report that:
“Santander UK holds frozen savings and current accounts for three customers resident in the U.K. who are currently designated by the U.S. for terrorism. The accounts held by each customer were blocked after the customer’s designation and remained blocked and dormant throughout 2014. No revenue has been generated by Santander UK on these accounts. The bank account held for one of these customers was closed in the fourth quarter of 2014.
An Iranian national, resident in the U.K., who is currently designated by the U.S. under the Iranian Financial Sanctions Regulations and the Weapons of Mass Destruction Proliferators Sanctions Regulations (“NPWMD sanctions program”), holds a mortgage with Santander UK that was issued prior to any such designation. No further drawdown has been made (or would be permitted) under this mortgage although Santander UK continues to receive repayment installments. In 2014, total revenue in connection with the mortgage was approximately £2,580 and net profits were negligible relative to the overall profits of Santander UK. The same Iranian national also holds two investment accounts with Santander Asset Management UK Limited. The accounts have remained frozen during 2014. The investment returns are being automatically reinvested, and no disbursements have been made to the customer. Total revenue for the Santander Group in connection with the investment accounts was £250 and net profits in 2014 were negligible relative to the overall profits of Banco Santander, S.A.
In addition, during the third quarter 2014, Santander UK identified two additional customers: a UK national designated by the U.S. under the NPWMD sanctions program held a business account. No transactions were made and the account was closed in the fourth quarter of 2014. No revenue or profit has been generated. A second UK national designated by the US for reasons of terrorism held a personal current account and a personal credit card account, both of which were closed in the third quarter of 2014. Although transactions took place on the current account during the third quarter of 2014, revenue and profits generated were negligible. No transactions took place on the credit card.”
182
Table of Contents
Part III
Item 10. Directors, Executive Officers and Corporate Governance
Information regarding directors will be set forth under “Proposals for Shareholder Approval Recommended by the Board—Proposal 1: Election of Directors” and “Board of Directors Corporate Governance—The Board of Directors and its Committees” in the Company’s Proxy Statement to be filed within 120 days of the end of our fiscal year ended December 31, 2014 (the “Proxy Statement”) and is incorporated by reference.
Information regarding executive officers is set forth under Part I, Item 1, “Business—Executive Officers of the Registrant,” included in this annual report.
Information regarding Section 16(a) beneficial ownership reporting compliance will be set forth in the section “Section 16(a) Beneficial Ownership Reporting Compliance” in the Proxy Statement and is incorporated by reference.
Information regarding the Company’s Audit Committee will be set forth under “Board of Directors Corporate Governance—The Board of Directors and its Committees” in the Proxy Statement and is incorporated by reference.
The Company has adopted a code of ethics that applies to all employees of the Company including its Chief Executive Officer, Chief Financial Officer and its controller. A copy of such code of ethics can be found on the Company’s internet website at www.mbia.com. The Company intends to satisfy the disclosure requirements under Item 10 of Form 8-K regarding an amendment to, or waiver from, a provision of its code of ethics and that relates to a substantive amendment or material departure from a provision of the Code by posting such information on its internet website at www.mbia.com.
Item 11. Executive Compensation
Information regarding compensation of the Company’s directors and executive officers will be set forth under “Board of Directors Corporate Governance—The Board of Directors and its Committees,” “Compensation and Governance Committee Report,” “Compensation Discussion and Analysis” and “Executive Compensation Tables” in the Proxy Statement and is incorporated by reference.
Item 12. Security Ownership of Certain Beneficial Owners and Management and Related Stockholder Matters
Information regarding security ownership of certain beneficial owners and management will be set forth under “Security Ownership of Certain Beneficial Owners” and “Security Ownership of Directors and Executive Officers” in the Proxy Statement and is incorporated by reference.
The following table provides information as of December 31, 2014, regarding securities authorized for issuance under our equity compensation plans. All outstanding awards relate to our common stock. For additional information about our equity compensation plans refer to “Note 16: Long-term Incentive Plans” in the Notes to Consolidated Financial Statements included in this Annual Report on Form 10-K.
| (a) | (b) | (c) | ||||||||||
| Plan category |
Number of securities to be issued upon exercise of outstanding options, warrants and rights(1) |
Weighted average exercise price of outstanding options, warrants and rights |
Number of securities remaining available for future issuance under equity compensation plans (excluding securities reflected in column (a))(2) |
|||||||||
| Equity compensation plans approved by security holders |
2,722,941 | $ | 10.99 | 6,272,184 | ||||||||
| Equity compensation plans not approved by security holders |
— | — | — | |||||||||
|
|
|
|
|
|
|
|||||||
| Total |
2,722,941 | $ | 10.99 | 6,272,184 | ||||||||
(1)—Includes 174,941 phantom shares granted under the Deferred Compensation and Stock Ownership Plan for Non-Employee Directors. The weighted average exercise price in column (b) does not take these awards into account.
(2)—Includes 6,056,168 shares of common stock available for future grants under the MBIA Inc. 2005 Omnibus Incentive Plan and 216,016 shares of common stock available for future grants under the Deferred Compensation and Stock Ownership Plan for Non-Employee Directors.
183
Table of Contents
Item 13. Certain Relationships and Related Transactions, and Director Independence
Information regarding certain relationships and related transactions will be set forth under “Certain Relationships and Related Transactions” in the Proxy Statement and is incorporated by reference. Information regarding director independence will be set forth under “Proposals for Shareholder Approval Recommended by the Board—Proposal 1: Election of Directors—Director Independence” in the Proxy Statement and is incorporated by reference.
Item 14. Principal Accounting Fees and Services
Information regarding principal accounting fees and services will be set forth under “Principal Accountant Fees and Services” in the Proxy Statement and is incorporated by reference.
184
Table of Contents
Part IV
Item 15. Exhibits, Financial Statement Schedules
| (a) | Financial Statements and Financial Statement Schedules and Exhibits |
1. Financial Statements
The following financial statements of MBIA Inc. have been included in Part II, Item 8 hereof:
Report of Independent Registered Public Accounting Firm.
Consolidated balance sheets as of December 31, 2014 and 2013.
Consolidated statements of operations for the years ended December 31, 2014, 2013 and 2012.
Consolidated statements of comprehensive income (loss) for the years ended December 31, 2014, 2013 and 2012.
Consolidated statements of changes in shareholders’ equity for the years ended December 31, 2014, 2013 and 2012.
Consolidated statements of cash flows for the years ended December 31, 2014, 2013 and 2012.
Notes to consolidated financial statements.
2. Financial Statement Schedules
The following financial statement schedules are filed as part of this report.
| Schedule |
Title | |
| I. | Summary of investments, other than investments in related parties, as of December 31, 2014. | |
| II. | Condensed financial information of Registrant for December 31, 2014, 2013 and 2012. | |
| IV. | Reinsurance for the years ended December 31, 2014, 2013 and 2012. |
The report of the Registrant’s Independent Registered Public Accounting Firm with respect to the above listed financial statement schedules is included within the report listed under Item 15.1 above.
All other schedules are omitted because they are not applicable or the required information is shown in the consolidated financial statements or notes thereto.
3. Exhibits
An exhibit index immediately preceding the Exhibits indicates the exhibit number where each exhibit filed as part of this report can be found.
(Note Regarding Reliance on Statements in Our Contracts: In reviewing the agreements included as exhibits to this Annual Report on Form 10-K, please remember that they are included to provide you with information regarding their terms and are not intended to provide any other factual or disclosure information about MBIA Inc., its subsidiaries or the other parties to the agreements. The agreements contain representations and warranties by each of the parties to the applicable agreement. These representations and warranties have been made solely for the benefit of the other parties to the applicable agreement and (i) should not in all instances be treated as categorical statements of fact, but rather as a way of allocating the risk to one of the parties if those statements prove to be inaccurate; (ii) have been qualified by disclosures that were made to the other party in connection with the negotiation of the applicable agreement, which disclosures are not necessarily reflected in the agreement; (iii) may apply standards of materiality in a way that is different from what may be viewed as material to investors; and (iv) were made only as of the date of the applicable agreement or such other date or dates as may be specified in the agreement and are subject to more recent developments. Accordingly, these representations and warranties may not describe the actual state of affairs as of the date they were made or at any other time.)
3. Articles of Incorporation and By-Laws.
3.1. Amended and Restated Certificate of Incorporation, dated May 5, 2005, incorporated by reference to Exhibit 3.1 to the Company’s Quarterly Report on Form 10-Q for the fiscal quarter ended June 30, 2005.
3.2. By-Laws as Amended as of July 14, 2009, incorporated by reference to Exhibit 3.1 to the Company’s Current Report on Form 8-K filed on July 16, 2009.
185
Table of Contents
Item 15. Exhibits, Financial Statement Schedules (continued)
4. Instruments Defining the Rights of Security Holders, including Indentures.
4.1. Indenture, dated as of August 1, 1990, between MBIA Inc. and The First National Bank of Chicago, Trustee, incorporated by reference to Exhibit 10.72 to the Company’s Annual Report on Form 10-K for the fiscal year ended December 31, 1992 as amended by the First Supplemental Indenture, dated as of August 22, 2002, between MBIA Inc. and Bank One Trust Company, N.A., as Trustee, in connection with the $300,000,000 6.4% senior notes due 2022, incorporated by reference to the Exhibit 4.04 to the Company’s Current Report on Form 8-K filed on August 22, 2002, and the Second Supplemental Indenture, dated as of November 21, 2012, between MBIA Inc. and The Bank of New York Mellon, as Trustee, incorporated by reference to Exhibit 4.1 to the Company’s Current Report on Form 8-K filed on November 26, 2012.
4.2. Senior Indenture, dated as of November 24, 2004, between MBIA Inc. and The Bank of New York, as Trustee, incorporated by reference to Exhibit 4.01 to the Company’s Current Report on Form 8-K filed on November 29, 2004 as amended by the First Supplemental Indenture, dated as of November 24, 2004, between MBIA Inc. and The Bank of New York, as Trustee, in connection with the $350,000,000 5.70% senior notes due 2034, incorporated by reference to Exhibit 4.02 to the Company’s Current Report on Form 8-K filed on November 29, 2004 as amended by the Second Supplemental Indenture, dated as of November 21, 2012, between MBIA Inc. and The Bank of New York Mellon, as Trustee, incorporated by reference to Exhibit 4.2 to the Company’s Current Report on Form 8-K filed on November 26, 2012.
4.3. Fiscal Agency Agreement, dated as of January 16, 2008, between MBIA Insurance Corporation and The Bank of New York, incorporated by reference to Exhibit 4.01 to the Company’s Current Report on Form 8-K filed on January 17, 2008.
4.4. Form of MBIA Corp. 14% Fixed-to-Floating Rate Global Note due January 15, 2033, incorporated by reference to Exhibit 4.02 to the Company’s Current Report on Form 8-K filed on January 17, 2008.
4.5. Warrant Agreement, dated as of January 30, 2008, between the Company and Warburg Pincus Private Equity X, LP., incorporated by reference to Exhibit 4.7 to the Company’s Annual Report on Form 10-K for the fiscal year ended December 31, 2007.
4.6. B Warrant Agreement, dated as of January 30, 2008, between the Company and Warburg Pincus Private Equity X, LP., incorporated by reference to Exhibit 4.8 to the Company’s Annual Report on Form 10-K for the fiscal year ended December 31, 2007.
4.7. B2 Warrant Agreement, dated as of January 30, 2008, between the Company and Warburg Pincus Private Equity X, LP, incorporated by reference to Exhibit 4.1 to the Company’s Current Report on Form 8-K filed on February 7, 2008.
4.8. B2 Warrant Agreement, dated as of January 30, 2008, between the Company and Warburg Pincus X Partners, L.P. incorporated by reference to Exhibit 4.2 to the Company’s Current Report on Form 8-K filed on February 7, 2008.
4.9. Warrant Agreement, dated as of May 6, 2013, between MBIA Inc. and Blue Ridge Investments, L.L.C., incorporated by reference to Exhibit 4.1 to the Company’s Quarterly Report on Form 10-Q for the fiscal quarter ended March 31, 2013.
4.10. Warrant Agreement, dated as of August 5, 2013, between MBIA Inc. and Warburg Pincus Private Equity X, L.P., incorporated by reference to Exhibit 4.2 to the Company’s Quarterly Report on Form 10-Q for the fiscal quarter ended June 30, 2013.
10. Material Contracts
10.1. Amended and Restated Investment Agreement, dated February 6, 2008, between MBIA Inc. and Warburg Pincus Private Equity X, L.P., incorporated by reference to exhibit 10.1 to the Company’s Current Report on Form 8-K filed on February 7, 2008.
186
Table of Contents
Item 15. Exhibits, Financial Statement Schedules (continued)
Executive Compensation Plans and Arrangements
The following Exhibits identify all existing executive compensation plans and arrangements:
10.2. Amended and Restated Deferred Compensation and Stock Ownership Plan for Non-Employee Directors, effective as of March 21, 2002, incorporated by reference to the MBIA Inc. Form S-8 filed on March 14, 2002 (Reg. No. 333-84300).
10.3. MBIA Inc. Annual Incentive Plan, effective January 1, 2011, incorporated by reference to Exhibit A to the Company’s Proxy Statement filed on March 19, 2010, as amended by the Amendment thereto effective as of May 2, 2013.
10.4. MBIA Inc. 2005 Omnibus Incentive Plan, as amended through March, 2012, incorporated by reference to Exhibit A to the Company’s Proxy Statement filed on March 19, 2012, as amended by the Amendment thereto, effective as of May 2, 2013.
10.5. Key Employee Employment Protection Plan, amended as of February 27, 2007, incorporated by reference to Exhibit 10.80 to the Company’s Annual Report on Form 10-K for the fiscal year ended December 31, 2007, as further amended by Amendment No. 2, effective February 22, 2010, incorporated by reference to Exhibit 10.15 to the Company’s Annual Report on Form 10-K for the fiscal year ended December 31, 2009.
10.6. Form of Key Employee Employment Protection Agreement, amended as of February 27, 2007, incorporated by reference to Exhibit 10.81 to the Company’s Annual Report on Form 10-K for the fiscal year ended December 31, 2007.
10.7. MBIA Inc. 2005 Non-Employee Director Deferred Compensation Plan (as amended through February 2014), incorporated by reference to Exhibit 10.1 to the Company’s Form S-8 filed on March 5, 2014 (Reg. No. 333-194335).
10.8. Form of MBIA Inc. 2005 Omnibus Incentive Plan Nonqualified Stock Option Agreement, effective as of May 5, 2005, incorporated by reference to Exhibit 10.30 to the Company’s Annual Report on Form 10-K for the fiscal year ended December 31, 2008.
10.9. Amended and Restated MBIA Inc. Deferred Compensation and Excess Benefit Plan, effective as of March 22, 2010, incorporated by reference to Exhibit 10.1 to the Company’s Quarterly Report on Form 10-Q for the fiscal quarter ended March 31, 2010.
10.10. Cutwater Holdings, LLC Equity Participation Plan effective as of May 7, 2010, incorporated by reference to Exhibit 10.2 to the Company’s Quarterly Report on Form 10-Q for the fiscal quarter ended March 31, 2010.
10.11. Cash Retention Award and Restricted Stock Agreement, dated as of December 21, 2012, between MBIA Inc. and C. Edward Chaplin, incorporated by reference to Exhibit 10.15 to the Company’s Annual Report on Form 10-K for the fiscal year ended December 31, 2012.
10.12. Cash Retention Award and Restricted Stock Agreement, dated as of December 21, 2012, between MBIA Inc. and William C. Fallon, incorporated by reference to Exhibit 10.16 to the Company’s Annual Report on Form 10-K for the fiscal year ended December 31, 2012.
10.13. Cash Retention Award and Restricted Stock Agreement, dated as of December 21, 2012, between MBIA Inc. and Anthony McKiernan, incorporated by reference to Exhibit 10.17 to the Company’s Annual Report on Form 10-K for the fiscal year ended December 31, 2012.
10.14. Cash Retention Award and Restricted Stock Agreement, dated as of December 21, 2012, between MBIA Inc. and Ram Wertheim, incorporated by reference to Exhibit 10.18 to the Company’s Annual Report on Form 10-K for the fiscal year ended December 31, 2012.
10.15. Restricted Stock Award Agreement between MBIA Inc. and Joseph W. Brown, dated as of March 17, 2014, incorporated by reference to Exhibit 10.2 to the Company’s Quarterly Report on Form 10-Q for the fiscal quarter ended March 31, 2014.
187
Table of Contents
+10.16. Amendment to Restricted Stock Award Agreement between MBIA Inc. and Joseph W. Brown, dated as of March 2, 2015.
+21. List of Subsidiaries.
+23. Consent of PricewaterhouseCoopers LLP.
+31.1. Chief Executive Officer—Certification Pursuant to Section 302 of the Sarbanes-Oxley Act of 2002.
+31.2. Chief Financial Officer—Certification Pursuant to Section 302 of the Sarbanes-Oxley Act of 2002.
*32.1. Chief Executive Officer—Certification Pursuant to 18 U.S.C. Section 1350, as Adopted Pursuant to Section 906 of the Sarbanes-Oxley Act of 2002.
*32.2. Chief Financial Officer— Certification Pursuant to 18 U.S.C. Section 1350, as Adopted Pursuant to Section 906 of the Sarbanes-Oxley Act of 2002.
99.1. Quota Share Reinsurance Agreement between MBIA Insurance Corporation and MBIA Insurance Corp. of Illinois dated February 17, 2009, incorporated by reference to Exhibit 99.1 to the Company’s Current Report on Form 8-K filed on February 20, 2009.
99.2. Novation Agreement, dated as of September 14, 2012, between Financial Guaranty Insurance Company and National Public Finance Guarantee Corporation, incorporated by reference to Exhibit 99.3 to the Company’s Quarterly Report on Form 10-Q for the fiscal quarter ended September 30, 2013.
+99.3 Amended and Restated Tax Sharing Agreement, dated as of September 8, 2011, between MBIA Inc. and certain of its subsidiaries.
+101. Additional Exhibits—MBIA Inc. and Subsidiaries Consolidated Financial Statements and Notes to Consolidated Financial Statements from the Company’s Annual Report on Form 10-K for the year ended December 31, 2014, formatted in XBRL.
| + | Filed Herewith |
| * | Furnished Herewith |
188
Table of Contents
Pursuant to the requirements of Section 13 or 15(d) of the Securities Exchange Act of 1934, the Registrant has caused this Report to be signed on its behalf by the undersigned, thereunto duly authorized.
| MBIA Inc. (Registrant) | ||||
| Dated: March 2, 2015 |
By | /s/ Joseph W. Brown | ||
| Name: | Joseph W. Brown | |||
| Title: | Chief Executive Officer | |||
Pursuant to the requirements of the Securities Exchange Act of 1934, this Report has been signed below by the following persons on behalf of the Registrant and in the capacities and on the dates indicated.
| Signature |
Title |
Date | ||
| /s/ Joseph W. Brown Joseph W. Brown |
Director and Chief Executive Officer | March 2, 2015 | ||
| /s/ C. Edward Chaplin C. Edward Chaplin |
President, Chief Financial Officer and Chief Administrative Officer |
March 2, 2015 | ||
| /s/ Douglas C. Hamilton Douglas C. Hamilton |
Assistant Vice President and Controller (chief accounting officer) | March 2, 2015 | ||
| /s/ Daniel P. Kearney Daniel P. Kearney |
Chairman and Director | March 2, 2015 | ||
| /s/ Maryann Bruce Maryann Bruce |
Director | March 2, 2015 | ||
| /s/ Sean D. Carney Sean D. Carney |
Director | March 2, 2015 | ||
| /s/ David A. Coulter David A. Coulter |
Director | March 2, 2015 | ||
| /s/ Steven J. Gilbert Steven J. Gilbert |
Director | March 2, 2015 | ||
| /s/ Charles R. Rinehart Charles R. Rinehart |
Director | March 2, 2015 | ||
| /s/ Theodore Shasta Theodore Shasta |
Director | March 2, 2015 | ||
| /s/ Richard C. Vaughan Richard C. Vaughan |
Director | March 2, 2015 | ||
189
Table of Contents
MBIA INC. AND SUBSIDIARIES
SUMMARY OF INVESTMENTS, OTHER THAN INVESTMENTS IN RELATED PARTIES
December 31, 2014
(In millions)
| December 31, 2014 | ||||||||||||
| Type of investment |
Cost | Fair Value | Amount at which shown in the balance sheet |
|||||||||
| Available-for-sale: |
||||||||||||
| U.S. Treasury and government agency |
$ | 446 | $ | 482 | $ | 482 | ||||||
| State and municipal bonds |
1,613 | 1,699 | 1,699 | |||||||||
| Foreign governments |
223 | 230 | 230 | |||||||||
| Corporate obligations |
1,434 | 1,386 | 1,386 | |||||||||
| Mortgage-backed securities: |
||||||||||||
| Residential mortgage-backed agency |
1,111 | 1,122 | 1,122 | |||||||||
| Residential mortgage-backed non-agency |
50 | 49 | 49 | |||||||||
| Commercial mortgage-backed |
17 | 17 | 17 | |||||||||
| Asset-backed securities: |
||||||||||||
| Collateralized debt obligations |
84 | 66 | 66 | |||||||||
| Other asset-backed |
184 | 174 | 174 | |||||||||
|
|
|
|
|
|
|
|||||||
| Total long-term available-for-sale |
5,162 | 5,225 | 5,225 | |||||||||
| Short-term available-for-sale |
1,335 | 1,333 | 1,333 | |||||||||
| Equity available-for-sale |
12 | 13 | 13 | |||||||||
|
|
|
|
|
|
|
|||||||
| Total available-for-sale |
6,509 | 6,571 | 6,571 | |||||||||
| Investments at fair value |
256 | 255 | 255 | |||||||||
| Other investments |
4 | 4 | 4 | |||||||||
|
|
|
|
|
|
|
|||||||
| Total investments |
$ | 6,769 | $ | 6,830 | $ | 6,830 | ||||||
|
|
|
|
|
|
|
|||||||
| Assets of consolidated variable interest entities: |
||||||||||||
| Investments at fair value |
298 | 421 | 421 | |||||||||
| Held-to-maturity: |
||||||||||||
| Corporate obligations |
2,757 | 2,632 | 2,757 | |||||||||
|
|
|
|
|
|
|
|||||||
| Total investments of consolidated variable interest entities |
$ | 3,055 | $ | 3,053 | $ | 3,178 | ||||||
|
|
|
|
|
|
|
|||||||
190
Table of Contents
MBIA INC. (PARENT COMPANY)
CONDENSED BALANCE SHEETS
(In millions except share and per share amounts)
| December 31, 2014 |
December 31, 2013 |
|||||||
| Assets |
||||||||
| Investments: |
||||||||
| Fixed-maturity securities held as available-for-sale, at fair value (amortized cost $671 and $703) |
$ | 751 | $ | 728 | ||||
| Investments carried at fair value |
33 | 32 | ||||||
| Investments pledged as collateral, at fair value (amortized cost $445 and $463) |
408 | 375 | ||||||
| Short-term investments held as available-for-sale, at fair value (amortized cost $327 and $171) |
327 | 171 | ||||||
| Other investments |
4 | 3 | ||||||
|
|
|
|
|
|||||
| Total investments |
1,523 | 1,309 | ||||||
| Cash and cash equivalents |
100 | 140 | ||||||
| Investment in wholly-owned subsidiaries |
3,953 | 3,890 | ||||||
| Deferred income taxes, net |
965 | 791 | ||||||
| Other assets |
143 | 140 | ||||||
|
|
|
|
|
|||||
| Total assets |
$ | 6,684 | $ | 6,270 | ||||
|
|
|
|
|
|||||
| Liabilities and Shareholders’ Equity |
||||||||
| Liabilities: |
||||||||
| Investment agreements |
505 | 654 | ||||||
| Long-term debt |
592 | 592 | ||||||
| Affiliate loans payable |
1,207 | 1,510 | ||||||
| Other liabilities |
451 | 236 | ||||||
|
|
|
|
|
|||||
| Total liabilities |
2,755 | 2,992 | ||||||
|
|
|
|
|
|||||
| Shareholders’ Equity: |
||||||||
| Preferred stock, par value $1 per share; authorized shares—10,000,000; issued and outstanding—none |
— | — | ||||||
| Common stock, par value $1 per share; authorized shares—400,000,000; issued shares—281,352,782 and 277,812,430 |
281 | 278 | ||||||
| Additional paid-in capital |
3,128 | 3,115 | ||||||
| Retained earnings |
2,858 | 2,289 | ||||||
| Accumulated other comprehensive income (loss), net of tax of $6 and $25 |
21 | (86) | ||||||
| Treasury stock, at cost—89,409,887 and 85,562,546 shares |
(2,359) | (2,318) | ||||||
|
|
|
|
|
|||||
| Total shareholders’ equity of MBIA Inc. |
3,929 | 3,278 | ||||||
|
|
|
|
|
|||||
| Total liabilities and shareholders’ equity |
$ | 6,684 | $ | 6,270 | ||||
|
|
|
|
|
|||||
The condensed financial statements should be read in conjunction with the consolidated financial statements and notes thereto and the accompanying notes.
191
Table of Contents
SCHEDULE II
MBIA INC. (PARENT COMPANY)
CONDENSED STATEMENTS OF OPERATIONS
(In millions)
| Years ended December 31, | ||||||||||||
| 2014 | 2013 | 2012 | ||||||||||
| Revenues: |
||||||||||||
| Net investment income |
$ | 44 | $ | 50 | $ | 60 | ||||||
| Net gains (losses) on financial instruments at fair value and foreign exchange |
24 | 11 | (119) | |||||||||
| Investment losses related to other-than-temporary impairments: |
||||||||||||
| Investment losses related to other-than-temporary impairments |
— | — | (52) | |||||||||
| Other-than-temporary impairments recognized in accumulated other comprehensive income (loss) |
|
— |
|
|
— |
|
|
(7) |
| |||
|
|
|
|
|
|
|
|||||||
| Net investment losses related to other-than-temporary impairments |
— | — | (59) | |||||||||
| Net gains (losses) on extinguishment of debt |
1 | 43 | (2) | |||||||||
| Other net realized gains (losses) |
1 | — | 6 | |||||||||
|
|
|
|
|
|
|
|||||||
| Total revenues |
70 | 104 | (114) | |||||||||
|
|
|
|
|
|
|
|||||||
| Expenses: |
||||||||||||
| Operating |
25 | 69 | 40 | |||||||||
| Interest |
104 | 105 | 155 | |||||||||
|
|
|
|
|
|
|
|||||||
| Total expenses |
129 | 174 | 195 | |||||||||
|
|
|
|
|
|
|
|||||||
| Gain (loss) before income taxes and equity in earnings of subsidiaries |
(59) | (70) | (309) | |||||||||
| Provision (benefit) for income taxes |
(165) | (202) | (781) | |||||||||
|
|
|
|
|
|
|
|||||||
| Gain (loss) before equity in earnings of subsidiaries |
106 | 132 | 472 | |||||||||
| Equity in net income (loss) of subsidiaries |
463 | 118 | 762 | |||||||||
|
|
|
|
|
|
|
|||||||
| Net income (loss) |
$ | 569 | $ | 250 | $ | 1,234 | ||||||
|
|
|
|
|
|
|
|||||||
The condensed financial statements should be read in conjunction with the
consolidated financial statements and notes thereto and the accompanying notes.
192
Table of Contents
SCHEDULE II
MBIA INC. (PARENT COMPANY)
CONDENSED STATEMENTS OF COMPREHENSIVE INCOME (LOSS)
(In millions)
| Years ended December 31, | ||||||||||||
| 2014 | 2013 | 2012 | ||||||||||
| Net income (loss) |
$ | 569 | $ | 250 | $ | 1,234 | ||||||
| Other comprehensive income (loss): |
||||||||||||
| Unrealized gains (losses) on available-for-sale securities: |
||||||||||||
| Unrealized gains (losses) arising during the period |
126 | (179) | 166 | |||||||||
| Provision (benefit) for income taxes |
14 | (17) | 36 | |||||||||
|
|
|
|
|
|
|
|||||||
| Total |
112 | (162) | 130 | |||||||||
| Reclassification adjustments for (gains) losses included in net income (loss) |
23 | 23 | 111 | |||||||||
| Provision (benefit) for income taxes |
8 | 8 | 39 | |||||||||
|
|
|
|
|
|
|
|||||||
| Total |
15 | 15 | 72 | |||||||||
| Available-for-sale securities with other-than-temporary impairments: |
||||||||||||
| Other-than-temporary impairments and unrealized gains (losses) arising during the period |
— | 12 | 38 | |||||||||
| Provision (benefit) for income taxes |
— | 4 | 13 | |||||||||
|
|
|
|
|
|
|
|||||||
| Total |
— | 8 | 25 | |||||||||
| Reclassification adjustments for (gains) losses included in net income (loss) |
4 | — | 31 | |||||||||
| Provision (benefit) for income taxes |
1 | — | 11 | |||||||||
|
|
|
|
|
|
|
|||||||
| Total |
3 | — | 20 | |||||||||
| Foreign currency translation: |
||||||||||||
| Foreign currency translation gains (losses) |
(23) | (3) | (15) | |||||||||
|
|
|
|
|
|
|
|||||||
| Total other comprehensive income (loss) |
107 | (142) | 232 | |||||||||
|
|
|
|
|
|
|
|||||||
| Comprehensive income (loss) |
$ | 676 | $ | 108 | $ | 1,466 | ||||||
|
|
|
|
|
|
|
|||||||
The condensed financial statements should be read in conjunction with the
consolidated financial statements and notes thereto and the accompanying notes.
193
Table of Contents
SCHEDULE II
MBIA INC. (PARENT COMPANY)
CONDENSED STATEMENTS OF CASH FLOWS
(In millions)
| Years ended December 31, | ||||||||||||
| 2014 | 2013 | 2012 | ||||||||||
| Cash flows from operating activities: |
||||||||||||
| Fees and reimbursements received |
$ | 1 | $ | — | $ | 5 | ||||||
| Investment income received |
256 | 250 | 118 | |||||||||
| Operating expenses paid |
(35) | (35) | (43) | |||||||||
| Interest paid, net of interest converted to principal |
(93) | (93) | (101) | |||||||||
| Income taxes (paid) received |
59 | 111 | 224 | |||||||||
|
|
|
|
|
|
|
|||||||
| Net cash provided (used) by operating activities |
188 | 233 | 203 | |||||||||
|
|
|
|
|
|
|
|||||||
| Cash flows from investing activities: |
||||||||||||
| Purchases of available-for-sale investments |
(125) | (287) | (560) | |||||||||
| Sales of available-for-sale investments |
268 | 147 | 1,148 | |||||||||
| Paydowns and maturities of available-for-sale investments |
98 | 252 | 1,036 | |||||||||
| Purchases of investments at fair value |
(266) | (144) | (42) | |||||||||
| Sales, paydowns and maturities of investments at fair value |
280 | 126 | 139 | |||||||||
| Sales, paydowns and maturities (purchases) of short-term investments, net |
(242) | 94 | 114 | |||||||||
| (Payments) proceeds for derivative settlements |
(26) | (32) | (207) | |||||||||
| Collateral (to) from swap counterparty |
144 | 122 | (285) | |||||||||
| Contributions to subsidiaries, net |
(20) | 2 | (12) | |||||||||
| Advances to subsidiaries, net |
(12) | — | 1 | |||||||||
|
|
|
|
|
|
|
|||||||
| Net cash provided (used) by investing activities |
99 | 280 | 1,332 | |||||||||
|
|
|
|
|
|
|
|||||||
| Cash flows from financing activities: |
||||||||||||
| Proceeds from investment agreements |
23 | 25 | 31 | |||||||||
| Principal paydowns of investment agreements |
(181) | (274) | (679) | |||||||||
| Payments for securities sold under agreements to repurchase |
— | (32) | (639) | |||||||||
| Payments for retirement of debt |
— | (3) | (180) | |||||||||
| Payments for affiliate loans |
(153) | (194) | (109) | |||||||||
| Purchases of treasury stock |
(32) | — | — | |||||||||
| Restricted stock awards settlements |
16 | 13 | 1 | |||||||||
|
|
|
|
|
|
|
|||||||
| Net cash provided (used) by financing activities |
(327) | (465) | (1,575) | |||||||||
|
|
|
|
|
|
|
|||||||
| Net increase (decrease) in cash and cash equivalents |
(40) | 48 | (40) | |||||||||
| Cash and cash equivalents—beginning of year |
140 | 92 | 132 | |||||||||
|
|
|
|
|
|
|
|||||||
| Cash and cash equivalents—end of year |
$ | 100 | $ | 140 | $ | 92 | ||||||
|
|
|
|
|
|
|
|||||||
| Reconciliation of net income (loss) to net cash provided (used) by operating activities: |
||||||||||||
| Net income (loss) |
$ | 569 | $ | 250 | $ | 1,234 | ||||||
| Adjustments to reconcile net income (loss) to net cash provided (used) by operating activities: |
||||||||||||
| Change in: |
||||||||||||
| Intercompany accounts receivable |
(24) | (14) | (9) | |||||||||
| Current income taxes |
70 | 116 | 57 | |||||||||
| Equity in earnings of subsidiaries |
(463) | (118) | (762) | |||||||||
| Dividends from subsidiaries |
225 | 219 | 60 | |||||||||
| Net investment losses related to other-than-temporary impairments |
— | — | 59 | |||||||||
| Net (gains) losses on financial instruments at fair value and foreign exchange |
(24) | (11) | 119 | |||||||||
| Other net realized (gains) losses |
(1) | — | (6) | |||||||||
| Deferred income tax benefit |
(176) | (207) | (613) | |||||||||
| (Gains) losses on extinguishment of debt |
(1) | (43) | 2 | |||||||||
| Other operating |
13 | 41 | 62 | |||||||||
|
|
|
|
|
|
|
|||||||
| Total adjustments to net income (loss) |
(381) | (17) | (1,031) | |||||||||
|
|
|
|
|
|
|
|||||||
| Net cash provided (used) by operating activities |
$ | 188 | $ | 233 | $ | 203 | ||||||
|
|
|
|
|
|
|
|||||||
The condensed financial statements should be read in conjunction with the
consolidated financial statements and notes thereto and the accompanying notes.
194
Table of Contents
SCHEDULE II
MBIA INC. (PARENT COMPANY)
NOTES TO CONDENSED FINANCIAL STATEMENTS
1. Condensed Financial Statements
Certain information and footnote disclosures normally included in financial statements prepared in accordance with accounting principles generally accepted in the United States of America have been condensed or omitted. It is suggested that these condensed financial statements be read in conjunction with the Company’s consolidated financial statements and the notes thereto.
The activities of MBIA Inc. consist of general corporate activities and funding activities, which principally include holding and managing investments, servicing outstanding corporate debt, investment agreements issued by MBIA Inc. and its subsidiaries, and posting collateral under investment agreement and derivative contracts.
MBIA Inc. is subject to the same liquidity risks and uncertainties as described in footnote 1 to the Company’s consolidated financial statements. As of December 31, 2014, MBIA Inc. had $498 million of cash and highly liquid assets available for general corporate liquidity purposes.
2. Significant Accounting Policies
MBIA Inc. (the “Parent Company”) carries its investments in subsidiaries under the equity method.
Certain amounts have been reclassified in prior years’ financial statements to conform to the current presentation. These reclassifications had no impact on total revenues, expenses, assets, liabilities, or shareholders’ equity for all periods presented.
3. Dividends from Subsidiaries
During 2014, National Public Finance Guarantee Holdings, Inc. declared and paid a dividend of $220 million to MBIA Inc. and Trifinium Holdings Limited declared and paid dividends of $5 million to MBIA Inc.
During 2013, National Public Finance Guarantee Holdings, Inc. declared and paid a dividend of $214 million to MBIA Inc., MBIA Services Corporation, formerly Optinuity Alliance Resources Corporation, declared and paid dividends of $2 million to MBIA Inc. and CapMAC Holdings Inc. declared and paid dividends of $3 million to MBIA Inc.
During 2012, MBIA Services Corporation declared and paid dividends of $53 million to MBIA Inc., MBIA Asset Finance, LLC declared and paid dividends of $6 million to MBIA Inc. and Euro Asset Acquisition Limited declared and paid dividends of $1 million to MBIA Inc.
4. Obligations under Investment Agreements
The investment agreement business, as described in footnotes 2 and 10 to the Company’s consolidated financial statements, is conducted by both MBIA Inc. and its wholly owned subsidiary, MBIA Investment Management Corp.
5. Pledged Collateral
Substantially all of the obligations under investment agreements require MBIA Inc. to pledge securities as collateral. As of December 31, 2014 and 2013, the fair value of securities pledged as collateral with respect to these investment agreements approximated $273 million and $270 million, respectively. The Parent Company’s collateral as of December 31, 2014, consisted principally of mortgage-backed securities, corporate obligations, and U.S. Treasury and government agency bonds, and was primarily held with major U.S. banks. Additionally, the Parent Company pledged money market securities as collateral under investment agreements in the amount of $26 million and $22 million as of December 31, 2014 and 2013, respectively.
Under derivative contracts entered into by MBIA Inc., collateral postings are required by either MBIA Inc. or the counterparty when the aggregate market value of derivative contracts entered into with the same counterparty exceeds a predefined threshold. As of December 31, 2014, MBIA Inc. pledged securities with a fair value of $199 million to derivative counterparties. As of December 31, 2013, MBIA Inc. pledged securities with a fair value of $42 million to derivative counterparties.
195
Table of Contents
6. Affiliate Loans Payable
Affiliate loans payable consists of loans payable to MBIA Global Funding, LLC (“GFL”). GFL raised funds through the issuance of medium-term notes with varying maturities, which were, in turn, guaranteed by MBIA Corp. GFL lent the proceeds of these medium-term note issuances to MBIA Inc.
196
Table of Contents
MBIA INC. AND SUBSIDIARIES
REINSURANCE
Years Ended December 31, 2014, 2013 and 2012
(In millions)
| Column A Insurance Premium Written |
Column B Direct Amount |
Column C Ceded to Others |
Column D Assumed From Other Companies |
Column E Net Amount |
Column F Percentage of Amount Assumed to Net |
|||||||||||||||
| 2014 |
$ | (18) | $ | 2 | $ | — | $ | (20) | 0% | |||||||||||
|
|
|
|
|
|
|
|
|
|
|
|||||||||||
| 2013 |
$ | (40) | $ | 2 | $ | 1 | $ | (41) | -2% | |||||||||||
|
|
|
|
|
|
|
|
|
|
|
|||||||||||
| 2012 |
$ | 17 | $ | 2 | $ | 2 | $ | 17 | 12% | |||||||||||
|
|
|
|
|
|
|
|
|
|
|
|||||||||||
197
Table of Contents
Securities and Exchange Commission
Washington, D.C. 20549
Exhibits
to
Form 10-K
Annual Report Pursuant to Section 13 or 15(d)
of the Securities Exchange Act of 1934
For the fiscal year ended December 31, 2014
Commission File No. 1-9583
MBIA Inc.
Exhibit Index
| 10.16. | Amendment to Restricted Stock Award Agreement between MBIA Inc. and Joseph W. Brown, dated as of March 2, 2015. | |
| 21. | List of Subsidiaries. | |
| 23. | Consent of PricewaterhouseCoopers LLP. | |
| 31.1. | Chief Executive Officer—Certification Pursuant to Section 302 of the Sarbanes-Oxley Act of 2002. | |
| 31.2. | Chief Financial Officer—Certification Pursuant to Section 302 of the Sarbanes-Oxley Act of 2002. | |
| *32.1. | Chief Executive Officer—Certification Pursuant to 18 U.S.C. Section 1350, as Adopted Pursuant to Section 906 of the Sarbanes-Oxley Act of 2002. | |
| *32.2. | Chief Financial Officer—Certification Pursuant to 18 U.S.C. Section 1350, as Adopted Pursuant to Section 906 of the Sarbanes-Oxley Act of 2002. | |
| 99.3 | Amended and Restated Tax Sharing Agreement, dated as of September 8, 2011, between MBIA Inc. and certain of its subsidiaries. | |
| 101. | Additional Exhibits—MBIA Inc. and Subsidiaries Consolidated Financial Statements and Notes to Consolidated Financial Statements from the Company’s Annual Report on Form 10-K for the year ended December 31, 2014, formatted in XBRL. | |
| * | Furnished Herewith |
198
Exhibit 10.16
AMENDMENT TO
RESTRICTED STOCK AWARD AGREEMENT
This amendment (this “Amendment”) to the Restricted Stock Award Agreement (the “Agreement”) dated as of March 17, 2014, between MBIA Inc., a Connecticut corporation (together with its successors and assigns, the “Company”), and Joseph W. Brown (the “Grantee”), is dated as of March 2, 2015, between the Company and the Grantee (together, the “Parties”).
The Parties hereby agree to amend the Agreement by deleting clause (C) of Section 1(b)(i) and clause (C) of Section 1(b)(ii).
Except as expressly amended hereby, the other terms and conditions of the Agreement shall remain in full force and effect.
IN WITNESS WHEREOF, the Parties have executed this Amendment as of the date first written above.
| MBIA INC. | ||
| By: | /s/ Ram Wertheim | |
| Name: Ram Wertheim | ||
| Title: Chief Legal Officer | ||
| GRANTEE | ||
| /s/ Jay Brown | ||
| Joseph W. Brown | ||
Exhibit 21
SUBSIDIARIES OF MBIA INC.
| Name of Subsidiary |
State/Country of Incorporation | |
| CapMAC Holdings Inc. | Delaware | |
| Cutwater Asset Management Corp. | Delaware | |
| Cutwater Holdings, LLC | Delaware | |
| Cutwater Investor Services Corp. | Delaware | |
| LaCrosse Financial Products, LLC | Delaware | |
| LaCrosse Financial Products Member, LLC | Delaware | |
| MBIA Asset Finance, LLC | Delaware | |
| MBIA Capital Corp. | Delaware | |
| MBIA Global Funding, LLC | Delaware | |
| MBIA Insurance Corporation | New York | |
| MBIA Investment Management Corp. | Delaware | |
| MBIA Mexico, S.A. de C.V. | Mexico | |
| MBIA Services Corporation | Delaware | |
| MBIA UK (Holdings) Limited | England and Wales | |
| MBIA UK Insurance Limited | England and Wales | |
| Municipal Issuers Service Corporation | New York | |
| National Public Finance Guarantee Holdings, Inc. | Delaware | |
| National Public Finance Guarantee Corporation | New York | |
| National Real Estate Holdings of Armonk, LLC | Delaware | |
| Promotora de Infraestructura Registral, S.A. de C.V. SOFOM ENR | Mexico | |
| Trifinium Advisors (UK) Limited | England and Wales | |
| Trifinium Holdings Limited | England and Wales | |
| Trifinium Services Limited | England and Wales |
Exhibit 23
CONSENT OF INDEPENDENT REGISTERED PUBLIC ACCOUNTING FIRM
We hereby consent to the incorporation by reference in the Registration Statements on Form S-3 (No. 333-190737) and Form S-8 (Nos. 333-84300, 033-46062, 333-152894, 333-159648, 333-165713, 333-183529, 333-190738 and 333-194335) of MBIA Inc. of our report dated March 2, 2015 relating to the consolidated financial statements, financial statement schedules and the effectiveness of internal control over financial reporting, which appears in this Form 10-K.
/s/ PricewaterhouseCoopers LLP
New York, New York
March 2, 2015
Exhibit 31.1
CERTIFICATION PURSUANT TO
SECTION 302 OF THE SARBANES-OXLEY ACT OF 2002
I, Joseph W. Brown, certify that:
| 1. | I have reviewed the Annual Report of MBIA Inc. (the “Company”) on Form 10-K for the period ending December 31, 2014 as filed with the Securities and Exchange Commission on the date hereof (the “Report”); |
| 2. | Based on my knowledge, this Report does not contain any untrue statement of a material fact or omit to state a material fact necessary to make the statements made, in light of the circumstances under which such statements were made, not misleading with respect to the period covered by this Report; |
| 3. | Based on my knowledge, the financial statements, and other financial information included in this Report, fairly present in all material respects the financial condition, results of operations and cash flows of the Company as of, and for, the periods presented in this Report; |
| 4. | The Company’s other certifying officers and I are responsible for establishing and maintaining disclosure controls and procedures (as defined in Exchange Act Rules 13a-15(e) and 15d-15(e)) and internal control over financial reporting (as defined in Exchange Act Rules 13a-15(f) and 15d-15(f)) for the Company and have: |
| (a) | designed such disclosure controls and procedures, or caused such disclosure controls and procedures to be designed under our supervision, to ensure that material information relating to the Company, including its consolidated subsidiaries, is made known to us by others within those entities, particularly during the period in which this Report is being prepared; |
| (b) | designed such internal control over financial reporting, or caused such internal control over financial reporting to be designed under our supervision, to provide reasonable assurance regarding the reliability of financial reporting and the preparation of financial statements for external purposes in accordance with generally accepted accounting principles; |
| (c) | evaluated the effectiveness of the Company’s disclosure controls and procedures and presented in this Report our conclusions about the effectiveness of the disclosure controls and procedures, as of the end of the period covered by this Report based on such evaluation; and |
| (d) | disclosed in this Report that there were no changes in the Company’s internal control over financial reporting that occurred during the Company’s fourth quarter of 2014 that has materially affected, or is reasonably likely to materially affect, the Company’s internal control over financial reporting; and |
| 5. | The Company’s other certifying officers and I have disclosed, based on our most recent evaluation of internal control over financial reporting, to the Company’s auditors and to the audit committee of the board of directors: |
| (a) | all significant deficiencies and material weaknesses in the design or operation of internal control over financial reporting which are reasonably likely to adversely affect the Company’s ability to record, process, summarize and report financial information; and |
| (b) | any fraud, whether or not material, that involves management or other employees who have a significant role in the Company’s internal control over financial reporting. |
| /s/ Joseph W. Brown |
| Joseph W. Brown Chief Executive Officer March 2, 2015 |
Exhibit 31.2
CERTIFICATION PURSUANT TO
SECTION 302 OF THE SARBANES-OXLEY ACT OF 2002
I, C. Edward Chaplin, certify that:
| 1. | I have reviewed the Annual Report of MBIA Inc. (the “Company”) on Form 10-K for the period ending December 31, 2014 as filed with the Securities and Exchange Commission on the date hereof (the “Report”); |
| 2. | Based on my knowledge, this Report does not contain any untrue statement of a material fact or omit to state a material fact necessary to make the statements made, in light of the circumstances under which such statements were made, not misleading with respect to the period covered by this Report; |
| 3. | Based on my knowledge, the financial statements, and other financial information included in this Report, fairly present in all material respects the financial condition, results of operations and cash flows of the Company as of, and for, the periods presented in this Report; |
| 4. | The Company’s other certifying officers and I are responsible for establishing and maintaining disclosure controls and procedures (as defined in Exchange Act Rules 13a-15(e) and 15d-15(e)) and internal control over financial reporting (as defined in Exchange Act Rules 13a-15(f) and 15d-15(f)) for the Company and have: |
| (a) | designed such disclosure controls and procedures, or caused such disclosure controls and procedures to be designed under our supervision, to ensure that material information relating to the Company, including its consolidated subsidiaries, is made known to us by others within those entities, particularly during the period in which this Report is being prepared; |
| (b) | designed such internal control over financial reporting, or caused such internal control over financial reporting to be designed under our supervision, to provide reasonable assurance regarding the reliability of financial reporting and the preparation of financial statements for external purposes in accordance with generally accepted accounting principles; |
| (c) | evaluated the effectiveness of the Company’s disclosure controls and procedures and presented in this Report our conclusions about the effectiveness of the disclosure controls and procedures, as of the end of the period covered by this Report based on such evaluation; and |
| (d) | disclosed in this Report that there were no changes in the Company’s internal control over financial reporting that occurred during the Company’s fourth quarter of 2014 that has materially affected, or is reasonably likely to materially affect, the Company’s internal control over financial reporting; and |
| 5. | The Company’s other certifying officers and I have disclosed, based on our most recent evaluation of internal control over financial reporting, to the Company’s auditors and to the audit committee of the board of directors: |
| (a) | all significant deficiencies and material weaknesses in the design or operation of internal control over financial reporting which are reasonably likely to adversely affect the Company’s ability to record, process, summarize and report financial information; and |
| (b) | any fraud, whether or not material, that involves management or other employees who have a significant role in the Company’s internal control over financial reporting. |
| /s/ C. Edward Chaplin |
| C. Edward Chaplin |
| Chief Financial Officer |
| March 2, 2015 |
Exhibit 32.1
CERTIFICATION PURSUANT TO
18 U.S.C. SECTION 1350,
AS ADOPTED PURSUANT TO
SECTION 906 OF THE SARBANES-OXLEY ACT OF 2002
In connection with the Annual Report of MBIA Inc. (the “Company”) on Form 10-K for the period ending December 31, 2014 as filed with the Securities and Exchange Commission on the date hereof (the “Report”), I, Joseph W. Brown, Chief Executive Officer of the Company, certify, pursuant to 18 U.S.C. § 1350, as adopted pursuant to § 906 of the Sarbanes-Oxley Act of 2002, that:
| (1) | The Report fully complies with the requirements of section 13(a) or 15(d) of the Securities Exchange Act of 1934; and |
| (2) | The information contained in the Report fairly presents, in all material respects, the financial condition and results of operations of the Company. |
| /s/ Joseph W. Brown |
| Joseph W. Brown |
| Chief Executive Officer |
| March 2, 2015 |
Exhibit 32.2
CERTIFICATION PURSUANT TO
18 U.S.C. SECTION 1350,
AS ADOPTED PURSUANT TO
SECTION 906 OF THE SARBANES-OXLEY ACT OF 2002
In connection with the Annual Report of MBIA Inc. (the “Company”) on Form 10-K for the period ending December 31, 2014 as filed with the Securities and Exchange Commission on the date hereof (the “Report”), I, C. Edward Chaplin, Chief Financial Officer of the Company, certify, pursuant to 18 U.S.C. § 1350, as adopted pursuant to § 906 of the Sarbanes-Oxley Act of 2002, that:
| (1) | The Report fully complies with the requirements of section 13(a) or 15(d) of the Securities Exchange Act of 1934; and |
| (2) | The information contained in the Report fairly presents, in all material respects, the financial condition and results of operations of the Company. |
| /s/ C. Edward Chaplin |
| C. Edward Chaplin |
| Chief Financial Officer |
| March 2, 2015 |
Exhibit 99.3
Amended and Restated
TAX SHARING AGREEMENT
THIS TAX SHARING AGREEMENT (this “Agreement”) originally entered into as of January 1, 1987 and amended January 1, 1990, January 1, 2002 and March 11, 2004, February 25, 2009, amended and restated as of this 8th day of September, 2011 is among MBIA Inc., a Connecticut corporation (“MBIA”), and those eligible subsidiaries of MBIA added as parties from time to time to this Agreement and listed on the signature pages hereto.
W I T N E S S E T H:
WHEREAS, MBIA is the common parent and each of the Subsidiaries is a member of an affiliated group of companies permitted to file a consolidated Federal income tax return pursuant to the terms of Section 1504 of the Internal Revenue Code of 1986, as amended (the “Code”), (which affiliated group is referred to herein as the “Consolidated Group”);
WHEREAS, the Consolidated Group has, since January 1, 1987, filed and intends to continue to file consolidated Federal income tax returns under Section 1501 of the Code so that the tax liability of the Consolidated Group is determined under Section 1502 of the Code and the Regulations thereunder by consolidating the income, expenses, gains, losses and credits of all of the members of the Consolidated Group;
WHEREAS, as indicated in the Preamble to this Agreement, MBIA and its eligible subsidiaries have entered into tax allocation agreements to allocate and settle among themselves the consolidated Federal income tax liabilities of the Consolidated Group; and
WHEREAS, MBIA and its Subsidiaries wish to amend and restate this Agreement setting forth their understandings as to certain matters pertaining to their Federal income tax liabilities, in a manner consistent with the requirements of New York State Insurance Department Circular Letter No. 33 (December 20, 1979), as it applies to tax sharing payments due to be made on or after January 1, 2011.
NOW, THEREFORE, MBIA and the Subsidiaries agree as follows:
ARTICLE I
Certain Definitions
In this Agreement, the following terms have the meanings specified or referred to in this Article I and shall be equally applicable both to the singular and to the plural forms.
“Agreement” has the meaning set forth in the Preamble.
“Circular 33” has the meaning set forth in the Recitals, as the same may be amended or superseded by any subsequent publication or guidance issued by the New York State Insurance Department.
“Code” has the meaning set forth in the Recitals.
“Consolidated Group” has the meaning set forth in the Recitals.
“Consolidated Item” has the meaning set forth in Section 2.02.
“Consolidated Return Year” means any taxable year or period for which MBIA files a consolidated Federal income tax return with at least one Subsidiary.
“Escrow Account” has the meaning set forth in Section 2.05.
“Final Determination” means an IRS Form 870AD that reflects an adjustment to any item (or a component of an item) shown on a tax return (whether or not such adjustment results in a deficiency in taxes), a closing agreement or an accepted offer in compromise with the IRS or any other adjustment to any item to which the taxpayer concedes (whether or not such adjustment results in a deficiency in taxes), or a decision of any court of competent jurisdiction that is not subject to appeal or the time for appeal of which has expired.
“IRS” means the United States Internal Revenue Service.
“MBIA” has the meaning set forth in the Preamble.
“New York Insurance Member” means any Subsidiary incorporated as an insurance company in the State of New York.
“Noninsurance Subsidiary” means any Subsidiary not incorporated as an insurance company in the State of New York.
“Pro Forma Subsidiary Return” has the meaning set forth in Section 2.02.
“Regulations” mean the regulations issued by the Secretary of the Treasury interpreting the Code.
“Subsidiary” means any corporation that is eligible for inclusion in a consolidated income tax return with MBIA as the common parent and that is or from time to time becomes a signatory hereto.
ARTICLE II
Returns and Payments
Section 2.01. Consent to File Consolidated Returns. MBIA and the Subsidiaries hereby consent to the filing of consolidated Federal income tax returns by the Consolidated Group for each taxable year covered by this Agreement and each Subsidiary agrees to furnish all information and to execute all elections and other documents which may be necessary or appropriate to evidence such consent or to enable MBIA to prepare and file such returns.
Section 2.02. Preparation of Pro Forma Subsidiary Return. For each Consolidated Return Year, a pro forma Federal income tax return (a “Pro Forma Subsidiary Return”) shall be prepared for each Subsidiary, covering that portion of the taxable year in which such Subsidiary is included in the Consolidated Group, as if the Subsidiary had filed a separate tax return for the Consolidated Return Year, subject to the following modifications:
| (1) | all elections shall be consistent with the elections of the Consolidated Group for such Consolidated Return Year; |
| (2) | in the case of any item of income, gain, loss, deduction or credit that is computed or subject to a limitation only on the Consolidated Group return, including, but not limited to, net operating losses, capital losses, charitable contributions, foreign tax credits, research and experimentation credits and gains and losses under Section 1231 of the Code (“Consolidated Items”), such Consolidated Items shall be taken into account by the Subsidiary to the extent that (as determined by MBIA on a reasonable basis) the Consolidated Item is taken into account and actually affects the amount of the tax liability of the Consolidated Group; |
| (3) | all intercompany transactions (as defined in Section 1.1502-13(b)(1) of the Regulations) between members of the Consolidated Group shall be taken into account, in computing the Pro Forma Subsidiary Returns, at the time when such transactions are required to be taken into account by the Consolidated Group under Section 1.1502-13 of the Regulations; |
2
| (4) | the tax imposed by Section 55 (or any comparable provision of law) of the Code (or any tax credits generated with respect thereto) shall be disregarded except to the extent that such tax is actually imposed on the Consolidated Group; |
| (5) | any Consolidated Item not initially taken into account in computing the tax of the Subsidiary and not otherwise addressed in this Section 2.02 shall be taken into account by the Subsidiary in the year, and to the extent, that such Consolidated Item is taken into account by the Consolidated Group; and |
| (6) | any carryforwards and carrybacks of deductible or creditable losses and credits generated by the Subsidiary in any previous Consolidated Return Year in which it was included in the Consolidated Group return (as computed pursuant to the principles of this Section 2.02) shall be taken into account. |
Section 2.03. Computation of Tax Liability. Subject to Section 4.07, the tax charge payable by, or the tax refund payable to, a Subsidiary under this Agreement for any Consolidated Return Year shall be the amount that would have been payable if the Subsidiary were actually filing its Pro Forma Subsidiary Return for such Consolidated Return Year. If the Pro Forma Subsidiary Return prepared with respect to any Subsidiary reflects a net operating loss, net capital loss, excess tax credit or other deductible or creditable tax attribute that such Subsidiary could have carried back to a prior Consolidated Return Year had it actually filed its Pro Forma Subsidiary Return on a separate company basis for such prior year, then MBIA shall pay to such Subsidiary the refund (if any) that such Subsidiary would have received as a result of the carryback of such attribute to a Pro Forma Subsidiary Return for any Consolidated Return Year. The amount of such refund will be computed as if such Subsidiary had filed a separate tax return for the prior Consolidated Return Year, and otherwise in accordance with the principles of Section 2.02.
Section 2.04. Payment of Tax Liability.
(a) Estimated Taxes. Each Subsidiary shall pay to MBIA any required payment of estimated Federal income tax liability (when and as determined under Section 6655 of the Code) calculated in accordance with Section 2.03. In computing the Subsidiary’s estimated Federal income tax payments, each payment shall be sufficient to avoid incurring any penalty under Section 6655 of the Code that would have been payable under the Subsidiary’s Pro Forma Subsidiary Return by reason of any underpayment by a “large corporation” within the meaning of Section 6655(g)(2) of the Code and shall be consistent with the elections permitted to be made under Sections 6655(d) and (e) of the Code as actually made by MBIA, in its sole discretion, for such taxable year and communicated to the Subsidiary.
(b) Annual True-Up. Each Subsidiary shall pay to MBIA, or MBIA shall pay to each Subsidiary, as the case may be, the difference, if any, between the tax payable pursuant to Section 2.03 for such taxable year and the amount, if any, paid by the Subsidiary to MBIA pursuant to Section 2.04(a) for such taxable year.
(c) Settlements. All settlements under Sections 2.03 and 2.04(a) and (b) shall be made within 30 days after the filing of the applicable estimated or actual consolidated federal income tax return with the IRS, provided that MBIA shall provide each Subsidiary with notice of any amount due from the Subsidiary under this section at least 10 days before the required date for payment. Payments to any Subsidiary pursuant to Section 2.03 that are attributable to the carryback of any tax attribute reflected on a Pro Forma Subsidiary Return shall be made within 30 days after the filing of the consolidated federal income tax return that includes the tax items reported on such Pro Forma Subsidiary Return. All settlements to the New York Insurance Members shall be in cash or securities eligible as investments for such New York Insurance Members, at market value, or otherwise as required by Circular 33. Payments by the New York Insurance Members shall be subject to the escrow requirements of Section 2.05. If a Noninsurance Subsidiary is entitled to a payment from MBIA in accordance with Sections 2.03 and 2.04, in lieu of actual payment MBIA shall establish an intercompany payable for such amount within 30 days following the filing of the consolidated Federal income tax return. MBIA’s intercompany payables established pursuant to this Section 2.04(c) shall be settled through offset against future payments due from the Noninsurance Subsidiary under this Agreement.
3
Section 2.05. New York Insurance Members. As required by Circular 33, if the amount paid by any New York Insurance Member to MBIA for Federal income taxes is greater than the actual payment made by MBIA to the IRS, then cash or securities having a value equal to the difference shall be placed by MBIA in an escrow account (“Escrow Account”) in order to assure such New York Insurance Member’s enforceable right to recover its payment in the event that such New York Insurance Member generates a future loss which may be carried back to the year with respect to which such payment was made. The assets held in the Escrow Account shall be assets eligible as an investment for the New York Insurance Member pursuant to Circular 33. Assets may be released from the Escrow Account to (i) the applicable New York Insurance Member at such time as, and to the extent that, such New York Insurance Member is entitled to recover such assets pursuant to Section 2.03 or 2.07 as a result of the carryback or carryforward of any tax attribute and (ii) MBIA at such time as the permissible period for loss carrybacks applicable to such assets has elapsed.
Section 2.06. Redetermination. In the event of any adjustment to the tax return of the Consolidated Group as filed (including, without limitation, by reason of an amended return, claim for refund or an audit by the Internal Revenue Service), the liability of MBIA and the Subsidiaries shall be redetermined to give effect to any such adjustment as if it had been made as part of the original computation of tax liability. Payments shall be made within 30 days of any corresponding payments to the Internal Revenue Service or the receipt of any refund from the Internal Revenue Service. Any payments shall include interest and penalties equal to the amounts actually paid to, or received from, the Internal Revenue Service with respect to the redetermination of tax liabilities. MBIA shall calculate the amounts of any such payments and shall give the Subsidiaries at least 10 days notice of any amounts payable by the Subsidiaries. All payments due under this Section 2.06 shall be made in accordance with the principles of Section 2.04(c).
Section 2.07. Deconsolidation. To the extent permitted by law, if a New York Insurance Member shall cease to be a member of the Consolidated Group, (1) such New York Insurance Member shall elect to relinquish any carryback to any Consolidated Return Year of net operating losses, net capital losses, unused tax credits and other deductible or creditable tax attributes and (2) MBIA shall make any election, pursuant to Treas. Reg. 1.1502-36(d)(6) (or any successor or comparable provision of law or regulations), necessary or appropriate to preserve such New York Insurance Member’s ability to carry such deductible or creditable tax attributes forward to subsequent tax years. If any New York Insurance Member shall cease to be a member of the Consolidated Group and, as of the close of the taxable year of the Consolidated Group that includes such cessation, such New York Insurance Member shall have generated net operating losses, net capital losses, tax credits and other deductible or creditable tax attributes (i) that were utilized to reduce the tax liability of the Consolidated Group attributable to members of the Consolidated Group other than such New York Insurance Member, so that such deductible or creditable tax attributes are not available as carrybacks or carryforwards to other taxable years of the New York Insurance Member and (ii) for which such New York Insurance Member shall not have previously been compensated pursuant to this agreement, then MBIA will reimburse such New York Insurance Member for the use of those deductible or creditable tax attributes when and as such New York Insurance Member would be entitled to use such deductible or creditable tax attributes to reduce its own federal income tax payments, whether as a member of another consolidated group or on a stand-alone basis. A New York Insurance Member that ceases to be a member of the Consolidated Group shall not be entitled to any payment under this Agreement with respect to any carryback item arising after its deconsolidation.
Section 2.08. Payment of Consolidated Group Tax. All payments of actual or estimated Federal income taxes owed by the Consolidated Group shall be paid to the IRS by MBIA, and MBIA shall be entitled to receive any refunds of Federal income taxes owed to the Consolidated Group, subject to its tax sharing obligations set forth in this Agreement. Provided that a Subsidiary shall have made all payments required to have been made by it pursuant to this Agreement for any Consolidated Return Year, MBIA shall hold such Subsidiary harmless from any claims by the IRS in connection with the Consolidated Group’s Federal income tax liability, whether under Section 1.1502-6 of the Regulations or otherwise, for such Consolidated Return Year.
Section 2.09. Earnings and Profits. For purposes of determining the earnings and profits of each member, the Consolidated Group shall elect to allocate the tax liability of the Consolidated Group among the members of the Consolidated Group in accordance with the method prescribed in Section 1552(a) (2) of the Code and Section 1.1552-1(a)(2) of the Regulations.
Section 2.10. Interest. In connection with any amounts due and payable under this Agreement, interest shall be calculated based upon the same principles and rates applied by the IRS to the Consolidated Group tax liability or refund claim.
4
Section 2.11. Priority of Agreement. As between the parties, the provisions of this Agreement shall fix the liability of each of the other as to the matters provided for herein even if payments made pursuant hereto are treated as capital contributions or distributions for Federal income tax purposes.
Section 2.12. Allocation of State and Local Income Tax Liability. If a consolidated, combined or unitary tax return or report is filed in any state or local jurisdiction principles and procedures analogous to the principles and procedures stated herein shall apply to determine each Subsidiary’s liability in respect thereof and the payments to be made.
ARTICLE III
Tax Matters and Cooperation
3.01. Disputes With the IRS. Each Subsidiary hereby irrevocably appoints MBIA as its agent, and each Subsidiary hereby agrees that MBIA shall have absolute authority, for purposes of: (i) preparing and filing consolidated Federal income tax returns for the Consolidated Group (including, without limitation, preparing and filing estimated tax returns, amended tax returns and claims for refund, determining income tax return positions, selecting methods of accounting and making elections); (ii) representing any Subsidiary with respect to any consolidated Federal income tax audit or consolidated Federal income tax controversy (including, without limitation, any proceeding with the IRS and any judicial proceedings, whether any such proceedings relate to a claim for additional taxes or a claim for refund of taxes), settling or compromising any claim for additional, or any claim for refund of, Federal income taxes of any Subsidiary with respect to any issue that could affect an item reflected on the consolidated Federal income tax return of the Consolidated Group; (iii) engaging outside counsel, accountants and other experts with respect to Federal income tax matters relating to any Subsidiary; and (iv) taking any other action in connection with tax matters relating to any Subsidiary, as MBIA, in its sole and absolute discretion, determines to be necessary and appropriate.
Section 3.02. Cooperation and Exchange of Information. Notwithstanding any termination of this Agreement pursuant to Section 4.01 below, each party shall retain, and shall agree to make available to the other during regular business hours, all material relevant to the determination of the Federal income tax liability of the Consolidated Group for all tax periods to which this Agreement applies, including but not limited to, returns, supporting schedules, workpapers and relevant correspondence.
ARTICLE IV
Miscellaneous
4.01. Duration. This Agreement, as amended and restated through the latest date set forth in the Preamble hereto, shall apply to and remain in effect for all payments of Federal income tax or estimated Federal income tax that become due and payable on or after January 1, 2011 for any Consolidated Return Year. Notwithstanding the first sentence of this Section 4.01, this Agreement shall be terminated if (i) the parties agree in writing to such termination, on the date specified in such written agreement, (ii) with respect to any Subsidiary, membership in the Consolidated Group ceases or is terminated for any reason whatsoever, as of the last day of the taxable year of the Consolidation Group that includes such cessesation, or (iii) the Consolidated Group shall fail to file a consolidated Federal income tax return for any year, as of the last day of the year preceding the first year for which a consolidated Federal income tax return is not filed. Notwithstanding any termination of this Agreement, its provisions shall remain in effect with respect to any period of time during the tax year in which termination occurs, for which the income of the terminating party must be included in the Consolidated Group’s tax return.
Section 4.02. Expenses. MBIA shall be authorized to retain accountants and attorneys for the purpose of preparing returns or claims provided for herein or for the purpose of pursuing any controversies with the IRS. Each member of the Consolidated Group shall pay the costs reasonably allocated to it for employing such attorneys and accountants (including associated court costs).
Section 4.03. Controlling Law. This Agreement is made under the laws of the State of New York.
5
Section 4.04. Resolution of Disputes. Any disputes arising from the implementation of the terms and conditions of this Agreement shall be resolved by a single arbitrator, which shall be a nationally recognized public accounting firm selected by MBIA, whose fees and expenses shall be paid by MBIA.
Section 4.05. Retention of Records. MBIA and each Subsidiary agree to retain all material records and other documents as required under Section 6001 of the Code and the Treasury Regulations promulgated thereunder existing on the date hereof or created in respect of any taxable period that may be subject to a claim hereunder, until the later of (x) the expiration of the statute of limitations (including extensions) for the taxable periods to which such income tax returns and other documents relate and (y) the Final Determination of any payments that may be required in respect of such taxable periods under this Agreement. MBIA shall notify each Subsidiary whenever the applicable statute of limitations for any taxable period, including extensions, expires. From and after the end of the period described in the first sentence of this Section 4.05, if a Subsidiary wishes to dispose of any such records and documents, then such Subsidiary shall provide written notice thereof to MBIA and shall provide MBIA the opportunity to take possession of any such records and documents within 90 days after such notice is delivered, at MBIA’s sole cost and expense; provided, however, that if MBIA does not, within such 90-day period, confirm its intention to take possession of such records and documents, such Subsidiary may destroy or otherwise dispose of such records and documents.
Section 4.06. Binding Effect. This Agreement shall be binding upon, enforceable by and against and inure to the benefit of the parties hereto, including, for the avoidance of doubt, any entity that from time to time becomes a party hereto subsequent to the date hereof by executing and delivering a signature page, and the respective successors and assigns of the parties hereto. This agreement shall not be assignable by any party without the prior written consent of the other parties. This Agreement may be amended or modified at any time by prior mutual agreement in writing; provided, however, that this Agreement may not be amended or modified without the prior approval or non-disapproval of, or notification to, the Superintendent of the New York State Insurance Department to the extent required by Circular 33 or any provision of the insurance laws or regulations of the State of New York.
Section 4.07. Interpretation and Application. In the event of any question regarding the interpretation or application of this Agreement, it is the intention of the parties hereto that this Agreement be interpreted and applied so that the tax charge to any New York Insurance Member hereunder (as computed for all tax years subject to this Agreement) shall not be more than such New York Insurance Member would have paid if it had filed its tax returns on a separate company basis.
6
IN WITNESS WHEREOF, the parties have caused the signatures of their duly authorized offices to be hereto affixed.
| CAH ASSET HOLDINGS, INC. | ||
| By: | /s/ Ram D. Wertheim | |
| Name: | Ram D. Wertheim | |
| Title: | President | |
| CAPMAC HOLDINGS INC | ||
| By: | /s/ Ram D. Wertheim | |
| Name: | Ram D. Wertheim | |
| Title: | President |
| CUTWATER ASSET MANAGEMENT CORP. | ||
| By: | /s/ Clifford D. Corso | |
| Name: | Clifford D. Corso | |
| Title: | Chief Executive Officer and Chief Investment Officer |
| CUTWATER COLORADO INVESTOR SERVICES CORPORATION | ||
| By: | /s/ Clifford D. Corso | |
| Name: | Clifford D. Corso | |
| Title: | Chief Executive Officer and Chief Investment Officer | |
| CUTWATER INVESTOR SERVICES CORP. | ||
| By: | /s/ Clifford D. Corso | |
| Name: | Clifford D. Corso | |
| Title: | Chief Executive Officer and Chief Investment Officer | |
| LATAM CAPITAL ADVISORS, INC. | ||
| By: | /s/ Alfred C. Pastore | |
| Name: | Alfred C. Pastore | |
| Title: | Treasurer | |
| MBIA CAPITAL CORP. | ||
| By: | /s/ Alfred C. Pastore | |
| Name: | Alfred C. Pastore | |
| Title: | President | |
| MBIA INC. | ||
| By: | /s/ C. Edward Chaplin | |
| Name: | C. Edward Chaplin | |
| Title: | President, Chief Financial Officer and Chief Administrative Officer |
| MBIA INSURANCE CORPORATION | ||
| By: | /s/ William C. Fallon | |
| Name: | William C. Fallon | |
| Title: | President and Chief Operating Officer |
7
| MBIA INVESTMENT MANAGEMENT CORP. | ||
| By: | /s/ Alfred C. Pastore | |
| Name: | Alfred C. Pastore | |
| Title: | President |
| MBIA SERVICES COMPANY | ||
| By: | /s/ William C. Fallon | |
| Name: | William C. Fallon | |
| Title: | President |
| MUNICIPAL ISSUERS SERVICE CORPORATION | ||
| By: | /s/ C. Edward Chaplin | |
| Name: | C. Edward Chaplin | |
| Title: | President |
| NATIONAL PUBLIC FINANCE GUARANTEE CORPORATION | ||
| By: | /s/ William C. Fallon | |
| Name: | William C. Fallon | |
| Title: | President and Chief Executive Officer |
| NATIONAL PUBLIC FINANCE GUARANTEE HOLDINGS, INC. | ||
| By: | /s/ William C. Fallon | |
| Name: | William C. Fallon | |
| Title: | President |
| OPTINUITY ALLIANCE RESOURCE CORPORATION | ||
| By: | /s/ C. Edward Chaplin | |
| Name: | C. Edward Chaplin | |
| Title: | President, Chief Executive Officer and Chief Administrative Officer |
| TRIPLE - A ONE FUNDING CORPORATION | ||
| By: | /s/ Alfred C. Pastore | |
| Name: | Alfred C. Pastore | |
| Title: | President |
8
Serious News for Serious Traders! Try StreetInsider.com Premium Free!
You May Also Be Interested In
- MC and Denka Sign J/V Agreement in Fullerene Business
- Dimensional Fund Advisors Ltd. : Form 8.3 - QUANEX BUILDING PRODUCTS - Ordinary Shares
- Medigene AG reports Financial Results and Business Update for Q1 2024
Create E-mail Alert Related Categories
SEC FilingsSign up for StreetInsider Free!
Receive full access to all new and archived articles, unlimited portfolio tracking, e-mail alerts, custom newswires and RSS feeds - and more!
