

Form 10-K HOPFED BANCORP INC For: Dec 31
 Tweet
Tweet Share
Share
UNITED STATES
SECURITIES AND EXCHANGE COMMISSION
Washington, D.C. 20549
FORM 10-K
(Mark One)
| x | ANNUAL REPORT PURSUANT TO SECTION 13 OR 15(d) OF THE SECURITIES EXCHANGE ACT OF 1934 |
For the fiscal year ended December 31, 2014 Commission file number 000-23667
HOPFED BANCORP, INC.
(Exact name of registrant as specified in its charter)
| Delaware | 61-1322555 | |
| (State of jurisdiction of incorporation or organization) | (I.R.S. Employer Identification No.) | |
| 4155 Lafayette Road, Hopkinsville, KY | 42240 | |
| (Address of principal executive offices) | (Zip Code) | |
Registrant’s telephone number, including area code: (270) 885-1171.
Securities registered pursuant to Section 12(b) of the Act: None.
Securities registered pursuant to Section 12(g) of the Act:
Common Stock, par value $.01 per share
(Title of Class)
Indicate by check mark whether the registrant is a well-known seasoned issuer, as defined in Rule 405 of the Securities
Act. Yes ¨ No x.
Indicate by check mark if the registrant is not required to file reports pursuant to Section 13 or Section 15(d) of the
Act. Yes ¨ No x.
Indicate by check mark whether the registrant (1) has filed all reports required to be filed by Section 13 or 15(d) of the Securities Exchange Act of 1934 during the preceding 12 months (or for such shorter period that the registrant was required to file such reports), and (2) has been subject to such filing requirements for the past 90 days. YES x NO ¨
Indicate by check mark if disclosure of delinquent filers pursuant to Item 405 of Regulation S-K (subsection 229.405 of this chapter) is not contained herein, and will not be contained, to the best of registrant’s knowledge, in definitive proxy or information statements incorporated by reference in Part III of this Form 10-K or any amendment to this Form 10-K. ¨
Indicate by check mark whether the registrant is a large accelerated filer, an accelerated filer, or a non-accelerated filer. (as defined in Rule 12b-2 of the Act).
| Large accelerated filer | ¨ | Accelerated filer | x | |||
| Non-accelerated filer | ¨ | Smaller Reporting Company | ¨ | |||
Indicate by check mark whether the registrant is a shell company (as defined in Rule 12b-2 of the Act). Yes ¨ No x
The registrant’s voting stock is traded on the NASDAQ Stock Market. The aggregate market value of the voting stock held by non-affiliates of the registrant, computed by reference to the price ($11.62 per share) at which the stock was sold on June 30, 2014, was approximately $82,312,675. For purposes of this calculation, the term “affiliate” refers to all executive officers and directors of the registrant and all stockholders beneficially owning more than 10% of the registrant’s Common Stock.
As of the close of business on March 3, 2015, 7,149,439 shares of the registrant’s Common Stock were outstanding.
Documents Incorporated By Reference
Part II:
Annual Report to Stockholders for the year ended December 31, 2014.
Part III:
Portions of the definitive proxy statement for the 2015 Annual Meeting of Stockholders.
PART I
| ITEM 1. | BUSINESS |
In February 1998, HopFed Bancorp, Inc. (the “Corporation”) issued and sold 4,033,625 shares of common stock, par value $.01 per share (the “Common Stock”), in connection with the conversion of Hopkinsville Federal Savings Bank (the “Bank”) from a federal mutual savings bank to a federal stock savings bank and the issuance of the Bank’s capital stock to the Corporation. The conversion of the Bank, the acquisition of all of the outstanding capital stock of the Bank by the Corporation and the issuance and sale of the Common Stock are collectively referred to herein as the “Conversion.” In June of 2010, the Corporation issued and sold 3,333,334 shares of common stock, par value $0.01 per share in connection with a common stock offering. In July 2010, the Corporation issued and sold an additional 250,000 shares of common stock. Both sales were completed at an offering price of $9.00 per share ($8.55 net of expenses). After underwriting fees and selling expenses, the Corporation received additional capital proceeds of approximately $30.4 million. The consolidated results of the Bank and the Corporation are referred to as the Company.
HopFed Bancorp, Inc.
HopFed Bancorp, Inc. was incorporated under the laws of the State of Delaware in May 1997 at the direction of the Board of Directors of the Bank for the purpose of serving as a savings and loan holding company of the Bank upon the acquisition of all of the capital stock issued by the Bank in the Conversion. On June 5, 2013, the Corporation’s bank subsidiary, Heritage Bank, changed its name to Heritage Bank USA, Inc., (the “Bank”), converting its charter from a federal thrift to a Kentucky state chartered commercial bank. Likewise, the Corporation’s charter was converted to a Federal Reserve non-member commercial bank holding company. The Corporation’s assets primarily consist of the outstanding capital stock of the Bank. The Corporation’s principal business is overseeing the business of the Bank. See “Regulation – Regulation of the Company.” As a holding company, the Corporation has greater flexibility than the Bank to diversify its business activities through existing or newly formed subsidiaries or through acquisition or merger with other financial institutions. The Company’s executive offices are located at 4155 Lafayette Road, Hopkinsville, Kentucky 42240, and its main telephone number is (270) 885-1171. The Company’s mailing address is P.O. Box 537, Hopkinsville, Kentucky 42241-0537.
Heritage Bank USA, Inc.
The Bank is a Kentucky state chartered commercial bank headquartered in Hopkinsville, Kentucky, with branch offices in Kentucky and Tennessee. The Kentucky locations include Hopkinsville, Murray, Cadiz, Elkton, Fulton, Calvert City and Benton. The Tennessee locations include Clarksville, Pleasant View, Ashland City, Kingston Springs and Erin. In October 2014, the Bank opened a loan production office in Nashville, Tennessee. The Bank was incorporated by the Commonwealth of Kentucky in 1879 under the name Hopkinsville Building and Loan Association. In 1940, the Bank converted to a federal mutual savings association and received federal insurance of its deposit accounts. In 1983, the Bank became a federal mutual savings bank. On May 14, 2002, the Bank changed its name from Hopkinsville Federal Bank to Heritage Bank. On June 5, 2013, the Bank’s legal name was changed to Heritage Bank USA, Inc. The primary market area of the Bank consists of the adjacent counties of Calloway, Christian, Todd, Trigg, Fulton, and Marshall located in southwestern Kentucky and Montgomery, Cheatham, Houston, Davidson, Obion and Weakley counties located in Tennessee.
The business of the Bank primarily consists of attracting deposits from the general public and investing such deposits in loans secured by single family residential real estate and investment securities, including U.S. Government and agency securities, municipal and corporate bonds, collateralized mortgages obligations (CMO’s), and mortgage-backed securities. The Bank also originates single-family residential/construction loans and multi-family and commercial real estate loans, as well as loans secured by deposits, other consumer loans and commercial loans. The Bank emphasizes the origination of residential real estate loans with adjustable interest rates and other assets which are responsive to changes in interest rates and allow the Bank to more closely match the interest rate maturation of its assets and liabilities.
2
The following chart outlines the Bank’s market share in its six largest markets individually at June 30, 2011, 2012, 2013 and 2014, according to information provided by the FDIC market Share Report:
| At June 30 | ||||||||||||||||
| 2011 | 2012 | 2013 | 2014 | |||||||||||||
| Calloway |
16.2 | % | 15.3 | % | 14.1 | % | 13.7 | % | ||||||||
| Christian |
26.2 | % | 22.5 | % | 22.1 | % | 22.6 | % | ||||||||
| Fulton |
56.4 | % | 53.9 | % | 52.0 | % | 51.0 | % | ||||||||
| Marshall |
15.0 | % | 14.9 | % | 12.9 | % | 11.9 | % | ||||||||
| Cheatham |
16.9 | % | 17.8 | % | 18.9 | % | 20.0 | % | ||||||||
| Montgomery |
3.0 | % | 3.0 | % | 2.6 | % | 2.5 | % | ||||||||
Growth Opportunities
For the year ended December 31, 2014, the Company’s net loan portfolio declined approximately $4.4 million. The Company has experienced negative loan growth in four out of the last five in which loans declined by a total of approximately $98.7 million as compared to our net loan balance at December 31, 2009. There were many factors that resulted in the Company’s negative loan growth over this period. In 2010, the deployment of more than 15,000 troops from nearby Fort Campbell, Kentucky to Afghanistan resulted in a reduced level of economic activity, lower sales for merchants, weaker demand for most goods and services and reduced tax collections. Furthermore, the deployment of troops occurred during a time of a national recession, further exasperating the weakness in the local economy
Another important factor inhibiting lending growth prior to 2013 was the presence of a Memorandum of Understanding and Agreement (MOU) originally between the Board of Directors of the Corporation, Board of Directors of the Bank and the OTS, the Corporation’s and Banks former regulator. The MOU required the Bank to limit the growth of specific types of lending, including commercial real estate lending. In 2010 and 2011, the MOU’s limitation on commercial real estate made it more difficult for the Bank to experience positive loan growth. The MOU’s limitation on commercial real estate lending was focused on the OTS definition of commercial real estate loan concentrations. In October 2012, the Office of the Comptroller of the Currency (“OCC”) terminated the Bank’s MOU.
In response to the decline in loans balance outstanding, the Company has sought to reduce the level and cost of its interest bearing liabilities. At April 30, 2010, the Company had brokered deposits totaling $104.0 million as compared to $37.1 million at December 31, 2014. The Company has also reduced the balance of Federal Home Loan Bank (“FHLB”) borrowings from $81.9 million at December 31, 2010, to $34.0 million at December 31, 2014. The reduction of FHLB borrowings include early repayments of $35.9 million in borrowings on December 30, 2014, resulting in $2.5 million prepayment penalty. In addition to reducing the level of wholesale funding, the Company’s funding mix has significantly improved, resulting in lower level of interest expenses. At December 31, 2014, total time deposits (including brokered) were $331.9 million, a decline of $50.1 million and $55.1 million as compared to December 31, 2013, and December 31, 2012, respectively. At December 31, 2014, the Company’s time deposit balances accounted for 45.4% of total deposits as compared to 50.1% of total deposits at December 31, 2013, 57.5% at December 31, 2012, and 65.0% at December 31, 2011.
In October 2014, the Company opened a loan production office in Nashville, Tennessee. Nashville is approximately 70 miles from the Company’s headquarters and one of the fastest growing markets in the country. The Company seeks to establish a successful loan production office and use that success to build a modest branch network into the suburban areas surrounding Nashville. As the demographic information on pages four to six suggest, the Nashville metropolitan area provides the Company with an unlimited amount of growth opportunities not found in our more rural markets.
3
Western Kentucky
Small manufacturing and agri-business interest are the largest drivers of the local economy in our western Kentucky markets. After experiencing a severe drought in 2012, local farmers growing corn, soybeans, and wheat enjoyed record yields in 2013 and satisfactory yields in 2014. Despite falling commodity prices, the combination of recent yields and pricing are sufficient to provide a boost to the entire agri-business sector. Furthermore, higher commodity prices and the presence of crop insurance lessened the effects of the 2012 drought. The current price of land used in agricultural production remain near historical highs.
In western Kentucky, small manufacturing typically revolves around the automotive, transportation, and chemical industries. The manufacturing sector has improved since 2009 as sales of new autos have rebounded. Unemployment rates improved significantly in Western Kentucky due largely to the rebound in auto sales. Christian County, the Company’s home market, has an unemployment rate of 7.0%. For November 2014, unemployment rates in our western Kentucky markets ranged from 5.1% in Todd County to 8.9% in Fulton County. Kentucky’s unemployment rate is 6.0%.
Clarksville, Montgomery County, Tennessee (“Clarksville”)
The Clarksville market is the largest market in which the Company has a significant presence. The Clarksville economy has several large employers and economic drivers including the United States Army’s 101st Airborne Division with approximately 27,000 active duty military personnel assigned to the division. The many services available on the army installation and the community’s modest cost of living have resulted in a sizable military retirement population in the area. Clarksville is also home to Austin Peay State University, a 10,000 student public university as well as a diverse manufacturing sector. The unemployment rate for Clarksville in November 2014 was 6.9%.
The Clarksville, Montgomery County, Tennessee (“Clarksville”) market suffered two setbacks with the announcement in 2012 that the Hemlock Semiconductor plant (production was scheduled to begin in late 2012) would not begin production due to the market conditions surrounding the solar industry. Hemlock terminated approximately 300 employees but the bigger loss is the anticipated growth in employment and economic activity that will not occur in the near future. In late 2014, Hemlock has declared that it will no longer consider opening the plant and is looking to divest of the facility.
The second setback for the Clarksville market occurred in November of 2014 with the news that an Army aviation battalion will be deactivated, resulting in the relocation of 2,400 active duty military personnel and their families from the area. With further staffing cuts within the U.S. Army anticipated due to budget sequestration of 2013, the 101st division could see their active duty headcount reduced by up to 16,000 soldiers. This would result in an estimated $1 billion loss of economic activity to the region. While the Company does not have direct business contact with the majority of military personnel stationed at Fort Campbell, we believe the economic effects to the region could be severe if all proposed military cuts were to materialize.
In October of 2013, Hankook Tires announced that it will build its first U.S. manufacturing facility in Clarksville. Hankook, a South Korean tire company, will invest approximately $800 million in a new facility. Hankook anticipates that tire production will begin in 2016 and will result in approximately 1,800 full time jobs for the local economy. Hankook chose Clarksville due to its ideal location, strong transportation network and its proximity to automotive assembly plants owned by Nissan, Volkswagen, Toyota and General Motors.
4
Middle Tennessee and Nashville MSA
Cheatham County (“Cheatham”) and Houston County (“Houston”) are located in Middle Tennessee. Both communities are rural and residents of both communities typically rely on employment opportunities in neighboring communities as neither county has a sizeable base of manufacturing jobs. However, Cheatham is located within the Nashville Metropolitan Statistical Area (“Nashville MSA”) and its three largest communities are a 30 minute drive to downtown Nashville. Cheatham’s proximity and easy commute to Nashville has resulted in higher levels of income and population growth as compared to Houston. In November of 2014, the unemployment rates in Cheatham and Houston were 5.6% and 7.8%, respectively. The unemployment rates in the state of Tennessee and the Nashville MSA are 6.8% and 5.1%, respectively.
As supported by the tables below, the Company views Clarksville and the Nashville MSA as communities with the most potential for growth. The Company has established one loan production office in the Nashville MSA in 2014 and will seek to further expand in lending expertise in our Tennessee markets. The Company’s deposit base will allow us to seek loan growth without seeking immediate funding for the growth.
The tables below are a summary of selected information from the 2010 U.S. Census related to the Company’s current market areas:
| 2010 Census Estimated Population |
Population Change 2000-2010 |
Median Household Income |
Median Value Owner occupied housing units |
|||||||||||||
| Christian (Hopkinsville) |
73,955 | 2.3 | % | $ | 37,061 | $ | 95,500 | |||||||||
| Marshall |
31,448 | 4.4 | % | $ | 43,326 | $ | 96,900 | |||||||||
| Calloway |
37,191 | 8.8 | % | $ | 39,194 | $ | 105,300 | |||||||||
| Todd |
12,460 | 4.1 | % | $ | 36,989 | $ | 79,700 | |||||||||
| Trigg |
14,339 | 13.8 | % | $ | 41,825 | $ | 98,300 | |||||||||
| Fulton |
6,813 | -12.1 | % | $ | 31,965 | $ | 55,300 | |||||||||
| Mongomery (Clarksville) |
172,331 | 27.9 | % | $ | 48,930 | $ | 129,400 | |||||||||
| Cheatham |
39,105 | 9.0 | % | $ | 52,585 | $ | 155,900 | |||||||||
| Houston |
8,486 | 4.2 | % | $ | 33,738 | $ | 87,900 | |||||||||
Montgomery and Trigg counties are the only markets currently served by the Company with a 10 year population growth rate of more than 10%. Only two markets, Montgomery County and Cheatham County, have median household incomes greater than $43,500 per year, which is the approximate median household income in Tennessee and Kentucky and less that the $51,900 median household income in the United States. The population of the Company’s current footprint is approximately 400,000.
5
Meanwhile, the Nashville, Tennessee MSA has a population of approximately 1.6 million (includes Cheatham County, Tennessee listed above) and attractive demographics outlined below:
| Nashville TN MSA | 2010 Estimated Census Population |
Population Change 2000-2010 |
Median Household Income |
Median Value Owner occupied housing units |
||||||||||||
| Robertson (Springfield) |
66,283 | 21.8 | % | $ | 50,820 | $ | 149,100 | |||||||||
| Sumner (Gallatin) |
160,645 | 23.1 | % | $ | 54,916 | $ | 169,100 | |||||||||
| Wilson (Lebanon) |
113,193 | 28.4 | % | $ | 60,678 | $ | 187,500 | |||||||||
| Rutherford (Murfreesboro) |
262,604 | 44.3 | % | $ | 53,770 | $ | 157,100 | |||||||||
| Williamson (Franklin) |
183,182 | 44.7 | % | $ | 87,832 | $ | 335,800 | |||||||||
| Maury (Columbia) |
80,956 | 16.5 | % | $ | 46,278 | $ | 137,100 | |||||||||
| Dickson |
49,666 | 15.1 | % | $ | 44,554 | $ | 128,700 | |||||||||
| Davidson (Nashville) |
626,681 | 10.0 | % | $ | 45,668 | $ | 164,700 | |||||||||
| Cheatham (listed above) |
39,105 | 9.0 | % | $ | 52,585 | $ | 155,900 | |||||||||
In addition to the Clarksville and Nashville MSA markets, management views promising opportunities for growth in the midsize metropolitan markets near the Company’s current locations. Highly desirable markets include Bowling Green, Kentucky, Hardin, Kentucky and Louisville, Kentucky. These markets provide desirable demographic and growth opportunities as compared to the Company’s current footprint. As evident in the table below, Kentucky growth opportunities may be most attractive in Bowling Green, which is approximately 70 miles from the Company’s corporate headquarters. The tables below include the two largest counties by population in the Kentucky and other communities in Kentucky within a two hour drive of the Company’s headquarters:
| Kentucky | Census Population |
Change 2000-2010 |
Household Income |
Owner occupied housing units |
||||||||||||
| Henderson |
46,250 | 3.2 | % | $ | 40,438 | $ | 101,200 | |||||||||
| Hardin (Elizabethtown) |
105,543 | 12.1 | % | $ | 47,540 | $ | 131,900 | |||||||||
| Daviess (Owensboro) |
96,656 | 5.6 | % | $ | 42,821 | $ | 106,400 | |||||||||
| McCracken (Paducah) |
65,565 | 0.1 | % | $ | 41,630 | $ | 107,500 | |||||||||
| Warren (Bowling Green) |
113,792 | 23.0 | % | $ | 43,954 | $ | 135,400 | |||||||||
| Fayette (Lexington) |
295,803 | 13.5 | % | $ | 47,469 | $ | 159,200 | |||||||||
| Jefferson (Louisville) |
741,096 | 6.8 | % | $ | 45,352 | $ | 145,900 | |||||||||
Equity Transactions
On December 12, 2008, the Company received an $18.4 million investment from the United States Treasury (“Treasury”) in the form of preferred stock. The terms of the investment included a 5% dividend for five years, increasing to 9% thereafter. The investment had no stated maturity but could be paid back in whole or part at any time with regulatory approval. In addition to the dividend, the Treasury received a stock Warrant that allowed the Treasury to immediately purchase 243,816 shares of the Company’s Common Stock immediately at a strike price of $11.32 and had a final maturity of December 12, 2018. The amount and price of the warrant were adjusted to 253,667 shares and a strike price of $10.88 as a result of a 2% stock dividend declared for shareholders of record at September 30, 2010 and October 3, 2011.
6
In June and July of 2010, the Company sold a total of 3,583,334 shares of Common Stock at $9.00 per share ($8.55 net of expense) in a public offering. The net proceeds of the public offering, $30.4 million, were used for general corporate purposes and included a $10.0 million investment to the Bank. The sale of common stock in June 2010 included 112,639 shares of treasury stock.
On December 19, 2012, the Company repurchased all outstanding shares of preferred stock at par from the Treasury. The Company did not issue additional capital to repurchase the preferred stock. On January 16, 2013, the Company repurchased the outstanding Warrant from the Treasury for $257,000. The repurchased Preferred Stock was retired in 2013.
Stock Repurchases
On August 29, 2013, the Company announced that its Board of Directors authorized the repurchase of up to 375,000 shares of the Company’s outstanding common stock. On October 31, 2014, the Company announced that it intended to purchase an additional 300,000 shares of common stock and may purchase up to 1.0 million shares for general corporate purchases or employee benefit plans. The latest repurchase program is set to expire on October 31, 2015. For the twelve month period ended December 31, 2014, the Company purchased 298,999 shares of common stock at a weighted average price of $11.71 per share. At December 31, 2014, the Company has purchased a total of 778,383 shares of our common stock at a weighted average price of $12.11 per share.
Subsequent Event – Stock Repurchase
On February 2, 2015, the Company entered into a Stock Purchase Agreement to purchase 534,943 shares of the Company’s common stock at a price of $13.50 per share from Maltese Capital Management, LLC and affiliates (collectively, the “Seller”). The shares represent approximately 7.4% of the Company’s outstanding shares. The Company intends to use the shares at a later date for general corporate purposes and employee benefit plans.
On February 2, 2015, the Company also entered into a Standstill Agreement with the Seller which restricts the Seller or any of its affiliates and persons or entities acting in consent with it from acquiring or offering to acquire shares of the Company’s common stock, either directly or indirectly, for a period of three years from the date of the Agreement unless terminated prior to such date by a written agreement between the parties.
On February 27, 2015, the Company implemented the HopFed Bancorp, Inc. 2015 Employee Stock Ownership Plan (the “ESOP”) which covers substantially all employees who are at least 21 years old with at least one year of employment with the Company and Heritage Bank USA, Inc. (the “Bank”), the Company’s commercial bank subsidiary. Employer contributions to the ESOP are expected to replace matching and profit sharing contributions to the Heritage Bank 401(k) Plan sponsored by the Bank. The ESOP has three individuals who have been selected by the Company to serve as trustees. A directed corporate trustee has also been appointed. The ESOP will be administered by a committee (the “Committee”) composed of three or more individuals selected by the Company or its designee. Until the Committee is appointed, the trustees will carry out the duties and responsibilities of the Committee.
On March 2, 2015, the ESOP entered into a loan agreement with the Company to borrow up to $13,500,000 to purchase up to 1,000,000 shares common stock (“ESOP Loan”). On the same date, the ESOP purchased an initial block of 600,000 shares from the Company at a cost of $7,884,000 using the proceeds of the ESOP Loan. In accordance with the ESOP Loan documents, the common stock purchased by the ESOP serves as collateral for the ESOP Loan. The ESOP Loan will be repaid principally from discretionary contributions by the Bank to the ESOP over a period ending no later than December 31, 2040. The ESOP Loan documents provide that the ESOP Loan may be repaid over a shorter period, without penalty for prepayments. The interest rate on the ESOP Loan is 3.0%. Shares purchased by the ESOP will be held in a suspense account for allocation among participants as the ESOP Loan is repaid. The ESOP shares are dividend paying. Dividends on the shares will be used to repay the ESOP Loan.
Available Information
The Company’s filings with the Securities and Exchange Commission (“SEC”), including annual reports on Form 10-K, quarterly reports on Form 10-Q, current reports on Form 8-K, and all amendments thereto, are available on the Company’s website as soon as reasonably practicable after the reports are filed with or furnished to the SEC. Copies can be obtained free of charge in the “Investor Relations” section of the Company’s website at www.bankwithheritage.com.
Lending Activities
General. The total gross loan portfolio totaled $545.8 million at December 31, 2014, representing 58.3% of total assets at that date. Substantially all loans are originated in the Bank’s market area. At December 31, 2014, $186.9 million, or 34.2% of the loan portfolio, consisted of one-to-four family, residential mortgage loans. Other loans secured by real estate include non-residential real estate loans, which amounted to $220.1 million, or 40.3% of the loan portfolio at December 31, 2014, and multi-family residential loans, which were $26.0 million, or 4.7% of the loan portfolio at December 31, 2014. At December 31, 2014, construction loans were $24.2 million, or 4.4% of the loan portfolio, and total consumer and commercial loans totaled $88.6 million, or 16.3% of the loan portfolio.
7
Analysis of Loan Portfolio. Set forth below is selected data relating to the composition of the loan portfolio by type of loan at the dates indicated. At December 31, 2014, there were no concentrations of loans exceeding 10% of total loans other than as disclosed below.
| 2014 | 2013 | 2012 | 2011 | 2010 | ||||||||||||||||||||||||||||||||||||
| Amount | Percent | Amount | Percent | Amount | Percent | Amount | Percent | Amount | Percent | |||||||||||||||||||||||||||||||
| (Dollars in thousands) | ||||||||||||||||||||||||||||||||||||||||
| Type of Loan: |
||||||||||||||||||||||||||||||||||||||||
| Real estate loans: |
||||||||||||||||||||||||||||||||||||||||
| One-to-four family residential |
$ | 186,891 | 34.2 | % | $ | 192,603 | 34.9 | % | $ | 203,754 | 38.0 | % | $ | 216,095 | 38.1 | % | $ | 229,058 | 37.6 | % | ||||||||||||||||||||
| Multi-family residential |
25,991 | 4.8 | % | 29,736 | 5.4 | % | 33,056 | 6.2 | % | 33,739 | 5.9 | % | 29,416 | 4.8 | % | |||||||||||||||||||||||||
| Construction |
24,241 | 4.4 | % | 10,618 | 1.9 | % | 18,900 | 3.5 | % | 11,931 | 2.1 | % | 23,361 | 3.8 | % | |||||||||||||||||||||||||
| Non-residential (1) |
220,124 | 40.3 | % | 244,241 | 44.2 | % | 215,342 | 40.2 | % | 235,823 | 41.6 | % | 255,348 | 41.9 | % | |||||||||||||||||||||||||
|
|
|
|
|
|
|
|
|
|
|
|
|
|
|
|
|
|
|
|
|
|||||||||||||||||||||
| Total real estate loans |
457,247 | 83.7 | % | 477,198 | 86.4 | % | 471,052 | 87.9 | % | 497,588 | 87.7 | % | 537,183 | 88.1 | % | |||||||||||||||||||||||||
|
|
|
|
|
|
|
|
|
|
|
|
|
|
|
|
|
|
|
|
|
|||||||||||||||||||||
| Other loans: |
||||||||||||||||||||||||||||||||||||||||
| Secured by deposits |
8,136 | 1.5 | % | 3,048 | 0.6 | % | 3,768 | 0.7 | % | 4,016 | 0.7 | % | 4,081 | 0.7 | % | |||||||||||||||||||||||||
| Other consumer loans |
6,302 | 1.2 | % | 8,119 | 1.4 | % | 10,118 | 1.9 | % | 11,094 | 2.0 | % | 13,979 | 2.3 | % | |||||||||||||||||||||||||
| Commercial loans |
74,154 | 13.6 | % | 64,041 | 11.6 | % | 50,549 | 9.5 | % | 54,673 | 9.6 | % | 54,439 | 8.9 | % | |||||||||||||||||||||||||
|
|
|
|
|
|
|
|
|
|
|
|
|
|
|
|
|
|
|
|
|
|||||||||||||||||||||
| Total other loans |
88,592 | 16.3 | % | 75,208 | 13.6 | % | 64,435 | 12.1 | % | 69,783 | 12.3 | % | 72,499 | 11.9 | % | |||||||||||||||||||||||||
|
|
|
|
|
|
|
|
|
|
|
|
|
|
|
|
|
|
|
|
|
|||||||||||||||||||||
| 545,839 | 100.0 | % | 552,406 | 100.0 | % | 535,487 | 100.0 | % | 567,371 | 100.0 | % | 609,682 | 100.0 | % | ||||||||||||||||||||||||||
|
|
|
|
|
|
|
|
|
|
|
|||||||||||||||||||||||||||||||
| Deferred loan cost, net |
(286 | ) | (92 | ) | 146 | 251 | 363 | |||||||||||||||||||||||||||||||||
| Allowance for loan losses |
(6,289 | ) | (8,682 | ) | (10,648 | ) | (11,262 | ) | (9,830 | ) | ||||||||||||||||||||||||||||||
|
|
|
|
|
|
|
|
|
|
|
|||||||||||||||||||||||||||||||
| Total |
$ | 539,264 | $ | 543,632 | $ | 524,985 | $ | 556,360 | $ | 600,215 | ||||||||||||||||||||||||||||||
|
|
|
|
|
|
|
|
|
|
|
|||||||||||||||||||||||||||||||
| (1) | Consists of loans secured by first liens on residential lots and loans secured by first mortgages on commercial real property and land. |
Loan Maturity Schedule. The following table sets forth certain information at December 31, 2014, regarding the dollar amount of loans maturing in the portfolio based on their contractual maturity dates. Demand loans, loans having no stated schedule of repayments and loans having no stated maturity, and overdrafts are reported as due in one year or less.
| Due the year ending December 31, |
3 through 5 years after December 31, 2015 |
5 through 10 years after December 31, 2015 |
10 through 15 years after December 31, 2015 |
Due 15 years after December 31, 2015 |
Total | |||||||||||||||||||||||||||
| 2015 | 2016 | 2017 | ||||||||||||||||||||||||||||||
| (Dollars In Thousands) | ||||||||||||||||||||||||||||||||
| One-to-four family residential |
$ | 6,051 | 2,455 | 2,960 | 21,734 | 51,384 | 28,145 | 74,162 | 186,891 | |||||||||||||||||||||||
| Multi-family residential |
2,157 | 2,081 | 95 | 1,454 | 7,266 | 8,234 | 4,704 | 25,991 | ||||||||||||||||||||||||
| Construction |
9,143 | 1,587 | — | 9,292 | 4,075 | 144 | — | 24,241 | ||||||||||||||||||||||||
| Non-residential |
24,192 | 5,575 | 14,838 | 53,331 | 41,954 | 48,615 | 31,619 | 220,124 | ||||||||||||||||||||||||
| Secured by deposits |
1,316 | 5,863 | 275 | 663 | 19 | — | — | 8,136 | ||||||||||||||||||||||||
| Other |
25,494 | 11,322 | 5,917 | 22,670 | 11,124 | 3,839 | 90 | 80,456 | ||||||||||||||||||||||||
|
|
|
|
|
|
|
|
|
|
|
|
|
|
|
|
|
|||||||||||||||||
| Total |
$ | 68,353 | 28,883 | 24,085 | 109,144 | 115,822 | 88,977 | 110,575 | 545,839 | |||||||||||||||||||||||
|
|
|
|
|
|
|
|
|
|
|
|
|
|
|
|
|
|||||||||||||||||
8
The following table sets forth at December 31, 2014, the dollar amount of all loans due after December 31, 2015, which had predetermined interest rates and had floating or adjustable interest rates.
| Predetermined Rate |
Floating or Adjustable Rate |
|||||||
| (Dollars In Thousands) | ||||||||
| One-to-four family residential |
$ | 45,709 | $ | 135,131 | ||||
| Multi-family residential |
10,733 | 13,101 | ||||||
| Construction |
10,484 | 4,614 | ||||||
| Non-residential |
99,809 | 96,123 | ||||||
| Other |
47,475 | 14,307 | ||||||
|
|
|
|
|
|||||
| Total |
$ | 214,210 | $ | 263,276 | ||||
|
|
|
|
|
|||||
Scheduled contractual principal repayments of loans do not reflect the actual life of such assets. The average life of loans is substantially less than their contractual terms because of prepayments. In addition, due-on-sale clauses on loans generally give the lender the right to declare a loan immediately due and payable in the event, among other things, that the borrower sells the real property subject to the mortgage and the loan is not repaid. The average life of mortgage loans tends to increase when current mortgage loan market rates are substantially higher than rates on existing mortgage loans and, conversely, decrease when current mortgage loan market rates are substantially lower than rates on existing mortgage loans.
In the last ten years, the Company has attempted to diversify its loan portfolio mix to mitigate the risk of lending in a geographically limited area. The Company uses several metrics to measure our relative success in this area.
Management measures commercial real estate (CRE) concentrations as discussed in Concentrations of Commercial Real Estate Lending, Sound Risk Management Practices issued on December 12, 2006, jointly by the Office of the Comptroller of the Currency (OCC), Board of Governors of the Federal Reserve System (Federal Reserve) and the Federal Deposit Insurance Corporation (FDIC). In this guidance, the agencies make a significant distinction between owner-occupied CRE and non-owner occupied CRE. The agencies have a heighted level of concerned with those loans with risk profiles sensitive to the condition of the CRE market.
CRE loans secured by non-farm, non-residential CRE where the primary source of repayment is the cash flow from the ongoing operations and activities conducted by the owner of the property are generally excluded from the guidance. Using the instructions provided in the FDIC call report, the Bank has calculated that $145.6 million of our loan portfolio, or 134.1% of the Bank’s risk based capital, consists of properties classified as non-owner occupied commercial real estate which includes all loans secured by multi-family properties, all construction and land development loans and certain other commercial real estate loans identified by regulations as non-owner occupied. Included in the definition of commercial real estate are $24.2 million in construction loans and $26.7 million in land development loans, representing 22.3% and 24.6% of our risk based capital, respectively. Both of our concentration categories are within regulatory guidelines and appear reasonable to management at this time. However, the Company continues to experience below average credit performance in our land development portfolio. At December 31, 2014, $11.0 million, or approximately 41.1%, of the Company’s land development loans are classified as substandard. The Company’s land portfolio accounts for approximately 4.9% of the Company’s total loan portfolio. However, the Company’s land loans classified as substandard equal 29.3% of all loans classified as substandard by the Company. The Company has not originated a new land development loan since 2012.
9
Originations, Purchases and Sales of Loans. The Bank generally has authority to originate and purchase loans secured by real estate located throughout the United States. Consistent with its emphasis on being a community-oriented financial institution, the Bank conducts substantially all of its lending activities in its market area. The following table sets forth certain information with respect to loan origination activity for the periods indicated.
| Year Ended December 31, | ||||||||||||
| 2014 | 2013 | 2012 | ||||||||||
| (Dollars In Thousands) | ||||||||||||
| Loan originations: |
||||||||||||
| One-to-four family residential |
$ | 52,357 | $ | 38,783 | $ | 84,559 | ||||||
| Multi-family residential |
6,717 | 11,078 | 4,489 | |||||||||
| Construction |
31,344 | 20,238 | 21,361 | |||||||||
| Non-residential |
46,426 | 73,048 | 71,051 | |||||||||
| Other |
69,300 | 57,462 | 51,892 | |||||||||
|
|
|
|
|
|
|
|||||||
| Total loans originated |
206,144 | 200,609 | 233,352 | |||||||||
|
|
|
|
|
|
|
|||||||
| Loan reductions: |
||||||||||||
| Transfer to other real estate owned |
1,579 | 1,379 | 2,285 | |||||||||
| (Increase) decrease in deferred loan origination fees, net of income |
194 | 238 | 105 | |||||||||
| Increase (decrease) in allowance for loan losses |
(2,393 | ) | (1,966 | ) | (614 | ) | ||||||
| Loans sold |
33,096 | 16,943 | 47,749 | |||||||||
| Transfer to loans held for sale |
6,987 | — | — | |||||||||
| Loan principal payments |
171,049 | 165,368 | 215,202 | |||||||||
|
|
|
|
|
|
|
|||||||
| Net increase (decrease) in the loan portfolio |
($ | 4,368 | ) | $ | 18,647 | ($ | 31,375 | ) | ||||
|
|
|
|
|
|
|
|||||||
Loan originations are derived from a number of sources, including existing customers, referrals by real estate agents, depositors and borrowers and advertising, as well as walk-in customers. Solicitation programs consist of advertisements in local media, in addition to occasional participation in various community organizations and events. Real estate loans are originated by the Bank’s loan personnel. All of the loan personnel are salaried and may receive additional compensation on a commission basis based on achieving certain performance goals. Loan applications are accepted at any of the Bank’s branches.
Loan Underwriting Policies. Lending activities are subject to written, non-discriminatory underwriting standards and to loan origination procedures prescribed by the Board of Directors and its management. Detailed loan applications are obtained to determine the ability of borrowers to repay, and the more significant items on these applications are verified through the use of credit reports, financial statements and confirmations. Loan requests exceeding loan officer limits must be approved by the Chief Credit Officer, Chief Executive Officer, the executive loan committee of the Board of Directors or the entire Board of Directors.
Generally, upon receipt of a loan application from a prospective borrower, a credit report and verifications are ordered to confirm specific information relating to the loan applicant’s employment, income and credit standing. If a proposed loan is to be secured by a mortgage on real estate, an appraisal of the real estate is undertaken by an appraiser approved by the Board of Directors and licensed or certified (as necessary) by the Commonwealth of Kentucky or the State of Tennessee. In the case of one-to-four family residential mortgage loans, except when the Bank becomes aware of a particular risk of environmental contamination, the Bank generally does not obtain a formal environmental report on the real estate at the time a loan is made. A formal environmental report may be required in connection with nonresidential real estate loans.
It is the Bank’s policy to record a lien on the real estate securing a loan and to obtain a title opinion from Kentucky counsel who provides that the property is free of prior encumbrances and other possible title defects. Title Insurance is generally required on all real estate loans with balances exceeding $100,000 and all one-to-four family loans that are to be sold in the secondary market. Borrowers must also obtain hazard insurance policies prior to closing and, when the property is in a flood hazard area, pay flood insurance policy premiums. The majority of real estate loan applications are underwritten and closed in accordance with the Bank’s own lending guidelines, which generally do not conform to secondary market guidelines. Although such loans may not be readily saleable in the secondary market, management believes that, if necessary, such loans may be sold to private investors at a discount to par.
10
The Bank offers a fixed rate loan program with maturities of 15, 20, and 30 years. These loans are underwritten and closed in accordance with secondary market standards. These loans are originated with the intent to sell on the secondary market. The Bank offers both servicing retained and servicing released products in an attempt to meet the needs of our customers. At December 31, 2014, the Bank’s 1-4 family loan servicing portfolio was approximately $25.0 million.
The Bank is permitted to lend up to 100% of the appraised value of the residential real property securing a mortgage loan. Under its lending policies, the Bank will originate a one-to-four family residential mortgage loan for owner-occupied property with a loan-to-value ratio of up to 95%. For residential properties that are not owner-occupied, the Bank generally does not lend more than 80% of the appraised value. For all residential mortgage loans, the Bank may increase its lending level on a case-by-case basis, provided that the excess amount is insured with private mortgage insurance. At December 31, 2014, the Bank held approximately $3.6 million of 1-4 family residential mortgages with a loan to value ratio exceeding 90% without private mortgage insurance. For these loans at December 31, 2014, approximately $47,000 are in non-accrual status and $19,000 were past due more than 30 days but less than 89 days.
Under applicable law, with certain limited exceptions, loans and extensions of credit outstanding by a commercial bank to a person at one time shall not exceed 15% of the institution’s unimpaired capital and surplus. Loans and extensions of credit fully secured by readily marketable collateral may comprise an additional 10% of unimpaired capital and surplus. Under these limits, the Bank’s loans to one borrower were limited to approximately $16.4 million at December 31, 2014. At that date, the Bank had no lending relationships in excess of the loans-to-one-borrower limit.
Interest rates charged by the Bank on loans are affected principally by competitive factors, the demand for such loans and the supply of funds available for lending purposes. These factors are, in turn, affected by general economic conditions, monetary policies of the federal government, including the Federal Reserve Board, legislative tax policies and government budgetary matters.
One-to-four Family Residential Lending. The Bank historically has been and continues to be an originator of one-to-four family residential real estate loans in its market area. At December 31, 2014, one-to-four family residential mortgage loans totaled approximately $186.9 million, or 34.2% of the Bank’s loan portfolio. The Bank originated approximately $32.8 million in loans that were sold in the secondary market with servicing released. At December 31, 2014, the Bank had approximately $1.5 million in one-to-four family residential real estate loans past due more than ninety days or in non-accrual status. At December 31, 2014, the Company’s allowance for loan loss included $1.4 million for one to four family residential lending.
11
The Bank primarily originates residential mortgage loans with adjustable rates. As of December 31, 2014, 76.3% of one-to-four family mortgage loans in the Bank’s loan portfolio carried adjustable rates or mature within one year. The Bank’s one to four family loan portfolio consists of closed end first and second mortgages as well as opened ended home equity lines of credit. At December 31, 2014, approximately $152.7 million of the Bank’s residential mortgage portfolio consisted of closed end first and junior liens. Such loans are originated for 15, 20 and 30 year terms, in each case amortized on a monthly basis with principal and interest due each month. The interest rates on these mortgages are adjusted once per year, with a maximum adjustment of 1% per adjustment period and a maximum aggregate adjustment of 5% over the life of the loan. Prior to August 1, 1997, rate adjustments on the Bank’s adjustable rate loans were indexed to a rate which adjusted annually based upon changes in an index based on the National Monthly Median Cost of Funds, plus a margin of 2.75%. Because the National Monthly Median Cost of Funds is a lagging index, which results in rates changing at a slower pace than rates generally in the marketplace, the Bank changed to a one-year Treasury bill constant maturity (“One Year CMT”), which the Bank believes reflects more current market information and thus allows the Bank to react more quickly to changes in the interest rate environment. In 2004, the Bank increased its margin on its adjustable rate loans to 3.00%.
The Bank also originates, to a limited extent, fixed-rate loans for terms of 10 and 15 years. Such loans are secured by first mortgages on one-to-four family, owner-occupied residential real property located in the Bank’s market area. Because of the Bank’s policy to mitigate its exposure to interest rate risk through the use of adjustable rate rather than fixed rate products, the Bank does not emphasize fixed-rate mortgage loans. Fixed rate mortgage loans originated by the Bank are loans that often do not qualify for the secondary market due to numerous factors not related to credit quality. Typically, these products are not priced to be competitive with secondary market loans but to offer as an alternative if that option is not available. At December 31, 2014, $45.7 million of the Bank’s loan portfolio consisted of fixed-rate one-to-four family first mortgage loans that will mature after December 31, 2015. To further reduce its interest rate risk associated with such loans, the Bank may rely upon FHLB advances with similar maturities to fund such loans. See “— Deposit Activity and Other Sources of Funds — Borrowing.”
At December 31, 2014, the Bank had $34.2 million in home equity lines of credit outstanding and $29.8 million of additional credit available. Typically, these loans are for a term of fifteen years and have loan to value ratio of 80% to 100%. The home equity portfolio is priced at a spread to prime, adjusted daily, depending on the customer’s loan to value ratio at the time of origination. Many of the home equity lines of credit require monthly interest payments with all unpaid interest and principal due at maturity.
The retention of adjustable rate loans in the Bank’s portfolio helps reduce, but does not eliminate, the Bank’s exposure to increases in prevailing market interest rates. However, there are unquantifiable credit risks resulting from potential increases in costs to borrowers in the event of upward re-pricing of adjustable-rate loans. It is possible that during periods of rising interest rates, the risk of default on adjustable rate loans may increase due to increases in interest costs to borrowers. Further, although adjustable rate loans allow the Bank to increase the sensitivity of its interest-earning assets to changes in interest rates, the extent of this interest sensitivity is limited by the initial fixed-rate period before the first adjustment and the lifetime interest rate adjustment limitations. This risk is heightened by the Bank’s prior practice of offering its adjustable rate mortgages with a 2.0% limitation on annual interest rate adjustments. Accordingly, there can be no assurance that yields on the Bank’s adjustable rate loans will fully adjust to compensate for increases in the Bank’s cost of funds.
Finally, adjustable rate loans increase the Bank’s exposure to decreases in prevailing market interest rates, although the 2.0% limitation on annual decreases in the loans’ interest rate tends to offset this effect. In times of declining interest rates, borrowers often refinance into fixed rate loan products, limiting the Bank’s ability to significantly increase its interest rate margin on adjustable rate loans in a declining interest rate market. In times of increasing interest rates, the 2.0% annual cap on increases in the interest rates tends to reduce refinancing activity and reduce the Bank’s net interest margin.
Neither the fixed rate nor the adjustable rate residential mortgage loans held in the Bank’s portfolio are originated in conformity with secondary market guidelines issued by FHLMC or FNMA. As a result, such loans may not be readily saleable in the secondary market to institutional purchasers. However, such loans may still be sold to private investors whose investment strategies do not depend upon loans that satisfy FHLMC or FNMA criteria. Further, given its high liquidity, the Bank does not currently view loan sales as a necessary funding source.
12
Construction Lending. The Bank engages in construction lending involving loans to individuals for construction of one-to-four family residential housing, multi-family housing and non-residential real estate located within the Bank’s market area, with such loans converting to permanent financing upon completion of construction. The Bank mitigates its risk with construction loans by imposing a maximum loan-to-value ratio of 80% for homes that will be owner-occupied or being built on a speculative basis.
The Bank also makes loans to qualified builders for the construction of one-to-four family residential housing located in established subdivisions in the Bank’s market area. Because such homes are intended for resale, such loans are generally not converted to permanent financing at the Bank. All construction loans are secured by a first lien on the property under construction.
Loan proceeds are disbursed in increments as construction progresses and as inspections warrant. Construction/permanent loans may have adjustable or fixed interest rates and are underwritten in accordance with the same terms and requirements as the Bank’s permanent mortgages.
Such loans generally provide for disbursement in stages during a construction period of up to eighteen months, during which period the borrower is required to make payments of interest only. The permanent loans are typically 30-year adjustable rate loans, with the same terms and conditions otherwise offered by the Bank. Monthly payments of principal and interest commence the month following the date the loan is converted to permanent financing. Borrowers must satisfy all credit requirements that would apply to the Bank’s permanent mortgage loan financing prior to receiving construction financing for the subject property.
Construction financing generally is considered to involve a higher degree of risk of loss than long-term financing on improved, occupied real estate. Risk of loss on a construction loan is dependent largely upon the accuracy of the initial estimate of the property’s value at completion of construction or development and the estimated cost (including interest) of construction. During the construction phase, a number of factors could result in delays and cost overruns. If the estimate of construction costs proves to be inaccurate, the Bank may be confronted at or prior to the maturity of the loan, with a project having a value which is insufficient to assure full repayment. The ability of a developer to sell developed lots or completed dwelling units will depend on, among other things, demand, pricing, availability of comparable properties and economic conditions. The Bank has sought to minimize this risk by limiting construction lending to qualified borrowers in the Bank’s market area, by requiring the involvement of qualified builders, and by limiting the aggregate amount of outstanding construction loans. At December 31, 2008, the Bank’s construction loan portfolio was $62.3 million. By that time, the Bank had begun to reduce its construction loan exposure due to concerns about a slowing economy. The significant reduction in construction loans has had a negative impact on the Bank’s loan portfolio balances and net interest margin. However, the negative impact has been offset by the relatively minor credit problems that have occurred in this portfolio.
At December 31, 2014, the Bank’s loan portfolio included $24.2 million of loans secured by properties under construction, including construction/permanent loans structured to become permanent loans upon the completion of construction and interim construction loans structured to be repaid in full upon completion of construction and receipt of permanent financing. At December 31, 2014, approximately $5.9 million of construction loans were for one to four family dwellings, approximately $1.8 million of construction loans were for multi-family dwellings and $16.5 million were for non-residential real estate. At December 31, 2014, there were no construction loans past due more than ninety days or in non-accrual status. At December 31, 2014, the Company’s allowance for loan loss included $146,000 in the general reserve for construction loans.
13
Multi-Family Residential and Non-Residential Real Estate Lending. The Bank’s multi-family residential loan portfolio consists of fixed and adjustable rate loans secured by real estate. At December 31, 2014, the Bank had $26.0 million of multi-family residential loans, which amounted to 4.7% of the Bank’s loan portfolio at such date. The Bank’s non-residential real estate portfolio generally consists of adjustable and fixed rate loans secured by first mortgages on commercial real estate, farmland, residential lots, and rental property. In most cases, such property is located in the Bank’s market area. At December 31, 2014, the Bank had approximately $220.1 million of such loans, which comprised 40.2% of its loan portfolio.
At December 31, 2014, non-residential real estate loans consisted of $42.9 million in farmland, $68.5 million in non-owner occupied properties, and $82.0 million in owner occupied commercial real estate and $26.7 million in raw land. The Company currently has no land under development and all lots are completed and available for sale. At December 31, 2014, approximately $11.0 million, or 41.1% of the Company’s land portfolio is classified as substandard, $2.2 million, or 5.3% of the Company’s farmland portfolio is classified as substandard and $13.3 million, or 8.8% of the Company’s commercial real estate portfolio, is classified as substandard. Together, these three categories represent 70.8% of all substandard loans. The reduction of loans classified as substandard remains a high priority for management.
At December 31, 2014, the inventory of land loans includes 131 lots available for sale compared to 297 lots available for sale at December 31, 2013. At December 31, 2014, the Company’s aggregate loan balance for loans secured by developed lots was $3.4 million representing an average loan balance of $26,300 per lot. At December 31, 2013, the Company held land loans secured by develop lots of $10.8 million and the average lot has a loan balance of approximately $36,300. Also at December 31, 2014, the Company has $16.8 million in land loans on property that is designated for future development with which no meaningful infrastructure has been started. These loans represent 1,247 acres of land with an average price per acre of approximately $13,500. At December 31, 2013, the Company has $23.8 million in land loans on property that is designated for future development in which no meaningful infrastructure has been started. These loans represent approximately 1,322 acres of land with an average price per acre of approximately $14,000. At December 31, 2014, the remaining $6.5 million in land loans is classified as land for personal use.
Multi-family residential real estate loans are underwritten with loan-to-value ratios up to 80% of the appraised value of the property. Non-residential real estate loans are underwritten with loan-to-value ratios up to 65% of the appraised value for raw land and 75% for land development loans. Non-residential real estate loans for agricultural and other non-residential real estate properties are underwritten with loan-to-value ratios up to 85%.
Multi-family residential and non-residential real estate lending entails significant additional risks as compared with one-to-four family residential property lending. Multi-family residential and commercial real estate loans typically involve larger loan balances to single borrowers or groups of related borrowers. The payment experience on such loans typically is dependent on the successful operation of the real estate project, retail establishment or business. These risks can be significantly impacted by supply and demand conditions in the market for the office, retail and residential space, and, as such, may be subject to a greater extent to adverse conditions in the economy generally.
To minimize these risks, the Bank generally limits itself to its market area or to borrowers with which it has prior experience or who are otherwise known to the Bank. It has been the Bank’s policy to obtain annual financial statements of the business of the borrower or the project for which multi-family residential real estate or non-residential real estate loans are made. At December 31, 2014, $95,000 of multi-family loans were past due more than 90 days or classified as non-accrual. At December 31, 2014, there were $1.2 million in non-residential real estate that were past due by 90 days or more or classified as non-accrual and $215,000 in loans secured by raw land that were past due by 90 days or more or classified as non-accrual. Also at December 31, 2014, $115,000 of loans secured by farmland were past due more than 90 days or classified as non-accrual.
14
Consumer Lending. The consumer loans currently in the Bank’s loan portfolio consist of loans secured by savings deposits and other consumer loans. Savings deposit loans are usually made for up to 100% of the depositor’s savings account balance. The interest rate is approximately 2.0% above the rate paid on such deposit account serving as collateral, and the account must be pledged as collateral to secure the loan. Interest generally is billed on a quarterly basis. At December 31, 2014, loans on deposit accounts totaled $8.1 million, or 1.5% of the Bank’s loan portfolio. Other consumer loans include automobile loans, the amount and terms of which are determined by management, and closed end home equity and home improvement loans, which are made for up to 100% of the value of the property. At December 31, 2014, all other consumer loans accounts totaled $6.3 million, or 1.1% of total loans.
Consumer loans may entail greater credit risk than do residential mortgage loans, particularly in the case of consumer loans that are unsecured or are secured by rapidly depreciable assets, such as automobiles. In such cases, any repossessed collateral for a defaulted consumer loan may not provide an adequate source of repayment of the outstanding loan balance as a result of the greater likelihood of damage, loss or depreciation. In addition, consumer loan collections are dependent on the borrower’s continuing financial stability, and therefore are more likely to be affected by adverse personal circumstances. Furthermore, the application of various federal and state laws, including bankruptcy and insolvency laws, may limit the amount which can be recovered on such loans. At December 31, 2014, no consumer loans are delinquent 90 days or more or classified as non-accrual. At December 31, 2014, the Company’s allowance for loan loss included $494,000 for consumer loans.
In 2013, the Company instituted a centralized lending function for all residential real estate and consumer loans. The centralized process allows for a more standardized and consistent credit decision, a more efficient use of Company resources and allows provides for a concentrating of the Company’s compliance and documentation expertise. In 2015, the centralized documentation process will be expanded to include all loan originations.
Commercial Lending. The Bank originates commercial loans on a secured and, to a lesser extent, unsecured basis. At December 31, 2014, the Bank’s commercial loans amounted to $74.2 million, or 13.6% of the Bank’s loan portfolio. The Bank’s commercial loans generally are secured by business assets. In addition, the Bank generally obtains guarantees from the principals of the borrower with respect to all commercial loans. At December 31, 2014, there was $90,000 in commercial loans delinquent 90 days or more or classified as non-accrual. At December 31, 2014, the Company’s allowance for loan loss included $504,000 in reserve for commercial loans.
In 2014, the Company experienced a decline in net charge offs as compared to 2013. In 2014, the Company’s net charge offs were $120,000, as compared to $3.6 million, $2.9 million and $4.5 million in 2013, 2012 and 2011, respectively. In 2014, the Company’s net charge offs included $798,000 in recoveries of loans secured by non-residential real estate, net charge offs of $202,000 in commercial loans, $306,000 in consumer loans, $129,000 in construction and land development loans and $280,000 in loans secured by 1-4 family residences.
At December 31, 2014, the Company’s level of classified loans to risk based capital is 33.6%. The Company seeks to reduce this ratio to at least 30%. To make further reductions in the level of classified assets, management will focus on a limited number but significant loan relationships secured by land and commercial real estate. To assist in the reduction of the level of classified loans to capital, management has developed a special assets division to more closely monitor and work with classified assets. As a part of these efforts, management has reduced its exposure to classified assets in specific categories and / or to specific customers. The strategy worked to reduce the level of classified assets but resulted in lower loan balances in 2014.
15
Non-accrual Loans and Other Problem Assets
The Bank’s non-accrual loans totaled 0.58% of total loans at December 31, 2014. Loans are placed on a non-accrual status when the loan is past due in excess of 90 days or the collection of principal and interest is doubtful. The Bank places a high priority on contacting customers by telephone as a primary method of determining the status of delinquent loans and the action necessary to resolve any payment problem. The Bank’s management performs quality reviews of problem assets to determine the necessity of establishing additional loss reserves. The Bank’s total non-performing assets to total asset ratio was 0.55% at December 31, 2014.
The following table sets forth information with respect to the Bank’s non-accrual loans at the dates indicated.
| At December 31, | ||||||||||||||||||||
| 2014 | 2013 | 2012 | 2011 | 2010 | ||||||||||||||||
| (Dollars In Thousands) | ||||||||||||||||||||
| Accruing loans which are contractually past due 90 days or more: |
||||||||||||||||||||
| Residential real estate |
$ | — | $ | — | $ | — | $ | — | $ | — | ||||||||||
| Non-residential real estate |
— | — | — | — | — | |||||||||||||||
| Consumer |
— | — | — | — | — | |||||||||||||||
| Commercial |
— | — | — | — | — | |||||||||||||||
|
|
|
|
|
|
|
|
|
|
|
|||||||||||
| Total |
— | — | — | — | — | |||||||||||||||
|
|
|
|
|
|
|
|
|
|
|
|||||||||||
| Non-Accrual Loans: |
||||||||||||||||||||
| Construction |
— | 175 | — | — | 1,541 | |||||||||||||||
| Multi-family |
95 | — | 38 | — | 301 | |||||||||||||||
| Residential real estate |
1,501 | 948 | 2,313 | 2,309 | 1,662 | |||||||||||||||
| Land |
215 | 1,218 | 2,768 | 1,330 | 363 | |||||||||||||||
| Non-residential real estate |
1,159 | 6,546 | 1,134 | 2,231 | 1,043 | |||||||||||||||
| Farmland |
115 | 703 | 648 | — | — | |||||||||||||||
| Consumer |
— | 13 | 145 | 9 | 23 | |||||||||||||||
| Commercial |
90 | 463 | 617 | 254 | 97 | |||||||||||||||
|
|
|
|
|
|
|
|
|
|
|
|||||||||||
| Total non-accrual loans |
$ | 3,175 | $ | 10,066 | $ | 7,663 | $ | 6,133 | $ | 5,030 | ||||||||||
|
|
|
|
|
|
|
|
|
|
|
|||||||||||
| Percentage of total loans |
0.58 | % | 1.82 | % | 1.43 | % | 1.08 | % | 0.82 | % | ||||||||||
|
|
|
|
|
|
|
|
|
|
|
|||||||||||
Federal regulations require commercial banks to classify their assets on the basis of quality on a regular basis. In determining the classification of an asset, the Company utilizes a Classified Asset Committee consisting of members of senior management, accounting, credit analysis, loan administration, loan review, internal audit and collections. The committee is charged with determining the value of assets that are potentially impaired as well as the accurate reporting of Troubled Debt Restructuring (TDR) assets as defined later in this report. The committee’s function is an important step in management’s determination as to the necessary level of funding required in the Company’s allowance for loan loss account.
An asset meeting one of the classification definitions set forth below may be classified and still be a performing loan. An asset is classified as substandard if it is determined to be inadequately protected by the current retained earnings and paying capacity of the obligor or of the collateral pledged, if any.
16
An asset is classified as doubtful if full collection is highly questionable or improbable. An asset is classified as loss if it is considered uncollectible, even if a partial recovery could be expected in the future. The regulations also provide for a special mention designation, described as assets which do not currently expose a savings institution to a sufficient degree of risk to warrant classification but do possess credit deficiencies or potential weaknesses deserving management’s close attention. Such assets designated as special mention may include non-performing loans consistent with the above definition.
Assets classified as substandard or doubtful require a commercial bank to conduct an impairment test to determine if the establishment of a specific reserve against the allowance for loan loss account is necessary. Typically, the basis for a loan impairment test is the current market value of the collateral, discounted to allow for selling and carrying cost. Typically, new appraisals on 1-4 family properties are discounted 10% to 15% from the appraised value while land and commercial real estate are discounted at 15% to 25% of new appraised values depending on the perceived marketability of the property.
The Company requires a new appraisal for all impairment testing of collateral when the loan balance exceeds $250,000. For loans less than $250,000, the Company may choose to use an old appraisal and provide additional discounts to the appraised value in determining the amount of specific reserve required. In the last twelve months, the Company has found that appraisers face an increase in request for services and the time between a request for an appraisal and its completion is longer than normal, up to sixty days for complex multi-family or commercial properties. During the interim, the Company may use an old appraisal with larger discounts to ascertain the likelihood of a loan impairment until a current appraisal is received.
If an asset or portion thereof is classified loss, we establish a specific reserve for such amount. If the Company determines that a loan relationship is collateral dependent, it will charge off the portion of that loan that is deemed to be impaired. The Company defines collateral dependent as any loan in that the customer will be unable to reduce the principal balance of the loan without the complete or partial sale of the collateral.
State and federal examiners may disagree with management’s classifications. If management does not agree with an examiner’s classification of an asset, it may appeal this determination to the appropriate supervisory examiner with the KDFI and FDIC. Management regularly reviews its assets to determine whether any assets require classification or re-classification. At December 31, 2014, the Bank had $37.4 million in loans classified as substandard. Loans classified as substandard or doubtful by the Bank meet our classification of impaired loans, as defined by ASC 942-310-45-1. At December 31, 2014, and including our most recent examination, there were no material disagreements between examiners, auditors and management regarding risk grading or the funding of the allowance for loan loss account.
During the third and fourth quarter of 2012, the level of classified loans began to decline from their highest levels and have continued to decline into 2013. The improved level of classified loans occurred as the Company received updated financial information and saw a select number of customers seek financing elsewhere. At December 31, 2014, our classified asset to risk based capital ratio was 33.6%. The Company’s long term goal is to maintain a classified capital to risk based capital ratio at or below 30%.
17
The tables below provide a summary of loans classified by the Bank as special mention, substandard and doubtful by category for the years ended December 31, 2014, and December 31, 2013. The table also identifies the amount of the Bank’s allowance for loan loss account specifically allocated to individual loans for the specific periods below:
| December 31, 2014 |
Special Mention |
Substandard | Doubtful | Specific Allowance for Impairment |
||||||||||||
| One-to-four family residential |
$ | 203 | 4,219 | — | 51 | |||||||||||
| Home equity line of credit |
— | 757 | — | — | ||||||||||||
| Junior lien |
40 | 37 | — | — | ||||||||||||
| Multi-family |
2,904 | 3,021 | — | — | ||||||||||||
| Construction |
— | — | — | — | ||||||||||||
| Land |
362 | 10,964 | — | 663 | ||||||||||||
| Non-residential real estate |
5,492 | 13,250 | — | 738 | ||||||||||||
| Farmland |
516 | 2,237 | — | — | ||||||||||||
| Consumer |
21 | 299 | — | 62 | ||||||||||||
| Commercial |
325 | 2,583 | — | — | ||||||||||||
|
|
|
|
|
|
|
|
|
|||||||||
| Total |
$ | 9,863 | 37,367 | — | 1,514 | |||||||||||
|
|
|
|
|
|
|
|
|
|||||||||
| December 31, 2013 |
Special Mention |
Substandard | Doubtful | Specific Allowance for Impairment |
||||||||||||
| One-to-four family residential |
$ | 814 | 5,087 | — | 597 | |||||||||||
| Home equity line of credit |
— | 641 | — | — | ||||||||||||
| Junior lien |
43 | 79 | — | — | ||||||||||||
| Multi-family |
— | — | — | — | ||||||||||||
| Construction |
— | 175 | — | — | ||||||||||||
| Land |
52 | 14,730 | — | 771 | ||||||||||||
| Non-residential real estate |
515 | 14,133 | — | 465 | ||||||||||||
| Farmland |
480 | 5,346 | — | — | ||||||||||||
| Consumer |
— | 440 | — | 96 | ||||||||||||
| Commercial |
526 | 2,013 | — | — | ||||||||||||
|
|
|
|
|
|
|
|
|
|||||||||
| Total |
$ | 2,430 | 42,644 | — | 1,929 | |||||||||||
|
|
|
|
|
|
|
|
|
|||||||||
Troubled Debt Restructuring
Due to challenges in the local and national economy that continue to persist, the Company has had more of its customers incur financial problems. These customers may request temporary or permanent modification of loans in an effort to avoid foreclosure. The Company analyzes each request separately and grants loan modifications based on the customer’s ability to eventually repay the loan and return to the original loan terms, the customer’s current loan status and the current and projected future value of the Bank’s collateral. Loans that are modified as a result of a customer’s financial distress are classified as Troubled Debt Restructuring (TDR). The classification of a loan as TDR is important in that it indicates that a particular customer may not be past due but represents a credit weakness due to the Bank’s willingness to modify loan terms based on the financial weakness of the borrower.
18
The classification of a loan as a TD R may represent the Company’s “last best chance” to work with a distressed customer before foreclosure proceedings begin. At December 31, 2013, the Company had no loans classified as TDR. At December 31, 2012, the Company had $14.1 million in loans classified as TDR, with $11.0 million of reported TDR’s performing as agreed by the loans modified terms. At December 31, 2012, non-performing TDRs included $2.8 million in land loans, $44,000 in loans secured by farmland, $100,000 secured by junior liens on 1-4 family properties and $119,000 in commercial loans. At December 31, 2012, the Company had $1.0 million in specific reserves of the allowance for loan loss account allocated to loans classified as performing TDRs and no specific reserves for non-performing TDRs. A summary of loans classified as TDR and the respective TDR activity for the year ended December 31, 2014, can be found in the table below:
| Balance at December 31, 2013 |
New TDR |
Loss on Foreclosure |
Transfer to Held for Sale |
Balance at December 31,2014 |
||||||||||||||||
| (Dollars in Thousands) | ||||||||||||||||||||
| One-to-four family mortgages |
— | — | — | — | — | |||||||||||||||
| Junior Lien |
— | — | — | — | — | |||||||||||||||
| Multi-family |
— | — | — | — | — | |||||||||||||||
| Construction |
— | — | — | — | — | |||||||||||||||
| Land |
— | — | — | — | — | |||||||||||||||
| Non-residential real estate |
— | 10,271 | — | (6,987 | ) | 3,284 | ||||||||||||||
| Land |
— | — | — | — | — | |||||||||||||||
| Consumer loans |
— | — | — | — | — | |||||||||||||||
| Commercial loans |
— | — | — | — | — | |||||||||||||||
|
|
|
|
|
|
|
|
|
|
|
|||||||||||
| Total TDR |
— | 10,271 | (6,987 | ) | 3,284 | |||||||||||||||
|
|
|
|
|
|
|
|
|
|
|
|||||||||||
A summary of loans classified as TDR and the respective TDR activity for the year ended December 31, 2013, can be found in the table below:
| Balance at 12/31/12 | New TDR |
Loss or Foreclosure |
Removed due to Payment or Performance |
Removed from (Taken to) Non-accrual |
Balance at 12/31/13 | |||||||||||||||||||
| (Dollars in Thousands) | ||||||||||||||||||||||||
| One-to-four family mortgages |
$ | 1,888 | 242 | — | (1,863 | ) | (267 | ) | — | |||||||||||||||
| Home equity line of credit |
— | — | — | — | — | — | ||||||||||||||||||
| Junior Lien |
96 | — | — | (10 | ) | (86 | ) | — | ||||||||||||||||
| Multi-family |
234 | — | — | (234 | ) | — | — | |||||||||||||||||
| Construction |
4,112 | — | — | — | (4,112 | ) | — | |||||||||||||||||
| Land |
656 | 2,649 | (393 | ) | (656 | ) | (2,256 | ) | — | |||||||||||||||
| Non-residential real estate |
3,173 | 266 | (864 | ) | — | (2,575 | ) | — | ||||||||||||||||
| Farmland |
865 | — | — | (865 | ) | — | — | |||||||||||||||||
| Consumer loans |
5 | — | — | (5 | ) | — | — | |||||||||||||||||
| Commercial loans |
9 | 222 | — | (231 | ) | — | — | |||||||||||||||||
|
|
|
|
|
|
|
|
|
|
|
|
|
|||||||||||||
| Total performing TDR |
$ | 11,038 | 3,379 | (1,257 | ) | (3,864 | ) | (9,296 | ) | — | ||||||||||||||
|
|
|
|
|
|
|
|
|
|
|
|
|
|||||||||||||
19
Real estate acquired by the Bank as a result of foreclosure is classified as real estate owned until such time as it is sold. The Bank generally tries to sell the property at its current market price. The current market price is determined by obtaining an appraisal prior to the acquisition of the property. When such property is acquired, it is recorded at its fair value less estimated costs of sale. In the last eighteen months, the Company has determined that properties acquired through foreclosure have experienced a significant loss in market value as compared to the market value at the time of the origination of the loan. At the time of foreclosure, the collateral is reduced in value to its fair market value less holding and selling expenses and the remaining balance is charged against the allowance for loan losses.
Subsequent to foreclosure, in accordance with accounting principles generally accepted in the United States of America, a valuation allowance is established if the carrying value of the property exceeds its fair value net of related selling expenses. The value of other real estate owned is periodically evaluated, no less than annually, to ascertain its current market value. Additional reductions in market value are recognized as an expense through a charge to losses on real estate owned. At December 31, 2014, the Bank’s real estate and other assets owned totaled $1.9 million. The following table sets forth information with respect to the Bank’s real estate and other assets owned at December 31, 2014, December 31, 2013, and December 31, 2012:
| 2014 | 2013 | 2012 | ||||||||||
| (Dollars in Thousands) | ||||||||||||
| One-to-four family first mortgages |
$ | 159 | 350 | 258 | ||||||||
| Construction |
— | — | 130 | |||||||||
| Land |
1,768 | 1,124 | 1,112 | |||||||||
| Non-residential real estate |
— | 200 | 44 | |||||||||
| Consumer loans |
— | — | 4 | |||||||||
|
|
|
|
|
|
|
|||||||
| Total real estate and other assets owned |
$ | 1,927 | 1,674 | 1,548 | ||||||||
|
|
|
|
|
|
|
|||||||
Allowance for Loan Losses. In originating loans, the Bank recognizes that credit losses will be experienced and that the risk of loss will vary with, among other things, the type of loan being made, the creditworthiness of the borrower over the term of the loan, general economic conditions and, in the case of a secured loan, the quality of the security for the loan. It is management’s policy to maintain an adequate allowance for loan losses based on, among other things, the Bank’s and the industry’s historical loan loss experience, evaluation of economic conditions, regular reviews of delinquencies and loan portfolio quality and evolving standards imposed by federal bank examiners and other regulatory agencies. The Bank increases its allowance for loan losses by charging provisions for loan losses against the Bank’s income.
Management will continue to actively monitor the Bank’s asset quality and allowance for loan losses. Management will charge off loans and properties acquired in settlement of loans against the allowances for loan losses on such loans and such properties when appropriate and will provide specific loss allowances when necessary. Although management believes it uses the best information available to make determinations with respect to the allowances for loan losses and believes such allowances are adequate, future adjustments may be necessary if economic conditions differ substantially from the economic conditions in the assumptions used in making the initial determinations.
The Bank’s methodology for establishing the allowance for loan losses takes into consideration probable losses that have been identified in connection with specific assets as well as losses that have not been identified but can be expected to occur. Management conducts regular reviews of the Bank’s assets and evaluates the need to establish allowances on the basis of this review. Allowances are established by the Board of Directors on a quarterly basis based on an assessment of risk in the Bank’s assets taking into consideration the composition and quality of the portfolio, delinquency trends, current charge-off and loss experience, loan concentrations, the state of the real estate market, regulatory reviews conducted in the regulatory examination process and economic conditions generally.
20
Specific reserves will be provided for individual assets, or portions of assets, when ultimate collection is considered improbable by management based on the current payment status of the assets and the fair value of the security. At the date of foreclosure or other repossession, the Bank would transfer the property to real estate acquired in settlement of loans initially at the lower of cost or estimated fair value and subsequently at the lower of book value or fair value less estimated selling costs. Any portion of the outstanding loan balance in excess of fair value less estimated selling costs would be charged off against the allowance for loan losses. If, upon ultimate disposition of the property, net sales proceeds exceed the net carrying value of the property, a gain on sale of other real estate would be recorded.
Financial institutions must provide adequate disclosure of the methodology used regarding maintenance of an adequate allowance for loan and lease losses and an effective loan review system. The Bank utilizes a combination of its twelve quarter loan loss history and the sum of all impairment testing completed on individually classified loans deemed collateral dependent.
The charge off history is weighted using the sum of the year’s digits. This method provides a 15.4% weight to the most recent quarterly losses, then 14.1% for the prior quarter’s losses, 12.8% for the 2nd prior quarter’s losses and 11.5% for the prior quarter’s losses and continuing for twelve quarters. Using this method, the Bank trends for increasing or decreasing levels of charge offs may materially impact the funding level of the allowance for loan loss account. Additionally, the Bank reserves the loss amount of any loans deemed to be impaired. The Bank also applies certain qualitative factors in reviewing its allowance funding, including local and national delinquency and loss trends, noted concentrations or risk and recent additions to regulator guidance.
Financial institutions regulated by the KDFI and FDIC may require institutions to immediately charge off any portion of a collateral dependent loan that is deemed to be impaired.
The following table sets forth an analysis of the Bank’s allowance for loan losses for the years indicated.
| Year Ended December 31, | ||||||||||||||||||||
| 2014 | 2013 | 2012 | 2011 | 2010 | ||||||||||||||||
| (Dollars in thousands) | ||||||||||||||||||||
| Balance at beginning of period |
$ | 8,682 | 10,648 | 11,262 | 9,830 | 8,851 | ||||||||||||||
| Loans charged off: |
||||||||||||||||||||
| Commercial loans |
(501 | ) | (2,802 | ) | (2,727 | ) | (3,596 | ) | (4,354 | ) | ||||||||||
| Consumer loans and overdrafts |
(415 | ) | (649 | ) | (510 | ) | (371 | ) | (472 | ) | ||||||||||
| Residential real estate |
(316 | ) | (993 | ) | (447 | ) | (908 | ) | (464 | ) | ||||||||||
|
|
|
|
|
|
|
|
|
|
|
|||||||||||
| Total charge-offs |
(1,232 | ) | (4,444 | ) | (3,684 | ) | (4,875 | ) | (5,290 | ) | ||||||||||
|
|
|
|
|
|
|
|
|
|
|
|||||||||||
| Recoveries |
1,112 | 874 | 795 | 386 | 299 | |||||||||||||||
|
|
|
|
|
|
|
|
|
|
|
|||||||||||
| Net loans charged off |
(120 | ) | (3,570 | ) | (2,889 | ) | (4,489 | ) | (4,991 | ) | ||||||||||
|
|
|
|
|
|
|
|
|
|
|
|||||||||||
| Provision for loan losses |
(2,273 | ) | 1,604 | 2,275 | 5,921 | 5,970 | ||||||||||||||
|
|
|
|
|
|
|
|
|
|
|
|||||||||||
| Balance at end of period |
$ | 6,289 | 8,682 | 10,648 | 11,262 | 9,830 | ||||||||||||||
|
|
|
|
|
|
|
|
|
|
|
|||||||||||
| Ratio of net charge-offs to average loans outstanding during the period |
0.03 | % | 0.66 | % | 0.52 | % | 0.76 | % | 0.79 | % | ||||||||||
|
|
|
|
|
|
|
|
|
|
|
|||||||||||
21
The following table sets forth the breakdown of the allowance for loan losses by loan category at the dates indicated. Management believes that the allowance can be allocated by category only on an approximate basis. The allocation of the allowance to each category is not necessarily indicative of future losses and does not restrict the use of the allowance to absorb losses in any category.
| At December 31, | ||||||||||||||||||||||||||||||||
| 2014 | 2013 | 2012 | 2011 | |||||||||||||||||||||||||||||
| Amount | Percent of Loans in Each Category to Total Loans |
Amount | Percent of Loans in Each Category to Total Loans |
Amount | Percent of Loans in Each Category to Total Loans |
Amount | Percent of Loans in Each Category to Total Loans |
|||||||||||||||||||||||||
| (Dollars in thousands) | ||||||||||||||||||||||||||||||||
| One-to-four family |
$ | 1,393 | 34.2 | % | $ | 2,305 | 34.9 | % | $ | 3,094 | 38.0 | % | $ | 3,325 | 38.1 | % | ||||||||||||||||
| Construction |
146 | 4.4 | % | 88 | 1.9 | % | 256 | 3.5 | % | 139 | 2.1 | % | ||||||||||||||||||||
| Multi-family residential |
85 | 4.8 | % | 466 | 5.4 | % | 524 | 6.2 | % | 1,201 | 5.9 | % | ||||||||||||||||||||
| Non-residential |
3,667 | 40.3 | % | 4,534 | 44.2 | % | 5,817 | 40.2 | % | 5,003 | 41.6 | % | ||||||||||||||||||||
| Secured by deposits |
— | 1.5 | % | — | 0.6 | % | — | 0.7 | % | — | 0.7 | % | ||||||||||||||||||||
| Other loans |
998 | 14.8 | % | 1,289 | 13.0 | % | 957 | 11.4 | % | 1,594 | 11.6 | % | ||||||||||||||||||||
|
|
|
|
|
|
|
|
|
|
|
|
|
|
|
|
|
|||||||||||||||||
| Total allowance for loan losses |
$ | 6,289 | 100.0 | % | $ | 8,682 | 100.0 | % | $ | 10,648 | 100.0 | % | $ | 11,262 | 100.0 | % | ||||||||||||||||
|
|
|
|
|
|
|
|
|
|
|
|
|
|
|
|
|
|||||||||||||||||
| At December 31, 2010 | ||||||||
| Amount | Percent of Loans in Each Category to Total Loans |
|||||||
| (Dollars In Thousands) | ||||||||
| One-to-four family |
$ | 1,455 | 37.6 | % | ||||
| Construction |
657 | 3.8 | % | |||||
| Multi-family residential |
2,022 | 4.8 | % | |||||
| Non-residential |
4,890 | 41.9 | % | |||||
| Secured by deposits |
— | 0.7 | % | |||||
| Other consumer loans |
806 | 11.2 | % | |||||
|
|
|
|
|
|||||
| Total allowance for loan losses |
$ | 9,830 | 100.0 | % | ||||
|
|
|
|
|
|||||
Investment Activities
The Company makes investments in order to maintain the levels of liquid assets required by regulatory authorities and manage cash flow, diversify its assets, obtain yield and to satisfy certain requirements for favorable tax treatment. The principal objective of the investment policy is to earn as high a rate of return as possible, but to consider also financial or credit risk, liquidity risk and interest rate risk. The investment activities of the Corporation and the Bank consist primarily of investments in U.S. Government agency securities, municipal and corporate bonds, CMO’s (see definition below), and mortgage-backed securities. Typical investments include federally sponsored agency mortgage pass-through and federally sponsored agency and mortgage-related securities. Investment and aggregate investment limitations and credit quality parameters of each class of investment are prescribed in the Bank’s investment policy. The Corporation and the Bank perform analyses on mortgage-related securities prior to purchase and on an ongoing basis to determine the impact on earnings and market value under various interest rate and prepayment conditions. Securities purchases must be approved by the Bank’s Chief Financial Officer or President. The Board of Directors reviews all securities transactions on a monthly basis.
At December 31, 2014, securities with an amortized cost of $297.8 million and an approximate market value of $303.6 million were classified as available for sale. Management presently does not intend to sell such securities and, based on the current liquidity level and the access to borrowings through the FHLB of Cincinnati, management currently does not anticipate that the Corporation or the Bank will be placed in a position of having to sell securities with material unrealized losses.
22
Mortgage-Backed and Related Securities. Mortgage-backed securities represent a participation interest in a pool of one-to-four family or multi-family mortgages, the principal and interest payments on which are passed from the mortgage originators through intermediaries that pool and repackage the participation interest in the form of securities to investors such as the Bank. CMO’s are a variation of mortgage-backed securities in which the mortgage pool is divided into specific classes, with different classes receiving different principal reduction streams based on numerous factors, including prepayments speeds. Such intermediaries may include quasi-governmental agencies such as FHLMC, FNMA and the Government National Mortgage Association (“GNMA”) which guarantees the payment of principal and interest to investors. Of the $82.2 million mortgage-backed security portfolio and $28.0 million CMO portfolio at December 31, 2014, approximately $34.1 million were originated through GNMA, approximately $67.9 million were originated through FNMA, and approximately $8.2 million were originated through FHLMC.
At December 31, 2014, the Company’s mortgage backed security portfolio included approximately $5.1 million in GNMA mortgages securities used in the construction of a hospital and approximately $24.6 million in other securities used to finance multi-family housing. Securities used to finance multi-family properties and other projects typically have longer dated amortization schedules, substantial prepayment penalties and balloon maturities due in five to ten years. These securities are desirable in low or declining rate markets in which prepayment speeds on single family mortgage securities speed up.
Mortgage-backed securities are typically issued with stated principal amounts and the securities are backed by pools of mortgages that have loans with interest rates that are within a range and have similar maturities. The underlying pool of mortgages can be composed of either fixed-rate or adjustable-rate mortgage loans. Mortgage-backed securities generally are referred to as mortgage participation certificates or pass-through certificates. As a result, the interest rate risk characteristics of the underlying pool of mortgages, i.e., fixed-rate or adjustable-rate, as well as prepayment risk, are passed on to the certificate holder. The life of a mortgage-backed pass-through security is equal to the life of the underlying mortgages. The actual maturity of a mortgage-backed security varies, depending on when the mortgagors prepay or repay the underlying mortgages. Prepayments of the underlying mortgages may shorten the life of the investment, thereby adversely affecting its yield to maturity and the related market value of the mortgage-backed security.
The yield on mortgage backed securities is based upon the interest income and the amortization of the premium or accretion of the discount related to the mortgage-backed security. Premiums and discounts on mortgage-backed securities are amortized or accreted over the estimated term of the securities using a level yield method. The prepayment assumptions used to determine the amortization period for premiums and discounts can significantly affect the yield of the mortgage-backed security, and these assumptions are reviewed periodically to reflect the actual prepayment. The actual prepayments of the underlying mortgages depend on many factors, including the type of mortgage, the coupon rate, the age of the mortgages, the geographical location of the underlying real estate collateralizing the mortgages and general levels of market interest rates. The difference between the interest rates on the underlying mortgages and the prevailing mortgage interest rates is an important determinant in the rate of prepayments. During periods of falling mortgage interest rates, prepayments generally increase, and, conversely, during periods of rising mortgage interest rates, prepayments generally decrease. If the coupon rate of the underlying mortgage significantly exceeds the prevailing market interest rates offered for mortgage loans, refinancing generally increases and accelerates the prepayment of the underlying mortgages. Prepayment experience is more difficult to estimate for adjustable-rate mortgage-backed securities.
At December 31, 2014, the Company owned $9.6 million in securities collateralized by federally insured student loans. These securities are floating rate and are indexed to one month libor and reset each quarter. The collateral provides approximately 97% guarantee of SLMA and current have a weighted average book value equal to 93.2% of par. Beginning January 1, 2015, Basel III places new and excessive risk weighting requirements on specific support bonds, including $3.9 million in bonds owned by the Company. The risk weightings on the $3.9 million in support bonds will increase from 20% to approximately 1250%, making it difficult to sell these bonds at current market prices.
23
The Company currently owns one corporate bond. The bond has a par value and market value of $2.0 million. The security was issued by General Electric Capital Corporation at three month libor plus 0.80% and matures in April 2020. The security is currently rated as investment grade. The Company currently owns a trust preferred security issued as a private placement by First Financial Services Corporation of Elizabethtown, Kentucky (“FFKY”). The security has a $2.0 million face value, a par value of $1.6 million and a market value of $1.5 million. On December 31, 2014, FFKY has deferred dividend payments on the security and the Company was not accruing interest. On January 1, 2015, FFKY was purchased by Community Bank Shares of Indiana (“CBIN”). CBIN terminated the interest extension for the securities by transferring funds to the debentures trustees to pay all interest payments due through March 15, 2015. See note 2 of the Audited Financial Statements for more information concerning this security.
Amortizing U.S. Agency securities owned by the Company are similar in structure to mortgage backed securities. The Company owns two types of amortizing agency securities, both of which are issued with the full faith and credit guarantee of the Small Business Administration (SBA). The Small Business Investment Corporation (SBIC) bonds include pools of SBA loans for business equipment with a ten year maturity. The Small Business Administration Participation Notes (SBAP) has a twenty year maturity and is secured by pools of commercial real estate loans guaranteed by the SBA. Both investments provide superior yields to mortgage backed securities with a credit rating equal to GNMA and superior to FHLMC and FNMA. Historically, the actual cash flows and prepayment speeds for SBIC and SBAP bonds are typically slower than similar maturities for mortgage backed securities due to the cost of refinancing SBA loans. At December 31, 2014, the Company owns $16.6 million in SBIC notes, $3.5 million in floating rate SBA pools and $62.8 million at SBAP notes. At December 31, 2014, the company owns $646,000 in an amortizing note issued by the FHLMC.
The following table sets forth the carrying value of the investment securities at the dates indicated.
| At December 31, | ||||||||||||
| 2014 | 2013 | 2012 | ||||||||||
| (In thousands) | ||||||||||||
| FHLB stock, restricted |
$ | 4,428 | 4,428 | 4,428 | ||||||||
| Securities available for sale: |
||||||||||||
| U.S. Treasury securities |
3,980 | — | — | |||||||||
| U.S. Agency securities, non-amortizing |
24,172 | 13,148 | 12,362 | |||||||||
| U.S. Agency securities, amortizing |
79,080 | 106,875 | 140,416 | |||||||||
| Mortage-backed securities |
110,167 | 103,813 | 114,295 | |||||||||
| Tax free municipal bonds |
61,047 | 65,459 | 74,047 | |||||||||
| Taxable municipal bonds |
12,043 | 18,057 | 13,736 | |||||||||
| Corporate bonds |
2,007 | 1,984 | — | |||||||||
| SLMA CMO |
9,643 | 8,085 | — | |||||||||
| Trust preferred security |
1,489 | 1,489 | 1,489 | |||||||||
|
|
|
|
|
|
|
|||||||
| Total investment securities |
$ | 308,056 | $ | 323,338 | 360,773 | |||||||
|
|
|
|
|
|
|
|||||||
The following table sets forth information on the scheduled maturities, amortized cost, market values and average yields for non-amortizing U.S. Government agency securities, corporate bonds and municipal securities in the investment portfolio at December 31, 2014. At such date, $11.2 million of the non-amortizing agency securities were callable and/or due on or before March 31, 2015, and $13.0 million were not callable. In addition, approximately $79.0 million in small business administration amortizing bonds require periodic principal payments. At December 31, 2014, $50.4 million of tax free municipals and $6.8 million of taxable all municipal securities were callable between January 2015 and February 2022. The average yield for the tax free municipal security portfolio is quoted as a taxable equivalent yield. The tax free bond maturing in 2015 provides a tax credit to the Bank and no additional interest income.
24
| One Year or Less | One to Five Years | Five to Ten Years | After Ten Years | Total Investment Portfolio | ||||||||||||||||||||||||||||||||||||||||
| Carrying Value |
Average Yield |
Carrying Value |
Average Yield |
Carrying Value |
Average Yield |
Carrying Value |
Average Yield |
Carrying Value |
Market Value |
Average Yield |
||||||||||||||||||||||||||||||||||
| . | (Dollars in thousands) | |||||||||||||||||||||||||||||||||||||||||||
| Non-amortizing U.S. agency securities |
$ | — | —% | $ | 10,998 | 1.72% | $ | 13,820 | 2.25% | $ | — | n/a | $ | 24,818 | $ | 24,818 | 2.02% | |||||||||||||||||||||||||||
|
|
|
|
|
|
|
|
|
|
|
|
|
|
|
|
|
|
|
|
|
|
|
|||||||||||||||||||||||
| Taxable municipal bonds |
$ | — | —% | $ | 500 | 3.62% | $ | 6,336 | 3.53% | $ | 5,207 | 3.09% | $ | 12,043 | $ | 12,043 | 3.34% | |||||||||||||||||||||||||||
|
|
|
|
|
|
|
|
|
|
|
|
|
|
|
|
|
|
|
|
|
|
|
|||||||||||||||||||||||
| Tax free municipal bonds |
$ | 4,927 | —% | $ | 6,340 | 4.06% | $ | 21,096 | 4.87% | $ | 28,684 | 5.79% | $ | 61,047 | $ | 61,047 | 5.03% | |||||||||||||||||||||||||||
|
|
|
|
|
|
|
|
|
|
|
|
|
|
|
|
|
|
|
|
|
|
|
|||||||||||||||||||||||
| Trust preferred |
— | — | — | — | — | — | $ | 1,489 | n/a | $ | 1,489 | $ | 1,489 | n/a | ||||||||||||||||||||||||||||||
|
|
|
|
|
|
|
|
|
|
|
|
|
|
|
|
|
|
|
|
|
|
|
|||||||||||||||||||||||
| Corporate bonds |
— | — | — | — | $ | 2,007 | 1.04% | — | n/a | $ | 2,007 | $ | 2,007 | 1.04% | ||||||||||||||||||||||||||||||
|
|
|
|
|
|
|
|
|
|
|
|
|
|
|
|
|
|
|
|
|
|
|
|||||||||||||||||||||||
| U.S. Treasury bonds |
— | — | $ | 3,980 | 0.91% | — | n/a | — | n/a | $ | 3,980 | $ | 3,980 | 0.91% | ||||||||||||||||||||||||||||||
|
|
|
|
|
|
|
|
|
|
|
|
|
|
|
|
|
|
|
|
|
|
|
|||||||||||||||||||||||
Deposit Activity and Other Sources of Funds
General. Deposits are the primary source of the Bank’s funds for lending, investment activities and general operational purposes. In addition to deposits, the Bank derives funds from loan principal and interest repayments, maturities of investment securities and mortgage-backed securities and interest payments thereon. Although scheduled loan repayments are a relatively stable source of funds, deposit inflows and outflows are significantly influenced by general interest rates and money market conditions. Borrowings may be used on a short-term basis to compensate for reductions in the availability of funds, or on a longer term basis for general corporate purposes. The Bank has access to borrow from the FHLB of Cincinnati. The Bank may rely upon retail deposits rather than borrowings as its primary source of funding for future asset growth.
In 2014 and 2013, weak loan demand and high levels of liquidity have made it difficult to maintain a desirable level of profitability. Therefore, management is placing an emphasis on reducing the Bank’s cost of funds ratio. The reduction in cost of funds will be accomplished by changing the deposit mix and overall funding mix of the Bank. First, we continue to place a strong marketing emphasis on non-interest bearing checking accounts. In both 2014 and 2013, we opened more than 4,000 non-interest checking accounts and saw the average balance of non-interest checking accounts increase by $12.5 million and $8.1 million, respectively, for the years ended December 31, 2014 and December 31, 2013, respectively. While growing transaction accounts, we have successfully reduced our interest expense for time deposits. This reduction was accomplished by allowing higher costing deposits to re-price to lower levels or leave the Bank. At December 31, 2014, total time deposits were $331.9 million, a decline of $50.1 million and $105.2 million as compared to December 31, 2013, and December 31, 2012, respectively.
Deposits. The Bank attracts deposits principally from within its market area by offering competitive rates on its deposit instruments, including money market accounts, passbook savings accounts, individual retirement accounts, and certificates of deposit which range in maturity from three months to five years. Deposit terms vary according to the minimum balance required and the length of time the funds must remain on deposit and the interest rate. Maturities, terms, service fees and withdrawal penalties for its deposit accounts are established by the Bank on a periodic basis. The Bank reviews its deposit mix and pricing on a weekly basis. In determining the characteristics of its deposit accounts, the Bank considers the rates offered by competing institutions, lending and liquidity requirements, growth goals and federal regulations.
The Bank has, on a limited basis, utilized brokered deposits to augment its funding requirements. At December 31, 2014, the Bank had $37.1 million in brokered deposits as compared to $46.3 million at December 31, 2013. Given the high level of liquidity maintained by the Bank, it is our current practice to not replace the majority of brokered time deposits once they mature or, where applicable, the Bank tenders a call on the deposit. All brokered deposits are FDIC insured.
25
The Bank attempts to compete for deposits with other institutions in its market area by offering competitively priced deposit instruments that are tailored to the needs of its customers. Additionally, the Bank seeks to meet customers’ needs by providing convenient customer service to the community. With the exception of brokered deposits, substantially all of the Bank’s depositors are Kentucky or Tennessee residents who reside in the Bank’s market area.
Deposits in the Bank at December 31, 2014, were represented by the various types of deposit programs described below.
| Interest |
Minimum Term |
Category |
Minimum |
Balance |
Percentage |
|||||||||||
| (In thousands) | ||||||||||||||||
| — % |
None | Non-interest bearing | $ | 100 | $ | 115,051 | 15.7 | % | ||||||||
| 0.05%* |
None | Interest checking accounts | 1,500 | 186,616 | 25.5 | % | ||||||||||
| 0.10% |
None | Savings & money market | 10 | 97,726 | 13.4 | % | ||||||||||
|
|
|
|
|
|||||||||||||
| 399,393 | 54.6 | % | ||||||||||||||
| Certificates of Deposit |
|
|
|
|||||||||||||
| 0.12% |
3 months or less | Fixed-term, fixed rate | 1,000 | 41,241 | 5.6 | % | ||||||||||
| 0.22% |
3 to 12 months | Fixed-term, fixed-rate | 1,000 | 98,467 | 13.5 | % | ||||||||||
| 0.44% |
12 to 24-months | Fixed-term, fixed-rate | 1,000 | 137,147 | 18.8 | % | ||||||||||
| 0.97% |
24 to 36-months | Fixed-term, fixed-rate | 1,000 | 32,175 | 4.4 | % | ||||||||||
| 0.85% |
36 to 48-months | Fixed-term, fixed-rate | 1,000 | 15,299 | 2.1 | % | ||||||||||
| 1.10% |
48 to 60-months | Fixed-term, fixed rate | 1,000 | 7,586 | 1.0 | % | ||||||||||
|
|
|
|
|
|||||||||||||
| 331,915 | 45.4 | % | ||||||||||||||
|
|
|
|
|
|||||||||||||
| $ | 731,308 | 100. 0 | % | |||||||||||||
|
|
|
|
|
|||||||||||||
| * | Represents current interest rate offered by the Bank. |
The following table sets forth, for the periods indicated, the average balances and interest rates based on month-end balances for interest-bearing demand deposits and time deposits.
| Year Ended December 31, | ||||||||||||||||||||||||
| 2014 | 2013 | 2012 | ||||||||||||||||||||||
| Interest-bearing demand deposits |
Time deposits |
Interest-bearing demand deposits |
Time deposits |
Interest-bearing demand deposits |
Time deposits |
|||||||||||||||||||
| (Dollars in thousands) | ||||||||||||||||||||||||
| Average Balance |
$ | 284,607 | $ | 356,069 | $ | 250,895 | $ | 407,000 | $ | 219,747 | $ | 486,647 | ||||||||||||
| Average Rate |
0.51 | % | 1.16 | % | 0.56 | % | 1.41 | % | 0.60 | % | 1.90 | % | ||||||||||||
26
The following table sets forth the change in dollar amount of deposits in the various types of accounts offered by the Bank between the dates indicated.
| Balance at December 31, 2014 |
% of Deposits |
Increase (Decrease) from December 31, 2013 |
Balance at December 31, 2013 |
% of Deposits |
Increase (Decrease) from December 31, 2012 |
|||||||||||||||||||
| (Dollars in thousands) | ||||||||||||||||||||||||
| Non-interest bearing |
$ | 115,051 | 15.7 | % | $ | 9,799 | $ | 105,252 | 13.8 | % | $ | 11,169 | ||||||||||||
| Interest checking |
186,616 | 25.5 | % | 2,973 | 183,643 | 24.1 | % | 36,596 | ||||||||||||||||
| Savings & MMDA |
97,726 | 13.4 | % | 5,620 | 92,106 | 12.0 | % | 10,463 | ||||||||||||||||
| Time deposits |
331,915 | 45.4 | % | (50,081 | ) | 381,996 | 50.1 | % | (55,096 | ) | ||||||||||||||
|
|
|
|
|
|
|
|
|
|
|
|
|
|||||||||||||
| Total |
$ | 731,308 | 100.0 | % | $ | (31,689 | ) | $ | 762,997 | 100.0 | % | $ | 3,132 | |||||||||||
|
|
|
|
|
|
|
|
|
|
|
|
|
|||||||||||||
| Balance at December 31, 2012 |
% of Deposits |
Increase (Decrease) from December 31, 2011 |
Balance at December 31, 2011 |
% of Deposits |
||||||||||||||||
| (Dollars in thousands) | ||||||||||||||||||||
| Non-interest bearing |
$ | 94,083 | 12.4 | % | $ | 14,533 | $ | 79,550 | 9.9 | % | ||||||||||
| Interest checking |
147,047 | 19.4 | % | 16,933 | 130,114 | 16.3 | % | |||||||||||||
| Savings & MMDA. |
81,643 | 10.7 | % | 11,200 | 70,443 | 8.8 | % | |||||||||||||
| Time deposits |
437,092 | 57.5 | % | (82,896 | ) | 519,988 | 65.0 | % | ||||||||||||
|
|
|
|
|
|
|
|
|
|
|
|||||||||||
| Total |
$ | 759,865 | 100.0 | % | $ | (40,230 | ) | $ | 800,095 | 100.0 | % | |||||||||
|
|
|
|
|
|
|
|
|
|
|
|||||||||||
The following table sets forth the time deposits in the Bank classified by rates at the dates indicated.
| At December 31, | ||||||||||||
| 2014 | 2013 | 2012 | ||||||||||
| (In thousands) | ||||||||||||
| 0.01 - 2.00% |
$ | 252,416 | $ | 292,992 | $ | 276,231 | ||||||
| 2.01 - 4.00% |
79,408 | 89,002 | 159,664 | |||||||||
| 4.01 - 6.00% |
91 | 2 | 1,197 | |||||||||
|
|
|
|
|
|
|
|||||||
| Total |
$ | 331,915 | $ | 381,996 | $ | 437,092 | ||||||
|
|
|
|
|
|
|
|||||||
The following table sets forth the amount and maturities of time deposits at December 31, 2014.
| Amount Due | ||||||||||||||||||||
| Less Than One Year | 1-2 Years | 2-3 Years | After 3 Years | Total | ||||||||||||||||
| (In thousands) | ||||||||||||||||||||
| 0.00 - 2.00% |
$ | 121,683 | $ | 75,764 | 32,175 | $ | 22,794 | $ | 252,416 | |||||||||||
| 2.01 - 4.00% |
18,025 | 61,383 | — | — | 79,408 | |||||||||||||||
| 4.01 - 6.00% |
— | — | — | 91 | 91 | |||||||||||||||
|
|
|
|
|
|
|
|
|
|
|
|||||||||||
| Total |
$ | 139,708 | $ | 137,147 | $ | 32,175 | $ | 22,885 | $ | 331,915 | ||||||||||
|
|
|
|
|
|
|
|
|
|
|
|||||||||||
27
The following table indicates the amount of the Bank’s certificates of deposit of $100,000 or more by time remaining until maturity as of December 31, 2014.
| Maturity Period |
Certificates of Deposit | |||
| (In millions) | ||||
| Three months or less |
$ | 23,258 | ||
| Over three through six months |
10,571 | |||
| Over six through 12 months |
36,191 | |||
| Over 12 months |
99,313 | |||
|
|
|
|||
| Total |
$ | 169,333 | ||
|
|
|
|||
Certificates of deposit at December 31, 2014, included approximately $169.3 million of deposits with balances of $100,000 or more, compared to $200.2 million and $222.0 million at December 31, 2013, and December 31, 2012, respectively. Such time deposits may be risky because their continued presence in the Bank is dependent partially upon the rates paid by the Bank rather than any customer relationship and, therefore, may be withdrawn upon maturity if another institution offers higher interest rates. The Bank may be required to resort to other funding sources such as borrowings or sales of its securities available for sale if the Bank believes that increasing its rates to maintain such deposits would adversely affect its operating results. At this time, the Bank does not believe that it will need to significantly increase its deposit rates to maintain such certificates of deposit and, therefore, does not anticipate resorting to alternative funding sources. See Note 6 of Notes to Consolidated Financial Statements.
The following table sets forth the deposit activities of the Bank for the periods indicated.
| Year Ended December 31, | ||||||||||||
| 2014 | 2013 | 2012 | ||||||||||
| (In thousands) | ||||||||||||
| Deposits |
$ | 155,837 | $ | 180,643 | $ | 174,825 | ||||||
| Withdrawals |
(191,863 | ) | (181,235 | ) | (222,546 | ) | ||||||
|
|
|
|
|
|
|
|||||||
| Net increase (decrease) before interest credited |
(36,026 | ) | (592 | ) | (47,721 | ) | ||||||
| Interest credited |
4,337 | 3,724 | 7,491 | |||||||||
|
|
|
|
|
|
|
|||||||
| Net increase (decrease) in deposits |
($ | 31,689 | ) | $ | 3,132 | $ | (40,230 | ) | ||||
|
|
|
|
|
|
|
|||||||
Borrowings. Savings deposits historically have been the primary source of funds for the Bank’s lending, investments and general operating activities. The Bank is authorized, however, to use advances from the FHLB of Cincinnati to supplement its supply of lendable funds and to meet deposit withdrawal requirements. The FHLB of Cincinnati functions as a central reserve bank providing credit for savings institutions and certain other member financial institutions.
As a member of the FHLB System, the Bank is required to own stock in the FHLB of Cincinnati and is authorized to apply for advances. Advances are pursuant to several different programs, each of which has its own interest rate and range of maturities. The Bank has entered into a Cash Management Advance program with FHLB. See Note 7 of Notes to Consolidated Financial Statements. Advances from the FHLB of Cincinnati were $34.0 million at December 31, 2014, and are secured by a blanket security agreement in which the Bank has pledged its 1-4 family first mortgage loans held in the Bank’s loan portfolio. On December 30, 2014, the Company prepaid $35.9 million in FHLB advances and incurred a prepayment penalty of $2.5 million. To assist in the funding of this prepayment, the Company borrowed $15.0 million with a maturity of one month and $15.0 million with a maturity of six months.
On September 25, 2003, the Company issued $10,310,000 in floating rate junior subordinated debentures with a thirty year maturity and callable at the Company’s discretion quarterly after September 25, 2008. The subordinated debentures are priced at a variable rate equal to the three month Libor (London Inter Bank Offering Rate) plus 3.10%. At December 31, 2014, the three-month Libor rate was 0.25%. The securities are immediately callable in the event of a change in tax or accounting law that has a significant negative impact to issuing these securities.
28
For regulatory purposes, subordinated debentures may be treated as Tier I capital. Federal regulations limit the use of subordinated debentures to 25% of total Tier I capital. Discussions among regulatory agencies are underway that may limit the current and future use of subordinated debentures as Tier I capital. The Company’s decision to issue subordinated debentures was in part influenced by potential regulatory actions in the future. The Company anticipates above average growth to continue and anticipates a time in the future when capital ratios are lower and additional capital may be need.
In October of 2008, the Bank entered into an interest rate swap agreement. The agreement calls for the Bank to pay a fixed rate of 7.27% until October 8, 2015, on $10 million and receive payment equal to the three month libor plus 3.10%. The Bank then completed an intercompany transaction that transferred the swap to the Company, providing an effective hedge for its variable rate subordinated debentures. At December 31, 2014, the cost to the Bank to terminate the swap is approximately $390,000.
Repurchase Agreements
The Company offers cash management customers an automated sweep account of excess funds from checking accounts into repurchase accounts. Prior to 2011, this product was the preferred method to provide commercial deposit customers the opportunity to earn interest income on demand deposit accounts. Repurchase balances are overnight borrowings from customers and are not FDIC insured but are fully collateralized by specific securities in the Company’s investment portfolio. In addition to customer repurchase agreements, the Company has two long term repurchase agreements with large money center banks that are secured by individual investment securities. At December 31, 2014, the Company’s retail repurchase agreements total $51.4 million. In addition, the Company has one term repurchase agreement. The Company has a $6.0 million term repurchase agreement with an interest rate of 4.36% maturing on September 18, 2016.
Subsidiary Activities
The Bank owns JBMM, LLC, a wholly owned, limited liability company, owns and manages the Bank’s other real estate and other assets owned. The Bank owns Heritage Interim Corporation, a Tennessee corporation established to facilitate the acquisition of a bank in Tennessee. The proposed acquisition was terminated in August of 2013. The Bank owns Heritage USA Title, LLC, which sells title insurance to the Bank’s real estate loan customers.
The Bank owns Fort Webb LLLP, LLC, , which owns a limited partnership interest in Fort Webb LLLP, a low income senior citizen housing facility in Bowling Green, Kentucky. The facility offers apartments for rent for those senior citizens who qualify and is managed by the Bowling Green, Kentucky Housing Authority. The Company receives tax credits and Community Reinvestment Credits for its $420,000 investment.
Federal Taxation
The Company and the Bank file a consolidated federal income tax return on a calendar year basis. The Company is subject to the federal tax laws and regulations that apply to corporations generally.
Kentucky Taxation
Kentucky corporations, such as HopFed Bancorp, Inc., are subject to the Kentucky corporation income tax and the Kentucky corporation license (‘franchise”) tax. The income tax is imposed based on the following rates: 4% of the first $50,000 of net taxable income allocated or apportioned to Kentucky; 5% of the next $50,000; and 6% of taxable net income over $100,000. All dividend income received by a corporation is excluded for purposes of arriving at taxable net income.
Tennessee Taxation
The Company and all subsidiaries are subject to Tennessee Franchise and Excise tax on apportioned capital and apportioned income.
29
Heritage Bank USA, Inc.
State chartered banks are not subject to the Kentucky corporation tax.
The Commonwealth of Kentucky imposes both a “Kentucky Bank Franchise Tax” and “Local Deposits Franchise Tax”. The Kentucky Bank Franchise Tax is an annual tax equal to 1.1% of net capital after apportionment, if applicable. The value of the net capital is calculated annually by deducting from total capital an amount equal to the same percentage of total as the book value of Unites States obligations bears to the book value of the total assets of the financial institution. Heritage Bank USA Inc., as a financial institution, is exempt from both corporate income and license taxes.
Competition
The Bank faces significant competition both in originating mortgage and other loans and in attracting deposits. The Bank competes for loans principally on the basis of interest rates, the types of loans it originates, the deposit products it offers and the quality of services it provides to borrowers. The Bank also competes by offering products which are tailored to the local community. Its competition in originating real estate loans comes primarily from other savings institutions, commercial banks and mortgage bankers making loans secured by real estate located in the Bank’s market area. Commercial banks, credit unions and finance companies provide vigorous competition in consumer lending. Competition may increase as a result of the continuing reduction of restrictions on the interstate operations of financial institutions.
At June 30, 2014, the Bank had a 13.1% share of the deposit market in its combined markets. The Bank’s most significant competition across its entire market area was Planters Bank of Kentucky with a 9.4% deposit market share, Community Financial Services Bank with a 8.6% deposit market share, U.S. Bank N/A with a 8.3% market share, and Branch Bank & Trust of North Carolina with an 7.9% deposit market share and Regions Bank of Birmingham, Alabama with a 7.1% deposit market share. In addition, each market contains other community banks that provide competitive products and services within individual markets.
The Bank attracts its deposits through its eighteen offices primarily from the local community. Consequently, competition for deposits is principally from other savings institutions, commercial banks and brokers in the local community as well as from credit unions. The Bank competes for deposits and loans by offering what it believes to be a variety of deposit accounts at competitive rates, convenient business hours, a commitment to outstanding customer service and a well-trained staff. The Bank believes it has developed strong relationships with local realtors and the community in general.
The Bank is a community and retail-oriented financial institution. Management considers the Bank’s branch network and reputation for financial strength and quality customer service as its major competitive advantage in attracting and retaining customers in its market area. A number of the Bank’s competitors have been acquired by statewide/nationwide banking organizations. While the Bank is subject to competition from other financial institutions which may have greater financial and marketing resources, management believes the Bank benefits by its community orientation and its long-standing relationship with many of its customers.
Employees
As of December 31, 2014, the Company and the Bank had 262 full-time equivalent employees, none of whom were represented by a collective bargaining agreement. Management considers the Bank’s relationships with its employees to be good.
30
Executive Officers of the Registrant
John E. Peck. Mr. Peck has served as President and Chief Executive Officer of both the Company and the Bank since July 2000. Prior to that, Mr. Peck was President and Chief Executive Officer of United Commonwealth Bank and President of Firstar Bank-Calloway County. Mr. Peck was a past Board Member and Chairman of the Christian County Chamber of Commerce, Jennie Stuart Hospital and Murray-Calloway County Hospital. Mr. Peck holds a Bachelor of Science of Business Administration with a concentration in Finance from the University of Louisville. Mr. Peck is a graduate of the Louisiana State University School of Banking. Mr. Peck is a member and serves on the finance committee of the First Baptist Church of Hopkinsville.
Michael L. Woolfolk. Mr. Woolfolk has served as Executive Vice President and Chief Operations Officer of the Bank since August 2000. Mr. Woolfolk was appointed to the Board of Directors of the Company on August 15, 2012. Prior to that, he was President of First-Star Bank-Marshall County, President and Chief Executive Officer of Bank of Marshall County and President of Mercantile Bank. Mr. Woolfolk is a member of First Baptist Church of Hopkinsville.
Billy C. Duvall. Mr. Duvall has served as Senior Vice President, Chief Financial Officer and Treasurer of the Company and the Bank since June 1, 2001. Prior to that, he was an Auditor with Rayburn, Betts & Bates, P.C., independent public accountants and nine years as a Principal Examiner with the National Credit Union Administration. Mr. Duvall holds a Bachelor of Business Administration from Austin Peay State University in Accounting and Finance. Mr. Duvall is a Certified Public Accountant of Virginia. Mr. Duvall is the past Board Chairman for the Pennyroyal Mental Health Center, a member of the Hopkinsville Kiwanis club, and a member of Southside Church of Christ in Hopkinsville.
P. Michael Foley. Mr. Foley was hired in December 2011 to serve as Senior Vice President, Chief Credit Officer of the Bank. Prior to that, from January 2011 to December 2011, he served as Senior Vice President, Senior Credit Officer in the Special Assets Group of Old National Bank of Evansville, Indiana. From July 2006 through December 2010, Mr. Foley served as Senior Vice President, Senior Credit Officer and Chicago Market Manager for Integra Bank of Evansville, Indiana.
Keith Bennett. Mr. Bennett has served as Montgomery County, Tennessee Market President for the Bank since November 2005. Prior to that, Mr. Bennett was Vice President of Commercial Lending for Farmers and Merchants Bank and First Federal Savings and Loan, both of Clarksville, Tennessee. Mr. Bennett served seven years as a field examiner with the Office of Thrift Supervision. Mr. Bennett holds a Bachelor of Business Administration in Accounting from the University of Tennessee at Martin.
Seasonality of Revenues and Expenses
The Company’s business is not materially affected by seasonality fluctuations in our business cycle. The Company’s financial health is substantially affected by the overall business cycle and market interest rates.
Supervision and Regulation
General. The Company is a bank holding company registered with the Board of Governors of the FRB System (the “FRB”). We are subject to examination and supervision by the FRB pursuant to the Bank Holding Company Act of 1956, as amended (the “BHCA”), and are required to file reports and other information regarding our business operations and the business operations of our subsidiaries with the FRB.
In general, the BHCA and the FRB’s regulations limit the nonbanking activities permissible for bank holding companies to those activities that the FRB has determined to be so closely related to banking or managing or controlling banks to be a proper incident thereto. A bank holding company that elects to be treated as a financial holding company, however, may engage in, and acquire companies engaged in, activities that are considered “financial in nature,” as defined by the Gramm-Leach-Bliley Act and FRB regulations. These activities include, among other things, securities underwriting, dealing and market-making, sponsoring mutual funds and investment companies, insurance underwriting and agency activities, and merchant banking.
31
A bank holding company is required to serve as a source of financial and managerial strength to its subsidiary banks and may not conduct its operations in an unsafe or unsound manner. In addition, it is the policy of the FRB that a bank holding company should stand ready to use available resources to provide adequate capital to its subsidiary banks during periods of financial stress or adversity and should maintain the financial flexibility and capital-raising capacity to obtain additional resources for assisting its subsidiary banks. A bank holding company’s failure to meet its obligations to serve as a source of strength to its subsidiary banks will generally be considered by the FRB to be an unsafe and unsound banking practice or a violation of the FRB regulations, or both.
As a Kentucky-chartered commercial bank, the Bank is subject to regulation, supervision and examination by the Kentucky Department of Financial Institutions (“KDFI”) and by the Federal Deposit Insurance Corporation (“FDIC”), which insures its deposits to the maximum extent permitted by law. The federal and state laws and regulations applicable to banks regulate, among other things, the scope of their business, their investments, the reserves required to be kept against deposits, the timing of the availability of deposited funds and the nature and amount of and collateral for certain loans. The laws and regulations governing the Bank generally have been promulgated to protect depositors and not for the purpose of protecting stockholders. This regulatory structure also gives the federal and state banking agencies extensive discretion in connection with their supervisory and enforcement activities and examination policies, including policies with respect to the classification of assets and the establishment of adequate loan loss reserves for regulatory purposes. Any change in such regulation, whether by the KDFI, the FDIC or the United States Congress, could have a material impact on the Company, the Bank and their operations.
Dodd-Frank Wall Street Reform and Consumer Protection Act. The Dodd-Frank Wall Street Reform and Consumer Protection Act (the “Dodd-Frank Act”), enacted in 2010, extensively restructured financial institution regulation in the United States, including through the creation of a new resolution authority, mandating higher capital and liquidity requirements, requiring banks to pay increased fees to regulatory agencies, and through numerous other provisions intended to strengthen the financial services sector. The implications of the Dodd-Frank Act for the Company’s businesses will depend to a large extent on the manner in which rules adopted pursuant to the Dodd-Frank Act are implemented by the primary U.S. financial regulatory agencies as well as potential changes in market practices and structures in response to the requirements of the Dodd-Frank Act and financial reforms in other jurisdictions.
The Dodd-Frank Act established the Consumer Financial Protection Bureau, or CFPB, and granted it broad rulemaking, supervisory and enforcement powers under a broad range of federal consumer financial protection laws. The CFPB has examination and primary enforcement authority with respect to depository institutions with $10 billion or more in assets. Smaller institutions will be subject to rules promulgated by the CFPB but are examined and supervised by federal banking regulators for consumer compliance purposes. The CFPB also has the authority to seek to uncover unfair, deceptive or abusive practices in connection with the offering of consumer financial products. The Dodd-Frank Act authorizes the CFPB to establish certain minimum standards for the origination of residential mortgages including a determination of the borrower’s ability to repay. In addition, the Dodd-Frank Act allows borrowers to raise certain defenses to foreclosure if they receive any loan other than a “qualified mortgage” as defined by the CFPB. The Dodd-Frank Act permits states to adopt consumer protection laws and standards that are more stringent than those adopted at the federal level and, in certain circumstances, permits state attorneys general to enforce compliance with both the state and federal laws and regulations.
The Dodd-Frank Act also established the Financial Stability Oversight Council, which has oversight authority for monitoring and regulating systemic risk. In addition, the Dodd-Frank Act altered the authority and duties of the federal banking and securities regulatory agencies, implemented certain corporate governance requirements for all public companies, including financial institutions, with regard to executive compensation, proxy access by shareholders, and certain whistleblower provisions, and restricted certain proprietary trading and hedge fund and private equity activities of banks and their affiliates.
New laws or regulations or changes to existing laws and regulations (including changes in interpretation or enforcement) could materially adversely affect our financial condition or results of operations. Many aspects of the Dodd-Frank Act are subject to further rule making and will take effect over several years. The overall financial impact on us and our subsidiaries or the financial services industry generally cannot be anticipated at this time.
32
Holding Company Capital Requirements. The FRB has adopted capital adequacy guidelines pursuant to which it assesses the adequacy of capital in examining and supervising a bank holding company and in analyzing applications to it under the BHCA. The FRB’s capital adequacy guidelines are similar to those imposed on the Bank by the FDIC. See “-Bank Capital Requirements.”
The FRB has adopted a policy statement that generally exempts bank holding companies with less than $500 million in consolidated assets from its regulatory capital requirements. As long as their bank subsidiaries are well capitalized, such bank holding companies need only maintain a pro forma debt to equity ratio of less than 1.0 in order to pay dividends and repurchase stock and to be eligible for expedited treatment on applications. In December 2014, federal legislation was enacted that requires the FRB to revise this policy statement to exempt bank holding companies having less than $1 billion of consolidated assets from its holding company capital requirements, provided that such companies are not engaged in significant nonbanking activities, do not conduct significant off-balance sheet activities and do not have a material amount of debt or equity securities outstanding that are registered with the SEC. The FRB has issued a proposed amendment to its policy statement to implement the recent legislation’s increase in the size threshold for qualification for the small holding company exemption. Although our asset size would qualify for the exemption provided by the amended policy statement, we believe that the Company will remain subject to consolidated regulatory capital requirements because its equity securities are registered with the SEC.
Bank Capital Requirements. The FDIC has promulgated capital adequacy requirements for state-chartered banks that, like the Bank, are not members of the Federal Reserve System. Through December 31, 2014, the FDIC’s capital adequacy regulations required the Bank to meet three minimum capital standards: (1) tangible capital equal to 1.5% of total adjusted assets, (2) “Tier 1” or “core” capital equal to at least 4% (3% if the institution had received the highest possible rating on its most recent examination) of total adjusted assets, and (3) total capital equal to 8% of total risk-weighted assets. Tangible capital is defined as core capital less all intangible assets except for certain mortgage servicing rights. Tier 1 or core capital is defined as common stockholders’ equity, non-cumulative perpetual preferred stock and related surplus, minority interests in the equity accounts of consolidated subsidiaries, and certain non-withdrawable accounts and pledged deposits of mutual banks. Total capital consists of Tier 1 capital plus Tier 2 or supplementary capital items, which include allowances for loan losses in an amount of up to 1.25% of risk-weighted assets, cumulative preferred stock, subordinated debentures and certain other capital instruments, and a portion of the net unrealized gain on equity securities. An institution’s risk-based capital requirement is measured against risk-weighted assets, which equal the sum of each on-balance-sheet asset and the credit-equivalent amount of each off-balance-sheet item after being multiplied by an assigned risk weight. The risk weights imposed by the regulations effective through December 31, 2014 ranged from 0% for cash to 100% for delinquent loans, property acquired through foreclosure, commercial loans, and certain other assets.
In July 2013, the federal bank regulatory agencies issued a final rule to revise the risk-based and leverage capital requirements and the method for calculating risk-weighted assets, to conform them to the international regulatory standards agreed to by the Basel Committee on Banking Supervision in the accord often referred to as “Basel III”. The final Basel III rule applies to all depository institutions, top-tier bank holding companies with total consolidated assets of $500 million or more and top-tier savings and loan holding companies (“banking organizations”). The final rule became effective for the Bank and the Company on January 1, 2015.
Among other things, the final Basel III capital rule establishes a new common equity Tier 1 (or CET1) capital requirement (4.5% of risk-weighted assets), sets the minimum leverage ratio for all banking organizations at a uniform 4% of total assets, increases the minimum Tier 1 capital to risk-based assets requirement (from 4% to 6% of risk-weighted assets) and assigns a higher risk weight (150%) to exposures that are more than 90 days past due or are on nonaccrual status and to certain commercial real estate facilities that finance the acquisition, development or construction of real property. The final rule also requires unrealized gains and losses on certain “available-for-sale” securities holdings to be included for purposes of calculating regulatory capital requirements unless a one-time opt out is exercised, establishes new limitations on the inclusion in regulatory capital of deferred tax assets and mortgage servicing rights, and expands the recognition of collateral and guarantors in determining risk-weighted assets.
In addition to higher capital requirements, the Basel III capital rule requires banking organizations to maintain a capital conservation buffer of at least 2.5% of risk-weighted assets over and above the minimum risk-based capital requirements. Institutions that do not maintain the required capital buffer will become subject to progressively more stringent limitations on the percentage of earnings that can be paid out in dividends or used for stock repurchases and on the payment of discretionary bonuses to senior executive management. The capital buffer requirement will be phased in over four years beginning January 1, 2016. The fully phased-in capital buffer requirement will effectively raise the minimum required risk-based capital ratios to 7% CET1 capital, 8.5% Tier 1 capital and 10.5% total capital on a fully phased-in basis.
33
Prompt Corrective Action. Under applicable federal statute, the federal bank regulatory agencies are required to take “prompt corrective action” with respect to institutions that do not meet specified minimum capital requirements. For these purposes, the law establishes five capital categories: well capitalized, adequately capitalized, undercapitalized, significantly undercapitalized and critically undercapitalized. Under the FDIC’s prompt corrective action regulations in effect through December 31, 2014, an institution was deemed to be “well capitalized” if it had a total risk-based capital ratio of 10.0% or greater, a Tier 1 risk-based capital ratio of 6.0% or greater and a leverage ratio of 5.0% or greater. An institution was “adequately capitalized” if it had a total risk-based capital ratio of 8.0% or greater, a Tier 1 risk-based capital ratio of 4.0% or greater, and generally a leverage ratio of 4.0% or greater. An institution was “undercapitalized” if it had a total risk-based capital ratio of less than 8.0%, a Tier 1 risk-based capital ratio of less than 4.0%, or generally a leverage ratio of less than 4.0%. An institution was deemed to be “significantly undercapitalized” if it had a total risk-based capital ratio of less than 6.0%, a Tier 1 risk-based capital ratio of less than 3.0%, or a leverage ratio of less than 3.0%. An institution was considered to be “critically undercapitalized” if it had a ratio of tangible equity (as defined in the regulations) to total assets that is equal to or less than 2.0%.
The prompt corrective action regulations provide for the imposition of a variety of requirements and limitations on institutions that fail to meet the above capital requirements. In particular, the FDIC may require any savings institution that is not “adequately capitalized” to take certain action to increase its capital ratios. If the savings institution’s capital is significantly below the minimum required levels of capital or if it is unsuccessful in increasing its capital ratios, the institution’s activities may be restricted.
The final Basel III capital rule adjusted the prompt corrective action categories effective January 1, 2015. As amended, the prompt corrective action rules incorporate a CET1 capital requirement and increase the requirements for certain capital categories. In order to be adequately capitalized for purposes of the prompt corrective action rules, a banking organization is now required to have at least an 8% total risk-based capital ratio, a 6% Tier 1 risk-based capital ratio, a 4.5% CET1 risk-based capital ratio and a 4% Tier 1 leverage ratio. To be well-capitalized, a banking organization is required to have at least a 10% total risk-based capital ratio, an 8% Tier 1 risk-based capital ratio, a 6.5% CET1 risk-based capital ratio and a 5% Tier 1 leverage ratio.
Deposit Insurance. The Bank’s deposits are insured to applicable limits by the FDIC. Under the Dodd-Frank Act, the maximum deposit insurance amount has been permanently increased from $100,000 to $250,000. The Dodd-Frank Act increased the minimum target Deposit Insurance Fund ratio from 1.15% of estimated insured deposits to 1.35% of estimated insured deposits. The FDIC must seek to achieve the 1.35% ratio by June 30, 2020. It is intended that insured institutions with assets of $10 billion or more will fund the increase.
The FDIC has adopted a risk-based premium system that provides for quarterly assessments. Assessments are based on an insured institution’s classification among four risk categories determined from their examination ratings and capital and other financial ratios. The institution is assigned to a category and the category determines its assessment rate, subject to certain specified risk adjustments. Insured institutions deemed to pose less risk to the deposit insurance fund pay lower assessments, while greater risk institutions pay higher assessments. In February 2011, the FDIC published a final rule under the Dodd-Frank Act to reform the deposit insurance assessment system. Under such final rule, assessments are based on an institution’s average consolidated total assets minus average tangible equity instead of deposits, which was the FDIC’s prior practice. The rule revised the assessment rate schedule to establish assessments ranging from 2.5 to 45 basis points, based on an institution’s risk classification and possible risk adjustments.
The FDIC has authority to increase insurance assessments. Any significant increases would have an adverse effect on the operating expenses and results of operations of the Bank. Management cannot predict what assessment rates will be in the future.
34
Ratio of Earnings to Fixed Charges.
The table below is a Company’s computation of earnings to fixed charges for the years ended December 31, 2014, through December 31, 2011 (All dollars in thousands).
| 2014 | 2013 | 2012 | 2011 | |||||||||||||
| Including interest on deposits |
|
|||||||||||||||
| Earnings |
||||||||||||||||
| Pre-tax income |
$ | 1,998 | $ | 4,406 | $ | 4,886 | $ | 3,404 | ||||||||
| Add: fixed charges from below |
8,879 | 10,581 | 14,877 | 18,415 | ||||||||||||
|
|
|
|
|
|
|
|
|
|||||||||
| $ | 10,877 | $ | 14,987 | $ | 19,763 | $ | 21,819 | |||||||||
|
|
|
|
|
|
|
|
|
|||||||||
| Fixed Charges: |
||||||||||||||||
| Total interest expense |
$ | 8,879 | $ | 10,581 | $ | 14,877 | $ | 18,415 | ||||||||
| Preference stock dividend |
— | — | 1,526 | 1,394 | ||||||||||||
|
|
|
|
|
|
|
|
|
|||||||||
| Including preference security dividend |
$ | 8,879 | $ | 10,581 | $ | 16,403 | $ | 19,809 | ||||||||
|
|
|
|
|
|
|
|
|
|||||||||
| Ratio of earnings to fixed charges |
$ | 1.24 | $ | 1.42 | $ | 1.33 | 1.18 | |||||||||
|
|
|
|
|
|
|
|
|
|||||||||
| Including preference security dividend |
$ | 1.24 | $ | 1.42 | $ | 1.20 | 1.10 | |||||||||
|
|
|
|
|
|
|
|
|
|||||||||
| Excluding interest on deposits |
||||||||||||||||
| Earnings |
||||||||||||||||
| Pre-tax income |
$ | 1,998 | $ | 4,406 | $ | 4,886 | $ | 3,404 | ||||||||
| Add: fixed charges from below |
3,276 | 3,467 | 4,306 | 4,208 | ||||||||||||
|
|
|
|
|
|
|
|
|
|||||||||
| $ | 5,274 | $ | 7,873 | $ | 9,192 | $ | 7,612 | |||||||||
|
|
|
|
|
|
|
|
|
|||||||||
| Fixed Charges: |
||||||||||||||||
| Total interest expense excluding |
||||||||||||||||
| interest paid on deposits |
$ | 3,276 | $ | 3,467 | $ | 4,306 | $ | 4,208 | ||||||||
| Preferred stock dividend |
— | — | 1,526 | 1,394 | ||||||||||||
|
|
|
|
|
|
|
|
|
|||||||||
| Including preference security dividend |
$ | 3,276 | $ | 3,467 | $ | 5,832 | $ | 5,602 | ||||||||
|
|
|
|
|
|
|
|
|
|||||||||
| Ratio of earnings to fixed charges |
$ | 1.61 | $ | 2.27 | $ | 2.13 | 1.81 | |||||||||
|
|
|
|
|
|
|
|
|
|||||||||
| Including preference security dividend |
$ | 1.61 | $ | 2.27 | $ | 1.58 | 1.36 | |||||||||
|
|
|
|
|
|
|
|
|
|||||||||
Limitations on Capital Distributions. The FRB has issued a policy statement on the payment of cash dividends by bank holding companies, which provides that a bank holding company should pay cash dividends only to the extent that the holding company’s net income for the past year is sufficient to cover both the cash dividends and a rate of earnings retention that is consistent with the holding company’s capital needs, asset quality and overall financial condition. The FRB also indicated that it would be inappropriate for a company experiencing serious financial problems to borrow funds to pay dividends. In a recent Supervisory Letter, the FRB staff has stated that, as a general matter, bank holding companies should eliminate cash dividends if net income available to shareholders for the past four quarters, net of dividends previously paid, is not sufficient to fully fund the dividend. Furthermore, under the federal prompt corrective action regulations, the FRB may prohibit a bank holding company from paying any dividends if the holding company’s bank subsidiary is classified as “undercapitalized.”
35
The KDFI limits the amount of dividends that can be paid by a state chartered commercial bank to its holding company. The limit is established by adding the current year’s net income plus the prior two years net income. The Bank must reduce the amount of accumulated net income over the last two years plus the current year by the amount of dividends paid to the Corporation during the same period of time. At December 31, 2014, the Bank could not pay an additional cash dividend to the Corporation without the prior approval of the KDFI.
Future earnings of the Bank appropriated to bad debt reserves and deducted for federal income tax purposes are not available for payment of dividends or other distributions to the Company without payment of taxes at the then current tax rate by the Bank on the amount of earnings removed from the reserves for such distributions.
Transactions with Affiliates and Insiders. Generally, transactions between commercial banks or its subsidiaries and its affiliates are required to be on terms as favorable to the commercial bank as transactions with non-affiliates. In addition, certain of these transactions, such as loans to an affiliate, are restricted to a percentage of the commercial bank’s capital. Affiliates of the Bank include the Company and any company that is under common control with the Bank. In addition, a commercial bank may not lend to any affiliate engaged in activities not permissible for a bank holding company or acquire the securities of most affiliates. The KDFI and FDIC have the discretion to treat subsidiaries of commercial banks as affiliates on a case-by-case basis.
Certain transactions with directors, officers or controlling persons are also subject to conflict of interest regulations enforced by the KDFI and FDIC. These conflict of interest regulations and other statutes also impose restrictions on loans to insiders. Among other things, such loans must generally be made on terms that are substantially the same as for loans to unaffiliated individuals. In addition, under the Dodd-Frank Act, the Bank is prohibited from purchasing an asset from or selling an asset to an insider unless the transaction is on market terms and, if representing more than 10% of capital, is approved in advance by the disinterested directors.
Reserve Requirements. Pursuant to regulations of the FRB, all FDIC-insured depository institutions must maintain average daily reserves at specified levels against their transaction accounts. The Bank met these reserve requirements at December 31, 2014.
Federal Home Loan Bank System. The Federal Home Loan Bank System consists of 12 district Federal Home Loan Banks subject to supervision and regulation by the Federal Housing Finance Board (“FHFB”). The Federal Home Loan Banks provide a central credit facility primarily for member institutions. As a member of the FHLB, the Bank is required to acquire and hold shares of capital stock in the FHLB in an amount at least equal to 1% of the aggregate unpaid principal of its home mortgage loans, home purchase contracts, and similar obligations at the beginning of each year, or 5% of its advances (borrowings) from the FHLB, whichever is greater. The Bank was in compliance with this requirement, with a $4.4 million investment in FHLB stock at December 31, 2014.
36
Financial Stability Plan
The Financial Stability Plan (“FSP”) is a comprehensive set of measures intended to improve the health of the financial system. The key elements of the FSP include making additional capital injections into financial institutions, creating a private – public investment fund to buy troubled assets, establishing guidelines for loan modification programs and expanding the Federal Reserve lending program.
American Recovery and Reinvestment Act of 2009
On February 17, 2009, the American Recovery and Reinvestment Act of 2009 (“ARRA”) was enacted. ARRA is intended to provide a stimulus to the United States economy in the wake of the economic downturn brought about by the subprime mortgage crisis and resulting liquidity and credit crunch. The bill includes federal tax cuts, expansion of unemployment benefits and other social welfare provisions, and domestic spending in education, healthcare, and infrastructure, including the energy structure. The new law also includes numerous non-economic recovery related items, including a limitation on executive compensation in federally aided banks.
37
Under ARRA, an institution will be subject to the following restrictions and standards throughout the period of which any obligation arising from the financial assistance provided under TARP remains outstanding:
| • | Limits on incentive compensation for risk taking by senior executive officers. |
| • | “Claw Back” provisions for compensation paid based or inaccurate financial information. |
| • | Prohibition on “Golden Parachute Payments”. |
| • | Limitations on luxury expenditures. |
| • | TARP recipients are required to permit a separate shareholder vote to approve the compensation of executives, as disclosed pursuant to the SEC’s compensation disclosure rules. |
| • | Publically registered TARP recipients must establish a board compensation committee comprised entirely of independent directors, for the purpose of reviewing employee compensation plans. |
Sarbanes–Oxley Act of 2002
The Sarbanes-Oxley Act provided for sweeping changes with respect to corporate governance, accounting policies and disclosure requirements for public companies, and also for their directors and officers. The Sarbanes-Oxley Act required the SEC to adopt new rules to implement the Act’s requirements. These requirements include new financial reporting requirements and rules concerning the chief executive and chief financial officers to certify certain financial and other information included in the company’s quarterly and annual reports. The rules also require these officers to certify that they are responsible for establishing, maintaining and regularly evaluating the effectiveness of the company’s disclosure controls and procedures; and that they have included information in their quarterly and annual filings about their evaluation and whether there have been significant changes to the controls and procedures or other factors which would significantly impact these controls subsequent to their evaluation. The certifications by the Company’s Chief Executive Officer and Chief Financial Officer of the financial statements and other information included in this Annual Report on Form 10-K have been filed as exhibits to this Form 10-K. See Item 9A (“Controls and Procedures”) hereof for the Company’s evaluation of disclosure controls and procedures.
Pursuant to Section 404 of the Sarbanes-Oxley Act, the Company is required under rules adopted by the SEC to include in its annual reports a report by management on the Company’s internal control over financial reporting and an accompanying auditor’s report.
USA Patriot Act
The USA Patriot Act authorizes new regulatory powers to combat international terrorism. The provisions that affect financial institutions most directly provide the federal government with enhanced authority to identify, deter, and punish international money laundering and other crimes. Among other things, the USA Patriot Act prohibits financial institutions from doing business with foreign “shell” banks and requires increased due diligence for private banking transactions and correspondent accounts for foreign banks. In addition, financial institutions have to follow minimum verification of identity standards for all new accounts and are permitted to share information with law enforcement authorities under circumstances that were not previously permitted.
Community Reinvestment Act
The Community Reinvestment Act requires federal bank regulatory agencies to encourage financial institutions to meet the credit needs of low and moderate-income borrowers in their local communities. An institution’s size and business strategy determines the type of examination that it will receive. Large, retail-oriented institutions are examined using a performance-based lending, investment and service test. Small institutions are examined using a streamlined approach. All institutions may opt to be evaluated under a strategic plan formulated with community input and pre-approved by the bank regulatory agency.
38
The Community Reinvestment Act regulations provide for certain disclosure obligations. Each institution must post a notice advising the public of its right to comment to the institution and its regulator on the institution’s Community Reinvestment Act performance and to review the institution’s Community Reinvestment Act public file. Each lending institution must maintain, for public inspection, a file that includes a listing of branch locations and services, a summary of lending activity, a map of its communities and any written comments from the public on its performance in meeting community credit needs. The Community Reinvestment Act requires public disclosure of a financial institution’s written Community Reinvestment Act evaluations. This promotes enforcement of Community Reinvestment Act requirements by providing the public with the status of a particular institution’s community reinvestment record.
The Gramm-Leach-Bliley Act made various changes to the Community Reinvestment Act. Among other changes, Community Reinvestment Act agreements with private parties must be disclosed and annual Community Reinvestment Act reports must be made available to a bank’s primary federal regulator. A bank holding company will not be permitted to become a financial holding company and no new activities authorized under the Gramm-Leach-Bliley Act may be commenced by a holding company or by a bank financial subsidiary if any of its bank subsidiaries received less than a satisfactory Community Reinvestment Act rating in its latest Community Reinvestment Act examination.
Forward-Looking Statements
This Annual Report on Form 10-K, including all documents incorporated herein by reference, contains forward-looking statements. Additional written or oral forward-looking statements may be made by the Company from time to time in filings with the Securities and Exchange Commission or otherwise. The words “believe,” “expect,” “seek,” and “intend” and similar expressions identify forward-looking statements, which speak only as of the date the statement is made. Such forward-looking statements are within the meaning of that term in Section 27A of the Securities Act of 1933, as amended, and Section 21E of the Securities Exchange Act of 1934, as amended. Such statements may include, but are not limited to, projections of income or loss, expenditures, acquisitions, plans for future operations, financing needs or plans relating to services of the Company, as well as assumptions relating to the foregoing. Forward-looking statements are inherently subject to risks and uncertainties, some of which cannot be predicted or quantified. Future events and actual results could differ materially from those set forth in, contemplated by or underlying the forward-looking statements.
The Company does not undertake, and specifically disclaims, any obligation to publicly release the results of revisions which may be made to forward-looking statements to reflect the occurrence of anticipated or unanticipated events or circumstances after the date of such statements.
| Item 1A. | RISK FACTORS |
The Company could experience an increase in loan losses, which would reduce the Company’s earnings.
As the nation continues to suffer from an economic recession, real estate prices remain under pressure in the Company’s market. Furthermore, elevated levels of unemployment have made it difficult for many consumers to meet their monthly obligations. The deployment of military personnel out of Fort Campbell to the Middle East may reduce both demand for and pricing of all types of real estate in the Company’s largest market. As a lender, we are exposed to the risk that our customers will be unable to repay their loans according to their terms and that any collateral securing the payment of their loans may not be sufficient to assure repayment. As discussed in Footnote 3 of the Notes to Consolidated Financial Statements, the Company has significant exposure to various types of real estate loans, including commercial real estate, land and land development loans, construction loans, multi-family real estate and loans for residential homes. Credit losses are inherent in the business of making loans and our industry has seen above average loan loss levels for approximately eighteen months. While the Company believes that its loan underwriting standards have been and remain sound, the Company has experienced an increase in charge offs and non-performing loans. To the extent charge offs exceed our financial models, increased amounts charged to the provision for loan losses would reduce net income.
39
Rapidly changing interest rate environments could reduce our net interest margin, net interest income, fee income and net income.
Interest and fees on loans and securities, net of interest paid on deposits and borrowings, are a large part of our net income. Interest rates are the key drivers of the Company’s net interest margin and subject to many factors beyond the control of management. As interest rates change, net interest income is affected. Rapid increases in interest rates in the future could result in interest expense increasing faster than interest income because of mismatches in the maturities of the Company’s assets and liabilities. Furthermore, substantially higher rates generally reduce loan demand and may result in slower loan growth. Decreases or increases in interest rates could have a negative effect on the spreads between interest rates earned on assets and the rates of interest paid on liabilities, and therefore decrease net interest income. See “Quantitative and Qualitative Disclosures about Market Risk”.
Liquidity needs could adversely affect the Company’s results of operations and financial condition.
The Company relies on dividends from the Bank as a primary source of funds. The Bank’s primary source of funds is customer deposits and cash flows from investment instruments and loan repayments. While scheduled loan repayments are a relatively stable source, they are subject to the ability of the borrowers to repay their loans. The ability of the borrowers to repay their loans can be adversely affected by a number of factors, including changes in the economic conditions, adverse trends or events affecting the business environment, natural disasters and various other factors. Cash flows from the investment portfolio may be affected by changes in interest rates, resulting in excessive levels of cash flow during periods of declining interest rates and lower levels of cash flow during periods of rising interest rates. Deposit levels may be affected by a number of factors, including both the national market and local competitive interest rate environment, local and national economic conditions, natural disasters and other various events. Accordingly, the Company may be required from time to time to rely on secondary sources of liquidity to meet withdrawal demands or otherwise fund operations. Such sources include the FHLB advances, brokered deposits and federal funds lines of credit from correspondent banks.
The Company may also pledge investments as collateral to borrow money from third parties. In certain cases, the Company may sell investment instruments for sizable losses to meet liquidity needs, hurting net income. While the Company believes that these sources are currently adequate, there can be no assurance they will be sufficient to meet future liquidity needs.
The financial industry is very competitive.
We face competition in attracting and retaining deposits, making loans, and providing other financial services throughout our market area. Our competitors include other community banks, regional and super-regional banking institutions, national banking institutions, and a wide range of other financial institutions such as credit unions, government-sponsored enterprises, mutual fund companies, insurance companies, brokerage companies, and other non-bank businesses. Many of these competitors have substantially greater resources than HopFed Bancorp, Inc.
Inability to hire or retain certain key professionals, management and staff could adversely affect our revenues and net income.
We rely on key personnel to manage and operate our business, including major revenue generating functions such as our loan and deposit portfolios. The loss of key staff may adversely affect our ability to maintain and manage these portfolios effectively, which could negatively affect our revenues. In addition, loss of key personnel could result in increased recruiting, hiring, and training expenses, resulting in lower net income.
40
The Company is subject to extensive regulation that could limit or restrict its activities.
The Company operates in a highly regulated industry and is subject to examination, supervision, and comprehensive regulation by various federal agencies, including the Kentucky Department of Financial Institutions and the Federal Deposit Insurance Corporation. The Company’s regulatory compliance is costly and certain types of activities, including the payment of dividends, mergers and acquisitions, investments, loans and interest rates charged and interest rates paid on deposits and locations of offices are subject to regulatory approval and may be limited by regulation. The Company is also subject to regulatory capital rules by its regulators, which require it and the Bank to maintain adequate capital to support its and the Bank’s growth.
The laws and regulations applicable to the banking industry could change at any time, and the Company cannot predict the effects of these changes on its business and profitability. The Sarbanes-Oxley Act of 2002, and the related rules and regulations promulgated by the Securities and Exchange Commission and NASDAQ National Market that are now and will be applicable to the Company, have increased the scope, complexity, and cost of corporate governance, reporting and disclosure practices. As a result, the Company has experienced, and may continue to experience, greater compliance cost.
On July 21, 2010, the Dodd-Frank Act was signed into law. The Dodd-Frank Act is having a broad impact on the financial services industry, including significant regulatory and compliance changes. Many of the requirements called for in the Dodd-Frank Act are being implemented over time and most are subject to implementing regulations over the course of several years. Given the uncertainty associated with the manner in which the provisions of the Dodd-Frank Act are implemented by the various regulatory agencies and through regulations, the full extent of the impact such requirements will have on our operations is unclear. The regulatory changes resulting from the Dodd-Frank Act may impact the profitability of our business activities, require changes to certain of our business practices, impose upon us more stringent capital, liquidity and leverage requirements, increase our regulatory compliance burden or otherwise adversely affect our business.
Further, we may be required to invest significant management attention and resources to evaluate and make any changes necessary to comply with new statutory and regulatory requirements under the Dodd-Frank Act. Failure to comply with the new requirements may negatively impact our results of operations and financial condition. While we cannot predict what effect any presently contemplated or future changes in the laws or regulations or their interpretations would have on us, these changes could be materially adverse to our investors.
Even though the Company’s common stock is currently traded on The NASDAQ Global Market, the trading volume in the Company’s common stock has been low and the sale of substantial amounts of its common stock in the public market could depress the price of the Company’s common stock.
The trading volume of the Company’s common stock on The NASDAQ Global Market has been relatively low when compared with larger companies listed on The NASDAQ Global Market or other stock exchanges. Thinly traded stocks, such as the Company’s, can be more volatile than stocks trading in an active public market. Because of this, the Company stockholders may not be able to sell their shares at the volumes, prices, or times that they desire.
The Company cannot predict the effect, if any, that future sales of its common stock in the market, or availability of shares of its common stock for sale in the market, will have on the market prices of the Company’s common stock. The Company, therefore, can give no assurance that sales of substantial amounts of its common stock in the market, or the potential for large amounts of sale in the market, would not cause the price of its common stock to decline or impair the Company’s ability to raise capital through sales of its common stock.
41
The market price of the Company’s common stock may fluctuate in the future, and these fluctuations may be unrelated to its performance. General market prices declines or overall market volatility in the future could adversely affect the price of the Company’s common stock, and the current market price may not be indicative of future market prices.
The current banking crisis, including the enactment of Emergency Economic Stabilization Action (EESA) and American Recovery and Reinvestment Act (ARRA), have significantly affected our financial condition, results of operations, liquidity or stock price.
The capital and credit markets have been experiencing volatility and disruption for more than a year. In recent months, the volatility and disruption has reached unprecedented levels. In some cases, the markets have produced downward pressure on stock prices and credit availability for certain issuers seeming without regard to that issuer’s underlying financial strength.
EESA, which established the TARP, was signed into law in October 2008. As part of TARP, the Treasury established the Capital Purchase Program (CPP) to provide up to $700 billion of funding to eligible financial institutions through the purchase of preferred shares and other financial instruments with the stated purpose of stabilizing and providing liquidity to the U.S. financial markets.
On February 17, 2009, President Obama signed ARRA, an economic recovery package intended to stimulate the economy and provide for a broad range of infrastructure, energy, health and educational needs. There can be no assurance as to the actual impact that EESA or its programs, including the CPP, and the ARRA or its programs, will have on the national economy or financial markets. The failure of these significant legislative measures to help stabilize the financial markets and the continuation or worsening of current financial market conditions may materially and adversely affect our business, financial condition, results of operations, access to credit or the trading price of our common shares.
The Company conducts virtually all of its business activities in a geographically concentrated area of Middle and West Tennessee and Western Kentucky.
The Company operates eighteen offices located in Middle Tennessee and Western Kentucky. The Company maintains significant business relationships in the markets in which it operates as well as the communities adjoining our offices. Therefore, the Company’s success is directly tied to the economic viability of our markets which may not be representative of the country as a whole. In 2013, the Company’s market had unemployment rates ranging from 5.5% to 11.8%. While the Company believes that its credit quality has been strong given the current environment, continued economic stress in the market may result in an increase in non-performing loans and charge offs. Given the limited geographic footprint of our Company, the economic conditions in our marketplace may not be reflective of the entire nation.
Management’s analysis of the necessary funding for the allowance for loan loss account may be incorrect or may suddenly change, resulting in lower earnings.
The funding of the allowance for loan loss account is the most significant estimate made by management in its financial reporting to shareholders and regulators. If negative changes to the performance of the Company’s loan portfolio were to occur, management may find it necessary or be required to funding the allowance for loan loss account through additional charges to the Company’s provision for loan loss expense. These changes may occur suddenly and be dramatic in nature. These changes are likely to affect the Company’s financial performance, capital levels and stock price.
42
If the federal funds and interbank funding rates remain at current extremely low levels, our net interest margin, and consequently our net earnings, may be negatively impacted.
Because of significant competitive pressures in our market and the negative impact of these pressures on our deposit and loan pricing, coupled with the fact that a significant portion of our loan portfolio has variable rate pricing that moves in concert with changes to the Federal Reserve Board of Governors’ federal funds rate or the London Interbank Offered Rate (LIBOR) (both of which are at extremely low levels as a result of current economic conditions), our net interest margin may be negatively impacted. Additionally, the amount of non-accrual loans and other real estate owned has been and may continue to be elevated. We also expect loan pricing to remain competitive in 2015 and believe that economic factors affecting broader markets will likely result in reduced yields for our investment securities portfolio. As a result, our net interest margin, and consequently our profitability, may continue to be negatively impacted in 2015 and beyond.
Holders of HopFed Capital Trust I have rights that are senior to those of the Company’s common shareholders.
The Company has issued trust preferred securities from a special purpose trusts and accompanying junior subordinated debentures. At December 31, 2014, HopFed had outstanding trust preferred securities of $10.3 million. Payments of the principal and interest on the trust preferred securities of these trusts are conditionally guaranteed by the Company. Further, the accompanying junior subordinated debentures HopFed issued to the trusts are senior to our common stock. As a result, we must make payments on the junior subordinated debentures before any dividends can be paid on common stock and, in the event of the Company’s , dissolution or liquidation, the holders of the junior subordinated debentures must be satisfied before any distributions can be made to the Company’s common shareholders. The Company has the right to defer distributions on its junior subordinated debentures (and the related trust preferred securities) for up to five years, during which time no dividends may be paid on its common stock. If our financial condition deteriorates or if we do not receive required regulatory approvals, we may be required to defer distributions on our junior subordinated debentures.
New capital requirements for bank holding companies and depository institutions may negatively impact our results of operations.
In July 2013, the Board of Governors of the Federal Reserve Bank approved the final rule for BASEL III capital requirements for all commercial banks charted in the United States of America. The rule will implements in the United States the Basel III regulatory capital reforms from the Basel Committee on Banking Supervision and certain changes required by the Dodd-Frank Wall Street Reform and Consumer Protection Act. Under the final rule, minimum requirements have increased for both the quantity and quality of capital held by banking organizations. Consistent with the international Basel framework, the rule includes a new minimum ratio of common equity tier 1 capital to risk-weighted assets of 4.5% and a common equity tier 1 capital conservation buffer of 2.5% of risk-weighted assets that will apply to all supervised financial institutions. The rule also raises the minimum ratio of tier 1 capital to risk-weighted assets from 4.0% percent to 6.0% percent and includes a minimum leverage ratio of 4.0% for all banking organizations. The transition period for implementation of Basel III is January 1, 2015, through December 31, 2018.
The application of more stringent capital requirements for HopFed Bancorp and Heritage Bank, may, among other things, result in lower returns on invested capital, require the raising of additional capital, and result in regulatory actions if we were to be unable to comply with such requirements. Furthermore, the imposition of liquidity requirements in connection with the implementation of Basel III could result in our having to lengthen the term and increase the cost of our funding, restructure our business models and/or increase our holdings of liquid assets. Implementation of changes to asset risk weightings for risk based capital calculations, items included or deducted in calculating regulatory capital and/or additional capital conservation buffers could result in management modifying its business strategy and could limit our ability to make distributions, including paying dividends or buying back shares.
43
A failure in our operational systems or infrastructure, or those of third parties, could impair our liquidity, disrupt our businesses, result in the unauthorized disclosure of confidential information, damage our reputation and cause financial losses.
Our businesses are dependent on their ability to process and monitor, on a daily basis, a large number of transactions, many of which are highly complex, across numerous and diverse markets. These transactions, as well as the information technology services we provide to clients, often must adhere to client-specific guidelines, as well as legal and regulatory standards. Due to the breadth of our client base and our geographical reach, developing and maintaining our operational systems and infrastructure is challenging, particularly as a result of rapidly evolving legal and regulatory requirements and technological shifts.
Our financial, accounting, data processing or other operating systems and facilities may fail to operate properly or become disabled as a result of events that are wholly or partially beyond our control, such as a spike in transaction volume, cyber-attack or other unforeseen catastrophic events, which may adversely affect our ability to process these transactions or provide services.
In addition, our operations rely on the secure processing, storage and transmission of confidential and other information on our computer systems and networks. Although we take protective measures to maintain the confidentiality, integrity and availability of our and our clients’ information across all geographic and product lines, and endeavor to modify these protective measures as circumstances warrant, the nature of the threats continues to evolve. As a result, our computer systems, software and networks may be vulnerable to unauthorized access, loss or destruction of data (including confidential client information), account takeovers, unavailability of service, computer viruses or other malicious code, cyber-attacks and other events that could have an adverse security impact. Despite the defensive measures we take to manage our internal technological and operational infrastructure, these threats may originate externally from third parties such as foreign governments, organized crime and other hackers, and outsource or infrastructure-support providers and application developers, or may originate internally from within our organization. Given the increasingly high volume of our transactions, certain errors may be repeated or compounded before they can be discovered and rectified.
We also face the risk of operational disruption, failure, termination or capacity constraints of any of the third parties that facilitate our business activities, including exchanges, clearing agents, clearing houses or other financial intermediaries. Such parties could also be the source of an attack on, or breach of, our operational systems, data or infrastructure. In addition, as interconnectivity with our clients grows, we increasingly face the risk of operational failure with respect to our clients’ systems.
Although we have not experienced a cyber-incident, if one or more of these events occurs, it could potentially jeopardize the confidential, proprietary and other information processed and stored in, and transmitted through, our computer systems and networks, or otherwise cause interruptions or malfunctions in our, as well as our clients’ or other third parties’, operations, which could result in damage to our reputation, substantial costs, regulatory penalties and/or client dissatisfaction or loss. Potential costs of a cyber-incident may include, but would not be limited to, remediation costs, increased protection costs, lost revenue from the unauthorized use of proprietary information or the loss of current and/or future customers, and litigation.
We maintain an insurance policy which we believe provides sufficient coverage at a manageable expense for an institution of our size and scope with similar technological systems. However, we cannot assure that this policy would be sufficient to cover all financial losses, damages, penalties, including lost revenues, should we experience any one or more of our or a third party’s systems failing or experiencing attack.
44
The downgrade of the U.S. credit rating and Europe’s debt crisis could have a material adverse effect on our business, financial condition and liquidity.
Standard & Poor’s lowered its long term sovereign credit rating on the United States of America from AAA to AA+ on August 5, 2011. A further downgrade or a downgrade by other rating agencies could have a material adverse impact on financial markets and economic conditions in the United States and worldwide. Any such adverse impact could have a material adverse effect on our liquidity, financial condition and results of operations.
In addition, the possibility that certain European Union (“EU”) member states will default on their debt obligations has negatively impacted economic conditions and global markets. The continued uncertainty over the outcome of international and the EU’s financial support programs and the possibility that other EU member states may experience similar financial troubles could further disrupt global markets. The negative impact on economic conditions and global markets could also have a material adverse effect on our liquidity, financial condition and results of operations.
Our loan portfolio includes loans with a higher risk of loss which could lead to higher loan losses and non- accrual assets.
We originate commercial real estate loans, construction and development loans, consumer loans, loans secured by farmland and residential mortgage loans primarily within our market area. Commercial real estate, commercial, farmland, and construction and development loans tend to involve larger loan balances to a single borrower or groups of related borrowers and are most susceptible to a risk of loss during a downturn in the business cycle. These loans also have historically had greater credit risk than other loans for the following reasons:
| • | Non-residential Real Estate Loans. Repayment is dependent on income being generated in amounts sufficient to cover operating expenses and debt service. These loans also involve greater risk because they may not be fully amortizing over a loan period, but may have a balloon payment due at maturity. A borrower’s ability to make a balloon payment typically will depend on being able to either refinance the loan or timely sell the underlying property. As of December 31, 2014, commercial real estate loans and multi-family loans comprised approximately 32.4% of our total loan portfolio, or 162.7% of the Company’s total risk based capital. At December 31, 2014, the Company had $16.3 million of its commercial real estate and multi-family real estate loans classified as substandard which equaled 9.2% of that portfolio and 43.51% of total substandard loans. At December 31, 2014, the Company’s allowance for loan losses included $2.2 million allocated to this portfolio. |
| • | Commercial Loans. Repayment is generally dependent upon the successful operation of the borrower’s business. In addition, the collateral securing the loans may depreciate over time, be difficult to appraise, be illiquid, or fluctuate in value based on the success of the business. As of December 31, 2014, commercial loans comprised approximately 13.5% of our total loan portfolio, or 67.9% of the Company’s consolidated total risk based capital. At December 31, 2014, the Company had $2.6 million of its commercial loan portfolio classified as substandard which equaled 3.5% of that portfolio and 6.9% of total substandard loans. At December 31, 2014, the Company’s allowance for loan losses included $504,000 allocated to this portfolio. |
| • | Construction and Development Loans. The risk of loss is largely dependent on our initial estimate of whether the property’s value at completion equals or exceeds the cost of property construction and the availability of take-out financing. During the construction phase, a number of factors can result in delays or cost overruns. If our estimate is inaccurate or if actual construction costs exceed estimates, the value of the property securing our loan may be insufficient to ensure full repayment when completed through a permanent loan, sale of the property, or by seizure of collateral. As of December 31, 2014, construction, land and land development loans comprised approximately 9.3% of our total loan portfolio and approximately 47.0% of the Company’s consolidated total risk based capital. At December 31, 2014, the Company had $11.0 million of its construction and development loans classified as substandard which equaled 21.5% of that portfolio and 29.3% of total substandard loans. At December 31, 2014, the Company’s allowance for loan losses included $1.3 million allocated to this portfolio. |
45
| • | Farmland. Repayment is generally dependent upon the successful operation of the borrower’s farming operation. The typical risk to a farming operating include adverse weather conditions, changes to the operations farm insurance subsidies, declines in commodity prices, sudden increases in the cost of farm production. Sudden changes in the value of the United States Dollar, the level of interest rates and competition both domestically and internationally may also a farming operations long term success rate. In addition, the value collateral securing the loans often fluctuates with the long term trends for commodity prices and may rise and fall significantly and may be illiquid in times of declining values. As of December 31, 2014, loans secured by farmland comprised approximately 7.8% of our total loan portfolio, or 39.5% of the Company’s consolidated total risk based capital. At December 31, 2014, the Company had $2.2 million of its farmland portfolio classified as substandard which equaled 5.2% of that portfolio and 6.02% of total substandard loans. At December 31, 2013, the Company’s allowance for loan losses included $461,000 allocated to this portfolio. |
The increased risks associated with these types of loans result in a correspondingly higher probability of default on such loans (as compared to single-family real estate loans). Loan defaults would likely increase our loan losses and non-accrual assets and could adversely affect our allowance for loan losses.
Since we engage in lending secured by real estate and may be forced to foreclose on the collateral property and own the underlying real estate, we may be subject to the increased costs associated with the ownership of real property, which could result in reduced net income.
Since we originate loans secured by real estate, we may have to foreclose on the collateral property to protect our investment and may thereafter own and operate such property, in which case we are exposed to the risks inherent in the ownership of real estate.
The amount that we, as mortgagee, may realize after a default is dependent upon factors outside of our control, including, but not limited to general and local economic conditions, changing values of property, interest rates, unpaid real estate taxes, environmental issues, operating expenses involved with managing other real estate owned, and the supply and demand for units held for sale as well as other unforeseen cost and delays.
Certain expenditures associated with the ownership of real estate, principally real estate taxes and maintenance costs, may adversely affect the income from the real estate. Therefore, the cost of operating real property may exceed the rental income earned from such property, and we may have to advance funds in order to protect our investment or we may be required to dispose of the real property at a loss.
We face risks arising from acquisitions of either other financial institutions or branch locations.
From time to time, we may acquire another financial institution in the future. We face a number of risks arising from acquisition transactions, including difficulties in integrating the acquired business into our operations, difficulties in assimilating and retaining employees and intermediaries, difficulties in retaining the existing customers of the acquired entity, unforeseen liabilities that arise in connection with the acquired business and unfavorable market conditions that could negatively impact our growth expectations for the acquired business. These risks may prevent us from realizing the expected benefits from acquisitions and could result in the impairment of goodwill and/or intangible assets recognized at the time of acquisition.
46
We face risk from further reductions in the size and makeup of the United States Army staffing at Fort Campbell, Kentucky.
The U.S. Army has provided a revised assessment of future staffing cuts that indicates that Fort Campbell may lose approximately 50% of its 32,000 active duty military personnel by 2020. In November of 2014, the United States Army announced that it was de-activating a combat battalion at Fort Campbell, Kentucky, sending its 2,400 members to other duty stations within the U.S. Army system.
At December 31, 2014, the Company’s loan portfolio has approximately $164.5 million in loans originated from its three Montgomery County, Tennessee offices and $97.7 million in loans originated in its Christian County, Kentucky offices. The Fort Campbell military installation in the largest employer in the region and a significant reduction in the staffing of the base would have a major negative affect on the economies of Montgomery County, Tennessee and Christian County, Kentucky. The annual cost to the local economy is estimated at nearly $1 billion.
The Company’s management considers growth in the nearby Nashville, Tennessee, market critical for our future success. With the potential for our largest current market to experience an economic downturn, market diversification is vital to the future prosperity of our Company.
Stockholder activists could cause a disruption to our business.
Certain institutional investors have indicated that they disagree with the strategic direction of our Company. Our business, operating results or financial condition could be adversely affected by these activists. Any such disruption may result in, among other things:
| • | Increased operating costs, including increased legal expenses, insurance, administrative expenses and associated costs; |
| • | Uncertainties as to our future direction could result in the loss of potential business opportunities, make it more difficult to attract, retain, or motivate qualified personnel, and strain relationships with investors and customers; and |
| • | Activist investors may reduce or delay our ability to effectively execute our current business strategies and the implementation of new strategies. |
| ITEM 1B. | UNRESOLVED STAFF COMMENTS |
There are no unresolved staff comments from the Securities and Exchange Commission.
47
| ITEM 2. | PROPERTIES |
The following table sets forth information regarding the Bank’s offices at December 31, 2014:
| Year Opened | Owned or Leased | Book Value (1) | Approximate Square Footage of Office |
|||||||||||||
| (In thousands) | ||||||||||||||||
| Main Office: |
||||||||||||||||
| 4155 Lafayette Road |
||||||||||||||||
| Hopkinsville, Kentucky |
2006 | Owned | $ | 4,556 | 24,072 | |||||||||||
| Branch Offices: |
||||||||||||||||
| 2700 Fort Campbell Boulevard |
||||||||||||||||
| Hopkinsville, Kentucky |
1995 | Owned | $ | 1,311 | 17,625 | |||||||||||
| Downtown Branch Office |
||||||||||||||||
| 605 South Virginia Street |
||||||||||||||||
| Hopkinsville, Kentucky |
1997 | Owned | $ | 142 | 756 | |||||||||||
| Murray South Office |
||||||||||||||||
| 210 N. 12th Street |
||||||||||||||||
| Murray, Kentucky |
2003 | Owned | $ | 1,529 | 5,600 | |||||||||||
| Murray North Office |
||||||||||||||||
| 1601 North 12th Street |
||||||||||||||||
| Murray, Kentucky |
2007 | Owned | $ | 1,093 | 3,400 | |||||||||||
| Cadiz Branch Office |
||||||||||||||||
| 352 Main Street |
||||||||||||||||
| Cadiz, Kentucky |
1998 | Owned | $ | 404 | 2,200 | |||||||||||
| Elkton Branch Office |
||||||||||||||||
| 536 W. Main Street |
||||||||||||||||
| Elkton, Kentucky |
1976 | Owned | $ | 87 | 3,400 | |||||||||||
| Benton Branch Office |
||||||||||||||||
| 105 W. 5th Street |
||||||||||||||||
| Benton, Kentucky |
2003 | Owned | $ | 1,486 | (1) | 4,800 | ||||||||||
| Benton Land (Future Office) |
||||||||||||||||
| Benton, Kentucky |
2013 | Owned | $ | 490 | n/a | |||||||||||
| Calvert City Office |
||||||||||||||||
| 35 Oak Plaza Drive |
||||||||||||||||
| Calvert City, Kentucky |
2003 | Owned | $ | 1,055 | 3,400 | |||||||||||
| Carr Plaza Office |
||||||||||||||||
| 607 N. Highland Drive |
||||||||||||||||
| Fulton, Kentucky |
2002 | Owned | $ | 179 | 800 | |||||||||||
| Lake Street Office |
||||||||||||||||
| 306 Lake Street |
||||||||||||||||
| Fulton, Kentucky |
2002 | Leased | $ | 963 | 400 | |||||||||||
| Nashville Loan Production Office |
||||||||||||||||
| 101 Main Street |
||||||||||||||||
| Nashville, Tennessee |
2014 | Owned | $ | 5 | 3,200 | |||||||||||
| Clarksville Main Street |
||||||||||||||||
| 322 Main Street |
||||||||||||||||
| Clarksville, Tennessee |
2007 | Owned | $ | 1,383 | 10,000 | |||||||||||
| Trenton Road Branch |
||||||||||||||||
| 3845 Trenton Road |
||||||||||||||||
| Clarksville, Tennessee |
2006 | Owned | $ | 2,223 | 3,362 | |||||||||||
| Madison Street Office |
||||||||||||||||
| 2185 Madison Street |
||||||||||||||||
| Clarksville, Tennessee |
2007 | Owned | $ | 1,398 | 3,950 | |||||||||||
| Houston County Office |
||||||||||||||||
| 1102 West Main Street |
||||||||||||||||
| Erin, Tennessee |
2006 | Owned | $ | 515 | 2,390 | |||||||||||
| Ashland City Office |
||||||||||||||||
| 108 Cumberland Street |
||||||||||||||||
| Ashland City, Tennessee |
2006 | Owned | $ | 1,486 | 7,058 | |||||||||||
| Pleasant View Office |
||||||||||||||||
| 2556 Highway 49 East |
||||||||||||||||
| Pleasant View, Tennessee |
2006 | Owned | $ | 850 | 2,433 | |||||||||||
| Kingston Springs Office |
||||||||||||||||
| 104 West Kingston Springs Road |
||||||||||||||||
| Kingston Springs, Tennessee |
2006 | Owned | $ | 1,785 | 9,780 | |||||||||||
|
|
|
|||||||||||||||
| Total |
$ | 22,940 | ||||||||||||||
|
|
|
|||||||||||||||
| (1) | Represents the book value of land, building, furniture, fixtures and equipment owned by the Bank. Includes construction in process of $486,000 for the construction of a new office in Benton, Kentucky. |
48
| ITEM 3. | LEGAL PROCEEDINGS |
From time to time, the Company or the Bank is a party to various legal proceedings incident to its business. At March 13, 2015, there were no legal proceedings to which the Company or the Bank was a party, or to which any of their property was subject, which were expected by management to result in a material loss to the Company or the Bank except as discussed below. There are no pending regulatory proceedings to which the Company or the Bank is a party or to which any of their properties is subject which are currently expected to result in a material loss.
The Company is the defendant in a class action lawsuit concerning the disclosure of ATM fees at Company owned ATMs that the defendant claims were not adequately disclosed. The Company asserts that fees were adequately disclosed and that portions of the ATM’s were vandalized by an unknown third party immediately prior to the defendants using the Company’s ATMs. At December 31, 2014, the Company has negotiated a settlement in this case and has established a $90,000 reserve potential losses. The Company has not admitted to be a fault in the case but has determined that it is more cost effective to come to a settlement as opposed to continuing the defend ourselves in court.
| ITEM 4. | MINE SAFETY DISCLOSURE |
None
PART II
| ITEM 5. | MARKET FOR REGISTRANT’S COMMON EQUITY, RELATED STOCKHOLDER MATTERS AND ISSUERS PURCHASES OF EQUITY SECURITIES. |
A cash dividend of $0.02 per share was declared in the first and second quarters of 2013. A cash dividend of $0.04 per share was declared in the third and fourth quarter of 2013 and all four quarters in 2014. The high and low price range of the Company’s common stock for 2014 and 2013 is set forth below:
| Year Ended December 31, 2014 |
Year Ended December 31, 2013 | |||||||
| High | Low | High | Low | |||||
| First Quarter |
$11.75 | $10.97 | $11.22 | $ 8.55 | ||||
| Second Quarter |
$11.74 | $11.21 | $11.13 | $10.50 | ||||
| Third Quarter |
$12.45 | $11.35 | $11.65 | $10.61 | ||||
| Fourth Quarter |
$13.04 | $11.11 | $11.75 | $10.75 | ||||
At February 28, 2015, the Company estimates that is has approximately 1,900 shareholders, with approximately 910 reported in the name of the shareholder and the remainder recorded in street name.
The Company’s participation in the United States Treasury’s Capital Purchase Program precluded it from repurchasing additional treasury shares for a three year period. The Company repurchased 100% of its preferred stock at par on December 19, 2012. The Company issued 112,639 shares of treasury stock as part of its common equity offering in June 2010. The Company currently has 778,383 shares of common treasury stock and has an active repurchase plan in which we may purchase up to 299,533 shares of our common stock on the open market or in negotiated transactions. Furthermore, the Company authorized management to purchase up to 1,000,000 additional shares on the open market or in negotiated transactions for future corporate uses or employee benefit plans.
49
The following table provides information with respect to purchases made by or on behalf of the Company or any “affiliated purchaser” (as defined in Rule 10b-18(a)(3) under the Securities Exchange Act of 1934), of the Company’s common stock during the three month period ended December 31, 2014:
| Period |
Total Number of Shares Purchased |
Average Price Paid Per Share |
Total number of shares Purchased as part of Publically Announced Programs |
Maximum Number of Shares that Yet may be Purchased Under the Program at the end of the period |
||||||||||||
| October 1, 2014, to October 31, 2014 |
812 | $ | 11.40 | 336,506 | 338,494 | |||||||||||
| November 1, 2014, to November 30, 2014 |
1,060 | $ | 11.49 | 337,566 | 337,434 | |||||||||||
| December 1, 2014, to December 31, 2014 |
37,901 | $ | 11.91 | 375,467 | 299,533 | |||||||||||
|
|
|
|
|
|
|
|
|
|||||||||
| Total |
39,773 | $ | 11.89 | 375,467 | 299,533 | |||||||||||
|
|
|
|
|
|
|
|
|
|||||||||
The Federal Reserve Bank has issued a policy statement regarding the payment of dividends and the repurchase of common stock by commercial bank holding companies. In general, dividends should be paid out of current earnings and only if the prospective rate of earnings retention by the holding company appears consistent with the organization’s capital requirements, asset quality and overall financial condition. These regulatory policies may affect the ability of the Company to pay dividends, repurchase shares of common stock or otherwise engage in capital distributions.
| ITEM 6. | SELECTED FINANCIAL DATA |
The information set forth under the caption “Selected Financial Information and Other Data” in the Company’s Annual Report to Stockholders for the year ended December 31, 2014, (Exhibit No. 13.1) is incorporated herein by reference. See Note 22 of Notes of Consolidated Financial Statements which is incorporated herein by reference.
50
| ITEM 7. | MANAGEMENT’S DISCUSSION AND ANALYSIS OF FINANCIAL CONDITION AND RESULTS OF OPERATIONS |
The information set forth under the caption “Management’s Discussion and Analysis of Financial Condition and Results of Operations” in the Company’s Annual Report to Stockholders for the year ended December 31, 2014, (Exhibit No. 13.1) is incorporated herein by reference.
| ITEM 7A. | QUANTITATIVE AND QUALITATIVE DISCLOSURES ABOUT MARKET RISK |
The information set forth under the caption “Management’s Discussion and Analysis of Financial Condition and Results of Operations – Interest Rate Sensitivity Analysis” in the Company’s Annual Report to Stockholders for the year ended December 31, 2014, (Exhibit No. 13.1) is incorporated herein by reference.
| ITEM 8. | FINANCIAL STATEMENTS AND SUPPLEMENTARY DATA |
The Company’s Consolidated Financial Statements together with the related notes and the report of Rayburn, Bates & Fitzgerald, P.C., independent registered public accounting firm, all as set forth in the Company’s Annual Report to Stockholders for the year ended December 31, 2014, (Exhibit No. 13.1) are incorporated herein by reference.
| ITEM 9. | CHANGES IN AND DISAGREEMENTS WITH ACCOUNTANTS ON ACCOUNTING AND FINANCIAL DISCLOSURE |
None
| ITEM 9A. | CONTROLS AND PROCEDURES |
The Company maintains disclosure controls and procedures, as defined in Rule 13a-15(e) promulgated under the Securities Exchange Act of 1934 (the “Exchange Act”) that are designed to insure that information required to be disclosed by it in the reports that it files or submits under the Exchange Act is recorded, processed, summarized and reported within the time periods specified under the SEC’s rules and forms and that such information is accumulated and communicated to the Company’s management, including its Chief Executive Officer and Chief Financial Officer, as appropriate, to allow timely decision making regarding required disclosure. The Company, under the supervision and participation of its management, including the Company’s Chief Executive Officer and the Chief Financial Officer, carried out an evaluation of the effectiveness of the design and operation of the Company’s disclosure controls and procedures as of the end of the period covered by this report pursuant to the Exchange Act. Based upon that evaluation, the Chief Executive Officer and the Chief Financial Officer concluded that the Company’s disclosure controls and procedures are effective in ensuring that all material information required to be disclosed is this annual report has been accumulated and communicated to them in a manner appropriate to allow timely decisions regarding required disclosures.
51
Management Report on Internal Control
The management of HopFed Bancorp, Inc. and its subsidiaries (collectively referred to as the Company) is responsible for the preparation, integrity and fair presentation of published financial statements and all other information presented in this annual report. The financial statements have been prepared in accordance with accounting principles generally accepted in the United States of America (GAAP) and, as such, include amounts based on informed judgments and estimates made by management.
Management is responsible for establishing and maintaining adequate internal control over financial reporting for financial presentations in conformity with GAAP. Pursuant to the rules and regulations of the Securities and Exchange Commission, internal control over financial reporting is a process designed by, or under the supervision of, the Company’s Board of Directors, management and other personnel, to provide reasonable assurance regarding the reliability of financial reporting and the preparation of financial statements for external purposes in accordance with GAAP and included those policies and procedures that:
| • | Pertain to the maintenance of records that in reasonable detail accurately and fairly reflect the transactions and dispositions of the assets of the Company. |
| • | Provide reasonable assurance that transactions are recorded as necessary to permit preparation of financial statements in accordance with generally accepted accounting principles, and that receipts and expenditures of the Company are being made only in accordance with authorizations of management and Directors of the Company; and |
| • | Provide reasonable assurance regarding prevention or timely detection of unauthorized acquisition, use or disposition of the Company’s assets that could have a material effect on the financial statements. |
All internal control systems, no matter how well designed, have inherent limitations, including the possibility of human error and the circumvention of overriding controls. Accordingly, even effective internal control can provide only reasonable assurance with respect to financial statement preparation. Further, because of changes in conditions, or that the degree of compliance with the policies and procedures include in such controls may deteriorate.
Management has evaluated the effectiveness of its internal control over financial reporting as of December 31, 2014, based on the control criteria established in a report entitled Internal Control – Integrated Framework (2013), issued by the Committee of Sponsoring Organizations of the Treadway Commission. Based on such evaluation, we have concluded that HopFed Bancorp’s internal control over financial reporting is effective as of December 31, 2014.
Rayburn, Bates & Fitzgerald, P.C., the independent registered public accounting firm that audited the consolidated financial statements of the Company included in this Annual Report on Form 10-K, has issued an attestation report on the effective of the Company’s internal control over financial reporting as of December 31, 2014. The report, which expresses an unqualified opinion on the effectiveness of the Company’s internal control over financial reporting as of December 31, 2014, is included in this Item under the heading “Report of Independent Registered Public Accounting Firm.”
| Date: March 13, 2015 |
By: | (signed) John E. Peck | ||||||||
| John E. Peck | ||||||||||
| President and Chief Executive Officer | ||||||||||
| By: | (signed) Billy C. Duvall | |||||||||
| Billy C. Duvall | ||||||||||
| Senior Vice President and Treasurer | ||||||||||
| (Principal Financial Officer) | ||||||||||
52
REPORT OF INDEPENDENT REGISTERED PUBLIC ACCOUNTING FIRM
To the Board of Directors and Stockholders
of HopFed Bancorp, Inc.
Hopkinsville, Kentucky
We have audited HopFed Bancorp, Inc. and subsidiaries’ (the “Company”) internal control over financial reporting as of December 31, 2014, based on criteria established in Internal Control – Integrated Framework (2013) issued by the Committee of Sponsoring Organizations of the Treadway Commission. The Company’s management is responsible for maintaining effective internal control over financial reporting and for its assessment of the effectiveness of internal control over financial reporting, included in the accompanying Management Report on Internal Control Over Financial Reporting. Our responsibility is to express an opinion on the Company’s internal control over financial reporting based on our audit.
We conducted our audit in accordance with the standards of the Public Company Accounting Oversight Board (United States). Those standards require that we plan and perform the audit to obtain reasonable assurance about whether effective internal control over financial reporting was maintained in all material respects. Our audit included obtaining an understanding of internal control over financial reporting, assessing the risk that a material weakness exists, and testing and evaluating the design and operating effectiveness of internal control based on the assessed risk. Our audit also included performing such other procedures as we considered necessary in the circumstances. We believe that our audit provides a reasonable basis for our opinion.
A company’s internal control over financial reporting is a process designed to provide reasonable assurance regarding the reliability of financial reporting and the preparation of financial statements for external purposes in accordance with generally accepted accounting principles. A company’s internal control over financial reporting includes those policies and procedures that (1) pertain to the maintenance of records that, in reasonable detail, accurately and fairly reflect the transactions and dispositions of the assets of the company; (2) provide reasonable assurance that transactions are recorded as necessary to permit preparation of financial statements in accordance with generally accepted accounting principles, and that receipts and expenditures of the company are being made only in accordance with authorizations of management and directors of the company; and (3) provide reasonable assurance regarding prevention or timely detection of unauthorized acquisition, use, or disposition of the company’s assets that could have a material effect on the financial statements.
Because of its inherent limitations, internal control over financial reporting may not prevent or detect misstatements. Also, projections of any evaluation of effectiveness to future periods are subject to the risk that controls may become inadequate because of changes in conditions, or that the degree of compliance with the policies or procedures may deteriorate.
In our opinion, the Company maintained, in all material respects, effective internal control over financial reporting as of December 31, 2014, based on the criteria established in Internal Control – Integrated Framework (2013) issued by the Committee of Sponsoring Organizations of the Treadway Commission.
We also have audited, in accordance with the standards of the Public Company Accounting Oversight Board (United States), the consolidated balance sheets of HopFed Bancorp, Inc. and subsidiaries as of December 31, 2014 and 2013, and the related consolidated statements of income, comprehensive income (loss), changes in stockholders’ equity, and cash flows for each of the years in the three-year period ended December 31, 2014, and our report dated March 13, 2015 expressed an unqualified opinion on those consolidated financial statements.
(signed) Rayburn, Bates & Fitzgerald P.C.
Brentwood, Tennessee
March 13, 2015
53
| ITEM 9B. | OTHER INFORMATION |
Not Applicable
PART III
| ITEM 10. | DIRECTORS AND EXECUTIVE OFFICERS AND CORPORATE GOVERNANCE OF THE REGISTRANT |
Information regarding directors of the Company is omitted from this Report as the Company will file a definitive proxy statement (the “Proxy Statement”) not later than 120 days after December 31, 2014, and the information included therein under “Proposal I — Election of Directors” is incorporated herein by reference. Information regarding the executive officers of the Company is included under separate caption in Part I of this Form 10-K
Information regarding Section 16(a) beneficial ownership reporting compliance is omitted from this Report as the Company will file the Proxy Statement not later than 120 days after December 31, 2014, and the information included therein under “Section 16(a) Beneficial Ownership Reporting Compliance” is incorporated herein by reference.
Information regarding audit committee financial expert compliance is omitted from this Report as the Company will file the Proxy Statement not later than 120 days after December 31, 2014, and the information contained therein under “Committees of the Board of Directors” is incorporated herein by reference.
The Company has adopted a code of ethics that applies to all directors and employees, including without exception, the principal executive officer, principal financial officer, principal accounting officer and controller, or persons performing similar functions.
| ITEM 11. | EXECUTIVE COMPENSATION |
Information regarding executive compensation is omitted from this Report as the Company will file the Proxy Statement not later than 120 days after December 31, 2014, and the information included therein under “Proposal I — Election of Directors” is incorporated herein by reference.
| ITEM 12. | SECURITY OWNERSHIP OF CERTAIN BENEFICIAL OWNERS AND MANAGEMENT AND RELATED STOCKHOLDER MATTERS |
Information required by this Item is omitted from this Report as the Company will file the Proxy Statement not later than 120 days after December 31, 2014, and the information included therein under “Voting Securities and Principal Holders Thereof” and “Proposal I – Election of Directors” is incorporated herein by reference.
| ITEM 13. | CERTAIN RELATIONSHIPS AND RELATED TRANSACTIONS AND DIRECTOR INDEPENDENCE |
Information required by this Item is omitted from this Report as the Company will file the Proxy Statement, not later than 120 days after December 31, 2014, and the information included therein under “Proposal I — Election of Directors” is incorporated herein by reference.
54
| ITEM 14. | PRINCIPAL ACCOUNTANT FEES AND SERVICES |
Information required by this item is omitted from this report as the Company will file the Proxy Statement not later than 120 days after December 31, 2014, and the information included therein under “Independent Registered Public Accounting Firm” is incorporated herein by reference.
PART IV
| ITEM 15. | EXHIBITS AND FINANCIAL STATEMENT SCHEDULES |
(a) The following consolidated financial statements of the Company included in the Annual Report to Stockholders for the year ended December 31, 2014, are incorporated herein by reference in Item 8 of this Report. The remaining information appearing in the Annual Report to Stockholders is not deemed to be filed as part of this Report, except as expressly provided herein.
| 1. | Report of Independent Registered Public Accounting Firm. |
| 2. | Consolidated Balance Sheets - December 31, 2014 and 2013. |
| 3. | Consolidated Statements of Income for the Years Ended December 31, 2014, 2013 and 2012. |
| 4. | Consolidated Statements of Comprehensive Income (Loss) for the Years Ended December 31, 2014, 2013 and 2012. |
| 5. | Consolidated Statements of Changes in Stockholders’ Equity for the Years Ended December 31, 2014, 2013 and 2012. |
| 6. | Consolidated Statements of Cash Flows for the Years Ended December 31, 2014, 2013 and 2012. |
| 7. | Notes to Consolidated Financial Statements. |
(b) The following exhibits either are filed as part of this Report or are incorporated herein by reference:
Exhibit No. 2.1. Plan of Conversion of Hopkinsville Federal Savings Bank. Incorporated herein by reference to Exhibit No. 2 to Registrant’s Registration Statement on Form S-1 (File No. 333-30215).
Exhibit No. 3.1. Certificate of Incorporation. Incorporated herein by reference to Exhibit No. 3.1 to Registrant’s Annual Report on Form 10-K for the fiscal year ended December 31, 2013.
Exhibit No. 3.2 Bylaws, as amended. Incorporated herein by reference to Exhibit No. 3.2 to Registrant’s Current Report on Form 8-K dated March 1, 2015 (filed on March 4, 2015).
Exhibit No. 4.1. Form of Common Stock Certificate incorporated herein by reference to Exhibit No. 4.1 to Registrant’s Registration Statement on Form S-1 (File No. 333-30215).
Exhibit No. 10.1. HopFed Bancorp, Inc. Management Recognition Plan. Incorporated herein by reference to Exhibit 99.1 to Registration Statement on Form S-8 (File No. 333-79391).
Exhibit No. 10.2. HopFed Bancorp, Inc. 1999 Stock Option Plan. Incorporated herein by reference to Exhibit 99.2 to Registration Statement on Form S-8 (File No. 333-79391).
Exhibit No. 10.3. HopFed Bancorp, Inc. 2000 Stock Option Plan. Incorporated herein by reference to Exhibit 10.10 to Registrant’s Annual Report on Form 10-K for the fiscal year ended December 31, 2000.
55
Exhibit No. 10.4 HopFed Bancorp, Inc. 2004 Long Term Incentive Plan. Incorporated herein by reference to Exhibit 99.3 to Registration Statement on Form S-8 (File No. 333-117956) dated August 5, 2004.
Exhibit No. 10.5 HopFed Bancorp, Inc. 2013 Long Term Incentive Plan. Incorporated herein by reference to Exhibit 99.3 to Registration Statement on Form S-8 (File No. 333-117956) dated June 28, 2013.
Exhibit No. 10.6. Employment Agreement by and between Registrant and John E. Peck. Incorporated herein by reference to Exhibit No. 10.2 to Registrant’s Current Report on Form 8-K dated April 17, 2008 (filed April 22, 2008).
Exhibit No. 10.7. Employment Agreement by and between Heritage Bank and John E. Peck. Incorporated herein by reference to Exhibit No. 10.2 to Registrant’s Current Report on Form 8-K dated April 1, 2008 (filed April 22, 2008).
Exhibit No. 10.8. Employment Agreement by and between Registrant and Billy C. Duvall. Incorporated herein by reference to Exhibit 10.1 to Registrant’s Current Report on Form 8-K dated July 1, 2013 (filed July 1, 2013).
Exhibit No. 10.9. Employment Agreement by and between Heritage Bank and Billy C. Duvall. Incorporated herein by reference to Exhibit 10.2 to Registrant’s Current Report on Form 8-K dated July 1, 2013 (filed July 1, 2013).
Exhibit No. 10.10. Employment Agreement by and between Registrant and Michael L. Woolfolk. Incorporated herein by reference to Exhibit 10.3 to Registrant’s Current Report on Form 8-K dated April 17, 2008 (filed April 22, 2008).
Exhibit No. 10.11. Employment Agreement by and between Heritage Bank and Michael L. Woolfolk. Incorporated herein by reference to Exhibit 10.4 to Registrant’s Current Report on Form 8-K dated April 17, 2008 (filed April 22, 2008).
Exhibit No. 10.12 Employment Agreement by and between Heritage Bank and P. Michael Foley. Incorporated herein by reference to Exhibit 10.1 to Registrant’s Current Report on Form 8-K dated December 6, 2011 (filed December 7, 2011).
Exhibit No. 10.13 Employment Agreement by and between Heritage Bank and Keith Bennett. Incorporated herein by reference to Exhibit 10.1 to Registrant’s Current Report on Form 8-K dated April 25, 2013 (filed April 25, 2013).
Exhibit No. 10.14 Restricted Share Award Agreement with John E. Peck. Incorporated herein by reference to Registrant’s Current Report on Form 8-k dated June 23, 2010 (filed June 28, 2010).
Exhibit No. 10.15 Restricted Share Award Agreement with John E. Peck and Michael Foley. Incorporated herein by reference to Exhibits 10.1 and 10.2, respectively, to Registrant’s Current Report on Form 8-k dated June 23, 2012 (filed June 25, 2012).
Exhibit No. 10.16 Employee Stock Ownership Plan. Incorporated herein by reference to Exhibit 10.1 to Registrant’s Current Report on Form 8-K dated February 27, 2015 (filed March 3, 2015).
Exhibit No. 10.17 Employee Stock Ownership Trust. Incorporated herein by reference to Exhibit 10.2 to Registrant’s Current Report on Form 8-K dated February 27, 2015 (filed March 3, 2015).
Exhibit No. 99.1 Stock Purchase Agreement with Maltese Capital Management. Incorporated herein by reference to Exhibit 99.1 to Registrant’s Current Report on Form 8-K dated February 2, 2015 (filed February 3, 2015).
Exhibit 99.2 Standstill Agreement with Maltese Capital Management. Incorporated herein by reference to Exhibit 99.2 to Registrant’s Current Report on Form 8-K dated February 2, 2015 (filed February 3, 2015), as amended by Exhibit 99.2 to Registrant’s Current Report on Form 8-K/A (filed February 4, 2015).
Exhibit No. 13.1. Annual Report to Stockholders Except for those portions of the Annual Report to Stockholders for the year ended December 31, 2013, which are expressly incorporated herein by reference, such Annual Report is furnished for the information of the Commission and is not to be deemed “filed” as part of this Report.
Exhibit No. 14.1. Code of Ethics. Incorporated herein by reference to Exhibit 14 to Registrant’s Annual Report on Form 10-K for the fiscal year ended December 31, 2003.
56
Exhibit No. 21.1 Subsidiaries of the Registrant.
Exhibit No. 23.1. Consent of Independent Registered Public Accounting Firm.
Exhibit No. 31.1 Certification of Principal Executive Officer pursuant to Exchange Act Rule 13a – 14(a) or 15d – 14(a).
Exhibit No. 31.2 Certification of Principal Financial Officer pursuant to Exchange Act Rule 13a – 14(a) or 15d – 14(a).
Exhibit No 32.1. Certification of Principal Executive Officer pursuant to 18 U.S.C. Section 1350, as adopted pursuant to Section 906 of the Sarbanes – Oxley Act of 2002.
Exhibit No 32.2. Certification of Principal Financial Officer pursuant to 18 U.S.C. Section 1350, as adopted pursuant to Section 906 of the Sarbanes – Oxley Act of 2002.
Exhibit 101. The following materials from the Company’s annual report on Form 10-K for the years ended December 31, 2014 and December 31, 2013, formatted in XBRL (eXtensible Business Reporting Language): (i) Condensed Consolidated Statement of Financial Condition as of December 31, 2014 and December 31, 2013, (ii) Condensed Consolidated Statements of Income for the years ended December 31, 2014, 2013 and 2012, respectively (iii) Condensed Statements of Comprehensive Income (Loss) for the years ended December 31, 2014, 2013, and 2012, respectively (iv) Condensed Consolidated Statements of Cash Flows, for the years ended December 31, 2014, 2013 and 2012, respectively, and (v) Notes to Condensed Consolidated Financial Statements (unaudited), tagged as blocks of text.
(c) All schedules for which provision is made in the applicable accounting regulations of the Securities and Exchange Commission are not required under the related instructions or are inapplicable and therefore have been omitted.
SIGNATURES
Pursuant to the requirements of Section 13 or 15(d) of the Securities Exchange Act of 1934, the Registrant has duly caused this report to be signed on behalf by the undersigned, thereunto duly authorized.
| HOPFED BANCORP, INC. | ||||||||
| (Registrant) | ||||||||
| Date: March 13, 2015 | By: | (signed) John E. Peck | ||||||
| John E. Peck | ||||||||
| President and Chief Executive Officer | ||||||||
57
Pursuant to the requirements of the Securities Exchange Act of 1934, this report has been signed below by the following persons on behalf of the Registrant and in the capacities indicated and on the dates indicated.
DATE: SIGNATURE AND TITLE:
| (signed) John E. Peck |
March 13, 2015 | |||
| John E. Peck | ||||
| Director, President and Chief Executive Officer (Principal Executive Officer) |
||||
| (signed) Billy C. Duvall |
March 13, 2015 | |||
| Billy C. Duvall Senior Vice President, Chief Financial Officer and Treasurer (Principal Financial and Accounting Officer) |
||||
| (signed) Gilbert E. Lee |
March 13, 2015 | |||
| Gilbert E. Lee Chairman of the Board |
||||
| (signed) Dr. Harry J. Dempsey |
March 13, 2015 | |||
| Dr. Harry J. Dempsey Vice-Chairman of the Board |
||||
| (signed) Michael Woolfolk |
March 13, 2015 | |||
| Michael Woolfolk Director, Board Secretary and Executive Vice President and Chief Operating Officer |
||||
| (signed) Steve Hunt |
March 13, 2015 | |||
| Steve Hunt Director | ||||
| (signed) Robert Bolton |
March 13, 2015 | |||
| Robert Bolton Director | ||||
| (signed) Ted Kinsey |
March 13, 2015 | |||
| Ted Kinsey Director | ||||
| (signed) Clay Smith |
March 13, 2015 | |||
| Clay Smith Director | ||||
| (signed) Robert Perkins |
March 13, 2015 | |||
| Richard Perkins Director | ||||
58
Table of Contents
Exhibit 13
SELECTED FINANCIAL INFORMATION AND OTHER DATA
The following summary of selected financial information and other data does not purport to be complete and is qualified in its entirety by reference to the detailed information and Consolidated Financial Statements and accompanying Notes appearing elsewhere in this Report.
Financial Condition and Other Data
| At December 31, | ||||||||||||||||||||
| 2014 | 2013 | 2012 | 2011 | 2010 | ||||||||||||||||
| (Dollars in thousands) | ||||||||||||||||||||
| Total amount of: |
||||||||||||||||||||
| Assets |
$ | 935,785 | $ | 973,649 | $ | 967,689 | $ | 1,040,820 | $ | 1,082,591 | ||||||||||
| Loans receivable, net |
539,264 | 543,632 | 524,985 | 556,360 | 600,215 | |||||||||||||||
| Cash and due from banks |
34,389 | 37,229 | 31,563 | 44,389 | 54,042 | |||||||||||||||
| Federal Home Loan Bank stock |
4,428 | 4,428 | 4,428 | 4,428 | 4,378 | |||||||||||||||
| Securities available for sale |
303,628 | 318,910 | 356,345 | 383,782 | 357,738 | |||||||||||||||
| Deposits |
731,308 | 762,997 | 759,865 | 800,095 | 826,929 | |||||||||||||||
| Repurchase agreements |
57,358 | 52,759 | 43,508 | 43,080 | 45,110 | |||||||||||||||
| FHLB advances |
34,000 | 46,780 | 43,741 | 63,319 | 81,905 | |||||||||||||||
| Subordinated debentures |
10,310 | 10,310 | 10,310 | 10,310 | 10,310 | |||||||||||||||
| Total stockholders’ equity |
98,402 | 95,717 | 104,999 | 118,483 | 111,444 | |||||||||||||||
| Number of active: |
||||||||||||||||||||
| Real estate loans Outstanding |
4,527 | 4,730 | 4,212 | 4,383 | 4,715 | |||||||||||||||
| Deposit accounts |
44,183 | 44,792 | 40,770 | 42,140 | 40,359 | |||||||||||||||
| Offices open |
18 | 18 | 18 | 18 | 18 | |||||||||||||||
Operating Data
| Year Ended December 31, | ||||||||||||||||||||
| 2014 | 2013 | 2012 | 2011 | 2010 | ||||||||||||||||
| (Dollars in thousands) | ||||||||||||||||||||
| Interest and dividend income |
$ | 34,680 | $ | 35,857 | $ | 40,840 | $ | 46,240 | $ | 52,417 | ||||||||||
| Interest expense |
8,879 | 10,581 | 14,877 | 18,415 | 22,246 | |||||||||||||||
|
|
|
|
|
|
|
|
|
|
|
|||||||||||
| Net interest income before provision for loan losses |
25,801 | 25,276 | 25,963 | 27,825 | 30,171 | |||||||||||||||
| Provision for loan losses |
(2,273 | ) | 1,604 | 2,275 | 5,921 | 5,970 | ||||||||||||||
|
|
|
|
|
|
|
|
|
|
|
|||||||||||
| Net interest income |
28,074 | 23,672 | 23,688 | 21,904 | 24,201 | |||||||||||||||
| Non-interest income |
7,840 | 9,372 | 9,639 | 10,193 | 11,106 | |||||||||||||||
| Non-interest expense |
33,916 | 28,638 | 28,441 | 28,693 | 26,178 | |||||||||||||||
|
|
|
|
|
|
|
|
|
|
|
|||||||||||
| Income before income taxes |
1,998 | 4,406 | 4,886 | 3,404 | 9,129 | |||||||||||||||
| Provision for income taxes |
(201 | ) | 644 | 817 | 484 | 2,613 | ||||||||||||||
|
|
|
|
|
|
|
|
|
|
|
|||||||||||
| Net income |
$ | 2,199 | $ | 3,762 | $ | 4,069 | $ | 2,920 | $ | 6,516 | ||||||||||
|
|
|
|
|
|
|
|
|
|
|
|||||||||||
| Preferred stock dividend and accretion of stock warrants |
— | — | 1,229 | 1,031 | 1,031 | |||||||||||||||
|
|
|
|
|
|
|
|
|
|
|
|||||||||||
| Net income available to common shareholders |
$ | 2,199 | $ | 3,762 | $ | 2,840 | $ | 1,889 | $ | 5,485 | ||||||||||
|
|
|
|
|
|
|
|
|
|
|
|||||||||||
1
Table of Contents
Selected Quarterly Information (Unaudited)
| First Quarter |
Second Quarter |
Third Quarter |
Fourth Quarter |
|||||||||||||
| ( Dollars in thousands) | ||||||||||||||||
| Year Ended December 31, 2014: |
||||||||||||||||
| Interest and dividend income |
$ | 8,658 | $ | 8,734 | $ | 8,994 | $ | 8,294 | ||||||||
| Net interest income after provision for losses on loans |
6,320 | 6,380 | 6,808 | 6,293 | ||||||||||||
| Non-interest income |
1,598 | 1,945 | 2,393 | 1,904 | ||||||||||||
| Non-interest expense |
7,324 | 7,447 | 7,563 | 11,582 | ||||||||||||
| Net income available to common shareholder |
354 | 925 | 1,953 | (1,033 | ) | |||||||||||
| Year Ended December 31, 2013: |
||||||||||||||||
| Interest and dividend income |
$ | 9,305 | $ | 8,994 | $ | 8,795 | $ | 8,763 | ||||||||
| Net interest income after provision for losses on loans |
6,015 | 5,794 | 5,873 | 5,990 | ||||||||||||
| Non-interest income |
2,483 | 2,828 | 1,769 | 2,292 | ||||||||||||
| Non-interest expense |
7,274 | 7,124 | 6,984 | 7,256 | ||||||||||||
| Net income available to common shareholders |
984 | 1,166 | 536 | 1,076 | ||||||||||||
2
Table of Contents
Key Operating Ratios
| At or for the Year Ended December 31, | ||||||||||||
| 2014 | 2013 | 2012 | ||||||||||
| Performance Ratios |
||||||||||||
| Return on average assets (net income available to common shareholders divided by average total assets) |
0.23 | % | 0.39 | % | 0.28 | % | ||||||
| Return on average equity (net income available to common shareholders divided by average total equity) |
2.20 | % | 3.59 | % | 2.49 | % | ||||||
| Interest rate spread (combined weighted average interest rate earned less combined weighted average interest rate cost) |
2.90 | % | 2.81 | % | 2.62 | % | ||||||
| Net interest margin |
3.08 | % | 3.01 | % | 2.86 | % | ||||||
| Ratio of average interest-earning assets to average interest-bearing liabilities |
117.88 | % | 116.15 | % | 114.65 | % | ||||||
| Ratio of non-interest expense to average total assets |
3.57 | % | 2.99 | % | 2.79 | % | ||||||
| Ratio of net interest income after provision for loan losses to non-interest expense |
85.81 | % | 86.44 | % | 87.10 | % | ||||||
| Efficiency ratio (non-interest expense divided by sum of net interest income plus non-interest income) |
97.83 | % | 80.15 | % | 77.52 | % | ||||||
| Asset Quality Ratios |
||||||||||||
| Non-performing assets to total assets at end of period |
0.55 | % | 1.82 | % | 0.95 | % | ||||||
| Non-accrual loans to total loans at end of period |
0.58 | % | 1.21 | % | 1.43 | % | ||||||
| Allowance for loan losses to total loans at end of period |
1.15 | % | 1.57 | % | 1.99 | % | ||||||
| Allowance for loan losses to non-performing loans at end of period |
198.08 | % | 86.25 | % | 138.99 | % | ||||||
| Provision for loan losses to total loans receivable, net |
(0.42 | %) | 0.30 | % | 0.43 | % | ||||||
| Net charge-offs to average loans outstanding |
0.02 | % | 0.66 | % | 0.52 | % | ||||||
| Capital Ratios |
||||||||||||
| Total equity to total assets at end of period |
10.52 | % | 9.83 | % | 10.85 | % | ||||||
| Average total equity to average assets |
10.55 | % | 10.94 | % | 11.18 | % | ||||||
Regulatory Capital
| December 31, 2014 | ||||||||
| (Dollars in thousands) | ||||||||
| Corporation | Bank | |||||||
| Tier 1 Leverage capital |
$ | 104,813 | $ | 102,240 | ||||
| Less: Tier 1 Leverage capital requirement |
37,766 | 37,252 | ||||||
|
|
|
|
|
|||||
| Excess |
67,047 | 64,988 | ||||||
|
|
|
|
|
|||||
| Tier 1 Risk Based capital |
$ | 104,813 | $ | 102,240 | ||||
| Less: Tier 1 Risk Based capital requirement |
14,162 | n/a | ||||||
|
|
|
|
|
|||||
| Excess |
90,651 | n/a | ||||||
|
|
|
|
|
|||||
| Total risk-based capital |
$ | 111,102 | $ | 108,529 | ||||
| Less: Risk-based capital requirement |
46,662 | 46,576 | ||||||
|
|
|
|
|
|||||
| Excess |
$ | 64,440 | $ | 61,953 | ||||
|
|
|
|
|
|||||
3
Table of Contents
MANAGEMENT’S DISCUSSION AND ANALYSIS OF
FINANCIAL CONDITION AND RESULTS OF OPERATIONS
General
This discussion relates to the financial condition and results of operations of the Company, which consist of the consolidation of Heritage Bank USA, Inc. (“the Bank”) and HopFed Bancorp, Inc. (“the Corporation”) Fall and Fall Insurance Inc. (“Fall and Fall”), JBMM, LLC, Heritage Interim Corporation, Heritage USA Title, LLC and Fort Webb, LLC. The Corporation became the holding company for the Bank in February 1998. The principal business of the Bank consists of accepting deposits from the general public and investing these funds primarily in loans and in investment securities and mortgage-backed securities. The Bank’s loan portfolio consists primarily of loans secured by residential real estate located in its market area.
The Company’s loan demand remained weak in 2014. Management continued to focus on reducing our average cost of deposits. For the year ended December 31, 2014, the average cost of average time deposits was 1.16%, as compared to 1.39% for the year ended December 31, 2013. For the years ended December 31, 2014, and December 31, 2013, our average cost of total deposits was 0.75% and 0.95%, respectively. As a result of our efforts to reduce the Company’s cost of deposit expense, total time deposits declined by $50.1 million and $55.1 million in the years ended December 31, 2014, and December 31, 2013, respectively. At December 31, 2014, total time deposits now compose 45.3% of total deposits, as compared to 65.0% of total deposits at December 31, 2011. At December 31, 2014, the Company announced that we prepaid $35.9 million in Federal Home Loan Bank (“FHLB”) borrowings with a weighted average cost of 4.06%. The prepayment of FHLB borrowings will reduce the Company’s future interest expense by approximately $1.5 million in 2015, $1.4 million in 2016, $730,000 in 2017 and $70,000 in 2018.
The opportunities for the Company to further reduce our interest expense in the year ending December 31, 2015, are limited due to the smaller amount and lower weighted average cost of time deposits scheduled to mature. At December 31, 2014, the Company has $91.4 million in time deposits set to mature between December 2015 and February 2016 with a weighted average cost of 1.99%. Therefore, the time frame of December 2015 to February 2016 provides the Company with the most significant remaining opportunity to reduce our time deposit cost. The Company has an interest rate swap, discussed in Note 15 of the Company’s 2014 Audited Financial Statements, that will mature in October 2015.
At December 31, 2014, the Company’s credit quality is significantly improved as compared to prior years. In the first six months of 2012, the Company experienced a significant increase in its level of classified loans, those loans risk graded as either substandard or doubtful. The Company’s level of classified loans increased from $49.3 million at December 31, 2011, to $82.2 million at March 31, 2012, and $90.4 million at June 30, 2012. The increase in classified loans resulted from a combination of factors, including updated financial analysis that indicated that some customer’s ability to service their debt was weakening, a lack of current financial information on specific customers and slower than anticipated sales of both new homes and developed subdivision lots.
In response to this negative trend, management undertook aggressive action to remediate the increase in classified loans. These actions included additional customer contact with problem credits, the review of interim financial statements to more closely monitor developing trends in customer’s finances and the establishment of a special assets department. The special assets department (“special assets”) assumes the responsibility for a smaller number of loan relationships that are adversely classified, have negative cash flow trends developing, are likely to face future foreclosing actions or may already be in the process of foreclosure. The purpose of special assets is to determine if a customer relationship can be saved by improved financial reporting and performance. If the Company determines that the customer’s finances are not likely to improve in the future, the special assets officer develops a strategy for the Company to exit the relationship.
At December 31, 2014, the Company has $37.4 million in loans classified as substandard, representing 33.6% of our risk based capital. The decline in classified loans has been accomplished by the improved financial performance of specific customers, an increased monitoring of customer financial statements, the sale of certain classified loans, the restructuring of development loans into amortizing loans, and the liquidation of other problem loans. It is the intent of the Company to continue to place a heavy emphasis on this strategy, with a goal to reduce and maintain our level of classified asset to risk based capital to less than 30%.
4
Table of Contents
At December 31, 2014, approximately $11.0 million, or 41.1% of the Company’s land portfolio (non-agricultural related) is classified as substandard. At December 31, 2014, the Company has no land loans under development. At December 31, 2014, the inventory of land loans includes 131 lots available for sale with an aggregate loan balance of $3.4 million. The average lot has a loan balance of approximately $26,300. At December 31, 2013, the inventory of land loans included 297 lots available for sale with an aggregate loan balance of $10.8 million. The average lot had an average loan balance of approximately $36,300.
Also at December 31, 2014, the Company has $16.8 million in land loans on property that is designated for future development in which no meaningful infrastructure has been financed. These loans represent approximately 1,247 acres of land with an average price per acre of approximately $13,500. The remaining $6.5 million in land loans are considered to be used for personal and recreational purposes. At December 31, 2013, the Company had $18.5 million in land loans on property that is designated for future development in which no meaningful infrastructure has been started. These loans represented approximately 1,322 acres of land with an average price per acre of approximately $14,000. The reduction of land loans classified as substandard remains a high priority of management.
For the year ended December 31, 2014, the Company recorded net income available for common shareholders of $2.2 million, a return on average assets of 0.23% and a return on average equity of 2.2%. Company results for the year ended December 31, 2014, were adversely affected by the decision to prepay $35.9 million in FHLB advances and incurring a prepayment penalty of $2.5 million and a $1.8 million loss on the sale of a substandard rated commercial real estate loan.
For the year ended December 31, 2013, the Company recorded net income available for common shareholders of $3.8 million, a return on average assets of 0.39% and a return on average equity of 3.59%. Company results for the year ended December 31, 2013, improved as a result of the repurchase of preferred stock in December of 2012. For the years ended December 31, 2012, and December 31, 2011, the Company’s net income available to common shareholders was reduced by $1,229,000 and $1,031,000, respectively, as a result of our issuance of preferred stock to the United States Treasury. In December 2012, the Company repurchased all shares of Preferred Stock from the Treasury, eliminating the negative effects to future shareholder income. On January 16, 2013, the Company repurchased the Warrant from the Treasury for $257,000.
The Company’s net income is dependent primarily on its net interest income, which is the difference between interest income earned on its loans, investment securities and mortgage-backed securities portfolios and interest paid on interest-bearing liabilities. Net interest income is determined by (i) the difference between yields earned on interest-earning assets and rates paid on interest-bearing liabilities (“interest rate spread”) and (ii) the relative amounts of interest-earning assets and interest-bearing liabilities. The Company’s interest rate spread is affected by regulatory, economic and competitive factors that influence interest rates, loan demand and deposit flows. To a lesser extent, the level of non-interest expenses such as compensation, employee benefits, data processing expenses, local deposit and federal income taxes also affect the Company’s net income.
The operations of the Company and the entire financial services are significantly affected by prevailing economic conditions, competition and the monetary, fiscal and regulatory policies of governmental agencies. Lending activities are influenced by the demand for and supply of housing, competition among lenders, the level of interest rates and the availability of funds. Deposit flows and costs of funds are influenced by prevailing market rates of interest, primarily on competing investments, account maturities and the levels of personal income and savings in the Company’s market area.
5
Table of Contents
Aggregate Contractual Obligations
| Maturity by Period | ||||||||||||||||||||
| December 31, 2014 (In thousands) | Less than | Greater than 1 year |
Greater than 3 year |
Greater than |
||||||||||||||||
| 1 year | to 3 years | to 5 years | 5 years | Total | ||||||||||||||||
| Deposits |
$ | 539,101 | 169,322 | 22,885 | — | 731,308 | ||||||||||||||
| FHLB borrowings |
30,000 | 4,000 | — | — | 34,000 | |||||||||||||||
| Repurchase agreements |
51,358 | 6,000 | — | — | 57,358 | |||||||||||||||
| Subordinated debentures |
— | — | — | 10,310 | 10,310 | |||||||||||||||
| Lease commitments |
227 | 351 | 21 | — | 599 | |||||||||||||||
| Purchase obligations |
5,372 | 4,131 | 187 | — | 9,690 | |||||||||||||||
|
|
|
|
|
|
|
|
|
|
|
|||||||||||
| Total |
626,058 | 183,804 | 23,093 | 10,310 | 843,265 | |||||||||||||||
|
|
|
|
|
|
|
|
|
|
|
|||||||||||
Deposits represent non-interest bearing, money market, savings, NOW, certificates of deposit and all other deposits held by the Company. Amounts that have an indeterminate maturity period are included in the less than one-year category.
FHLB borrowings represent the amounts that are due to FHLB of Cincinnati. All amounts have fixed maturity dates. On December 30, 2014, the Company announced that it had pre-paid $35.9 million in advances and incurred a $2.5 million prepayment penalty in the process. To accommodate the advance prepayment, the Company borrowed $15.0 million with a maturity of thirty days and $15.0 million with a maturity of six months. The Company maintains a $4.0 million advance due in March 2016 at a rate of 5.36%.
Subordinated debentures represent the amount borrowed in a private pool trust preferred issuance group on September 25, 2003. The debentures are priced at the three-month LIBOR plus 3.10%. At December 31, 2014, the three-month Libor rate was 0.25%. The debentures re-price and pay interest quarterly and have a thirty-year final maturity. The debentures may be called at the issuer’s discretion on a quarterly basis after five years. The interest rate of the debentures reset on the 8th day of January, April, August and November of each year.
Lease commitments represent the total minimum lease payments under non-cancelable operating leases.
The most significant operating contract is for the Company’s data processing services, which re-prices monthly based on the number of accounts and other operational factors. Estimates have been made to include reasonable growth projections. In December 2010, the Company renewed the operating contract with the current data processing provider for a period not to exceed five years. The Company anticipates only a minor increase in fixed and variable cost rates with this contract.
Off Balance Sheet Arrangements
| Maturity by Period | ||||||||||||||||||||
| December 31, 2014 (In thousands) | Less than | Greater than 1 year |
Greater than 3 year |
Greater than |
||||||||||||||||
| 1 year | to 3 years | to 5 years | 5 years | Total | ||||||||||||||||
| Commercial lines of credit |
$ | 11,431 | 37,560 | 28 | 7 | 49,026 | ||||||||||||||
| Commitments to extend credit |
16,170 | 18,701 | 5,469 | 4,837 | 45,177 | |||||||||||||||
| Standby letters of credit |
443 | 19 | — | — | 462 | |||||||||||||||
| Home equity lines of credit |
714 | 1,352 | 3,680 | 24,097 | 29,843 | |||||||||||||||
|
|
|
|
|
|
|
|
|
|
|
|||||||||||
| Total |
$ | 28,758 | 57,632 | 9,177 | 28,941 | 124,508 | ||||||||||||||
|
|
|
|
|
|
|
|
|
|
|
|||||||||||
6
Table of Contents
Standby letters of credit represent commitments by the Company to repay a third party beneficiary when a customer fails to repay a loan or debt instrument. The terms and risk of loss involved in issuing standby letters of credit are similar to those involved in issuing loan commitments and extending credit. In addition to credit risk, the Company also has liquidity risk associated with stand-by letters of credit because funding for these obligations could be required immediately. Unused lines of credit represent commercial and residential equity lines of credit with maturities ranging from one to fifteen years.
Accounting for Derivative Instruments and Hedging Activities
In October 2008, the Bank entered into a receive fixed pay variable swap transaction in the amount of $10.0 million with Compass Bank of Birmingham in which Heritage Bank will pay Compass a fixed rate of 7.27% quarterly for seven years while Compass will pay Heritage Bank a rate equal to the three month London Interbank Offering Rate (“LIBOR”) plus 3.10%, the rate banks in London charge one another for overnight borrowings. The Bank has signed an inter-company transfer with the Company that allows the Company to convert its variable rate subordinated debenture issuance to a fixed rate. The critical terms of the interest rate swap match the term of the corresponding variable rate subordinated debt issuance. The Company considers the interest rate swap a cash flow hedge and conducts a quarterly analysis to ensure that the hedge is effective. At December 31, 2014, the Company’s review indicates that the cash flow hedge is effective. At December 31, 2014, the approximate market loss on the cash flow hedge is $390,000.
Quantitative and Qualitative Disclosure about Market Risk
Quantitative Aspects of Market Risk. The principal market risk affecting the Company is risk associated with interest rate volatility (interest rate risk). The Company does not maintain a trading account for investment securities. The Company is not subject to foreign currency exchange rate risk or commodity price risk. Substantially all of the Company’s interest rate risk is derived from the Bank’s lending, deposit taking, and investment activities. This risk could result in reduced net income, loss in fair values of assets and/or increases in fair values of liabilities due to changes in interest rates.
Qualitative Aspects of Market Risk. The Company’s principal financial objective is to achieve long-term profitability while reducing its exposure to fluctuating market interest rates. The Company has sought to reduce the exposure of its earnings to changes in market interest rates by attempting to manage the mismatch between assets and liabilities maturities and interest rates. The principal element in achieving this objective is to increase the interest-rate sensitivity of the Company’s interest-earning assets by retaining for its portfolio loans with interest rates subject to periodic adjustment to market conditions. The Company relies on retail deposits as its primary source of funds. However, management is utilizing brokered deposits, wholesale repurchase agreements and FHLB borrowings as sources of liquidity. As part of its interest rate risk management strategy, the Bank promotes demand accounts, overnight repurchase agreements and certificates of deposit with primarily terms of up to five years.
Asset / Liability Management
Key components of a successful asset/liability strategy are the monitoring and managing of interest rate sensitivity of both the interest-earning asset and interest-bearing liability portfolios. The Company has employed various strategies intended to minimize the adverse affect of interest rate risk on future operations by providing a better match between the interest rate sensitivity between its assets and liabilities. In particular, the Company’s strategies are intended to stabilize net interest income for the long-term by protecting its interest rate spread against increases in interest rates. Such strategies include the origination of adjustable-rate mortgage loans secured by one-to-four family residential real estate, and, to a lesser extent, multi-family real estate loans and the origination of other loans with interest rates that are more sensitive to adjustment based upon market conditions than long-term, fixed-rate residential mortgage loans. At December 31, 2014, approximately $138.3 million of the $186.9 million of one-to-four family residential loans originated by the Company (comprising 75.5% of such loans) had adjustable rates or will mature within one year.
7
Table of Contents
The U.S. government agency securities generally are purchased for a term of fifteen years or less. Securities may or may not have call options. A security with call options improves the yield on the security but also has little or no positive price convexity. Non-callable securities or securities with one time calls offer a lower yield but more positive price convexity and an improved predictability of cash flow. Generally, securities with the greater call options (continuous and quarterly) are purchased only during times of extremely low interest rates. The reasons for purchasing these securities generally focus on the fact that a non callable or one time call is of little value if rates are exceptionally low.
In 2011, Standard and Poor, Inc. issued a rating downgrade on all debt issued or guaranteed by the U.S. government. This downgrade has had little impact on the liquidity and yields associated with any form of U.S. guaranteed debt. The Company remains heavily invested in U.S. agency debt and the Company has not experienced any negative effects due to the rating change. The Company has no exposure of the rating downgrades.
At December 31, 2014, the Company owns two U.S. Treasury securities with a combined market value of $4.0 million. Both securities mature in 2017 and have the full faith and credit guarantee of the United States government. Also at December 31, 2014, the Company owed a $2.0 million floating rate General Electric Capital Corporation bond with a final maturity of April 15, 2020. The floating rate is equal to the one month LIBOR plus 0.80%.
At December 31, 2014, the Company’s agency security portfolio consisted of $6.3 million of unsecured debt issued by Federal Home Loan Mortgage Corporation (FHLMC), $9.5 million issued by the Federal Home Loan Bank (FHLB) and $8.4 issued by the Federal Farm Credit Bank (FFCB). All U.S. Agency debt securities have a credit rating of AA+ and continue to maintain the implicit backing of the United States of America. The Company has $646,000 in an amortizing FHLMC note set to mature in 2022.
At December 31, 2014, $11.0 million in agency securities were due within five years and approximately $13.2 million were due in five to ten years. At December 31, 2014, $11.2 million of these securities had a call provision, which authorizes the issuing agency to prepay the securities at face value on or before March 31, 2015. If, prior to their maturity dates, market interest rates decline below the rates paid on the securities, the issuing agency may elect to exercise its right to prepay the securities. At December 31, 2014, the non-amortizing agency portfolio has an estimated weighted average maturity is 4.8 years and an effective duration of 4.5 years.
The Company owns significant positions in agency securities issued by the Small Business Administration. These securities are classified as SBAPs, SBICs and SBA Pools. The SBAP notes have a twenty year maturity, pay interest monthly and principal semi-annually. The SBIC notes have a ten year final maturity and pay principal and interest quarterly. SBA pools are floating rate securities tied to prime that may have final maturities of ten, twenty-five or thirty year maturities and pay principal and interest monthly. The interest rate on SBA pools reset either on a quarterly or monthly basis, providing the Company with lower price volatility as compared to fixed rate securities. The purchase of variable rate securities with low price volatility provides the Company with a source of lower risk liquidity should loan demand improve or interest rates increase. The risk in purchasing SBA Pools is that they are typically purchased at significant premiums and provide lower yields as compared to many long term fixed rate investment products.
All SBA securities, SBAP, SBIC’s and SBA Pools are backed by the full faith and credit of the United States Government and classified by the Company’s regulators as zero risk based assets. SBIC notes are ten year notes that typically behave similar to a ten year mortgage backed security, with slow prepayments in their first two or three years and then experiencing an acceleration of payments. SBAP notes typically experience slower prepayment speeds as compared to 20 year GNMA mortgage backed securities as SBAP notes typically have prepayment penalties that make it cost prohibitive for many borrowers to prepay during the first five years of the loan. Current SBA pools are experiencing abnormally slow prepayment speeds as the loans tied to the prime rate provide relatively inexpensive financing for businesses requiring an SBA guarantee to meet their credit needs. Typically, SBA pools will experience an increase in prepayments as they become more than two years old. In 2014, the Company sold the majority of its SBA pool portfolio due to increasing prepayment speeds.
8
Table of Contents
At December 31, 2014, the Company’s agency bond portfolio includes approximately $62.8 million in SBAP securities, $16.6 million in SBIC securities and $3.5 million in SBA Pools. At December 31, 2014, the weighted average life of the Company’s amortizing U.S. Agency portfolio is 5.1 years and the portfolio has an effective duration of 3.7 years.
The Company maintains a significant municipal bond portfolio. The majority of the municipal portfolio was purchased during 2008 and 2009 as municipal bond yields increased to levels not seen in the last ten years despite record low Treasury rates. The municipal bond portfolio largely consists of local school district and county courthouse bonds with guarantees from both the local counties and the State of Kentucky and general obligations bonds issued by municipalities in Tennessee and Kentucky. The Company’s municipal portfolio consists of the following types of securities:
| Market Value | ||||
| (Dollars in Thousands) | ||||
| • Kentucky school bonds |
$ | 27,656 | ||
| • Kentucky general obligation bonds |
9,988 | |||
| • Other Kentucky bonds |
20,470 | |||
| • Tennessee general obligation bonds |
7,140 | |||
| • Out of state bonds |
7,836 | |||
|
|
|
|||
| Total |
$ | 73,090 | ||
|
|
|
|||
At December 31, 2014, the Company has $61.0 million in tax free municipal bonds and $12.1 million in taxable municipal bonds. Municipal bonds were purchased to provide long-term income stability and higher tax equivalent yields as compared to other portions of the Company’s investment portfolio. The Company’s investment policy limits municipal concentrations to 125% of the Bank’s Tier 1 Capital, currently $102.2 million. The investment policy places a concentration limit on the amounts of municipal bonds per issuer in Tennessee and Kentucky to 15% of the Bank’s Tier 1 Capital and out of market issuers to 10% of Tier 1 Capital. At December 31, 2013, the largest municipal bond concentration for one issuer was $4.8 million. The investment policy limits concentrations in the amounts a single state guarantee program can provide to a bond at 75% of Tier 1 Capital. The Company is currently within policy guidelines on all concentration limits.
At December 31, 2014, $4.9 million in municipal bonds were due in less than one year, $6.9 million were due within one to five years, $27.4 million were due in five to ten years, $26.6 million were due in ten to fifteen years and approximately $7.3 million were due after fifteen years. At December 31, 2014, approximately $54.1 million of the Company’s municipal bond portfolio is callable with call dates ranging from May 2015 to December 2022. The majority of callable municipal bonds purchased by the Company were originally scheduled to have a call ten years after issuance. At December 31, 2014, approximately $6.7 million of municipal bonds had a call date of less than one year; approximately $38.6 million had a call date from one to five years and approximately $11.9 million in more than five years but less than ten years. At December 31, 2014, the weighted average life of the municipal bond portfolio is 4.4 years and its modified duration is 3.0 years.
Mortgage-backed securities entitle the Company to receive a pro-rata portion of the cash flow from an identified pool of mortgages. Although mortgage-backed securities generally offer lesser yields than the loans for which they are exchanged, mortgage-backed securities present lower credit risk by virtue of the guarantees that back them, are more liquid than individual mortgage loans, and may be used to collateralize borrowings or other obligations of the Company. Further, mortgage-backed securities provide a monthly stream of both interest and principal, thereby providing the Company with a cash flow to reinvest at current market rates and limit the Company’s interest rate risk. Mortgage backed securities may be collateralized by either single family or multi-family properties.
At December 31, 2014, the Company’s mortgage backed security portfolio consisted of $3.3 million issued by the FHLMC, $50.8 million issued by the FNMA and $28.1 million issued by the Government National Mortgage Agency (GNMA). GNMA securities are guaranteed by the full faith and credit of the U.S. Government while FHLMC and FHLB mortgage backed securities maintain the implicit backing of the United States of America.
9
Table of Contents
In 2014, the prepayment speeds of single family mortgage backed securities slowed considerable as most homeowners with a desire to refinance their home had already done so. All multi-family mortgage backed securities contain substantial prepayment penalties for a significant portion of their life. Unlike single family mortgage backed securities, multi-family mortgage backed securities have a five, seven or ten year balloon payment. At December 31, 2014, the majority of the Company’s mortgage back security portfolio consisted of fixed rate mortgages with approximately $15.2 million in adjustable rate mortgages. The weighted average life of the portfolio is approximately 5.9 years and an effective duration is approximately 3.0 years.
At December 31, 2014, the Company held approximately $28.0 million in Collateral Mortgage Obligations (CMO) issued by various agencies of the United States government, including $6.0 million by GNMA, $7.2 million by FHLMC and $14.8 million by FNMA. A CMO is a mortgage-backed security that has a structured payment stream based on various factors and does not necessarily remit monthly principal and interest on a pro-rata basis. At December 31, 2014, the Company’s CMO portfolio had a weighted average life of approximately 3.3 years and a modified duration of approximately 3.7 years.
At December 31, 2014, the Company held $189,000 of a private label CMO, and $9.4 million in floating rate SLMA collateralized debt obligation (“CDO”) secured by federally guaranteed student loans. The CDO owned by the Company utilizes a pool of government guaranteed student loans as collateral and not mortgage loans. The CDO’s secured by SLMA collateral are floating rate securities tied to the one month Libor rate and re-price on a monthly basis.
In June of 2008, the Company purchased $2.0 million par value of a private placement subordinated debenture issued by First Financial Services Corporation (“FFKY”), the holding company for First Federal Savings Bank (“First Fed”). The debenture is a thirty year security with a coupon rate of 8.00%. FFKY was a NASDAQ listed commercial bank holding company located in Elizabethtown, Kentucky. In October of 2010, FFKY informed the owners of its subordinated trust, including the Company, that it was deferred dividend payments for up to five years as prescribed by the trust. FFKY and First Fed have significant asset quality issues that have resulted in negative earnings since 2009. In 2013, the Company recognized a $400,000 other than temporary impairment loss on the subordinated debenture issued by FFKY. The recognition of a loss was the result of the Company’s analysis that, despite a slowly improving financial condition, FFKY was not likely to resume dividend payments prior to the end of the five year interest rate extension period.
On January 1, 2015, FFKY was sold and merged into Community Bank Shares of Indiana, (“CBIN”). On January 12, 2015, the Company was notified by Wilmington Trust that its investment in First Federal Statutory Trust III, (“FFKY Trust”), has elected to terminate the extension period of interest payments effective January 1, 2015. All accrued interest due and payable to all owners of securities through March 15, 2015, has been paid to the trustee. The Trustee will hold the funds until the next interest payment date of March 16, 2015. At that time, the Company will receive a total of $871,000 of interest and compounded interest and will continue to receive regularly scheduled interest of approximately $40,000 each quarter thereafter. On January 21, 2015, the Company has determined that FFKY Trust is no longer impaired and has placed the investment back into accrual status.
Interest Rate Sensitivity Analysis
The Company’s profitability is affected by fluctuations in interest rates. A sudden and substantial increase or decrease in interest rates may adversely impact the Company’s earnings to the extent that the interest rates on interest earning assets and interest bearing liabilities do not change at the same speed, to the same extent or on the same basis. As part of its effort to manage interest rate risk, the Bank monitors its net economic value of capital (“EVE”) by using our asset liability software to assist in modeling how changes in interest rates affect the values of various assets and liabilities on the Company’s balance sheet. By calculating our EVE, the Company is able to construct models that show the effect of different interest rate changes on its total capital. This risk analysis is a key tool that allows banks to prepare against constantly changing interest rates.
10
Table of Contents
Generally, EVE is a cash flow calculation that takes the present value of all asset cash flows and subtracts the present value of all liability cash flows. The application of the methodology attempts to quantify interest rate risk as the change in the EVE, which would result from a theoretical 200 basis point (1 basis point equals .01%) change in market rates. Both a 300 basis point increase in market interest rates and a 100 basis point decrease in market interest rates are considered.
The following table presents the Company’s EVE at December 31, 2014, as calculated by the Company’s asset liability model for the year period ending December 31, 2014.
| Change | Net Portfolio Value | |||||||||||
| In Rates |
$ Amount | $ Change | % Change | |||||||||
| (Dollars in thousands) | ||||||||||||
| +300 bp |
$ | 67,292 | ($ | 48,306 | ) | (41.8 | %) | |||||
| +200 bp |
83,498 | (32,100 | ) | (37.8 | %) | |||||||
| +100 bp |
98,230 | (17,368 | ) | (15.0 | %) | |||||||
| 0 bp |
115,598 | — | — | |||||||||
| -100 bp |
128,304 | 12,706 | 11.0 | % | ||||||||
| Interest Rate Risk Measures: 200 Basis Point (bp) Rate Shock |
||||||||
| Tangible Common Equity Ratio at December 31, 2013 |
9.8 | % | ||||||
| Pre-Shock Tier 1 Capital Ratio at December 31, 2014 |
10.9 | % | ||||||
| Exposure Measure: 2% Increase in Rates |
7.5 | % | ||||||
The computation of prospective effects of hypothetical interest rate changes are based on numerous assumptions, including relative levels of market interest rates, loan prepayments and deposit decay rates, and should not be relied upon as indicative of actual results. The computations do not contemplate any actions the Company could undertake in response to changes in interest rates. The matching of assets and liabilities may be analyzed by examining the extent to which such assets and liabilities are “interest rate sensitive” and by monitoring an institution’s interest rate sensitivity “gap.” An asset or liability is said to be interest rate sensitive within a specific period if it will mature or re-price within that period.
Interest Income Analysis
As a part of the Company’s asset liability management process, an emphasis is placed on the effect that changes in interest rates have on the net interest income of the Company and the resulting change in the net present value of capital. As a part of its analysis, the Company uses third party software and analytical tools derived from the Company’s regulatory reporting models to analyze the re-pricing characteristics of both assets and liabilities and the resulting net present value of the Company’s capital given various changes in interest rates. The model also uses mortgage prepayment assumptions obtained from third party vendors to anticipate prepayment speeds on both loans and investments. The Company’s model uses incremental changes in interest rates. For example, a 3.0% change in annual rates includes a 75 basis point change in each of the next four quarters.
For the year ended December 31, 2014, the Company’s previous efforts to increase duration had a positive effect on its results of operations. At December 31, 2014, the extended duration remains in effect. However, the purchase of SBA pools in late 2011 and 2012 were taken as an effort to limit the effects of the longer duration in the municipal bond portfolio. The monthly and quarterly re-pricing of the SBA Pools provides a first source of liquidity should interest rates increase or loan demand improve.
11
Table of Contents
Beginning in 2012 and continuing through 2013 and 2014, management has sought to reduce the Company’s cost of interest bearing liabilities by reducing both the cost and dependency on time deposit funding. The average balance and weighted average cost of time deposits has declined in each of the last two years. The average balance of time deposits for the year ended December 31, 2011, $548.0 million, as compared to $486.6 million, $407.0 million and $356.1million for the years ended December 31, 2012, December 31, 2013, and December 31, 2014, respectively. The average cost of time deposits for the years ended December 31, 2011, December 31, 2012, December 31, 2013 and December 31, 2014, was 2.29%, 1.90%, 1.41%, and 1.17%, respectively. These efforts, in the face of weak loan growth for most of the last three years, worked to reduce the Company’s interest expense and make modest improvements to the Company’s net interest margins. The Company’s loan growth was sluggish during 2014 and 2013. In October 2014, we opened a loan production office in Nashville, Tennessee, the most economically vibrant community within the Company’s current market area. To make further improvements to our net interest margin, loan growth is essential.
The amount of change in interest rate sensitivity eventually achieved by management will be largely dependent on its ability to make changes at a reasonable cost. The reduction of interest rate in the one to two year time frame can dramatically reduce the Company’s net income due to the severe upward slope of the interest rate yield curve. To the extent possible, management will reduce its balances in FHLB deposits to ensure greater flexibility in the event of a sudden change of interest rates.
The Company’s analysis at December 31, 2014, indicates that changes in interest rates are likely to result in modest changes in the Company’s annual net interest income. A summary of the Company’s analysis at December 31, 2014, for the year ending December 31, 2015, is as follows:
| Down 1.00% | No Change | Up 1.00% | Up 2.00% | Up 3.00% | ||||||||||||||||
| (Dollars in Thousands) | ||||||||||||||||||||
| Net interest income |
$ | 24,530 | $ | 25,424 | $ | 25,674 | $ | 26,008 | $ | 26,335 | ||||||||||
Gap Analysis
The interest rate sensitivity gap is defined as the difference between the amount of interest-earning assets maturing or re-pricing within a specific time period and the amount of interest-bearing liabilities maturing or re-pricing within that time period. A gap is considered positive when the amount of interest rate sensitive assets exceeds the amount of interest rate sensitive liabilities, and is considered negative when the amount of interest rate sensitive liabilities exceeds the amount of interest rate sensitive assets.
At December 31, 2014, the Company had a negative one year or less interest rate sensitivity gap of 27.43% of total interest-earning assets. Generally, during a period of rising interest rates, a negative gap position would be expected to adversely affect net interest income while a positive gap position would be expected to result in an increase in net interest income. Conversely during a period of falling interest rates, a negative gap would be expected to result in an increase in net interest income and a positive gap would be expected to adversely affect net interest income. This analysis is considered less reliable as compared to the Company’s ALM models as changes in various interest rate spreads are not incorporated in Gap Analysis. Furthermore, the presence of non-interest bearing liabilities does not factor in the Company’s Gap Analysis but provides an additional source of funds that can offset the negative impact of changing interest rates. Gap Analysis does not give considerations to how much the yield on assets and the cost of liabilities may change in any given period. In the current rate environment, loans yields often re-price more quickly and more substantially as opposed to short term deposits, which are currently priced a much lower levels.
12
Table of Contents
The following table sets forth the amounts of interest-earning assets and interest-bearing liabilities outstanding at December 31, 2014, which are expected to mature, are likely to be called or re-priced in each of the time periods shown.
| One Year or Less |
Over one Through Five Years |
Over Five Through Ten Years |
Over Ten Through Fifteen Years |
Over Fifteen Years |
Total | |||||||||||||||||||
| Interest-earning assets |
||||||||||||||||||||||||
| Loans: |
||||||||||||||||||||||||
| 1 - 4 family residential |
$ | 103,603 | 53,042 | 22,286 | 5,226 | 2,734 | 186,891 | |||||||||||||||||
| Multi-family |
6,866 | 11,437 | 6,705 | 983 | — | 25,991 | ||||||||||||||||||
| Construction |
12,461 | 9,004 | 2,776 | — | — | 24,241 | ||||||||||||||||||
| Non-residential |
41,878 | 70,747 | 31,497 | 4,334 | 2,140 | 150,596 | ||||||||||||||||||
| Land |
16,492 | 9,984 | 178 | — | — | 26,654 | ||||||||||||||||||
| Farmland |
9,068 | 16,222 | 12,081 | 4,684 | 819 | 42,874 | ||||||||||||||||||
| Consumer |
2,202 | 10,167 | 1,723 | 346 | — | 14,438 | ||||||||||||||||||
| Commercial |
38,052 | 25,711 | 9,643 | 658 | 90 | 74,154 | ||||||||||||||||||
| Interest bearing deposits |
6,050 | — | — | — | — | 6,050 | ||||||||||||||||||
| Non-amortizing securities |
13,129 | 58,091 | 35,565 | 1,538 | 1,489 | 109,812 | ||||||||||||||||||
| Amortizing securities |
7,726 | 14,203 | 28,253 | 22,602 | 5,650 | 78,434 | ||||||||||||||||||
| Mortgage backed securities |
22,343 | 73,812 | 17,641 | 4,374 | 1,640 | 119,810 | ||||||||||||||||||
|
|
|
|
|
|
|
|
|
|
|
|
|
|||||||||||||
| Total |
279,870 | 352,420 | 168,348 | 44,745 | 14,562 | 859,945 | ||||||||||||||||||
|
|
|
|
|
|
|
|
|
|
|
|
|
|||||||||||||
| Interest bearing liabilities: |
||||||||||||||||||||||||
| Deposits |
424,050 | 192,207 | — | — | — | 616,257 | ||||||||||||||||||
| Borrowed funds |
91,668 | 10,000 | — | — | — | 101,668 | ||||||||||||||||||
|
|
|
|
|
|
|
|
|
|
|
|
|
|||||||||||||
| Total |
515,718 | 202,207 | — | — | — | 717,925 | ||||||||||||||||||
|
|
|
|
|
|
|
|
|
|
|
|
|
|||||||||||||
| Interest sensitivity gap |
($ | 235,848 | ) | 150,213 | 168,348 | 44,745 | 14,562 | 142,020 | ||||||||||||||||
|
|
|
|
|
|
|
|
|
|
|
|
|
|||||||||||||
| Cumulative interest sensitivity gap |
($ | 235,848 | ) | (85,635 | ) | 82,713 | $ | 127,458 | $ | 142,020 | 142,020 | |||||||||||||
|
|
|
|
|
|
|
|
|
|
|
|
|
|||||||||||||
| Ratio of interest-earning assets to interest bearing liabilities |
(54.27 | %) | 174.29 | % | — | — | — | 119.78 | % | |||||||||||||||
|
|
|
|
|
|
|
|
|
|
|
|
|
|||||||||||||
| Ratio of cumulative gap to total interest-earning assets |
(27.43 | %) | (9.96 | %) | 9.62 | % | 14.82 | % | 16.52 | % | 16.52 | % | ||||||||||||
|
|
|
|
|
|
|
|
|
|
|
|
|
|||||||||||||
The preceding table was prepared based upon the assumption that loans will not be repaid before their respective contractual maturities, except for adjustable rate loans, which are classified, based upon their next re-pricing date. Further, it is assumed that fixed maturity deposits are not withdrawn prior to maturity and other deposits are withdrawn or re-priced within one year. Mortgage-backed securities are classified based on their three month prepayment speeds. Prepayment speeds on mortgage backed securities have slowed considerable as many outstanding mortgage loans have low coupons and are not prone to future refinancing. We anticipate that the majority of mortgage pools will exhibit historically low prepayment speeds for several years. The preceding table does not reflect possible changes in cash flows that may result from this change in Fannie Mae and Freddie Mac portfolio servicing practices or Small Business Administration lending practices. The actual interest rate sensitivity of the Company’s assets and liabilities could vary significantly from the information set forth in the table due to market and other factors. The retention of adjustable-rate mortgage loans in the Company’s investment and loan portfolios helps reduce the Company’s exposure to changes in interest rates. However, there are unquantifiable credit risks resulting from potential increased costs to borrowers as a result of re-pricing adjustable-rate mortgage loans. It is possible that during periods of rising interest rates, the risk of default on adjustable-rate mortgage loans may increase due to the upward adjustment of interest costs to the borrowers.
13
Table of Contents
Average Balance, Interest and Average Yields and Rates
The following table sets forth certain information relating to the Company’s average interest-earning assets and average interest-bearing liabilities and reflects the average yield on assets and average cost of liabilities for the periods and at the date indicated. Such yields and costs are derived by dividing income or expense by the average monthly balance of assets or liabilities, respectively, for the periods presented. Average balances are derived from month-end balances. Management does not believe that the use of month-end balances instead of daily balances has caused any material difference in the information presented.
The table also presents information for the periods and at the date indicated with respect to the difference between the average yield earned on interest-earning assets and average rate paid on interest-bearing liabilities, or “interest rate spread,” which commercial banks have traditionally used as an indicator of profitability. Another indicator of an institution’s net interest income is its “net yield on interest-earning assets,” which is its net interest income divided by the average balance of interest-earning assets. Net interest income is affected by the interest rate spread and by the relative amounts of interest-earning assets and interest-bearing liabilities. When interest-earning assets approximate or exceed interest-bearing liabilities, any positive interest rate spread will generate net interest income.
| December 2014 Monthly Averages | ||||||||
| Balance | Weighted Average Yield/ Cost |
|||||||
| (Dollars in thousands) | ||||||||
| Interest-earning assets: |
||||||||
| Loans receivable, net |
$ | 528,262 | 4.67 | % | ||||
| Non taxable securities available for sale |
61,102 | 4.65 | %* | |||||
| Taxable securities available for sale |
249,260 | 2.21 | % | |||||
| Federal Home Loan Bank stock |
4,428 | 4.00 | % | |||||
| Interest bearing deposits |
9,688 | 0.24 | % | |||||
|
|
|
|
|
|||||
| Total interest-earning assets |
852,740 | 3.94 | % | |||||
| Non-interest-earning assets |
80,836 | |||||||
|
|
|
|||||||
| Total assets |
$ | 933,576 | ||||||
|
|
|
|||||||
| Interest-bearing liabilities: |
||||||||
| Deposits |
$ | 623,860 | 0.84 | % | ||||
| FHLB borrowings |
42,264 | 4.04 | % | |||||
| Repurchase agreements |
40,834 | 1.42 | % | |||||
| Subordinated debentures |
10,310 | 7.14 | % | |||||
|
|
|
|
|
|||||
| Total interest-bearing liabilities |
717,268 | 1.14 | % | |||||
| Non-interest-bearing liabilities |
117,833 | |||||||
|
|
|
|||||||
| Total liabilities |
835,101 | |||||||
| Common stock |
1 | |||||||
| Additional paid-in capital |
58,465 | |||||||
| Retained earnings |
45,729 | |||||||
| Treasury stock |
(9,428 | ) | ||||||
| Accumulated other comprehensive income |
3,708 | |||||||
|
|
|
|||||||
| Total liabilities and equity |
$ | 933,576 | ||||||
|
|
|
|||||||
| Interest rate spread |
2.80 | % | ||||||
|
|
|
|||||||
| Net interest margin |
3.04 | % | ||||||
|
|
|
|||||||
| Ratio of interest-earning assets to interest-bearing liabilities |
118.89 | % | ||||||
|
|
|
|||||||
| * | Tax equivalent yield at the Company’s 34% tax bracket and the Company’s month to date cost of funds rate of 1.14%. |
14
Table of Contents
| Years Ended December 31, | ||||||||||||||||||||||||||||||||||||
| 2014 | 2013 | 2012 | ||||||||||||||||||||||||||||||||||
| Average Balance |
Interest | Average Yield/ Cost |
Average Balance |
Interest | Average Yield/ Cost |
Average Balance |
Interest | Average Yield / Cost |
||||||||||||||||||||||||||||
| (Dollars in Thousands) | ||||||||||||||||||||||||||||||||||||
| Interest-earning assets: |
||||||||||||||||||||||||||||||||||||
| Loans receivable, net (a) |
$ | 534,404 | 26,038 | 4.87 | % | $ | 528,074 | 26,750 | 5.07 | % | $ | 542,292 | 29,837 | 5.50 | % | |||||||||||||||||||||
| Taxable securities AFS |
262,154 | 6,548 | 2.50 | % | 269,304 | 6,873 | 2.55 | % | 313,347 | 8,722 | 2.78 | % | ||||||||||||||||||||||||
| Non-taxable securities AFS |
64,393 | 3,097 | 4.81 | % | 70,178 | 3,292 | 4.69 | % | 68,428 | 2,982 | 4.36 | % | ||||||||||||||||||||||||
| Other interest-bearing deposits |
10,461 | 26 | 0.25 | % | 9,060 | 24 | 0.26 | % | 9,850 | 24 | 0.24 | % | ||||||||||||||||||||||||
|
|
|
|
|
|
|
|
|
|
|
|
|
|
|
|
|
|
|
|||||||||||||||||||
| Total interest-earning assets |
$ | 871,412 | 35,709 | 4.10 | % | $ | 876,616 | 36,939 | 4.21 | % | $ | 933,917 | 41,565 | 4.45 | % | |||||||||||||||||||||
|
|
|
|
|
|
|
|
|
|
|
|
|
|||||||||||||||||||||||||
| Non-interest-earning assets |
77,716 | 80,609 | 85,560 | |||||||||||||||||||||||||||||||||
|
|
|
|
|
|
|
|||||||||||||||||||||||||||||||
| Total assets |
$ | 949,128 | $ | 957,225 | 1,019,477 | |||||||||||||||||||||||||||||||
|
|
|
|
|
|
|
|||||||||||||||||||||||||||||||
| Interest-bearing liabilities: |
||||||||||||||||||||||||||||||||||||
| Deposits |
$ | 640,676 | 5,603 | 0.87 | % | $ | 657,895 | 7,114 | 1.08 | % | $ | 706,394 | 10,571 | 1.50 | % | |||||||||||||||||||||
| Borrowings |
98,574 | 3,276 | 3.32 | % | 96,823 | 3,467 | 3.58 | % | 108,215 | 4,306 | 3.98 | % | ||||||||||||||||||||||||
|
|
|
|
|
|
|
|
|
|
|
|
|
|
|
|
|
|
|
|||||||||||||||||||
| Total interest-bearing liabilities |
739,250 | 8,879 | 1.20 | % | 754,718 | 10,581 | 1.40 | % | 814,609 | 14,877 | 1.83 | % | ||||||||||||||||||||||||
|
|
|
|
|
|
|
|
|
|
|
|
|
|
|
|
|
|
|
|||||||||||||||||||
| Non-interest-bearing liabilities |
109,766 | 97,762 | 90,863 | |||||||||||||||||||||||||||||||||
|
|
|
|
|
|
|
|||||||||||||||||||||||||||||||
| Total liabilities |
849,016 | 852,480 | 905,472 | |||||||||||||||||||||||||||||||||
| Common stock |
79 | 79 | 79 | |||||||||||||||||||||||||||||||||
| Common stock warrants |
— | 18 | 556 | |||||||||||||||||||||||||||||||||
| Additional paid-in capital |
58,384 | 75,353 | 76,072 | |||||||||||||||||||||||||||||||||
| Retained earnings |
45,211 | 39,204 | 38,710 | |||||||||||||||||||||||||||||||||
| Treasury stock |
(5,998 | ) | (14,702 | ) | (6,609 | ) | ||||||||||||||||||||||||||||||
| Accumulated other comprehensive income |
2,436 | 4,793 | 5,197 | |||||||||||||||||||||||||||||||||
|
|
|
|
|
|
|
|||||||||||||||||||||||||||||||
| Total liabilities and equity |
$ | 949,128 | $ | 957,225 | 1,019,477 | |||||||||||||||||||||||||||||||
|
|
|
|
|
|
|
|||||||||||||||||||||||||||||||
| Net interest income |
26,830 | 26,358 | 26,688 | |||||||||||||||||||||||||||||||||
|
|
|
|
|
|
|
|||||||||||||||||||||||||||||||
| Interest rate spread |
2.90 | % | 2.81 | % | 2.62 | % | ||||||||||||||||||||||||||||||
|
|
|
|
|
|
|
|||||||||||||||||||||||||||||||
| Net interest margin |
3.08 | % | 3.01 | % | 2.86 | % | ||||||||||||||||||||||||||||||
|
|
|
|
|
|
|
|||||||||||||||||||||||||||||||
| Ratio of average interest-earning assets to average interest-bearing liabilities |
117.88 | % | 116.15 | % | 114.65 | % | ||||||||||||||||||||||||||||||
|
|
|
|
|
|
|
|||||||||||||||||||||||||||||||
| (a) | Average loans include non-performing loans. |
| (b) | Interest income and yields are presented on a fully tax equivalent basis |
15
Table of Contents
Rate Volume Analysis
The following table sets forth certain information regarding changes in interest income and interest expense of the Company for the periods indicated. For each category of interest-earning asset and interest-bearing liability, information is provided on changes attributable to: (i) changes in volume (changes in volume from year to year multiplied by the average rate for the prior year) and (ii) changes in rate (changes in the average rate from year to year multiplied by the prior year’s volume). All amounts are quoted on a tax equivalent basis using a cost of funds rate of 1.40% for 2013 and a 1.20% rate for 2014.
| Year Ended December 31, | ||||||||||||||||||||||||
| 2014 vs. 2013 | 2013 vs. 2012 | |||||||||||||||||||||||
| Increase (Decrease) due to |
Increase (Decrease) due to |
|||||||||||||||||||||||
| Rate | Volume | Total Increase (Decrease) |
Rate | Volume | Total Increase (Decrease) |
|||||||||||||||||||
| (Dollars in thousands) | ||||||||||||||||||||||||
| Interest-earning assets: |
||||||||||||||||||||||||
| Loans receivable |
$ | (1,020 | ) | 308 | (712 | ) | $ | (2,367 | ) | (720 | ) | (3,087 | ) | |||||||||||
| Securities available for sale, taxable |
(146 | ) | (179 | ) | (325 | ) | (725 | ) | (1,124 | ) | (1,849 | ) | ||||||||||||
| Securities available for sale, non-taxable |
83 | (278 | ) | (195 | ) | 228 | 82 | 310 | ||||||||||||||||
| Other interest- earning assets |
(2 | ) | 4 | 2 | 2 | (2 | ) | — | ||||||||||||||||
|
|
|
|
|
|
|
|
|
|
|
|
|
|||||||||||||
| Total interest- earning assets |
(1,085 | ) | (145 | ) | (1,230 | ) | (2,862 | ) | (1,764 | ) | (4,626 | ) | ||||||||||||
|
|
|
|
|
|
|
|
|
|
|
|
|
|||||||||||||
| Interest-bearing liabilities: |
||||||||||||||||||||||||
| Deposits |
(1,100 | ) | (411 | ) | (1,511 | ) | (2,508 | ) | (949 | ) | (3,457 | ) | ||||||||||||
| Borrowings |
(175 | ) | (16 | ) | (191 | ) | (376 | ) | (463 | ) | (839 | ) | ||||||||||||
|
|
|
|
|
|
|
|
|
|
|
|
|
|||||||||||||
| Total interest- bearing liabilities |
(1,275 | ) | (427 | ) | (1,702 | ) | (2,884 | ) | (1,412 | ) | (4,296 | ) | ||||||||||||
|
|
|
|
|
|
|
|
|
|
|
|
|
|||||||||||||
| Increase (decrease) in net interest income |
$ | 190 | 282 | 472 | $ | 22 | (352 | ) | (330 | ) | ||||||||||||||
|
|
|
|
|
|
|
|
|
|
|
|
|
|||||||||||||
Critical Accounting Policies and Estimates
The Company’s financial statements are prepared in accordance with accounting principles generally accepted in the United States of America. The financial information contained within these statements is, to a significant extent, financial information that is based on appropriate measures of the financial effects of transactions and events that have already occurred. Based on its consideration of accounting policies that involved the most complex and subjective decisions and assessments, management has identified its most critical accounting policy to be that related to the allowance for loan losses. The Company’s allowance for loan loss methodology incorporates a variety of risk considerations, both quantitative and qualitative; in establishing an allowance for loan loss that management believes is appropriate at each reporting date. Quantitative factors included the Company’s historical loss experience, delinquency and charge-off trends, collateral values, changes in non-performing loans, and other factors. Quantitative factors also incorporate known information about individual loans, including borrower’s sensitivity to economic conditions throughout the southeast and particular, the state of certain industries. Size and complexity of individual credits in relation to loan structure, existing loan policies and pace of portfolio growth are other qualitative factors that are considered in the methodology.
16
Table of Contents
As the Company adds new products and increases the complexity of the loan portfolio, its methodology accordingly may change. In addition, it may report materially different amounts for the provision for loan losses in the statement of operations if management’s assessment of the above factors changes in future periods. This discussion and analysis should be read in conjunction with the Company’s consolidated financial statements and the accompanying notes presented elsewhere herein. Although management believes the levels of the allowance for loan losses as of both December 31, 2014 and 2013 were adequate to absorb inherent losses in the loan portfolio, a decline in local economic conditions, or other factors, could result in increasing losses that cannot be reasonably predicted at this time. The Company also considers its policy on non-accrual loans as a critical accounting policy. Loans are placed on non-accrual when a loan is specifically determined to be impaired or when principal or interest is delinquent for 91 days or more.
Comparison of Financial Condition at December 31, 2014 and December 31, 2013
For the year ended December 31, 2014, the Company’s total assets declined by $37.8 million, to $935.8 million as compared to the twelve month period ended December 31, 2013. In December 2014, the Company experienced significant growth in non-interest checking accounts, which now total 15.7% of total deposits. The Company has sought to lower its cost of deposits for several years. As a result, we have experienced a decline in the balances of time deposits. At December 31, 2014, time deposits declined by $50.1 million, to $331.9 million, as compared to and December 31, 2013. At December 31, 2014, the Company’s balance of borrowing from the FHLB declined to $34.0 million, from $46.8 million at December 31, 2013.
The available for sale portfolio declined $15.3 million, from $318.9 million at December 31, 2013, to $303.6 million at December 31, 2014. The Company used cash flows from the investment portfolio to fund a reduction in time deposits and FHLB borrowings. At December 31, 2014, the Company’s investment in Federal Home Loan Bank stock was carried at an amortized cost of $4.4 million.
The Company’s net loan portfolio declined by $4.3 million during the year ended December 31, 2014. Net loans totaled $539.3 million and $543.6 million at December 31, 2014, and December 31, 2013, respectively. The small decline in loan balances in 2014 occurred due to weak loan demand and the sale of a $6.9 million adversely classified loan relationship. In 2015, the Company’s prospects for loan portfolio growth should be enhanced by the opening of a loan production office in Nashville, Tennessee, in October 2014. As discussed in Note 3 of the Company’s Consolidated Financial Statements, our level of classified assets, charge offs and non-accrual loans has been significantly reduced during 2014.
The allowance for loan losses totaled $6.3 million at December 31, 2014, a decline of approximately $2.4 million from the allowance for loan losses of $8.7 million at December 31, 2013. At December 31, 2014, the Company recorded a loss of the sale of that loan of $1.8 million. The ratio of the allowance for loan losses to total loans was 1.15% and 1.57% at December 31, 2014, and December 31, 2013, respectively. Also, at December 31, 2014, the Company’s non-accrual loans were approximately $3.2 million, or 0.58% of total loans, compared to $10.1 million or 1.21% of total loans, December 31, 2013. The Company’s ratio of allowance for loan losses to non-accrual loans at December 31, 2014 and 2013 was 198.07% and 86.25%, respectively.
17
Table of Contents
Comparison of Operating Results for the Years Ended December 31, 2014 and 2013
Net Income. The Company’s net income available for common shareholders for the year ended December 31, 2014, was $2.2 million compared to $3.8 million for the year ended December 31, 2013. In 2014, the reduction in net income was largely the result of the Company’s decision to prepay $35.9 million in FHLB borrowings and incur a prepayment penalty of $2.5 million. This action will save the Company approximately $135,000 per month beginning in January 2015 and the Company will recoup our one time penalty in approximately 20 months. During 2014, the Company sold a loan note for a loss of approximately $1.8 million.
Net Interest Income. Net interest income for the year ended December 31, 2014, was $25.8 million, compared to $25.3 million for the year ended December 31, 2013. The increase in net interest income for the year ended December 31, 2014, was largely the result of a $1.5 million reduction in interest expense on deposits, offsetting a $1.2 million decline in interest income.
For the year ended December 31, 2014, the Company’s tax equivalent average yield on total interest-earning assets was 4.10% compared to 4.21% for the year ended December 31, 2013, and its average cost of interest-bearing liabilities was 1.20%, compared to 1.40% for the year ended December 31, 2013. As a result, the Company’s tax equivalent interest rate spread for the year ended December 31, 2014, was 2.90%, compared to 2.81% for the year ended December 31, 2013, and its tax equivalent net interest margin was 3.08% for the year ended December 31, 2014, compared to 3.01% for the year ended December 31, 2013.
Interest Income. Interest income declined $1.2 million from $35.9 million to $34.7 million, or approximately 3.3% during the year ended December 31, 2014, compared to 2013. The decline in interest income was largely attributable to a decline in yields on assets and a decline in the average balance of interest earning assets. The average balance on taxable securities available for sale declined $7.1 million, from $269.3 million for the year ended December 31, 2013, to $262.2 million for the year ended December 31, 2014. The average yield on taxable securities available for sale was 2.50% and 2.55%, respectively, for the years ended December 31, 2014, and December 31, 2013, respectively. The average balance of non-taxable securities available for sale declined by approximately $5.8 million, from $70.2 million for the year ended December 31, 2013, to $64.4 million for the year ended December 31, 2014. The average yield on non-taxable securities available for sale increased from 4.69% for the year ended December 31, 2013, to 4.81% for the year ended December 31, 2014. For the year ended December 31, 2014, the average balance of loans was $534.4 million, an increase of $6.3 million as compared to the year ended December 31, 2013. The average yield on loans declined from 5.07% for the year ended December 31, 2013, to 4.87% for the year ended December 31, 2014.
Interest Expense. Interest expense declined to $8.9 million for the year ended December 31, 2014, compared to $10.6 million for 2013. The decline in interest expense was attributable to the $1.5 million decline in interest expense on deposits. The average cost of average interest-bearing deposits declined to 0.87% for the year ended December 31, 2014, from 1.08% for the year ended December 31, 2013. Over the same period, the average balance of interest bearing deposits declined from $657.9 million for the year ended December 31, 2013, to $640.7 million for the year ended December 31, 2014. The Company’s cost structure has benefited from its growth of non-interest bearing deposits. For the year ended December 31, 2014, the average balance of non-interest bearing deposits was $104.9 million, an increase of $12.5 million, or 13.5%, over the average balance of non-interest bearing deposits for the year ended December 31, 2013. The average balance of FHLB borrowings declined from $44.9 million for the year ended December 31, 2013, to $42.4 million for the year ended December 31, 2014. The average cost of FHLB borrowings decreased from 3.96% for the year ended December 31, 2013, to 3.92% for the year ended December 31, 2014.
Provision for Loan Losses. The Company determined that an additional $1.6 million in provision for loan losses was required for the year ended December 31, 2013. For the year ended December 31, 2014, the Company determined that significant improvements in our credit quality provided the opportunity to reduce the allowance for loan loss account by $2.3 million. The reduction in the allowance for loan loss account was the result of lower levels of past due loans, improving appraisal values on collateral securing loans classified as substandard, and a continued reduction in the amount of problem assets.
18
Table of Contents
Non-Interest Income. Non-interest income declined by $1.6 million for the year ended December 31, 2014, to $7.8 million, compared to $9.4 million for the year ended December 31, 2013. The decline in non-interest income is largely the result of a $1.1 million decline in gains on the sale of securities. For the year ended December 31, 2014, the Company’s financial services income declined by $270,000 as compared to the year ended December 31, 2013, due to the sale of the Company’s insurance assets in December 2013, which resulted in a gain of $412,000 for the year ended December 31, 2013. For the year ended December 31, 2014, income from service charges declined $316,000, to $3.4 million, as compared to the year ended December 31, 2013. The decline in service charge income appears to be the result of new regulations regarding overdraft protection programs. Income from service charges has declined in both 2014 and 2013 from the prior year’s level.
Non-Interest Expense. Total non-interest expense for the year ended December 31, 2014, was $33.9 million, compared to $28.6 million in 2013, an increase of $5.3 million, or approximately 18.4%. The increase in non-interest expense was heavily influenced by a $1.8 million loss on the sale of an adversely classified commercial real estate loan and the $2.5 million FHLB prepayment penalty. Excluding these two expenses, non-interest expense increased by approximately $1.0 million, or 3.4%, for the year ended December 31, 2014, as compared to the year ended December 31, 2013.
For the year ended December 31, 2014, the Company’s salaries and benefits expense increased by $489,000, or 3.3%, as compared to the year ended December 31, 2013. For the year ended December 31, 2014, state deposit taxes increased by $755,000, or 130% as compared to the year ended December 31, 2013, due to the charter change of the Company’s bank subsidiaries charter. For the year ended December 31, 2014, data processing expenses increased by $192,000, or 7.12% as compared to the year ended December 31, 2013, due to changes implemented for disaster recovery purposes required by regulators. For the year ended December 31, 2014, no other non-interest expense increased by more than $200,000 as compared to the year ended December 21, 2013. For the year ended December 31, 2014, the Company’s most significant reductions in non-interest expense included occupancy expenses and professional services expenses, which declined $258,000 and $442,000, respectively, for the year ended December 31, 2014, as compared to the year ended December 31, 2013.
Income Taxes. The effective tax rates for the years ended December 31, 2014, and December 31, 2013, was (10.1%) and 14.6%, respectively. The Company’s effective tax rate remains well below historical levels due to a higher percentage of pre-tax income that is not subject to federal income tax. The Company’s sizable holdings in municipal bonds, life insurance contracts and certain tax credits earned have lowered our effective tax rate.
Comparison of Operating Results for the Years Ended December 31, 2013 and 2012
Net Income. The Company’s net income available for common shareholders for the year ended December 31, 2013, was $3.8 million compared to $2.8 million for the year ended December 31, 2012. In 2013, the improvement in net income available for common shareholders was largely the result of the repurchase of the Company’s preferred stock in December of 2012, saving the Company $1.2 million in preferred dividends and warrant accretion. In 2013, net income growth was limited by a decline in the average balance and yields of our loan portfolio.
Net Interest Income. Net interest income for the year ended December 31, 2013, was $25.3 million, compared to $26.0 million for the year ended December 31, 2012. The decrease in net interest income for the year ended December 31, 2013, was the result of Company’s declining average balance of loans outstanding and the re-pricing of all assets as interest rates remain at historically low levels. For the year ended December 31, 2013, compared to theyear ended December 31, 2012, the Company’s level of average interest bearing assets declined $57.3 million the average balance of loans receivable declined by $14.2 million, respectively.
For the year ended December 31, 2013, the Company’s tax equivalent average yield on total interest-earning assets was 4.21% compared to 4.45% for the year ended December 31, 2012, and its average cost of interest-bearing liabilities was 1.40%, compared to 1.83% for the year ended December 31, 2012. As a result, the Company’s tax equivalent interest rate spread for the year ended December 31, 2013, was 2.81%, compared to 2.62% for the year ended December 31, 2012, and its tax equivalent net interest margin was 3.01% for the year ended December 31, 2013, compared to 2.86% for the year ended December 31, 2012.
19
Table of Contents
Interest Income. Interest income declined $4.9 million from $40.8 million to $35.9 million, or approximately 12.0% during the year ended December 31, 2013, compared to 2012. The decline in interest income was attributable to a decline in yields on assets as well as a decline in the average balance of interest earning assets. The average balance on taxable securities available for sale declined $44.0 million, from $313.3 million for the year ended December 31, 2012, to $269.3 million for the year ended December 31, 2013. The average balance of non-taxable securities available for sale increased approximately $1.8 million, from $68.4 million for the year ended December 31, 2012, to $70.2 million for the year ended December 31, 2013.
Interest Expense. Interest expense declined to $10.6 million for the year ended December 31, 2013, compared to $14.9 million for 2012. The decline in interest expense was attributable to a decline in the average cost interest bearing deposits and decline in interest-bearings liabilities. The average cost of average interest-bearing deposits declined to 1.08% for the year ended December 31, 2013, from 1.50% for the year ended December 31, 2012. Over the same period, the average balance of interest bearing deposits declined from $706.4 million for the year ended December 31, 2012, to $657.9 million for the year ended December 31, 2013. The average balance of FHLB borrowings declined from $57.0 million for the year ended December 31, 2012, to $44.9 million for the year ended December 31, 2013. The average cost of FHLB borrowings declined from 4.58% for the year ended December 31, 2012, to 3.96% for the year ended December 31, 2013, due to the prepayment of FHLB advances. Management’s decision to prepay selected FHLB advances and incur $480,000 in penalties increased the Company’s cost of borrowings by 0.45% in 2012. The average balance and average cost of total borrowings was $108.2 million and 3.98% for the year ended December 31, 2012, respectively as compared to $96.8 million and 3.58% for the year ended December 31, 2013, respectively.
Provision for Loan Losses. The Company determined that an additional $1.6 million and $2.3 million in provision for loan losses was required for the years ended December 31, 2013, and December 31, 2012, respectively. The decline in the Company’s provision for loan loss expense is largely the result of the improving asset quality of the Company. For the year ended December 31, 2013, the Company incurred net charge offs of $3.6 million as compared to $2.9 million for the year ended December 31, 2012, and $4.5 million in the year ended December 31, 2011. Furthermore, the Company’s analysis of customer financial information indicates that many customers have noted improved levels of cash flow and business activity, a positive factor in considering loans for future removal from our list of classified assets.
Non-Interest Income. Non-interest income declined by $267,000 for the year ended December 31, 2013, to $9.4 million, compared to $9.6 million for the year ended December 31, 2012. The decline in non-interest income is largely the result of a $322,000 decrease in mortgage origination income as rising long term interest rates resulted in lower mortgage refinancing activity. For the year ended December 31, 2013, financial services income increased by approximately $179,000. Service charge income was relatively flat as the Company offset the negative effects of new regulations with the opening of more than 4,000 checking accounts in 2013. The Company’s $400,000 impairment charge on investment securities was offset by a $412,000 gain on the sale of our insurance related assets.
Non-Interest Expense. Total non-interest expense for the year ended December 31, 2013, was $28.6 million, compared to $28.4 million in 2012, an increase of $197,000, or approximately 0.70%. For the year ended December 31, 2013, the Company’s salaries and benefits expense increased by $754,000, or 5.4%, as compared to the year ended December 31, 2012. For the year ended December 31, 2013, professional services expense increased by $168,000, data processing expenses increased by $201,000, supplies expense increased by $140,000, and expenses related to other real estate owned increased by $279,000. For the year ended December 31, 2013, increases in expense items discussed above were largely offset by declines of $812,000 in deposit insurance and examination expense, a $126,000 decline in losses on the sale of other real estate owned and a $103,000 decline in other operating expenses.
Income Taxes. The effective tax rates for the years ended December 31, 2013, and December 31, 2012, was 14.6% and 16.7%, respectively. The Company’s effective tax rate remains well below historical levels due to a higher percentage of pre-tax income that is not subject to federal income tax. The Company’s sizable holdings in municipal bonds, life insurance contracts and certain tax credits earned have lowered our effective tax rate.
20
Table of Contents
Liquidity and Capital Resources
The Company’s primary business is that of the Bank. Management believes dividends that may be paid from the Bank to the Company will provide sufficient funds for the Company’s current and anticipated needs; however, no assurance can be given that the Company will not have a need for additional funds in the future. The Bank is subject to certain regulatory limitations with respect to the payment of dividends to the Company.
Capital Resources. At December 31, 2014, the Bank exceeded all regulatory minimum capital requirements. For a detailed discussion of the Kentucky Department of Financial Institutions (“KDFI”) and FDIC capital requirements, and for a tabular presentation of the Bank’s compliance with such requirements, see Note 16 of Notes to Consolidated Financial Statements. See the Company’s Risk Factors, located in our Annual Report filed on SEC form10-K for the year ended December 31, 2014, for comments related to effects that the implementation of Basel III will have on the Company’s future operations.
Liquidity. Liquidity management is both a daily and long-term function of business management. If the Bank requires funds beyond its ability to generate them internally, the Bank believes that it could borrow funds from the FHLB. At December 31, 2014, the Bank had outstanding advances of $34.0 million from the FHLB and $11.0 million of letters of credit issued by the FHLB to secure municipal deposits. The Bank can immediately borrow an additional $52.6 million from the FHLB and the Company has the ability to pledge another $40.1 million in securities to the FHLB for additional borrowing capacity. See Note 7 of Notes to Consolidated Financial Statements.
Subordinated Debentures Issuance. On September 25, 2003, the Company issued $10,310,000 of subordinated debentures in a private placement offering. The securities have a thirty-year maturity and are callable at the issuer’s discretion on a quarterly basis beginning five years after issuance. The securities are priced at a variable rate equal to the three-month LIBOR (London Interbank Offering Rate) plus 3.10%. Interest is paid and the rate of interest may change on a quarterly basis. The Company’s subsidiary, a state chartered commercial bank supervised by the KDFI and the FDIC may recognize the proceeds of trust preferred securities as capital. KDFI and FDIC regulations provide that 25% of Tier I capital may consist of trust preferred proceeds. See Note 10 of Notes to Consolidated Financial Statements.
The Bank’s primary sources of funds consist of deposits, repayment of loans and mortgage-backed securities, maturities of investments and interest-bearing deposits, and funds provided from operations. While scheduled repayments of loans and mortgage-backed securities and maturities of investment securities are predictable sources of funds, deposit flows and loan prepayments are greatly influenced by the general level of interest rates, economic conditions and competition. The Bank uses its liquidity resources principally to fund existing and future loan commitments, to fund maturing certificates of deposit and demand deposit withdrawals, to invest in other interest-earning assets, to maintain liquidity, and to meet operating expenses.
Management believes that loan repayments and other sources of funds will be adequate to meet the Bank’s liquidity needs for the immediate future. A portion of the Bank’s liquidity consists of cash and cash equivalents. At December 31, 2013, cash and cash equivalents totaled $55.8 million. The level of these assets depends upon the Bank’s operating, investing and financing activities during any given period.
Cash flows from operating activities for the years ended December 31, 2014, 2013 and 2012 were $10.1 million, $9.3 million, and $9.3 million, respectively.
Cash flows from (used in) investing activities were $19.0 million, ($4.3) million and were $58.2 million in 2014, 2013 and 2012, respectively. A principal use of cash in this area has been purchases of securities available for sale of $91.3 million, offset by proceeds from sales, calls and maturities of securities of $112.2 million during 2014. At the same time, the loan portfolio provided cash of $26.8 in 2012. The Company invested $1.9 million and $21.6 million of cash in loans in 2014 and 2013. Sales and maturities of available for sale securities exceeded purchases by $29.2 million in 2012 and $18.9 million in 2013.
At December 31, 2014, the Bank had $45.2 million in outstanding commitments to originate loans and unused lines of credit of $78.9 million. The Bank anticipates that it will have sufficient funds available to meet its current loan origination and lines of credit commitments. The Bank has certificates of deposit maturing in one year or less of $139.7 million at December 31, 2014. Based on historical experience, management believes that a significant portion of such deposits will remain with the Bank.
21
Table of Contents
Impact of Inflation and Changing Prices
The consolidated financial statements and notes thereto presented herein have been prepared in accordance with accounting principles generally accepted in the United States of America, which require the measurement of financial position and operating results in terms of historical dollars without considering the change in the relative purchasing power of money over time and due to inflation. The impact of inflation is reflected in the increased cost of the Company’s operations.
Unlike most industrial companies, nearly all the assets and liabilities of the Company are monetary in nature. As a result, changes in interest rates have a greater impact on the Company’s performance than do the effects of general levels of inflation. Interest rates do not necessarily move in the same direction or to the same extent as the price of goods and services.
Forward-Looking Statements
Management’s discussion and analysis includes certain forward-looking statements addressing, among other things, the Bank’s prospects for earnings, asset growth and net interest margin. Forward-looking statements are accompanied by, and identified with, such terms as “anticipates,” “believes,” “expects,” “intends,” and similar phrases. Management’s expectations for the Company’s future involve a number of assumptions and estimates. Factors that could cause actual results to differ from the expectations expressed herein include: substantial changes in interest rates, and changes in the general economy; changes in the Company’s strategies for credit-risk management, interest-rate risk management and investment activities. Accordingly, any forward-looking statements included herein do not purport to be predictions of future events or circumstances and may not be realized.
Stock Performance Comparison
The following graph, which was prepared by SNL Financial LC (“SNL”), shows the cumulative total return of the Common Stock of the Company since December 31, 2009, compared with the (1) NASDAQ Composite Index, comprised of all U.S. Companies quoted on NASDAQ, (2) the SNL Midwest Thrift Index, comprised of publically traded thrifts and thrift holding companies operating in the Midwestern United States, and (3) the SNL Midwest Bank Index, comprised of publically traded commercial banks and bank holding companies operating in the Midwestern United States. Cumulative total return on the Common Stock or the index equals the total increase in the value since December 31, 2009, assuming reinvestment of all dividends paid into the Common Stock or the index, respectively. The graph was prepared assuming that $100 was invested on December 31, 2009, in the Common Stock, the securities included in the indices. The stock price performance included in this graph is not necessarily indicative of future stock price performance.
22
Table of Contents
On June 5, 2013, the Company became a Kentucky state chartered commercial bank holding company. As such, the Company will compare the SNL Midwest Bank index in the current and in future periods.
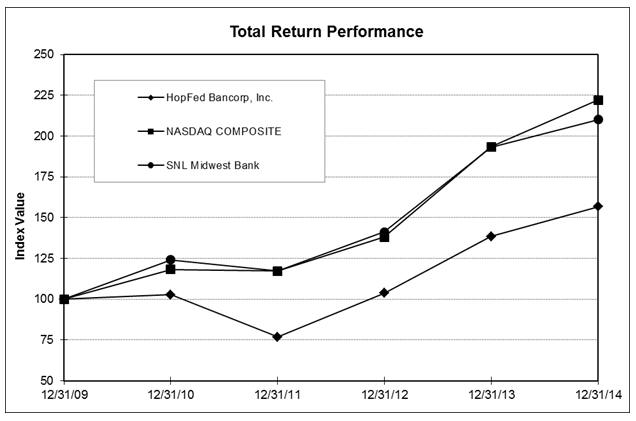
| Period Ending | ||||||||||||||||||||||||
| Index |
12/31/09 | 12/31/10 | 12/31/11 | 12/31/12 | 12/31/13 | 12/31/14 | ||||||||||||||||||
| HopFed Bancorp, Inc. |
100.00 | 102.81 | 76.77 | 103.63 | 138.41 | 156.66 | ||||||||||||||||||
| NASDAQ COMPOSITE |
100.00 | 118.15 | 117.22 | 138.02 | 193.47 | 222.16 | ||||||||||||||||||
| SNL Midwest Bank |
100.00 | 124.18 | 117.30 | 141.18 | 193.28 | 210.12 | ||||||||||||||||||
23
Table of Contents
Consolidated Financial Statements
HopFed Bancorp, Inc.
and Subsidiaries
December 31, 2014, 2013 and 2012
Table of Contents
Table of Contents
REPORT OF INDEPENDENT REGISTERED PUBLIC ACCOUNTING FIRM
To the Board of Directors and Stockholders
of HopFed Bancorp, Inc.
Hopkinsville, Kentucky
We have audited the accompanying consolidated balance sheets of HopFed Bancorp, Inc. and subsidiaries (the “Company”) as of December 31, 2014 and 2013, and the related consolidated statements of income, comprehensive income (loss), changes in stockholders’ equity, and cash flows for each of the years in the three-year period ended December 31, 2014. These consolidated financial statements are the responsibility of the Company’s management. Our responsibility is to express an opinion on these consolidated financial statements based on our audits.
We conducted our audits in accordance with the standards of the Public Company Accounting Oversight Board (United States). Those standards require that we plan and perform the audits to obtain reasonable assurance about whether the financial statements are free of material misstatement. An audit includes examining, on a test basis, evidence supporting the amounts and disclosures in the financial statements, assessing the accounting principles used and significant estimates made by management, as well as evaluating the overall financial statement presentation. We believe that our audits provide a reasonable basis for our opinion.
In our opinion, the consolidated financial statements referred to above present fairly, in all material respects, the financial position of HopFed Bancorp, Inc. and subsidiaries as of December 31, 2014 and 2013, and the results of their operations and their cash flows for each of the years in the three-year period ended December 31, 2014, in conformity with accounting principles generally accepted in the United States of America.
We also have audited, in accordance with the standards of the Public Company Accounting Oversight Board (United States), HopFed Bancorp, Inc.’s internal control over financial reporting as of December 31, 2014, based on criteria established in Internal Control-Integrated Framework (2013) issued by the Committee of Sponsoring Organizations of the Treadway Commission (COSO) and our report dated March 13, 2015, expressed an unqualified opinion on the effectiveness of the Company’s internal control over financial reporting.
(signed) Rayburn, Bates & Fitzgerald, P.C.
Brentwood, Tennessee
March 13, 2015
Table of Contents
HopFed Bancorp, Inc. and Subsidiaries
December 31, 2014 and 2013
(Dollars in Thousands)
| 2014 | 2013 | |||||||
| Assets | ||||||||
| Cash and due from banks |
$ | 34,389 | 37,229 | |||||
| Interest-earning deposits |
6,050 | 18,619 | ||||||
|
|
|
|
|
|||||
| Cash and cash equivalents |
40,439 | 55,848 | ||||||
| Federal Home Loan Bank stock, at cost (note 2) |
4,428 | 4,428 | ||||||
| Securities available for sale (notes 2 and 8) |
303,628 | 318,910 | ||||||
| Loans held for sale |
1,444 | — | ||||||
| Loans receivable, net of allowance for loan losses of $6,289 at December 31, 2014, and $8,682 at December 31, 2013 (notes 3 and 7) |
539,264 | 543,632 | ||||||
| Accrued interest receivable |
4,576 | 5,233 | ||||||
| Real estate and other assets owned (note 14) |
1,927 | 1,674 | ||||||
| Bank owned life insurance |
9,984 | 9,677 | ||||||
| Premises and equipment, net (note 4) |
22,940 | 23,108 | ||||||
| Deferred tax assets (note 13) |
2,261 | 4,610 | ||||||
| Intangible asset (note 5) |
33 | 130 | ||||||
| Other assets |
4,861 | 6,399 | ||||||
|
|
|
|
|
|||||
| Total assets |
$ | 935,785 | 973,649 | |||||
|
|
|
|
|
|||||
| Liabilities and Stockholders’ Equity | ||||||||
| Liabilities: |
||||||||
| Deposits (note 6): |
||||||||
| Non-interest-bearing accounts |
$ | 115,051 | 105,252 | |||||
| Interest-bearing accounts: |
||||||||
| Interest bearing checking accounts |
186,616 | 183,643 | ||||||
| Savings and money market accounts |
97,726 | 92,106 | ||||||
| Other time deposits |
331,915 | 381,996 | ||||||
|
|
|
|
|
|||||
| Total deposits |
731,308 | 762,997 | ||||||
| Advances from Federal Home Loan Bank (note 7) |
34,000 | 46,780 | ||||||
| Repurchase agreements (note 8) |
57,358 | 52,759 | ||||||
| Subordinated debentures (note 10) |
10,310 | 10,310 | ||||||
| Advances from borrowers for taxes and insurance |
513 | 521 | ||||||
| Dividends payable |
301 | 326 | ||||||
| Accrued expenses and other liabilities |
3,593 | 4,239 | ||||||
|
|
|
|
|
|||||
| Total liabilities |
837,383 | 877,932 | ||||||
|
|
|
|
|
|||||
See accompanying notes to consolidated financial statements.
5
Table of Contents
HopFed Bancorp, Inc. and Subsidiaries
Consolidated Balance Sheets, Continued
December 31, 2014 and 2013
(Dollars in Thousands)
| 2014 | 2013 | |||||||
| Stockholders’ equity |
||||||||
| Preferred stock, par value $0.01 per share; authorized—500,000 shares; no shares issued or outstanding at December 31, 2014, and December 31, 2013. |
$ | — | — | |||||
| Common stock, par value $.01 per share; authorized 15,000,000 shares; 7,949,665 issued and 7,171,282 outstanding at December 31, 2014, and 7,927,287 issued and 7,447,903 outstanding at December 31, 2013 |
79 | 79 | ||||||
| Additional paid-in-capital |
58,466 | 58,302 | ||||||
| Retained earnings |
45,729 | 44,694 | ||||||
| Treasury stock- common (at cost 778,383 shares at December 31, 2014 and 479,384 shares at December 31, 2013) |
(9,429 | ) | (5,929 | ) | ||||
| Accumulated other comprehensive income (loss), net of taxes |
3,557 | (1,429 | ) | |||||
|
|
|
|
|
|||||
| Total stockholders’ equity |
98,402 | 95,717 | ||||||
|
|
|
|
|
|||||
| Total liabilities and stockholders’ equity |
$ | 935,785 | 973,649 | |||||
|
|
|
|
|
|||||
Commitments and contingencies (notes 11 and 15)
See accompanying notes to consolidated financial statements
6
Table of Contents
HopFed Bancorp, Inc. and Subsidiaries
Consolidated Statements of Income
For the Years ended December 31, 2014, 2013 and 2012
(Dollars in Thousands)
| 2014 | 2013 | 2012 | ||||||||||
| Interest and dividend income |
||||||||||||
| Loans receivable |
$ | 26,025 | 26,741 | 29,828 | ||||||||
| Securities available for sale |
6,548 | 6,873 | 8,722 | |||||||||
| Nontaxable securities available for sale |
2,081 | 2,219 | 2,266 | |||||||||
| Interest-earning deposits |
26 | 24 | 24 | |||||||||
|
|
|
|
|
|
|
|||||||
| Total interest and dividend income |
34,680 | 35,857 | 40,840 | |||||||||
|
|
|
|
|
|
|
|||||||
| Interest expense: |
||||||||||||
| Deposits (note 6) |
5,603 | 7,114 | 10,571 | |||||||||
| Advances from Federal Home loan Bank |
1,665 | 1,780 | 2,609 | |||||||||
| Repurchase agreements |
874 | 954 | 963 | |||||||||
| Subordinated debentures |
737 | 733 | 734 | |||||||||
|
|
|
|
|
|
|
|||||||
| Total interest expense |
8,879 | 10,581 | 14,877 | |||||||||
|
|
|
|
|
|
|
|||||||
| Net interest income |
25,801 | 25,276 | 25,963 | |||||||||
|
|
|
|
|
|
|
|||||||
| Provision for loan losses (note 3) |
(2,273 | ) | 1,604 | 2,275 | ||||||||
|
|
|
|
|
|
|
|||||||
| Net interest income after provision for loan losses |
28,074 | 23,672 | 23,688 | |||||||||
|
|
|
|
|
|
|
|||||||
| Non-interest income: |
||||||||||||
| Other-than-temporary impairment losses on debt securities |
— | (511 | ) | — | ||||||||
| Portion of losses recognized in other comprehensive income |
— | 111 | — | |||||||||
|
|
|
|
|
|
|
|||||||
| Net impairment losses recognized in earnings (note 2) |
— | (400 | ) | — | ||||||||
| Service charges |
3,354 | 3,670 | 3,840 | |||||||||
| Merchant card income |
1,075 | 983 | 842 | |||||||||
| Mortgage origination income |
719 | 634 | 956 | |||||||||
| Realized gain from sale of securities available for sale, net (note 2) |
578 | 1,661 | 1,671 | |||||||||
| Income from bank owned life insurance |
307 | 354 | 399 | |||||||||
| Financial services commission |
980 | 1,250 | 1,071 | |||||||||
| Gain on sale of assets |
— | 412 | — | |||||||||
| Other operating income |
827 | 808 | 860 | |||||||||
|
|
|
|
|
|
|
|||||||
| Total non-interest income |
7,840 | 9,372 | 9,639 | |||||||||
|
|
|
|
|
|
|
|||||||
See accompanying notes to consolidated financial statements.
7
Table of Contents
HopFed Bancorp, Inc. and Subsidiaries
Consolidated Statements of Income, Continued
For the Years ended December 31, 2014, 2013 and 2012
(Dollars in Thousands, Except Per Share Amounts)
| 2014 | 2013 | 2012 | ||||||||||
| Non-interest expenses: |
||||||||||||
| Salaries and benefits (note 12) |
15,222 | 14,733 | 13,979 | |||||||||
| Occupancy expense (note 4) |
3,217 | 3,475 | 3,531 | |||||||||
| Data processing expense |
2,887 | 2,695 | 2,494 | |||||||||
| Franchise and deposit tax |
1,336 | 581 | 647 | |||||||||
| Intangible amortization |
97 | 162 | 227 | |||||||||
| Professional services |
1,331 | 1,773 | 1,605 | |||||||||
| Advertising expense |
1,341 | 1,236 | 1,357 | |||||||||
| Postage and communications expense |
577 | 567 | 562 | |||||||||
| Supplies expense |
627 | 495 | 355 | |||||||||
| Deposit insurance and examination fees |
724 | 727 | 1,539 | |||||||||
| Loss on sale of assets |
25 | 12 | 13 | |||||||||
| Loss (gain) on sale of real estate owned |
208 | 140 | 266 | |||||||||
| Expenses related to real estate owned |
266 | 402 | 123 | |||||||||
| Loss on sale of loan note |
1,781 | — | — | |||||||||
| Loss on early debt extinguishment |
2,510 | — | — | |||||||||
| Other operating expenses |
1,767 | 1,640 | 1,743 | |||||||||
|
|
|
|
|
|
|
|||||||
| Total non-interest expense |
33,916 | 28,638 | 28,441 | |||||||||
|
|
|
|
|
|
|
|||||||
| Income before income tax expense |
1,998 | 4,406 | 4,886 | |||||||||
| Income tax expense (note 13) |
(201 | ) | 644 | 817 | ||||||||
|
|
|
|
|
|
|
|||||||
| Net income |
2,199 | 3,762 | 4,069 | |||||||||
| Less: Dividend on preferred shares |
— | — | 1,007 | |||||||||
| Accretion dividend on preferred shares |
— | — | 222 | |||||||||
|
|
|
|
|
|
|
|||||||
| Net income available for common shareholders |
$ | 2,199 | 3,762 | 2,840 | ||||||||
|
|
|
|
|
|
|
|||||||
| Earnings per share available to common stockholders (note 18): |
||||||||||||
| Basic |
$ | 0.30 | 0.50 | 0.38 | ||||||||
|
|
|
|
|
|
|
|||||||
| Fully diluted |
$ | 0.30 | 0.50 | 0.38 | ||||||||
|
|
|
|
|
|
|
|||||||
| Weighted average shares outstanding - basic |
7,306,078 | 7,483,606 | 7,486,445 | |||||||||
|
|
|
|
|
|
|
|||||||
| Weighted average shares outstanding - diluted |
7,306,078 | 7,483,606 | 7,486,445 | |||||||||
|
|
|
|
|
|
|
|||||||
See accompanying notes to consolidated financial statements.
8
Table of Contents
HopFed Bancorp, Inc. and Subsidiaries
Consolidated Statements of Comprehensive Income (Loss)
For the Years ended December 31, 2014, 2013 and 2012
(Dollars in Thousands)
| 2014 | 2013 | 2012 | ||||||||||
| Net income |
$ | 2,199 | 3,762 | 4,069 | ||||||||
| Other comprehensive income (loss), net of tax: |
||||||||||||
| Unrealized holding gain (loss) arising during the year, net of tax effect |
5,130 | (10,568 | ) | 3,348 | ||||||||
| Unrealized gain (loss) on derivatives |
237 | 248 | 113 | |||||||||
| Reclassification adjustment for gains and OTTI losses included in net income |
(381 | ) | (832 | ) | (1,104 | ) | ||||||
|
|
|
|
|
|
|
|||||||
| Comprehensive income (loss) |
$ | 7,185 | (7,390 | ) | 6,426 | |||||||
|
|
|
|
|
|
|
|||||||
See accompanying notes to consolidated financial statements.
9
Table of Contents
HopFed Bancorp, Inc. and Subsidiaries
Consolidated Statements of Changes in Stockholders’ Equity
For the Years ended December 31, 2014, 2013 and 2012
(Dollars in Thousands, Except Share Amounts)
| Common Shares |
Preferred Shares |
Common Stock |
Common Stock Warrant |
Additional Paid-in Capital |
Retained Earnings |
Preferred Treasury Stock |
Common Treasury Stock |
Accumulated Other Comprehensive Income (Loss) |
Total Equity |
|||||||||||||||||||||||||||||||
| Brought Forward, December 31, 2011 |
7,492,420 | 18,400 | $ | 79 | 556 | 75,967 | 39,591 | — | (5,076 | ) | 7,366 | 118,483 | ||||||||||||||||||||||||||||
| Net income |
— | — | — | — | — | 4,069 | — | — | — | 4,069 | ||||||||||||||||||||||||||||||
| Restricted stock awards |
10,392 | — | — | — | — | — | — | — | — | — | ||||||||||||||||||||||||||||||
| Net change in unrealized gain on securities available for sale, net of taxes of ($1,156) |
— | — | — | — | — | — | — | — | 2,244 | 2,244 | ||||||||||||||||||||||||||||||
| Net change in unrealized losses on derivatives, net of taxes of ($58) |
— | — | — | — | — | — | — | — | 113 | 113 | ||||||||||||||||||||||||||||||
| Preferred stock dividend of 5% |
— | — | — | — | — | (1,007 | ) | — | — | — | (1,007 | ) | ||||||||||||||||||||||||||||
| Cash dividend to common stockholders’ ($0.08 per share) |
— | — | — | — | — | (602 | ) | — | — | — | (602 | ) | ||||||||||||||||||||||||||||
| Repurchase preferred stock |
— | — | — | — | — | — | (18,400 | ) | — | — | (18,400 | ) | ||||||||||||||||||||||||||||
| Compensation expense, restricted stock awards |
— | — | — | — | 99 | — | — | — | — | 99 | ||||||||||||||||||||||||||||||
| Accretion of preferred stock discount |
— | — | — | — | 222 | (222 | ) | — | — | — | — | |||||||||||||||||||||||||||||
|
|
|
|
|
|
|
|
|
|
|
|
|
|
|
|
|
|
|
|
|
|||||||||||||||||||||
| Balance December 31, 2012 |
7,502,812 | 18,400 | $ | 79 | 556 | 76,288 | 41,829 | (18,400 | ) | (5,076 | ) | 9,723 | 104,999 | |||||||||||||||||||||||||||
|
|
|
|
|
|
|
|
|
|
|
|
|
|
|
|
|
|
|
|
|
|||||||||||||||||||||
| Net income |
— | — | — | — | — | 3,762 | — | — | — | 3,762 | ||||||||||||||||||||||||||||||
| Restricted stock awards |
21,559 | — | — | — | — | — | — | — | — | — | ||||||||||||||||||||||||||||||
| Net change in unrealized gain (losses) on securities available for sale, net of taxes of $5,873 |
— | — | — | — | — | — | — | — | (11,400 | ) | (11,400 | ) | ||||||||||||||||||||||||||||
| Net change in unrealized gain (losses)on derivatives, net of taxes of ($128) |
— | — | — | — | — | — | — | — | 248 | 248 | ||||||||||||||||||||||||||||||
| Preferred stock retired |
— | (18,400 | ) | — | — | (18,400 | ) | — | 18,400 | — | — | — | ||||||||||||||||||||||||||||
| Cash dividend to common stockholders’ ($0.12 per share) |
— | — | — | — | — | (897 | ) | — | — | — | (897 | ) | ||||||||||||||||||||||||||||
| Common stock repurchase |
(76,468 | ) | — | — | — | — | — | — | (853 | ) | — | (853 | ) | |||||||||||||||||||||||||||
| Cash repurchase of warrant |
— | — | — | (556 | ) | 299 | — | — | — | — | (257 | ) | ||||||||||||||||||||||||||||
| Compensation expense, restricted stock awards |
|
— |
|
— | — | — | 115 | — | — | — | — | 115 | ||||||||||||||||||||||||||||
|
|
|
|
|
|
|
|
|
|
|
|
|
|
|
|
|
|
|
|
|
|||||||||||||||||||||
| Balance December 31, 2013 |
7,447,903 | — | 79 | — | 58,302 | 44,694 | — | (5,929 | ) | (1,429 | ) | 95,717 | ||||||||||||||||||||||||||||
|
|
|
|
|
|
|
|
|
|
|
|
|
|
|
|
|
|
|
|
|
|||||||||||||||||||||
See accompanying notes to consolidated financial statements.
10
Table of Contents
HopFed Bancorp, Inc. and Subsidiaries
Consolidated Statements of Changes in Stockholders’ Equity
For the Years ended December 31, 2014, 2013 and 2012 (Continued)
(Dollars in Thousands, Except Share Amounts)
| Common Shares |
Preferred Shares |
Common Stock |
Common Stock Warrant |
Additional Paid-in Capital |
Retained Earnings |
Preferred Treasury Stock |
Common Treasury Stock |
Accumulated Other Comprehensive Income (Loss) |
Total Equity |
|||||||||||||||||||||||||||||||
| Brought Forward |
7,447,903 | — | 79 | — | 58,302 | 44,694 | — | (5,929 | ) | (1,429 | ) | 95,717 | ||||||||||||||||||||||||||||
| Net Income |
— | — | — | — | — | 2,199 | — | — | — | 2,199 | ||||||||||||||||||||||||||||||
| Restricted stock awards |
|
22,378 |
|
|
— |
|
|
— |
|
|
— |
|
|
— |
|
|
— |
|
|
— |
|
|
— |
|
|
— |
|
|
— |
| ||||||||||
| Net change in unrealized gain (losses) on securities available for sale, net of taxes of $2,446 |
— | — | — | — | — | — | — | — | 4,749 | 4,749 | ||||||||||||||||||||||||||||||
| Net change in unrealized gain (losses)on derivatives, net of taxes of ($122) |
— | — | — | — | — | — | — | — | 237 | 237 | ||||||||||||||||||||||||||||||
| Cash dividend to common stockholders’ ($0.16 per share) |
— | — | — | — | — | (1,164 | ) | — | — | — | (1,164 | ) | ||||||||||||||||||||||||||||
| Common stock repurchase |
(298,999 | ) | — | — | — | — | — | — | (3,500 | ) | — | (3,500 | ) | |||||||||||||||||||||||||||
| Compensation expense, restricted stock awards |
— | — | — | — | 164 | — | — | — | — | 164 | ||||||||||||||||||||||||||||||
|
|
|
|
|
|
|
|
|
|
|
|
|
|
|
|
|
|
|
|
|
|||||||||||||||||||||
| Balance December 31, 2014 |
7,171,282 | — | 79 | — | 58,466 | 45,729 | — | (9,429 | ) | 3,557 | 98,402 | |||||||||||||||||||||||||||||
|
|
|
|
|
|
|
|
|
|
|
|
|
|
|
|
|
|
|
|
|
|||||||||||||||||||||
See accompanying notes to consolidated financial statements.
11
Table of Contents
HopFed Bancorp, Inc. and Subsidiaries
Consolidated Statements of Cash Flows
For the Years ended December 31, 2014, 2013 and 2012
(Dollars in Thousands)
| 2014 | 2013 | 2012 | ||||||||||
| Cash flows from operating activities: |
||||||||||||
| Net income |
$ | 2,199 | 3,762 | 4,069 | ||||||||
| Adjustments to reconcile net income to net cash provided by operating activities: |
||||||||||||
| Provision for loan losses |
(2,273 | ) | 1,604 | 2,275 | ||||||||
| Depreciation |
1,336 | 1,502 | 1,587 | |||||||||
| Amortization of intangible assets |
97 | 162 | 227 | |||||||||
| Amortization of investment premiums and discounts, net |
2,076 | 2,561 | 3,327 | |||||||||
| Other than temporary impairment charge on available for sale securities |
— | 400 | — | |||||||||
| Expense (benefit) for deferred income taxes |
(231 | ) | 566 | 487 | ||||||||
| Compensation expense, restricted stock grants and options |
164 | 115 | 99 | |||||||||
| Income from bank owned life insurance |
(307 | ) | (354 | ) | (399 | ) | ||||||
| Gain on sale of securities available for sale |
(578 | ) | (1,661 | ) | (1,671 | ) | ||||||
| Gain on sales of loans |
(719 | ) | (634 | ) | (956 | ) | ||||||
| Loss on sale of commercial real estate loan |
1,781 | — | — | |||||||||
| Loss on sale of premises and equipment |
25 | 12 | 13 | |||||||||
| Proceeds from sales of loans |
37,300 | 17,577 | 48,705 | |||||||||
| (Gain) loss on sale of foreclosed assets |
208 | 140 | 266 | |||||||||
| Originations of loans sold |
(32,835 | ) | (16,943 | ) | (47,749 | ) | ||||||
| (Increase) decrease in: |
||||||||||||
| Accrued interest receivable |
657 | 165 | 785 | |||||||||
| Other assets (increase) |
1,513 | 171 | (815 | ) | ||||||||
| Increase (decrease) in accrued expenses and other liabilities |
(277 | ) | 170 | (911 | ) | |||||||
|
|
|
|
|
|
|
|||||||
| Net cash provided by operating activities |
10,136 | 9,315 | 9,339 | |||||||||
|
|
|
|
|
|
|
|||||||
| Cash flows from investing activities |
||||||||||||
| Proceeds from sales, calls and maturities of securities available for sale |
112,235 | 124,471 | 143,434 | |||||||||
| Purchase of securities available for sale |
(91,257 | ) | (105,605 | ) | (114,253 | ) | ||||||
| Net (increase) decrease in loans |
(1,908 | ) | (21,630 | ) | 26,815 | |||||||
| Proceeds from sale of foreclosed assets |
1,118 | 908 | 2,738 | |||||||||
| Proceeds from bank owned life insurance |
— | — | 211 | |||||||||
| Purchase of premises and equipment |
(1,168 | ) | (2,473 | ) | (726 | ) | ||||||
|
|
|
|
|
|
|
|||||||
| Net cash provided by (used in) investing activities |
19,020 | (4,329 | ) | 58,219 | ||||||||
|
|
|
|
|
|
|
|||||||
See accompanying notes to consolidated financial statements.
12
Table of Contents
HopFed Bancorp, Inc. and Subsidiaries
Consolidated Statements of Cash Flows, Continued
For the Years ended December 31, 2014, 2013 and 2012
(Dollars in Thousands)
| 2014 | 2013 | 2012 | ||||||||||
| Cash flows from financing activities: |
||||||||||||
| Net increase (decrease) in deposits |
($ | 31,689 | ) | 3,132 | (40,230 | ) | ||||||
| Increase (decrease) in advance payments by borrowers for taxes and insurance |
(8 | ) | 125 | 243 | ||||||||
| Advances from Federal Home Loan Bank |
57,000 | 23,000 | 3,000 | |||||||||
| Repayment of advances from Federal Home Loan Bank |
(69,780 | ) | (19,961 | ) | (22,578 | ) | ||||||
| Increase in repurchase agreements |
4,599 | 9,251 | 428 | |||||||||
| Repurchase of preferred stock |
— | — | (18,400 | ) | ||||||||
| Repurchase of common stock |
(3,500 | ) | (853 | ) | — | |||||||
| Repurchase of common stock warrant |
— | (257 | ) | — | ||||||||
| Dividends paid on preferred stock |
— | — | (1,007 | ) | ||||||||
| Dividends paid on common stock |
(1,187 | ) | (751 | ) | (598 | ) | ||||||
|
|
|
|
|
|
|
|||||||
| Net cash provided by (used in) financing activities |
(44,565 | ) | 13,686 | (79,142 | ) | |||||||
|
|
|
|
|
|
|
|||||||
| Increase (decrease) in cash and cash equivalents |
(15,409 | ) | 18,672 | (11,584 | ) | |||||||
| Cash and cash equivalents, beginning of period |
55,848 | 37,176 | 48,760 | |||||||||
|
|
|
|
|
|
|
|||||||
| Cash and cash equivalents, end of period |
$ | 40,439 | 55,848 | 37,176 | ||||||||
|
|
|
|
|
|
|
|||||||
| Supplemental disclosures of cash flow information: |
||||||||||||
| Interest paid |
$ | 8,977 | 10,840 | 15,331 | ||||||||
|
|
|
|
|
|
|
|||||||
| Income taxes paid (refund) |
($ | 718 | ) | (487 | ) | 1,990 | ||||||
|
|
|
|
|
|
|
|||||||
| Supplemental disclosures of non-cash investing and financing activities: |
||||||||||||
| Loans charged off |
$ | 1,232 | 4,444 | 3,684 | ||||||||
|
|
|
|
|
|
|
|||||||
| Loan transferred to held for sale |
$ | 6,987 | — | — | ||||||||
|
|
|
|
|
|
|
|||||||
| Foreclosures and in substance foreclosures of loans during year |
$ | 1,579 | 1,379 | 2,285 | ||||||||
|
|
|
|
|
|
|
|||||||
| Net unrealized gains (losses) on investment securities classified as available for sale |
$ | 7,195 | (17,273 | ) | 3,400 | |||||||
|
|
|
|
|
|
|
|||||||
| Increase (decrease) in deferred tax asset related to unrealized gain (losses) on investments |
($ | 2,446 | ) | 5,873 | (1,156 | ) | ||||||
|
|
|
|
|
|
|
|||||||
| Dividends declared and payable |
$ | 301 | 325 | 180 | ||||||||
|
|
|
|
|
|
|
|||||||
| Issue of unearned restricted stock |
$ | 260 | 232 | 74 | ||||||||
|
|
|
|
|
|
|
|||||||
See accompanying notes to consolidated financial statements.
13
Table of Contents
HopFed Bancorp, Inc. and Subsidiaries
Notes to Consolidated Financial Statements
December 31, 2014, 2013 and 2012
| (1) | Summary of Significant Accounting Policies: |
Nature of Operations and Customer Concentration
HopFed Bancorp, Inc. (the Corporation) is a bank holding company incorporated in the state of Delaware and headquartered in Hopkinsville, Kentucky. The Corporation’s principal business activities are conducted through it’s wholly-owned subsidiary, Heritage Bank USA, Inc. (the Bank), a Kentucky state chartered commercial bank engaged in the business of accepting deposits and providing mortgage, consumer, construction and commercial loans to the general public through its retail banking offices. The Bank’s business activities are primarily limited to western Kentucky and middle and western Tennessee. The Bank is subject to competition from other financial institutions. Deposits at the Bank are insured up to the applicable limits by the Federal Deposit Insurance Corporation (FDIC).
As part of the enactment of the Dodd-Frank Financial Reform Act of 2010, the Corporation and Bank’s former regulator, the Office of Thrift Supervision, was eliminated on July 21, 2011. Prior to June 5, 2013, the Bank was subject to comprehensive regulation, examination and supervision by the Office of Comptroller of the Currency (OCC) and the FDIC. After June 5, 2013, the Bank’s legal name was changed to Heritage Bank USA, Inc. and the Bank was granted a Kentucky commercial bank charter and is now supervised by the Kentucky Department of Financial Institutions (“KDFI”) and the Federal Deposit Insurance Corporation (“FDIC”). Supervision of the Corporation continues to be conducted by the Federal Reserve Bank of Saint Louis (“FED”).
A substantial portion of the Bank’s loans are secured by real estate in the western Kentucky and middle and west Tennessee markets. In addition, foreclosed real estate is located in this same market. Accordingly, the ultimate ability to collect on a substantial portion of the Bank’s loan portfolio and the recovery of a substantial portion of the carrying amount of foreclosed real estate is susceptible to changes in local market conditions.
Principles of Consolidation
The consolidated financial statements include the accounts of the Corporation, the Bank and its wholly-owned subsidiary Fall & Fall Insurance (collectively the Company) for all periods. The Company sold all significant assets of Fall & Fall on December 31, 2013, to an unrelated third party. Significant inter-company balances and transactions have been eliminated in consolidation.
Accounting
The accounting and reporting policies of the Company are in accordance with accounting principles generally accepted in the United States of America and conform to general practices in the banking industry.
14
Table of Contents
HopFed Bancorp, Inc. and Subsidiaries
Notes to Consolidated Financial Statements, Continued
December 31, 2014, 2013 and 2012
| (1) | Summary of Significant Accounting Policies: (Continued) |
Accounting, (Continued)
The Company determines whether it has a controlling financial interest in an entity by first evaluating whether the entity is a voting interest entity or a variable interest entity (VIE) under accounting principles generally accepted in the United States. Voting interest entities in which the total equity investment is a risk is sufficient to enable the entity to finance itself independently and provides the equity holders with the obligation to absorb losses, the right to receive residual returns and the right to make decision about the entity’s activities. The Company consolidates voting interest entities in which it has all, or at least a majority of, the voting interest. As defined in applicable accounting standards, VIE’s are entities in which it has all, or at least a majority of, the voting interest. A controlling financial interest in a VIE is present when an enterprise has both the power to direct the activities of the VIE that most significantly impact the VIE’s economic performance and an obligation to absorb losses or the right to receive benefits that could potentially be significant to the VIE. The subsidiaries, HopFed Capital Trust I and Fort Webb LP, LLC are VIEs for which the Company is not the primary beneficiary. Accordingly, these accounts are not included in the Company’s consolidated financial statements.
The Company has evaluated subsequent events for potential impact and disclosure through the issue date of these consolidated financial statements.
Estimates
In preparing the consolidated financial statements, management is required to make estimates and assumptions that affect the reported amounts of assets and liabilities as of the date of the consolidated balance sheets and revenues and expenses for each year. Actual results could differ significantly from those estimates. Material estimates that are particularly susceptible to significant change relate to the determination of the allowance for loan losses and the valuation of real estate acquired in connection with foreclosures or in satisfaction of loans. In connection with the determination of the allowances for loan losses and foreclosed real estate, management obtains independent appraisals for significant collateral.
Cash and Cash Equivalents
Cash and cash equivalents are defined as cash on hand, amounts due on demand from commercial banks, interest-earning deposits in other financial institutions and federal funds sold with maturities of three months or less.
Securities
The Company reports debt, readily-marketable equity, mortgage-backed and mortgage related securities in one of the following categories: (i) “trading” (held for current resale) which are to be reported at fair value, with unrealized gains and losses included in earnings; and (ii) “available for sale” (all other debt, equity, mortgage-backed and mortgage related securities) which are to be reported at fair value, with unrealized gains and losses reported net of tax as a separate component of stockholders’ equity. At the time of new security purchases, a determination is made as to the appropriate classification. Realized and unrealized gains and losses on trading securities are included in net income. Unrealized gains and losses on securities available for sale are recognized as direct increases or decreases in stockholders’ equity, net of any tax effect. Cost of securities sold is recognized using the specific identification method.
15
Table of Contents
HopFed Bancorp, Inc. and Subsidiaries
Notes to Consolidated Financial Statements, Continued
December 31, 2014, 2013 and 2012
| (1) | Summary of Significant Accounting Policies: (Continued) |
Securities, (Continued)
Interest income on securities is recognized as earned. The Company purchases many agency bonds at either a premium or discount to its par value. Premiums and discounts on agency bonds are amortized using the net interest method. For callable bonds purchased at a premium, the premium is amortized to the first call date. If the bond is not called on that date, the premium is fully amortized and the Company recognizes an increase in the net yield of the investment. The Company has determined that callable bonds purchased at a premium have a high likelihood of being called, and the decision to amortize premiums to their first call is a more conservative method of recognizing income and any variance from amortizing to contractual maturity is not material to the consolidated financial statements. For agency bonds purchased at a discount, the discount is accreted to the final maturity date. For callable bonds purchased at discount and called before maturity, the Company recognizes a gain on the sale of securities. The Company amortizes premiums and accretes discounts on mortgage back securities and collateralized mortgage obligations based on the securities three month average prepayment speed.
Other Than Temporary Impairment
A decline in the fair value of any available-for-sale security below cost that is deemed to be other-than-temporary results in a reduction in the carrying amount to fair value. To determine whether impairment is other-than-temporary, management considers whether the entity expects to recover the entire amortized cost basis of the security by reviewing the present value of the future cash flows associated with the security. The shortfall of the present value of the cash flows expected to be collected in relation to the amortized cost basis is referred to as a credit loss. If a credit loss is identified, management then considers whether it is more-likely-than-not that the Company will be required to sell the security prior to recovery. If management concludes that it is not more-likely-than-not that it will be required to sell the security, then the security is not other-than-temporarily impaired and the shortfall is recorded as a component of equity. If the security is determined to be other-than-temporarily impaired, the credit loss is recognized as a charge to earnings and a new cost basis for the security is established.
Other Securities
Other securities which are not actively traded and may be restricted, such as Federal Home Loan Bank (FHLB) stock are recognized at cost, as the value is not considered impaired.
Loans Receivable
Loans receivable are stated at unpaid principal balances, less the allowance for loan losses and deferred loan cost. The Statement of Financial Accounting Standards ASC 310-20, Nonrefundable Fees and Other Costs Associated with Originating or Acquiring Loans and Initial Direct Costs of Leases, requires the recognition of loan origination fee income over the life of the loan and the recognition of certain direct loan origination costs over the life of the loan.
16
Table of Contents
HopFed Bancorp, Inc. and Subsidiaries
Notes to Consolidated Financial Statements, Continued
December 31, 2014, 2013 and 2012
| (1) | Summary of Significant Accounting Policies: (Continued) |
Loans Receivable, (Continued)
Uncollectible interest on loans that are contractually past due is charged off, or an allowance is established based on management’s periodic evaluation. The Company charges off loans after, in management’s opinion, the collection of all or a large portion of the principal or interest is not collectable. The allowance is established by a charge to interest income equal to all interest previously accrued, and income is subsequently recognized only to the extent that cash payments are received while the loan is classified as non-accrual, when the loan is ninety days past due. Loans may be returned to accrual status when all principal and interest amounts contractually due (including arrearages) are reasonably assured of repayment within an acceptable period of time, and there is a sustained period of repayment performance by the borrower in accordance with the contractual terms of interest and principal.
The Company provides an allowance for loan losses and includes in operating expenses a provision for loan losses determined by management. Management’s periodic evaluation of the adequacy of the allowance is based on the Company’s past loan loss experience, known and inherent risks in the portfolio, adverse situations that may affect the borrower’s ability to repay, the estimated value of any underlying collateral, and current economic conditions. Management’s estimate of the adequacy of the allowance for loan loss can be classified as either a reserve for currently classified loans or estimates of future losses in the current loan portfolio.
Loans are considered to be impaired when, in management’s judgment, principal or interest is not collectible according to the contractual terms of the loan agreement. When conducting loan evaluations, management considers various factors such as historical loan performance, the financial condition of the borrower and adequacy of collateral to determine if a loan is impaired. Impaired loans and loans classified as Troubled Debt Restructurings (“TDR’s”) may be classified as either substandard or doubtful and reserved for based on individual loans risk for loss. Loans not considered impaired may be classified as either special mention or watch and may have an allowance established for it. Typically, unimpaired classified loans exhibit some form of weakness in either industry trends, collateral, or cash flow that result in a default risk greater than that of the Company’s typical loan. All classified amounts include all unpaid interest and fees as well as the principal balance outstanding.
The measurement of impaired loans generally may be based on the present value of future cash flows discounted at the historical effective interest rate. However, the majority of the Company’s problem loans become collateral dependent at the time they are judged to be impaired. Therefore, the measurement of impaired requires the Company to obtain a new appraisal to obtain the fair value of the collateral. The appraised value is then discounted to an estimated of the Company’s net realizable value, reducing the appraised value by the amount of holding and selling cost. When the measured amount of an impaired loan is less than the recorded investment in the loan, the impairment is recorded as a charge to income and a valuation allowance, which is included as a component of the allowance for loan losses. For loans not individually evaluated, management considers the Company’s recent charge off history, the Company’s current past due and non-accrual trends, banking industry trends and both local and national economic conditions when making an estimate as to the amount to reserve for losses. Management believes it has established the allowance in accordance with accounting principles generally accepted in the United States of America and has taken into account the views of its regulators and the current economic environment.
17
Table of Contents
HopFed Bancorp, Inc. and Subsidiaries
Notes to Consolidated Financial Statements, Continued
December 31, 2014, 2013 and 2012
| (1) | Summary of Significant Accounting Policies: (Continued) |
Fixed Rate Mortgage Originations
The Company operates a mortgage division that originates mortgage loans in the name of assorted investors, including Federal Home Loan Mortgage Corporation (Freddie Mac). Originations for Freddie Mac are sold through the Bank while originations to other investors are processed for a fee. On a limited basis, loans sold to Freddie Mac may result in the Bank retaining loan servicing rights. In recent years, customers have chosen lower origination rates over having their loan locally serviced; thereby limiting the amount of new loans sold with servicing retained. At December 31, 2014, the Bank maintained a servicing portfolio of one to four family real estate loans of approximately $25.0 million. For the years ended December 31, 2014, December 31, 2013, and December 31, 2012, the Bank has reviewed the value of the servicing asset as well as the operational cost associated with servicing the portfolio. The Bank has determined that the values of its servicing rights are not material to the Company’s consolidated financial statements.
Real Estate and Other Assets Owned
Assets acquired through, or in lieu of, loan foreclosure or repossession carried at the lower of cost or fair value less selling expenses. Costs of improving the assets are capitalized, whereas costs relating to holding the property are expensed. Management conducts periodic valuations (no less than annually) and any adjustments to value are recognized in the current period’s operations.
Brokered Deposits
The Company may choose to attract deposits from several sources, including using outside brokers to assist in obtaining time deposits using national distribution channels. Brokered deposits offer the Company an alternative to Federal Home Loan Bank advances and local retail time deposits.
Repurchase Agreements
The Company sells investments from its portfolio to business and municipal customers with a written agreement to repurchase those investments on the next business day. The repurchase product gives business customers the opportunity to earn income on liquid cash reserves. These funds are overnight borrowings of the Company secured by Company assets and are not FDIC insured.
Revenue Recognition
Mortgage loans held for sale are generally delivered to secondary market investors under best efforts sales commitments entered into prior to the closing of the individual loan. Loan sales and related gains or losses are recognized at settlement. Loan fees earned for the servicing of secondary market loans are recognized as earned.
Interest income on loans receivable is reported on the interest method. Interest income is not reported when full loan repayment is in doubt, typically when the loan is impaired, placed in non-accrual status, or payments are past due more than 90 days. Interest earned as reported as income is reversed on any loans classified as non-accrual or past due more than 90 days. Interest may continue to accrue on loans over 90 days past due if they are well secured and in the process of collection.
18
Table of Contents
HopFed Bancorp, Inc. and Subsidiaries
Notes to Consolidated Financial Statements, Continued
December 31, 2014, 2013 and 2012
| (1) | Summary of Significant Accounting Policies: (Continued) |
Income Taxes
Income taxes are accounted for through the use of the asset and liability method. Under the asset and liability method, deferred taxes are recognized for the tax consequences of temporary differences by applying enacted statutory rates applicable to future years to differences between the financial statement carrying amounts and the tax bases of existing assets and liabilities. The effect on deferred taxes of a change in tax rates would be recognized in income in the period that includes the enactment date. The Company files its federal and Kentucky income tax returns as well as its Kentucky and Tennessee franchise and excise tax returns on a consolidated basis with its subsidiaries. All taxes are accrued on a separate entity basis.
Operating Segments
The Company’s continuing operations include one primary segment, retail banking. The retail banking segment involves the origination of commercial, residential and consumer loans as well as the collections of deposits in eighteen branch offices.
Premises and Equipment
Land, land improvements, buildings, and furniture and equipment are carried at cost, less accumulated depreciation and amortization. Buildings and land improvements are depreciated generally by the straight-line method, and furniture and equipment are depreciated under various methods over the estimated useful lives of the assets. The Company capitalizes interest expense on construction in process at a rate equal to the Company’s cost of funds. The estimated useful lives used to compute depreciation are as follows:
| Land improvements |
5-15 years | |||
| Buildings |
40 years | |||
| Furniture and equipment |
5-15 years |
Intangible Assets
The core deposit intangible asset related to the middle Tennessee acquisition of June 2006 is amortized using the sum of the year’s digits method over an estimated period of nine years. The Company periodically evaluates the recoverability of the intangible assets and takes into account events or circumstances that warrant a revised estimate of the useful lives or indicates that impairment exists.
Bank Owned Life Insurance
Bank owned life insurance policies (BOLI) are recorded at the cash surrender value or the amount to be realized upon current redemption. The realization of the redemption value is evaluated for each insuring entity that holds insurance contracts annually by management.
19
Table of Contents
HopFed Bancorp, Inc. and Subsidiaries
Notes to Consolidated Financial Statements, Continued
December 31, 2014, 2013 and 2012
| (1) | Summary of Significant Accounting Policies: (Continued) |
Advertising
The Company expenses the production cost of advertising as incurred.
Financial Instruments
The Company has entered into off-balance-sheet financial instruments consisting of commitments to extend credit and commercial letters of credit. Such financial instruments are recorded in the consolidated financial statements when they are funded or related fees are incurred or received.
Derivative Instruments
Under guidelines ASC 815, Accounting for Derivative Instruments and Hedging Activities, as amended, all derivative instruments are required to be carried at fair value on the consolidated balance sheet. ASC 815 provides special hedge accounting provisions, which permit the change in fair value of the hedge item related to the risk being hedged to be recognized in earnings in the same period and in the same income statement line as the change in the fair value of the derivative.
A derivative instrument designated in a hedge relationship to mitigate exposure to changes in the fair value of an asset, liability or firm commitment attributable to a particular risk, such as interest rate risk, are considered fair value hedges under ASC 815. Derivative instruments designated in a hedge relationship to mitigate exposure to variability in expected future cash flows, or other types of forecasted transactions, are considered cash flow hedges. Cash value hedges are accounted for by recording the fair value of the derivative instrument and the fair value related to the risk being hedged of the hedged asset or liability on the consolidated balance sheet with corresponding offsets recorded in the consolidated balance sheet. The adjustment to the hedged asset or liability is included in the basis of the hedged item, while the fair value of the derivative is recorded as a freestanding asset or liability. Actual cash receipts or payments and related amounts accrued during the period on derivatives included in a fair value hedge relationship are recorded as adjustments to the income or expense recorded on the hedged asset or liability.
Under both the fair value and cash flow hedge methods, derivative gains and losses not effective in hedging the change in fair value or expected cash flows of the hedged item are recognized immediately in the income statement. At the hedge’s inception and at least quarterly thereafter, a formal assessment is performed to determine whether changes in the fair values or cash flows of the derivative instrument has been highly effective in offsetting changes in the fair values or cash flows of the hedged items and whether they are expected to be highly effective in the future. If it is determined a derivative instrument has not been, or will not continue to be highly effective as a hedge, hedged accounting is discontinued. ASC 815 basis adjustments recorded on hedged assets and liabilities are amortized over the remaining life of the hedged item beginning no later than when hedge accounting ceases. There were no fair value hedging gains or losses, as a result of hedge ineffectiveness, recognized for the years ended December 31, 2014, 2013 and 2012.
20
Table of Contents
HopFed Bancorp, Inc. and Subsidiaries
Notes to Consolidated Financial Statements, Continued
December 31, 2014, 2013 and 2012
| (1) | Summary of Significant Accounting Policies: (Continued) |
Fair Values of Financial Instruments
ASC 825, Disclosures about Fair Value of Financial Instruments, requires disclosure of fair value information about financial instruments, whether or not recognized in the consolidated balance sheets for which it is practicable to estimate that value. In cases where quoted market prices are not available, fair values are based on estimates using present value or other valuation techniques. Those techniques are significantly affected by the assumptions used, including the discount rate and estimates of future cash flows. In that regard, the derived fair value estimates cannot be substantiated by comparison to independent markets and, in many cases, could not be realized in immediate settlement of the instruments. Fair value estimates are made at a point in time, based on relevant market information and information about the financial instrument. Accordingly, such estimates involve uncertainties and matters of judgment and therefore cannot be determined with precision. ASC 825 excludes certain financial instruments and all non-financial instruments from its disclosure requirements. Accordingly, the aggregate fair value amounts presented do not represent the underlying value of the Company.
The following are the more significant methods and assumptions used by the Company in estimating its fair value disclosures for financial instruments:
Cash and cash equivalents
The carrying amounts reported in the consolidated balance sheets for cash and cash equivalents approximate those assets’ fair values, because they mature within 90 days or less and do not present credit risk concerns.
Interest earning deposits
The carrying amounts reported in the consolidated balance sheets for interest earning deposits approximate those assets’ fair values, because they are considered overnight deposits and may be withdrawn at any time without penalty and do not present credit risk concerns.
Available-for-sale securities
Fair values for investment securities available-for-sale are based on quoted market prices, where available. If quoted market prices are not available, fair values are based on quoted market prices of comparable instruments provided by a third party pricing service. The Company reviews all securities in which the book value is greater than the market value for impairment that is other than temporary. For securities deemed to be other than temporarily impaired, the Company reduces the book value of the security to its market value by recognizing an impairment charge on its income statement.
Loans receivable
The fair values for of fixed-rate loans and variable rate loans that re-price on an infrequent basis is estimated using discounted cash flow analysis which considers future re-pricing dates and estimated repayment dates, and further using interest rates currently being offered for loans of similar type, terms to borrowers of similar credit quality. Loan fair value estimates include judgments regarding future expected loss experience and risk characteristics. The estimated fair value of variable-rate loans that re-price frequently and with have no significant change in credit risk is approximately the carrying value of the loan.
21
Table of Contents
HopFed Bancorp, Inc. and Subsidiaries
Notes to Consolidated Financial Statements, Continued
December 31, 2014, 2013 and 2012
| (1) | Summary of Significant Accounting Policies: (Continued) |
Fair Values of Financial Instruments, (Continued)
Letters of credit
The fair value of standby letters of credit is estimated using the fees currently charged to enter into similar agreements, taking into account the remaining terms of the agreements, the likelihood of the counter parties drawing on such financial instruments and the present creditworthiness of such counter parties. Such commitments have been made on terms which are competitive in the markets in which the Company operates, thus, the fair value of standby letters of credit equals the carrying value for the purposes of this disclosure.
Accrued interest receivable
Fair value is estimated to approximate the carrying amount because such amounts are expected to be received within 90 days or less and any credit concerns have been previously considered in the carrying value.
Repurchase agreements
Overnight repurchase agreements have a fair value at book, given that they mature overnight. The fair values for of longer date repurchase agreements is estimated using discounted cash flow analysis which considers the current market pricing for repurchase agreements of similar final maturities and collateral requirements.
Bank owned life insurance
The fair value of bank owned life insurance is the cash surrender value of the policy less redemption charges. By surrendering the policy, the Company is also subject to federal income taxes on all earnings previously recognized.
Deposits
The fair values disclosed for deposits with no stated maturity such as demand deposits, interest-bearing checking accounts and savings accounts are, by definition, equal to the amount payable on demand at the reporting date (that is, their carrying amounts). The fair values for certificates of deposit and other fixed maturity time deposits are estimated using a discounted cash flow calculation that applies interest rates currently being offered on such type accounts or similar accounts to a schedule of aggregated contractual maturities or similar maturities on such time deposits.
Advances from the Federal Home Loan Bank (FHLB)
The fair value of these advances is estimated by discounting the future cash flows of these advances using the current rates at which similar advances or similar financial instruments could be obtained.
FHLB stock
The fair value of FHLB stock is recognized at cost.
22
Table of Contents
HopFed Bancorp, Inc. and Subsidiaries
Notes to Consolidated Financial Statements, Continued
December 31, 2014, 2013 and 2012
| (1) | Summary of Significant Accounting Policies: (Continued) |
Fair Values of Financial Instruments, (Continued)
Subordinated debentures
The book value of subordinated debentures is cost. The subordinated debentures re-price quarterly at a rate equal to three month libor plus 3.10%.
Off-Balance-Sheet Instruments
Off-balance-sheet lending commitments approximate their fair values due to the short period of time before the commitment expires.
Dividend Restrictions
The Company is not permitted to pay a dividend to common shareholders if it fails to make a quarterly interest payment to the holders of the Company’s subordinated debentures. Furthermore, the Bank may be restricted in the payment of dividends to the Corporation by the KDFI or FDIC. Any restrictions imposed by either regulator would effectively limit the Company’s ability to pay a dividend to its common stockholders as discussed in Note 17. At December 31, 2013, there were no such restrictions. At December 31, 2014, the Corporation has $2.9 million in cash on hand available to pay common dividends and repurchase common share as outlined in Note 20. At December 31, 2014, the Bank may not pay an additional cash dividend to the Company without regulatory approval.
23
Table of Contents
HopFed Bancorp, Inc. and Subsidiaries
Notes to Consolidated Financial Statements, Continued
December 31, 2014, 2013 and 2012
| (1) | Summary of Significant Accounting Policies: (Continued) |
Earnings Per Share
Earnings per share (EPS) consists of two separate components, basic EPS and diluted EPS. Basic EPS is computed by dividing net income available to common shareholders by the weighted average number of common shares outstanding for each period presented. Diluted EPS is calculated by dividing net income available to common shareholders by the weighted average number of common shares outstanding plus dilutive common stock equivalents (CSE). CSE consists of dilutive stock options granted through the Company’s stock option plan. Restricted stock awards represent future compensation expense and are dilutive. Common stock equivalents which are considered anti-dilutive are not included for the purposes of this calculation. Common stock warrants issued in December 2008 and all stock options outstanding are currently anti-dilutive and are not included for the purposes of this calculation.
Both EPS and diluted EPS are reduced by the amount of dividend payments on preferred stock and the accretion of the discount on the preferred stock. The Company repurchased all preferred shares in December of 2012. The effect of the Company’s dividend payment on preferred stock and accretion of the preferred stock is as provided for the year ended December 31, 2012:
| 2012 | ||||
| Dividend on preferred shares |
$ | 1,006,886 | ||
| Accretion dividend on preferred shares |
222,360 | |||
|
|
|
|||
| Total cost of preferred stock |
$ | 1,229,246 | ||
|
|
|
|||
| Reduction in earnings per share to common stockholders: |
||||
| Basic |
$ | 0.16 | ||
|
|
|
|||
| Fully diluted |
$ | 0.16 | ||
|
|
|
|||
| Weighted average shares outstanding -basic |
7,486,445 | |||
|
|
|
|||
| Weighted average shares outstanding -diluted |
7,486,445 | |||
|
|
|
|||
Stock Compensation
The Company utilized the Black-Sholes valuation model to determine the fair value of stock options on the date of grant. The model derives the fair value of stock options based on certain assumptions related to the expected stock prices volatility, expected option life, risk-free rate of return and the dividend yield of the stock. The expected life of options granted is estimated based on historical employee exercise behavior. The risk free rate of return coincides with the expected life of the options and is based on the ten year Treasury note rate at the time the options are issued. The historical volatility levels of the Company’s common stock are used to estimate the expected stock price volatility. The set dividend yield is used to estimate the expected dividend yield of the stock.
24
Table of Contents
HopFed Bancorp, Inc. and Subsidiaries
Notes to Consolidated Financial Statements, Continued
December 31, 2014, 2013 and 2012
| (1) | Summary of Significant Accounting Policies: (Continued) |
Effect of New Accounting Pronouncements
In January 2014, the FASB issued ASU No. 2014-04, Receivables-Troubled Debt Restructurings by Creditors (Subtopic 310-40): Reclassification of Residential Real Estate Collateralized Consumer Mortgage Loans upon Foreclosure. These amendments are intended to clarify when a creditor should be considered to have received physical possession of residential real estate property collateralizing a consumer mortgage loan such that the loan should be derecognized and the real estate recognized. The amendments clarify that an in substance repossession or foreclosure occurs, and a creditor is considered to have received physical possession of residential real estate property collateralizing a consumer mortgage loan, upon either: (1) the creditor obtaining legal title to the residential real estate property upon completion of residential foreclosure, or (2) the borrower conveying all interest in the residential real estate property to the creditor to satisfy that loan through completion of a deed in lieu of foreclosure or through a similar legal agreement. Additional disclosures about such activities are required by these amendments. The amendments in this ASU become effective for public companies for annual periods and interim periods within those annual periods beginning after December 15, 2014, and early adoption is permitted. The Company is assessing the impact that these amendments will have on its financial position and results of operations, but does not currently anticipate that it will have a material impact.
On June 12, 2014, the FASB issued ASU 2014-11, which makes limited amendments to the guidance in ASC 860 on accounting for certain repurchase agreements (“repos”). ASU 2014-11 requires entities to account for repurchase-to-maturity transactions as secured borrowings (rather than as sales with forward repurchase agreements), (2) eliminates accounting guidance on linked repurchase financing transactions, and (3) expands disclosure requirements related to certain transfers of financial assets that are accounted for as sales and certain transfers (specifically, repos, securities lending transactions, and repurchase-to-maturity transactions) accounted for as secured borrowings.
ASU 2014-11 also amends ASC 860 to clarify that repos and securities lending transactions that do not meet all of the de-recognition criteria in ASC 860-10-40-5 should be accounted for as secured borrowings. In addition, the ASU provides examples of repurchase and securities lending arrangements that illustrate whether a transferor has maintained effective control over the transferred financial assets. For public business entities, the accounting changes are effective for the first interim or annual period beginning after December 15, 2014. The Company is assessing the impact that these amendments will have on its financial position and results of operations.
25
Table of Contents
HopFed Bancorp, Inc. and Subsidiaries
Notes to Consolidated Financial Statements, Continued
December 31, 2014, 2013 and 2012
| (1) | Summary of Significant Accounting Policies: (Continued) |
Effect of New Accounting Pronouncements (Continued)
ASU 2013-10, “Derivatives and Hedging (Topic 815) – Inclusion of the Fed Funds Effective Swap Rate (or Overnight Index Swap Rate) as a Benchmark Interest Rate for Hedge Accounting Purposes.” ASU 2013-10 permits the Fed Funds Effective Swap Rate (or Overnight Index Swap Rate) to be used as a U.S. benchmark interest rate for hedge accounting purposes under Topic 815, in addition to interest rates on direct Treasury obligations of the U.S. government and the London Interbank Offered Rate (“LIBOR”). ASU 2013-10 became effective for qualifying new or re-designated hedging relationships entered into on or after July 17, 2013, and did not have a significant impact on the Company’s consolidated financial position or results of operations.
ASU 2015-01, “Income Statement—Extraordinary and Unusual Items (Subtopic 225-20) – Simplifying Income Statement Presentation by Eliminating the Concept of Extraordinary Items.” ASU 2015-01 eliminates from U.S. GAAP the concept of extraordinary items, which, among other things, required an entity to segregate extraordinary items considered to be unusual and infrequent from the results of ordinary operations and show the item separately in the income statement, net of tax, after income from continuing operations. ASU 2015-01 is effective for the Corporation beginning January 1, 2016, though early adoption is permitted. ASU 2015-01 is not expected to have a significant impact on the Company’s consolidated financial position or results of operations.
Other accounting standards that have been issued or proposed by the FASB or other standards-setting bodies are not expected to have a material impact on the Company’s financial position, results of operations or cash flows.
Reclassifications
Certain items in prior financial statements have been reclassified to conform to the current presentation.
26
Table of Contents
HopFed Bancorp, Inc. and Subsidiaries
Notes to Consolidated Financial Statements, Continued
December 31, 2014, 2013 and 2012
(Table Amounts in Thousands)
| (2) | Securities: |
Securities, which consist of debt and equity investments, have been classified in the consolidated balance sheets according to management’s intent. The carrying amount of securities and their estimated fair values follow:
| December 31, 2014 | ||||||||||||||||
| Amortized Cost |
Gross Unrealized Gains |
Gross Unrealized Losses |
Estimated Fair Value |
|||||||||||||
| Restricted: |
||||||||||||||||
| FHLB stock |
$ | 4,428 | — | — | 4,428 | |||||||||||
|
|
|
|
|
|
|
|
|
|||||||||
| Available for Sale: |
||||||||||||||||
| U.S. Treasury securities |
$ | 3,977 | 3 | — | 3,980 | |||||||||||
| U.S. Agency securities: |
101,654 | 2,125 | (527 | ) | 103,252 | |||||||||||
| Tax free municipal bonds |
57,399 | 3,814 | (166 | ) | 61,047 | |||||||||||
| Taxable municipal bonds |
11,871 | 235 | (63 | ) | 12,043 | |||||||||||
| Trust preferred securities |
1,600 | — | (111 | ) | 1,489 | |||||||||||
| Commercial bonds |
2,000 | 7 | — | 2,007 | ||||||||||||
| Mortgage-backed securities: |
||||||||||||||||
| GNMA |
27,535 | 670 | (122 | ) | 28,083 | |||||||||||
| FNMA |
50,617 | 694 | (536 | ) | 50,775 | |||||||||||
| FHLMC |
3,276 | 38 | — | 3,314 | ||||||||||||
| SLMA CMOs |
9,895 | — | (252 | ) | 9,643 | |||||||||||
| AGENCY CMOs |
28,024 | 176 | (205 | ) | 27,995 | |||||||||||
|
|
|
|
|
|
|
|
|
|||||||||
| $ | 297,848 | 7,762 | (1,982 | ) | 303,628 | |||||||||||
|
|
|
|
|
|
|
|
|
|||||||||
27
Table of Contents
HopFed Bancorp, Inc. and Subsidiaries
Notes to Consolidated Financial Statements, Continued
December 31, 2014, 2013 and 2012
(Table Amounts in Thousands)
| (2) | Securities: (Continued) |
| December 31, 2013 | ||||||||||||||||
| Amortized Cost |
Gross Unrealized Gains |
Gross Unrealized Losses |
Estimated Fair Value |
|||||||||||||
| Restricted: |
||||||||||||||||
| FHLB stock |
$ | 4,428 | — | — | 4,428 | |||||||||||
|
|
|
|
|
|
|
|
|
|||||||||
| Available for Sale: |
||||||||||||||||
| U.S. government and agency securities: |
$ | 120,608 | 1,856 | (2,441 | ) | 120,023 | ||||||||||
| Tax free municipal bonds |
64,291 | 2,066 | (898 | ) | 65,459 | |||||||||||
| Taxable municipal bonds |
18,337 | 458 | (738 | ) | 18,057 | |||||||||||
| Trust preferred securities |
1,600 | — | (111 | ) | 1,489 | |||||||||||
| Commercial bonds |
2,000 | — | (16 | ) | 1,984 | |||||||||||
| Mortgage-backed securities: |
||||||||||||||||
| GNMA |
17,327 | 590 | (142 | ) | 17,775 | |||||||||||
| FNMA |
70,104 | 526 | (1,938 | ) | 68,692 | |||||||||||
| FHLMC |
1,301 | 35 | — | 1,336 | ||||||||||||
| SLMA CMOs |
8,459 | — | (374 | ) | 8,085 | |||||||||||
| AGENCY CMOs |
16,296 | 134 | (420 | ) | 16,010 | |||||||||||
|
|
|
|
|
|
|
|
|
|||||||||
| $ | 320,323 | 5,665 | (7,078 | ) | 318,910 | |||||||||||
|
|
|
|
|
|
|
|
|
|||||||||
The scheduled maturities of debt securities available for sale at December 31, 2014, were as follows:
| Amortized Cost |
Estimated Fair Value |
|||||||
| 2014 |
||||||||
| Due within one year |
$ | 4,830 | 4,927 | |||||
| Due in one to five years |
21,564 | 21,818 | ||||||
| Due in five to ten years |
41,683 | 42,613 | ||||||
| Due after ten years |
33,119 | 35,380 | ||||||
|
|
|
|
|
|||||
| 101,196 | 104,738 | |||||||
| Amortizing agency bonds |
77,305 | 79,080 | ||||||
| Mortgage-backed securities |
119,347 | 119,810 | ||||||
|
|
|
|
|
|||||
| Total unrestricted securities available for sale |
$ | 297,848 | 303,628 | |||||
|
|
|
|
|
|||||
28
Table of Contents
HopFed Bancorp, Inc. and Subsidiaries
Notes to Consolidated Financial Statements, Continued
December 31, 2014, 2013 and 2012
(Table Amounts in Thousands)
| (2) | Securities: (Continued) |
The scheduled maturities of debt securities available for sale at December 31, 2013, were as follows:
| 2013 |
Amortized Cost |
Estimated Fair Value |
||||||
| Due within one year |
$ | 501 | 505 | |||||
| Due in one to five years |
12,630 | 12,954 | ||||||
| Due in five to ten years |
38,192 | 37,364 | ||||||
| Due after ten years |
49,284 | 49,314 | ||||||
|
|
|
|
|
|||||
| 100,607 | 100,137 | |||||||
| Amortizing agency bonds |
106,229 | 106,875 | ||||||
| Mortgage-backed securities |
113,487 | 111,898 | ||||||
|
|
|
|
|
|||||
| Total unrestricted securities available for sale |
$ | 320,323 | 318,910 | |||||
|
|
|
|
|
|||||
The FHLB stock is an equity interest in the Federal Home Loan Bank. FHLB stock does not have a readily determinable fair value because ownership is restricted and a market is lacking. FHLB stock is classified as a restricted investment security, carried at cost and evaluated for impairment.
The estimated fair value and unrealized loss amounts of temporarily impaired investments as of December 31, 2014, are as follows:
| Less than 12 months | 12 months or longer | Total | ||||||||||||||||||||||
| December 31, 2014 |
Estimated | Unrealized | Estimated | Unrealized | Estimated | Unrealized | ||||||||||||||||||
| Fair Value | Losses | Fair Value | Losses | Fair Value | Losses | |||||||||||||||||||
| Available for sale |
||||||||||||||||||||||||
| U.S. government and agency securities: |
||||||||||||||||||||||||
| Agency debt securities |
$ | 14,021 | (20 | ) | 29,156 | (507 | ) | 43,177 | (527 | ) | ||||||||||||||
| Taxable municipals |
— | — | 4,785 | (63 | ) | 4,785 | (63 | ) | ||||||||||||||||
| Tax free municipals |
— | — | 6,647 | (166 | ) | 6,647 | (166 | ) | ||||||||||||||||
| Trust preferred securities |
— | — | 1,489 | (111 | ) | 1,489 | (111 | ) | ||||||||||||||||
| Mortgage-backed securities: |
||||||||||||||||||||||||
| GNMA |
12,568 | (108 | ) | 2,895 | (14 | ) | 15,463 | (122 | ) | |||||||||||||||
| FNMA |
— | — | 18,927 | (536 | ) | 18,927 | (536 | ) | ||||||||||||||||
| SLMA CMOs |
1,923 | (14 | ) | 7,720 | (238 | ) | 9,643 | (252 | ) | |||||||||||||||
| AGENCY CMOs |
9,545 | (91 | ) | 7,685 | (114 | ) | 17,230 | (205 | ) | |||||||||||||||
|
|
|
|
|
|
|
|
|
|
|
|
|
|||||||||||||
| Total Available for Sale |
$ | 38,057 | (233 | ) | 79,304 | (1,749 | ) | 117,361 | (1,982 | ) | ||||||||||||||
|
|
|
|
|
|
|
|
|
|
|
|
|
|||||||||||||
29
Table of Contents
HopFed Bancorp, Inc. and Subsidiaries
Notes to Consolidated Financial Statements, Continued
December 31, 2014, 2013 and 2012
(Table Amounts in Thousands)
| (2) | Securities: (Continued) |
The estimated fair value and unrealized loss amounts of temporarily impaired investments as of December 31, 2013, are as follows:
| Less than 12 months | 12 months or longer | Total | ||||||||||||||||||||||
| December 31, 2013 |
Estimated | Unrealized | Estimated | Unrealized | Estimated | Unrealized | ||||||||||||||||||
| Fair Value | Losses | Fair Value | Losses | Fair Value | Losses | |||||||||||||||||||
| Available for sale |
||||||||||||||||||||||||
| U.S. government and agency securities: |
||||||||||||||||||||||||
| Agency debt securities |
$ | 44,968 | (2,107 | ) | 6,793 | (334 | ) | 51,761 | (2,441 | ) | ||||||||||||||
| Taxable municipals |
7,903 | (660 | ) | 797 | (78 | ) | 8,700 | (738 | ) | |||||||||||||||
| Tax free municipals |
9,848 | (692 | ) | 3,720 | (206 | ) | 13,568 | (898 | ) | |||||||||||||||
| Trust preferred securities |
— | — | 1,489 | (111 | ) | 1,489 | (111 | ) | ||||||||||||||||
| Commercial bonds |
1,984 | (16 | ) | — | — | 1,984 | (16 | ) | ||||||||||||||||
| Mortgage-backed securities: |
||||||||||||||||||||||||
| GNMA |
5,320 | (128 | ) | 1,551 | (14 | ) | 6,871 | (142 | ) | |||||||||||||||
| FNMA |
42,464 | (1,626 | ) | 6,746 | (312 | ) | 49,210 | (1,938 | ) | |||||||||||||||
| NON-AGENCY CMOs |
5,224 | (374 | ) | — | — | 5,224 | (374 | ) | ||||||||||||||||
| AGENCY CMOs |
7,031 | (223 | ) | 1,844 | (197 | ) | 8,875 | (420 | ) | |||||||||||||||
|
|
|
|
|
|
|
|
|
|
|
|
|
|||||||||||||
| Total Available for Sale |
$ | 124,742 | (5,826 | ) | 22,940 | (1,252 | ) | 147,682 | (7,078 | ) | ||||||||||||||
|
|
|
|
|
|
|
|
|
|
|
|
|
|||||||||||||
30
Table of Contents
HopFed Bancorp, Inc. and Subsidiaries
Notes to Consolidated Financial Statements, Continued
December 31, 2014, 2013 and 2012
| (2) | Securities: (Continued) |
Management evaluates securities for other-than-temporary impairment at least on a quarterly basis, and more frequently when economic or market concerns warrant such evaluations. Consideration is given to (1) the length of time and the extent to which the fair value has been less than cost, (2) the financial condition and near-term prospects of the issuer, and (3) the intent and ability of the Company to retain its investment in the issuer for a period of time sufficient to allow for any anticipated recovery in fair value.
At December 31, 2014, the Company has 67 securities with unrealized losses. With the exception of a subordinated debenture discussed below, Management believes these unrealized losses relate to changes in interest rates and not credit quality. Management also believes the Company has the ability to hold these securities until maturity or for the foreseeable future and therefore no declines are deemed to be other than temporary.
The carrying value of the Company’s investment securities may decline in the future if the financial condition of issuers deteriorates and management determines it is probable that the Company will not recover the entire amortized cost bases of the securities. As a result, there is a risk that other-than-temporary impairment charges may occur in the future.
In June of 2008, the Company purchased $2.0 million par value of a private placement subordinated debenture issued by First Financial Services Corporation (“FFKY”), the holding Company for First Federal Savings Bank (“First Fed”). The debenture is a thirty year security with a coupon rate of 8.00%. FFKY is a NASDAQ listed commercial bank holding company located in Elizabethtown, Kentucky. In October of 2010, FFKY informed the owners of its subordinated trust, including the Company, that it was deferring the dividend payments for up to five years as prescribed by the trust.
At September 30, 2013, the Company recognized a $400,000 impairment charge due against this security. The impairment charge was recognized due to management’s financial analysis of the issuing institution and our opinion that it would be unable to make dividend payments after the five year extension expired. The current par value of the security is $1.6 million, which reflects the impairment charge taken. At December 31, 2014, the Company has determined that our Company’s investment in FFKY remained impaired.
31
Table of Contents
HopFed Bancorp, Inc. and Subsidiaries
Notes to Consolidated Financial Statements, Continued
December 31, 2014, 2013 and 2012
| (2) | Securities: (Continued) |
During 2014, the Company sold investment securities classified as available for sale for proceeds of $75.3 million resulting in gross gains of $788,000 and gross losses of $210,000. During 2013, the Company sold investment securities classified as available for sale for proceeds of $68.5 million resulting in gross gains of $1.7 million and gross losses of $33,000. During 2012, the Company sold investment securities classified as available for sale for proceeds of $69.0 million resulting in gross gains of $1.8 million and gross losses of $115,000.
As part of its normal course of business, the Bank holds significant balances of municipal and other deposits that require the Bank to pledge investment instruments as collateral. At December 31, 2014, the Bank pledged investments with a book value of $181.8 million and a market value of approximately $192.8 million to various municipal entities as required by law. In addition, the Bank has provided $11.0 million of letters of credit issued by the Federal Home Loan Bank of Cincinnati to collateralize municipal deposits. The collateral for these letters of credit are the Bank’s one to four family loan portfolio.
32
Table of Contents
HopFed Bancorp, Inc. and Subsidiaries
Notes to Consolidated Financial Statements, Continued
December 31, 2014, 2013 and 2012
(Table Amounts in Thousands, Except Percentages)
| (3) | Loans Receivable, Net: |
The components of loans receivable in the consolidated balance sheets as of December 31, 2014, and December 31, 2013, were as follows:
| December 31, 2014 | December 31, 2013 | |||||||||||||||
| Amount | Percent | Amount | Percent | |||||||||||||
| Real estate loans: |
||||||||||||||||
| One-to-four family (closed end) first mortgages |
$ | 150,551 | 27.6 | % | 155,252 | 28.1 | % | |||||||||
| Second mortgages (closed end) |
2,102 | 0.4 | % | 3,248 | 0.6 | % | ||||||||||
| Home equity lines of credit |
34,238 | 6.3 | % | 34,103 | 6.2 | % | ||||||||||
| Multi-family |
25,991 | 4.8 | % | 29,736 | 5.4 | % | ||||||||||
| Construction |
24,241 | 4.4 | % | 10,618 | 1.9 | % | ||||||||||
| Land |
26,654 | 4.9 | % | 34,681 | 6.3 | % | ||||||||||
| Farmland |
42,874 | 7.8 | % | 51,868 | 9.4 | % | ||||||||||
| Non-residential real estate |
150,596 | 27.6 | % | 157,692 | 28.5 | % | ||||||||||
|
|
|
|
|
|
|
|
|
|||||||||
| Total mortgage loans |
457,247 | 83.8 | % | 477,198 | 86.4 | % | ||||||||||
| Consumer loans |
14,438 | 2.6 | % | 11,167 | 2.0 | % | ||||||||||
| Commercial loans |
74,154 | 13.6 | % | 64,041 | 11.6 | % | ||||||||||
|
|
|
|
|
|
|
|
|
|||||||||
| Total other loans |
88,592 | 16.2 | % | 75,208 | 13.6 | % | ||||||||||
|
|
|
|
|
|
|
|
|
|||||||||
| Total loans, gross |
545,839 | 100.0 | % | 552,406 | 100.0 | % | ||||||||||
|
|
|
|
|
|||||||||||||
| Deferred loan cost, net of fees |
(286 | ) | (92 | ) | ||||||||||||
| Less allowance for loan losses |
(6,289 | ) | (8,682 | ) | ||||||||||||
|
|
|
|
|
|||||||||||||
| Total loans |
$ | 539,264 | 543,632 | |||||||||||||
|
|
|
|
|
|||||||||||||
The Company continues to reduce its land development loan portfolio exposure. The land development portfolio continues to be plagued by higher levels of loan losses, adverse risk classifications and regulatory scrutiny. At December 31, 2014, the Company has approximately $26.7 million land development loans, with $10.8 million, or 40.6% of the land development portfolio, being classified as substandard. At December 31, 2014, the Company has $37.4 million of total loans classified as substandard.
33
Table of Contents
HopFed Bancorp, Inc. and Subsidiaries
Notes to Consolidated Financial Statements, Continued
December 31, 2014, 2013 and 2012
| (3) | Loans Receivable, Net: (Continued) |
Loans serviced for the benefit of others totaled approximately $30.4 million, $32.6 million and $40.3 million at December 31, 2014, 2013 and 2012, respectively. At December 31, 2014, approximately $25.0 million of the $30.4 million in loans serviced by the Company are serviced for the benefit of Freddie Mac. Servicing loans for others generally consists of collecting mortgage payments, maintaining escrow amounts, disbursing payments to investors and foreclosure processing. The servicing rights associated with these loans are not material to the Company’s consolidated financial statements. Qualified one-to-four family first mortgage loans, non-residential real estate loans, multi-family loans and commercial real estate loans are pledged to the Federal Home Loan Bank of Cincinnati as discussed in Note 7.
The Company originates most fixed rate loans for immediate sale to FHLMC or other investors. Generally, the sale of such loans is arranged shortly after the loan application is tentatively approved through commitments.
The Company conducts annual reviews on all loan relationships above $1.0 million to ascertain the borrowers continued ability to service their debt as agreed. In addition to the credit relationships mentioned above, management may classify any credit relationship once it becomes aware of adverse credit trends for that customer. Typically, the annual review consists of updated financial statements for borrowers and any guarantors, a review of the borrower’s credit history with the Company and other creditors, and current income tax information. As a result of this review, management will classify loans based on their credit risk. Additionally, the Company provides a risk grade for all loans past due more than sixty days.
The Company uses the following risk definitions for risk grades:
Satisfactory loans of average strength having some deficiency or vulnerability to changing economic or industry conditions. These customers should have reasonable amount of capital and operating ratios. Secured loans may lack in margin or liquidity. Loans to individuals, perhaps supported in dollars of net worth, but with supporting assets may be difficult to liquidate.
Watch loans are acceptable credits: (1) that need continual monitoring, such as out-of territory or asset-based loans (since the Company does not have an asset-based lending department), or (2) with a marginal risk level to business concerns and individuals that; (a) have exhibited favorable performance in the past, though currently experiencing negative trends; (b) are in an industry that is experiencing volatility or is declining, and their performance is less than industry norms; and (c) are experiencing unfavorable trends in their financial position, such as one-time net losses or declines in asset values. These marginal borrowers may have early warning signs of problems such as occasional overdrafts and minor delinquency.
34
Table of Contents
HopFed Bancorp, Inc. and Subsidiaries
Notes to Consolidated Financial Statements, Continued
December 31, 2014, 2013 and 2012
| (3) | Loans Receivable, Net: (Continued) |
If considered marginal, a loan would be a “watch” until financial data demonstrated improved performance or further deterioration to a “substandard” grade usually within a 12-month period. In the table on page 38, Watch loans are included with satisfactory loans and classified as Pass.
Other Loans Especially Mentioned are currently protected but are potentially weak. These loans constitute an undue and unwarranted credit risk but not to the point of justifying a substandard classification. The credit risk may be relatively minor yet constitutes an unwarranted risk in light of the circumstances surrounding a specific loan. These credit weaknesses, if not checked or corrected, will weaken the loan or inadequately protect the Bank’s credit position at some future date.
A Substandard loan is inadequately protected by the current sound worth and paying capacity of the obligor or of the collateral pledged. Loans so classified have a well-defined weakness or weaknesses that jeopardize the liquidation of the debt. The loans are characterized by the distinct possibility that the Company will sustain some loss if the deficiencies are not corrected. This does not imply ultimate loss of the principal, but may involve burdensome administrative expenses and the accompanying cost to carry the credit. Examples of substandard loans include those to borrowers with insufficient or negative cash flow, negative net worth coupled with inadequate guarantor support, inadequate working capital, and/or significantly past-due loans and overdrafts.
A loan classified Doubtful has all the weaknesses inherent in a substandard credit except that the weaknesses make collection or liquidation in full (on the basis of currently existing facts, conditions, and values) highly questionable and improbable. The possibility of loss is extremely high, but because of certain pending factors charge-off is deferred until its more exact status may be determined. Pending factors include proposed merger, acquisition, or liquidation procedures, capital injection, perfecting liens on additional collateral, and refinancing plans. The doubtful classification is applied to that portion of the credit in which the full collection of principal and interest is questionable.
A loan is considered to be impaired when management determines that it is probable that the Company will be unable to collect all principal and interest payments due in accordance with the contractual terms of the loan agreement. The value of individually impaired loans is measured based on the present value of expected payments or using the fair value of the collateral if the loan is collateral dependent. Currently, it is management’s practice to classify all substandard or doubtful loans as impaired.
35
Table of Contents
HopFed Bancorp, Inc. and Subsidiaries
Notes to Consolidated Financial Statements, Continued
December 31, 2014, 2013 and 2012
| (3) | Loans Receivable, Net: (Continued) |
Loan Origination/Risk Management
The Company has certain lending policies and procedures in place that are designed to maximize loan income within an acceptable level of risk. Management reviews and approves these policies and procedures on a regular basis. A reporting system supplements the review process by providing management with frequent reports related to loan production, loan quality, concentrations of credit, loan delinquencies and non-performing and potential problem loans. Diversification in the loan portfolio is a means of managing risk associated with fluctuations in economic conditions.
Commercial and industrial loans are underwritten after evaluating and understanding the borrower’s ability to operate profitably and prudently expand its business. Underwriting standards are designed to promote relationship banking rather than transactional banking. Once it is determined that the borrower’s management possesses sound ethics and solid business acumen, the Company’s management examines current and projected cash flows to determine the ability of the borrower to repay their obligations as agreed. Commercial and industrial loans are primarily made based on the identified cash flows of the borrower and secondarily on the underlying collateral provided by the borrower. The cash flows of borrowers, however, may not be as expected and the collateral securing these loans may fluctuate in value. Most commercial and industrial loans are secured by the assets being financed or other business assets such as accounts receivable or inventory and may incorporate a personal guarantee; however, some short-term loans may be made on an unsecured basis. In the case of loans secured by accounts receivable, the availability of funds for the repayment of these loans may be substantially dependent on the ability of the borrower to collect amounts due from its customers.
Commercial real estate loans are subject to underwriting standards and processes similar to commercial and industrial loans, in addition to those of real estate loans. These loans are viewed primarily as cash flow loans and secondarily as loans secured by real estate. Commercial real estate lending typically involves higher loan principal amounts and the repayment of these loans is generally largely dependent on the successful operation of the property securing the loan or the business conducted on the property securing the loan. Commercial real estate loans may be more adversely affected by conditions in the real estate markets or in the general economy. The properties securing the Company’s commercial real estate portfolio are diverse in terms of type and geographic location. This diversity helps reduce the Company’s exposure to adverse economic events that affect any single market or industry. Management monitors and evaluates commercial real estate loans based on collateral, geography and risk grade criteria. As a general rule, the Company avoids financing single-purpose projects unless other underwriting factors are present to help mitigate risk. The Company also utilizes third-party experts to provide insight and guidance about economic conditions and trends affecting market areas it serves. In addition, management tracks the level of owner-occupied commercial real estate loans versus non-owner occupied loans. At December 31, 2014, approximately $82.0 million of the outstanding principal balance of the Company’s non-residential real estate loans were secured by owner-occupied properties, approximately $68.6 million was secured by non-owner occupied properties.
36
Table of Contents
HopFed Bancorp, Inc. and Subsidiaries
Notes to Consolidated Financial Statements, Continued
December 31, 2014, 2013 and 2012
| (3) | Loans Receivable, Net: (Continued) |
Loan Origination/Risk Management (Continued)
With respect to loans to developers and builders that are secured by non-owner occupied properties that the Company may originate from time to time, the Company generally requires the borrower to have had an existing relationship with the Company and have a proven record of success. Construction loans are underwritten utilizing feasibility studies, independent appraisal reviews, sensitivity analysis of absorption and lease rates and financial analysis of the developers and property owners. Construction loans are generally based upon estimates of costs and value associated with the completed project. These estimates may be inaccurate. Construction loans often involve the disbursement of substantial funds with repayment substantially dependent on the success of the ultimate project. Sources of repayment for these types of loans may be pre-committed permanent loans from approved long-term lenders, sales of developed property or an interim loan commitment from the Company until permanent financing is obtained. These loans are closely monitored by on-site inspections and are considered to have higher risks than other real estate loans due to their ultimate repayment being sensitive to interest rate changes, governmental regulation of real property, general economic conditions and the availability of long-term financing.
The Company maintains an independent loan review function that is typically outsourced to firms that specialize in conducting loan reviews. Results of these reviews are presented to management. The loan review process complements and reinforces the risk identification and assessment decisions made by lenders and credit personnel, as well as the Company policies and procedures.
Most of the Company’s lending activity occurs in Western Kentucky and middle and western Tennessee. The majority of the Company’s loan portfolio consists of non-residential real estate loans and one-to-four family residential real estate loans.
37
Table of Contents
HopFed Bancorp, Inc. and Subsidiaries
Notes to Consolidated Financial Statements, Continued
December 31, 2014, 2013 and 2012
(Table Amounts in Thousands)
| (3) | Loans Receivable, Net: (Continued) |
Loans by classification type and the related valuation allowance amounts at December 31, 2014, were as follows:
| Special | Impaired Loans | Specific Allowance for |
Allowance for Loans not |
|||||||||||||||||||||||||
| Pass | Mention | Substandard | Doubtful | Total | Impairment | Impaired | ||||||||||||||||||||||
| December 31, 2014 |
||||||||||||||||||||||||||||
| One-to-four family mortgages |
$ | 146,129 | 203 | 4,219 | — | 150,551 | 51 | 1,147 | ||||||||||||||||||||
| Home equity line of credit |
33,481 | — | 757 | — | 34,238 | — | 181 | |||||||||||||||||||||
| Junior lien |
2,025 | 40 | 37 | — | 2,102 | — | 14 | |||||||||||||||||||||
| Multi-family |
20,066 | 2,904 | 3,021 | — | 25,991 | — | 85 | |||||||||||||||||||||
| Construction |
24,241 | — | — | — | 24,241 | — | 146 | |||||||||||||||||||||
| Land |
15,328 | 362 | 10,964 | — | 26,654 | 663 | 460 | |||||||||||||||||||||
| Non-residential real estate |
131,854 | 5,492 | 13,250 | — | 150,596 | 738 | 1,345 | |||||||||||||||||||||
| Farmland |
40,121 | 516 | 2,237 | — | 42,874 | — | 461 | |||||||||||||||||||||
| Consumer loans |
14,118 | 21 | 299 | — | 14,438 | 62 | 432 | |||||||||||||||||||||
| Commercial loans |
71,246 | 325 | 2,583 | — | 74,154 | — | 504 | |||||||||||||||||||||
|
|
|
|
|
|
|
|
|
|
|
|
|
|
|
|||||||||||||||
| Total |
$ | 498,609 | 9,863 | 37,367 | — | 545,839 | 1,514 | 4,775 | ||||||||||||||||||||
|
|
|
|
|
|
|
|
|
|
|
|
|
|
|
|||||||||||||||
Loans by classification type and the related valuation allowance amounts at December 31, 2013, were as follows:
| Special | Impaired Loans | Specific Allowance for |
Allowance for Loans not |
|||||||||||||||||||||||||
| Pass | Mention | Substandard | Doubtful | Total | Impairment | Impaired | ||||||||||||||||||||||
| December 31, 2013 |
||||||||||||||||||||||||||||
| One-to-four family mortgages |
$ | 149,351 | 814 | 5,087 | — | 155,252 | 597 | 1,451 | ||||||||||||||||||||
| Home equity line of credit |
33,462 | — | 641 | — | 34,103 | — | 218 | |||||||||||||||||||||
| Junior lien |
3,126 | 43 | 79 | — | 3,248 | — | 39 | |||||||||||||||||||||
| Multi-family |
29,736 | — | — | — | 29,736 | — | 466 | |||||||||||||||||||||
| Construction |
10,443 | — | 175 | — | 10,618 | — | 88 | |||||||||||||||||||||
| Land |
19,899 | 52 | 14,730 | — | 34,681 | 771 | 534 | |||||||||||||||||||||
| Non-residential real estate |
143,044 | 515 | 14,133 | — | 157,692 | 465 | 2,254 | |||||||||||||||||||||
| Farmland |
46,042 | 480 | 5,346 | — | 51,868 | — | 510 | |||||||||||||||||||||
| Consumer loans |
10,727 | — | 440 | — | 11,167 | 96 | 445 | |||||||||||||||||||||
| Commercial loans |
61,502 | 526 | 2,013 | — | 64,041 | — | 748 | |||||||||||||||||||||
|
|
|
|
|
|
|
|
|
|
|
|
|
|
|
|||||||||||||||
| Total |
$ | 507,332 | 2,430 | 42,644 | — | 552,406 | 1,929 | 6,753 | ||||||||||||||||||||
|
|
|
|
|
|
|
|
|
|
|
|
|
|
|
|||||||||||||||
38
Table of Contents
HopFed Bancorp, Inc. and Subsidiaries
Notes to Consolidated Financial Statements, Continued
December 31, 2014, 2013 and 2012
(Table Amounts in Thousands)
| (3) | Loans Receivable, Net: (Continued) |
Impaired loans by classification type and the related valuation allowance amounts at December 31, 2014, were as follows:
| For the year ended | ||||||||||||||||||||
| At December 31, 2014 | December 31, 2014 | |||||||||||||||||||
| Recorded Investment |
Unpaid Principal Balance |
Related Allowance |
Average Recorded Investment |
Interest Income Recognized |
||||||||||||||||
| Impaired loans with no specific allowance |
||||||||||||||||||||
| One-to-four family mortgages |
$ | 3,501 | 3,501 | — | 2,972 | 176 | ||||||||||||||
| Home equity line of credit |
757 | 757 | — | 690 | 35 | |||||||||||||||
| Junior liens |
37 | 37 | — | 39 | 2 | |||||||||||||||
| Multi-family |
3,021 | 3,021 | — | 1,342 | 190 | |||||||||||||||
| Construction |
— | — | — | 29 | — | |||||||||||||||
| Land |
7,740 | 7,740 | — | 8,978 | 339 | |||||||||||||||
| Non-residential real estate |
12,057 | 12,057 | — | 8,672 | 669 | |||||||||||||||
| Farmland |
2,237 | 2,237 | 3,968 | 125 | ||||||||||||||||
| Consumer loans |
51 | 51 | — | 36 | 3 | |||||||||||||||
| Commercial loans |
2,583 | 2,583 | — | 2,246 | 154 | |||||||||||||||
|
|
|
|
|
|
|
|
|
|
|
|||||||||||
| Total |
31,984 | 31,984 | — | 28,972 | 1,693 | |||||||||||||||
|
|
|
|
|
|
|
|
|
|
|
|||||||||||
| Impaired loans with a specific allowance |
||||||||||||||||||||
| One-to-four family mortgages |
$ | 718 | 718 | 51 | 1,434 | 44 | ||||||||||||||
| Home equity line of credit |
— | — | — | — | — | |||||||||||||||
| Junior liens |
— | — | — | — | — | |||||||||||||||
| Multi-family |
— | — | — | — | — | |||||||||||||||
| Construction |
— | — | — | — | — | |||||||||||||||
| Land |
3,224 | 4,737 | 663 | 3,418 | 160 | |||||||||||||||
| Non-residential real estate |
1,193 | 1,258 | 738 | 3,617 | 69 | |||||||||||||||
| Farmland |
— | — | — | 619 | — | |||||||||||||||
| Consumer loans |
248 | 248 | 62 | 355 | — | |||||||||||||||
| Commercial loans |
— | — | — | 100 | — | |||||||||||||||
|
|
|
|
|
|
|
|
|
|
|
|||||||||||
| Total |
5,383 | 6,961 | 1,514 | 9,543 | 273 | |||||||||||||||
|
|
|
|
|
|
|
|
|
|
|
|||||||||||
| Total impaired loans |
$ | 37,367 | 38,945 | 1,514 | 38,515 | 1,966 | ||||||||||||||
|
|
|
|
|
|
|
|
|
|
|
|||||||||||
39
Table of Contents
HopFed Bancorp, Inc. and Subsidiaries
Notes to Consolidated Financial Statements, Continued
December 31, 2014, 2013 and 2012
(Table Amounts in Thousands)
| (3) | Loans Receivable, Net: (Continued) |
Impaired loans by classification type and the related valuation allowance amounts at December 31, 2013, were as follows:
| For the year ended | ||||||||||||||||||||
| At December 31, 2013 | December 31, 2013 | |||||||||||||||||||
| Recorded | Unpaid Principal |
Related | Average Recorded |
Interest Income |
||||||||||||||||
| Investment | Balance | Allowance | Investment | Recognized | ||||||||||||||||
| Impaired loans with no specific allowance |
||||||||||||||||||||
| One-to-four family mortgages |
$ | 3,216 | 3,216 | — | 2,361 | 8 | ||||||||||||||
| Home equity line of credit |
641 | 641 | — | 564 | 3 | |||||||||||||||
| Junior liens |
79 | 79 | — | 239 | 1 | |||||||||||||||
| Multi-family |
— | — | — | 990 | — | |||||||||||||||
| Construction |
175 | 175 | — | 1,072 | 5 | |||||||||||||||
| Land |
10,882 | 12,315 | — | 10,668 | 186 | |||||||||||||||
| Non-residential real estate |
10,775 | 10,775 | — | 6,196 | 263 | |||||||||||||||
| Farmland |
5,346 | 5,346 | 6,955 | 149 | ||||||||||||||||
| Consumer loans |
56 | 56 | — | 48 | — | |||||||||||||||
| Commercial loans |
2,013 | 2,013 | — | 2,391 | 95 | |||||||||||||||
|
|
|
|
|
|
|
|
|
|
|
|||||||||||
| Total |
33,183 | 34,616 | — | 31,484 | 710 | |||||||||||||||
|
|
|
|
|
|
|
|
|
|
|
|||||||||||
| Impaired loans with a specific allowance |
||||||||||||||||||||
| One-to-four family mortgages |
$ | 1,871 | 1,871 | 597 | 2,501 | 9 | ||||||||||||||
| Home equity line of credit |
— | — | — | 279 | — | |||||||||||||||
| Junior liens |
— | — | — | 113 | — | |||||||||||||||
| Multi-family |
— | — | — | — | — | |||||||||||||||
| Construction |
— | — | — | 1,385 | — | |||||||||||||||
| Land |
3,848 | 3,848 | 771 | 2,741 | 29 | |||||||||||||||
| Non-residential real estate |
3,358 | 4,222 | 465 | 2,243 | 111 | |||||||||||||||
| Farmland |
— | — | — | 1,601 | — | |||||||||||||||
| Consumer loans |
384 | 384 | 96 | 401 | — | |||||||||||||||
| Commercial loans |
— | — | — | 346 | — | |||||||||||||||
|
|
|
|
|
|
|
|
|
|
|
|||||||||||
| Total |
9,461 | 10,325 | 1,929 | 11,610 | 149 | |||||||||||||||
|
|
|
|
|
|
|
|
|
|
|
|||||||||||
| Total impaired loans |
$ | 42,644 | 44,941 | 1,929 | 43,094 | 859 | ||||||||||||||
|
|
|
|
|
|
|
|
|
|
|
|||||||||||
40
Table of Contents
HopFed Bancorp, Inc. and Subsidiaries
Notes to Consolidated Financial Statements, Continued
December 31, 2014, 2013 and 2012
(Table Amounts in Thousands)
| (3) | Loans Receivable, Net: (Continued) |
The following table presents the balance in the allowance for loan losses and the recorded investment in loans as of December 31, 2014, and December 31, 2013, by portfolio segment and based on the impairment method as of December 31, 2014, and December 31, 2013.
| Commercial | Land Development / Construction |
Commercial Real Estate |
Residential Real Estate |
Consumer | Total | |||||||||||||||||||
| December 31, 2014: |
||||||||||||||||||||||||
| Allowance for loan losses: |
||||||||||||||||||||||||
| Ending allowance balance attributable to loans: |
||||||||||||||||||||||||
| Individually evaluated for impairment |
$ | — | $ | 663 | $ | 738 | $ | 51 | $ | 62 | $ | 1,514 | ||||||||||||
| Collectively evaluated for impairment |
504 | 606 | 1,891 | 1,342 | 432 | 4,775 | ||||||||||||||||||
|
|
|
|
|
|
|
|
|
|
|
|
|
|||||||||||||
| Total ending allowance balance |
$ | 504 | $ | 1,269 | $ | 2,629 | $ | 1,393 | $ | 494 | $ | 6,289 | ||||||||||||
|
|
|
|
|
|
|
|
|
|
|
|
|
|||||||||||||
| Loans: |
||||||||||||||||||||||||
| Loans individually evaluated for impairment |
$ | 2,583 | $ | 10,964 | $ | 18,508 | $ | 5,013 | $ | 299 | $ | 37,367 | ||||||||||||
| Loans collectively evaluated for impairment |
71,571 | 39,931 | 200,953 | 181,878 | 14,139 | 508,472 | ||||||||||||||||||
|
|
|
|
|
|
|
|
|
|
|
|
|
|||||||||||||
| Total ending loans balance |
$ | 74,154 | $ | 50,895 | $ | 219,461 | $ | 186,891 | $ | 14,438 | $ | 545,839 | ||||||||||||
|
|
|
|
|
|
|
|
|
|
|
|
|
|||||||||||||
| Commercial | Land Development / Construction |
Commercial Real Estate |
Residential Real Estate |
Consumer | Total | |||||||||||||||||||
| December 31, 2013: |
||||||||||||||||||||||||
| Allowance for loan losses: |
||||||||||||||||||||||||
| Ending allowance balance attributable to loans: |
||||||||||||||||||||||||
| Individually evaluated for impairment |
$ | — | $ | 771 | $ | 465 | $ | 597 | $ | 96 | $ | 1,929 | ||||||||||||
| Collectively evaluated for impairment |
748 | 622 | 3,230 | 1,708 | 445 | 6,753 | ||||||||||||||||||
|
|
|
|
|
|
|
|
|
|
|
|
|
|||||||||||||
| Total ending allowance balance |
$ | 748 | $ | 1,393 | $ | 3,695 | $ | 2,305 | $ | 541 | $ | 8,682 | ||||||||||||
|
|
|
|
|
|
|
|
|
|
|
|
|
|||||||||||||
| Loans: |
||||||||||||||||||||||||
| Loans individually evaluated for impairment |
$ | 2,013 | $ | 14,905 | $ | 19,479 | $ | 5,807 | $ | 440 | $ | 42,644 | ||||||||||||
| Loans collectively evaluated for impairment |
62,028 | 30,394 | 219,817 | 186,796 | 10,727 | 509,762 | ||||||||||||||||||
|
|
|
|
|
|
|
|
|
|
|
|
|
|||||||||||||
| Total ending loans balance |
$ | 64,041 | $ | 45,299 | $ | 239,296 | $ | 192,603 | $ | 11,167 | $ | 552,406 | ||||||||||||
|
|
|
|
|
|
|
|
|
|
|
|
|
|||||||||||||
41
Table of Contents
HopFed Bancorp, Inc. and Subsidiaries
Notes to Consolidated Financial Statements, Continued
December 31, 2014, 2013 and 2012
(Table Amounts in Thousands)
| (3) | Loans Receivable, Net: (Continued) |
The average recorded investment in impaired loans for the years ended December 31, 2014, 2013 and 2012 was $38.5 million, $43.1 million and $79.3 million, respectively. Interest income recognized on impaired loans for the years ended December 31, 2014 and December 31, 2013 and December 31, 2012, was $2.0 million, $859,000 and $2.8 million, respectively. The following table provides a detail of the Company’s activity in the allowance for loan loss account allocated by loan type for the year ended December 31, 2014:
| Year ended December 31, 2014 |
Balance 12/31/2013 |
Charge off 2014 |
Recovery 2014 |
General Provision 2014 |
Specific Provision 2014 |
Ending Balance 12/31/2014 |
||||||||||||||||||
| One-to-four family mortgages |
2,048 | (233 | ) | 24 | (304 | ) | (337 | ) | 1,198 | |||||||||||||||
| Home equity line of credit |
218 | (83 | ) | 3 | (37 | ) | 80 | 181 | ||||||||||||||||
| Junior liens |
39 | — | 9 | (25 | ) | (9 | ) | 14 | ||||||||||||||||
| Multi-family |
466 | — | — | (381 | ) | — | 85 | |||||||||||||||||
| Construction |
88 | (139 | ) | 9 | 58 | 130 | 146 | |||||||||||||||||
| Land |
1,305 | — | — | (74 | ) | (108 | ) | 1,123 | ||||||||||||||||
| Non-residential real estate |
2,719 | (66 | ) | 864 | (1,368 | ) | (66 | ) | 2,083 | |||||||||||||||
| Farmland |
510 | — | — | 542 | (591 | ) | 461 | |||||||||||||||||
| Consumer loans |
541 | (415 | ) | 109 | (13 | ) | 272 | 494 | ||||||||||||||||
| Commercial loans |
748 | (296 | ) | 94 | (244 | ) | 202 | 504 | ||||||||||||||||
|
|
|
|
|
|
|
|
|
|
|
|
|
|||||||||||||
| 8,682 | (1,232 | ) | 1,112 | (1,846 | ) | (427 | ) | 6,289 | ||||||||||||||||
|
|
|
|
|
|
|
|
|
|
|
|
|
|||||||||||||
The following table provides a detail of the Company’s activity in the allowance for loan loss account allocated by loan type for the year ended December 30, 2013:
| Year ended December 31, 2013 |
Balance 12/31/2012 |
Charge off 2013 |
Recovery 2013 |
General Provision 2013 |
Specific Provision 2013 |
Ending Balance 12/31/2013 |
||||||||||||||||||
| One-to-four family mortgages |
$ | 2,490 | (852 | ) | 329 | (285 | ) | 366 | 2,048 | |||||||||||||||
| Home equity line of credit |
374 | (22 | ) | 9 | (88 | ) | (55 | ) | 218 | |||||||||||||||
| Junior liens |
230 | (119 | ) | 71 | 5 | (148 | ) | 39 | ||||||||||||||||
| Multi-family |
524 | (38 | ) | 164 | (20 | ) | (164 | ) | 466 | |||||||||||||||
| Construction |
256 | — | — | (168 | ) | — | 88 | |||||||||||||||||
| Land |
2,184 | (1,432 | ) | 9 | (718 | ) | 1,262 | 1,305 | ||||||||||||||||
| Non-residential real estate |
2,921 | (1,041 | ) | 14 | 757 | 68 | 2,719 | |||||||||||||||||
| Farmland |
712 | — | — | (202 | ) | — | 510 | |||||||||||||||||
| Consumer loans |
338 | (649 | ) | 246 | 228 | 378 | 541 | |||||||||||||||||
| Commercial loans |
619 | (291 | ) | 32 | 437 | (49 | ) | 748 | ||||||||||||||||
|
|
|
|
|
|
|
|
|
|
|
|
|
|||||||||||||
| $ | 10,648 | (4,444 | ) | 874 | (54 | ) | 1,658 | 8,682 | ||||||||||||||||
|
|
|
|
|
|
|
|
|
|
|
|
|
|||||||||||||
42
Table of Contents
HopFed Bancorp, Inc. and Subsidiaries
Notes to Consolidated Financial Statements, Continued
December 31, 2014, 2013 and 2012
(Table Amounts in Thousands)
| (3) | Loans Receivable, Net: (Continued) |
Non-accrual loans totaled $3.2 million and $10.1 million at December 31, 2014, and December 31, 2013, respectively. All non-accrual loans noted below are classified as either substandard or doubtful. Interest income foregone on such loans totaled $76,000 at December 31, 2014, $432,000 at December 31, 2013, and $271,000 at December 31, 2012, respectively. The Company is not committed to lend additional funds to borrowers whose loans have been placed on a non-accrual basis. There were no loans past due more than three months and still accruing interest as of December 31, 2014, and December 31, 2013. For the years ended December 31, 2014, and December 31, 2013, the components of the Company’s balances of non-accrual loans are as follows:
| 12/31/2014 | 12/31/2013 | |||||||
| One-to-four family first mortgages |
$ | 1,501 | 945 | |||||
| Home equity lines of credit |
— | 1 | ||||||
| Junior liens |
— | 2 | ||||||
| Multi-family |
95 | — | ||||||
| Construction |
— | 175 | ||||||
| Land |
215 | 1,218 | ||||||
| Non-residential real estate |
1,159 | 6,546 | ||||||
| Farmland |
115 | 703 | ||||||
| Consumer loans |
— | 13 | ||||||
| Commercial loans |
90 | 463 | ||||||
|
|
|
|
|
|||||
| Total non-accrual loans |
$ | 3,175 | 10,066 | |||||
|
|
|
|
|
|||||
43
Table of Contents
HopFed Bancorp, Inc. and Subsidiaries
Notes to Consolidated Financial Statements, Continued
December 31, 2014, 2013 and 2012
(Table Amounts in Thousands)
| (3) | Loans Receivable, Net: (Continued) |
The table below presents loan balances at December 31, 2014, by loan classification allocated between past due, classified, performing and non-performing:
| Currently | 30 - 89 Days |
Non-accrual | Special | Impaired Loans Currently Performing |
||||||||||||||||||||||||
| Performing | Past Due | Loans | Mention | Substandard | Doubtful | Total | ||||||||||||||||||||||
| One-to-four family mortgages |
$ | 145,372 | 757 | 1,501 | 203 | 2,718 | — | 150,551 | ||||||||||||||||||||
| Home equity line of credit |
33,338 | 143 | — | — | 757 | — | 34,238 | |||||||||||||||||||||
| Junior liens |
2,025 | — | — | 40 | 37 | — | 2,102 | |||||||||||||||||||||
| Multi-family |
20,066 | — | 95 | 2,904 | 2,926 | — | 25,991 | |||||||||||||||||||||
| Construction |
24,241 | — | — | — | — | — | 24,241 | |||||||||||||||||||||
| Land |
14,674 | 654 | 215 | 362 | 10,749 | — | 26,654 | |||||||||||||||||||||
| Non-residential real estate |
131,854 | — | 1,159 | 5,492 | 12,091 | — | 150,596 | |||||||||||||||||||||
| Farmland |
40,057 | 64 | 115 | 516 | 2,122 | — | 42,874 | |||||||||||||||||||||
| Consumer loans |
14,104 | 14 | — | 21 | 299 | — | 14,438 | |||||||||||||||||||||
| Commercial loans |
71,191 | 55 | 90 | 325 | 2,493 | — | 74,154 | |||||||||||||||||||||
|
|
|
|
|
|
|
|
|
|
|
|
|
|
|
|||||||||||||||
| Total |
$ | 496,922 | 1,687 | 3,175 | 9,863 | 34,192 | — | 545,839 | ||||||||||||||||||||
|
|
|
|
|
|
|
|
|
|
|
|
|
|
|
|||||||||||||||
The table below presents loan balances at December 31, 2013, by loan classification allocated between performing and non-performing:
| Currently | 30—89 Days |
Non-accrual | Special | Impaired Loans Currently Performing |
||||||||||||||||||||||||
| Performing | Past Due | Loans | Mention | Substandard | Doubtful | Total | ||||||||||||||||||||||
| One-to-four family mortgages |
$ | 148,759 | 592 | 945 | 814 | 4,142 | — | 155,252 | ||||||||||||||||||||
| Home equity line of credit |
33,369 | 93 | 1 | — | 640 | — | 34,103 | |||||||||||||||||||||
| Junior liens |
3,126 | — | 2 | 43 | 77 | — | 3,248 | |||||||||||||||||||||
| Multi-family |
29,736 | — | — | — | — | — | 29,736 | |||||||||||||||||||||
| Construction |
10,443 | — | 175 | — | — | — | 10,618 | |||||||||||||||||||||
| Land |
19,899 | — | 1,218 | 52 | 13,512 | — | 34,681 | |||||||||||||||||||||
| Non-residential real estate |
142,701 | 343 | 6,546 | 515 | 7,587 | — | 157,692 | |||||||||||||||||||||
| Farmland |
46,042 | — | 703 | 480 | 4,643 | — | 51,868 | |||||||||||||||||||||
| Consumer loans |
10,493 | 234 | 13 | — | 427 | — | 11,167 | |||||||||||||||||||||
| Commercial loans |
61,379 | 123 | 463 | 526 | 1,550 | — | 64,041 | |||||||||||||||||||||
|
|
|
|
|
|
|
|
|
|
|
|
|
|
|
|||||||||||||||
| Total |
$ | 505,947 | 1,385 | 10,066 | 2,430 | 32,578 | — | 552,406 | ||||||||||||||||||||
|
|
|
|
|
|
|
|
|
|
|
|
|
|
|
|||||||||||||||
44
Table of Contents
HopFed Bancorp, Inc. and Subsidiaries
Notes to Consolidated Financial Statements, Continued
December 31, 2014, 2013 and 2012
| (3) | Loans Receivable, Net: (Continued) |
All loans listed as 30-89 days past due and non-accrual are not performing as agreed. Loans listed as special mention, substandard and doubtful are paying as agreed. However, the customer’s financial statements may indicate weaknesses in their current cash flow, the customer’s industry may be in decline due to current economic conditions, collateral values used to secure the loan may be declining, or the Company may be concerned about the customer’s future business prospects.
Troubled Debt Restructuring
On a periodic basis, the Company may modify the terms of certain loans. In evaluating whether a restructuring constitutes a troubled debt restructuring (TDR), Financial Accounting Standards Board has issued Accounting Standards Update 310 (ASU 310); A Creditor’s Determination of Whether a Restructuring is a Troubled Debt Restructuring. In evaluating whether a restructuring constitutes a TDR, the Company must separately conclude that both of the following exist:
| a.) | The restructuring constitutes a concession |
| b.) | The debtor is experiencing financial difficulties |
ASU 310 provides the following guidance for the Company’s evaluation of whether it has granted a concession as follows:
If a debtor does not otherwise have access to funds at a market interest rate for debt with similar risk characteristics as the restructured debt, the restructured debt would be considered a below market rate, which may indicate that the Company may have granted a concession. In that circumstance, the Company should consider all aspects of the restructuring in determining whether it has granted a concession, the creditor must make a separate assessment about whether the debtor is experiencing financial difficulties to determine whether the restructuring constitutes a TDR.
A temporary or permanent increase in the interest rate on a loan as a result of a restructuring does not eliminate the possibility of the restructuring from being considered a concession if the new interest rate on the loan is below the market interest rate for loans of similar risk characteristics.
A restructuring that results in a delay in payment that is insignificant is not a concession. However, the Company must consider a variety of factors in assessing whether a restructuring resulting in a delay in payment is insignificant.
45
Table of Contents
HopFed Bancorp, Inc. and Subsidiaries
Notes to Consolidated Financial Statements, Continued
December 31, 2014, 2013 and 2012
(Table Amounts in Thousands)
| (3) | Loans Receivable, Net: (Continued) |
Troubled Debt Restructurings, (Continued)
At December 31, 2014, the Company had no loans classified as performing TDRs as compared to no loans at December 31, 2013. A summary of the activity in loans classified as TDRs for the twelve month period ended December 31, 2014, is as follows:
| Balance at 12/31/13 |
New TDR |
Loss or Foreclosure |
Transfer to Held for Sale |
Removed from (Taken to) Non-accrual |
Balance at 12/31/14 |
|||||||||||||||||||
| (Dollars in Thousands) | ||||||||||||||||||||||||
| One-to-four family mortgages |
$ | — | — | — | — | — | $ | — | ||||||||||||||||
| Home equity line of credit |
— | — | — | — | — | — | ||||||||||||||||||
| Junior Lien |
— | — | — | — | — | — | ||||||||||||||||||
| Multi-family |
— | — | — | — | — | — | ||||||||||||||||||
| Construction |
— | — | — | — | — | — | ||||||||||||||||||
| Land |
— | — | — | — | — | — | ||||||||||||||||||
| Non-residential real estate |
— | 10,271 | — | (6,987 | ) | — | 3,284 | |||||||||||||||||
| Farmland |
— | — | — | — | — | — | ||||||||||||||||||
| Consumer loans |
— | — | — | — | — | — | ||||||||||||||||||
| Commercial loans |
— | — | — | — | — | — | ||||||||||||||||||
|
|
|
|
|
|
|
|
|
|
|
|
|
|||||||||||||
| Total performing TDR |
$ | — | 10,271 | — | (6,987 | ) | — | $ | 3,284 | |||||||||||||||
|
|
|
|
|
|
|
|
|
|
|
|
|
|||||||||||||
46
Table of Contents
HopFed Bancorp, Inc. and Subsidiaries
Notes to Consolidated Financial Statements, Continued
December 31, 2014, 2013 and 2012
(Table Amounts in Thousands)
| (3) | Loans Receivable, Net: (Continued) |
Troubled Debt Restructurings, (Continued)
A summary of the activity in loans classified as TDRs for the year ended December 31, 2013, is as follows:
| Balance at 12/31/12 |
New TDR |
Loss or Foreclosure |
Removed due to Payment or Performance |
Removed from (Taken to) Non-accrual |
Balance at 12/31/13 |
|||||||||||||||||||
| (Dollars in Thousands) | ||||||||||||||||||||||||
| One-to-four family mortgages |
$ | 1,888 | 242 | — | (1,863 | ) | (267 | ) | — | |||||||||||||||
| Home equity line of credit |
— | — | — | — | — | — | ||||||||||||||||||
| Junior Lien |
96 | — | — | (10 | ) | (86 | ) | — | ||||||||||||||||
| Multi-family |
234 | — | — | (234 | ) | — | — | |||||||||||||||||
| Construction |
4,112 | — | — | — | (4,112 | ) | — | |||||||||||||||||
| Land |
656 | 2,649 | (393 | ) | (656 | ) | (2,256 | ) | — | |||||||||||||||
| Non-residential real estate |
3,173 | 266 | (864 | ) | — | (2,575 | ) | — | ||||||||||||||||
| Farmland |
865 | — | — | (865 | ) | — | — | |||||||||||||||||
| Consumer loans |
5 | — | — | (5 | ) | — | — | |||||||||||||||||
|
|
|
|||||||||||||||||||||||
| Commercial loans |
9 | 222 | — | (231 | ) | — | — | |||||||||||||||||
|
|
|
|
|
|
|
|
|
|
|
|
|
|||||||||||||
| Total performing TDR |
$ | 11,038 | 3,379 | (1,257 | ) | (3,864 | ) | (9,296 | ) | — | ||||||||||||||
|
|
|
|
|
|
|
|
|
|
|
|
|
|||||||||||||
47
Table of Contents
HopFed Bancorp, Inc. and Subsidiaries
Notes to Consolidated Financial Statements, Continued
December 31, 2014, 2013 and 2012
(Table Amounts in Thousands)
| (3) | Loans Receivable, Net: (Continued) |
The Company originates loans to officers and directors and their affiliates at terms substantially identical to those available to other borrowers. Loans to officers and directors at December 31, 2014 and December 31, 2013, were approximately $4.0 million and $4.8 million, respectively. At December 31, 2014, funds committed that were undisbursed to officers and directors approximated $447,000.
The following summarizes activity of loans to officers and directors and their affiliates for the years ended December 31, 2014, and December 31, 2013:
| 2014 | 2013 | |||||||
| Balance at beginning of period |
$ | 4,800 | 8,846 | |||||
| New loans |
669 | 410 | ||||||
| Principal repayments |
(1,447 | ) | (4,456 | ) | ||||
|
|
|
|
|
|||||
| Balance at end of period |
$ | 4,022 | 4,800 | |||||
|
|
|
|
|
|||||
| (4) | Premises and Equipment: |
Components of premises and equipment included in the consolidated balance sheets as of December 31, 2014 and December 31, 2013, consisted of the following:
| 2014 | 2013 | |||||||
| Land |
$ | 6,576 | 6,526 | |||||
| Land improvements |
611 | 575 | ||||||
| Buildings |
20,914 | 20,257 | ||||||
| Construction in process |
486 | 582 | ||||||
| Furniture and equipment |
6,213 | 6,696 | ||||||
|
|
|
|
|
|||||
| 34,800 | 34,636 | |||||||
| Less accumulated depreciation |
11,860 | 11,528 | ||||||
|
|
|
|
|
|||||
| Premises and equipment, net |
$ | 22,940 | 23,108 | |||||
|
|
|
|
|
|||||
Depreciation expense was approximately $1,336,000, $1,502,000 and $1,587,000 for the years ended December 31, 2014, 2013 and 2012, respectively.
48
Table of Contents
HopFed Bancorp, Inc. and Subsidiaries
Notes to Consolidated Financial Statements, Continued
December 31, 2014, 2013 and 2012
(Table Amounts in Thousands)
| (5) | Intangible Assets: |
The amount of other intangible assets and the changes in the carrying amounts of other intangible assets for the years ended December 31, 2014, 2013 and 2012:
| Core Deposits Intangible |
||||
| Balance, December 31, 2011 |
$ | 519 | ||
| Amortization |
(227 | ) | ||
|
|
|
|||
| Balance December 31, 2012 |
292 | |||
| Amortization |
(162 | ) | ||
|
|
|
|||
| Balance December 31, 2013 |
130 | |||
| Amortization |
(97 | ) | ||
|
|
|
|||
| Balance, December 31, 2014 |
$ | 33 | ||
|
|
|
|||
49
Table of Contents
HopFed Bancorp, Inc. and Subsidiaries
Notes to Consolidated Financial Statements, Continued
December 31, 2014, 2013 and 2012
(Table Amounts in Thousands)
| (6) | Deposits: |
At December 31, 2014, the scheduled maturities of other time deposits were as follows:
Years Ending December 31,
| 2015 |
$ | 139,708 | ||
| 2016 |
137,147 | |||
| 2017 |
32,175 | |||
| 2018 |
15,299 | |||
| 2019 |
7,576 | |||
| 2020 and thereafter |
10 | |||
|
|
|
|||
| $ | 331,915 | |||
|
|
|
The amount of other time deposits with a minimum denomination of $100,000 was approximately $169.3 million and $200.2 million at December 31, 2014, and December 31, 2013, respectively. At December 31, 2014, directors, members of senior management and their affiliates had deposits in the Bank of approximately $4.4 million.
Interest expense on deposits for the years ended December 31, 2014, December 31, 2013 and December 31, 2012 is summarized as follows:
| 2014 | 2013 | 2012 | ||||||||||
| Interest bearing checking accounts |
$ | 1,253 | $ | 1,243 | 1,180 | |||||||
| Money market accounts |
86 | 73 | 58 | |||||||||
| Savings |
109 | 79 | 71 | |||||||||
| Other time deposits |
4,155 | 5,719 | 9,262 | |||||||||
|
|
|
|
|
|
|
|||||||
| $ | 5,603 | $ | 7,114 | 10,571 | ||||||||
|
|
|
|
|
|
|
|||||||
The Bank maintains clearing arrangements for its demand, interest bearing checking accounts and money market accounts with BBVA Compass Bank. The Bank is required to maintain certain cash reserves in its account to cover average daily clearings. At December 31, 2014, average daily clearings were approximately $6.1 million.
At December 31, 2014, the Company had approximately $248,000 of deposit accounts in overdraft status and thus has been reclassified to loans on the accompanying consolidated balance sheet. At December 31, 2013, the Company had approximately $384,000 of deposit accounts in overdraft status and thus has been reclassified to loans on the accompanying consolidated balance sheet. At December 31, 2014, and December 31, 2013, the Company had deposits classified as brokered deposits totaling $37.1 million and $46.3 million, respectively.
50
Table of Contents
HopFed Bancorp, Inc. and Subsidiaries
Notes to Consolidated Financial Statements, Continued
December 31, 2014, 2013 and 2012
(Table Amounts in Thousands, Except Percentages)
| (7) | Advances from Federal Home Loan Bank: |
Federal Home Loan Bank advances are summarized as follows:
| December 31, | ||||||||||||||||
| 2014 | 2013 | |||||||||||||||
| Weighted | Weighted | |||||||||||||||
| Types of Advances |
Amount | Average Rate | Amount | Average Rate | ||||||||||||
| Fixed-rate |
$ | 34,000 | 0.88 | % | $ | 46,780 | 3.72 | % | ||||||||
Scheduled maturities of FHLB advances as of December 31, 2014 are as follows:
| Years Ending December 31, |
Fixed Rate |
Average Cost |
||||||
| 2015 |
$ | 30,000 | 0.29 | % | ||||
| 2016 |
4,000 | 5.34 | % | |||||
|
|
|
|
|
|||||
| Total |
$ | 34,000 | 0.88 | % | ||||
|
|
|
|
|
|||||
On December 30, 2014, the Company prepaid $35.9 million in FHLB advances, incurring a $2.5 million prepayment penalty. To fund this transaction, the Company borrowed $15.0 million from the FHLB with a maturity of one month and $15.0 million with a maturity of six months.
The Bank has an approved line of credit of $30 million at the FHLB of Cincinnati, which is secured by a blanket agreement to maintain residential first mortgage loans and non-residential real estate loans with a principal value of 125% of the outstanding advances and has a variable interest rate. At December 31, 2014, the Bank could borrow an additional $52.6 million from the FHLB of Cincinnati without pledging additional collateral. At December 31, 2014, the Bank has an additional $40.1 million in additional collateral that could be pledged to the FHLB to secure additional advance requirements. The Bank has an $8 million unsecured line of credit with BVA Compass Bank of Birmingham, Alabama. The Company’s overnight lines of credit with both the Federal Home Loan Bank of Cincinnati and Compass Bank had no balance at December 31, 2014.
51
Table of Contents
HopFed Bancorp, Inc. and Subsidiaries
Notes to Consolidated Financial Statements, Continued
December 31, 2014, 2013 and 2012
(Table Amounts in Thousands, Except Percentages)
| (8) | Repurchase Agreements: |
In 2006, the Company enhanced its cash management product line to include an automated sweep of excess funds from checking accounts to repurchase accounts, allowing interest to be paid on excess funds remaining in checking accounts of business and municipal customers. Repurchase balances are overnight borrowings from customers and are not FDIC insured. In addition, the Company has entered into two long term repurchase agreements with third parties.
At December 31, 2014, the Company provided investment securities with a market value and book value of $57.9 million as collateral for repurchase agreements. The maximum repurchase balances outstanding during the twelve month periods ending December 31, 2014, and December 31, 2013, was $57.9 million and $58.1 million, respectively.
At December 31, 2014, and December 31, 2013, the respective cost and maturities of the Company’s repurchase agreements are as follows:
| 2014 Third Party |
Balance | Average Rate | Maturity | Comments | ||||||||||
| Merrill Lynch |
$ | 6,000 | 4.36 | % | 9/18/2016 | Quarterly callable | ||||||||
| Various customers |
51,358 | 0.60 | % | Overnight | ||||||||||
|
|
|
|
|
|||||||||||
| Total |
$ | 57,358 | 1.42 | % | ||||||||||
|
|
|
|
|
|||||||||||
| 2013 Third Party |
Balance | Average Rate | Maturity | Comments | ||||||||||
| Deutsch Bank |
$ | 10,000 | 4.28 | % | 9/05/2014 | Quarterly callable | ||||||||
| Merrill Lynch |
6,000 | 4.36 | % | 9/18/2016 | Quarterly callable | |||||||||
| Various customers |
36,759 | 0.99 | % | Overnight | ||||||||||
|
|
|
|
|
|||||||||||
| Total |
$ | 52,759 | 2.29 | % | ||||||||||
|
|
|
|
|
|||||||||||
52
Table of Contents
HopFed Bancorp, Inc. and Subsidiaries
Notes to Consolidated Financial Statements, Continued
December 31, 2014, 2013 and 2012
| (9) | Fair Value Measurement: |
In September 2006, FASB issued ASC Topic 820, Fair Value Measurements and Disclosures. ASC 820 establishes a fair value hierarchy which requires an entity to maximize the use of observable input and minimize the use of unobservable inputs when measuring fair value. Although ASC 820 provides for fair value accounting, the Company did not elect the fair value option for any financial instrument not presently required to be accounted for at fair value.
HopFed Bancorp has developed a process for determining fair values. Fair value is based upon quoted market prices, where available. If listed prices or quotes are not available, fair value is based upon internally developed models or processes that use primarily market based or based on third party market data, including interest rate yield curves, option volatilities and other third party information. Valuation adjustments may be made to ensure that financial instruments are recorded at fair value. Furthermore, while the Company believes its valuation methods are appropriate and consistent with other market participants, the use of different methodologies, or assumptions, to determine the fair value of certain financials instruments could result in a different estimate of fair value at the reporting date.
ASC 820 establishes a three-level valuation hierarchy for disclosure of fair value measurement. The valuation hierarchy is based upon the transparency of inputs to the valuation of an asset or liability as of the measurement date.
| • | Level 1 is for assets and liabilities that management has obtained quoted prices (unadjusted for transaction cost) or identical assets or liabilities in active markets that the Company has the ability to access as of the measurement date. |
| • | Level 2 is for assets and liabilities in which significant unobservable inputs other than Level 1 prices such as quoted prices for similar assets and liabilities; quoted prices in markets that are not active; or other inputs that are observable or can be corroborated by observable market data. |
| • | Level 3 is for assets and liabilities in which significant unobservable inputs that reflect a reporting entity’s own assumptions about the assumptions that market participants would use in pricing an asset or liability. |
The fair value of securities available for sale are determined by a matrix pricing, which is a mathematical technique what is widely used in the industry to value debt securities without relying exclusively on quoted prices for the individual securities in the Company’s portfolio but relying on the securities relationship to other benchmark quoted securities. Impaired loans are valued at the net present value of expected payments and considering the fair value of any assigned collateral.
53
Table of Contents
HopFed Bancorp, Inc. and Subsidiaries
Notes to Consolidated Financial Statements, Continued
December 31, 2014, 2013 and 2012
(Table Amounts in Thousands)
| (9) | Fair Value Measurement: (Continued) |
The Company has certain liabilities carried at fair value including interest rate swap agreements. The fair value of these liabilities is based on information obtained from a third party bank and is reflected within level 2 of the valuation hierarchy.
Assets and Liabilities Measured on a Recurring Basis
The assets and liabilities measured at fair value on a recurring basis are summarized below:
| December 31, 2014 |
Total carrying value in the consolidated |
Quoted Prices In Active Markets for |
Significant Other Observable |
Significant Unobservable |
||||||||||||
| Description |
balance sheet at December 31, 2014 |
Identical Assets (Level 1) |
Inputs (Level 2) |
Inputs (Level 3) |
||||||||||||
| Assets |
||||||||||||||||
| Available for sale securities |
$ | 303,628 | — | 302,139 | 1,489 | |||||||||||
| Liabilities |
||||||||||||||||
| Interest rate swap |
$ | 390 | — | 390 | — | |||||||||||
| December 31, 2013 |
Total carrying value in the consolidated |
Quoted Prices In Active Markets for |
Significant Other Observable |
Significant Unobservable |
||||||||||||
| Description |
balance sheet at December 31, 2013 |
Identical Assets (Level 1) |
Inputs (Level 2) |
Inputs (Level 3) |
||||||||||||
| Assets |
||||||||||||||||
| Available for sale securities |
$ | 318,910 | — | 317,421 | 1,489 | |||||||||||
| Liabilities |
||||||||||||||||
| Interest rate swap |
$ | 750 | — | 750 | — | |||||||||||
54
Table of Contents
HopFed Bancorp, Inc. and Subsidiaries
Notes to Consolidated Financial Statements, Continued
December 31, 2014, 2013 and 2012
(Table Amounts in Thousands)
| (9) | Fair Value Measurement: (Continued) |
The assets and liabilities measured at fair value on a non-recurring basis are summarized below:
| December 31, 2014 |
Total carrying value in the |
Quoted Prices In Active |
Significant Other |
Significant | ||||||||||||
| Description |
consolidated balance sheet at 12/31/2014 |
Markets for Identical Assets (Level 1) |
Observable Inputs (Level 2) |
Unobservable Inputs (Level 3) |
||||||||||||
| Assets |
||||||||||||||||
| Other real estate owned |
$ | 1,927 | — | — | 1,927 | |||||||||||
| Impaired loans, net of allowance of $1,514 |
$ | 35,853 | — | — | 35,853 | |||||||||||
| December 31, 2013 |
Total carrying value in the |
Quoted Prices In Active |
Significant Other |
Significant | ||||||||||||
| Description |
consolidated balance sheet at 12/31/2013 |
Markets for Identical Assets (Level 1) |
Observable Inputs (Level 2) |
Unobservable Inputs (Level 3) |
||||||||||||
| Assets |
||||||||||||||||
| Other real estate owned |
$ | 1,674 | — | — | 1,674 | |||||||||||
| Impaired loans, net of allowance of $1,929 |
$ | 40,715 | — | — | 40,715 | |||||||||||
55
Table of Contents
HopFed Bancorp, Inc. and Subsidiaries
Notes to Consolidated Financial Statements, Continued
December 31, 2014, 2013 and 2012
(Table Amounts in Thousands)
| (9) | Fair Value Measurement: (Continued) |
Change in level 3 fair value measurements:
The table below includes a roll-forward of the balance sheet items for the years ended December 31, 2014 and 2013, (including the change in fair value) for assets and liabilities classified by HopFed Bancorp, Inc. within level 3 of the valuation hierarchy for assets and liabilities measured at fair value on a recurring basis. When a determination is made to classify a financial instrument within level 3 of the valuation hierarchy, the determination is based upon the significance of the unobservable factors to the overall fair value measurement. However, since level 3 financial instruments typically include, in addition to the unobservable or level 3 components, observable components (that is components that are actively quoted and can be validated to external sources), the gains and losses in the table below include changes in fair value due in part to observable factors that are part of the valuation methodology.
| Year ended December 31, | ||||||||||||||||
| 2014 | 2013 | |||||||||||||||
| Other | Other | Other | Other | |||||||||||||
| Assets | Liabilities | Assets | Liabilities | |||||||||||||
| Fair value, December 31, |
$ | 1,489 | — | $ | 1,489 | — | ||||||||||
| Change in unrealized gains (losses) included in other comprehensive income for assets and liabilities still held at December 31, |
— | — | — | — | ||||||||||||
| Other than temporary impairment charge |
— | — | — | — | ||||||||||||
| Purchases, issuances and settlements, net |
— | — | — | — | ||||||||||||
| Transfers in and/or out of Level 3 |
— | — | — | — | ||||||||||||
|
|
|
|
|
|
|
|
|
|||||||||
| Fair value, December 31, |
$ | 1,489 | — | $ | 1,489 | — | ||||||||||
|
|
|
|
|
|
|
|
|
|||||||||
56
Table of Contents
HopFed Bancorp, Inc. and Subsidiaries
Notes to Consolidated Financial Statements, Continued
December 31, 2014, 2013 and 2012
(Table Amounts in Thousands)
| (9) | Fair Value Measurement: (Continued) |
The estimated fair values of financial instruments were as follows at December 31, 2014:
| Carrying Amount |
Estimated Fair Value |
Quoted Prices In Active Markets for Identical Assets Level 1 |
Using Significant Other Observable Inputs Level 2 |
Significant Unobservable Inputs Level 3 |
||||||||||||||||
| Financial Assets: |
||||||||||||||||||||
| Cash and due from banks |
$ | 34,389 | 34,389 | $ | 34,389 | — | — | |||||||||||||
| Interest-earning deposits |
6,050 | 6,050 | 6,050 | — | — | |||||||||||||||
| Securities available for sale |
303,628 | 303,628 | — | 302,139 | 1,489 | |||||||||||||||
| Federal Home Loan Bank stock |
4,428 | 4,428 | — | 4,428 | — | |||||||||||||||
| Loans held for sale |
1,444 | 1,444 | — | 1,444 | — | |||||||||||||||
| Loans receivable |
539,264 | 537,493 | — | — | 537,493 | |||||||||||||||
| Accrued interest receivable |
4,576 | 4,576 | — | 4,576 | — | |||||||||||||||
| Financial liabilities: |
||||||||||||||||||||
| Deposits |
731,308 | 714,750 | — | 714,750 | — | |||||||||||||||
| Advances from borrowers for taxes and insurance |
513 | 513 | — | 513 | — | |||||||||||||||
| Advances from Federal Home Loan Bank |
34,000 | 34,217 | — | 34,217 | — | |||||||||||||||
| Repurchase agreements |
57,358 | 57,688 | — | 57,688 | — | |||||||||||||||
| Subordinated debentures |
10,310 | 10,099 | — | — | 10,099 | |||||||||||||||
| Off-balance-sheet liabilities: |
||||||||||||||||||||
| Commitments to extend credit |
— | — | — | — | — | |||||||||||||||
| Commercial letters of credit |
— | — | — | — | — | |||||||||||||||
| Market value of interest rate swap |
390 | 390 | — | 390 | — | |||||||||||||||
57
Table of Contents
HopFed Bancorp, Inc. and Subsidiaries
Notes to Consolidated Financial Statements, Continued
December 31, 2014, 2013 and 2012
(Table Amounts in Thousands)
| (9) | Fair Value Measurement: (Continued) |
The estimated fair values of financial instruments were as follows at December 31, 2013:
| Carrying Amount |
Estimated Fair Value |
Quoted Prices In Active Markets for Identical Assets Level 1 |
Using Significant Other Observable Inputs Level 2 |
Significant Unobservable Inputs Level 3 |
||||||||||||||||
| Financial Assets: |
||||||||||||||||||||
| Cash and due from banks |
$ | 37,229 | 37,229 | 37,229 | — | — | ||||||||||||||
| Interest-earning deposits |
18,619 | 18,619 | 18,619 | — | — | |||||||||||||||
| Securities available for sale |
318,910 | 318,910 | — | 317,421 | 1,489 | |||||||||||||||
| Federal Home Loan Bank stock |
4,428 | 4,428 | — | 4,428 | — | |||||||||||||||
| Loans receivable |
543,632 | 546,319 | — | — | 546,319 | |||||||||||||||
| Accrued interest receivable |
5,233 | 5,233 | — | 5,233 | — | |||||||||||||||
| Financial liabilities: |
||||||||||||||||||||
| Deposits |
762,997 | 763,605 | — | 763,605 | — | |||||||||||||||
| Advances from borrowers for taxes and insurance |
521 | 521 | — | 521 | — | |||||||||||||||
| Advances from Federal Home Loan Bank |
46,780 | 51,010 | — | 51,010 | — | |||||||||||||||
| Repurchase agreements |
52,759 | 53,712 | — | 53,712 | — | |||||||||||||||
| Subordinated debentures |
10,310 | 10,099 | — | — | 10,099 | |||||||||||||||
| Off-balance-sheet liabilities: |
||||||||||||||||||||
| Commitments to extend credit |
— | — | — | — | — | |||||||||||||||
| Commercial letters of credit |
— | — | — | — | — | |||||||||||||||
| Market value of interest rate swap |
750 | 750 | — | 750 | — | |||||||||||||||
58
Table of Contents
HopFed Bancorp, Inc. and Subsidiaries
Notes to Consolidated Financial Statements, Continued
December 31, 2014, 2013 and 2012
(Table Amounts in Thousands)
| (9) | Fair Value Measurement: (Continued) |
Non-Financial Assets and Non-Financial Liabilities:
The Company has no non-financial assets or non-financial liabilities measured at fair value on a recurring basis. Certain non-financial assets measured at fair value on a non-recurring basis include foreclosed assets (upon initial recognition or subsequent impairment), non-financial assets and intangible assets and other non-financial long-lived assets measured at fair value for impairment assessment. Non-financial assets measured at fair value on a non-recurring basis during the reported periods include certain foreclosed assets which, upon initial recognition, were re-measured and reported at fair value through a charge-off to the allowance for loan losses and certain foreclosed assets which, subsequent to their initial recognition, were re-measured at fair value through a write-down included in other non-interest expense. The fair value of a foreclosed asset is estimated using Level 2 inputs based on observable market data or Level 3 inputs based on customized discounting criteria.
The following table presents foreclosed assets that were re-measured and reported at fair value:
| Years Ended December 31, | ||||||||||||
| 2014 | 2013 | 2012 | ||||||||||
| Beginning balance |
$ | 1,674 | 1,548 | 2,267 | ||||||||
| Foreclosed assets measured at initial recognition: |
||||||||||||
| Carrying value of foreclosed assets prior to acquisition |
1,816 | 1,535 | 2,634 | |||||||||
| Proceeds from sale of foreclosed assets |
(1,118 | ) | (908 | ) | (2,738 | ) | ||||||
| Charge-offs recognized in the allowance for loan loss |
(237 | ) | (361 | ) | (349 | ) | ||||||
| Gains (losses) on REO included in non-interest expense |
(208 | ) | (140 | ) | (266 | ) | ||||||
|
|
|
|
|
|
|
|||||||
| Fair value |
$ | 1,927 | 1,674 | 1,548 | ||||||||
|
|
|
|
|
|
|
|||||||
59
Table of Contents
HopFed Bancorp, Inc. and Subsidiaries
Notes to Consolidated Financial Statements, Continued
December 31, 2014, 2013 and 2012
| (10) | Subordinated Debentures: |
On September 25, 2003, the Company formed HopFed Capital Trust I (the Trust). The Trust is a statutory trust formed under the laws of the state of Delaware. In September 2003, the Trust issued variable rate capital securities with an aggregate liquidation amount of $10,000,000 ($1,000 per preferred security) to a third-party investor. The Company then issued floating rate junior subordinated debentures aggregating $10,310,000 to the Trust. The junior subordinated debentures are the sole assets of the Trust. The junior subordinated debentures and the capital securities pay interest and dividends, respectively, on a quarterly basis. The variable interest rate is the three-month LIBOR plus 3.10% adjusted quarterly, The most recent adjustment was effective January 8, 2015, which adjusted the total coupon rate to 3.35%. These junior subordinated debentures mature in 2033, at which time the capital securities must be redeemed. The junior subordinated debentures and capital securities became redeemable contemporaneously, in whole or in part, beginning October 8, 2008 at a redemption price of $1,000 per capital security.
The Company has provided a full-irrevocable and unconditional guarantee on a subordinated basis of the obligations of the Trust under the capital securities in the event of the occurrence of an event of default, as defined in such guarantee.
| (11) | Concentrations of Credit Risk: |
Most of the Bank’s business activity is with customers located within the western part of the Commonwealth of Kentucky and middle and western Tennessee. One-to-four family residential and non residential real estate collateralize the majority of the loans. The Bank requires collateral for the majority of loans.
The distribution of commitments to extend credit approximates the distribution of loans outstanding. The contractual amounts of credit-related financial instruments such as commitments to extend credit and commercial letters of credit represent the amounts of potential accounting loss should the contract be fully drawn upon, the customer default, and the value of any existing collateral become worthless. In October of 2008, the FDIC increased its deposit coverage on all accounts to $250,000. In addition, financial institutions could choose to pay a higher premium to have all non-interest demand deposit balances insured. Compass Bank of Birmingham, Alabama, the Heritage Bank correspondent banker, elected to accept this additional coverage. Therefore, uninsured deposits are limited to those balances transferred to an overnight federal funds account. During 2013 and 2012, Heritage Bank chose not to transfer balances to an overnight federal funds account. Unlimited FDIC insurance on non-interest bearing deposits ended December 31, 2012.
At December 31, 2014, all cash and cash equivalents are deposited with Compass BBVA Bank, the Federal Reserve Bank or the Federal Home Loan Bank of Cincinnati (FHLB). Deposits at Compass BBVA Bank are insured to $250,000. All deposits at the FHLB are liabilities of the individual bank and were not federally insured. The FHLB is a government sponsored enterprise (GSE) and has the second highest rating available by all rating agencies. At December 31, 2014, total FHLB deposits were approximately $1.0 million and total deposits at the Federal Reserve were $5.8 million, none of which is insured by the FDIC.
60
Table of Contents
HopFed Bancorp, Inc. and Subsidiaries
Notes to Consolidated Financial Statements, Continued
December 31, 2014, 2013 and 2012
| (12) | Employee Benefit Plans: |
Stock Option Plan
The total amount of options outstanding and the exercise price of options were adjusted to reflect a 2% stock dividend paid to stockholders’ of record on September 30, 2010, and October 3, 2011.
On February 24, 1999, the Board of Directors of the Company adopted the HopFed Bancorp, Inc. 1999 Stock Option Plan (Option Plan), which was subsequently approved at the 1999 Annual Meeting of Stockholders. Under the Option Plan, the Option Committee has discretionary authority to grant stock options and stock appreciation rights to such employees, directors and advisory directors, as the committee shall designate. The Option Plan reserved 403,360 shares of common stock for issuance upon the exercise of options or stock appreciation rights. At December 31, 2012, the Company can no longer issue options under this plan. The remaining 20,808 options are fully vested and outstanding until their maturity date.
On May 31, 2000, the Board of Directors of the Company adopted the HopFed Bancorp, Inc. 2000 Stock Option Plan (the “2000 Option Plan”). Under the 2000 Option Plan, the option committee has discretionary authority to grant stock options to such employees as the committee shall designate. The 2000 Option Plan reserves 40,000 shares of common stock for issuance upon the exercise of options. The Company will receive the exercise price for shares of common stock issued to 2000 Option Plan participants upon the exercise of their option. The Board of Directors has granted options to purchase 40,000 shares of common stock under the 2000 Option Plan at an exercise price of $10.00 per share, which was the fair market value on the date of the grant. At December 31, 2014, all options having been granted under the 2000 Option Plan have been exercised and expired.
61
Table of Contents
HopFed Bancorp, Inc. and Subsidiaries
Notes to Consolidated Financial Statements, Continued
December 31, 2014, 2013 and 2012
| (12) | Employee Benefit Plans: (Continued) |
Stock Option Plan, (Continued)
| Number of Shares |
Weighted Average Exercise Price |
|||||||
| Options outstanding, December 2011 |
31,212 | 15.06 | ||||||
| Granted |
— | — | ||||||
| Exercised |
— | — | ||||||
| Forfeited |
(10,404 | ) | 11.85 | |||||
|
|
|
|
|
|||||
| Options outstanding, December 2012 |
20,808 | 16.67 | ||||||
| Granted |
— | — | ||||||
| Exercised |
— | — | ||||||
| Forfeited |
— | — | ||||||
|
|
|
|
|
|||||
| Options outstanding, December 2013 |
20,808 | 16.67 | ||||||
| Granted |
— | — | ||||||
| Exercised |
— | — | ||||||
| Forfeited |
(20,808 | ) | 16.67 | |||||
|
|
|
|
|
|||||
| Options outstanding, December 2014 |
— | — | ||||||
|
|
|
|
|
|||||
At December 31, 2014, there are no stock options outstanding.
62
Table of Contents
HopFed Bancorp, Inc. and Subsidiaries
Notes to Consolidated Financial Statements, Continued
December 31, 2014, 2013 and 2012
(Table Amounts in Thousands)
| (12) | Employee Benefit Plans: (Continued) |
HopFed Bancorp Long Term Incentive Plans
On February 18, 2004, the Board of Directors of the Company adopted the HopFed Bancorp, Inc. 2004 Long Term Incentive Plan (the Plan), which was subsequently approved at the 2004 Annual Meeting of Stockholders. Under the Plan, the Compensation Committee has discretionary authority to grant up to 200,000 shares in the form of restricted stock grants, options, and stock appreciation rights to such employees, directors and advisory directors as the committee shall designate. The grants vest in equal installments over a four-year period. Grants may vest immediately upon specific events, including a change of control of the Company, death or disability of award recipient, and termination of employment of the recipient by the Company without cause.
On March 20, 2013, the Board of Directors of the Company adopted the HopFed Bancorp, Inc. 2013 Long Term Incentive Plan (the Plan), which was subsequently approved at the 2013 Annual Meeting of Stockholders. Under the Plan, the Compensation Committee has discretionary authority to grant up to 300,000 shares in the form of restricted stock grants and options to such employees, directors and advisory directors as the committee shall designate. The grants vest in equal installments over a three or four year period. Grants may vest immediately upon specific events, including a change of control of the Company, death or disability of award recipient, and termination of employment of the recipient by the Company without cause. The 2004 Plan has now expired and no other shares may be issued under the 2004 Plan.
Awards are recognized as an expense to the Company in accordance with the vesting schedule. Awards in which the vesting is accelerated must be recognized as an expense immediately. Awards are valued at the closing stock price on the day the award is granted. For the year ended December 31, 2014, the Compensation Committee granted 22,378 shares of restricted stock with a market value of $260,000. For the year ended December 31, 2013, the Compensation Committee granted 21,559 shares of restricted stock with a market value of $232,000. For the year ended December 31, 2012, the Compensation Committee granted 10,392 shares of restricted stock with a market value of $73,800. The Company recognized $164,000, $115,000, and $99,000 in compensation expense in 2014, 2013 and 2012, respectively.
The remaining compensation expense to be recognized at December 31, 2014 is as follows:
| Year Ending December 31, |
Approximate Future Compensation Expense |
|||
| 2015 |
$ | 186 | ||
| 2016 |
133 | |||
| 2017 |
46 | |||
| 2018 |
3 | |||
|
|
|
|||
| Total | $ | 368 | ||
|
|
|
|||
63
Table of Contents
HopFed Bancorp, Inc. and Subsidiaries
Notes to Consolidated Financial Statements, Continued
December 31, 2014, 2013 and 2012
(Table Amounts in Thousands)
| (12) | Employee Benefit Plans: (Continued) |
HopFed Bancorp Long Term Incentive Plans
The Compensation Committee may make additional awards of restricted stock, thereby increasing the future expense related to this plan. The early vesting of restricted stock awards due to factors outlined in the award agreement may accelerate future compensation expenses related to the plan. However, the total amount of future compensation expense would not change as a result of an accelerated vesting of shares. At December 31, 2014, the Company has 256,290 restricted shares available from the HopFed Bancorp, Inc. 2013 Long Term Incentive Plan that may be awarded.
401(K) Plan
The Company has a 401(k) retirement program that is available to all employees who meet minimum eligibility requirements. Participants may generally contribute up to 15% of earnings, and in addition, management will match employee contributions up to 4%. In addition, the Company has chosen to provide all eligible employees an additional 4% of compensation without regards to the amount of the employee contribution. Expense related to Company contributions amounted to $769,000, $737,000, and $627,000 in 2014, 2013 and 2012, respectively. The reduction in expense related to the 401K program in 2014, 2013 and 2012 was the offset of approximately $43,000, $22,000 and $59,000, respectively, in Company contributions forfeited by employees who are no longer employed by the Company and have not met the full vesting requirements of the plan. See footnote 24 on subsequent events.
Deferred Compensation Plan
During the third quarter of 2002, the Company purchased assets and assumed the liabilities relating to a nonqualified deferred compensation plan for certain employees of the Fulton division. The Company owns single premium life insurance policies on the life of each participant and is the beneficiary of the policy value. When a participant retires, the benefits accrued for each participant will be distributed to the participant in equal installments for 15 years. The plan is now fully funded and no additional expenses will be recognized. The Deferred Compensation Plan also provides the participant with life insurance coverage, which is a percentage of the net death proceeds for the policy, if any, applicable to the participant. The original face value of all deferred compensation contracts was approximately $668,000. At December 31, 2014, the accrued value of all deferred compensation contacts is approximately $292,000. The Company is currently making cash remittances of approximately $12,000 per year on deferred compensation contracts.
64
Table of Contents
HopFed Bancorp, Inc. and Subsidiaries
Notes to Consolidated Financial Statements, Continued
December 31, 2014, 2013 and 2012
(Table Amounts in Thousands)
| (13) | Income Taxes: |
The provision for income tax expense (benefit) for the years ended December 31, 2014, December 31, 2013, and December 31, 2012, consisted of the following:
| 2014 | 2013 | 2012 | ||||||||||
| Current |
||||||||||||
| Federal |
$ | — | (32 | ) | 210 | |||||||
| State |
30 | 110 | 120 | |||||||||
|
|
|
|
|
|
|
|||||||
| 30 | 78 | 330 | ||||||||||
|
|
|
|
|
|
|
|||||||
| Deferred |
||||||||||||
| Federal |
(231 | ) | 566 | 487 | ||||||||
| State |
— | — | — | |||||||||
|
|
|
|
|
|
|
|||||||
| (231 | ) | 566 | 487 | |||||||||
|
|
|
|
|
|
|
|||||||
| ($ | 201 | ) | 644 | 817 | ||||||||
|
|
|
|
|
|
|
|||||||
Total income tax expense for the years ended December 31, 2014, 2013, and 2012 differed from the amounts computed by applying the federal income tax rate of 34 percent to income before income taxes as follows:
| 2014 | 2013 | 2012 | ||||||||||
| Expected federal income tax expense at statutory tax rate |
$ | 748 | 1,498 | 1,661 | ||||||||
| Effect of nontaxable interest income |
(724 | ) | (590 | ) | (575 | ) | ||||||
| Effect of nontaxable bank owned life insurance income |
(104 | ) | (120 | ) | (136 | ) | ||||||
| Effect of QSCAB credit |
(220 | ) | (220 | ) | (220 | ) | ||||||
| State taxes on income, net of federal benefit |
84 | 73 | 79 | |||||||||
| Other tax credits |
(80 | ) | (80 | ) | (64 | ) | ||||||
| Non deductible expenses |
95 | 83 | 72 | |||||||||
|
|
|
|
|
|
|
|||||||
| Total income tax expense |
($ | 201 | ) | 644 | 817 | |||||||
|
|
|
|
|
|
|
|||||||
| Effective rate |
(10.1 | %) | 14.6 | % | 16.7 | % | ||||||
|
|
|
|
|
|
|
|||||||
65
Table of Contents
HopFed Bancorp, Inc. and Subsidiaries
Notes to Consolidated Financial Statements, Continued
December 31, 2014, 2013 and 2012
(Table Amounts in Thousands)
| (13) | Income Taxes: (Continued) |
The components of deferred taxes as of December 31, 2014, and December 31, 2013, are summarized as follows:
| 2014 | 2013 | |||||||
| Deferred tax assets: |
||||||||
| Allowance for loan loss |
$ | 2,116 | 2,952 | |||||
| Accrued expenses |
1,482 | 310 | ||||||
| Intangible amortization |
981 | 1,184 | ||||||
| Other |
287 | 275 | ||||||
| Unrealized loss on items in comprehensive income |
— | 736 | ||||||
| Other real estate owned |
95 | 63 | ||||||
|
|
|
|
|
|||||
| 4,961 | 5,520 | |||||||
|
|
|
|
|
|||||
| Deferred tax liabilities: |
||||||||
| FHLB stock dividends |
(787 | ) | (787 | ) | ||||
| Unrealized gain on items in comprehensive income |
(1,832 | ) | — | |||||
| Depreciation and amortization |
(81 | ) | (123 | ) | ||||
|
|
|
|
|
|||||
| (2,700 | ) | (910 | ) | |||||
|
|
|
|
|
|||||
| Net deferred tax asset (liability) |
$ | 2,261 | 4,610 | |||||
|
|
|
|
|
|||||
The Small Business Protection Act of 1996, among other things, repealed the tax bad debt reserve method for thrifts effective for taxable years beginning after December 31, 1995. Commercial banks with assets greater than $500 million can no longer use the reserve method and may only deduct loan losses as they actually arise (i.e., the specific charge-off method).
The portion of a thrift’s tax bad debt reserve that is not recaptured (generally pre-1988 bad debt reserves) under the 1996 law is only subject to recapture at a later date under certain circumstances. These include stock repurchase redemptions by the thrift or if the thrift converts to a type of institution (such as a credit union) that is not considered a bank for tax purposes. However, no recapture was required due to the Bank’s charter conversion from a thrift to a commercial bank or if the bank was acquired by another bank. The Bank does not anticipate engaging in any transactions at this time that would require the recapture of its remaining tax bad debt reserves. Therefore, retained earnings at December 31, 2014, and December 31, 2013, includes approximately $4,027,000 which represents such bad debt deductions for which no deferred income taxes have been provided.
66
Table of Contents
HopFed Bancorp, Inc. and Subsidiaries
Notes to Consolidated Financial Statements, Continued
December 31, 2014, 2013 and 2012
(Table amounts in Thousands)
| (13) | Income Taxes: (Continued) |
No valuation allowance for deferred tax assets was recorded at December 31, 2014, and December 31, 2013, as management believes it is more likely than not that all of the deferred tax assets will be realized because they were supported by recoverable taxes paid in prior years and expected future taxable income. There were no unrecognized tax benefits during any of the reported periods. The Corporation files income tax returns in the U.S. federal jurisdiction. The Company is no longer subject to U.S. federal income tax examinations by tax authorities for years before 2010.
| (14) | Real Estate and Other Assets Owned: |
The Company’s real estate and other assets owned balances at December 31, 2014, and December 31, 2013, represent properties and personal collateral acquired by the Bank through customer loan defaults. The property is recorded at the lower of cost or fair value less estimated cost of to sell at the date acquired with any loss recognized as a charge off through the allowance for loan loss account. Additional real estate and other asset losses may be determined on individual properties at specific intervals or at the time of disposal. Additional losses are recognized as a non-interest expense. As of December 31, 2014, and December 31, 2013, the composition of the Company’s balance in both real estate and other assets owned are as follows:
| December 31, | ||||||||
| 2014 | 2013 | |||||||
| One-to-four family mortgages |
$ | 159 | 350 | |||||
| Land |
1,768 | 1,124 | ||||||
| Non-residential real estate |
— | 200 | ||||||
|
|
|
|
|
|||||
| Total other assets owned |
$ | 1,927 | 1,674 | |||||
|
|
|
|
|
|||||
67
Table of Contents
HopFed Bancorp, Inc. and Subsidiaries
Notes to Consolidated Financial Statements, Continued
December 31, 2014, 2013 and 2012
(Table Amounts in Thousands)
| (15) | Commitments and Contingencies: |
In the ordinary course of business, the Bank has various outstanding commitments and contingent liabilities that are not reflected in the accompanying consolidated financial statements.
The Bank had open loan commitments at December 31, 2014 and 2013 of approximately $45.2 million and $31.1 million, respectively. At December 31, 2014 and 2013, the Bank had no fixed rate loan commitments. Unused lines of credit were approximately $80.1 million and $74.7 million at December 31, 2014 and 2013, respectively. Also at December 31, 2014 and December 31, 2013, the Bank has unused consumer lines of credit tied to customer deposit accounts of $35.5 million and $20.7 million, respectively.
The Company and the Bank have agreed to enter into employment agreements with certain officers, which provide certain benefits in the event of their termination following a change in control of the Company or the Bank. The employment agreements provide for an initial term of three years. On each anniversary of the commencement date of the employment agreements, the term of each agreement may be extended for an additional year at the discretion of the Board. In the event of a change in control of the Company or the Bank, as defined in the agreement, the officers shall be paid an amount equal to two times the officer’s base salary as defined in the employment agreement.
The Company and the Bank have entered into commitments to rent facilities, purchase services and lease operating equipment that are non-cancelable. At December 31, 2014, future minimal purchase, lease and rental commitments were as follows:
| Years Ending December 31 |
||||
| 2015 |
$ | 5,599 | ||
| 2016 |
2,268 | |||
| 2017 |
2,214 | |||
| 2018 |
187 | |||
| 2019 |
21 | |||
|
|
|
|||
| Total |
$ | 10,289 | ||
|
|
|
|||
The Company incurred rental expenses of approximately $66,000, $54,000 and $61,000 for the years ended December 31, 2014, 2013, and 2012, respectively.
In the normal course of business, the Bank and Corporation have entered into operating contracts necessary to conduct the Company’s daily business. The most significant operating contract is for the Bank’s data processing services. The monthly cost associated with this contract is variable based on the number of accounts and usage but has an expected annual cost of approximately $1.2 million. The Bank has several ATM branding agreements with local businesses. These agreements allow the Bank to maintain a cash machine and signage in various locations for an annual cost of approximately $130,000.
68
Table of Contents
HopFed Bancorp, Inc. and Subsidiaries
Notes to Consolidated Financial Statements, Continued
December 31, 2014, 2013 and 2012
(Table Amounts in Thousands)
| (15) | Commitments and Contingencies: (Continued) |
The Company is partially self-insured for medical benefits provided to employees. Heritage Bank is named as the plan administrator for this plan and has retained Anthem Blue Cross Blue Shield (“Anthem”) to process claims and handle other duties of the plan. Anthem does not assume any liabilities as a third party administrator. The Bank purchased two stop-loss insurance policies to limit total medical claims from Anthem. The first specific stop-loss policy limits the Company’s cost in any one year to $90,000 per covered individual. The Company has purchased a second stop-loss policy that limits the aggregate claims for the Company in a given year at $1,783,289 based upon the Company’s current enrollment. The Company has established a liability for outstanding claims as well as incurred but unreported claims. While management uses what it believes are pertinent factors in estimating the plan liability, the actual liability is subject to change based upon unexpected claims experience and fluctuations in enrollment during the plan year. At December 31, 2014, and December 31, 2013, the Company recognized a liability for self-insured medical expenses of approximately $170,000 and $393,000, respectively.
The Company is a party to financial instruments with off-balance-sheet risk in the normal course of business to meet the financing needs of its customers and to reduce its own exposure to fluctuations in interest rates. These financial instruments include commitments to extend credit, standby letters of credit, and financial guarantees. Those instruments involve, to varying degrees, elements of credit and interest rate risk in excess of the amount recognized in the consolidated balance sheets. The contract or notional amounts of those instruments reflect the extent of involvement the Company has in particular classes of financial instruments.
The Company’s exposure to credit loss in the event of nonperformance by the other party to the financial instrument for commitments to extend credit and standby letters of credit and financial guarantees written is represented by the contractual notional amount of those instruments. The Company uses the same credit policies in making these commitments and conditional obligations as it does for on-balance-sheet instruments.
| December 31, | ||||||||
| 2014 | 2013 | |||||||
| Commitments to extend credit |
$ | 45,177 | 31,103 | |||||
| Standby letters of credit |
462 | 322 | ||||||
| Unused commercial lines of credit |
49,026 | 44,962 | ||||||
| Unused home equity lines of credit |
29,843 | 29,733 | ||||||
Commitments to extend credit are agreements to lend to a customer as long as there is no violation of any condition established in the contract. Commitments generally have fixed expiration dates or other termination clauses and may require payment of a fee. Since many of the commitments are expected to expire without being drawn upon, the total commitment amounts do not necessarily represent future cash requirements. The Company evaluates each customer’s creditworthiness on a case-by-case basis. The amount of collateral obtained, if deemed necessary by the Company upon extension of credit, is based on management’s credit evaluation of the counter-party. Collateral held varies but may include property, plant, and equipment and income-producing commercial properties.
69
Table of Contents
HopFed Bancorp, Inc. and Subsidiaries
Notes to Consolidated Financial Statements, Continued
December 31, 2014, 2013 and 2012
(Table Amounts in Thousands, Except Percentages)
| (15) | Commitments and Contingencies: (Continued) |
Standby letters of credit are conditional commitments issued by the Company to guarantee the performance of a customer to a third party. Those guarantees are primarily issued to support public and private borrowing arrangements, including commercial paper, bond financing, and similar transactions. Most guarantees extend from one to two years. The credit risk involved in issuing letters of credit is essentially the same as that involved in extending loan facilities to customers.
In October of 2008, the Company entered into an interest rate swap agreement for a term of seven years and an amount of $10 million. The Bank will pay a fixed rate of 7.27% for seven years and receive an amount equal to the three-month London Interbank Lending Rate (Libor) plus 3.10%. The interest rate swap is classified as a cash flow hedge by the Bank and will be tested quarterly for effectiveness. At December 31, 2014, the cost of the Bank to terminate the cash flow hedge is approximately $390,000. The Bank, in the normal course of business, originates fixed rate mortgages that are sold to Freddie Mac. Upon tentative underwriting approval by Freddie Mac, the Bank issues a best effort commitment to originate a fixed rate first mortgage under specific terms and conditions that the Bank intends to sell to Freddie Mac. The Bank no longer assumes a firm commitment to originate fixed rate loans, thus eliminating the risk of having to deliver loans they did not close or pay commitment fees to make Freddie Mac whole.
The Company is subject to various claims and legal actions that have arisen in the course of conducting business. Management does not expect the ultimate disposition of these matters to have a material adverse impact on the Company’s financial statements.
| (16) | Regulatory Matters: |
Prior to June 5, 2013, the Corporation was a federally chartered thrift holding company regulated by the Federal Reserve Bank and the bank subsidiary was regulated by the Office of the Comptroller of the Currency. On June 5, 2013, the Bank converted its charter to a Kentucky non-member state chartered commercial bank. The Corporation is now a commercial bank holding company and, as such, is subject to regulation, examination and supervision by the Federal Reserve Bank. The Corporation’s wholly owned bank subsidiary is a state chartered commercial bank supervised by the Kentucky Department of Financial Institutions and the Federal Deposit Insurance Corporation. Failure to meet minimum capital requirements can initiate certain mandatory and possibly additional discretionary actions by regulators that, if undertaken, could have a direct material effect on the Corporation’s and the Bank’s financial statements.
Under capital adequacy guidelines and the regulatory framework for prompt corrective action, the Bank must meet specific capital guidelines that involve quantitative measures of the Bank’s assets, liabilities and certain off-balance sheet items as calculated under regulatory accounting practices. The Bank’s capital amounts and classification are also subject to qualitative judgments by the regulators about components, risk weightings and other factors.
70
Table of Contents
HopFed Bancorp, Inc. and Subsidiaries
Notes to Consolidated Financial Statements, Continued
December 31, 2014, 2013 and 2012
(Table Amounts in Thousands, Except Percentages)
| (16) | Regulatory Matters: (Continued) |
Quantitative measures established by regulation to ensure capital adequacy require the Bank to maintain minimum amounts and ratios (set forth in the table below) of tangible and core capital (as defined in the regulations) to adjusted total assets (as defined), and of total capital (as defined) and Tier 1 to risk weighted assets (as defined). Management believes, as of December 31, 2014, and 2013, that the Bank meets all capital adequacy requirements to which it is subject.
The Company’s consolidated capital ratios and the Bank’s actual capital amounts and ratios as of December 31, 2014, and December 31, 2013, are presented below:
| Consolidated Actual |
Bank Actual |
Required for Capital Adequacy Purposes |
Required to be Categorized as Well Capitalized Under Prompt Corrective Action Provisions |
|||||||||||||||||||||||||||||
| Amount | Ratio | Amount | Ratio | Amount | Ratio | Amount | Ratio | |||||||||||||||||||||||||
| As of December 31, 2014 |
||||||||||||||||||||||||||||||||
| Tier 1 Leverage capital to adjusted total assets |
$ | 104,813 | 11.1 | % | $ | 102,240 | 11.0 | % | $ | 37,252 | 4.0 | % | $ | 46,567 | 5.00 | % | ||||||||||||||||
| Total capital to risk weighted assets |
$ | 111,102 | 18.0 | % | $ | 108,529 | 17.6 | % | $ | 46,576 | 8.0 | % | $ | 58,220 | 10.0 | % | ||||||||||||||||
| Tier 1 capital to risk weighted assets |
$ | 104,813 | 19.1 | % | $ | 102,240 | 18.6 | % | N/A | N/A | $ | 55,878 | 6.00 | % | ||||||||||||||||||
| As of December 31, 2013 |
||||||||||||||||||||||||||||||||
| Tier 1 Leverage capital to adjusted total assets |
$ | 107,016 | 11.2 | % | $ | 101,720 | 10.8 | % | $ | 37,819 | 4.00 | % | $ | 47,274 | 5.00 | % | ||||||||||||||||
| Total capital to risk weighted assets |
$ | 114,706 | 18.6 | % | $ | 109,410 | 17.8 | % | $ | 49,138 | 8.00 | % | $ | 61,423 | 10.00 | % | ||||||||||||||||
| Tier 1 capital to risk weighted assets |
$ | 107,016 | 17.4 | % | $ | 101,720 | 16.6 | % | N/A | N/A | $ | 36,854 | 6.00 | % | ||||||||||||||||||
71
Table of Contents
HopFed Bancorp, Inc. and Subsidiaries
Notes to Consolidated Financial Statements, Continued
December 31, 2014, 2013 and 2012
| (17) | Stockholders’ Equity: |
The Company’s sources of income and funds for dividends to its stockholders are earnings on its investments and dividends from the Bank. The Bank’s primary regulator, the KDFI, has regulations that impose certain restrictions on payment of dividends to the Corporation. Current regulations of the KDFI allow the Bank (based upon its current capital level and supervisory status assigned by the KDFI) to pay a dividend as long as the Bank subsidiary maintains an appropriate Tier 1 Capital ratio. Furthermore, for the Bank to pay a dividend to the Corporation without regulatory approval, the dividend is limited to the total amount of the Bank’s current year net income plus the Bank’s net income of the prior two years less any previous dividends paid by the Bank to the Corporation during that time. At December 31, 2014, the Bank was unable to pay additional dividends to the without regulatory approval. Given the prospects for the approval of Basel III, the Company anticipates that in practice it will need to maintain a minimum Tier 1 Capital ratio of 8.50% at its bank subsidiary to continue to pay dividends to common shareholders and will structure its business plan to maintain a Tier 1 Capital ratio at the Bank level at or above 9.00%.
Federal Reserve regulations also place restrictions after the conversion on the Company with respect to repurchases of its common stock. With prior notice to the Federal Reserve, the Company is allowed to repurchase its outstanding shares. In August 2006, under the supervision of the OTS, the Company announced that it replaced a previously announced stock buyback plan with a new plan to purchase up to 125,000 shares of common stock over the next two years. Under the plan that expired September 30, 2008, the Company purchased 106,647 shares of common stock at an average price of $15.36 per share. The Company reissued 112,639 shares of Treasury Stock as part of the stock offering discussed below.
On August 29, 2013, the Company’s Board of Directors approved the commencement of a new stock repurchase program of up to 375,000 shares of the Company’s, or approximately 5% of total shares outstanding. On October 28, 2014, the Company announced it may purchase an additional 300,000 shares of common stock. The Company will conduct repurchases through open market transactions or in privately negotiated transactions that may be made from time to time depending on market conditions and other factors. At December 31, 2014, the Company holds a total of 778,383 shares of treasury stock at an average price of $12.11 per share.
On December 12, 2008, HopFed Bancorp issued 18,400 shares of preferred stock to the United States Treasury (Treasury) for $18,400,000 pursuant to the Capital Purchase Program. The Company issued a Warrant to the Treasury as a condition to its participation in the Capital Purchase Program. The Warrant had an exercise price of $11.32 each and was immediately exercisable, giving the Treasury the right to purchase 243,816 shares of the Company’s Common Stock. The warrants expired ten years from the date of issuance. The Preferred Stock had no stated maturity and was non-voting, other than having class voting rights on certain matters, and pays cumulative dividends quarterly at a rate of 5% per year for the first five years and 9% thereafter. As a result of a 2% stock dividend paid to shareholders of record at September 30, 2010, total warrants issued was adjusted to 248,692 and the warrant strike price was adjusted to $11.098. As a result of a 2% stock dividend paid to shareholders of record at October 3, 2011, total warrants issued was adjusted to 253,667 and the warrant strike price was adjusted to $10.88.
72
Table of Contents
HopFed Bancorp, Inc. and Subsidiaries
Notes to Consolidated Financial Statements, Continued
December 31, 2014, 2013 and 2012
| (17) | Stockholders’ Equity: (Continued) |
On December 19, 2012, HopFed Bancorp repurchased the 18,400 shares of Preferred Stock previously sold to the Treasury at par plus accrued dividends. The repurchase was accomplished with the assistance of a $6.0 million dividend paid to the Company from the Bank. On January 11, 2013, the Company repurchased the warrant from the Treasury for $256,257.
On September 16, 2010, and September 21, 2011, respectively, the Company declared a 2% stock dividend payable to shareholders of record on September 30, 2010 and October 3, 2011. The stock dividend was paid on October 18, 2010, and October 18, 2011, resulting in the issuance of 143,458 shares of common stock in October of 2010 and 146,485 shares of common stock in October 2011. As discussed earlier, both the price and amount of all outstanding options and common stock warrants were adjusted accordingly.
The common stock warrants were assigned a value of $2.28 per warrant, or $555,900. As a result, the value of the warrants was recorded as a discount on the preferred stock and was accreted as a reduction in net income available for common shareholders. In 2012, the Company accelerated the last year of our warrant accretion, recognizing $222,360 of accretion, due to the repurchase of all preferred stock from the Treasury and our stated plans to attempt to repurchase the warrant. For the purposes of these calculations, the fair value of the common stock warrants was estimated using the following assumptions:
| • Risk free rate |
2.60 | % | ||
| • Expected life of warrants |
10 years | |||
| • Expected dividend yield |
3.50 | % | ||
| • Expected volatility |
26.5 | % | ||
| • Weighted average fair value |
$ | 2.28 |
The Company’s computation of expected volatility is based on the weekly historical volatility. The risk free rate was the approximate rate of the ten year treasury at the end of November 2008.
The Company has paid all interest payments due on HopFed Capital Trust 1. If interest payments to HopFed Capital Trust 1 are not made in a timely manner, the Company is prohibited from making cash dividend payments to its common shareholders.
In July 2013, the Federal Reserve Board and the FDIC approved final rules that substantially amend the regulatory risk-based capital rules applicable to Heritage Bank USA, Inc. and HopFed Bancorp, Inc. The final rules implement the regulatory capital reforms of the Basel Committee on Banking Supervision reflected in “Basel III: A Global Regulatory Framework for More Resilient Banks and Banking Systems” (Basel III) and changes required by the Dodd-Frank Act.
73
Table of Contents
HopFed Bancorp, Inc. and Subsidiaries
Notes to Consolidated Financial Statements, Continued
December 31, 2014, 2013 and 2012
| (17) | Stockholders’ Equity: (Continued) |
Under these rules, the leverage and risk-based capital ratios of bank holding companies may not be lower than the leverage and risk-based capital ratios for insured depository institutions. The final rules implementing the Basel III regulatory capital reforms will become effective as to the Bank and Corporation on January 1, 2015, and include new minimum risk-based capital and leverage ratios. Moreover, these rules refine the definition of what constitutes “capital” for purposes of calculating those ratios, including the definitions of Tier 1 capital and Tier 2 capital.
The new minimum capital level requirements applicable to bank holding companies and banks subject to the rules are:
| • | a new common equity Tier 1 capital ratio of 4.5%; |
| • | a Tier 1 risk-based capital ratio of 6% (increased from 4%) |
| • | a total risk-based capital ratio of 8% (unchanged from current rules) |
| • | a Tier 1 leverage ratio of 4% for all institutions. |
The rules also establish a “capital conservation buffer” of 2.5% (to be phased in over three years) above the new regulatory minimum risk-based capital ratios, and result in the following minimum ratios once the capital conservation buffer is fully phased in:
| • | a common equity Tier 1 risk-based capital ratio of 7.0% |
| • | a Tier 1 risk-based capital ratio of 8.5% |
| • | a total risk-based capital ratio of 10.5%. |
At December 31, 2014, the Bank and Corporation met all fully phased capital requires of Basel III, including the capital conservation buffer of 2.5%.
74
Table of Contents
HopFed Bancorp, Inc. and Subsidiaries
Notes to Consolidated Financial Statements, Continued
December 31, 2014, 2013 and 2012
| (18) | Earnings Per Share: |
Earnings per share of common stock are based on the weighted average number of basic shares and dilutive shares outstanding during the year. Common stock warrants outstanding are not included in the dilutive earnings per share computations because they would be anti-dilutive.
The following is a reconciliation of weighted average common shares for the basic and dilutive earnings per share computations:
| Years Ended December 31, | ||||||||||||
| 2014 | 2013 | 2012 | ||||||||||
| Basic earnings per share: |
||||||||||||
| Weighted average common shares |
7,306,078 | 7,483,606 | 7,486,445 | |||||||||
| Adjustment for stock dividend |
— | — | — | |||||||||
|
|
|
|
|
|
|
|||||||
| Weighted average common shares |
7,306,078 | 7,483,606 | 7,486,445 | |||||||||
| Dilutive effect of stock options |
— | — | — | |||||||||
| Adjustment for stock dividend |
— | — | — | |||||||||
|
|
|
|
|
|
|
|||||||
| Weighted average common and incremental shares |
7,306,078 | 7,483,606 | 7,486,445 | |||||||||
|
|
|
|
|
|
|
|||||||
| (19) | Variable Interest Entities: |
Under ASC 810, the Company is deemed to be the primary beneficiary and required to consolidate a variable interest entity (VIE) if it has a variable interest in the VIE that provides it with a controlling financial interest. For such purposes, the determination of whether a controlling financial interest exists is based on whether a single party has both the power to direct the activities of the VIE that most significantly impact the VIE’s economic performance and the obligation to absorb losses of the VIE or the right to receive benefits from the VIE that could potentially be significant to the VIE. ASC 810 requires continual reconsideration of conclusions reached regarding which interest holder is a VIE’s primary beneficiary and disclosures surrounding those VIE’s which have not been consolidated. The consolidation methodology provided in this footnote as of December 31, 2014 and 2013 has been prepared in accordance with ASC 810. At December 31, 2014, the Company did not have any consolidated variable interest entities to disclose but did have a commitment to a low income housing partnership and issued trust preferred securities.
75
Table of Contents
HopFed Bancorp, Inc. and Subsidiaries
Notes to Consolidated Financial Statements, Continued
December 31, 2014, 2013 and 2012
(Table Amounts in Thousands)
| (20) | Condensed Parent Company Only Financial Statements: |
The following condensed balance sheets as of December 31, 2014, and December 31, 2013, and condensed statements of income and cash flows for the years ended December 31, 2014, 2013 and 2012 of the parent company only should be read in conjunction with the consolidated financial statements and the notes thereto.
| Condensed Balance Sheets: | ||||||||
| 2014 | 2013 | |||||||
| Assets: |
||||||||
| Cash and due from banks |
$ | 2,932 | 5,199 | |||||
| Investment in subsidiary |
106,088 | 100,914 | ||||||
| Prepaid expenses and other assets |
534 | 1,078 | ||||||
|
|
|
|
|
|||||
| Total assets |
$ | 109,554 | $ | 107,191 | ||||
|
|
|
|
|
|||||
| Liabilities and equity |
||||||||
| Liabilities |
||||||||
| Unrealized loss on derivative |
$ | 390 | 750 | |||||
| Dividends payable - common |
301 | 325 | ||||||
| Interest payable |
87 | 87 | ||||||
| Other liabilities |
64 | 2 | ||||||
| Subordinated debentures |
10,310 | 10,310 | ||||||
|
|
|
|
|
|||||
| Total liabilities |
11,152 | 11,474 | ||||||
|
|
|
|
|
|||||
| Equity: |
||||||||
| Preferred stock |
— | — | ||||||
| Common stock |
79 | 79 | ||||||
| Additional paid-in capital |
58,466 | 58,302 | ||||||
| Retained earnings |
45,729 | 44,694 | ||||||
| Treasury stock- common stock |
(9,429 | ) | (5,929 | ) | ||||
| Accumulated other comprehensive income |
3,557 | (1,429 | ) | |||||
|
|
|
|
|
|||||
| Total equity |
98,402 | 95,717 | ||||||
|
|
|
|
|
|||||
| Total liabilities and equity |
$ | 109,554 | 107,191 | |||||
|
|
|
|
|
|||||
76
Table of Contents
HopFed Bancorp, Inc. and Subsidiaries
Notes to Consolidated Financial Statements, Continued
December 31, 2014, 2013 and 2012
(Table Amounts in Thousands)
| (20) | Condensed Parent Company Only Financial Statements: (Continued) |
Condensed Statements of Income:
| 2014 | 2013 | 2012 | ||||||||||
| Interest and dividend income: |
||||||||||||
| Dividend income from subsidiary Bank |
$ | 2,600 | 5,500 | 6,000 | ||||||||
| Income on agency securities |
— | — | 56 | |||||||||
|
|
|
|
|
|
|
|||||||
| Total interest and dividend income |
2,600 | 5,500 | 6,056 | |||||||||
|
|
|
|
|
|
|
|||||||
| Interest expense |
737 | 733 | 745 | |||||||||
| Non-interest expenses |
546 | 684 | 584 | |||||||||
|
|
|
|
|
|
|
|||||||
| Total expenses |
1,283 | 1,417 | 1,329 | |||||||||
|
|
|
|
|
|
|
|||||||
| Income (loss) before income taxes and equity in undistributed earnings of subsidiary |
1,317 | 4,083 | 4,727 | |||||||||
| Income tax benefits |
(459 | ) | (496 | ) | (367 | ) | ||||||
|
|
|
|
|
|
|
|||||||
| Income (loss) before equity in undistributed earnings of subsidiary |
1,776 | 4,579 | 5,094 | |||||||||
| Equity in (distribution in excess of) earnings of subsidiary |
423 | (817 | ) | (1,025 | ) | |||||||
|
|
|
|
|
|
|
|||||||
| Net income |
2,199 | 3,762 | 4,069 | |||||||||
| Preferred stock dividend and warrant accretion |
— | — | (1,229 | ) | ||||||||
|
|
|
|
|
|
|
|||||||
| Income available to common shareholders |
$ | 2,199 | 3,762 | 2,840 | ||||||||
|
|
|
|
|
|
|
|||||||
77
Table of Contents
HopFed Bancorp, Inc. and Subsidiaries
Notes to Consolidated Financial Statements, Continued
December 31, 2014, 2013 and 2012
(Table Amounts in Thousands)
| (20) | Condensed Parent Company Only Financial Statements: (Continued) |
Condensed Statements of Cash Flows:
| 2014 | 2013 | 2012 | ||||||||||
| Cash flows from operating activities: |
||||||||||||
| Net income |
$ | 2,199 | 3,762 | 4,069 | ||||||||
| Adjustments to reconcile net income to net cash (used in) provided by operating activities |
||||||||||||
| Equity in undistributed earnings of subsidiary |
(423 | ) | 817 | 1,025 | ||||||||
| Amortization of restricted stock |
164 | 115 | 99 | |||||||||
| Increase (decrease) in: |
||||||||||||
| Current income taxes payable |
200 | (355 | ) | 74 | ||||||||
| Accrued expenses |
280 | (142 | ) | (1 | ) | |||||||
|
|
|
|
|
|
|
|||||||
| Net cash (used in) provided by operating activities: |
2,420 | 4,197 | 5,266 | |||||||||
|
|
|
|
|
|
|
|||||||
| Cash flows for investing activities: |
||||||||||||
| Net cash flow used in investing activities |
— | — | — | |||||||||
| Cash flows from financing activities: |
||||||||||||
| Purchase of preferred stock - treasury |
— | — | (18,400 | ) | ||||||||
| Purchase of common stock - treasury |
(3,500 | ) | (853 | ) | — | |||||||
| Purchase of common stock warrant |
— | (257 | ) | — | ||||||||
| Dividends paid on preferred stock |
— | — | (1,007 | ) | ||||||||
| Dividends paid on common stock |
(1,187 | ) | (751 | ) | (598 | ) | ||||||
|
|
|
|
|
|
|
|||||||
| Net cash (used in) provided by financing activities |
(4,687 | ) | (1,861 | ) | (20,005 | ) | ||||||
|
|
|
|
|
|
|
|||||||
| Net increase (decrease) in cash |
(2,267 | ) | 2,336 | (14,739 | ) | |||||||
| Cash and due from banks at beginning of year |
5,199 | 2,863 | 17,602 | |||||||||
|
|
|
|
|
|
|
|||||||
| Cash and due from banks at end of year |
$ | 2,932 | 5,199 | 2,863 | ||||||||
|
|
|
|
|
|
|
|||||||
78
Table of Contents
HopFed Bancorp, Inc. and Subsidiaries
Notes to Consolidated Financial Statements, Continued
December 31, 2014, 2013 and 2012
(Table Amounts in Thousands)
| (21) | Investments in Affiliated Companies (Unaudited): |
Investments in affiliated companies accounted for under the equity method consist of 100% of the common stock of HopFed Capital Trust I (the Trust), a wholly owned statutory business trust. The Trust was formed on September 25, 2003. Summary financial information for the HopFed Capital Trust 1 is as follows:
Summary Balance Sheets
| December. 31, 2014 |
December. 31, 2013 |
|||||||
| Asset – investment in subordinated debentures issued by HopFed Bancorp, Inc. |
$ | 10,310 | 10,310 | |||||
|
|
|
|
|
|||||
| Liabilities |
$ | — | — | |||||
| Stockholders’ equity: |
||||||||
| Trust preferred securities |
10,000 | 10,000 | ||||||
| Common stock (100% owned by HopFed Bancorp, Inc.) |
310 | 310 | ||||||
|
|
|
|
|
|||||
| Total stockholder’s equity |
10,310 | 10,310 | ||||||
|
|
|
|
|
|||||
| Total liabilities and stockholder’s equity |
$ | 10,310 | 10,310 | |||||
|
|
|
|
|
|||||
Summary Statements of Income
| Years Ended December. 31, | ||||||||
| 2014 | 2013 | |||||||
| Income – interest income from subordinated debentures issued by HopFed Bancorp, Inc. |
$ | 348 | 353 | |||||
|
|
|
|
|
|||||
| Net income |
$ | 348 | 353 | |||||
|
|
|
|
|
|||||
Summary Statements of Stockholder’s Equity
| Trust Preferred Securities |
Common Stock |
Retained Earnings |
Total Stockholder’s Equity |
|||||||||||||
| Beginning balances, January 1, 2014 |
$ | 10,000 | 310 | — | 10,310 | |||||||||||
| Retained earnings: |
||||||||||||||||
| Net income |
— | — | 348 | 348 | ||||||||||||
| Dividends: |
||||||||||||||||
| Trust preferred securities |
— | — | (337 | ) | (337 | ) | ||||||||||
| Common dividends paid to HopFed Bancorp, Inc. |
— | — | (11 | ) | (11 | ) | ||||||||||
|
|
|
|
|
|
|
|
|
|||||||||
| Total retained earnings |
— | — | — | — | ||||||||||||
|
|
|
|
|
|
|
|
|
|||||||||
| Ending balances, December 31, 2014 |
$ | 10,000 | 310 | — | 10,310 | |||||||||||
|
|
|
|
|
|
|
|
|
|||||||||
79
Table of Contents
HopFed Bancorp, Inc. and Subsidiaries
Notes to Consolidated Financial Statements, Continued
December 31, 2014, 2013 and 2012
(Table Amounts in Thousands, Except Share Amounts)
| (22) | Quarterly Results of Operations: (Unaudited) |
Summarized unaudited quarterly operating results for the year ended December 31, 2014:
| First Quarter |
Second Quarter |
Third Quarter |
Fourth Quarter |
|||||||||||||
| December 31, 2014: |
||||||||||||||||
| Interest and dividend income |
$ | 8,658 | 8,734 | 8,994 | 8,294 | |||||||||||
| Interest expense |
2,338 | 2,354 | 2,186 | 2,001 | ||||||||||||
|
|
|
|
|
|
|
|
|
|||||||||
| Net interest income |
6,320 | 6,380 | 6,808 | 6,293 | ||||||||||||
| Provision for loan losses |
380 | (261 | ) | (892 | ) | (1,500 | ) | |||||||||
|
|
|
|
|
|
|
|
|
|||||||||
| Net interest income after provision for loan losses |
5,940 | 6,641 | 7,700 | 7,793 | ||||||||||||
| Noninterest income |
1,598 | 1,945 | 2,393 | 1,904 | ||||||||||||
| Noninterest expense |
7,324 | 7,447 | 7,563 | 11,582 | ||||||||||||
|
|
|
|
|
|
|
|
|
|||||||||
| Income (loss) before income taxes |
214 | 1,139 | 2,530 | (1,885 | ) | |||||||||||
| Income tax expense (benefit) |
(140 | ) | 214 | 577 | (852 | ) | ||||||||||
|
|
|
|
|
|
|
|
|
|||||||||
| Net income (loss) |
$ | 354 | 925 | 1,953 | (1,033 | ) | ||||||||||
|
|
|
|
|
|
|
|
|
|||||||||
| Basic earnings (loss) per share |
$ | 0.05 | 0.13 | 0.27 | (0.14 | ) | ||||||||||
|
|
|
|
|
|
|
|
|
|||||||||
| Diluted earnings (loss) per share |
$ | 0.05 | 0.13 | 0.27 | (0.14 | ) | ||||||||||
|
|
|
|
|
|
|
|
|
|||||||||
| Weighted average shares outstanding: |
||||||||||||||||
| Basic |
7,416,716 | 7,376,726 | 7,265,597 | 7,165,957 | ||||||||||||
|
|
|
|
|
|
|
|
|
|||||||||
| Diluted |
7,416,716 | 7,376,726 | 7,265,597 | 7,165,957 | ||||||||||||
|
|
|
|
|
|
|
|
|
|||||||||
80
Table of Contents
HopFed Bancorp, Inc. and Subsidiaries
Notes to Consolidated Financial Statements, Continued
December 31, 2014, 2013 and 2012
| (22) | Quarterly Results of Operations: (Unaudited) |
Summarized unaudited quarterly operating results for the year ended December 31, 2013:
| First Quarter |
Second Quarter |
Third Quarter |
Fourth Quarter |
|||||||||||||
| December 31, 2013: |
||||||||||||||||
| Interest and dividend income |
$ | 9,305 | 8,994 | 8,795 | 8,763 | |||||||||||
| Interest expense |
2,914 | 2,794 | 2,496 | 2,377 | ||||||||||||
|
|
|
|
|
|
|
|
|
|||||||||
| Net interest income |
6,391 | 6,200 | 6,299 | 6,386 | ||||||||||||
| Provision for loan losses |
376 | 406 | 426 | 396 | ||||||||||||
|
|
|
|
|
|
|
|
|
|||||||||
| Net interest income after provision for loan losses |
6,015 | 5,794 | 5,873 | 5,990 | ||||||||||||
| Noninterest income |
2,483 | 2,828 | 1,769 | 2,292 | ||||||||||||
| Noninterest expense |
7,274 | 7,124 | 6,984 | 7,256 | ||||||||||||
|
|
|
|
|
|
|
|
|
|||||||||
| Income before income taxes |
1,224 | 1,498 | 658 | 1,026 | ||||||||||||
| Income tax expense (benefit) |
240 | 332 | 122 | (50 | ) | |||||||||||
|
|
|
|
|
|
|
|
|
|||||||||
| Net income |
$ | 984 | 1,166 | 536 | 1,076 | |||||||||||
|
|
|
|
|
|
|
|
|
|||||||||
| Basic earnings per share |
$ | 0.13 | 0.16 | 0.07 | 0.14 | |||||||||||
|
|
|
|
|
|
|
|
|
|||||||||
| Diluted earnings per share |
$ | 0.13 | 0.16 | 0.07 | 0.14 | |||||||||||
|
|
|
|
|
|
|
|
|
|||||||||
| Weighted average shares outstanding: |
||||||||||||||||
| Basic |
7,488,445 | 7,488,906 | 7,483,582 | 7,430,970 | ||||||||||||
|
|
|
|
|
|
|
|
|
|||||||||
| Diluted |
7,488,445 | 7,488,906 | 7,483,582 | 7,430,970 | ||||||||||||
|
|
|
|
|
|
|
|
|
|||||||||
81
Table of Contents
HopFed Bancorp, Inc. and Subsidiaries
Notes to Consolidated Financial Statements, Continued
December 31, 2014, 2013 and 2012
| (23) | Comprehensive Income: |
FASB ASC 220, Comprehensive Income, established standards for reporting comprehensive income. Comprehensive income includes net income and other comprehensive net income which is defined as non-owner related transactions in equity. The following table sets forth the amounts of other comprehensive income (loss) included in stockholders’ equity along with the related tax effect for the years ended December 31, 2014, 2013 and 2012.
| Pre-Tax Amount |
Tax Benefit (Expense) |
Net of Tax Amount |
||||||||||
| December 31, 2014: |
||||||||||||
| Unrealized holding gains (losses) on: |
||||||||||||
| Available for sale securities |
$ | 7,773 | (2,643 | ) | 5,130 | |||||||
| Derivatives |
359 | (122 | ) | 237 | ||||||||
| Reclassification adjustments for gains on: |
||||||||||||
| Available for sale securities |
(578 | ) | 197 | (381 | ) | |||||||
|
|
|
|
|
|
|
|||||||
| $ | 7,554 | (2,568 | ) | 4,986 | ||||||||
|
|
|
|
|
|
|
|||||||
| December 31, 2013: |
||||||||||||
| Unrealized holding gains on: |
||||||||||||
| Available for sale securities |
($ | 16,012 | ) | 5,444 | (10,568 | ) | ||||||
| Derivatives |
376 | (128 | ) | 248 | ||||||||
| Reclassification adjustments for gains on: |
||||||||||||
| Available for sale securities |
(1,661 | ) | 565 | (1,096 | ) | |||||||
| Other than temporary impairment |
400 | (136 | ) | 264 | ||||||||
|
|
|
|
|
|
|
|||||||
| ($ | 16,897 | ) | 5,745 | (11,152 | ) | |||||||
|
|
|
|
|
|
|
|||||||
| December 31, 2012: |
||||||||||||
| Unrealized holding gains on: |
||||||||||||
| Available for sale securities |
$ | 5,071 | (1,723 | ) | 3,348 | |||||||
| Derivatives |
171 | (58 | ) | 113 | ||||||||
| Reclassification adjustments for gains on: |
||||||||||||
| Available for sale securities |
(1,671 | ) | 567 | (1,104 | ) | |||||||
|
|
|
|
|
|
|
|||||||
| $ | 3,571 | (1,214 | ) | 2,357 | ||||||||
|
|
|
|
|
|
|
|||||||
| (24) | Subsequent Events: |
On January 20, 2015, the Kentucky Department of Financial Institutions approved a special request of the Bank’s Board of Directors to pay a $16.0 million dividend to the Company. The approval for the Bank to pay the dividend is valid for twelve months. The Bank and Corporation expect to be well capitalized and meet all capital requirements under Basel III after the payment of this dividend.
On February 2, 2015, the Bank paid an $8.3 million dividend to the Corporation. The dividend proceeds were used to make two purchases of treasury stock, one for 80,000 shares and one for 534,943 shares.
On February 27, 2015, the Company implemented the HopFed Bancorp, Inc. 2015 Employee Stock Ownership Plan (the “ESOP”) which covers substantially all employees who are at least 21 years old with at least one year of employment with the Corporation and Heritage Bank USA, Inc. (the “Bank”), the Company’s commercial bank subsidiary. Employer contributions to the ESOP are expected to replace matching and profit sharing contributions to the Heritage Bank 401(k) Plan sponsored by the Bank. The ESOP has three individuals who have been selected by the Company to serve as trustees. A directed corporate trustee has also been appointed. The ESOP will be administered by a committee (the “Committee”) composed of three or more individuals selected by the Company or its designee. Until the Committee is appointed, the trustees will carry out the duties and responsibilities of the Committee.
The 2015 ESOP has filed a Notice of Change of Control with the Federal Reserve Bank of St. Louis. The notice is required for the 2015 ESOP to exceed 9.9% ownership of the Company’s stock. If approved, the 2015 ESOP may elect to acquire up to 1.0 million shares of the Company’s treasury stock. Beginning in 2015, the Company will utilize the 2015 ESOP as the primary retirement benefit for its employees. The Company will continue to offer a 401-K plan for its employees but will no longer contribute for the benefit of its employees.
On March 2, 2015, the ESOP entered into a loan agreement with the Corporation to borrow up to $13,500,000 to purchase up to 1,000,000 shares common stock (“ESOP Loan”). On the same date, the ESOP purchased an initial block of 600,000 shares from the Corporation at a cost of $7,884,000 using the proceeds of the ESOP Loan. In accordance with the ESOP Loan documents, the common stock purchased by the ESOP serves as collateral for the ESOP Loan. The ESOP Loan will be repaid principally from discretionary contributions by the Bank to the ESOP over a period ending no later than December 31, 2040. The ESOP Loan documents provide that the ESOP Loan may be repaid over a shorter period, without penalty for prepayments. The interest rate on the ESOP Loan is 3.0%. Shares purchased by the ESOP will be held in a suspense account for allocation among participants as the ESOP Loan is repaid. The ESOP shares are dividend paying. Dividends on the shares will be used to repay the ESOP Loan.
On January 1, 2015, FFKY was sold and merged into Community Bank Shares of Indiana, Inc. (“CBIN”) with CBIN being the surviving Company. On January 20, 2015, the Company was informed in writing by Wilmington Trust, trustee for the debentures, that CBIN terminated the interest extension period of the debenture by making a deposit equal to all amounts due, including compounded interest, with Wilmington Trust. The Company expects to receive approximately $871,000 of past due interest on March 16, 2015.
82
EXHIBIT 21.1
SUBSIDIARIES OF THE REGISTRANT
| Percentage Owned | Jurisdiction of Incorporation | |||||
| Heritage Bank USA |
100 | % | United States | |||
| HopFed Capital Trust I | 100 | % | Delaware | |||
SUBSIDIARIES OF HERITAGE BANK
| Percentage Owned | Jurisdiction of Incorporation | |||||
| Fort Webb LLC |
100 | % | Kentucky | |||
| Heritage Interim Corporation |
100 | % | Tennessee | |||
| JBMM LLC |
100 | % | Kentucky | |||
| Heritage USA Title, LLC |
100 | % | Kentucky | |||
EXHIBIT 23.1
CONSENT OF INDEPENDENT REGISTERED PUBLIC ACCOUNTING FIRM
We consent to the incorporation by reference in registration statements Nos. 333-189670, 333-117956 and 333-79391 on Form S-8 and No. 333-156652 on Form S-3 of HopFed Bancorp, Inc. and subsidiaries of our reports dated March 13, 2015, relating to the consolidated balance sheets of HopFed Bancorp, Inc. and subsidiaries as of December 31, 2014 and 2013 and the related consolidated statements of income, comprehensive income (loss), changes in stockholders’ equity, and cash flows for each of the years in the three-year period ended December 31, 2014, and the effectiveness of internal control over financial reporting as of December 31, 2014, which reports appear in the December 31, 2014, Annual Report on Form 10-K of HopFed Bancorp, Inc. and subsidiaries.
| (signed) Rayburn, Bates & Fitzgerald, P.C.
Brentwood, Tennessee March 13, 2015 |
EXHIBIT 31.1
CERTIFICATION
I, John E. Peck, certify that:
| (1) | I have reviewed this annual report on Form 10-K of HopFed Bancorp, Inc.; |
| (2) | Based on my knowledge, this annual report does not contain any untrue statement of a material fact or omit to state a material fact necessary to make the statements made, in light of the circumstances under which such statements were made, not misleading with respect to the period covered by this report; |
| (3) | Based on my knowledge, the financial statements, and other financial information included in this annual report, fairly present in all material respects the financial condition, results of operations and cash flows of the registrant as of, and for, the periods presented in this report; |
| (4) | The registrant’s other certifying officer and I are responsible for establishing and maintaining disclosure controls and procedures (as defined in Exchange Act Rules 13a-15(e) and 15d-15(e)) and internal control over financial reporting (as defined by Exchange Act Rules 13a-15(f)) for the registrant and have: |
| a) | designed such disclosure controls and procedures, or caused such disclosure controls and procedures to be designed under our supervision, to ensure that material information relating to the registrant, including its consolidated subsidiaries, is made known to us by others within those entities, particularly during the period in which this report is being prepared; |
| b) | designed such internal control over financial reporting, or caused such internal control over financial reporting to be designed under our supervision, to provide reasonable assurance regarding the reliability of financial reporting and the preparation of financial statements for external purposes in accordance with generally accepted accounting principles; and |
| c) | evaluated the effectiveness of the registrant’s disclosure controls and procedures and presented in this report our conclusions about the effectiveness of the disclosure controls and procedures, as of the end of the period covered by this report based on such evaluation: and |
| d) | disclosed in this report any change in the registrant’s internal control over financial reporting that occurred during the registrant’s most recent fiscal quarter (the registrant’s fourth quarter in the case of an annual report) that has materially affected, or is reasonable likely to materially affect, the registrants internal control over financial reporting; and |
| (5) | The registrant’s other certifying officer and I have disclosed, based on our most recent evaluation of internal control over financial reporting, to the registrant’s auditors and the audit committee of registrant’s board of directors (or persons performing the equivalent functions): |
| a) | all significant deficiencies and material weaknesses in the design or operation of internal control over financial reporting which are reasonably likely to adversely affect the registrant’s ability to record, process, summarize and report financial information; and |
| b) | any fraud, whether or not material, that involves management or other employees who have a significant role in the registrant’s internal control over financial reporting. |
| Date: March 13, 2015 | (signed) John. E. Peck | |||||
| John E. Peck, Chief Executive Officer |
EXHIBIT 31.2
CERTIFICATION
I, Billy C. Duvall, certify that:
| (1) | I have reviewed this annual report on Form 10-K of HopFed Bancorp, Inc.; |
| (2) | Based on my knowledge, this annual report does not contain any untrue statement of a material fact or omit to state a material fact necessary to make the statements made, in light of the circumstances under which such statements were made, not misleading with respect to the period covered by this report; |
| (3) | Based on my knowledge, the financial statement, and other financial information included in this annual report, fairly present in all material respects the financial condition, results of operations and cash flows of the registrant as of, and for, the periods presented in this report; |
| (4) | The registrant’s other certifying officers and I are responsible for establishing and maintaining disclosure controls and procedures (as defined in Exchange Act Rules 13a-15(e) and 15d-15(e)) and internal control over financial reporting (as defined by Exchange Act Rules 13a-15(f)) for the registrant and have: |
| a) | designed such disclosure controls and procedures, or caused such disclosure controls and procedures to be designed under our supervision, to ensure that material information relating to the registrant, including its consolidated subsidiaries, is made known to us by others within those entities, particularly during the period in which this report is being prepared; |
| b) | designed such internal control over financial reporting, or caused such internal control over financial reporting to be designed under our supervision, to provide reasonable assurance regarding the reliability of financial reporting and the preparation of financial statements for external purposes in accordance with generally accepted accounting principles; and |
| c) | evaluated the effectiveness of the registrant’s disclosure controls and procedures and presented in this report our conclusions about the effectiveness of the disclosure controls and procedures, as of the end of the period covered by this report based on such evaluation: and |
| d) | disclosed in this report any change in the registrant’s internal control over financial reporting that occurred during the registrant’s most recent fiscal quarter (the registrant’s fourth fiscal quarter in the case of an Annual Report) that has materially affected, or is reasonably likely to materially affect, the registrants internal control over financial reporting; and |
| (5) | The registrant’s other certifying officers and I have disclosed, based on our most recent evaluation of internal control over financial reporting, to the registrant’s auditors and the audit committee of registrant’s board of directors (or persons performing the equivalent functions): |
| a) | all significant deficiencies and material weaknesses in the design or operation of internal control over financial reporting which are reasonable likely to adversely affect the registrant’s ability to record, process, summarize and report financial information; and |
| b) | any fraud, whether or not material, that involves management or other employees who have a significant role in the registrant’s internal control over financial reporting. |
| Date: March 13, 2015 | (signed) Billy C. Duvall | |||||
| Billy C. Duvall, Chief Financial Officer |
Exhibit 32.1
CERTIFICATION PURSUANT TO
18 U.S.C SECTION 1350, AS ADOPTED
PURSUANT TO SECTION 906 OF THE
SARBANES-OXLEY ACT OF 2002
In connection with the Annual Report of HopFed Bancorp, Inc. (the “Company”) on
Form 10-K for the period ending December 31, 2014 as filed with the Securities and
Exchange Commission on the date hereof (the “Report”), I, John E. Peck, Chief Executive
Officer of the Company, certify, pursuant to 18 U.S.C. Section 1350, as adopted pursuant
to Section 906 of the Sarbanes-Oxley Act of 2002, that:
| 1) | The Report fully complies with the requirements of section 13(a) or 15 (d) of the Securities Exchange Act of 1934; and |
| 2) | The information contained in the Report fairly presents, in all material respects, the financial condition and the results of operations of the Company. |
Date: March 13, 2015
| (signed) John E. Peck |
| John E. Peck, Chief Executive Officer |
A signed original of this written statement required by Section 906 has been provided to HopFed Bancorp, Inc. and will be retained by HopFed Bancorp, Inc. and furnished to the Securities and Exchange Commission or its staff upon request. The information furnished herein shall not be deemed to be filed for purposes of Section 18 of the Securities Exchange Act of 1934, nor shall it be deemed incorporated by reference in any filing under the Securities Act of 1933.
Exhibit 32.2
CERTIFICATION PURSUANT TO
18 U.S.C SECTION 1350, AS ADOPTED
PURSUANT TO SECTION 906 OF THE
SARBANES-OXLEY ACT OF 2002
In connection with the Annual Report of HopFed Bancorp, Inc. (the “Company”) on
Form 10-K for the period ending December 31, 2014 as filed with the Securities and
Exchange Commission on the date hereof (the “Report”), I, Billy C. Duvall, Chief
Financial Officer of the Company, certify, pursuant to 18 U.S.C. Section 1350, as
adopted pursuant to Section 906 of the Sarbanes-Oxley Act of 2002, that:
| 1) | The Report fully complies with the requirements of section 13(a) or 15 (d) of the Securities Exchange Act of 1934; and |
| 2) | The information contained in the Report fairly presents, in all material respects, the financial condition and the results of operations of the Company. |
Date: March 13, 2015
| (signed) Billy C. Duvall |
| Billy C. Duvall, Chief Financial Officer |
A signed original of this written statement required by Section 906 has been provided to HopFed Bancorp, Inc. and will be retained by HopFed Bancorp, Inc. and furnished to the Securities and Exchange Commission or its staff upon request. The information furnished herein shall not be deemed to be filed for purposes of Section 18 of the Securities Exchange Act of 1934, nor shall it be deemed incorporated by reference in any filing under the Securities Act of 1933.
Serious News for Serious Traders! Try StreetInsider.com Premium Free!
You May Also Be Interested In
- LINCOLN ALERT: Bragar Eagel & Squire, P.C. Announces that a Class Action Lawsuit Has Been Filed Against Lincoln National Corporation and Encourages Investors to Contact the Firm
- INVESTIGATION ALERT: The Schall Law Firm Announces it is Investigating Claims Against FiscalNote Holdings, Inc. and Encourages Investors to Contact the Firm
- NorthStar Gaming Announces Extension of Strategic Marketing Agreement and Short-Term Financing from Playtech
Create E-mail Alert Related Categories
SEC FilingsSign up for StreetInsider Free!
Receive full access to all new and archived articles, unlimited portfolio tracking, e-mail alerts, custom newswires and RSS feeds - and more!
