

Form 10-K Fabrinet For: Jun 26
 Tweet
Tweet Share
ShareTable of Contents
UNITED STATES
SECURITIES AND EXCHANGE COMMISSION
Washington, D.C. 20549
FORM 10-K
(Mark One)
| x | ANNUAL REPORT PURSUANT TO SECTION 13 OR 15(d) OF THE SECURITIES EXCHANGE ACT OF 1934 |
For the fiscal year ended June 26, 2015
Or
| ¨ | TRANSITION REPORT PURSUANT TO SECTION 13 OR 15(d) OF THE SECURITIES EXCHANGE ACT OF 1934 |
For the transition period from to
Commission file number: 001-34775
FABRINET
(Exact name of registrant as specified in its charter)
| Cayman Islands | Not Applicable | |
| (State or other jurisdiction of incorporation or organization) |
(I.R.S. Employer Identification No.) |
| c/o Intertrust Corporate Services (Cayman) Limited 190 Elgin Avenue George Town Grand Cayman Cayman Islands |
KY1-9005 | |
| (Address of principal executive offices) | (Zip Code) |
+66 2-524-9600
(Registrant’s telephone number, including area code)
Securities registered pursuant to Section 12(b) of the Act:
| Ordinary Shares, $0.01 par value | New York Stock Exchange | |
| (Title of each class) | (Name of exchange on which registered) |
Securities registered pursuant to Section 12(g) of the Act: None
Indicate by check mark if the registrant is a well-known seasoned issuer, as defined in Rule 405 of the Securities Act. Yes ¨ No x
Indicate by check mark if the registrant is not required to file reports pursuant to Section 13 or Section 15(d) of the Act. Yes ¨ No x
Indicate by check mark whether the registrant (1) has filed all reports required to be filed by Section 13 or 15(d) of the Securities Exchange Act of 1934 during the preceding 12 months (or for such shorter period that the registrant was required to file such reports), and (2) has been subject to such filing requirements for the past 90 days. Yes x No ¨
Indicate by check mark whether the registrant has submitted electronically and posted on its corporate Web site, if any, every Interactive Data File required to be submitted and posted pursuant to Rule 405 of Regulation S-T (§229.405 of this chapter) during the preceding 12 months (or for such shorter period that the registrant was required to submit and post such files). Yes x No ¨
Indicate by check mark if disclosure of delinquent filers pursuant to Item 405 of Regulation S-K (section 229.405 of this chapter) is not contained herein, and will not be contained, to the best of the registrant’s knowledge, in definitive proxy or information statements incorporated by reference in Part III of this Form 10-K or any amendment to this Form 10-K. ¨
Indicate by check mark whether the registrant is a large accelerated filer, an accelerated filer, a non-accelerated filer, or a smaller reporting company. See the definitions of “large accelerated filer,” “accelerated filer” and “smaller reporting company” in Rule 12b-2 of the Exchange Act. (Check one):
| Large accelerated filer ¨ | Accelerated filer | x | ||||
| Non-accelerated filer ¨ | (Do not check if smaller reporting company) | Smaller reporting company | ¨ |
Indicate by check mark whether the registrant is a shell company (as defined in Rule 12b-2 of the Act). Yes ¨ No x
As of December 26, 2014, the last business day of the registrant’s most recently completed second fiscal quarter, shares held by non-affiliates of the registrant had an aggregate market value of approximately $594,264,000, based on the closing price for the registrant’s ordinary shares as reported on the New York Stock Exchange on such date.
As of August 7, 2015, the registrant had 35,440,694 ordinary shares, $0.01 par value, outstanding.
DOCUMENTS INCORPORATED BY REFERENCE
Portions of the registrant’s definitive proxy statement relating to its 2015 Annual Meeting of Shareholders are incorporated by reference into Part III of this Annual Report on Form 10-K where indicated. Such proxy statement will be filed with the U.S. Securities and Exchange Commission within 120 days after the end of the fiscal year to which this report relates.
Table of Contents
FABRINET
ANNUAL REPORT ON FORM 10-K
For the Fiscal Year Ended June 26, 2015
1
Table of Contents
| ITEM 1. | BUSINESS. |
Overview
We provide advanced optical packaging and precision optical, electro-mechanical and electronic manufacturing services to original equipment manufacturers (OEMs) of complex products such as optical communication components, modules and sub-systems, industrial lasers, medical devices, and sensors. We offer a broad range of advanced optical and electro-mechanical capabilities across the entire manufacturing process, including process design and engineering, supply chain management, manufacturing, complex printed circuit board assembly, advanced packaging, integration, final assembly and test. Although, we focus primarily on low-volume production of a wide variety of high complexity products, which we refer to as “low-volume, high-mix”, we also have the capability to accommodate high-volume production. Based on our experience with, and feedback from, customers, we believe we are a global leader in providing these services to the optical communications, industrial lasers, automotive, medical, and sensors markets.
Our customer base includes companies in complex industries that require advanced precision manufacturing capabilities, such as optical communications, industrial lasers, automotive, medical, and sensors. Our customers in these industries support a growing number of end-markets, including automotive, biotechnology, communications, materials processing, medical devices, metrology and semiconductor processing. Our revenues from lasers, sensors and other markets as a percentage of total revenues have slightly decreased from 28.6% for the year ended June 27, 2014 (“fiscal year 2014”) to 28.5% for the year ended June 26, 2015 (“fiscal year 2015”), while our revenues from optical communications products as a percentage of total revenues slightly increased from 71.4% for fiscal year 2014 to 71.5% for fiscal year 2015.
In many cases, we are the sole outsourced manufacturing partner used by our customers for the products that we produce for them. The products that we manufacture for our OEM customers include:
| • | optical communications devices, such as: |
| • | selective switching products, such as reconfigurable optical add-drop multiplexers (ROADMs), optical amplifiers, modulators and other optical components and modules that collectively enable network managers to route voice, video and data communications traffic through fiber optic cables at various wavelengths, speeds, and over various distances; |
| • | tunable transponders and transceivers that eliminate, at a significant cost savings to the service provider, the need to stock individual fixed wavelength transponders and transceivers used in voice and data communications networks; and |
| • | active optical cables providing high-speed interconnect capabilities for data centers and computing clusters, as well as Infiniband, Ethernet, fiber channel and optical backplane connectivity; |
| • | solid state, diode-pumped, gas and fiber lasers (collectively referred to as “industrial lasers”) used across a broad array of industries, including semiconductor processing (wafer inspection, wafer dicing, wafer scribing), biotechnology and medical device (DNA sequencing, flow cytometry, hematology, antibody detection), metrology (instrumentation, calibration, inspection), and material processing (photo processing, textile cutting, annealing, marking, engraving, and welding); and |
| • | sensors, including differential pressure, micro-gyro, fuel and other sensors that are used in automobiles, and non-contact temperature measurement sensors for the medical industry. |
We also design and fabricate application-specific crystals, lenses, prisms, mirrors, laser components and substrates (collectively referred to as “customized optics”) and other custom and standard borosilicate, clear
2
Table of Contents
fused quartz, and synthetic fused silica glass products (collectively referred to as “customized glass”). We incorporate our customized optics and glass into many of the products we manufacture for our OEM customers, and we also sell customized optics and glass in the merchant market.
We believe we offer differentiated manufacturing services through our optical and electro-mechanical process technologies and our strategic alignment with our customers. Our dedicated process and design engineers, who have a deep knowledge in materials sciences and physics, are able to tailor our service offerings to accommodate our customers’ complex engineering assignments. Our range of capabilities, from the design of customized optics and glass through process engineering and testing of finished assemblies, provides us with a knowledge base that we believe often leads to improvements in our customers’ product development cycles, manufacturing cycle times, quality and reliability, manufacturing yields and end product costs. We offer an efficient, technologically advanced and flexible manufacturing infrastructure designed to enable the scale production of low-volume, high-mix products, as well as high-volume products. We specialize in complex prototype and new product introduction services, with specialized resources to meet customers’ quick-turn printed circuit board assembly (PCBA) and early stage manufacturing requirements. We have a dedicated engineering team to support the advanced optical packaging needs of our customers’ cutting edge products, which allows them to accelerate development and time-to-market for such products. We often provide a “factory-within-a-factory” manufacturing environment to safeguard our customers’ intellectual property by physically segregating certain key employees and manufacturing space from the resources we use for other customers. We also provide our customers with a customized software platform to monitor all aspects of the manufacturing process, enabling our customers to remotely access our databases to monitor yields, inventory positions, work-in-progress status and vendor quality data in real time. We believe there is no other manufacturing services provider with a similar breadth and depth of optical and electro-mechanical engineering and process technology capabilities that does not directly compete with its customers in their end-markets. As a result, we believe we are more closely aligned and better able to develop long-term relationships with our customers than our competitors.
We are organized and operate in a single segment. See Note 18, Business segments and geographic information of Notes to Consolidated Financial Statements in Part II, Item 8 of this Report, which is incorporated herein by reference.
As of June 26, 2015, our facilities comprised approximately 1.3 million total square feet, including approximately 0.1 million square feet of office space and approximately 1.2 million square feet devoted to manufacturing and related activities, of which approximately 0.5 million square feet are clean room facilities. Of the aggregate square footage of our facilities, approximately 1.0 million square feet are located in Thailand and the balance is located in the People’s Republic of China (“PRC or China”) and the United States. See Part I, Item 2. Properties of this Report.
Thailand Flooding
We suspended production at all of our manufacturing facilities in Thailand from October 17, 2011 through November 14, 2011 due to severe flooding in Thailand. We never resumed, and have permanently ceased, production at our Chokchai facility. We submitted claims for losses to our insurance companies, all of which were settled as of the end of fiscal year 2014.
In fiscal year 2014, we received from our insurer a final payment of $45.2 million against our claims for owned and consigned equipment and inventory, which we recognized as income related to flooding. This income was offset by $0.5 million of other expenses from write-offs of advance payments to a customer due to flood-related losses.
During fiscal year 2014, we fulfilled our obligations to a customer in accordance with the settlement agreement entered into during the third quarter of fiscal year 2013 by making a final cash payment of $5.3 million and transferred equipment, with an aggregate value of $2.3 million, to such customer. In addition, we
3
Table of Contents
fulfilled our obligations to a customer’s insurers in accordance with a settlement agreement entered into during the fourth quarter of fiscal 2013 by making a payment of $2.3 million.
Industry Background
Optical Communications
Since 2001, most optical communications OEMs have reduced manufacturing capacity and transitioned to a low-cost and more efficient manufacturing base. By outsourcing production to third parties, OEMs are better able to concentrate their efforts and resources on what they believe are their core strengths, such as research and development, and sales and marketing. Additionally, outsourcing production often allows OEMs to reduce product costs, improve quality, access advanced process design and manufacturing technologies and achieve accelerated time-to-market and time-to-volume production. The principal barrier to the trend towards outsourcing in the optics industry has been the shortage of third-party manufacturing partners with the necessary optical process capabilities and robust intellectual property protection.
Demand for optical communications components and modules is influenced by the level and rate of development of optical communications infrastructure and carrier and enterprise network expansion. Carrier demand for optical communications network equipment has increased as a direct result of higher network utilization and increased demand for bandwidth capacity. The increase in network traffic volumes have been driven by increasing demand for voice, data and video services delivered over wired and wireless Internet protocol, or IP, networks.
Industrial Lasers, Sensors and Others
The optical and electro-mechanical process technologies used in the optical communications market also have applications in other similarly complex end-markets that require advanced precision manufacturing capabilities, such as automotive, industrial lasers, medical devices, and sensors. These markets are substantially larger than the optical communications components and modules market. Growth in the industrial lasers, medical, and sensors markets is expected to be driven by demand for:
| • | industrial laser applications across a growing number of end-markets, particularly in semiconductor processing, biotechnology, metrology and materials processing; |
| • | precision, non-contact and low power requirement sensors, particularly in automotive, medical and industrial end-markets; and |
| • | lower cost products used on both enterprise and consumer levels. |
Outsourcing of production by industrial laser and sensor OEMs has historically been limited. We believe industrial laser and sensor OEMs are increasingly recognizing the benefits of outsourcing that OEMs in other industries, such as optical communications, have been able to achieve.
Our Competitive Strengths
We believe we have succeeded in providing differentiated services to the optical communications, industrial lasers, medical, and sensors industries due to our long-term focus on optical and electro-mechanical process technologies, strategic alignment with our customers and our commitment to total customer satisfaction. More specifically, our key competitive strengths include:
| • | Advanced Optical and Electro-Mechanical Manufacturing Technologies: We believe that our optical and electro-mechanical process technologies and capabilities, coupled with our customized optics and glass technologies, provide us with a key competitive advantage. These technologies include: |
| • | advanced optical and precision packaging; |
| • | reliability and environmental testing; |
4
Table of Contents
| • | optical and mechanical material and process analysis; |
| • | precision optical fiber and electro-mechanical assembly; |
| • | complex printed circuit board assembly; |
| • | customized software tools for low-volume, high-mix manufacturing; |
| • | turn-key manufacturing systems; |
| • | fiber metallization and lensing; |
| • | fiber handling and fiber alignment; |
| • | crystal growth and processing; |
| • | precision lapping and polishing; |
| • | precision glass drawing; and |
| • | optical coating. |
| • | Efficient, Flexible and Low Cost Process Engineering and Manufacturing Platform: We enable our customers to transition their production to an efficient and flexible manufacturing platform that is specialized for the production of optics and similarly complex products and is located in a low-cost geography. We believe our advanced manufacturing technologies, coupled with our broad engineering capabilities, give us the ability to identify opportunities to improve our customers’ manufacturing processes and provide meaningful production cost benefits. We have also developed a series of customized software tools that we believe provide us with a specialized ability to manage the unique aspects of low-volume, high-mix production. |
| • | Customizable Factory-Within-a-Factory Production Environment: We offer our customers exclusive engineering teams and manufacturing space for production. We call this concept of segregating production by customer a “factory-within-a-factory.” We believe our approach maximizes intellectual property protection and provides greater opportunities to reduce cost and improve time to market for our customers’ products. |
| • | Vertical Integration Targeting Customized Optics and Glass: We believe our capabilities in the design and fabrication of high-value customized optics and glass are complementary to our manufacturing services. Specifically, these capabilities enable us to strategically align our business to our customers’ needs by streamlining our customers’ product development process and reducing the number of suppliers in our customers’ manufacturing supply chains. Also, we use these customized optics and glass products in certain of the components, modules and subsystems we manufacture, which enables us to shorten time to market and reduce the cost for our customers. We believe this level of vertical integration positions us to capitalize on further opportunities to cross-sell our design and fabrication capabilities. |
| • | Turn-Key Supply Chain Management: We have created a proprietary set of automated manufacturing resource planning tools designed specifically to address the unique inventory management demands of “low-volume, high-mix” manufacturing. Over the years, we have developed strong relationships with thousands of suppliers and implemented inventory management strategies with many of them, which enables us to obtain inventory on an as-needed basis and provide on-site stocking programs. We believe our deep expertise, relationships and capabilities in supply chain and materials management often allows us to further reduce costs and cycle times for our customers. |
5
Table of Contents
Our Growth Strategy
The key elements of our growth strategy are to:
| • | Strengthen Our Presence in the Optical Communications Market: We believe we are a leader in manufacturing products for the optical communications market. The optical communications market is growing rapidly, driven by the growth in demand for increased network bandwidth. We believe this trend will continue to increase the demand for the products that we manufacture and the services we provide. We continue to invest resources in advanced manufacturing process and optical packaging technologies to support the manufacture of the next generation of complex optical products. |
| • | Leverage Our Technology and Manufacturing Capabilities to Continue to Diversify Our End-Markets: We intend to use our technological strengths in precision optical and electro-mechanical manufacturing, advanced packaging and process design engineering to continue our diversification into industrial lasers, medical, sensors, and other select markets that require similar capabilities. |
| • | Continue to Extend Our Customized Optics and Glass Vertical Integration: We will continue to extend our vertical integration into customized optics and glass in order to gain greater access to key components used in the complex products we manufacture as well as to continue our diversification into new markets. We believe our customized optics and glass capabilities are highly complementary to our optical and electro-mechanical manufacturing services, and we intend to continue to market these products to our existing manufacturing services customers. In addition, we intend to continue our focus on customized optics and glass through further investment into research and development, as well as through potential acquisitions in what remains a highly fragmented market. |
| • | Evaluate Potential Strategic Alternatives such as Acquisitions and Joint Ventures: We will continue to evaluate opportunities to further expand our manufacturing capabilities and diversify our end-markets through the evaluation of various acquisition and joint venture opportunities around the globe. |
| • | Broaden Our Client Base Geographically: Our manufacturing services are incorporated into products that are distributed in markets worldwide, but we intend to further build out our client base in strategic regions. We intend to focus on expanding our client base in Europe, Asia-Pacific, and the United States. We believe these regions have a large and robust optics market, as well as a need for advanced manufacturing services in other growth markets, and would benefit from our precision optical and electromechanical manufacturing services. |
Service Offerings
We offer integrated precision optical, electro-mechanical, and electronic manufacturing services and customized optics and glass fabrication services for our OEM customers.
Precision Optical, Electro-Mechanical, and Electronic Manufacturing Services
Process Design and Engineering
We continuously analyze our customers’ product designs for cost and manufacturability improvements. We perform detailed design for manufacturability studies and design of experiments to assist in optimizing a product’s design for the lowest cost possible without compromising the quality specifications of form, fit and function. In the case of a new product design, we may assist in assembling one or more prototype products using the same production line and the same engineering and manufacturing teams that would be used for product qualification and volume production. We often transfer production from a customer’s internal prototype or production lines to our own facilities, requiring a copy-exact: the setup of a production process identical to the one used by our customer to minimize the number of variables and expedite qualification.
6
Table of Contents
Advanced Optical Packaging
We have a dedicated team of experienced engineers supporting our advanced optical packaging development capabilities. These highly qualified engineers work closely with our customers to understand the development requirements of their new products and assist them to build prototypes, as well as source materials, optimize manufacturing processes and develop schedules to bring these products to volume production. We maintain a real-time roadmap for the packaging requirements of our customers and the industry in general. Our advanced packaging team develops and maintains generic recipes that are readily available to be tailored and refined for the specific new applications of our customers, which helps to further accelerate prototype development and product delivery time.
Printed Circuit Board Assembly (PCBA) and Test
Printed circuit board assembly involves attaching electronic components, such as integrated circuits, capacitors, receivers, transceivers and other components and modules to printed circuit boards. We employ a variety of mounting and assembly technologies, including SMT, PTH and ACT, press-fit, and other connection processes that are focused on miniaturization and increasing the density of component placement on printed circuit boards. These technologies, which support the needs of our customers to provide greater functionality in smaller products, include chip-scale packaging, ball grid array, direct chip attach and high density interconnect. We perform in-circuit, functional and environmental testing of printed circuit board assemblies to verify all components are properly inserted, attached and the electrical circuits are complete, and that the board or assembly operates in accordance with its final design and manufacturing specifications.
Dedicated New Product Introduction (NPI)
We are committed to providing dedicated new product introduction (NPI) capabilities designed to ensure that our customers’ products get to market as quickly as possible. Co-locating strong engineering services in process design, prototyping, DFM and test at these locations gives customers as full suite of NPI services for quick turn PCBA to box-build to full system assembly. Stringent IP protection protocols are strictly enforced throughout the entire process, safeguarding our customers’ intellectual property. Our NPI sites are outfitted with state-of-the-art production equipment that mirrors the equipment used in our low-cost manufacturing facilities, ensuring a fast, smooth transition to a low-cost production environment once the product is qualified.
Qualifications
Production line and environmental qualifications require a variety of process engineering and technical skills, and the use of specialized equipment. Many of the products that we produce for our customers require extensive environmental and reliability qualification involving, in some cases, a three to six months or longer duration prior to volume production. The qualification phase may include a customer’s certification of a production line or process and one or a series of qualification tests for mechanical integrity and environmental endurance as specified by an industry standards organization, such as Telcordia for telecommunication equipment. We have extensive expertise in the planning, executing, troubleshooting and ultimate success of these qualifications and testing environments, which provides our customers a higher likelihood of completing these qualifications in a timely fashion.
Continuous Improvement and Optimization
Once we have completed the qualification phase and stabilized production yields, we shift our focus to cost and quality optimization. This requires a close working relationship with our customer to optimize processes and identify alternative sources for materials to improve efficiency, yields and cost. Design and process improvements may include reducing the number of parts, simplifying the assembly process, eliminating non-value add operations, using standard materials and optimizing manufacturing lines.
7
Table of Contents
Supply Chain and Inventory Management
Our expertise in supply chain and materials management often allows us to further reduce costs and cycle times for our customers. Our procurement and materials management services include planning, purchasing, expediting, warehousing and financing materials from thousands of suppliers. We have created a proprietary set of automated manufacturing resource planning tools to manage our inventory. We have also implemented inventory management strategies with certain suppliers that enable us to use inventory on an as-needed basis and provide on-site stocking programs.
Quality Control
We believe the integration of our manufacturing and test controls, quality systems, and software platforms contribute significantly to our ability to deliver high-quality products on a consistent basis and reduce the risk that we will be required to repair or replace defective products. Our manufacturing execution system (MES) is directly integrated with our test system and enterprise resource planning (ERP) database allowing us to respond to any process deviations in real time. We work with customers to develop product-specific test strategies. We also provide a variety of test management services, including material and process testing and reliability testing. In addition to providing yield, manufacturing data tracking and other information, our data tracking system also performs process route checking to ensure that the products follow correct process steps, and the test results meet all specified criteria. Our test capabilities include traditional printed-circuit board assembly (PCBA) testing, mechanical testing and optical testing, which includes parametric testing, such as insertion loss, return loss and extinction ratio, and functional testing (e.g., bit error ratio).
Customized Glass and Crystal Optics Fabrication
We design and fabricate our own customized glass and crystal optics, which are core components of the higher level assemblies that we manufacture for our customers. Our fabrication facilities are located in Fuzhou, China and Mountain Lakes, New Jersey. Our customized glass and crystal optics products include the following:
| • | Fiber Optic Ferrules and Alignment Sleeves; Fiber Optic Substrates; Precision Glass Tubing, Precision Capillaries and Rods: These single bore and multi-bore products, in various shapes and dimensions, are used principally in optical communications, medical and industrial applications. |
| • | Laser Optics: Includes crystals (such as YVO4, Nd: YVO4, Cr: YAG, and BBO), optics, high reflectivity mirrors, lenses, prisms and windows used in laser applications. |
| • | Medical Optics: Includes mirrors, lenses, filters, waveplates, windows, and prisms incorporated into various medical equipment products. |
| • | Storage Optics: Includes mirrors, polarizing beam splitters or PBS, and waveplates incorporated into optical storage products. |
| • | Surveying Optics: Includes penta prisms, corner cubes, and T-Windows incorporated into precision surveying products. |
| • | Telecom Optics: Includes lenses (such as spherical, a-spherical, C-lens, and cylindrical), waveplates, mirrors, prisms, filters and YVO4 crystals used for telecommunications applications. |
| • | Telecommunication Subassemblies: Includes fiber pigtails (both single and dual), assemblies and collimators used in many fiber optic components such as isolators, circulators, optical switches and three-port filters. |
Technology
Based on our experience with customers and our qualitative assessment of our capabilities, we believe we provide a broader array of process technologies to the optics industry than any other manufacturing services provider. We also continue to invest in customized optics and glass technology including in the areas of crystal
8
Table of Contents
growth, crystal and glass processing, optical coating, polishing and lapping, optical assemblies and precision glass drawing. We intend to continue to increase our process engineering capabilities and manufacturing technologies to extend our product portfolio and continue to gain market share in the optics industry.
Our internally developed and licensed technologies include the following:
| • | Advanced Optical Packaging: We have extensive experience in developing manufacturing processes and performing value engineering to improve our customers’ product performance, quality, reliability and manufacturing yields. In many cases, we partner with our customers to develop custom manufacturing solutions for their optics products. |
| • | Reliability Testing: Our reliability laboratory enables us to test the degree to which our results and specifications conform to our customers’ requirements. Through the reliability laboratory, we are able to perform most of the tests required by industry standards, including damp heat, thermal aging, thermal shock, temperature cycling, shock and vibration, accelerated life testing and stress screening. The reliability laboratory is critical to verification of root cause failure analysis. |
| • | Optical and Mechanical Material and Process Analysis: Our in-house material and process laboratory analyzes materials to support incoming inspection, process development, process monitoring, failure analysis and verification of compliance with the applicable environmental standards. |
| • | Precision Optical Fiber and Electro-Mechanical Assembly: We have extensive experience in precision optical and electro-mechanical assemblies in clean room environments, clean room control discipline, cleaning technologies and electro-static discharge (ESD) protection. |
| • | Fiber Metallization and Lensing: We use our fiber metallization and fiber lensing capabilities to assist our customers in packaging their products. Many optical component package designs require metallized fiber and some designs also require lensing at the tip of the fiber. We have in-house capabilities that enable us to produce these products at a low cost, with short lead times and high quality. |
| • | Fiber Handling and Fiber Alignment: The technique with which optical fiber is handled can have a significant impact on the functionality and reliability of optics products due to the risk of damage or flaws introduced to the fiber surface or micro-cracks to the core of the fiber, which may impact alignment or signal quality, among other things. We have implemented a number of processes, techniques, and best practices to avoid stressing or otherwise damaging fiber during stripping, cleaving and connectorization. Such techniques are also designed to achieve optimal alignment of fiber in the shortest period of time during these processes. |
| • | Optical Testing: We have the capability to perform parametric and functional tests for a wide variety of optical devices. In many cases, we are also able to help our customers develop their own proprietary software and test fixtures. |
| • | Crystal Growth and Processing: Our crystal growth technology produces non-linear optical crystals and crystals used in laser applications. Our processing capabilities include dicing, grinding, polishing and inspection with high dimension, tolerance and surface quality. |
| • | Precision Glass Drawing: We have developed the specialized capabilities necessary to draw precision structures within tight tolerances using borosilicate, clear fused quartz and synthetic fused silica glass. Using these processes, we produce customized rectangular and circular glass tubes and rods in various configurations and with multiple bores that are accurately drawn in precise locations within the tubing. These tubes can be sliced into thin wafers for use in various applications, such as ultra-filtration of bacteria, micro-organism counting, and identification of organisms and substances. These tubes can also be cut into larger lengths to produce ferrules and sleeves for use in fiber optic communications components. |
9
Table of Contents
| • | Optical Coating: We provide a wide variety of coating from simple single layer anti-reflection coatings to complex multi-layer stacks. The types of coating we provide include anti-reflection, partial reflection and high reflection. |
We continuously invest in new and optimized processes to accommodate the next generation of optical devices, such as optical packaging, anti-reflective coating and complex printed circuit board technologies. We believe many of these manufacturing processes and technologies will be key to developing and commercializing the next generation of optical devices, which may include multi-function passive optics and photonic integrated circuits (which are devices that incorporate various optical components and modules into a packaged chip), receivers integrated with an optical amplifier, and active optical cabling. We also anticipate our customers will continue to desire our vertically integrated capabilities, designing customized optics and glass to be incorporated into optical components, modules and complete network or laser systems.
Customers, Sales and Marketing
The optical communications market we serve is highly concentrated. Therefore, we expect a significant percentage of our total revenues will continue to come from a small number of customers. During fiscal year 2015 and fiscal year 2014, we had two customers that each contributed 10% or more of our total revenues. These two customers together accounted for 30% and 46%, respectively, of our total revenues during such fiscal years.
The production of optical devices is characterized by a lengthy qualification process. In particular, the qualification and field testing of the products that we produce for our customers may take three to six months or longer to complete. Generally, we must qualify our production process with our customers, and the products that we manufacture must also meet the product quality requirements of our customers’ customers. While most of our customers do not purchase our services until they qualify the services and satisfactorily complete factory audits and vendor evaluations, we typically produce a test run of their products to demonstrate that the products we produce will meet their qualification standards in advance of receiving an order. As part of this process, our engineers work closely with the customer’s design and procurement teams. We believe that the rigorous product transfer and qualification processes, and the close relationships that we develop with our customers during those processes, results in greater visibility into product life cycles and longer-term customer engagements.
Backlog
We are substantially dependent on orders we receive and fill on a short-term basis. Although we often receive a 12-month forecast from our customers, our customer contracts do not provide any assurance of future sales, and sales are typically made pursuant to individual purchase orders that have short lead times and are subject to revision or cancellation. Because of the possibility of changes in delivery or acceptance schedules, cancellations of orders, returns or price reductions, we do not believe that backlog is a reliable indicator of our future revenues.
Suppliers of Raw Materials
Our manufacturing operations use a wide variety of optical, semiconductor, mechanical and electronic components, assemblies and raw materials. We generally purchase materials from our suppliers through standard purchase orders, as opposed to long-term supply agreements. We rely on sole-source suppliers for a number of critical materials. Some of these sole-source suppliers are small businesses, which presents risks to us based on their financial health and reliability, which we continually monitor. We have historically experienced supply shortages for various reasons, including reduced yields by our suppliers, which have prevented us from manufacturing products for our customers in a timely manner. While we continually undertake programs to ensure the long-term availability of raw materials, there can be no assurance that we will be successful in doing so or that we will not be subject to future supply constraints.
10
Table of Contents
Quality
We have an extensive quality management system that focuses on continual process improvement and achieving high levels of customer satisfaction. We employ a variety of enhanced statistical engineering techniques and other tools to improve product and service quality. In addition, we generally offer a warranty ranging from one to five years on the products that we assemble. Generally, this warranty is limited to our workmanship and our liability is capped at the price of the product.
Our quality management systems help to ensure that the products we provide to our customers meet or exceed industry standards. We maintain the following certifications: ISO9001 for Manufacturing Quality Management Systems; ISO14001 for Environmental Management Systems; TL9000 for Telecommunications Industry Quality Certification; ISO/TS16949 for Automotive Industry Quality Certification; ISO13485 for Medical Devices Industry Quality Certification; AS9100 for Aerospace Industry Quality Certification; and OHSAS18001 for Occupational Health and Safety Management Systems. We also maintain compliance with various additional standards imposed by the U.S. Food and Drug Administration, or FDA, with respect to the manufacture of medical devices.
In addition to these standards, we are committed to the deployment of sustainable manufacturing, lean initiatives, and continuous improvement throughout our operations. The implementation of lean manufacturing initiatives helps improve efficiency and reduce waste in the manufacturing process in areas such as inventory on hand, set up times, and floor space and the number of people required for production, while Kaizen and Six Sigma ensures continuous improvement by reducing process variation.
Competition
Although the manufacturing services market is highly competitive, we believe that there are significant barriers to entry in our existing and target markets, including lengthy sales cycles, the need to demonstrate complex precision optical and electro-mechanical engineering and manufacturing capabilities to a prospective customer and the ability to protect a customer’s intellectual property.
Our overall competitive position depends upon a number of factors, including:
| • | our manufacturing technologies and capacity; |
| • | the quality of our manufacturing processes and products; |
| • | our supply chain tools and data management systems; |
| • | our ability to safeguard and protect our customers’ intellectual property; |
| • | our engineering and prototyping capabilities; |
| • | our ability to strengthen and broaden our engineering services and know-how to participate in the growth of emerging technologies; |
| • | our ability to deliver on-time; |
| • | our ability to deliver continuous cost improvements; and |
| • | our responsiveness and flexibility. |
Competitors in the market for optical manufacturing services include Benchmark Electronics, Inc., Celestica Inc., Sanmina-SCI Corporation and Venture Corporation Limited, as well as the internal manufacturing capabilities of our customers. Our customized optics and glass operations face competition from companies such as Browave Corporation, Fujian Castech Crystals, Inc., Photop Technologies, Inc. and Research Electro-Optic, Inc.
11
Table of Contents
Intellectual Property
Our success depends, in part, on our ability to protect our customers’ intellectual property. We license various technologies from our customers on a non-exclusive, royalty-free, non-transferable basis for the sole purpose of allowing us to manufacture products for those customers in accordance with their specifications. We have no rights to disclose, use, sublicense or sell this licensed technology for any other purpose. The duration of these licenses is limited to the duration of the underlying supply or manufacturing agreement. To meet the demands of certain customers, we created a factory-within-a-factory manufacturing environment that physically separates the manufacturing sites from one another. Some customers, for example, demand anonymity at our facilities while other customers require additional security measures such as biometric devices to safeguard their segregated manufacturing areas.
We regard our own manufacturing process technologies and customized optics and glass designs as proprietary intellectual property. We own any process engineering technology independently developed in-house by our technical staff. As part of our manufacturing services, to the extent we utilize our own manufacturing process technologies in the manufacture of our customers’ products, we grant our customers a royalty-free license to these process engineering technologies for the purpose of allowing our customers to make their products. Any process engineering or other improvements that we develop in connection with the improvement or optimization of a process for the manufacturing of a customer’s products are immediately assigned to that customer. To protect our proprietary rights, we rely largely upon a combination of trade secrets, non-disclosure agreements and internal security systems. Historically, patents have not played a significant role in the protection of our proprietary rights. Nevertheless, we currently have a relatively small number of solely-owned and jointly-held PRC patents in various customized optic technologies with expiration dates between 2015 and 2032. We believe that both our evolving business practices and industry trends may result in the continued growth of our patent portfolio and its importance to us, particularly as we expand our business.
Environmental Regulation
We are subject to a variety of international and U.S. laws and other legal requirements relating to the use, disposal, cleanup of and human exposure to, hazardous materials. To date, such laws and regulations have not materially affected our business. We do not anticipate any material capital expenditures for environmental control facilities for the foreseeable future. While to date we are not aware of any material exposures, there can be no assurance that environmental matters will not arise in the future or that costs will not be incurred with respect to sites as to which no problem is currently known.
Social Responsibility
Our corporate social responsibility practices focus on creating better social, economic and environmental outcomes for all stakeholders in the global electronics supply chain. These outcomes include: improved conditions for workers, increased efficiency and productivity for customers and suppliers, economic development, and a clean environment for our communities. We are committed to implementing programs that focus on driving continuous improvements in social, ethical, and environmental compliance throughout all of our global operating units in accordance with our Code of Business Conduct. As a guide to achieve this end, we look at principles, policies and standards as prescribed by the Electronics Industry Citizenship Coalition (“EICC”), an association of global electronics companies whose mission is to enable companies to improve the social and environmental conditions in the global supply chain. Fabrinet is a full member of the EICC.
Corporate Structure
Fabrinet was incorporated under the laws of the Cayman Islands in August 1999 and commenced business operations in January 2000. We have nine subsidiaries, all of which are wholly-owned.
12
Table of Contents
We incorporated Fabrinet Co., Ltd. and Fabrinet USA, Inc., a California corporation, in 1999. We incorporated FBN New Jersey Manufacturing, Inc. (or Vitrocom), a Delaware corporation, and acquired Fabrinet China Holdings (Mauritius Island) and CASIX, Inc. (People’s Republic of China) in 2005. We incorporated Fabrinet Pte., Ltd. (Singapore) in 2007. We incorporated Fabrilink SEZC (the Cayman Islands) and Fabrinet West, Inc. and Fabritek, Inc., California corporations, in 2015.
As the parent company, we enter into contracts directly with our customers, and have entered into various inter-company agreements with some of our subsidiaries, while Casix and Vitrocom each enter into sales contracts or purchase orders directly with their customers. We have inter-company agreements with Fabrinet Co., Ltd., and Vitrocom, whereby each provides manufacturing services to us. We also have inter-company agreements with Fabrinet USA, Inc., and Fabrinet Pte., Ltd. to provide us with certain administrative and business development services.
Employees
As of June 26, 2015, we had approximately 6,845 full-time employees located in Thailand, the PRC, North America, Europe, and the Cayman Islands. As of June 26, 2015, we had approximately 5,860 full-time employees located in Thailand, approximately 5,740 of whom were engaged in manufacturing operations and approximately 120 of whom were engaged in general and administrative functions. As of June 26, 2015, we had approximately 910 full-time employees located in the PRC, approximately 860 of whom were engaged in manufacturing operations and 50 of whom were engaged in general and administrative functions. As of June 26, 2015, we had approximately 70 full-time employees located in the United States, approximately 50 of whom were engaged in manufacturing operations and 20 of whom were engaged in general and administrative functions. As of June 26, 2015, we had 5 full-time employees located in Europe and the Cayman Islands, which were engaged in business development and administrative activities. None of our employees are represented by a labor union. We have not experienced any work stoppages, slowdowns, or strikes. We consider our relations with our employees to be positive.
Available Information
Our website is located at www.Fabrinet.com. The information posted on our website is not incorporated into this Annual Report on Form 10-K. Our Annual Report on Form 10-K, Quarterly Reports on Form 10-Q, Current Reports on Form 8-K and amendments to reports filed or furnished pursuant to Sections 13(a) and 15(d) of the Securities Exchange Act of 1934, as amended, are available free of charge through the “Investors” section of our website as soon as reasonably practicable after we electronically file such material with, or furnish it to, the U.S. Securities and Exchange Commission (SEC). You may also access all of our public filings through the SEC’s website at www.sec.gov. Further, a copy of this Annual Report on Form 10-K is located at the SEC’s Public Reference Room at 100 F Street, N.E., Washington, D.C. 20549. Information on the operation of the Public Reference Room can be obtained by calling the SEC at 1-800-SEC-0330.
13
Table of Contents
| ITEM 1A. | RISK FACTORS |
Investing in our ordinary shares involves a high degree of risk. You should carefully consider the following risks as well as the other information contained in this Annual Report on Form 10-K, including our consolidated financial statements and the related notes, before investing in our ordinary shares. The risks and uncertainties described below are not the only ones that we may face. Additional risks and uncertainties of which we are unaware, or that we currently deem immaterial, also may become important factors that affect us or our ordinary shares. If any of the following risks actually occur, they may harm our business, financial condition and operating results. In this event, the market price of our ordinary shares could decline and you could lose some or all of your investment.
Risks Related to Our Business
Our sales depend on and will continue to depend on a small number of customers. A reduction in orders from any of these customers, the loss of any of these customers, or a customer exerting significant pricing and margin pressures on us could harm our business, financial condition and operating results.
We have depended, and will continue to depend, upon a small number of customers for a significant percentage of our total revenues. During fiscal year 2015 and fiscal year 2014, we had two customers that each contributed 10% or more of our total revenues. These customers together accounted for 30% and 46% of our total revenues, respectively, during each of the last two fiscal years. Dependence on a small number of customers means that a reduction in orders from, a loss of, or other adverse actions by any one of these customers would reduce our revenues and could have a material adverse effect on our business, operating results and share price.
Further, our customer concentration increases the concentration of our accounts receivable and our exposure to payment default by any of our key customers. Many of our existing and potential customers have substantial debt burdens, have experienced financial distress or have static or declining revenues, all of which may be exacerbated by the recent conditions in the credit markets, and the continual uncertainty in the global economies. Certain of our customers have gone out of business, declared bankruptcy, been acquired, or announced their withdrawal from segments of the optics market. We generate significant accounts payable and inventory for the services that we provide to our customers, which could expose us to substantial and potentially unrecoverable costs if we do not receive payment from our customers.
Reliance on a small number of customers gives those customers substantial purchasing power and leverage in negotiating contracts with us. In addition, although we enter into master supply agreements with our customers, the level of business to be transacted under those agreements is not guaranteed. Instead, we are awarded business under those agreements on a project-by-project basis. Some of our customers have at times significantly reduced or delayed the volume of manufacturing services that they order from us. If we are unable to maintain our relationships with our existing significant customers, our business, financial condition and operating results could be harmed.
Natural disasters, including the 2011 flooding in Thailand, epidemics, acts of terrorism and other political and economic developments could harm our business, financial condition, and operating results.
Natural disasters, such as the October and November 2011 flooding in Thailand, where most of our manufacturing operations are located, could severely disrupt our manufacturing operations and increase our supply chain costs. These events, over which we have little or no control, could cause a decrease in demand for our services, make it difficult or impossible for us to manufacture and deliver products and for our suppliers to deliver components allowing us to manufacture those products, require large expenditures to repair or replace our facilities, or create delays and inefficiencies in our supply chain. For example, the October and November 2011 flooding in Thailand forced us to temporarily shut down all of our manufacturing facilities in Thailand and cease production permanently at our Chokchai facility in Thailand, which adversely affected our ability to meet our customers’ demands during fiscal year 2012. In some countries in which we operate, including the PRC and
14
Table of Contents
Thailand, potential outbreaks of infectious diseases such as the H1N1 influenza virus, severe acute respiratory syndrome (SARS) or bird flu could disrupt our manufacturing operations, reduce demand for our customers’ products and increase our supply chain costs. In addition, increased international political instability, evidenced by the threat or occurrence of terrorist attacks, enhanced national security measures, conflicts in the Middle East and Asia, strained international relations arising from these conflicts and the related decline in consumer confidence and economic weakness, may hinder our ability to do business. Any escalation in these events or similar future events may disrupt our operations and the operations of our customers and suppliers, and may affect the availability of materials needed for our manufacturing services. Such events may also disrupt the transportation of materials to our manufacturing facilities and finished products to our customers. These events have had, and may continue to have, an adverse impact on the U.S. and world economy in general, and customer
confidence and spending in particular, which in turn could adversely affect our total revenues and operating results. The impact of these events on the volatility of the U.S. and world financial markets also could increase the volatility of the market price of our ordinary shares and may limit the capital resources available to us, our customers and our suppliers.
We are not fully insured against all potential losses. Natural disasters or other catastrophes could adversely affect our business, financial condition and results of operations.
Our current property and casualty insurance covers loss or damage to our property and third-party property over which we have custody and control, as well as losses associated with business interruption, subject to specified exclusions and limitations such as coinsurance, facilities location sub-limits and other policy limitations and covenants. Even with insurance coverage, natural disasters or other catastrophic events, including acts of war, could cause us to suffer substantial losses in our operational capacity and could also lead to a loss of opportunity and to a potential adverse impact on our relationships with our existing customers resulting from our inability to produce products for them, for which we would not be compensated by existing insurance. This in turn could have a material adverse effect on our financial condition and results of operations.
If the optical communications market does not expand as we expect, our business may not grow as fast as we expect, which could adversely impact our business, financial condition and operating results.
Our future success as a provider of precision optical, electro-mechanical and electronic manufacturing services for the optical communications market depends on the continued growth of the optics industry and, in particular, the continued expansion of global information networks, particularly those directly or indirectly dependent upon a fiber optic infrastructure. As part of that growth, we anticipate that demand for voice, video, and other data services delivered over high-speed connections (both wired and wireless) will continue to increase. Without network and bandwidth growth, the need for enhanced communications products would be jeopardized. Currently, demand for network services and for high-speed broadband access, in particular, is increasing but growth may be limited by several factors, including, among others: (i) relative strength or weakness of the global economy or certain countries or regions, (ii) an uncertain regulatory environment, and (iii) uncertainty regarding long-term sustainable business models as multiple industries, such as the cable, traditional telecommunications, wireless and satellite industries, offer competing content delivery solutions. The optical communications market also has experienced periods of overcapacity, some of which have occurred even during periods of relatively high network usage and bandwidth demands. If the factors described above were to slow, stop or reverse the expansion in the optical communications market, our business, financial condition and operating results would be negatively affected.
15
Table of Contents
Our quarterly revenues, gross profit margins and operating results have fluctuated significantly and may continue to do so in the future, which may cause the market price of our ordinary shares to decline or be volatile.
Our quarterly revenues, gross profit margins, and operating results have fluctuated significantly and may continue to fluctuate significantly in the future. For example, any of the risks described in this “Risk Factors” section and, in particular, the following factors, could cause our quarterly and annual revenues, gross profit margins, and operating results to fluctuate from period to period:
| • | our ability to acquire new customers and retain our existing customers by delivering superior quality, cost, and customer service; |
| • | the cyclicality of the optical communications market, as well as the industrial lasers, medical, and sensors markets; |
| • | competition; |
| • | our ability to achieve favorable pricing for our services; |
| • | our ability to manage our headcount and other costs; and |
| • | changes in the relative mix in our revenues. |
Therefore, we believe that quarter-to-quarter comparisons of our operating results may not be useful in predicting our future operating results. You should not rely on our results for one quarter as any indication of our future performance. Quarterly variations in our operations could result in significant volatility in the market price of our ordinary shares.
If we are unable to continue diversifying our precision optical and electro-mechanical manufacturing services across other markets within the optics industry, such as the semiconductor processing, biotechnology, metrology and material processing markets, or if these markets do not grow as fast as we expect, our business may not grow as fast as we expect, which could adversely impact our business, financial condition and operating results.
We intend to continue diversifying across other markets within the optics industry, such as the semiconductor processing, biotechnology, metrology and material processing markets, to reduce our dependence on the optical communications market and to grow our business. Currently, the optical communications market contributes the majority of our revenues. There can be no assurance that our efforts to further expand and diversify into other markets within the optics industry will prove successful or that these markets will continue to grow as fast as we expect. In the event that the opportunities presented by these markets prove to be less than anticipated, if we are less successful than expected in diversifying into these markets, or if our margins in these markets prove to be less than expected, our growth may slow or stall, and we may incur costs that are not offset by revenues in these markets, all of which could harm our business, financial condition and operating results.
We face significant competition in our business. If we are unable to compete successfully against our current and future competitors, our business, financial condition and operating results could be harmed.
Our current and prospective customers tend to evaluate our capabilities against the merits of their internal manufacturing as well as the capabilities of third-party manufacturers. We believe the internal manufacturing capabilities of current and prospective customers are our primary competition. This competition is particularly strong when our customers have excess manufacturing capacity, as was the case when the markets that we serve experienced a significant downturn from 2001 through 2004 and again in 2008 and 2009, that resulted in underutilized capacity. Many of our potential customers continue to have excess manufacturing capacity at their facilities. In addition, as a result of the October and November 2011 flooding in Thailand, some of our customers began manufacturing products internally or using other third-party manufacturers that were not affected by the
16
Table of Contents
flooding. If our customers choose to manufacture products internally rather than to outsource production to us, or choose to outsource to a third-party manufacturer, our business, financial condition and operating results could be harmed.
Competitors in the market for optical manufacturing services include Benchmark Electronics, Inc., Celestica Inc., Sanmina-SCI Corporation and Venture Corporation Limited. Our customized optics and glass operations face competition from companies such as Browave Corporation, Fujian Castech Crystals, Inc., Photop Technologies, Inc., and Research Electro-Optic, Inc. Other existing contract manufacturing companies, original design manufacturers or outsourced semiconductor assembly and test companies could also enter our target markets. In addition, we may face more competitors as we attempt to penetrate new markets.
Many of our customers and potential competitors have longer operating histories, greater name recognition, larger customer bases and significantly greater resources than we have. These advantages may allow them to devote greater resources than we can to the development and promotion of service offerings that are similar or superior to our service offerings. These competitors may also engage in more extensive research and development, undertake more far-reaching marketing campaigns, adopt more aggressive pricing policies or offer services that achieve greater market acceptance than ours. These competitors may also compete with us by making more attractive offers to our existing and potential employees, suppliers and strategic partners. Further, consolidation in the optics industry could lead to larger and more geographically diverse competitors. New and increased competition could result in price reductions for our services, reduced gross profit margins or loss of market share. We may not be able to compete successfully against our current and future competitors, and the competitive pressures we face may harm our business, financial condition and operating results.
Cancellations, delays or reductions of customer orders and the relatively short-term nature of the commitments of our customers could harm our business, financial condition and operating results.
We do not typically obtain firm purchase orders or commitments from our customers that extend beyond 13 weeks. While we work closely with our customers to develop forecasts for periods of up to one year, these forecasts are not fully binding and may be unreliable. Customers may cancel their orders, change production quantities from forecasted volumes or delay production for a number of reasons beyond our control. Any material delay, cancellation or reduction of orders could cause our revenues to decline significantly and could cause us to hold excess materials. Many of our costs and operating expenses are fixed. As a result, a reduction in customer demand could decrease our gross profit and harm our business, financial condition and operating results.
In addition, we make significant decisions, including production schedules, material procurement commitments, personnel needs and other resource requirements, based on our estimate of our customers’ requirements. The short-term nature of our customers’ commitments and the possibility of rapid changes in demand for their products reduce our ability to accurately estimate the future requirements of our customers. Inability to forecast the level of customer orders with certainty makes it difficult to allocate resources to specific customers, order appropriate levels of materials and maximize the use of our manufacturing capacity. This could also lead to an inability to meet a spike in production demand, all of which could harm our business, financial condition and operating results.
Our exposure to financially troubled customers or suppliers could harm our business, financial condition and operating results.
We provide manufacturing services to companies, and rely on suppliers, that have in the past and may in the future experience financial difficulty, particularly in light of recent conditions in the credit markets and the overall economy that affected access to capital and liquidity. As a result, we devote significant resources to monitor receivables and inventory balances with certain of our customers. If our customers experience financial difficulty, we could have difficulty recovering amounts owed to us from these customers, or demand for our
17
Table of Contents
services from these customers could decline. If our suppliers experience financial difficulty, we could have trouble sourcing materials necessary to fulfill production requirements and meet scheduled shipments. Any such financial difficulty could adversely affect our operating results and financial condition by resulting in a reduction in our revenues, a charge for inventory write-offs, a provision for doubtful accounts, and an increase in working capital requirements due to increases in days in inventory and in days in accounts receivable. For example, in July 2014, one of our customers filed for bankruptcy protection under the Local Trade Court in France; however, the potential losses from this particular customer did not have a significant effect on our consolidated financial statements.
Fluctuations in foreign currency exchange rates and changes in governmental policies regarding foreign currencies could increase our operating costs, which would adversely affect our operating results.
Volatility in the functional and non-functional currencies of our entities and the U.S. dollar could seriously harm our business, financial condition and operating results. The primary impact of currency exchange fluctuations is on our cash, receivables and payables of our operating entities. We may experience significant unexpected expenses from fluctuations in exchange rates.
Our customer contracts generally require that our customers pay us in U.S. dollars. However, the majority of our payroll and other operating expenses are paid in Thai Baht. As a result of these arrangements, we have significant exposure to changes in the exchange rate between the Thai Baht and the U.S. dollar, and our operating results are adversely impacted when the U.S. dollar depreciates relative to the Thai Baht and other currencies. We have experienced such depreciation in the U.S. dollar as compared with the Thai Baht, and our results have been adversely impacted by this fluctuation in exchange rates. Further, while we attempt to hedge against certain exchange rate risks, we typically enter into hedging contracts with durations of one to six months, leaving us exposed to longer term changes in exchange rates.
Also, we have significant exposure to changes in the exchange rate between the RMB and the U.S. dollar. The expenses of our PRC subsidiary are denominated in RMB. Currently, RMB are convertible in connection with trade- and service-related foreign exchange transactions, foreign debt service and payment of dividends. The PRC government may at its discretion restrict access in the future to foreign currencies for current account transactions. If this occurs, our PRC subsidiary may not be able to pay us dividends in U.S. dollars without prior approval from the PRC State Administration of Foreign Exchange. In addition, conversion of RMB for most capital account items, including direct investments, is still subject to government approval in the PRC. This restriction may limit our ability to invest the earnings of our PRC subsidiary. As of June 26, 2015, the U.S. dollar had appreciated approximately 0.5% against the RMB since June 28, 2013. There remains significant international pressure on the PRC government to adopt a substantially more liberalized currency policy. Any further appreciation in the value of the RMB against the U.S. dollar could negatively impact our operating results.
We purchase some of the critical materials used in certain of our products from a single source or a limited number of suppliers. Supply shortages have in the past, and could in the future, impair the quality, reduce the availability or increase the cost of materials, which could harm our revenues, profitability and customer relations.
We rely on a single source or a limited number of suppliers for critical materials used in a significant number of the products we manufacture. We generally purchase these single or limited source materials through standard purchase orders and do not maintain long-term supply agreements with our suppliers. We generally use a rolling 12 month forecast based on anticipated product orders, customer forecasts, product order history, backlog, and warranty and service demand to determine our materials requirements. Lead times for the parts and components that we order vary significantly and depend on factors such as manufacturing cycle times, manufacturing yields and the availability of raw materials used to produce the parts or components. Historically, we have experienced supply shortages resulting from various causes, including reduced yields by our suppliers,
18
Table of Contents
which prevented us from manufacturing products for our customers in a timely manner. Our revenues, profitability and customer relations could be harmed by a stoppage or delay of supply, a substitution of more expensive or less reliable parts, the receipt of defective parts or contaminated materials, an increase in the price of supplies, or an inability to obtain reduction in price from our suppliers in response to competitive pressures.
We continue to undertake programs to strengthen our supply chain. Nevertheless, we are experiencing, and expect for the foreseeable future to continue to experience, strain on our supply chain and periodic supplier problems. We have incurred, and expect to continue to incur for the foreseeable future, costs to address these problems.
Managing our inventory is complex and may require write-downs due to excess or obsolete inventory, which could cause our operating results to decrease significantly in a given fiscal period.
Managing our inventory is complex. We are generally required to procure material based upon the anticipated demand of our customers. The inaccuracy of these forecasts or estimates could result in excess supply or shortages of certain materials. Inventory that is not used or expected to be used as and when planned may become excess or obsolete. Generally, we are unable to use most of the materials purchased for one of our customers to manufacture products for any of our other customers. Additionally, we could experience reduced or delayed product shipments or incur additional inventory write-downs and cancellation charges or penalties, which would increase costs and could harm our business, financial condition and operating results. While our agreements with customers are structured to mitigate our risks related to excess or obsolete inventory, enforcement of these provisions may result in material expense and delay in payment for inventory. If any of our significant customers becomes unable or unwilling to purchase inventory or does not agree to such contractual provisions in the future, our business, financial condition and operating results may be harmed.
We conduct operations in a number of countries, which creates logistical and communications challenges for us and exposes us to other risks that could harm our business, financial condition and operating results.
The vast majority of our operations, including manufacturing and customer support, are located primarily in the Asia-Pacific region. The distances between Thailand, the PRC and our customers and suppliers globally, create a number of logistical and communications challenges for us, including managing operations across multiple time zones, directing the manufacture and delivery of products across significant distances, coordinating the procurement of raw materials and their delivery to multiple locations and coordinating the activities and decisions of our management team, the members of which are based in different countries.
Our customers are located throughout the world. Total revenues from the bill-to-location of customers outside of North America accounted for 52.1%, 51.8% and 53.3% of our total revenues for fiscal year 2015, fiscal year 2014, and fiscal year 2013, respectively. We expect that total revenues from the bill-to-location of customers outside of North America will continue to account for a significant portion of our total revenues. Our customers also depend on international sales, which further exposes us to the risks associated with international operations. In addition, our international operations and sales subject us to a variety of domestic and foreign trade regulatory requirements.
Political unrest and demonstrations, as well as changes in the political, social, business or economic conditions in Thailand, could harm our business, financial condition and operating results.
The majority of our assets and manufacturing operations are located in Thailand. Therefore, political, social, business and economic conditions in Thailand have a significant effect on our business. In March 2015, Thailand was assessed as a medium-high political risk by AON Political Risk, a risk management, insurance and consulting firm. Any changes to tax regimes, laws, exchange controls or political action in Thailand may harm our business, financial condition and operating results.
19
Table of Contents
Thailand has a history of political unrest that includes the involvement of the military as an active participant in the ruling government. In recent years, political unrest in the country has sparked political demonstrations and, in some instances, violence. In March 2010, protestors held anti-government demonstrations calling for new elections. These demonstrations in Bangkok and other parts of Thailand resulted in the country’s worst political violence in nearly two decades with numerous deaths and injuries, as well as destruction of property. Certain hotels and businesses in Bangkok were closed for weeks as the protestors occupied Bangkok’s commercial center, and governments around the world issued travel advisories urging their citizens to avoid non-essential travel to Bangkok. In December 2013, anti-government protesters known as the People’s Democratic Reform Committee (PDRC) began campaigning for people to join the shutdown of Bangkok and calling for reform before a new election. As a result, certain government agencies in Bangkok were closed and demonstrations continued into the first half of 2014. The ongoing political stalemate reached a culmination on May 22, 2014, when the Thai military took over the government in a coup, and it continues to rule the country today. It is unknown how long it may take for the current political situation to be resolved and for democracy to be restored, or what effects the current political situation may have on Thailand and the surrounding region.
Any succession crisis in the Kingdom of Thailand could cause new or increased political instability. In the event that a violent coup were to occur or the current political instability were to worsen, such activity could prevent shipments from entering or leaving the country and disrupt our ability to manufacture products in Thailand, and we could be forced to transfer our manufacturing activities to more stable, and potentially more costly, regions. Further, the Thai government recently raised the minimum wage standards for labor and could repeal certain promotional certificates that we have received or tax holidays for certain export and value added taxes that we enjoy, either preventing us from engaging in our current or anticipated activities or subjecting us to higher tax rates. A new regime could nationalize our business or otherwise seize our assets and any other future political instability, such as the recent coup, could harm our business, financial condition and operating results.
We expect to continue to invest in our manufacturing operations in the PRC, which will continue to expose us to risks inherent in doing business in the PRC, any of which risks could harm our business, financial condition and operating results.
We anticipate that we will continue to invest in our customized optics manufacturing facilities located in Fuzhou, China. Because these operations are located in the PRC, they are subject to greater political, legal and economic risks than the geographies in which the facilities of many of our competitors and customers are located. In particular, the political and economic climate in the PRC (both at national and regional levels) is fluid and unpredictable. In March 2015, AON Political Risk assessed the PRC as a medium-high political risk. A large part of the PRC’s economy is still being operated under varying degrees of control by the PRC government. By imposing industrial policies and other economic measures, such as control of foreign exchange, taxation, import and export tariffs, environmental regulations, land use rights, intellectual property and restrictions on foreign participation in the domestic market of various industries, the PRC government exerts considerable direct and indirect influence on the development of the PRC economy. Many of the economic reforms carried out by the PRC government are unprecedented or experimental and are expected to change further. Any changes to the political, legal or economic climate in the PRC could harm our business, financial condition and operating results.
Our PRC subsidiary is a “wholly foreign-owned enterprise” and is therefore subject to laws and regulations applicable to foreign investment in the PRC, in general, and laws and regulations applicable to wholly foreign-owned enterprises, in particular. The PRC has made significant progress in the promulgation of laws and regulations pertaining to economic matters such as corporate organization and governance, foreign investment, commerce, taxation and trade. However, the promulgation of new laws, changes in existing laws and abrogation of local regulations by national laws may have a negative impact on our business and prospects. In addition, these laws and regulations are relatively new, and published cases are limited in volume and non-binding. Therefore, the interpretation and enforcement of these laws and regulations involve significant uncertainties. Laws may be changed with little or no prior notice, for political or other reasons. These uncertainties could limit the legal protections available to foreign investors. Furthermore, any litigation in the PRC may be protracted and result in substantial costs and diversion of resources and management’s attention.
20
Table of Contents
Our business and operations would be adversely impacted in the event of a failure of our information technology infrastructure and/or cyber security attacks.
We rely upon the capacity, availability, and security of our information technology hardware and software infrastructure. For instance, we use a combination of standard and customized software platforms to manage, record, and report all aspects of our operations and, in many instances, enable our customers to remotely access certain areas of our databases to monitor yields, inventory positions, work-in-progress status and vendor quality data. We are constantly expanding and updating our information technology infrastructure in response to our changing needs. Any failure to manage, expand and update our information technology infrastructure or any failure in the operation of this infrastructure could harm our business.
Despite our implementation of security measures, our systems are vulnerable to damages from computer viruses, natural disasters, unauthorized access and other similar disruptions. Any system failure, accident or security breach could result in disruptions to our operations. To the extent that any disruptions, cyber-attack or other security breach results in a loss or damage to our data, or inappropriate disclosure of confidential information, it could harm our business. In addition, we may be required to incur significant costs to protect against damage caused by these disruptions or security breaches in the future.
Consolidation in the markets we serve could harm our business, financial condition and operating results.
Consolidation in the markets we serve has resulted in a reduction in the number of potential customers for our services. In July 2012, Oclaro and Opnext, Inc., both of which were our customers at the time, merged. In some cases, consolidation among our customers has led to a reduction in demand for our services as customers acquired the capacity to manufacture products in-house.
Consolidation among our customers and their customers may continue and may adversely affect our business, financial condition and operating results in several ways. Consolidation among our customers and their customers may result in a smaller number of large customers whose size and purchasing power give them increased leverage that may result in, among other things, decreases in our average selling prices. In addition to pricing pressures, this consolidation may also reduce overall demand for our manufacturing services if customers obtain new capacity to manufacture products in-house or discontinue duplicate or competing product lines in order to streamline operations. If demand for our manufacturing services decreases, our business, financial condition and operating results could be harmed.
Unfavorable worldwide economic conditions may negatively affect our business, operating results and financial condition.
Volatility and disruption in the capital and credit markets, depressed consumer confidence, and negative global economic conditions have affected levels of business and consumer spending. Concerns about the potential default of various national bonds and debt backed by individual countries as well as the politics impacting these, could negatively impact the U.S. and global economies and adversely affect our financial results. In particular, recent economic uncertainty in Europe has led to reduced demand in some of our customers’ optical communications product portfolios. If economic conditions in Europe do not recover or if they continue to deteriorate, our operating results could be harmed.
Uncertainty about worldwide economic conditions poses a risk as businesses may further reduce or postpone spending in response to reduced budgets, tight credit, negative financial news and declines in income or asset values, which could adversely affect our business, financial condition and results of operations and increase the volatility of our share price. In addition, our ability to access capital markets may be restricted, which could have an impact on our ability to react to changing economic and business conditions and could also adversely affect our results of operations and financial condition.
21
Table of Contents
If we fail to adequately expand our manufacturing capacity, we will not be able to grow our business, which would harm our business, financial condition and operating results. Conversely, if we expand too much or too rapidly, we may experience excess capacity, which would harm our business, financial condition and operating results.
We may not be able to pursue many large customer orders or sustain our historical growth rates if we do not have sufficient manufacturing capacity to enable us to commit to provide customers with specified quantities of products. If our customers do not believe that we have sufficient manufacturing capacity, they may: (i) outsource all of their production to another source that they believe can fulfill all of their production requirements; (ii) look to a second source for the manufacture of additional quantities of the products that we currently manufacture for them; (iii) manufacture the products themselves; or (iv) otherwise decide against using our services for their new products.
We most recently expanded our manufacturing capacity with the purchase of land and a building in Santa Clara, California. We may continue to devote significant resources to the expansion of our manufacturing capacity, and any such expansion will be expensive, will require management’s time and may disrupt our operations. In the event we are unsuccessful in our attempts to expand our manufacturing capacity, our business, financial condition and operating results could be harmed.
However, if we expand our manufacturing capacity and are unable to promptly utilize the additional space due to reduced demand for our services, an inability to win new projects, new customers or penetrate new markets, or if the optics industry does not grow as we expect, we may experience periods of excess capacity, which could harm our business, financial condition and operating results.
We may experience manufacturing yields that are lower than expected, potentially resulting in increased costs, which could harm our business, operating results and customer relations.
Manufacturing yields depend on a number of factors, including the following:
| • | the quality of input, materials and equipment; |
| • | the quality and feasibility of our customer’s design; |
| • | the repeatability and complexity of the manufacturing process; |
| • | the experience and quality of training of our manufacturing and engineering teams; and |
| • | the monitoring of the manufacturing environment. |
Lower volume production due to continually changing designs generally results in lower yields. Manufacturing yields and margins can also be lower if we receive or inadvertently use defective or contaminated materials from our suppliers. In addition, our customer contracts typically provide that we will supply products at a fixed price each quarter, which assumes specific production yields and quality metrics. If we do not meet the yield assumptions and quality metrics used in calculating the price of a product, we may not be able to recover the costs associated with our failure to do so. Consequently, our operating results and profitability may be harmed.
If the products that we manufacture contain defects, we could incur significant correction costs, demand for our services may decline and we may be exposed to product liability and product warranty claims, which could harm our business, financial condition, operating results and customer relations.
We manufacture products to our customers’ specifications, and our manufacturing processes and facilities must comply with applicable statutory and regulatory requirements. In addition, our customers’ products and the manufacturing processes that we use to produce them are often complex. As a result, products that we manufacture may at times contain manufacturing or design defects, and our manufacturing processes may be
22
Table of Contents
subject to errors or fail to be in compliance with applicable statutory or regulatory requirements. Additionally, not all defects are immediately detectible. The testing procedures of our customers are generally limited to the evaluation of the products that we manufacture under likely and foreseeable failure scenarios. For various reasons (including, among others, the occurrence of performance problems that are unforeseeable at the time of testing or that are detected only when products are fully deployed and operated under peak stress conditions), these products may fail to perform as expected after their initial acceptance by a customer.
We generally provide a warranty of between one to two years on the products that we manufacture for our customers. This warranty typically guarantees that products will conform to our customers’ specifications and be free from defects in workmanship. Defects in the products we manufacture, whether caused by a design, engineering, manufacturing or component failure or by deficiencies in our manufacturing processes and whether during or after the warranty period, could result in product or component failures, which may damage our business reputation, whether or not we are indemnified for such failures. We could also incur significant costs to repair or replace defective products under warranty, particularly when such failures occur in installed systems. In some instances, we may also be required to incur costs to repair or replace defective products outside of the warranty period in the event that a recurring defect is discovered in a certain percentage of a customer’s products delivered over an agreed upon period of time. We have experienced product or component failures in the past and remain exposed to such failures, as the products that we manufacture are widely deployed throughout the world in multiple environments and applications. Further, due to the difficulty in determining whether a given defect resulted from our customer’s design of the product or our manufacturing process, we may be exposed to product liability or product warranty claims arising from defects that are not our fault. In addition, if the number or type of defects exceeds certain percentage limitations contained in our contractual arrangements, we may be required to conduct extensive failure analysis, re-qualify for production or cease production of the specified products.
Product liability claims may include liability for personal injury or property damage. Product warranty claims may include liability to pay for a recall, repair or replacement of a product or component. Although liability for these claims is generally assigned to our customers in our contracts, even where they have assumed liability, our customers may not, or may not have the resources to, satisfy claims for costs or liabilities arising from a defective product. Additionally, under one of our contracts, in the event the products we manufacture do not meet the end-customer’s testing requirements or otherwise fail, we may be required to pay penalties to our customer, including a fee during the time period that the customer or end-customer’s production line is not operational as a result of the failure of the products that we manufacture, all of which could harm our business, operating results and customer relations. If we engineer or manufacture a product that is found to cause any personal injury or property damage or is otherwise found to be defective, we could incur significant costs to resolve the claim. While we maintain insurance for certain product liability claims, we do not maintain insurance for any recalls and, therefore, would be required to pay any associated costs that are determined to be our responsibility. A successful product liability or product warranty claim in excess of our insurance coverage or any material claim for which insurance coverage is denied, limited, is not available or has not been obtained could harm our business, financial condition and operating results.
If we are unable to meet regulatory quality standards applicable to our manufacturing and quality processes for the products we manufacture, our business, financial condition or operating results could be harmed.
As a manufacturer of products for the optics industry, we are required to meet certain certification standards, including the following: ISO9001 for Manufacturing Quality Management Systems; ISO14001 for Environmental Management Systems; TL9000 for Telecommunications Industry Quality Certification; ISO/TS16949 for Automotive Industry Quality Certification; ISO13485 for Medical Devices Industry Quality Certification; AS9100 for Aerospace Industry Quality Certification; and OHSAS18001 for Occupational Health and Safety Management Systems. We also maintain compliance with various additional standards imposed by the U.S. Food and Drug Administration, or FDA, with respect to the manufacture of medical devices.
23
Table of Contents
Additionally, we are required to register with the FDA and other regulatory bodies and are subject to continual review and periodic inspection for compliance with various requirements, which require manufacturers to adhere to certain regulations, including testing, quality control, and documentation procedures. We hold the following additional certifications: ANSI ESD S20.20 for facilities and manufacturing process control, in compliance with ESD standard; Transported Asset Protection Association, or TAPA, for Logistic Security Management System; and CSR-DIW for Corporate Social Responsibility in Thailand. In the European Union, we are required to maintain certain ISO certifications in order to sell our precision optical, electro-mechanical, and electronic manufacturing services and we must undergo periodic inspections by regulatory bodies to obtain and maintain these certifications. If any regulatory inspection reveals that we are not in compliance with applicable standards, regulators may take action against us, including issuing a warning letter, imposing fines on us, requiring a recall of the products we manufactured for our customers, or closing our manufacturing facilities. If any of these actions were to occur, it could harm our reputation as well as our business, financial condition, and operating results.
If we fail to attract additional skilled employees or retain key personnel, our business, financial condition and operating results could suffer.
Our future success depends, in part, upon our ability to attract additional skilled employees and retain our current key personnel. We have identified several areas where we intend to expand our hiring, including business development, finance, human resources, operations and supply chain management. We may not be able to hire and retain such personnel at compensation levels consistent with our existing compensation and salary structure. Our future also depends on the continued contributions of our executive management team, including Mr. Mitchell, and other key management and technical personnel, each of whom would be difficult to replace. We do not have key person life insurance or long-term employment contracts with any of our key personnel. The loss of any of our executive officers or key personnel or the inability to continue to attract qualified personnel could harm our business, financial condition and operating results.
Failure to comply with applicable environmental laws and regulations could have a material adverse effect on our business, results of operations and financial condition.
The sale and manufacturing of products in certain states and countries may subject us to environmental laws and regulations. In addition, rules adopted by the U.S. Securities and Exchange Commission (SEC) implementing the Dodd-Frank Wall Street Reform and Consumer Protection Act of 2010 impose diligence and disclosure requirements regarding the use of “conflict” minerals mined from the Democratic Republic of Congo and adjoining countries in the products we manufacture for our customers. Compliance with these rules has resulted in additional cost and expense, including for due diligence to determine and verify the sources of any conflict minerals used in the products we manufacture, and may result in additional costs of remediation and other changes to processes or sources of supply as a consequence of such verification activities. These rules may also affect the sourcing and availability of minerals used in the products we manufacture, as there may be only a limited number of suppliers offering “conflict free” metals that can be used in the products we manufacture for our customers.
Although we do not anticipate any material adverse effects based on the nature of our operations and these laws and regulations, we will need to ensure that we, and our suppliers, comply with such current and future laws and regulations. If we fail to timely comply with such laws and regulations, our customers may cease doing business with us, which would have a material adverse effect on our business, results of operations and financial condition. In addition, if we were found to be in violation of these laws, we could be subject to governmental fines, liability to our customers and damage to our reputation, which would also have a material adverse effect on our business, results of operations and financial condition.
24
Table of Contents
We have incurred and will continue to incur significant increased costs as a result of operating as a public company, and our management will be required to continue to devote substantial time to various compliance initiatives.
The Sarbanes-Oxley Act of 2002, the Dodd-Frank Wall Street Reform and Consumer Protection Act of 2010, as well as other rules implemented by the SEC and the New York Stock Exchange (NYSE), impose various requirements on public companies, including requiring changes in corporate governance practices. These and proposed corporate governance laws and regulations under consideration may further increase our compliance costs. If compliance with these various legal and regulatory requirements diverts our management’s attention from other business concerns, it could have a material adverse effect on our business, financial condition and results of operations. The Sarbanes-Oxley Act requires, among other things, that we assess the effectiveness of our internal control over financial reporting annually and disclosure controls and procedures quarterly. While we were able to assert in this Annual Report on Form 10-K that our internal control over financial reporting was effective as of June 26, 2015, we cannot predict the outcome of our testing in future periods. If we are unable to assert in any future reporting periods that our internal control over financial reporting is effective (or if our independent registered public accounting firm is unable to express an opinion on the effectiveness of our internal controls), we could lose investor confidence in the accuracy and completeness of our financial reports, which would have an adverse effect on our share price.
Given the nature and complexity of our business and the fact that some members of our management team are located in Thailand while others are located in the United States, control deficiencies may periodically occur. For example, following an internal investigation by the Audit Committee of our Board of Directors concerning various accounting cut-off issues, we identified certain significant deficiencies in our internal control over financial reporting. While we have ongoing measures and procedures to prevent and remedy control deficiencies, if they occur there can be no assurance that we will be successful or that we will be able to prevent material weaknesses or significant deficiencies in our internal control over financial reporting in the future. Moreover, if we or our independent registered public accounting firm identify deficiencies in our internal control over financial reporting that are deemed to be material weaknesses in future periods, the market price of our ordinary shares could decline and we could be subject to potential delisting by the NYSE and review by the NYSE, the SEC, or other regulatory authorities, which would require the expenditure by us of additional financial and management resources. As a result, our shareholders could lose confidence in our financial reporting, which would harm our business and the market price of our ordinary shares.
We are subject to the risk of increased income taxes, which could harm our business, financial condition and operating results.
We base our tax position upon the anticipated nature and conduct of our business and upon our understanding of the tax laws of the various countries in which we have assets or conduct activities. However, our tax position is subject to review and possible challenge by tax authorities and to possible changes in law, which may have retroactive effect. Fabrinet (the “Cayman Islands Parent”) is an exempted company incorporated in the Cayman Islands. We maintain manufacturing operations in Thailand, the PRC and the United States, any of which jurisdictions could assert tax claims against us. We cannot determine in advance the extent to which some jurisdictions may require us to pay taxes or make payments in lieu of taxes. Preferential tax treatment from the Thai government in the form of a corporate tax exemption is currently available to us through June 2020 on income generated from the manufacture of products at Pinehurst Building 6. Such preferential tax treatment is contingent on various factors, including the export of our customers’ products out of Thailand and our agreement not to move our manufacturing facilities out of our current province in Thailand for at least 15 years. We will lose this favorable tax treatment in Thailand unless we comply with these restrictions, and as a result we may delay or forego certain strategic business decisions due to these tax considerations. In addition, we benefit from recent reductions in corporate tax rates in Thailand for fiscal years 2013 to 2016.
There is also a risk that Thailand or another jurisdiction in which we operate may treat the Cayman Islands Parent as having a permanent establishment in such jurisdiction and subject its income to tax. If we become
25
Table of Contents
subject to additional taxes in any jurisdiction or if any jurisdiction begins to treat the Cayman Islands Parent as having a permanent establishment, such tax treatment could materially and adversely affect our business, financial condition and operating results.
Certain of our subsidiaries provide products and services to, and may from time to time undertake certain significant transactions with, us and our other subsidiaries in different jurisdictions. For instance, we have intercompany agreements in place that provide for our California and Singapore subsidiaries to provide administrative services for the Cayman Islands Parent, and the Cayman Islands Parent has entered into manufacturing agreements with our Thai subsidiary. In general, related party transactions and, in particular, related party financing transactions, are subject to close review by tax authorities. Moreover, several jurisdictions in which we operate have tax laws with detailed transfer pricing rules that require all transactions with non-resident related parties to be priced using arm’s length pricing principles and require the existence of contemporaneous documentation to support such pricing. Tax authorities in various jurisdictions could challenge the validity of our related party transfer pricing policies. Such a challenge generally involves a complex area of taxation and a significant degree of judgment by management. If any taxation authorities are successful in challenging our financing or transfer pricing policies, our income tax expense may be adversely affected and we could become subject to interest and penalty charges, which may harm our business, financial condition and operating results.
We may encounter difficulties completing or integrating acquisitions, asset purchases and other types of transactions that we may pursue in the future, which could disrupt our business, cause dilution to our shareholders and harm our business, financial condition and operating results.
We have grown and may continue to grow our business through acquisitions, asset purchases and other types of transactions, including the transfer of products from our customers and their suppliers. Acquisitions and other strategic transactions typically involve many risks, including the following:
| • | the integration of the acquired assets and facilities into our business may be difficult, time-consuming and costly, and may adversely impact our profitability; |
| • | we may lose key employees of the acquired companies or divisions; |
| • | we may issue additional ordinary shares, which would dilute our current shareholders’ percentage ownership in us; |
| • | we may incur indebtedness to pay for the transactions; |
| • | we may assume liabilities, some of which may be unknown at the time of the transactions; |
| • | we may record goodwill and non-amortizable intangible assets that will be subject to impairment testing and potential periodic impairment charges; |
| • | we may incur amortization expenses related to certain intangible assets; |
| • | we may devote significant resources to transactions that may not ultimately yield anticipated benefits; |
| • | we may incur greater than expected expenses or lower than expected revenues; |
| • | we may assume obligations with respect to regulatory requirements, including environmental regulations, which may prove more burdensome than expected; or |
| • | we may become subject to litigation. |
Acquisitions are inherently risky, and we can provide no assurance that our previous or future acquisitions will be successful or will not harm our business, financial condition and operating results.
26
Table of Contents
We may not be able to obtain capital when desired on favorable terms, if at all, or without dilution to our shareholders.
We anticipate that our current cash and cash equivalents, together with cash provided by operating activities and funds available through our working capital and credit facilities, will be sufficient to meet our current and anticipated needs for general corporate purposes for at least the next 12 months. We operate in a market, however, that makes our prospects difficult to evaluate. It is possible that we may not generate sufficient cash flow from operations or otherwise have the capital resources to meet our future capital needs. If this occurs, we may need additional financing to execute on our current or future business strategies.
Furthermore, if we raise additional funds through the issuance of equity or convertible debt securities, the percentage ownership of our shareholders could be significantly diluted, and these newly-issued securities may have rights, preferences or privileges senior to those of existing shareholders. If adequate additional funds are not available or are not available on acceptable terms, if and when needed, our ability to fund our operations, take advantage of unanticipated opportunities, develop or enhance our manufacturing services, hire additional technical and other personnel, or otherwise respond to competitive pressures could be significantly limited.
Intellectual property infringement claims against our customers or us could harm our business, financial condition and operating results.
Our services involve the creation and use of intellectual property rights, which subject us to the risk of intellectual property infringement claims from third parties and claims arising from the allocation of intellectual property rights among us and our customers.
Our customers may require that we indemnify them against the risk of intellectual property infringement arising out of our manufacturing processes. If any claims are brought against us or our customers for such infringement, whether or not these claims have merit, we could be required to expend significant resources in defense of such claims. In the event of an infringement claim, we may be required to spend a significant amount of money to develop non-infringing alternatives or obtain licenses. We may not be successful in developing such alternatives or obtaining such licenses on reasonable terms or at all, which could harm our business, financial condition and operating results.
Any failure to protect our customers’ intellectual property that we use in the products we manufacture for them could harm our customer relationships and subject us to liability.
We focus on manufacturing complex optical products for our customers. These products often contain our customers’ intellectual property, including trade secrets and know-how. Our success depends, in part, on our ability to protect our customers’ intellectual property. We may maintain separate and secure areas for customer proprietary manufacturing processes and materials and dedicate floor space, equipment, engineers and supply chain management to protect our customers’ proprietary drawings, materials and products. The steps we take to protect our customers’ intellectual property may not adequately prevent its disclosure or misappropriation. If we fail to protect our customers’ intellectual property, our customer relationships could be harmed and we may experience difficulty in establishing new customer relationships. In addition, our customers might pursue legal claims against us for any failure to protect their intellectual property, possibly resulting in harm to our reputation and our business, financial condition and operating results.
There are inherent uncertainties involved in estimates, judgments and assumptions used in the preparation of financial statements in accordance with U.S. GAAP. Any changes in estimates, judgments and assumptions could have a material adverse effect on our business, financial condition and operating results.
The preparation of financial statements in accordance with U.S. GAAP involves making estimates, judgments and assumptions that affect reported amounts of assets (including intangible assets), liabilities and
27
Table of Contents
related reserves, revenues, expenses and income. Estimates, judgments and assumptions are inherently subject to change in the future, and any such changes could result in corresponding changes to the amounts of assets, liabilities, revenues, expenses and income. Any such changes could have a material adverse effect on our business, financial condition and operating results.
We are subject to governmental export and import controls in several jurisdictions that could subject us to liability or impair our ability to compete in international markets.
We are subject to governmental export and import controls in Thailand, the PRC, and the United States that may limit our business opportunities. Various countries regulate the import of certain technologies and have enacted laws that could limit our ability to export or sell the products we manufacture. The export of certain technologies from the United States and other nations to the PRC is barred by applicable export controls, and similar prohibitions could be extended to Thailand, thereby limiting our ability to manufacture certain products. Any change in export or import regulations or related legislation, shift in approach to the enforcement of existing regulations, or change in the countries, persons or technologies targeted by such regulations, could limit our ability to offer our manufacturing services to existing or potential customers, which could harm our business, financial condition and operating results.
The loan agreements for our long-term debt obligations and other credit facilities contain financial ratio covenants that may impair our ability to conduct our business.
We have loan agreements for our long-term and short-term debt obligations, which contain financial ratio covenants that may limit management’s discretion with respect to certain business matters. These covenants require us to maintain a specified debt-to-equity ratio, debt service coverage ratio (earnings before interest and depreciation and amortization plus cash on hand minus short-term debt), a minimum tangible net worth and a minimum quick ratio, which may restrict our ability to incur additional indebtedness and limit our ability to use our cash. In the event of our default on these loans or a breach of a covenant, the lenders may immediately cancel the loan agreement, deem the full amount of the outstanding indebtedness immediately due and payable, charge us interest on a monthly basis on the full amount of the outstanding indebtedness and, if we cannot repay all of our outstanding obligations, sell the assets pledged as collateral for the loan in order to fulfill our obligation. We may also be held responsible for any damages and related expenses incurred by the lender as a result of any default. Any failure by us, or our subsidiaries, to comply with these agreements could harm our business, financial condition and operating results.
Our investment portfolio may become impaired by deterioration of the capital markets.
We use professional investment management firms to manage our excess cash and cash equivalents. Our marketable securities as of June 26, 2015 are primarily investments in a fixed income portfolio, including corporate bonds and commercial paper, U.S. agency and U.S. Treasury securities, and sovereign and municipal securities. Our investment portfolio may become impaired by deterioration of the capital markets. We follow an established investment policy and set of guidelines to monitor and help mitigate our exposure to interest rate and credit risk. The policy sets forth credit quality standards and limits our exposure to any one issuer, as well as our maximum exposure to various asset classes. The policy also provides that we may not invest in marketable securities with a maturity in excess of three years.
We regularly review our investment portfolio to determine if any security is other-than-temporarily impaired, which would require us to record an impairment charge in the period any such determination is made. In making this judgment, we evaluate, among other things, the duration and extent to which the fair value of a security is less than its cost; the financial condition of the issuer and any changes thereto; and our intent to sell, or whether we will more likely than not be required to sell, the security before recovery of its amortized cost basis. Our assessment on whether a security is other-than-temporarily impaired could change in the future due to new developments or changes in assumptions related to any particular security.
28
Table of Contents
Should financial market conditions worsen, investments in some financial instruments may pose risks arising from market liquidity and credit concerns. In addition, any deterioration of the capital markets could cause our other income and expense to vary from expectations. As of June 26, 2015, we did not record any impairment charges associated with our investment portfolio of marketable securities, and although we believe our current investment portfolio has little risk of material impairment, we cannot predict future market conditions or market liquidity, or credit availability, and can provide no assurance that our investment portfolio will remain materially unimpaired.
Energy price volatility may negatively impact our results of operations.
We, along with our suppliers and customers, rely on various energy sources in our manufacturing and transportation activities. Energy prices have been subject to increases and volatility caused by market fluctuations, supply and demand, currency fluctuation, production and transportation disruption, world events and government regulations. While we are currently experiencing lower energy prices, a significant increase is possible. Increased energy prices could increase our raw material and transportation costs. In addition, increased transportation costs of our suppliers and customers could be passed along to us. We may not be able to increase our prices enough to offset these increased costs. In addition, any increase in our prices may reduce our future customer orders which could harm our business, financial condition and operating results.
Risks Related to Ownership of Our Ordinary Shares
Our share price may be volatile due to fluctuations in our operating results and other factors, including the activities and operating results of our customers or competitors, any of which could cause our share price to decline.
Our revenues, expenses and results of operations have fluctuated in the past and are likely to do so in the future from quarter-to-quarter and year-to-year due to the risk factors described in this section and elsewhere in this Annual Report on Form 10-K. In addition to market and industry factors, the price and trading volume of our ordinary shares may fluctuate in response to a number of events and factors relating to us, our competitors, our customers and the markets we serve, many of which are beyond our control. Factors such as variations in our total revenues, earnings and cash flow, announcements of new investments or acquisitions, changes in our pricing practices or those of our competitors, commencement or outcome of litigation, sales of ordinary shares by us or our principal shareholders, fluctuations in market prices for our services and general market conditions could cause the market price of our ordinary shares to change substantially. Any of these factors may result in large and sudden changes in the volume and price at which our ordinary shares trade. For example, during October 2011, when some of the worst flooding in Thailand occurred, our share price fell from $20.03 per share on October 10, 2011 to $11.95 per share on October 26, 2011, a 40% decrease. Among other things, volatility and weakness in our share price could mean that investors may not be able to sell their shares at or above the prices they paid. Volatility and weakness could also impair our ability in the future to offer our ordinary shares or convertible securities as a source of additional capital and/or as consideration in the acquisition of other businesses.
Furthermore, the stock markets have experienced extreme price and volume fluctuations that have affected and continue to affect the market prices of equity securities of many companies. These fluctuations often have been unrelated or disproportionate to the operating performance of those companies. These broad market and industry fluctuations, as well as general economic, political and market conditions such as recessions, interest rate changes or international currency fluctuations, may cause the market price of our ordinary shares to decline. In the past, companies that have experienced volatility in the market price of their stock have been subject to securities class action litigation. We may be the target of this type of litigation in the future. Securities litigation against us could result in substantial costs and divert our management’s attention from other business concerns, which could seriously harm our business.
29
Table of Contents
If securities or industry analysts do not publish research or if they publish misleading or unfavorable research about our business, the market price and trading volume of our ordinary shares could decline.
The trading market for our ordinary shares depends in part on the research and reports that securities or industry analysts publish about us or our business. If securities or industry analysts stop covering us, or if too few analysts cover us, the market price of our ordinary shares would be adversely impacted. If one or more of the analysts who covers us downgrades our ordinary shares or publishes misleading or unfavorable research about our business, our market price would likely decline. If one or more of these analysts ceases coverage of us or fails to publish reports on us regularly, demand for our ordinary shares could decrease, which could cause the market price or trading volume of our ordinary shares to decline.
We may become a passive foreign investment company, which could result in adverse U.S. tax consequences to U.S. investors.
Based upon estimates of the value of our assets, which are based in part on the trading price of our ordinary shares, we do not expect to be a passive foreign investment company, or PFIC, for U.S. federal income tax purposes for the taxable year 2015 or for the foreseeable future. However, despite our expectations, we cannot assure you that we will not be a PFIC for the taxable year 2015 or any future year because our PFIC status is determined at the end of each year and depends on the composition of our income and assets during such year. If we are a PFIC, our U.S. investors will be subject to increased tax liabilities under U.S. tax laws and regulations and to burdensome reporting requirements.
Certain provisions in our constitutional documents may discourage our acquisition by a third party, which could limit your opportunity to sell shares at a premium.
Our constitutional documents include provisions that could limit the ability of others to acquire control of us, modify our structure or cause us to engage in change-of-control transactions, including, among other things, provisions that:
| • | establish a classified board of directors; |
| • | prohibit our shareholders from calling meetings or acting by written consent in lieu of a meeting; |
| • | limit the ability of our shareholders to propose actions at duly convened meetings; and |
| • | authorize our board of directors, without action by our shareholders, to issue preferred shares and additional ordinary shares. |
These provisions could have the effect of depriving you of an opportunity to sell your ordinary shares at a premium over prevailing market prices by discouraging third parties from seeking to acquire control of us in a tender offer or similar transaction.
Our shareholders may face difficulties in protecting their interests because we are incorporated under Cayman Islands law.
Our corporate affairs are governed by our amended and restated memorandum and articles of association, by the Companies Law (as amended) of the Cayman Islands and the common law of the Cayman Islands. The rights of our shareholders and the fiduciary responsibilities of our directors under the laws of the Cayman Islands are not as clearly established as under statutes or judicial precedent in existence in jurisdictions in the United States. Therefore, you may have more difficulty in protecting your interests than would shareholders of a corporation incorporated in a jurisdiction in the U.S., due to the comparatively less developed nature of Cayman Islands law in this area.
The Companies Law permits mergers and consolidations between Cayman Islands companies and between Cayman Islands companies and non-Cayman Islands companies. Dissenting shareholders have the right to be
30
Table of Contents
paid the fair value of their shares (which, if not agreed between the parties, will be determined by the Cayman Islands court) if they follow the required procedures, subject to certain exceptions. Court approval is not required for a merger or consolidation which is effected in compliance with these statutory procedures.
In addition, there are statutory provisions that facilitate the reconstruction and amalgamation of companies, provided that the arrangement is approved by a majority in number of each class of shareholders and creditors with whom the arrangement is to be made, and who must in addition represent three-fourths in value of each such class of shareholders or creditors, as the case may be, that are present and voting either in person or by proxy at a meeting convened for that purpose. The convening of the meeting and subsequently the arrangement must be sanctioned by the Grand Court of the Cayman Islands. A dissenting shareholder has the right to express to the court the view that the transaction ought not to be approved.
When a takeover offer is made and accepted by holders of 90.0% of the shares within four months, the offeror may, within a two-month period, require the holders of the remaining shares to transfer such shares on the terms of the offer. An objection can be made to the Grand Court of the Cayman Islands but this is unlikely to succeed unless there is evidence of fraud, bad faith or collusion.
If the arrangement and reconstruction is thus approved, the dissenting shareholder would have no rights comparable to appraisal rights, which would otherwise ordinarily be available to dissenting shareholders of a corporation incorporated in a jurisdiction in the United States, providing rights to receive payment in cash for the judicially determined value of the shares. This may make it more difficult for you to assess the value of any consideration you may receive in a merger or consolidation or to require that the offeror give you additional consideration if you believe the consideration offered is insufficient.
Shareholders of Cayman Islands exempted companies have no general rights under Cayman Islands law to inspect corporate records and accounts or to obtain copies of lists of shareholders. Our directors have discretion under our amended and restated memorandum and articles of association to determine whether or not, and under what conditions, our corporate records may be inspected by our shareholders, but are not obliged to make them available to our shareholders. This may make it more difficult for you to obtain the information needed to establish any facts necessary for a shareholder motion or to solicit proxies from other shareholders in connection with a proxy contest.
Subject to limited exceptions, under Cayman Islands law, a minority shareholder may not bring a derivative action against the board of directors.
Certain judgments obtained against us by our shareholders may not be enforceable.
The Cayman Islands Parent is a Cayman Islands exempted company and substantially all of our assets are located outside of the United States. In addition, some of our directors and officers are nationals and residents of countries other than the United States. A substantial portion of the assets of these persons is located outside of the United States. As a result, it may be difficult to effect service of process within the United States upon these persons. It may also be difficult to enforce in U.S. courts judgments obtained in U.S. courts based on the civil liability provisions of the U.S. federal securities laws against us and our officers and directors who are not resident in the United States and the substantial majority of whose assets are located outside of the United States. In addition, there is uncertainty as to whether the courts of the Cayman Islands, Thailand or the PRC would recognize or enforce judgments of U.S. courts against us or such persons predicated upon the civil liability provisions of the securities laws of the United States or any state. In particular, a judgment in a U.S. court would not be recognized and accepted by Thai courts without a re-trial or examination of the merits of the case. In addition, there is uncertainty as to whether such Cayman Islands, Thai or PRC courts would be competent to hear original actions brought in the Cayman Islands, Thailand or the PRC against us or such persons predicated upon the securities laws of the United States or any state.
31
Table of Contents
| ITEM 1B. | UNRESOLVED STAFF COMMENTS. |
Not applicable.
| ITEM 2. | PROPERTIES. |
Our principal registered office is located at c/o Intertrust Corporate Services (Cayman) Limited, 190 Elgin Avenue, George Town, Grand Cayman, KYI-9005, Cayman Islands. We have facilities located in Bangkok, Thailand, Fuzhou, China, New Jersey and California, United States, and Grand Cayman, the Cayman Islands as set forth below that are used for manufacturing and general administration purposes as set forth below:
| Location |
Year Operations Commenced |
Owned/Leased | Approximate Square Footage | |||
| Pinehurst Campus, Bangkok, Thailand (Buildings 3 and 4) |
2004 (Building 3) and 2005 (Building 4) |
Owned | 315,000 square feet | |||
| CASIX, Fuzhou, PRC |
2005 | Leased (1) | 248,000 square feet | |||
| VitroCom, Mountain Lakes, New Jersey, United States |
2005 | Leased (2) | 28,000 square feet | |||
| Pinehurst Campus, Bangkok, Thailand (Building 5) |
2008 | Owned | 317,000 square feet | |||
| Pinehurst Campus, Bangkok, Thailand (Building 6) |
2012 | Owned (3) | 315,000 square feet | |||
| Pinehurst Campus, Bangkok, Thailand (Building 8) |
2015 | Owned | 25,000 square feet | |||
| Fabritek, Santa Clara, California, United States |
2015 | Owned | 72,000 square feet | |||
| Fabrilink, Cayman Islands |
2015 | Leased (4) | 1,700 square feet | |||
| (1) | The lease periods for the buildings located at this facility expire on September 30, 2015 and September 30, 2018, respectively. |
| (2) | Leased until June 30, 2020. |
| (3) | Although we hold title to this building, the building and the underlying land is encumbered by a mortgage that secures our debt obligations to TMB Bank Public Company Limited. |
| (4) | Leased until May 17, 2016. |
| ITEM 3. | LEGAL PROCEEDINGS. |
From time to time, we may be involved in litigation relating to claims arising in the ordinary course of our business. There are currently no material claims or actions pending or threatened against us.
| ITEM 4. | MINE SAFETY DISCLOSURES. |
Not applicable.
32
Table of Contents
| ITEM 5. | MARKET FOR REGISTRANT’S COMMON EQUITY, RELATED STOCKHOLDER MATTERS AND ISSUER PURCHASES OF EQUITY SECURITIES. |
Our ordinary shares are listed on the New York Stock Exchange under the symbol “FN”. The following table sets forth, for the time periods indicated, the highest and lowest intraday sales prices of our ordinary shares as reported on the New York Stock Exchange.
| Fiscal Year 2015 |
High | Low | ||||||
| Fourth Quarter (March 28, 2015—June 26, 2015) |
$ | 20.72 | $ | 17.86 | ||||
| Third Quarter (December 27, 2014—March 27, 2015) |
$ | 19.97 | $ | 15.68 | ||||
| Second Quarter (September 27, 2014—December 26, 2014) |
$ | 18.50 | $ | 14.09 | ||||
| First Quarter (June 28, 2014—September 26, 2014) |
$ | 21.17 | $ | 13.57 | ||||
| Fiscal Year 2014 |
High | Low | ||||||
| Fourth Quarter (March 29, 2014—June 27, 2014) |
$ | 22.67 | $ | 18.01 | ||||
| Third Quarter (December 28, 2013—March 28, 2014) |
$ | 21.00 | $ | 16.56 | ||||
| Second Quarter (September 28, 2013—December 27, 2013) |
$ | 20.93 | $ | 15.90 | ||||
| First Quarter (June 29, 2013—September 27, 2013) |
$ | 16.99 | $ | 13.66 | ||||
The equity compensation plan information required by this item, which includes a summary of the number of outstanding options granted to employees and directors, as well as the number of securities remaining available for future issuances, under our equity compensation plans as of June 26, 2015, is incorporated by reference to our Proxy Statement for our 2015 Annual Meeting of Shareholders to be filed with the SEC within 120 days after the end of the fiscal year ended June 26, 2015.
Holders of Record
As of August 7, 2015, there were approximately 15 shareholders of record of our ordinary shares. Because many of our ordinary shares are held by brokers and other institutions on behalf of shareholders, we are unable to estimate the total number of shareholders represented by these record holders.
Dividends
Although we have paid cash dividends prior to our initial public offering, we currently intend to retain any earnings for use in our business and do not currently intend to pay dividends on our ordinary shares. Dividends, if any, on our ordinary shares will be declared by and subject to the discretion of our board of directors. Even if our board of directors decides to distribute dividends, the form, frequency and amount of such dividends will depend upon our future operations and earnings, capital requirements and surplus, general financial conditions, contractual restrictions, applicable laws and regulations and other factors our board of directors may deem relevant.
Sales of Unregistered Securities
None.
Purchases of Equity Securities by the Issuer and Affiliated Purchasers
None.
33
Table of Contents
Five-Year Performance Graph
The following performance graph shall not be deemed “filed” for purposes of Section 18 of the Securities Exchange Act of 1934, as amended, or otherwise subject to the liabilities under that Section, and shall not be deemed to be incorporated by reference into any filing of Fabrinet under the Securities Act of 1933, as amended, or the Exchange Act.
The following graph compares the cumulative total return to holders of Fabrinet’s ordinary shares with the cumulative total return of the NASDAQ Composite Index, and the NASDAQ Telecommunications Index.
The graph assumes that $100 was invested on June 25, 2010 in Fabrinet’s ordinary shares and on a month-end basis in each of the indices discussed above, including reinvestment of dividends. Historic stock performance is not necessarily indicative of future stock price performance.
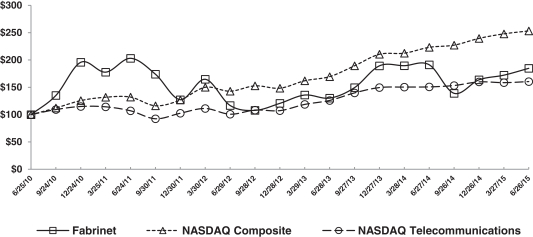
34
Table of Contents
| ITEM 6. | SELECTED FINANCIAL DATA. |
The selected consolidated financial data presented below should be read in conjunction with “Management’s Discussion and Analysis of Financial Condition and Results of Operations” and our consolidated financial statements and the related notes included elsewhere in this Annual Report on Form 10-K. The selected financial data set forth below at June 26, 2015 and June 27, 2014, and for the fiscal years ended June 26, 2015, June 27, 2014, and June 28, 2013, are derived from the audited consolidated financial statements included elsewhere in this Annual Report on Form 10-K. The selected financial data at June 28, 2013, June 29, 2012 and June 24, 2011, and for the fiscal years ended June 29, 2012 and June 24, 2011, are derived from the audited consolidated financial statements not included in this Annual Report on Form 10-K. The results presented below are not necessarily indicative of financial results to be achieved in future periods.
| Years Ended | ||||||||||||||||||||
| (amount in thousands, except per share data) | June 26, 2015 (fiscal year 2015) |
June 27, 2014 (fiscal year 2014) |
June 28, 2013 (fiscal year 2013) |
June 29, 2012 (fiscal year 2012) |
June 24, 2011 (fiscal year 2011) |
|||||||||||||||
| Selected Consolidated Statements of Operations Data: | ||||||||||||||||||||
| Revenues |
$ | 773,587 | $ | 677,854 | $ | 641,542 | $ | 564,732 | $ | 743,570 | ||||||||||
| Cost of revenues |
(685,814 | ) | (603,621 | ) | (572,124 | ) | (502,818 | ) | (648,823 | ) | ||||||||||
|
|
|
|
|
|
|
|
|
|
|
|||||||||||
| Gross profit |
87,773 | 74,233 | 69,418 | 61,914 | 94,747 | |||||||||||||||
| Selling, general and administrative expenses |
(39,460 | ) | (27,664 | ) | (23,787 | ) | (23,466 | ) | (24,806 | ) | ||||||||||
| Income (expense) related to flooding |
— | 44,748 | 27,211 | (97,286 | ) | — | ||||||||||||||
| Expenses related to reduction in workforce |
(1,153 | ) | — | (2,052 | ) | (1,978 | ) | — | ||||||||||||
|
|
|
|
|
|
|
|
|
|
|
|||||||||||
| Operating income (loss) |
47,160 | 91,317 | 70,790 | (60,816 | ) | 69,941 | ||||||||||||||
| Interest income |
1,253 | 1,793 | 1,083 | 844 | 494 | |||||||||||||||
| Interest expense |
(616 | ) | (713 | ) | (1,010 | ) | (427 | ) | (357 | ) | ||||||||||
| Foreign exchange (loss) gain, net |
(19 | ) | (24 | ) | 354 | 1,569 | (1,430 | ) | ||||||||||||
| Other (expense) income |
(152 | ) | 797 | 692 | 395 | 216 | ||||||||||||||
|
|
|
|
|
|
|
|
|
|
|
|||||||||||
| Income (loss) before income taxes |
47,626 | 93,170 | 71,909 | (58,435 | ) | 68,864 | ||||||||||||||
| Income tax (expense) benefit |
(3,984 | ) | (1,439 | ) | (2,940 | ) | 1,968 | (4,535 | ) | |||||||||||
|
|
|
|
|
|
|
|
|
|
|
|||||||||||
| Net income (loss) |
43,642 | 91,731 | 68,969 | (56,467 | ) | 64,329 | ||||||||||||||
| Other comprehensive loss |
(44 | ) | — | — | — | — | ||||||||||||||
|
|
|
|
|
|
|
|
|
|
|
|||||||||||
| Net comprehensive income (loss) |
$ | 43,598 | $ | 91,731 | $ | 68,969 | $ | (56,467 | ) | $ | 64,329 | |||||||||
|
|
|
|
|
|
|
|
|
|
|
|||||||||||
| Earnings (loss) per share: |
||||||||||||||||||||
| Basic |
$ | 1.23 | $ | 2.63 | $ | 2.00 | $ | (1.64 | ) | $ | 1.90 | |||||||||
| Diluted |
$ | 1.21 | $ | 2.58 | $ | 1.98 | $ | (1.64 | ) | $ | 1.87 | |||||||||
| Weighted average number of ordinary shares outstanding (thousands of shares) |
||||||||||||||||||||
| Basic |
35,354 | 34,938 | 34,557 | 34,382 | 33,922 | |||||||||||||||
| Diluted |
35,984 | 35,589 | 34,846 | 34,382 | 34,407 | |||||||||||||||
| As of | ||||||||||||||||||||
| (amount in thousands) | June 26, 2015 | June 27, 2014 | June 28, 2013 | June 29, 2012 | June 24, 2011 | |||||||||||||||
| Selected Consolidated Balance Sheet Data: | ||||||||||||||||||||
| Cash and cash equivalents |
$ | 112,978 | $ | 233,477 | $ | 149,716 | $ | 115,507 | $ | 127,282 | ||||||||||
| Short-term investment |
$ | 142,866 | $ | — | $ | — | $ | — | $ | — | ||||||||||
| Working capital (1) |
$ | 150,246 | $ | 130,885 | $ | 130,298 | $ | 145,476 | $ | 131,609 | ||||||||||
| Total assets |
$ | 672,503 | $ | 564,557 | $ | 463,579 | $ | 461,362 | $ | 437,775 | ||||||||||
| Current and long-term debt |
$ | 40,500 | $ | 16,500 | $ | 28,911 | $ | 38,579 | $ | 16,377 | ||||||||||
| Total liabilities |
$ | 193,559 | $ | 137,721 | $ | 138,261 | $ | 210,653 | $ | 136,248 | ||||||||||
| Total shareholders’ equity |
$ | 478,944 | $ | 426,836 | $ | 325,318 | $ | 250,709 | $ | 301,527 | ||||||||||
| (1) | Working capital is defined as trade accounts receivable plus inventory, less trade accounts payable. |
| Years Ended | ||||||||||||||||||||
| (amount in thousands) | June 26, 2015 | June 27, 2014 | June 28, 2013 | June 29, 2012 | June 24, 2011 | |||||||||||||||
| Selected Consolidated Statements of Cash Flow Data: | ||||||||||||||||||||
| Net cash provided by operating activities |
$ | 52,629 | $ | 66,550 | $ | 48,750 | $ | 2,251 | $ | 41,282 | ||||||||||
| Net cash (used in) provided by investing activities |
$ | (195,499 | ) | $ | 26,988 | $ | (5,862 | ) | $ | (37,378 | ) | $ | (23,590 | ) | ||||||
| Net cash provided by (used in) financing activities |
$ | 22,537 | $ | (8,171 | ) | $ | (9,128 | ) | $ | 23,202 | $ | 23,886 | ||||||||
| Net (decrease) increase in cash and cash equivalents |
$ | (120,333 | ) | $ | 85,367 | $ | 33,760 | $ | (11,925 | ) | $ | 41,578 | ||||||||
35
Table of Contents
| ITEM 7. | MANAGEMENT’S DISCUSSION AND ANALYSIS OF FINANCIAL CONDITION AND RESULTS OF OPERATIONS. |
In addition to historical information, this Annual Report on Form 10-K contains forward-looking statements within the meaning of Section 27A of the Securities Act of 1933 and Section 21E of the Securities Exchange Act of 1934. These statements relate to future events or to our future financial performance and involve known and unknown risks, uncertainties and other factors that may cause our or our industry’s actual results, levels of activity, performance or achievements to be materially different from any future results, levels of activity, performance or achievements expressed or implied by these forward-looking statements. Forward-looking statements include, but are not limited to, statements about:
| • | our goals and strategies; |
| • | our and our customers’ estimates regarding future revenues, operating results, expenses, capital requirements and liquidity; |
| • | our expectation that the portion of our future revenues attributable to customers in regions outside of North America will decrease compared with the portion of those revenues for the year ended June 26, 2015; |
| • | our expectation that we will incur significant incremental costs of revenue as a result of our continued diversification into the industrial lasers and sensors markets and other end-markets outside of the optical communications market or our further development of customized optics and glass manufacturing capabilities; |
| • | our expectation that we will incur incremental costs of revenue as a result of our planned expansion into new geographic markets; |
| • | our expectation that our fiscal year 2016 selling, general and administrative (SG&A) expenses will increase on an absolute dollar basis and as a percentage of revenue compared with fiscal year 2015; |
| • | our expectation that, in addition to incremental costs associated with growing our business generally, we will incur additional SG&A expenses as a result of expanding our business in the United States; |
| • | our expectation that our employee costs will increase in Thailand and the People’s Republic of China (PRC); |
| • | our future capital expenditures and our needs for additional financing; |
| • | the expansion of our manufacturing capacity, including into new geographies; |
| • | the growth rates of our existing markets and potential new markets; |
| • | our ability, and the ability of our customers and suppliers, to respond successfully to technological or industry developments; |
| • | our suppliers’ estimates regarding future costs; |
| • | our ability to increase our penetration of existing markets and to penetrate new markets; |
| • | our plans to diversify our sources of revenues; |
| • | trends in the optical communications, industrial lasers, and sensors markets, including trends to outsource the production of components used in those markets; |
| • | our ability to attract and retain a qualified management team and other qualified personnel and advisors; and |
| • | competition in our existing and new markets. |
36
Table of Contents
These forward-looking statements are subject to certain risks and uncertainties that could cause our actual results to differ materially from those reflected in the forward looking statements. Factors that could cause or contribute to such differences include, but are not limited to, those discussed in this Annual Report on Form 10-K, in particular, the risks discussed under the heading “Risk Factors” in Item 1A, as well as those discussed in other documents we file with the Securities and Exchange Commission. We undertake no obligation to revise or publicly release the results of any revision to these forward-looking statements. Given these risks and uncertainties, readers are cautioned not to place undue reliance on these statements.
Overview
We provide advanced optical packaging and precision optical, electro-mechanical and electronic manufacturing services to original equipment manufacturers (OEMs) of complex products such as optical communication components, modules and sub-systems, industrial lasers, medical devices, and sensors. We offer a broad range of advanced optical and electro-mechanical capabilities across the entire manufacturing process, including process design and engineering, supply chain management, manufacturing, complex printed circuit board assembly, advanced packaging, integration, final assembly and test. Although we focus primarily on low-volume production of a wide variety of high complexity products, which we refer to as “low-volume, high-mix”, we also have the capability to accommodate high-volume production. Based on our experience, and the positive feedback we have received from our customers, we believe we are a global leader in providing these services to the optical communications, industrial lasers, automotive, medical, and sensors markets.
Our customer base includes companies in complex industries that require advanced precision manufacturing capabilities such as optical communications, industrial lasers, automotive, and sensors. The products that we manufacture for our OEM customers include selective switching products; tunable transponders and transceivers; active optical cables; solid state, diode-pumped, gas and fiber lasers; and sensors. In many cases, we are the sole outsourced manufacturing partner used by our customers for the products that we produce for them.
We also design and fabricate application-specific crystals, lenses, prisms, mirrors, laser components, and substrates (collectively referred to as “customized optics”), and other custom and standard borosilicate, clear fused quartz, and synthetic fused silica glass products (collectively referred to as “customized glass”). We incorporate our customized optics and glass into many of the products we manufacture for our OEM customers, and we also sell customized optics and glass in the merchant market.
Audit Committee Investigation
During the fourth quarter of fiscal year 2014, we discovered violations of our policies and procedures relating to finished goods held in our warehouse on behalf of our customers (we refer to finished goods held in our warehouse on behalf of our customers as consignment goods or consignment inventory and, when the finished goods are sold, we refer to the related revenue as consignment revenue). Specifically, we identified violations related to certain employees in one business unit colluding to cause the improper recognition of revenues for certain goods by recording consignment revenues on goods before such goods were finished.
In connection with the above, the Audit Committee of our Board of Directors initiated an investigation concerning various accounting cut-off issues in fiscal year 2014, specifically the transfer of unfinished goods to consignment inventory and other inventory cut-off issues. The investigation found certain process deficiencies concerning the potential to invoice unfinished goods held under consignment arrangements and the need for certain remedial measures. The investigation did not find executive officer involvement in the identified violations.
37
Table of Contents
We developed remedial steps to address these significant deficiencies and improve our internal control over our financial reporting. Specifically, throughout fiscal year 2015, we implemented the following remedial measures for the deficiencies identified in the investigation:
| 1. | Dismissed an employee involved in the violations. |
| 2. | Provided training to staff from all departments at the manager level and above on: |
| a. | Our Code of Business Conduct, which provided guidance and further clarity to our employees on our policies and procedures related to the conduct of business; and |
| b. | Our revenue recognition policies, using the services of a third party advisor. This training focused on the scope and application of the Company’s policies concerning revenue recognition and related cut-off procedures. |
| 3. | Evaluated existing inventory procedures and enhanced such procedures, or where necessary, designed and implemented new procedures, including: |
| a. | The segregation and storage of consignment inventory in a secure designated warehouse; and |
| b. | Physical check of finished goods when our production division delivers products to the designated warehouse. |
Impact of the Findings of the Investigation on the Financial Statements and Internal Controls
Based on an analysis prepared by the Company, it was determined that the potential exposure relating to the control deficiencies identified during the investigation were not material to our consolidated financial statements. Further, the Company assessed these control deficiencies to be significant deficiencies rather than material weaknesses on the basis that there was no executive officer involvement in the violations, the potential misstatements were not material to the financial statements and the Audit Committee was actively involved in the investigation.
As of June 26, 2015, based on an assessment performed by management and taking into account the above mentioned remediation measures, the Company determined that these significant deficiencies had been remediated.
Consignment Revenue Recognition
Subsequent to completion of the Audit Committee’s investigation, the Company evaluated its accounting practices surrounding consignment inventory and consignment revenue. Based on that evaluation, the Company determined that for certain volume supply agreements with our customers, not all of the revenue recognition criteria prescribed by U.S. GAAP and Staff Accounting Bulletin No. 104 had been met at the time revenue was recorded. Specifically, the Company misapplied the guidance when assessing the terms of these agreements with respect to when title and risk of loss transfers to our customers. As a result, the Company determined that certain sales previously recognized did not qualify for revenue recognition in the periods in which they were recognized. The Company evaluated the impact of the errors on both a quantitative and qualitative basis under the guidance of Financial Accounting Standard Board’s Accounting Standard Codification (“ASC”) 250, Accounting Changes and Error Corrections and determined that the errors did not have a material impact to the previously issued consolidated financial statements. Accordingly, previously issued financial statements for fiscal years 2013 and 2012 have not been revised or restated. The Company assessed the control implications and concluded that the deficiency constituted a material weakness in internal control over financial reporting for the fiscal year 2014.
38
Table of Contents
Throughout fiscal year 2015, the Company undertook the following actions to remedy this material weakness.
| • | We conducted mandatory revenue recognition training for our management staff using third-party accounting experts. Management staff also attended follow-up training held by technical accounting specialists from large accounting firms and other professional organizations to maintain up-to-date knowledge on U.S. GAAP accounting principles with respect to the application of our policies concerning revenue recognition. |
| • | We implemented procedures to ensure that significant customer contracts, both contracts in effect at the commencement of the fiscal year and those entered into during the year, are subject to a comprehensive review by appropriate management staff to ensure that the financial accounting for such contracts is in compliance with U.S. GAAP and that the contracts properly reflected our current business practices. |
| • | In addition, we engaged an external technical accounting consultant with extensive U.S. GAAP experience to conduct a comprehensive review of all contracts discussed above to ensure the correct application of U.S. GAAP standards and principles related to relevant technical accounting topics, especially for the revenue recognition and the cut-off criteria. |
Management evaluated the operating effectiveness of the remediation procedures throughout the fiscal year 2015. As of June 26, 2015, the controls and procedures implemented have been tested, and management has determined that such internal controls and procedures are operating effectively to allow management to conclude that the material weakness has been remediated (refer Item 9A for additional information).
Typhoon Soudelor Storm Damage
During the week of August 10, 2015, we temporarily suspended production in the manufacturing facility of our subsidiary in China due to storm damage caused by Typhoon Soudelor. We expect to resume production at the facility in August 2015. While we are currently estimating our liabilities and expenses for the quarter ending September 25, 2015 in relation to this matter, our financial statements for the year ended June 26, 2015 were not affected.
Thailand Flooding
We suspended production at all of our manufacturing facilities in Thailand from October 17, 2011 through November 14, 2011 due to severe flooding in Thailand. We never resumed, and have permanently ceased, production at our Chokchai facility. We submitted claims for losses to our insurance companies, all of which were settled as of the end of fiscal year 2014.
In fiscal year 2014, we received from our insurers a final payment of $45.2 million against our claims for owned and customer-owned equipment and inventory, which we recognized as income related to flooding. This income was offset by $0.5 million of other expenses from write-offs of advance payments to a customer due to flood-related losses.
During fiscal year 2014, we fulfilled our obligations to a customer in accordance with a settlement agreement entered into during the third quarter of fiscal year 2013 by making a final cash payment of $5.3 million and transferring equipment with an aggregate value of $2.3 million to such customer. In addition, we fulfilled our obligations to a customer’s insurers in accordance with a settlement agreement entered into during the fourth quarter of fiscal 2013 by making a payment of $2.3 million.
Revenues
Our total revenues increased by $95.7 million, or 14.1%, to $773.6 million for fiscal year 2015, compared with $677.9 million for fiscal year 2014. This increase was primarily due to i) an increase in our customers’
39
Table of Contents
demand for both optical and non-optical communications manufacturing service during the year ended June 26, 2015 and ii) the consignment revenues recognition during the fiscal year 2015 of $16.5 million.
We believe our ability to expand our relationships with existing customers and attract new customers is due to a number of factors, including our broad range of complex engineering and manufacturing service offerings, flexible low-cost manufacturing platform, process optimization capabilities, advanced supply chain management, excellent customer service and experienced management team. Although we expect the prices we charge for our manufactured products to decrease over time (partly as a result of competitive market forces), we still believe we will be able to maintain favorable pricing for our services because of our ability to reduce cycle time, adjust our product mix by focusing on more complicated products, improve product quality and yields, and reduce material costs for the products we manufacture. We believe these capabilities will enable us to help our OEM customers reduce their manufacturing costs while maintaining or improving the design, quality, reliability, and delivery times of their products.
Revenues, by percentage, from individual customers representing 10% or more of our total revenues in the respective periods were as follows:
| Years Ended | ||||||||||||
| June 26, 2015 | June 27, 2014 | June 28, 2013 | ||||||||||
| JDS Uniphase Corporation |
20 | % | 24 | % | 22 | % | ||||||
| Oclaro, Inc. |
10 | % | 22 | % | 25 | % | ||||||
During fiscal year 2015, fiscal year 2014 and fiscal year 2013, we had two customers that each contributed 10% or more of our total revenues, and such customers together accounted for 30%, 46%, and 47%, respectively, of our total revenues during the respective periods.
Because we depend upon a small number of customers for a significant percentage of our total revenues, a reduction in orders from, a loss of, or any other adverse actions by, any one of these customers would reduce our revenues and could have a material adverse effect on our business, operating results and share price. Moreover, our customer concentration increases the concentration of our accounts receivable and payment default by any of our key customers will negatively impact our exposure. Many of our existing and potential customers have substantial debt burdens, have experienced financial distress or have static or declining revenues, all of which may be exacerbated by the continued uncertainty in the global economies. Certain customers have gone out of business or have been acquired or announced their withdrawal from segments of the optics market. We generate significant accounts payable and inventory for the services that we provide to our customers, which could expose us to substantial and potentially unrecoverable costs if we do not receive payment from our customers. Therefore, any financial difficulties that our key customers experience could materially and adversely affect our operating results and financial condition by generating charges for inventory write-offs, provisions for doubtful accounts, and increases in working capital requirements due to increased days inventory and in accounts receivable.
Furthermore, reliance on a small number of customers gives those customers substantial purchasing power and leverage in negotiating contracts with us. In addition, although we enter into master supply agreements with our customers, the level of business to be transacted under those agreements is not guaranteed. Instead, we are awarded business under those agreements on a project-by-project basis. Some of our customers have at times significantly reduced or delayed the volume of manufacturing services that they order from us. If we are unable to maintain our relationships with our existing significant customers, our business, financial condition and operating results could be harmed.
Revenues by Geography
We generate revenues from three geographic regions: North America, Asia-Pacific, and Europe. Revenues are attributed to a particular geographic area based on the bill-to-location of our customers, notwithstanding that our customers may ultimately ship their products to end customers in a different geographic region. Virtually all of our revenues are derived from our manufacturing facilities in Asia-Pacific.
40
Table of Contents
The percentage of our revenues generated from a bill-to-location outside of North America, consisting of Asia-Pacific and Europe, increased from 51.8% in fiscal year 2014 to 52.1% in fiscal year 2015, primarily because of an increase in sales volumes of our customers in those regions. We expect that the portion of our future revenues attributable to customers in regions outside of North America will decrease as compared with the fiscal year 2015.
The following table presents percentages of total revenues by geographic regions:
| Years Ended | ||||||||||||
| June 26, 2015 | June 27, 2014 | June 28, 2013 | ||||||||||
| North America |
47.9 | % | 48.2 | % | 46.7 | % | ||||||
| Asia-Pacific |
40.1 | 34.0 | 34.0 | |||||||||
| Europe |
12.0 | 17.8 | 19.3 | |||||||||
|
|
|
|
|
|
|
|||||||
| 100.0 | % | 100.0 | % | 100.0 | % | |||||||
|
|
|
|
|
|
|
|||||||
Our Contracts
We enter into supply agreements with our customers which generally have an initial term of up to three years, subject to automatic renewals for subsequent one-year terms unless expressly terminated. Although there are no minimum purchase requirements in our supply agreements, our customers do provide us with rolling forecasts of their demand requirements. Our supply agreements generally include provisions for pricing and periodic review of pricing, consignment of our customer’s unique production equipment to us, and the sharing of benefits from cost-savings derived from our efforts. We are generally required to purchase materials, which may include long lead-time materials and materials that are subject to minimum order quantities and/or non-cancelable or non-returnable terms, to meet the stated demands of our customers. After procuring materials, we manufacture products for our customers based on purchase orders that contain terms regarding product quantities, delivery locations and delivery dates. Our customers are generally obligated to purchase finished goods that we have manufactured according to their demand requirements. Materials that are not consumed by our customers within a specified period of time, or are no longer required due to a product’s cancellation or end-of-life, are typically designated as excess or obsolete inventory under our contracts. Once materials are designated as either excess or obsolete inventory, our customers are typically required to purchase such inventory from us even if they have chosen to cancel production of the related products.
Cost of Revenues
The key components of our cost of revenues are material costs, employee costs, and infrastructure-related costs. Material costs generally represent the majority of our cost of revenues. Several of the materials we require to manufacture products for our customers are customized for their products and often sourced from a single supplier or in some cases, our own subsidiaries. Shortages from sole-source suppliers due to yield loss, quality concerns, and capacity constraints, among other factors, may increase our expenses and negatively impact our gross profit margin or total revenues in a given quarter. Material costs include scrap material. Historically, scrap rate diminishes during a product’s life cycle due to process, fixturing and test improvement, and optimization.
A second significant element of cost of revenues is employee costs, including indirect employee costs related to design; configuration and optimization of manufacturing processes for our customers, quality testing; materials testing and other engineering services; and direct costs related to our manufacturing employees. Direct employee costs include employee salaries, insurance and benefits, merit-based bonuses, recruitment, training and retention. Historically, our employee costs have increased primarily due to increases in the number of employees necessary to support our growth and, to a lesser extent, costs to recruit, train, and retain employees. Our cost of revenues are significantly impacted by salary levels in Thailand and the PRC; the fluctuation of the Thai Baht and Chinese Renminbi (RMB) against our functional currency, the U.S. dollar; and our ability to retain our
41
Table of Contents
employees. We expect our employee costs to increase as wages continue to increase in Thailand and the PRC. Wage increases may impact our ability to sustain our competitive advantage and may reduce our profit margin. We seek to mitigate these cost increases through improvements in employee productivity, employee retention, and asset utilization.
Our infrastructure costs are comprised of depreciation, utilities, facilities management, and overhead costs. Most of our facility leases are long-term agreements. Our depreciation costs include buildings and fixed assets, primarily at our Pinehurst Campus in Thailand, and capital equipment located at each of our manufacturing locations.
During fiscal year 2015, fiscal year 2014, and fiscal year 2013, discretionary merit-based bonus awards were provided to our non-executive employees. Charges included in cost of revenues for bonus distributions to such employees were $2.4 million, $1.9 million and $2.0 million for fiscal year 2015, fiscal year 2014, and fiscal year 2013, respectively.
Share-based compensation expense included in cost of revenues was $1.5 million, $1.2 million and $1.1 million for fiscal year 2015, fiscal year 2014, and fiscal year 2013, respectively.
We expect to incur significant incremental costs of revenue as a result of our continued diversification into the industrial lasers, automotive, and sensors markets, and other end-markets outside of the optical communications market or our further development of customized optics and glass manufacturing capabilities. We also expect to incur incremental costs of revenue as a result of our planned expansion into new geographic markets, though we are not able to determine the amount of these incremental expenses.
Selling, General and Administrative Expenses
Our selling, general and administrative expenses (SG&A) primarily consist of corporate employee costs for sales and marketing, general and administrative, and other support personnel, including research and development expenses related to the design of customized optics and glass, travel expenses, legal and other professional fees, share-based compensation expense, and other general expenses not related to cost of revenues. In fiscal year 2016, we expect our SG&A expenses will increase on an absolute dollar basis and as a percentage of revenue compared with fiscal year 2015, due to the startup expenses of our facility in the United States.
The compensation committee of our board of directors approved a fiscal year 2015 executive incentive plan with quantitative objectives, based on achieving certain revenue and non-GAAP earnings per share targets for our fiscal year ended June 26, 2015, as well as qualitative objectives, based on achieving individual performance goals. Bonuses under our fiscal year 2015 executive incentive plan are payable after the end of fiscal year 2015. In fiscal year 2014, the compensation committee approved a fiscal year 2014 executive incentive plan with quantitative objectives, based on achieving certain revenue and gross margin percentage targets for our fiscal year ended June 27, 2014, as well as qualitative objectives, based on achieving individual performance goals. In the three months ended December 26, 2014, the compensation committee awarded bonuses to our executive employees for Company and individual achievements of performance under our fiscal year 2014 executive incentive plan. Discretionary merit-based bonus awards were also available to our non-executive employees and were payable as of June 26, 2015.
Charges included in SG&A expenses for bonus distributions to non-executive and executive employees were $3.6 million, $3.1 million and $1.7 million for fiscal year 2015, fiscal year 2014, and fiscal year 2013, respectively.
Share-based compensation expense included in SG&A expenses was $6.6 million, $4.4 million and $4.0 million for fiscal year 2015, fiscal year 2014, and fiscal year 2013, respectively.
In addition to incremental costs associated with growing our business generally, we expect to incur additional SG&A expenses as a result of expanding our business in the United States.
42
Table of Contents
Additional Financial Disclosures
Foreign Exchange
As a result of our international operations, we are exposed to foreign exchange risk arising from various currency exposures primarily with respect to the Thai Baht. Although a majority of our total revenues is denominated in U.S. dollars, a substantial portion of our payroll plus certain other operating expenses are incurred and paid in Thai Baht. The exchange rates between the Thai Baht and the U.S. dollar have fluctuated substantially in recent years and may continue to fluctuate substantially in the future. We report our financial results in U.S. dollars and our results of operations have been and may continue to be negatively impacted owing to appreciation of the Thai Baht against the U.S. dollar. Smaller portions of our expenses are incurred in a variety of other currencies, including RMB, Canadian dollars, Euros, and Japanese yen, the appreciation of which may also negatively impact our financial results.
In addition, we are exposed to foreign exchange risk in connection with the credit facility and cross currency swap arrangements we entered into with TMB Bank Public Company Limited (the “Bank”) in May 2011 for the construction of Pinehurst Building 6. The terms of the contract with the Bank provide the following facilities: (1) a term loan facility for up to Thai Baht 960 million (equal to $30.0 million) with a fixed interest rate of 5.28% per annum, (2) a hedging facility for currency interest rate swaps with a notional amount of $30.0 million, and (3) a settlement limit of Thai Baht 65 million, subject to certain terms and conditions as set forth therein. As of March 30, 2012, we had drawn down the entire $30.0 million available under the term loan facility. Borrowings and interest under the term loan have been scheduled to be repaid on a quarterly basis between September 2011 and March 2017. As of June 26, 2015 and June 27, 2014, we had outstanding borrowings under the term loan facility of $10.5 million and $16.5 million, respectively. Under the terms of the cross currency swap arrangement amounts drawn in Thai Baht were converted to U.S. dollars for repayment by us on a quarterly basis at the floating rate of 3-month London Interbank Offered Rate (LIBOR) plus 2.8% per annum.
In order to manage the risks arising from fluctuations in foreign currency exchange rates, we use derivative financial instruments. We may enter into short-term forward foreign currency contracts or put option contracts to help manage currency exposures associated with certain assets and liabilities, primarily short-term obligations. The forward exchange contracts and put option contracts generally had original maturities of one to six months. All foreign currency exchange contracts are recognized on the consolidated balance sheets at fair value. As we do not apply hedge accounting to these instruments, the change in the fair value of the derivatives are recorded in foreign exchange (loss) gain, net on the consolidated statements of operations and comprehensive income. The gains and losses on our forward contracts and put option contracts generally offset losses and gains on the assets, liabilities, and transactions economically hedged and, accordingly, generally do not subject us to the risk of significant accounting losses.
We had foreign currency assets and liabilities in Thai Baht and RMB as follows:
| As of June 26, 2015 | As of June 27, 2014 | |||||||||||||||||||||||
| (amount in thousands, except percentages) | Currency | $ | % | Currency | $ | % | ||||||||||||||||||
| Assets |
||||||||||||||||||||||||
| Thai Baht |
377,785 | $ | 11,596 | 51.3 | 1,536,887 | $ | 47,318 | 79.6 | ||||||||||||||||
| RMB |
67,455 | 11,029 | 48.7 | 74,813 | 12,156 | 20.4 | ||||||||||||||||||
|
|
|
|
|
|
|
|
|
|||||||||||||||||
| Total |
$ | 22,625 | 100.0 | $ | 59,474 | 100.0 | ||||||||||||||||||
|
|
|
|
|
|
|
|
|
|||||||||||||||||
| Liabilities |
||||||||||||||||||||||||
| Thai Baht |
860,425 | $ | 26,410 | 88.8 | 735,490 | $ | 22,644 | 81.1 | ||||||||||||||||
| RMB |
20,461 | 3,347 | 11.2 | 32,512 | 5,283 | 18.9 | ||||||||||||||||||
|
|
|
|
|
|
|
|
|
|||||||||||||||||
| Total |
$ | 29,757 | 100.0 | $ | 27,927 | 100.0 | ||||||||||||||||||
|
|
|
|
|
|
|
|
|
|||||||||||||||||
43
Table of Contents
The Thai Baht assets represent cash and cash equivalents, trade accounts receivable, deposits and other current assets. The Thai Baht liabilities represent trade accounts payable, accrued expenses, and other payables. We manage our exposure to fluctuations in foreign exchange rates by the use of foreign currency contracts and offsetting assets and liabilities denominated in the same currency in accordance with management’s policy. As of June 26, 2015 and June 27, 2014, there were $41.0 million and $15.0 million, respectively, in put option contracts outstanding on the Thai Baht payables.
The RMB assets represent cash and cash equivalents, accounts receivable, and other current assets. The RMB liabilities represent trade accounts payable, accrued expenses and other payables. As of June 26, 2015 and June 27, 2014, we did not have any selling RMB to U.S. dollar forward contracts.
As of June 26, 2015 and June 27, 2014, unrealized loss from fair market value of derivatives amounted to $0.4 million and unrealized gain from fair market value of derivatives amounted $0.1 million, respectively.
Currency Regulation and Dividend Distribution
Foreign exchange regulation in the PRC is primarily governed by the following rules:
| • | Foreign Currency Administration Rules, as amended on August 5, 2008, or the Exchange Rules; |
| • | Administration Rules of the Settlement, Sale and Payment of Foreign Exchange (1996), or the Administration Rules; and |
| • | Notice on Perfecting Practices Concerning Foreign Exchange Settlement Regarding the Capital Contribution by Foreign-invested Enterprises, as promulgated by the State Administration of Foreign Exchange, or State Administration of Foreign Exchange (SAFE), on August 29, 2008, or Circular 142. |
Under the Exchange Rules, RMB is freely convertible into foreign currencies for current account items, including the distribution of dividends, interest payments, and trade and service-related foreign exchange transactions. However, conversion of RMB for capital account items, such as direct investments, loans, security investments and repatriation of investments, is still subject to the approval of SAFE.
Under the Administration Rules, foreign-invested enterprises may only buy, sell, or remit foreign currencies at banks authorized to conduct foreign exchange business after providing valid commercial documents and relevant supporting documents and, in the case of capital account item transactions, obtaining approval from SAFE. Capital investments by foreign-invested enterprises outside of the PRC are also subject to limitations, which include approvals by the Ministry of Commerce, SAFE, and the State Development and Reform Commission.
Circular 142 regulates the conversion by a foreign-invested company of foreign currency into RMB by restricting how the converted RMB may be used. Circular 142 requires that the registered capital of a foreign-invested enterprise settled in RMB converted from foreign currencies may only be used for purposes within the business scope approved by the applicable governmental authority and may not be used for equity investments within the PRC. In addition, SAFE strengthened its oversight of the flow and use of the registered capital of foreign-invested enterprises settled in RMB converted from foreign currencies. The use of such RMB capital may not be changed without SAFE’s approval and may not be used to repay RMB loans if the proceeds of such loans have not been used.
On January 5, 2007, SAFE promulgated the Detailed Rules for Implementing the Measures for the Administration on Individual Foreign Exchange, or the Implementation Rules. Under the Implementation Rules, PRC citizens who are granted share options by an overseas publicly-listed company are required, through a PRC agent or PRC subsidiary of such overseas publicly-listed company, to register with SAFE and complete certain other procedures.
44
Table of Contents
In addition, the General Administration of Taxation has issued circulars concerning employee share options. Under these circulars, our employees working in the PRC who exercise share options will be subject to PRC individual income tax. Our PRC subsidiary is obligated to file documents related to employee share options with relevant tax authorities and withhold individual income taxes of those employees who exercise their share options.
Furthermore, our transfer of funds to our subsidiaries in Thailand and the PRC are each subject to approval by governmental authorities in the case of an increase in registered capital, or subject to registration with governmental authorities in case of a shareholder loan. These limitations on the flow of funds between our subsidiaries and us could restrict our ability to act in response to changing market conditions.
Income Tax
Our effective tax rate is a function of the mix of tax rates in the various jurisdictions in which we do business. We are domiciled in the Cayman Islands. Under the current laws of the Cayman Islands, we are not subject to tax in the Cayman Islands on income or capital gains. We have received this undertaking for a 20-year period ending August 24, 2019, and after the expiration date we may request a renewal with the office of the Clerk of the Cabinet for another twenty years.
Throughout the period of our operations in Thailand, we have generally received income tax and other incentives from the Thailand Board of Investment. Preferential tax treatment from the Thai government in the form of a corporate tax exemption is currently available to us through June 2020 on income generated from the manufacture of products at Pinehurst Building 6. Such preferential tax treatment is contingent on various factors, including the export of our customers’ products out of Thailand and our agreement not to move our manufacturing facilities out of our current province in Thailand for at least 15 years. Additionally, in December 2011, the Thailand Revenue Department announced a reduction in corporate income tax rates for tax periods beginning on or after January 1, 2012. As a result of the announcement, corporate income tax rates for our Thai subsidiary will be reduced from 23% in fiscal year 2013 to 20% in fiscal year 2014, fiscal year 2015, and fiscal year 2016.
Our subsidiary in China had been granted a tax privilege to reduce its corporate income tax rate from 25% to 15% but the privilege expired on December 31, 2013.
Critical Accounting Policies and Use of Estimates
We prepare our consolidated financial statements in conformity with U.S. GAAP which requires us to make estimates and assumptions that affect the reported amounts of assets and liabilities, the disclosure of contingent liabilities on the date of the consolidated financial statements and the reported amounts of revenues and expenses during the financial reporting period. We continually evaluate these estimates and assumptions based on the most recently available information, our own historical experience and on various other assumptions that we believe to be reasonable under the circumstances, the results form the basis for making judgments about the carrying values of assets and liabilities that are not readily apparent from other sources. Because the use of estimates is an integral component of the financial reporting process, actual results could differ from those estimates. Some of our accounting policies require higher degrees of judgment than others in their application. We consider the policies discussed below to be critical to an understanding of our consolidated financial statements, as their application places the most significant demands on our management’s judgment.
A quantitative sensitivity analysis is provided where such information is reasonably available, can be reliably estimated, and provides material information to investors. The amounts used to assess sensitivity are included for illustrative purposes only and do not represent management’s predictions of variability.
45
Table of Contents
Revenue Recognition
We recognize revenue when it is realized or realizable and earned. We consider revenue realized or realizable and earned when there is persuasive evidence of an arrangement, delivery has occurred, the sales price is fixed or determinable, and collectability is reasonably assured. Delivery does not occur until products have been shipped or services have been provided, risk of loss has transferred and in cases where formal acceptance is required, customer acceptance has been obtained or customer acceptance provisions have lapsed. In situations where a formal acceptance is required but the acceptance only relates to whether the product meets its published specifications, revenue is recognized upon shipment provided all other revenue recognition criteria are met. The sales price is not considered to be fixed or determinable until all contingencies related to the sale have been resolved.
We reduce revenue for rebates and other similar allowances. Revenue is recognized only if these estimates can be reliably determined. Our estimates are based on historical results taking into consideration the type of customer, the type of transaction, and the specifics of each arrangement.
In addition to the aforementioned general policies, certain customers may request us to store finished products purchased by them at the Company’s warehouse. In these instances, we receive a written request from the customer asking us to hold the inventory at our warehouse and the ordered goods are segregated in our warehouse from other inventory and cannot be used to fulfil other customer orders. In these situations revenue is only recognized when persuasive evidence of the sales arrangement exists, the goods are completed and ready for shipment, pricing is fixed or determinable, collection is reasonable assured, and title and risk of loss have passed to the customer.
Income Related to Flooding
We estimated flood-related losses to consigned equipment and inventory based on discussions with our customers regarding their assessments of the damage to, and valuation of, the consigned assets that were under our care, custody and control at our Chokchai facility. For assets owned by us, flood-related losses were estimated based on the net book value of the assets written-off as a result of the flood.
In fiscal year 2014, we recognized $45.2 million as income related to flooding, which consisted of a payment from our insurers against our claims for owned and consigned equipment and inventory, offset by $0.5 million of other expenses from write-offs of advance payments to a customer due to flood-related losses.
Long-Lived Assets
We review property, plant and equipment for impairment when events or changes in circumstances indicate the carrying amount of an asset may not be recoverable. An impairment loss is recognized when the carrying amount of a long-lived asset or assets group exceeds its fair value. Recoverability of property and equipment is measured by comparing its carrying amount to the projected undiscounted cash flows the property and equipment are expected to generate. If such assets are considered to be impaired, the impairment loss recognized, if any, is the amount by which the carrying amount of the property and equipment exceeds its fair value.
Allowance for Doubtful Accounts
We perform ongoing credit evaluations of our customers’ financial condition and make provisions for doubtful accounts based on the outcomes of these credit evaluations. We evaluate the collectability of our accounts receivable based on specific customer circumstances, current economic trends, historical experience with collections, and the age of past due receivables. Unanticipated changes in the liquidity or financial position of our customers may require additional provisions for doubtful accounts. Under our specific identification method it is not practical to assess the sensitivity of our estimates.
46
Table of Contents
Inventory Valuation
Our inventory is stated at the lower of cost (on a first-in, first-out basis) or market value. Our industry is characterized by rapid technological change, short-term customer commitments, and rapid changes in demand. We make provisions for estimated excess and obsolete inventory based on regular reviews of inventory quantities on hand and the latest forecasts of product demand and production requirements from our customers. If actual market conditions or our customers’ product demands are less favorable than those projected, additional provisions may be required. In addition, unanticipated changes in liquidity or the financial positions of our customers or changes in economic conditions may require additional provisions for inventory due to our customers’ inability to fulfill their contractual obligations. During fiscal year 2015 and fiscal year 2014, a change of 10% for excess and obsolete materials, based on product demand and production requirements from our customers, would have decreased by decrease our net income by approximately $0.3 million and $0.3 million, respectively.
Deferred Income Taxes
Our deferred income tax assets represent temporary differences between the carrying amount and the tax basis of existing assets and liabilities that will result in deductible and payable amounts in future years, including net operating loss carryforwards. Based on estimates, the carrying value of our net deferred tax assets assumes that it is more likely than not that we will be able to generate sufficient future taxable income in certain tax jurisdictions to realize these deferred income tax assets. Our judgments regarding future profitability may change owing to future market conditions, changes in U.S. or international tax laws, or other factors. If these estimates and related assumptions change in the future, we may be required to increase or decrease our valuation allowance against the deferred tax assets, resulting in additional or lesser income tax expense. As of June 26, 2015 we have determined that it is more likely than not that deferred tax asset attributable to a subsidiary in the United States will not be realized, primarily due to uncertainties related to the subsidiary’s ability to utilize its operating loss carryforward before they expire. Accordingly, we have established a valuation allowance for such deferred tax asset of $1.0 million. As of June 27, 2014, we assessed all of our deferred tax assets as more likely than not to be realizable and, accordingly, did not have a valuation allowance against our deferred tax assets.
We assess tax positions in a previously filed tax return or a position expected to be taken in a future tax return that is reflected in measuring current or deferred income tax assets and liabilities for interim or annual periods, based on the technical merits of the position. We apply a “more likely than not” basis (i.e., a likelihood greater than 50 percent), in accordance with the authoritative guidance, and recognize a tax provision in the consolidated financial statements for an uncertain tax position that would not be sustained.
Share-Based Compensation
Awards granted are accounted for by recognizing the cost of employee services received in exchange for awards of equity instruments, based on the fair value of those awards, in the consolidated financial statements. In determining the fair value of awards, we are required to make estimates of the fair value of our ordinary shares, expected dividends to be issued, expected volatility of our shares, expected forfeitures of the awards, risk free interest rates for the expected terms of the awards, expected terms of the awards, and the vesting period of the respective awards.
The determination of our share-based compensation expense for both current and future periods requires the input of assumptions, including estimated forfeitures and the price volatility of the underlying ordinary shares. We estimate forfeitures based on past employee retention rates and our expectations of future retention rates, and we will prospectively revise our forfeiture rates based on actual history. Our share-based compensation expense may change based on changes to our actual forfeitures.
For accounting purposes only, the fair value of each option grant is estimated using the Black-Scholes-Merton option pricing model, which takes into account the following factors: (i) the exercise price of the options;
47
Table of Contents
(ii) the estimated fair value of the underlying ordinary shares; (iii) the expected life of the options; (iv) the expected volatility of the underlying ordinary shares; (v) the risk-free interest rate during the expected life of the options; and (vi) the expected dividend yield of the underlying ordinary shares. However, these fair values are inherently uncertain and highly subjective.
The exercise price of the options is stated in the option agreements. The expected life of the options involves estimates of the anticipated timing of the exercise of the vested options. The expected volatility is based on the historical volatility of the capital stock of comparable publicly-traded companies. We have applied the U.S. Treasury Bill interest rate with a maturity date similar to the expected life of our options as the risk-free interest rate and assumed a dividend yield for periods when we paid dividends.
Results of Operations
The following table sets forth a summary of our consolidated statements of operations and comprehensive income. Note that period-to-period comparisons of operating results should not be relied upon as indicative of future performance.
| Years Ended | ||||||||||||
| June 26, 2015 | June 27, 2014 | June 28, 2013 | ||||||||||
| Revenues |
$ | 773,587 | $ | 677,854 | $ | 641,542 | ||||||
| Cost of revenues |
(685,814 | ) | (603,621 | ) | (572,124 | ) | ||||||
|
|
|
|
|
|
|
|||||||
| Gross profit |
87,773 | 74,233 | 69,418 | |||||||||
| Selling, general and administrative expenses |
(39,460 | ) | (27,664 | ) | (23,787 | ) | ||||||
| Income related to flooding |
— | 44,748 | 27,211 | |||||||||
| Expenses related to reduction in workforce |
(1,153 | ) | — | (2,052 | ) | |||||||
|
|
|
|
|
|
|
|||||||
| Operating income |
47,160 | 91,317 | 70,790 | |||||||||
| Interest income |
1,253 | 1,793 | 1,083 | |||||||||
| Interest expense |
(616 | ) | (713 | ) | (1,010 | ) | ||||||
| Foreign exchange (loss) gain, net |
(19 | ) | (24 | ) | 354 | |||||||
| Other (expense) income |
(152 | ) | 797 | 692 | ||||||||
|
|
|
|
|
|
|
|||||||
| Income before income taxes |
47,626 | 93,170 | 71,909 | |||||||||
| Income tax expense |
(3,984 | ) | (1,439 | ) | (2,940 | ) | ||||||
|
|
|
|
|
|
|
|||||||
| Net income |
43,642 | 91,731 | 68,969 | |||||||||
| Other comprehensive loss |
(44 | ) | — | — | ||||||||
|
|
|
|
|
|
|
|||||||
| Net comprehensive income |
$ | 43,598 | $ | 91,731 | $ | 68,969 | ||||||
|
|
|
|
|
|
|
|||||||
48
Table of Contents
The following table sets forth a summary of our consolidated statements of operations and comprehensive income as a percentage of total revenues for the periods indicated.
| Years Ended | ||||||||||||
| June 26, 2015 | June 27, 2014 | June 28, 2013 | ||||||||||
| Revenues |
100.0 | % | 100.0 | % | 100.0 | % | ||||||
| Cost of revenues |
(88.6 | ) | (89.1 | ) | (89.2 | ) | ||||||
|
|
|
|
|
|
|
|||||||
| Gross profit |
11.4 | 10.9 | 10.8 | |||||||||
| Selling, general and administrative expenses |
(5.1 | ) | (4.1 | ) | (3.7 | ) | ||||||
| Income related to flooding |
— | 6.6 | 4.2 | |||||||||
| Expenses related to reduction in workforce |
(0.2 | ) | — | (0.3 | ) | |||||||
|
|
|
|
|
|
|
|||||||
| Operating income |
6.1 | 13.4 | 11.0 | |||||||||
| Interest income |
0.2 | 0.3 | 0.2 | |||||||||
| Interest expense |
(0.1 | ) | (0.1 | ) | (0.2 | ) | ||||||
| Foreign exchange (loss) gain, net |
(0.0 | ) | (0.0 | ) | 0.1 | |||||||
| Other (expense) income |
(0.0 | ) | 0.1 | 0.1 | ||||||||
|
|
|
|
|
|
|
|||||||
| Income before income taxes |
6.2 | 13.7 | 11.2 | |||||||||
| Income tax expense |
(0.5 | ) | (0.2 | ) | (0.5 | ) | ||||||
|
|
|
|
|
|
|
|||||||
| Net income |
5.6 | 13.5 | 10.7 | |||||||||
| Other comprehensive loss |
(0.0 | ) | — | — | ||||||||
|
|
|
|
|
|
|
|||||||
| Net comprehensive income |
5.6 | % | 13.5 | % | 10.7 | % | ||||||
|
|
|
|
|
|
|
|||||||
The following table sets forth our revenues by end market for the periods indicated. As necessary, comparative figures have been adjusted to conform with changes in presentation in the current year.
| Years Ended | ||||||||||||
| (amount in thousands) | June 26, 2015 | June 27, 2014 | June 28, 2013 | |||||||||
| Optical communications |
$ | 553,245 | $ | 484,071 | $ | 449,790 | ||||||
| Lasers, sensors, and other |
220,342 | 193,783 | 191,752 | |||||||||
|
|
|
|
|
|
|
|||||||
| Total |
$ | 773,587 | $ | 677,854 | $ | 641,542 | ||||||
|
|
|
|
|
|
|
|||||||
We operate and internally manage a single operating segment. As such, discrete information with respect to separate product lines and segments is not accumulated.
Comparison of Fiscal Year 2015 with Fiscal Year 2014
Total revenues. Our total revenues increased by $95.7 million, or 14.1%, to $773.6 million for fiscal year 2015, compared with $677.9 million for fiscal year 2014. This increase was due to i) an increase in customer’s demand for both optical and non-optical communication manufacturing services during fiscal year 2015 and ii) the consignment revenues recognition during fiscal year 2015 of $16.5 million. Revenues from optical communications products represented 71.5% of our total revenues for fiscal year 2015, compared with 71.4% for fiscal year 2014.
Cost of revenues. Our cost of revenues increased by $82.2 million, or 13.6%, to $685.8 million, or 88.6% of total revenues, for fiscal year 2015, compared with $603.6 million, or 89.1% of total revenues, for fiscal year 2014. The increase in cost of revenues on an absolute dollar basis was primarily due to an increase in sales volume, partially offset by a favorable product mix. Cost of revenues also included non-cash share-based compensation expense of $1.5 million for fiscal year 2015, compared with $1.2 million for fiscal year 2014.
49
Table of Contents
Gross profit. Our gross profit increased by $13.5 million, or 18.2%, to $87.8 million, or 11.4% of total revenues, for fiscal year 2015, compared with $74.2 million, or 11.0% of total revenues, for fiscal year 2014. The slight increase in gross profit margin during fiscal year 2015, compared with fiscal year 2014, was primarily related to an increase in revenues resulting from increases in both optical and non-optical products sales volume, as well as a favorable product mix.
SG&A expenses. Our SG&A expenses increased by $11.8 million, or 42.6%, to $39.5 million, or 5.1% of total revenues, for fiscal year 2015, compared with $27.7 million, or 4.1% of total revenues, for fiscal year 2014. Our SG&A expenses increased both in absolute dollars and as a percentage of revenue during fiscal year 2015, compared with fiscal year 2014, mainly due to; (i) an increase of $2.8 million in costs related to the Audit committee’s internal investigation; (ii) an increase of $1.3 million in accrued executive salaries and other benefits; (iii) an increase of $2.2 million in share-based compensation; (iv) an increase of $2.9 million in pre-operating expenses of our subsidiary’s new facility in the United States; (v) an increase of $0.7 million in post-retirement benefit in fiscal year 2015 due to an increase in the number of employees; and (vi) an increase of $0.9 million in expenses related to business development.
Income related to flooding. In fiscal year 2014, we recognized income related to flooding of $45.2 million, which consisted of a payment from our insurers against our claim for owned and customer-owned equipment and inventory, offset by $0.5 million of other expenses from write-offs of advance payments to a customer due to flood-related losses.
Expenses related to reduction in workforce. During fiscal year 2015, we implemented a reduction in workforce and incurred expenses of approximately $1.2 million, which represented severance and benefits costs associated with the termination of approximately 100 employees in accordance with contractual obligations and local regulations.
Operating income. Our operating income decreased by $44.2 million to $47.2 million, or 6.1% of total revenues, for fiscal year 2015, compared with $91.3 million, or 13.5% of total revenues, for fiscal year 2014.
Interest income. Our interest income decreased by $0.5 million to $1.3 million for fiscal year 2015, compared with $1.8 million for fiscal year 2014. This decrease was due to a decrease in interest rates of bank deposits and the short-term investment in marketable securities.
Interest expense. Our interest expense decreased by $0.1 million to $0.6 million for fiscal year 2015, compared with $0.7 million for fiscal year 2014. This decrease was due to decreases in our average long-term loan balances resulting from principal repayments during the fiscal year 2014.
Income before income taxes. We recorded income before income taxes of $47.6 million for fiscal year 2015, compared with $93.2 million for fiscal year 2014.
Income tax expense. Our provision for income tax reflects an effective tax rate of 8.3% for fiscal year 2015, compared with an effective tax rate of 1.5% for fiscal year 2014. The increase was primarily due to the fact that the income tax rate of our subsidiary in China increased from 15% to 25% commencing the quarter ended March 28, 2014 due to the expiration of a tax privilege, as well as the reversal of liability for uncertain tax positions, including accrued interest of $1.5 million during the fiscal year 2014 and the fact that we had higher taxable income during fiscal year 2015, as compared with fiscal year 2014 due to the income related to flooding of $44.7 million that was not subjected to income tax.
Net income. We recorded net income of $43.6 million, or 5.6% of total revenues, for fiscal year 2015, compared with net income of $91.7 million, or 13.5% of total revenues, for fiscal year 2014.
Other comprehensive loss. We recorded other comprehensive loss related to accumulated net unrealized loss on available-for-sale investments of $0.04 million for the fiscal year 2015.
50
Table of Contents
Comparison of Fiscal Year 2014 with Fiscal Year 2013
Total revenues. Our total revenues increased by $36.3 million, or 5.7%, to $677.9 million for fiscal year 2014, compared with $641.5 million for fiscal year 2013. This increase was primarily due to an increase in optical communication products sales volume. Revenues from optical communications products represented 71.4% of our total revenues for fiscal year 2014, compared with 70.1% for fiscal year 2013.
Cost of revenues. Our cost of revenues increased by $31.5 million, or 5.5%, to $603.6 million, or 89.1% of total revenues, for fiscal year 2014, compared with $572.1 million, or 89.2% of total revenues, for fiscal year 2013. The increase in cost of revenues on an absolute dollar basis was primarily due to an increase in sales volume and a proportional increase in cost of revenues. Cost of revenues also included non-cash share-based compensation expense of $1.2 million for fiscal year 2014, compared with $1.1 million for fiscal year 2013.
Gross profit. Our gross profit increased by $4.8 million, or 6.9%, to $74.2 million, or 11.0% of total revenues, for fiscal year 2014, compared with $69.4 million, or 10.8% of total revenues, for fiscal year 2013. The slight increase in gross profit margin during fiscal year 2014, compared with fiscal year 2013, was primarily related to an increase in revenues resulting from increases in both optical and non-optical products sales volume.
SG&A expenses. Our SG&A expenses increased by $3.9 million, or 16.3%, to $27.7 million, or 4.1% of total revenues, for fiscal year 2014, compared with $23.8 million, or 3.7% of total revenues, for fiscal year 2013. Our SG&A expenses increased both in absolute dollars and as a percentage of revenue during fiscal year 2014, compared with fiscal year 2013, mainly due to: (i) a $1.8 million increase in accrued executive bonuses, salaries, and other benefits; (ii) the recognition of $0.5 million in severance and related payments to an executive who left the Company in March 2014; (iii) a $0.7 million increase in severance liability expense in fiscal year 2014 due to an increase in the number of employees; and (iv) a $0.4 million increase in share-based compensation charges.
Income related to flooding. In fiscal year 2014, we recognized income related to flooding of $45.2 million, which consisted of a payment from our insurers against our claims for owned and customer-owned equipment and inventory, offset by the recognition of $0.5 million from write-offs of advance payments to a customer due to flood-related losses. In fiscal year 2013, we recognized $27.2 million of income related to flooding, which consisted of an interim payment from our insurers of $16.2 million against our claims for owned inventory losses and owned equipment losses, a payment of $13.1 million from our insurers in full and final settlement of our claims for business interruption losses and a payment of $0.1 million from our insurers in full and final settlement of our claim for damage to our buildings at Pinehurst, which was offset by the recognition of $2.2 million in additional liabilities to third parties due to flood losses.
Expenses related to reduction in workforce. During fiscal year 2013, we implemented a reduction in workforce and incurred expenses of approximately $2.1 million, which represented severance and benefits costs associated with the termination of approximately 180 employees in accordance with contractual obligations and local regulations.
Operating income. Our operating income increased by $20.5 million to $91.3 million, or 13.5% of total revenues, for fiscal year 2014, compared with $70.8 million, or 11.0% of total revenues, for fiscal year 2013.
Interest income. Our interest income increased by $0.7 million to $1.8 million for fiscal year 2014, compared with $1.1 million for fiscal year 2013. This increase was due to increases in cash and cash equivalent balances and an increase in interest rates.
Interest expense. Our interest expense decreased by $0.3 million to $0.7 million for fiscal year 2014, compared with $1.0 million for fiscal year 2013. This decrease was due to decreases in our average long-term loan balances resulting from repayments during the year.
51
Table of Contents
Income before income taxes. We recorded income before income taxes of $93.2 million for fiscal year 2014, compared with $71.9 million for fiscal year 2013.
Income tax expense. Our provision for income tax reflects an effective tax rate of 1.5% for fiscal year 2014, compared with an effective tax rate of 4.1% for fiscal year 2013. The decrease was primarily due to the reversal of liability for uncertain tax positions in fiscal year 2014, including accrued interest of $1.5 million, an increase in deferred tax assets of $0.6 million and the fact that we had lower taxable income during fiscal year 2014 because the income related to flooding of $44.7 million in fiscal year 2014 was not subjected to income tax, as compared with $27.2 million of income related to flooding during fiscal year 2013 that was not subject to income tax and the reversal of liability for uncertain tax positions of $0.6 million for fiscal year 2013.
Net income. We recorded net income of $91.7 million, or 13.5% of total revenues, for fiscal year 2014, compared with a net income of $69.0 million, or 10.7% of total revenues, for fiscal year 2013.
Liquidity and Capital Resources
We primarily finance our operations through cash flow from operations activities. As of June 26, 2015, June 27, 2014, and June 28, 2013, we had cash, cash equivalents, and marketable securities of $255.8 million, $233.5 million, and $149.7 million, respectively, and outstanding debt of $40.5 million, $16.5 million, and $28.9 million, respectively.
Our cash and cash equivalents, which primarily consist of cash on hand, demand deposits and liquid investments with original maturities of three months or less, are placed with banks and other financial institutions. The weighted average interest rate on our cash and cash equivalents for fiscal year 2015, fiscal year 2014, and fiscal year 2013 was 0.7%, 1.0% and 0.9%, respectively.
Our cash investments are made in accordance with an investment policy approved by the Audit Committee of our Board of Directors. In general, our investment policy requires that securities purchased be rated A1, P-1, F1 or better. No security may have an effective maturity that exceeds three years. Our investments in fixed income securities are primarily classified as available-for-sale securities and are recorded at fair value. The cost of securities sold is based on the specific identification method. Unrealized gains and losses on these securities are recorded as other comprehensive income (loss) and are reported as a separate component of shareholders’ equity.
For fiscal year 2015, we borrowed $ 30.0 million under our Facility Agreement in order to purchase land and a building in the United States. In addition to better manage our cash on hand, we invested in short-term marketable securities of $ 203.4 million.
As of June 27, 2014, we had settled all insurance claims for flood-related losses. We recognized $45.2 million of income related to flooding in fiscal year 2014, which consisted of a payment from our insurers against our claims for owned and customer-owned equipment and inventory, offset by the recognition of $0.5 million of other expense from write-offs of advance payments to a customer due to flood-related losses.
For fiscal year 2013, we recognized $29.4 million of income related to flooding, which consisted of an interim payment from our insurers of $16.2 million against our claims for owned inventory losses and owned equipment losses, a payment from our insurer of $13.1 million in full and final settlement of our claim for business interruption losses, and a payment from our insurer of $0.1 million in full and final settlement of our claim for damage to our buildings at Pinehurst. For fiscal year 2013, we recognized additional expenses of $2.2 million related to liabilities to third parties due to flood losses.
During fiscal year 2014, we fulfilled our obligations to a customer in accordance with a settlement agreement entered into during the third quarter of fiscal year 2013 by making a final cash payment of $5.3 million and transferring equipment with an aggregate value of $2.3 million to a customer. In addition, we
52
Table of Contents
fulfilled our obligations to a customer’s insurers in accordance with a settlement agreement entered into during the fourth quarter of fiscal year 2013 by making a final payment of $2.3 million.
During fiscal year 2013, we entered into a settlement agreement with three of our customers relating to our liability for the customers’ losses as a result of the flooding and made an initial aggregate payment of $8.1 million to such customers.
We believe that our current cash, cash equivalents, marketable securities, cash flow from operations, and funds available through our credit facility will be sufficient to meet our working capital and capital expenditure needs for the next 12 months. Our ability to sustain our working capital position is subject to a number of risks that we discuss in Item 1A of this Annual Report on Form 10-K.
We believe that our current manufacturing capacity, including our new facility in the United States, is sufficient to meet anticipated production requirements for at least the next 12 months. We maintain a long-term credit facility associated with construction of production facilities at our Pinehurst campus in Thailand that will come due within the next 21 months, and we anticipate that our internally generated working capital, together with our cash and cash equivalents will be adequate to repay this obligation.
The following table shows our cash flows for the periods indicated:
| Years Ended | ||||||||||||
| (amount in thousands) | June 26, 2015 | June 27, 2014 | June 28, 2013 | |||||||||
| Net cash provided by operating activities |
$ | 52,629 | $ | 66,550 | $ | 48,750 | ||||||
| Net cash (used in) provided by investing activities |
$ | (195,499 | ) | $ | 26,988 | $ | (5,862 | ) | ||||
| Net cash provided by (used in) financing activities |
$ | 22,537 | $ | (8,171 | ) | $ | (9,128 | ) | ||||
| Net (decrease) increase in cash and cash equivalents |
$ | (120,333 | ) | $ | 85,367 | $ | 33,760 | |||||
| Cash and cash equivalents, beginning of period |
$ | 233,477 | $ | 149,716 | $ | 115,507 | ||||||
| Cash and cash equivalents, end of period |
$ | 112,978 | $ | 233,477 | $ | 149,716 | ||||||
Operating Activities
Net cash provided by operating activities decreased by $13.9 million, or 20.9%, to $52.6 million for fiscal year 2015, compared with net cash provided by operating activities of $66.6 million for fiscal year 2014. This decrease was primarily due to a decrease of $51.2 million in cash collection from customers, off-set with a decrease of $2.8 million in cash payment to vendor and a decrease of $29.6 million in inventory as a result of higher customer demand during fiscal year 2015.
Net cash provided by operating activities increased by $17.8 million, or 36.5%, to $66.6 million for fiscal year 2014, compared with net cash provided by operating activities of $48.8 million for fiscal year 2013. The increase was primarily due to an increase in net income from operations, a decrease of $34.5 million in flood-related liabilities to third parties, as we fulfilled our payment obligations to our customers under settlement agreements entered into during fiscal year 2014 and fiscal year 2013, a decrease of $26.6 million in cash payment to vendor, and an increase of $12.6 million in cash collection from customers which were offset by an increase of $50.3 million in inventory.
Investing Activities
Net cash used in investing activities increased by $222.5 million, or 824.4%, to $195.5 million for fiscal year 2015, compared with net cash provided by investing activities of $27.0 million for fiscal year 2014. The increase in net cash used in investing activities was primarily due to an increase of $144.0 million in short-term investment in marketable securities, an increase of $40.6 million in purchase of property, plant, and equipment to support new facility in the United States, and a decrease of $37.8 million in proceeds against claims related to flood damage to consigned and owned equipment.
53
Table of Contents
Net cash provided by investing activities increased by $32.9 million, or 560.4%, to $27.0 million for fiscal year 2014, compared with net cash used in investing activities of $5.9 million for fiscal year 2013. The increase in net cash provided by investing activities was primarily due to the receipt of $37.8 million in proceeds against claims related to flood damage to consigned and owned equipment.
Financing Activities
Net cash provided by financing activities increased by $30.7 million, or 375.8%, to $22.5 million for fiscal year 2015, compared with net cash used in financing activities of $8.2 million for fiscal year 2014. This increase was primarily due to an increase in proceeds from a revolving loan of $30.0 million to purchase land and a building for a new facility in the United States and a decrease in repayment of a long-term loan from a bank of $6.0 million, off-set with the payment of debt issuance costs of $1.9 million and a decrease in proceeds from the issuance of ordinary shares under employee share option plans of $3.7 million.
Net cash used in financing activities decreased by $1.0 million, or 10.5%, to $8.2 million for fiscal year 2014, compared with net cash used in financing activities of $9.1 million for fiscal year 2013. This decrease was primarily due to an increase of $4.0 million from the proceeds from issuance of ordinary shares under employee share option plans, offset by an increase of $2.7 million from the early repayment of long-term loans for Pinehurst Building 5.
Contractual Obligations
The following table sets forth certain of our contractual obligations as of June 26, 2015:
| Payments Due by Period | ||||||||||||||||||||
| (amount in thousands) | Total | Less than 1 year |
1-3 years | 3-5 years | More than 5 years |
|||||||||||||||
| Long-term debt obligations |
$ | 10,500 | $ | 6,000 | $ | 4,500 | $ | — | $ | — | ||||||||||
| Interest expense obligation (1) |
329 | 259 | 70 | — | — | |||||||||||||||
| Operating lease obligations |
3,891 | 1,153 | 1,958 | 780 | — | |||||||||||||||
| Severance liabilities (2) |
5,477 | 389 | 379 | 513 | 4,196 | |||||||||||||||
| Provision for uncertain income tax position |
1,575 | — | 459 | 564 | 552 | |||||||||||||||
|
|
|
|
|
|
|
|
|
|
|
|||||||||||
| Total |
$ | 21,772 | $ | 7,801 | $ | 7,366 | $ | 1,857 | $ | 4,748 | ||||||||||
|
|
|
|
|
|
|
|
|
|
|
|||||||||||
| (1) | Interest expense obligation reflects the interest rate on long-term debt obligation as of June 26, 2015. The interest rate was 3.1%. For further discussion of long-term and short-term debt obligations, see Note 11 of our audited consolidated financial statements. |
| (2) | Severance liabilities as of June 26, 2015 are determined based on management assumptions, see Note 12 of our audited consolidated financial statements. |
As of June 26, 2015, our long-term debt obligations consisted of approximately $10.5 million outstanding under a loan agreement. The loan is secured by certain property, plant and equipment and prescribes maximum ratios of debt to equity and minimum levels of debt service coverage ratios (i.e., earnings before interest expenses and depreciation and amortization plus cash on hand minus short-term debts divided by current portion of long-term debts plus interest expenses). These financial ratio covenants could restrict our ability to incur additional indebtedness and limit our ability to use our cash. Our long-term debt obligation also include customary events of default.
As of June 26, 2015, we were in compliance with our long-term loan agreements. Nonetheless, in the event of a default on these loans or a breach of a financial ratio covenant, the lenders may immediately cancel the loan agreements, deem the full amount of the outstanding indebtedness immediately due and payable; charge us
54
Table of Contents
interest on a monthly basis on the full amount of the outstanding indebtedness and, if we cannot repay all of our outstanding obligations, sell the assets pledged as collateral for the loans in order to fulfill our obligations to the lenders. We may also be held responsible for any damages and related expenses incurred by the lender as a result of any default.
We entered into a syndicated senior credit facility agreement (the “Facility Agreement”) with a consortium of banks on May 22, 2014. The Facility Agreement, led by Bank of America, provides for a $200.0 million credit line, comprised of a $150.0 million revolving loan facility and a $50.0 million delayed draw term loan facility. The revolving loan facility contains an accordion feature permitting us to request an increase in the facility up to $100.0 million subject to customary terms and conditions and provided that no default or event of default exists at the time of request. The revolving loan facility terminates and all amounts outstanding are due and payable in full on May 22, 2019. The principal amount of any drawn term loans must be repaid according to the scheduled quarterly amortization payments, with final payment of all amounts outstanding, plus accrued interest, being due May 22, 2019.
On February 26, 2015, we entered into the Second Amendment to the Facility Agreement. The amendment extended the availability period for draws on the term loan facility from May 21, 2015 to July 31, 2015. It also allows us, upon the satisfaction of certain conditions, to designate from time to time one or more of Fabrinet’s subsidiaries as borrowers under the Facility Agreement. On July 31, 2015, we entered into the Third Amendment to the Facility Agreement. The amendment extended the availability period for draws on the term loan facility from July 31, 2015 to July 31, 2016.
As of June 26, 2015, the outstanding revolving borrowing under the Facility Agreement was $30.0 million, resulting in available credit facilities of $170.0 million.
As of June 26, 2015, we also had certain operating lease arrangements in which the lease payments are calculated based on specified formulas. Our rental expenses under these leases were $1.1 million, $0.8 million, and $0.8 million for fiscal year 2015, fiscal year 2014, and fiscal year 2013, respectively.
Capital Expenditures
The following table sets forth our capital expenditures, which include amounts for which payments have been accrued, for the periods indicated.
| Years Ended | ||||||||||||
| (amount in thousands) | June 26, 2015 | June 27, 2014 | June 28, 2013 | |||||||||
| Capital expenditures |
$ | 56,130 | $ | 10,604 | $ | 9,284 | ||||||
Our capital expenditures for fiscal year 2014 and fiscal year 2013 principally consisted of investment in equipment for our manufacturing facilities. During fiscal year 2015, our capital expenditures consisted of purchase of property and equipment. During fiscal year 2016, we expect to purchase additional equipment for our new manufacturing facility in the United States.
Off-Balance Sheet Commitments and Arrangements
As of June 26, 2015, we did not have any off-balance sheet arrangements as defined in Item 303(a)(4)(ii) of SEC Regulation S-K.
Recent Accounting Pronouncements
See Note 2 of the Notes to Consolidated Financial Statements for recent accounting pronouncements that could have an effect on us.
55
Table of Contents
| ITEM 7A. | QUANTITATIVE AND QUALITATIVE DISCLOSURES ABOUT MARKET RISK. |
Interest Rate Risk
We had cash, cash equivalents, and marketable securities totaling $255.8 million, $233.5 million, and $149.7 million as of June 26, 2015, June 27, 2014, and June 28, 2013, respectively. Our exposure to interest rate risk primarily relates to the interest income generated by excess cash invested in highly liquid investments with maturities of three months or less from the original dates of purchase. The cash and cash equivalents are held for working capital purposes. We have not used derivative financial instruments in our investment portfolio. We have not been exposed nor do we anticipate being exposed to material risks due to changes in market interest rates. Declines in interest rates, however, will reduce future investment income. If overall interest rates had declined by 10 basis points during fiscal year 2015, fiscal year 2014, and fiscal year 2013, our interest income would have decreased by approximately $0.1 million, $0.2 million, and $0.1 million, respectively, assuming consistent investment levels.
Interest rate risk also refers to our exposure to movements in interest rates associated with our interest bearing liabilities. The interest bearing liabilities are denominated in U.S. dollars and the interest expense is based on LIBOR, plus an additional margin, depending on the lending institution. If the SIBOR and the LIBOR had increased by 100 basis points during fiscal year 2015, fiscal year 2014, and fiscal year 2013, our interest expense would have increased by approximately $0.1 million, $0.2 million, and $0.3 million, respectively, assuming consistent borrowing levels.
We maintain an investment portfolio in a variety of financial instruments, including, but not limited to, U.S. government and agency bonds, corporate obligations, money market funds, asset-backed securities, and other investment-grade securities. The majority of these investments pay a fixed rate of interest. The securities in the investment portfolio are subject to market price risk due to changes in interest rates, perceived issuer creditworthiness, marketability, and other factors. These investments are generally classified as available-for-sale and, consequently, are recorded on our consolidated balance sheets at fair value with unrealized gains or losses reported as a separate component of shareholders’ equity.
Investments in both fixed-rate and floating-rate interest earning instruments carry a degree of interest rate risk. The fair market values of our fixed-rate securities decline if interest rates rise, while floating-rate securities may produce less income than expected if interest rates fall. Due in part to these factors, our future investment income may be less than we expect because of changes in interest rates or we may suffer losses in principal if forced to sell securities that have experienced a decline in market value because of changes in interest rates.
Foreign Currency Risk
As a result of our foreign operations, we have significant expenses, assets and liabilities that are denominated in foreign currencies. Substantially all of our employees and most of our facilities are located in Thailand and the PRC. Therefore, a substantial portion of our payroll as well as certain other operating expenses are paid in Thai Baht or RMB. The significant majority of our revenues are denominated in U.S. dollars because our customer contracts generally provide that our customers will pay us in U.S. dollars.
As a consequence, our gross profit margins, operating results, profitability and cash flows are adversely impacted when the dollar depreciates relative to the Thai Baht or the RMB. We have a particularly significant currency rate exposure to changes in the exchange rate between the Thai Baht and the U.S. dollar. We must translate foreign currency-denominated results of operations, assets and liabilities for our foreign subsidiaries to U.S. dollars in our consolidated financial statements. Consequently, increases and decreases in the value of the U.S. dollar compared with such foreign currencies will affect our reported results of operations and the value of our assets and liabilities on our consolidated balance sheets, even if our results of operations or the value of those assets and liabilities has not changed in its original currency. These transactions could significantly affect the comparability of our results between financial periods or result in significant changes to the carrying value of our assets, liabilities and shareholders’ equity.
56
Table of Contents
In addition, we are exposed to foreign exchange risk in connection with the credit facility and cross currency swap arrangements we entered into with TMB Bank Public Company Limited (the “Bank”) in May 2011 for the construction of Pinehurst Building 6. The terms of the contract with the Bank provide the following facilities: (1) a term loan facility for up to Thai Baht 960 million (equal to $30.0 million) with a fixed interest rate of 5.28% per annum, (2) a hedging facility for currency swaps with a notional amount of $30.0 million, and (3) a settlement limit of Thai Baht 65 million, subject to certain terms and conditions as set forth therein. As of March 30, 2012, we had drawn down the entire $30.0 million available under the term loan facility. Borrowings and interest under the term loan are scheduled to be repaid on a quarterly basis between September 2011 and March 2017. Under the terms of the cross currency interest rate swap arrangement, all amounts drawn in Thai Baht were converted to U.S. dollars for repayment by us on a quarterly basis at the floating rate of 3-month U.S. LIBOR plus 2.8% per annum.
We attempt to hedge against these exchange rate risks by entering into hedging contracts that are typically one to six months in duration, leaving us exposed to longer term changes in exchange rates. We realized foreign exchange loss of $0.02 million and $0.02 million during fiscal year 2015 and fiscal year 2014, respectively, and foreign exchange gain of $0.4 million during fiscal year 2013. As foreign currency exchange rates fluctuate relative to the U.S. dollar, we expect to incur foreign currency translation adjustments and may incur foreign currency exchange losses. For example, a 10% weakening in the U.S. dollar against the Thai Baht and the RMB would have resulted in a decrease in our net dollar position of approximately $0.8 million and $3.5 million as of June 26, 2015 and June 27, 2014, respectively. We cannot give any assurance as to the effect that future changes in foreign currency rates will have on our consolidated financial position, operating results or cash flows.
Credit Risk
Credit risk refers to our exposures to financial institutions, suppliers and customers that have in the past and may in the future experience financial difficulty, particularly in light of recent conditions in the credit markets and the global economy. As of June 26, 2015, our cash and cash equivalents were held in deposits and highly liquid investment products with maturities of three months or less with banks and other financial institutions having credit ratings of A minus or above. As of June 26, 2015, our marketable securities are held in various financial institutions with a maturity limit not to exceed 3 years, and all securities are rated A1, P-1, F1, or better. We continue to monitor our surplus cash and consider investment in corporate and U.S. government debt as well as certain available for sale securities in accordance with our investment policy. We generally monitor the financial performance of our suppliers and customers, as well as other factors that may affect their access to capital and liquidity. Presently, we believe that we will not incur material losses due to our exposures to such credit risk.
57
Table of Contents
| ITEM 8. | FINANCIAL STATEMENTS AND SUPPLEMENTARY DATA. |
INDEX TO CONSOLIDATED FINANCIAL STATEMENTS
Consolidated Financial Statements of Fabrinet
| Page | ||||
| 59 | ||||
| Consolidated Balance Sheets as of June 26, 2015 and June 27, 2014 |
60 | |||
| 61 | ||||
| 62 | ||||
| 63 | ||||
| 65 | ||||
| Supplementary Financial Data |
||||
| Selected Quarterly Financial Data (unaudited) for the Years Ended June 26, 2015 and June 27, 2014 |
94 | |||
58
Table of Contents
REPORT OF INDEPENDENT REGISTERED PUBLIC ACCOUNTING FIRM
To the Board of Directors and Shareholders of Fabrinet
In our opinion, the accompanying consolidated balance sheets and the related consolidated statements of operations and comprehensive income, of shareholders’ equity and of cash flows present fairly, in all material respects, the financial position of Fabrinet and its subsidiaries (the “Company”) at June 26, 2015 and June 27, 2014, and the results of their operations and their cash flows for each of the three years in the period ended June 26, 2015 in conformity with accounting principles generally accepted in the United States of America. Also in our opinion, the Company maintained, in all material respects, effective internal control over financial reporting as of June 26, 2015, based on criteria established in Internal Control—Integrated Framework (2013) issued by the Committee of Sponsoring Organizations of the Treadway Commission (COSO). The Company’s management is responsible for these financial statements, for maintaining effective internal control over financial reporting and for its assessment of the effectiveness of internal control over financial reporting, included in management’s report referred to above. Our responsibility is to express opinions on these financial statements and on the Company’s internal control over financial reporting based on our integrated audits. We conducted our audits in accordance with the standards of the Public Company Accounting Oversight Board (United States). Those standards require that we plan and perform the audits to obtain reasonable assurance about whether the financial statements are free of material misstatement and whether effective internal control over financial reporting was maintained in all material respects. Our audits of the financial statements included examining, on a test basis, evidence supporting the amounts and disclosures in the financial statements, assessing the accounting principles used and significant estimates made by management, and evaluating the overall financial statement presentation. Our audit of internal control over financial reporting included obtaining an understanding of internal control over financial reporting, assessing the risk that a material weakness exists, and testing and evaluating the design and operating effectiveness of internal control based on the assessed risk. Our audits also included performing such other procedures as we considered necessary in the circumstances. We believe that our audits provide a reasonable basis for our opinions.
A company’s internal control over financial reporting is a process designed to provide reasonable assurance regarding the reliability of financial reporting and the preparation of financial statements for external purposes in accordance with generally accepted accounting principles. A company’s internal control over financial reporting includes those policies and procedures that (i) pertain to the maintenance of records that, in reasonable detail, accurately and fairly reflect the transactions and dispositions of the assets of the company; (ii) provide reasonable assurance that transactions are recorded as necessary to permit preparation of financial statements in accordance with generally accepted accounting principles, and that receipts and expenditures of the company are being made only in accordance with authorizations of management and directors of the company; and (iii) provide reasonable assurance regarding prevention or timely detection of unauthorized acquisition, use, or disposition of the company’s assets that could have a material effect on the financial statements.
Because of its inherent limitations, internal control over financial reporting may not prevent or detect misstatements. Also, projections of any evaluation of effectiveness to future periods are subject to the risk that controls may become inadequate because of changes in conditions, or that the degree of compliance with the policies or procedures may deteriorate.
/s/ PricewaterhouseCoopers ABAS Ltd.
PricewaterhouseCoopers ABAS Ltd.
Bangkok, Thailand
August 19, 2015
59
Table of Contents
CONSOLIDATED BALANCE SHEETS
| (in thousands of U.S. dollars, except share data) | As of June 26, 2015 |
As of June 27, 2014 |
||||||
| Assets |
| |||||||
| Current assets |
||||||||
| Cash and cash equivalents |
$ | 112,978 | $ | 233,477 | ||||
| Marketable securities |
142,866 | — | ||||||
| Trade accounts receivable, net |
134,952 | 101,168 | ||||||
| Inventory, net |
130,613 | 124,570 | ||||||
| Deferred tax assets |
1,662 | 1,561 | ||||||
| Prepaid expenses |
2,135 | 1,691 | ||||||
| Other current assets |
1,833 | 2,010 | ||||||
|
|
|
|
|
|||||
| Total current assets |
527,039 | 464,477 | ||||||
|
|
|
|
|
|||||
| Non-current assets |
||||||||
| Property, plant and equipment, net |
140,654 | 97,244 | ||||||
| Intangibles, net |
137 | 72 | ||||||
| Deferred tax assets |
2,249 | 1,775 | ||||||
| Deferred debt issuance costs |
2,424 | 989 | ||||||
|
|
|
|
|
|||||
| Total non-current assets |
145,464 | 100,080 | ||||||
|
|
|
|
|
|||||
| Total assets |
$ | 672,503 | $ | 564,557 | ||||
|
|
|
|
|
|||||
| Liabilities and Shareholders’ Equity |
||||||||
| Current liabilities |
||||||||
| Bank borrowings, including revolving loan and current portion of long-term loan from banks |
$ | 36,000 | $ | 6,000 | ||||
| Trade accounts payable |
115,319 | 94,853 | ||||||
| Income tax payable |
1,470 | 1,024 | ||||||
| Accrued payroll, bonus and related expenses |
9,804 | 8,612 | ||||||
| Accrued expenses |
6,405 | 4,345 | ||||||
| Other payables |
12,050 | 5,795 | ||||||
|
|
|
|
|
|||||
| Total current liabilities |
181,048 | 120,629 | ||||||
|
|
|
|
|
|||||
| Non-current liabilities |
||||||||
| Long-term loans from bank, non-current portion |
4,500 | 10,500 | ||||||
| Deferred tax liability |
737 | 1,040 | ||||||
| Severance liabilities |
5,477 | 4,453 | ||||||
| Other non-current liabilities |
1,797 | 1,099 | ||||||
|
|
|
|
|
|||||
| Total non-current liabilities |
12,511 | 17,092 | ||||||
|
|
|
|
|
|||||
| Total liabilities |
193,559 | 137,721 | ||||||
|
|
|
|
|
|||||
| Commitments and contingencies (Note 17) |
||||||||
| Shareholders’ equity |
||||||||
| Preferred shares (5,000,000 shares authorized, $0.01 par value; no shares issued and outstanding as of June 26, 2015 and June 27, 2014) |
— | — | ||||||
| Ordinary shares (500,000,000 shares authorized, $0.01 par value; 35,437,654 shares and 35,152,772 shares issued and outstanding as of June 26, 2015 and June 27, 2014, respectively) |
354 | 352 | ||||||
| Additional paid-in capital |
89,390 | 80,882 | ||||||
| Retained earnings |
389,244 | 345,602 | ||||||
| Accumulated other comprehensive loss |
(44 | ) | — | |||||
|
|
|
|
|
|||||
| Total shareholders’ equity |
478,944 | 426,836 | ||||||
|
|
|
|
|
|||||
| Total Liabilities and Shareholders’ Equity |
$ | 672,503 | $ | 564,557 | ||||
|
|
|
|
|
|||||
The accompanying notes are an integral part of these consolidated financial statements.
60
Table of Contents
CONSOLIDATED STATEMENTS OF OPERATIONS AND COMPREHENSIVE INCOME
| Years Ended | ||||||||||||
| (in thousands of U.S. dollars, except per share data) | June 26, 2015 |
June 27, 2014 |
June 28, 2013 |
|||||||||
| Revenues |
$ | 773,587 | $ | 677,854 | $ | 641,542 | ||||||
| Cost of revenues |
(685,814 | ) | (603,621 | ) | (572,124 | ) | ||||||
|
|
|
|
|
|
|
|||||||
| Gross profit |
87,773 | 74,233 | 69,418 | |||||||||
| Selling, general and administrative expenses |
(39,460 | ) | (27,664 | ) | (23,787 | ) | ||||||
| Income related to flooding |
— | 44,748 | 27,211 | |||||||||
| Expenses related to reduction in workforce |
(1,153 | ) | — | (2,052 | ) | |||||||
|
|
|
|
|
|
|
|||||||
| Operating income |
47,160 | 91,317 | 70,790 | |||||||||
| Interest income |
1,253 | 1,793 | 1,083 | |||||||||
| Interest expense |
(616 | ) | (713 | ) | (1,010 | ) | ||||||
| Foreign exchange (loss) gain, net |
(19 | ) | (24 | ) | 354 | |||||||
| Other (expense) income |
(152 | ) | 797 | 692 | ||||||||
|
|
|
|
|
|
|
|||||||
| Income before income taxes |
47,626 | 93,170 | 71,909 | |||||||||
| Income tax expense |
(3,984 | ) | (1,439 | ) | (2,940 | ) | ||||||
|
|
|
|
|
|
|
|||||||
| Net income |
43,642 | 91,731 | 68,969 | |||||||||
|
|
|
|
|
|
|
|||||||
| Other comprehensive loss, before tax: |
||||||||||||
| Change in fair value of marketable securities |
(193 | ) | — | — | ||||||||
| Less: Reclassification adjustment for net loss realized and included in net income |
149 | — | — | |||||||||
|
|
|
|
|
|
|
|||||||
| Total change in unrealized loss on marketable securities, before tax |
(44 | ) | — | — | ||||||||
| Income tax expense related to items of other comprehensive loss |
— | — | — | |||||||||
|
|
|
|
|
|
|
|||||||
| Total other comprehensive loss, net of tax |
(44 | ) | — | — | ||||||||
|
|
|
|
|
|
|
|||||||
| Net comprehensive income |
$ | 43,598 | $ | 91,731 | $ | 68,969 | ||||||
|
|
|
|
|
|
|
|||||||
| Earnings per share |
||||||||||||
| Basic |
$ | 1.23 | $ | 2.63 | $ | 2.00 | ||||||
| Diluted |
$ | 1.21 | $ | 2.58 | $ | 1.98 | ||||||
| Weighted average number of ordinary shares outstanding (thousands of shares) |
||||||||||||
| Basic |
35,354 | 34,938 | 34,557 | |||||||||
| Diluted |
35,984 | 35,589 | 34,846 | |||||||||
The accompanying notes are an integral part of these consolidated financial statements.
61
Table of Contents
FABRINET
CONSOLIDATED STATEMENTS OF SHAREHOLDERS’ EQUITY
| (in thousands of U.S. dollars, except share data) |
Ordinary Share |
Additional Paid-in Capital |
Retained Earnings |
Accumulated Other Comprehensive Loss |
Total | |||||||||||||||||||
| Shares | Amount | |||||||||||||||||||||||
| Balances at June 29, 2012 |
34,470,829 | $ | 345 | $ | 65,462 | $ | 184,902 | $ | — | $ | 250,709 | |||||||||||||
| Net income |
— | — | — | 68,969 | 68,969 | |||||||||||||||||||
| Share-based compensation expense |
— | — | 5,100 | — | — | 5,100 | ||||||||||||||||||
| Issuance of ordinary shares |
164,138 | 1 | 560 | — | — | 561 | ||||||||||||||||||
| Tax withholdings related to net share settlement of restricted share units |
— | — | (21 | ) | — | — | (21 | ) | ||||||||||||||||
|
|
|
|
|
|
|
|
|
|
|
|
|
|||||||||||||
| Balances at June 28, 2013 |
34,634,967 | 346 | 71,101 | 253,871 | — | 325,318 | ||||||||||||||||||
| Net income |
— | — | — | 91,731 | — | 91,731 | ||||||||||||||||||
| Share-based compensation expense |
— | — | 5,547 | — | — | 5,547 | ||||||||||||||||||
| Issuance of ordinary shares |
517,805 | 6 | 4,561 | — | — | 4,567 | ||||||||||||||||||
| Tax withholdings related to net share settlement of restricted share units |
— | — | (327 | ) | — | — | (327 | ) | ||||||||||||||||
|
|
|
|
|
|
|
|
|
|
|
|
|
|||||||||||||
| Balances at June 27, 2014 |
35,152,772 | 352 | 80,882 | 345,602 | — | 426,836 | ||||||||||||||||||
| Net income |
— | — | — | 43,642 | — | 43,642 | ||||||||||||||||||
| Other comprehensive loss |
— | — | — | — | (44 | ) | (44 | ) | ||||||||||||||||
| Share-based compensation expense |
— | — | 8,027 | — | — | 8,027 | ||||||||||||||||||
| Issuance of ordinary shares |
284,882 | 2 | 833 | — | — | 835 | ||||||||||||||||||
| Tax withholdings related to net share settlement of restricted share units |
— | — | (352 | ) | — | — | (352 | ) | ||||||||||||||||
|
|
|
|
|
|
|
|
|
|
|
|
|
|||||||||||||
| Balances at June 26, 2015 |
35,437,654 | $ | 354 | $ | 89,390 | $ | 389,244 | $ | (44 | ) | $ | 478,944 | ||||||||||||
|
|
|
|
|
|
|
|
|
|
|
|
|
|||||||||||||
The accompanying notes are an integral part of these consolidated financial statements.
62
Table of Contents
FABRINET
CONSOLIDATED STATEMENTS OF CASH FLOWS
| Years Ended | ||||||||||||
| (in thousands of U. S. dollars) | June 26, 2015 |
June 27, 2014 |
June 28, 2013 |
|||||||||
| Cash flows from operating activities |
||||||||||||
| Net income for the year |
$ | 43,642 | $ | 91,731 | $ | 68,969 | ||||||
| Adjustments to reconcile net income to net cash provided by operating activities |
||||||||||||
| Depreciation |
12,878 | 10,565 | 9,994 | |||||||||
| Amortization of intangibles |
69 | 93 | 217 | |||||||||
| Gain on disposal of property, plant and equipment |
(42 | ) | (28 | ) | (24 | ) | ||||||
| Loss from sales and maturities of marketable securities |
120 | — | — | |||||||||
| Amortization of investment premium |
985 | — | — | |||||||||
| Amortization of deferred debt issuance costs |
527 | — | — | |||||||||
| Income related to flooding |
— | (45,211 | ) | (29,465 | ) | |||||||
| Proceeds from insurers for business interruption losses related to flooding |
— | — | 13,143 | |||||||||
| Proceeds from insurers for inventory losses related to flooding |
— | 7,416 | 11,419 | |||||||||
| Allowance for doubtful accounts (reversal of) |
13 | (72 | ) | (94 | ) | |||||||
| Unrealized loss (gain) on exchange rate and fair value of derivative |
671 | 722 | (1,043 | ) | ||||||||
| Share-based compensation |
8,027 | 5,547 | 5,100 | |||||||||
| Deferred income tax |
(878 | ) | 65 | 2,086 | ||||||||
| Other non-cash expenses (income) |
1,722 | 634 | (89 | ) | ||||||||
| Reversal of uncertain tax positions |
— | (1,538 | ) | — | ||||||||
| Inventory obsolescence (reversal of) |
397 | 443 | (584 | ) | ||||||||
| Loss from written-off assets and liabilities to third parties due to flood losses |
— | — | 2,255 | |||||||||
| Changes in operating assets and liabilities |
||||||||||||
| Trade accounts receivable |
(33,797 | ) | 17,379 | 4,739 | ||||||||
| Inventory |
(6,440 | ) | (36,051 | ) | 14,229 | |||||||
| Other current assets and non-current assets |
(283 | ) | (1,035 | ) | (1,207 | ) | ||||||
| Trade accounts payable |
20,466 | 17,714 | (8,861 | ) | ||||||||
| Income tax payable |
446 | 737 | (5 | ) | ||||||||
| Other current liabilities and non-current liabilities |
4,106 | 4,951 | (35 | ) | ||||||||
| Liabilities to third parties due to flood losses |
— | (7,512 | ) | (41,994 | ) | |||||||
|
|
|
|
|
|
|
|||||||
| Net cash provided by operating activities |
52,629 | 66,550 | 48,750 | |||||||||
|
|
|
|
|
|
|
|||||||
| Cash flows from investing activities |
||||||||||||
| Purchase of marketable securities |
(203,407 | ) | — | — | ||||||||
| Proceeds from sales of marketable securities |
29,036 | — | — | |||||||||
| Proceeds from maturities of marketable securities |
30,356 | — | — | |||||||||
| Purchase of property, plant and equipment |
(51,398 | ) | (10,835 | ) | (10,793 | ) | ||||||
| Purchase of intangibles |
(134 | ) | (1 | ) | (2 | ) | ||||||
| Proceeds from disposal of property, plant and equipment |
48 | 29 | 29 | |||||||||
| Proceeds from insurers in settlement of claims related to flood damage |
— | 37,795 | 4,904 | |||||||||
|
|
|
|
|
|
|
|||||||
| Net cash (used in) provided by investing activities |
(195,499 | ) | 26,988 | (5,862 | ) | |||||||
|
|
|
|
|
|
|
|||||||
| Cash flows from financing activities |
||||||||||||
| Payment of debt issuance costs |
(1,946 | ) | — | — | ||||||||
| Proceeds from revolving loan |
30,000 | — | — | |||||||||
| Repayment of long-term loans from bank |
(6,000 | ) | (12,411 | ) | (9,668 | ) | ||||||
| Proceeds from issuance of ordinary shares under employee share option plan |
835 | 4,567 | 561 | |||||||||
| Withholding tax related to net share settlement of restricted share units |
(352 | ) | (327 | ) | (21 | ) | ||||||
|
|
|
|
|
|
|
|||||||
| Net cash provided by (used in) financing activities |
22,537 | (8,171 | ) | (9,128 | ) | |||||||
|
|
|
|
|
|
|
|||||||
| Net (decrease) increase in cash and cash equivalents |
$ | (120,333 | ) | $ | 85,367 | $ | 33,760 | |||||
|
|
|
|
|
|
|
|||||||
63
Table of Contents
| Years Ended | ||||||||||||
| (in thousands of U. S. dollars) | June 26, 2015 |
June 27, 2014 |
June 28, 2013 |
|||||||||
| Movement in cash and cash equivalents |
||||||||||||
| Cash and cash equivalents at beginning of period |
$ | 233,477 | $ | 149,716 | $ | 115,507 | ||||||
| (Decrease) increase in cash and cash equivalents |
(120,333 | ) | 85,367 | 33,760 | ||||||||
| Effect of exchange rate on cash and cash equivalents |
(166 | ) | (1,606 | ) | 449 | |||||||
|
|
|
|
|
|
|
|||||||
| Cash and cash equivalents at end of period |
$ | 112,978 | $ | 233,477 | $ | 149,716 | ||||||
|
|
|
|
|
|
|
|||||||
| Supplemental disclosures |
||||||||||||
| Cash paid for |
||||||||||||
| Interest |
$ | 590 | $ | 709 | $ | 1,014 | ||||||
| Taxes |
$ | 2,841 | $ | 198 | $ | 260 | ||||||
| Cash received for interest |
$ | 749 | $ | 1,672 | $ | 873 | ||||||
| Non-cash investing and financing activities |
||||||||||||
| Fixed assets-related payable |
$ | 6,026 | $ | 1,130 | $ | 1,361 | ||||||
The accompanying notes are an integral part of these consolidated financial statements.
64
Table of Contents
FABRINET
NOTES TO CONSOLIDATED FINANCIAL STATEMENTS
(in thousands of U.S. dollars unless otherwise noted)
| 1. | Business and organization |
Description of Business
Fabrinet (“Fabrinet” or the “Parent Company”) was incorporated on August 12, 1999, and commenced operations on January 1, 2000. The Parent Company is an exempted company incorporated in the Cayman Islands, British West Indies. “We,” “us,” “our” and the “Company” refer to Fabrinet and its subsidiaries as a group.
The Company provides advanced optical packaging and precision optical, electro-mechanical and electronic manufacturing services to original equipment manufacturers (“OEMs”) of complex products, such as optical communication components, modules and sub-systems, industrial lasers, medical devices, and sensors. The Company offers a broad range of advanced optical and electro-mechanical capabilities across the entire manufacturing process, including process design and engineering, supply chain management, manufacturing, complex printed circuit board assembly, advanced packaging, integration, final assembly and test. The Company focuses primarily on the production of low-volume, high-mix products. The subsidiaries of Fabrinet include Fabrinet Co., Ltd. (“Fabrinet Thailand”), Fabrinet USA, Inc., FBN New Jersey Manufacturing, Inc., Fabrinet China Holdings, Casix, Inc. (“Casix”), Fabrinet Pte., Ltd., Fabrilink SEZC, Fabrinet West, Inc., and Fabritek, Inc.
Fabrilink SEZC, Fabrinet West, Inc., and Fabritek, Inc. were incorporated in January 2015.
Asia Pacific Growth Fund III, L.P. and its affiliates held 8.9%, 8.8% and 17.8% of Fabrinet’s share capital (fully diluted) as of June 26, 2015, June 27, 2014, and June 28, 2013, respectively. The Company has no commercial transactions with Asia Pacific Growth Fund III, L.P. and its affiliates.
Secondary Public Offering
On May 28, 2014 and on March 14, 2013, certain existing shareholders of Fabrinet sold an aggregate of 3,150,000 and 3,800,000 ordinary shares at a price of $18.00 and $14.00 per share, respectively, less underwriting discounts and commissions, in a secondary public offering. The Company did not receive any proceeds from the sale of ordinary shares by the selling shareholders. The Company incurred $0.3 million and $0.4 million of expenses in connection with the secondary offering during the years ended June 27, 2014 and June 28, 2013.
| 2. | Summary of significant accounting policies |
Principles of consolidation
The Company utilizes a 52-53 week fiscal year ending on the Friday in June closest to June 30. Fiscal year 2015, fiscal year 2014, and fiscal year 2013 ended on June 26, 2015, June 27, 2014 and June 28, 2013, respectively, and consisted of 52 weeks, 52 weeks and 52 weeks, respectively.
The consolidated financial statements have been prepared in accordance with accounting principles generally accepted in the United States (“U.S. GAAP”) and include Fabrinet and its subsidiaries listed in Note 1 above. All inter-company accounts and transactions have been eliminated.
Use of estimates
The preparation of the Company’s consolidated financial statements in conformity with U.S. GAAP requires management to make estimates and assumptions that affect the reported amounts of assets and liabilities and disclosure of contingent liabilities at the date of the financial statements, and the reported amount of total
65
Table of Contents
revenues and expense during the year. The Company bases estimates on historical experience and various assumptions about the future that are believed to be reasonable based on available information. The Company’s reported financial position or results of operations may be materially different under different conditions or when using different estimates and assumptions, particularly with respect to significant accounting policies, which are discussed below. Significant assumptions are used in accounting for share-based compensation, allowance for doubtful accounts, income taxes, and inventory obsolescence, among others. Due to the inherent uncertainty involved in making estimates, actual results reported in future periods may be different from these estimates. In the event that estimates or assumptions prove to differ from actual results, adjustments will be made in subsequent periods to reflect more current information.
Foreign currency transactions and translation
The consolidated financial statements are presented in United States Dollars (“$” or “USD”).
The functional currency of Fabrinet and its subsidiaries is the USD. Transactions in currencies other than the functional currency are translated into the functional currency at the rates of exchange in effect at the date of the transaction. Monetary assets and liabilities denominated in foreign currencies are translated into the functional currency at the exchange rate prevailing at the balance sheet dates. Transaction gains and losses are included in other income and expense, net, in the accompanying consolidated statements of operations.
Cash and cash equivalents
All highly liquid investments with original maturities of three months or less at the date of purchase are classified as cash equivalents. Cash and cash equivalents consist of cash deposited in checking accounts, time deposits with maturities of less than three months, money market accounts, and marketable securities with maturities of three months or less at the date of purchase.
Marketable securities
Management determines the appropriate classification of its investments at the time of purchase and reevaluates the designations at each balance sheet date. The Company may sell certain of its marketable securities prior to their stated maturities for strategic reasons including, but not limited to, anticipation of credit deterioration and duration management. The maturities of the Company’s marketable securities generally range from three months to three years. The Company’s marketable securities consist of investment in U.S. Treasuries and fixed income securities and have been classified and accounted for as available-for-sale.
The Company’s investments in marketable securities are primary classified as available-for-sale securities and reported at fair value. Unrealized gains and losses related to changes in the fair value of securities are recognized in accumulated other comprehensive income, net of tax, in the Company’s consolidated balance sheets. Changes in the fair value of available-for-sale securities impact the Company’s net income only when such securities are sold or other-than-temporary impairment is recognized. Realized gains and losses on the sale of securities are determined by specific identification of each security’s cost basis.
The Company reviews its marketable securities on a regular basis to evaluate whether or not any security has experienced an other-than-temporary decline in fair value. The Company considers factors such as the length of time and extent to which the market value has been less than the cost, the financial condition and near-term prospects of the issue and the Company’s intent to sell, or whether it is more likely than not the Company will be required to sell the investment before recovery of the investment’s amortized cost basis. If the Company believes that an other-than-temporary decline exists in one of these securities, the Company will write down these investments to fair value.
66
Table of Contents
Trade accounts receivable
Accounts receivable are carried at anticipated realizable value. The Company assesses the collectability of its accounts receivable based on specific customer circumstances, current economic trends, historical experience with collection and the age of past due receivables and provides an allowance for doubtful receivables based on a review of all outstanding amounts at the period end. Bad debts are written-off when identified.
Unanticipated changes in the liquidity or financial position of the Company’s customers may require revision to the allowances for doubtful accounts.
Inventory
Inventory is stated at the lower of cost or market value. Cost is estimated using the standard costing method, computed on a first-in, first-out basis, with adjustments for variances to reflect actual costs not in excess of net realizable market value. Market value is the estimated selling price in the ordinary course of business, less the costs of completion and selling expenses. The Company assesses the valuation of inventory on a quarterly basis and writes down the value for estimated excess and obsolete inventory based upon estimates of future demand.
Leases
Payments made under operating leases are expensed on a straight-line basis over the lease term.
Property, plant and equipment
Land is stated at historical cost. Other property, plant and equipment, except for construction in process and machinery under installation, are stated at historical cost less accumulated depreciation. Depreciation is calculated on the straight-line method to write-off the cost of each asset to its residual value over its estimated useful life as follows:
| Building and building improvements |
10 - 30 years | |||
| Leasehold improvements |
Shorter of useful life or lease term | |||
| Manufacturing equipment |
3 - 5 years | |||
| Office equipment |
3 - 5 years | |||
| Motor vehicles |
5 years | |||
| Computer hardware |
3 - 5 years |
Construction in process and machinery under installation is stated at historic cost and depreciation begins after it is constructed and fully installed and is used in the operations of the Company.
Gains and losses on disposal are determined by comparing proceeds with carrying amounts and are included in operating income in the consolidated statements of operations and comprehensive income.
The Company tests long-lived assets or asset groups for recoverability when events or changes in circumstances indicate that their carrying amount may not be recoverable. Recoverability of long-lived assets or asset groups is measured by comparing their carrying amount to the projected undiscounted cash flows that the long-lived assets or asset groups are expected to generate. If such assets are considered to be impaired, the impairment loss recognized, if any, is the amount by which the carrying amount of the property and equipment exceeds its fair value.
Borrowing costs
Borrowing costs are accounted for on an accrual basis and are charged to the consolidated statements of operations and comprehensive income in the year incurred, except for interest costs on borrowings to
67
Table of Contents
finance certain qualifying assets. Such costs to finance qualifying assets are capitalized during the period of time that is required to complete and prepare the assets for their intended use, as part of the cost of the assets. All other borrowing costs are expensed as incurred.
The capitalization rate used to determine the amount of interest to be capitalized is the weighted average interest rate applicable to the Company’s outstanding borrowings during the year. Where funds are borrowed specifically for the acquisition, construction or production of assets, the amount of borrowing costs eligible for capitalization on the respective assets is determined as the actual borrowing costs are incurred on that borrowing during the respective periods.
Fair value of financial instruments
Fair value is defined as the exchange price that would be received for an asset or paid to transfer a liability (an exit price) in the principal or most advantageous market for the asset or liability in an orderly transaction between market participants on the measurement date. A fair value hierarchy is established which requires an entity to maximize the use of observable inputs and minimize the use of unobservable inputs for the valuation of an asset or liability as of the measurement date. The three levels of inputs that may be used to measure fair value are defined as follows:
Level 1 inputs are quoted prices (unadjusted) in active markets for identical assets or liabilities.
Level 2 inputs for similar assets and liabilities in active markets other than quoted prices included within Level 1 that are observable for the asset or liability, either directly or indirectly, for substantially the full term of the asset or liability.
Level 3 inputs that are significant to the fair value measurement and unobservable (i.e. supported by little or no market activity), which require the reporting entity to develop its own valuation techniques and assumptions.
The Company utilizes the market approach to measure fair value for its financial assets and liabilities. The market approach uses prices and other relevant information generated by market transactions involving identical or comparable assets or liabilities.
The carrying amounts of certain financial instruments, which include cash and cash equivalents, trade accounts receivable, and trade accounts payable, approximate their fair values due to their short maturities. The carrying amounts of borrowings approximate their fair values as the applicable interest rate is based on market interest rates. The particular recognition methods adopted are disclosed in the individual policy statements associated with each item.
Derivatives
The derivatives assets and liabilities are recognized on the consolidated balance sheets as other current assets or accrued expenses at fair value, based on the free-standing derivative instrument. The accounting for changes in the fair value of a derivative depends on the intended use of the derivative and the resulting designation and can either be designated as (1) a hedge of the fair value of a recognized asset or liability or of an unrecognized firm commitment (“fair value” hedge), (2) a hedge of a forecasted transaction or the variability of cash flows to be received or paid related to a recognized asset or liability (“cash flow” hedge) or (3) held for trading or not designated for hedge accounting (“free-standing derivative instrument”).
The Company does not have any derivatives designated as either fair value or cash flow hedges. Accordingly, the change in the fair value of the derivatives is recorded in foreign exchange (loss) gain on the consolidated statement of operations and comprehensive income.
Concentration of credit risk
Financial instruments that potentially subject the Company to concentrations of credit risk consist of cash, cash equivalents, marketable securities, derivatives, and accounts receivable.
68
Table of Contents
Cash, cash equivalents, and marketable securities are maintained with several financial institutions. Deposits held with banks may exceed the amount of insurance provided on such deposits. Generally, these deposits may be redeemed upon demand and are maintained with financial institutions with reputable credit and therefore bear minimal credit risk. The Company seeks to mitigate its credit risks by spreading such risks across multiple counterparties and monitoring the risk profiles of these counterparties. The Company limits its investments in marketable securities to securities with a maturity not in excess of three years, and all marketable securities that the Company invests in are rated A1, P-1, F1, or better.
The Company performs ongoing credit evaluations for credit worthiness of its customers and usually does not require collateral from its customers. Management has implemented a program to closely monitor near term cash collection and credit exposures to mitigate any material losses.
Revenue recognition
The Company derives total revenues primarily from the assembly of products under supply agreements with its customers and the fabrication of customized optics and glass. Revenues represent the invoiced value of products, net of trade discounts and allowances, and exclude goods and services tax. The Company recognizes revenues when realized or realizable and earned. The Company considers revenues realized or realizable and earned when there is persuasive evidence of an arrangement, delivery has occurred, the sales price is fixed or determinable, and collectability is reasonably assured. Delivery does not occur until products have been shipped or services have been provided to the customer, risk of loss has transferred to the customer and customer acceptance has been obtained, customer acceptance provisions have lapsed, or the Company has objective evidence that the criteria specified in the customer acceptance provisions have been satisfied. In situations where a formal acceptance is required but the acceptance only relates to whether the product meets its published specifications, revenues are generally recognized upon shipment provided all other revenue recognition criteria are met. The sales price is not considered to be fixed or determinable until all contingencies related to the sale have been resolved. The Company reduces revenues for rebates and other similar allowances. Revenues are recognized only if these estimates can be reasonably and reliably determined. The Company bases its estimates on historical results taking into consideration the type of customer, the type of transaction and the specifics of each arrangement. In addition to the aforementioned general policies, the following are the specific revenue recognition policies for each major category of revenues.
Services
The Company provides services for its customers that range from process design to product manufacturing. The Company recognizes service revenues when the services have been performed. The related costs are expensed as incurred.
Services revenue of $32.3 million, $25.5 million, and $24.1 million were recognized in the consolidated statements of operations and comprehensive income for the years ended June 26, 2015, June 27, 2014 and June 28, 2013, respectively.
Sales of goods
Revenues from sales of goods are generally recognized when the product is shipped to the customer and when there are no unfulfilled obligations that affect the customer’s final acceptance of the arrangement. Any cost of warranties and remaining obligations that are inconsequential or perfunctory are accrued when the corresponding revenues are recognized.
Certain customers may request the Company to store finished products purchased by them at the Company’s warehouse. In these instances, the Company receives a written request from the customer asking the Company to hold the inventory at the Company’s warehouse and the ordered goods are segregated in the
69
Table of Contents
Company’s warehouse from other inventory and cannot be used to fulfil other customer orders. In these situations revenue is only recognized when persuasive evidence of the sales arrangement exists, the goods are completed and ready for shipment, pricing is fixed or determinable, collection is reasonably assured, and title and risk of loss have passed to the customer.
Warranty provision
Provisions for estimated expenses relating to product warranties are made at the time the products are sold using historical experience. Generally, this warranty is limited to workmanship and the Company’s liability is capped at the price of the product. The provisions will be adjusted when experience indicates an expected settlement will differ from initial estimates.
Warranty cost allowances of $0.03 million, $0.02 million, and $0.02 million were recognized in the consolidated statements of operations and comprehensive income for the years ended June 26, 2015, June 27, 2014 and June 28, 2013, respectively.
Shipping and handling costs
The Company records costs related to shipping and handling in cost of revenues for all periods presented.
Share-based compensation
Share-based compensation is recognized in the consolidated financial statements based on grant-date fair value. The value of the portion of the award that is ultimately expected to vest is recognized as expense ratably over the requisite service period. The Company estimates the fair value of share-based awards utilizing the Black-Scholes-Merton (“BSM”) option-pricing model net of estimated forfeitures.
Employee contribution plan
The Company operates a defined contribution plan, known as a provident fund, in Fabrinet Thailand. The assets of this plan are in a separate trustee-administered fund. The provident fund is funded by matching payments from employees and by the subsidiary on a monthly basis. Current contributions to the provident fund are accrued and paid to the fund manager on a monthly basis. The Company sponsors the Fabrinet U.S. 401(k) Retirement Plan (the “401(k) Plan”), a Defined Contribution Plan under ERISA, at Fabrinet USA, Inc., FBN New Jersey Manufacturing, Inc., and Fabrinet West Inc., its subsidiaries, which provides retirement benefits for its eligible employees through tax deferred salary deductions.
Severance liabilities
Under labor protection laws applicable in Thailand and under the Fabrinet Thailand employment policy, all employees of Fabrinet Thailand with more than 120 days of service are entitled to severance pay on forced termination or retrenchment or in the event that the employee reaches the retirement age of 55. The entitlement to severance pay is determined according to an employee’s individual employment tenure with the Company and is subject to a maximum benefit of 10 months of salary unless otherwise agreed upon in an employee’s employment contract. The Company accounts for this severance liability on an actuarial basis using the Projected Unit Credit Method, using the long-term Thai government bond yield as a discount rate. There are no separate plan assets held in respect of this liability.
Annual leave
Employee entitlements to annual leave are recognized when they accrue to the employee. On termination of employment, accrued employee entitlement to annual leave is paid in cash.
70
Table of Contents
Income taxes
The Company uses the asset and liability method of accounting for income taxes, whereby deferred tax assets and liabilities are recognized for future tax consequences attributable to temporary differences between the financial statement carrying amounts of existing assets and liabilities and their respective tax bases. Deferred tax assets and liabilities are measured using tax rates expected to apply to taxable income in the years in which those temporary differences are expected to reverse. The effect of a change in tax rates on deferred tax assets and liabilities is recognized in income in the period that includes the enactment date. Deferred tax assets are reduced by a valuation allowance if, based on the weight of the available evidence, it is more likely than not that some portion or all of the deferred tax assets will not be realized.
Fabrinet’s subsidiaries are subject to income tax audits by the respective tax authorities in all of the jurisdictions in which they operate. The determination of tax liabilities in each of these jurisdictions requires the interpretation and application of complex and sometimes uncertain tax laws and regulations. The Company recognizes liabilities based on its estimate of whether, and the extent to which, additional tax liabilities are probable. If the Company ultimately determines that the payment of such a liability is not probable, then it reverses the liability and recognizes a tax benefit during the period in which the determination is made that the liability is no longer probable. The recognition and measurement of current taxes payable or refundable and deferred tax assets and liabilities requires that the Company makes certain estimates and judgments. Changes to these estimates or a change in judgment may have a material impact on the Company’s tax provision in a future period.
The authoritative guidance provides for recognition of deferred tax assets if the realization of such deferred tax assets is more likely than not to occur based on an evaluation of both positive and negative evidence and the relative weight of the evidence. The Company has determined that it is more likely than not that deferred tax asset attributable to a subsidiary in the United States will not be realized, primarily due to uncertainties related to its ability to utilize its net operating loss carryforward before they expire. Accordingly, the Company has established a valuation allowance for such deferred tax asset. If there is a change in the Company’s ability to realize its deferred tax assets for which a valuation allowance has been established, then its tax provision may decrease in the period in which it determines that realization is more likely than not. Likewise, if the Company determines that it is not more likely than not that its deferred tax assets will be realized, then a valuation allowance may be established for such deferred tax assets and the Company’s tax provision may increase in the period in which it makes the determination.
The accounting standard clarifies the accounting for uncertainty in income taxes recognized in an entity’s financial statements and prescribes a recognition threshold and measurement attributes for financial statement disclosure of tax positions taken or expected to be taken on a tax return.
The Company recognizes a tax benefit in the financial statements for an uncertain tax position only if management’s assessment is that the position is “more likely than not” (i.e., a likelihood greater than 50 percent) to be allowed by the tax jurisdiction based solely on the technical merits of the position. The term “tax position” refers to a position in a previously filed tax return or a position expected to be taken in a future tax return that is reflected in measuring current or deferred income tax assets and liabilities for interim or annual periods. The accounting interpretation also provides guidance on measurement methodology, derecognition thresholds, financial statement classification and disclosures, recognition of interest and penalties, and accounting for the cumulative-effect adjustment at the date of adoption.
New Accounting Pronouncements—not yet adopted by the Company
In July 2015, Financial Accounting Standards Board (“FASB”) issued Accounting Standards Update (“ASU”) 2015-11, “Inventory (Topic 330): Simplifying the Measurement of Inventory”. The update provides the guidance that an entity, that measured inventory by using first-in, first-out or average cost, should measure inventory at the lower of cost and net realizable value. Net realizable value is the estimated selling prices in the ordinary course of business, less reasonably predictable costs of completion, disposal,
71
Table of Contents
and transportation. Subsequent measurement is unchanged for inventory measured using last-in, first-out or the retail inventory method. The update is effective for fiscal years beginning after December 15, 2016, including interim periods within these fiscal years. This update should be applied prospectively with earlier application permitted as of the beginning of an interim or annual reporting date. The Company is currently evaluating the impact of adoption of this update on its consolidated financial statements.
In April 2015, the FASB issued ASU 2015-03, “Interest—Imputation of Interest (Subtopic 835-30): Simplifying the Presentation of Debt Issuance Costs”. The update requires debt issuance costs related to a recognized debt liability be presented in the balance sheet as a direct deduction from the carrying amount of the related debt liability instead of being presented as an asset. Debt disclosures will include the face amount of the debt liability and the effective interest rate. The update requires retrospective application and represents a change in accounting principle. The update is effective for fiscal years beginning after December 15, 2015. Early adoption is permitted for financial statements that have not been previously issued. The Company is currently evaluating the impact of adoption of this update on its consolidated financial statements.
In February 2015, the FASB issued ASU 2015-02, “Consolidation (Topic 810): Amendments to the Consolidation Analysis”. ASU No. 2015-02 amended the process that a reporting entity must perform to determine whether it should consolidate certain types of legal entities. ASU No. 2015-02 is effective for fiscal years, and for interim periods within those fiscal years beginning after December 15, 2015. Early adoption is permitted, including adoption in an interim period. The Company is currently evaluating the impact of adoption of this update on its consolidated financial statements.
In January 2015, the FASB issued ASU No. 2015-01, “Income Statement—Extraordinary and Unusual Items (Subtopic 225-20): Simplifying Income Statement Presentation by Eliminating the Concept of Extraordinary Items”. The objective of this amendment is to reduce the complexity in accounting standards by eliminating the concept of extraordinary items from U.S. GAAP. Presently, an event or transaction is presumed to be an ordinary and usual activity of the reporting entity unless evidence clearly supports its classification as an extraordinary item. The following criteria must both be met for extraordinary classification: (a) the underlying event or transaction should possess a high degree of abnormality and be of a type clearly unrelated to, or only incidentally related to, the ordinary and typical activities of the entity; and (b) the underlying event or transaction should not reasonably be expected to recur in the foreseeable future. This amendment is effective for fiscal years and interim periods beginning after December 15, 2015. Early adoption is permitted provided that the guidance is applied from the beginning of the fiscal year of adoption. The Company does not expect that the adoption of this update will have an effect on its consolidated financial statements.
In August 2014, The Financial Accounting Standards Board (FASB) issued Accounting Standard Update (ASU) no. 2014-15, “Presentation of Financial Statements—Going Concern (Subtopic 205-40): Disclosure of Uncertainties about an Entity’s Ability to Continue as a Going Concern”. The amendments require management to evaluate an entity’s ability to continue as a going concern; when relevant conditions and events, considered in the aggregate, indicate that it is probable that the entity will be unable to meet its obligations that become due within one year after the date that the financial statements are issued (or available to be issued). This applies to all entities and effective for fiscal beginning after December 15, 2016 and for annual periods and interim periods thereafter. The Company does not expect that the adoption of this guidance will have an effect on its consolidated financial statements.
In June 2014, the FASB issued ASU No. 2014-12, “Compensation—Stock Compensation (Topic 718), Accounting for Share-Based Payments when the terms of an award provide that a performance target could be achieved after the requisite service period”. This ASU requires that a performance target that affects vesting, and that could be achieved after the requisite service period, be treated as a performance condition. As such, the performance target should not be reflected in estimating the grant date fair value of the award. This update further clarifies that compensation cost should be recognized in the period in which it becomes probable that the performance target will be achieved and should represent the compensation cost
72
Table of Contents
attributable to the period(s) for which the requisite service has already been rendered. The Company is currently evaluating the impact of adoption of this new guidance on its consolidated financial statements.
In May 2014, the FASB issued ASU No. 2014-09, “Revenue from Contracts with Customers (Topic 606), issued as a new Topic, Accounting Standards Codification”. The core principle of this amendment is that an entity should recognize revenue to depict the transfer of promised goods or services to customers in an amount that reflects the consideration to which the entity expects to be entitled in exchange for those goods or services. This new guidance is effective for annual reporting periods beginning after December 15, 2016, including interim periods within that reporting period, with earlier adoption not being permitted. This new guidance can be adopted either retrospectively to each prior reporting period presented or as a cumulative-effect adjustment as of the date of adoption. The Company is currently assessing impact of adoption of this new guidance on its consolidated financial statements.
| 3. | Income taxes |
Cayman Islands
Fabrinet is domiciled in the Cayman Islands. Under the current laws of Cayman Islands, Fabrinet is not subject to tax in the Cayman Islands on income or capital gains. Fabrinet has received this undertaking for a 20-year period ending August 24, 2019, and after the expiration date, Fabrinet can make a request for renewal with the office of the Clerk of the Cabinet for another 20 years.
Income of the Company exempted from corporate income tax in the Cayman Islands amounted to $27.0 million, $73.0 million and $50.3 in the years ended June 26, 2015, June 27, 2014 and June 28, 2013, respectively.
Thailand
Fabrinet Co., Ltd. is where the majority of the Company’s operations and production takes place. The Company is not subject to tax for the period from July 2010 through June 2015 on income generated from the manufacture of products at Pinehurst Building 5, and from July 2012 through June 2020 on income generated from the manufacture of products at Pinehurst Building 6. Such preferential tax treatment is contingent on, among other things, the export of the Company’s customers’ products out of Thailand and the Company’s agreement not to move Fabrinet Thailand’s manufacturing facilities out of its current province in Thailand for at least 15 years. In addition, in December 2011, the Thailand Revenue Department announced a reduction in corporate income tax rates for tax periods beginning on or after January 1, 2012. As a result of the announcement, enacted corporate income tax rates for Fabrinet Thailand were reduced from 23% in fiscal year 2013 to 20% in fiscal year 2014, fiscal year 2015, and fiscal year 2016.
People’s Republic of China
Casix had been granted a tax privilege to reduce its corporate income tax rate from 25% to 15%, but the privilege expired on December 31, 2013. As a result, the corporate income tax rate for Casix has been 25% since January 2014.
The Company’s income tax expense consisted of the following:
| Years Ended | ||||||||||||
| (amount in thousands) | June 26, 2015 | June 27, 2014 | June 28, 2013 | |||||||||
| Current |
$ | 4,191 | $ | 2,304 | $ | 239 | ||||||
| Deferred |
(207 | ) | (865 | ) | 2,701 | |||||||
|
|
|
|
|
|
|
|||||||
| Total income tax expense |
$ | 3,984 | $ | 1,439 | $ | 2,940 | ||||||
|
|
|
|
|
|
|
|||||||
73
Table of Contents
The reconciliation between the Company’s taxes that would arise by applying the statutory tax rate of the country of the Company’s principal operations, Thailand, to the Company’s effective tax charge is shown below:
| Years Ended | ||||||||||||
| (amount in thousands) | June 26, 2015 |
June 27, 2014 |
June 28, 2013 |
|||||||||
| Income before income taxes (1) |
$ | 47,626 | $ | 93,170 | $ | 71,909 | ||||||
| Tax expense calculated at a statutory corporate income tax rate of 20% (2014: 20% and 2013: 23%) |
9,525 | 18,634 | 16,539 | |||||||||
| Effect of income taxes from locations with tax rates different from Thailand |
1,134 | (2 | ) | (457 | ) | |||||||
| Income not subject to tax (2) |
(7,094 | ) | (15,648 | ) | (12,728 | ) | ||||||
| Income tax on unremitted earnings (reversal of) |
1,263 | (259 | ) | 466 | ||||||||
| Effect of different tax rate in relation to deferred tax utilization (3) |
(221 | ) | (662 | ) | (303 | ) | ||||||
| Effect of foreign exchange rate adjustment |
(365 | ) | (380 | ) | (90 | ) | ||||||
| Tax rebate from research and development application |
(102 | ) | — | — | ||||||||
| Insurance proceeds from equipment claim due to flooding |
— | — | (516 | ) | ||||||||
| Reversal of reserve fixed assets damaged from flooding |
— | (251 | ) | — | ||||||||
| Others |
(156 | ) | 7 | 29 | ||||||||
|
|
|
|
|
|
|
|||||||
| Corporate income tax expense |
$ | 3,984 | $ | 1,439 | $ | 2,940 | ||||||
|
|
|
|
|
|
|
|||||||
| (1) | Income before income taxes was mostly generated from domestic income in the Cayman Islands. |
| (2) | Income not subject to tax relates to income earned in the Cayman Islands, income subject to an investment promotion privilege for Building 5 and Building 6. Income not subject to tax per ordinary share on a diluted basis (in dollars) was $0.20, $0.44 and $0.37 for the years ended June 26, 2015, June 27, 2014 and June 28, 2013, respectively. |
| (3) | The balances were effect of different tax rate in relation to the rate recognized deferred taxes in fiscal year 2015 and the rate when deferred taxes will be utilized in the following fiscal years. |
The Company’s deferred tax assets and deferred tax liabilities, net of valuation allowance, at each balance sheet date are as follows:
| Years Ended | ||||||||
| (amount in thousands) | June 26, 2015 |
June 27, 2014 |
||||||
| Deferred tax assets: |
||||||||
| Depreciation |
$ | 1,057 | $ | 979 | ||||
| Severance liability |
1,192 | 796 | ||||||
| Reserve and allowance |
1,648 | 1,561 | ||||||
| Others |
14 | — | ||||||
|
|
|
|
|
|||||
| Total |
3,911 | 3,336 | ||||||
|
|
|
|
|
|||||
| Deferred tax liabilities: |
||||||||
| Deferred tax from unremitted earning |
(737 | ) | (1,040 | ) | ||||
|
|
|
|
|
|||||
| Total |
(737 | ) | (1,040 | ) | ||||
|
|
|
|
|
|||||
| Net |
$ | 3,174 | $ | 2,296 | ||||
|
|
|
|
|
74
Table of Contents
Current deferred income tax assets and liabilities and non-current deferred income tax assets and liabilities are offset when the income taxes relate to the same tax jurisdiction. The following amounts are shown in the consolidated balance sheets:
| Years Ended | ||||||||
| (amount in thousands) | June 26, 2015 |
June 27, 2014 |
||||||
| Deferred income tax assets—current |
$ | 1,662 | $ | 1,561 | ||||
| Deferred income tax liabilities—current |
— | — | ||||||
|
|
|
|
|
|||||
| Current deferred income tax—net |
1,662 | 1,561 | ||||||
|
|
|
|
|
|||||
| Deferred income tax assets—non current |
3,253 | 1,775 | ||||||
| Deferred income tax liabilities—non current |
(737 | ) | (1,040 | ) | ||||
|
|
|
|
|
|||||
| Less: Valuation allowance |
(1,004 | ) | — | |||||
| Non-current deferred income tax—net |
1,512 | 735 | ||||||
|
|
|
|
|
|||||
| Net deferred income tax assets |
$ | 3,174 | $ | 2,296 | ||||
|
|
|
|
|
|||||
As of June 26, 2015, the Company recognized deferred tax assets of $1.0 million from tax net operating loss carrying forward of a subsidiary of the Company. Utilization of the tax net operating losses carrying forward may be subject to substantial limitations according to the subsidiary’s future operation, which may result in the reduced utilization of a portion of the Company’s net operating losses.
Income tax liabilities have not been established for withholding tax and other taxes that would be payable on the unremitted earnings of Fabrinet Thailand. Such amounts of Fabrinet Thailand are permanently reinvested; unremitted earnings for Fabrinet Thailand totaled $50.9 million and $37.2 million as of June 26, 2015 and June 27, 2014, respectively. Unrecognized deferred tax liabilities for such unremitted earnings were $2.6 million and $2.6 million as of June 26, 2015 and June 27, 2014, respectively.
Deferred tax liabilities of $0.7 million and $1.0 million have been established for withholding tax on the unremitted earnings of Casix, which included in non-current deferred tax liability as of June 26, 2015 and June 27, 2014, respectively.
Uncertain income tax positions
Interest and penalties related to uncertain tax positions are recognized in income tax expense. The Company had approximately $0.2 million and $0.04 million of accrued interest and penalties related to uncertain tax positions on the consolidated balance sheets as of June 26, 2015 and June 27, 2014, respectively. The Company recorded (reversed) interest and penalties of $0.1 million, ($0.6 million) and ($0.1 million) for the years ended June 26, 2015, June 27, 2014 and June 28, 2013, respectively, in the consolidated statements of operations and comprehensive income. With regard to the Thailand jurisdiction, tax years 2010 through 2014 remain open to examination by the local authorities.
The following table indicates the changes to the Company’s uncertain income tax positions for the years ended June 26, 2015, June 27, 2014, and June 28, 2013 included in other non-current liabilities.
| (amount in thousands) | As
of June 26, 2015 |
As
of June 27, 2014 |
As
of June 28, 2013 |
|||||||||
| Beginning balance |
$ | 868 | $ | 1,167 | $ | 1,124 | ||||||
| Additions during the year |
552 | 510 | 358 | |||||||||
| Reductions for tax positions of prior years |
— | (809 | ) | (315 | ) | |||||||
|
|
|
|
|
|
|
|||||||
| Ending balance |
$ | 1,420 | $ | 868 | $ | 1,167 | ||||||
|
|
|
|
|
|
|
|||||||
75
Table of Contents
| 4. | Earnings per ordinary share |
Basic earnings per ordinary share is computed by dividing reported net income by the weighted average number of ordinary shares outstanding during each period. Diluted earnings per ordinary share is computed by dividing reported net income by the weighted average number of ordinary shares and dilutive ordinary equivalent shares outstanding during each period. Dilutive ordinary equivalent shares consist of share options and restricted share units. The earnings per ordinary share was calculated as follows:
| Years Ended | ||||||||||||
| (amount in thousands except per share amounts) | June 26, 2015 |
June 27, 2014 |
June 28, 2013 |
|||||||||
| Net income attributable to shareholders |
$ | 43,642 | $ | 91,731 | $ | 68,969 | ||||||
|
|
|
|
|
|
|
|||||||
| Weighted-average number of ordinary shares outstanding (thousands of shares) |
35,354 | 34,938 | 34,557 | |||||||||
| Incremental shares arising from the assumed exercise of share options and vesting of restricted share units (thousands of shares) |
630 | 651 | 289 | |||||||||
|
|
|
|
|
|
|
|||||||
| Weighted-average number of ordinary shares for diluted earnings per ordinary share (thousands of shares) |
35,984 | 35,589 | 34,846 | |||||||||
|
|
|
|
|
|
|
|||||||
| Basic earnings per ordinary share |
$ | 1.23 | $ | 2.63 | $ | 2.00 | ||||||
| Diluted earnings per ordinary share |
$ | 1.21 | $ | 2.58 | $ | 1.98 | ||||||
| Outstanding share options excluded in the computation of diluted earnings per ordinary share (1) |
39,544 | 44,369 | 1,129,933 | |||||||||
| (1) | These share options were not included in the computation of diluted earnings per ordinary share for fiscal year 2015, fiscal year 2014, and fiscal year 2013, respectively, because the exercise price of the options was greater than the average market price of the underlying shares. |
| 5. | Cash, cash equivalents and marketable securities |
The Company’s cash, cash equivalents, and marketable securities can be analyzed as follows:
| Fair Value | ||||||||||||||||
| (amount in thousands) | Carrying Cost |
Unrealized (Loss)/Gain |
Cash and Cash Equivalents |
Marketable Securities |
||||||||||||
| As of June 26, 2015 |
||||||||||||||||
| Cash |
$ | — | $ | — | $ | 105,548 | $ | — | ||||||||
| Cash equivalents |
7,430 | — | 7,430 | — | ||||||||||||
| Corporate bonds and commercial papers |
120,144 | (43 | ) | — | 120,101 | |||||||||||
| U.S. agency and U.S. treasury securities |
21,029 | (2 | ) | — | 21,027 | |||||||||||
| Sovereign and municipal securities |
1,737 | 1 | — | 1,738 | ||||||||||||
|
|
|
|
|
|
|
|
|
|||||||||
| Total |
$ | 150,340 | $ | (44 | ) | $ | 112,978 | $ | 142,866 | |||||||
|
|
|
|
|
|
|
|
|
|||||||||
| Fair Value | ||||||||||||||||
| (amount in thousands) | Carrying Cost |
Unrealized (Loss)/Gain |
Cash and Cash Equivalents |
Marketable Securities |
||||||||||||
| As of June 27, 2014 |
||||||||||||||||
| Cash |
$ | — | $ | — | $ | 214,283 | $ | — | ||||||||
| Cash equivalents |
— | — | 19,194 | — | ||||||||||||
|
|
|
|
|
|
|
|
|
|||||||||
| Total |
$ | — | $ | — | $ | 233,477 | $ | — | ||||||||
|
|
|
|
|
|
|
|
|
|||||||||
76
Table of Contents
The cash equivalents include short term bank deposits, investments in money market funds, and marketable securities with maturities of less than three months. The effective interest rate on short term bank deposits was 0.66% and 1.01% per annum for the years ended June 26, 2015 and June 27, 2014, respectively.
As of June 26, 2015, 66.4% of our cash and cash equivalents were held by the Parent Company.
The following table summarizes the cost and estimated fair value of marketable securities classified as available-for-sale securities based on stated effective maturities as of June 26, 2015:
| (amount in thousands) | Carrying Cost | Fair Value | ||||||
| Due within one year |
$ | 30,461 | $ | 30,458 | ||||
| Due between one to three years |
112,449 | 112,408 | ||||||
|
|
|
|
|
|||||
| Total |
$ | 142,910 | $ | 142,866 | ||||
|
|
|
|
|
|||||
During the year ended June 26, 2015, the net realized loss recognized by the Company was $0.1 million.
As of June 26, 2015, the Company considered the declines in market value of its marketable securities investment portfolio to be temporary in nature and did not consider any of its securities other-than-temporarily impaired. The Company typically invests in highly-rated securities, and its investment policy generally limits the amount of credit exposure to any one issuer. The policy requires investments generally to be investment grade, with the primary objective of minimizing the potential risk of principal loss. Fair values were determined for each individual security in the investment portfolio. When evaluating an investment for other-than-temporary impairment, the Company reviews factors such as the length of time and extent to which fair value has been below its cost basis, the financial condition of the issuer and any changes thereto, changes in market interest rates, and the Company’s intent to sell, or whether it is more likely than not it will be required to sell, the investment before recovery of the investment’s cost basis. No impairment losses were recorded for the year ended June 26, 2015.
As of June 26, 2015, cash, cash equivalents, and marketable securities included bank deposits of $40.0 million held in various financial institutions located in the United States in order to support the availability of the Facility Agreement and comply with covenants. Under the terms and conditions of the Facility Agreement, the Company shall maintain cash, cash equivalents and/or marketable securities in an aggregate amount not less than $40.0 million in unencumbered deposits, and/or securities in accounts located in the United States at all times during the term of the Facility Agreement. As discussed in Note 11, the Company must comply with this covenant from and after the effective date of the Facility Agreement.
| 6. | Fair Value |
The following table provides details of the financial instruments measured at fair value on a recurring basis, including:
| Fair Value Measurements at Reporting Date Using |
||||||||||||||||
| (amount in thousands) | Level 1 | Level 2 | Level 3 | Total | ||||||||||||
| As of June 26, 2015 |
||||||||||||||||
| Assets |
||||||||||||||||
| Cash equivalents |
$ | — | $ | 7,430 | $ | — | $ | 7,430 | ||||||||
| Corporate bonds and commercial papers |
— | 120,101 | — | 120,101 | ||||||||||||
| U.S. agency and U.S. treasury securities |
— | 21,027 | — | 21,027 | ||||||||||||
| Sovereign and municipal securities |
— | 1,738 | — | 1,738 | ||||||||||||
| Derivative assets |
— | 4 | (1) | — | 4 | |||||||||||
|
|
|
|
|
|
|
|
|
|||||||||
| Total |
$ | — | $ | 150,300 | $ | — | $ | 150,300 | ||||||||
|
|
|
|
|
|
|
|
|
|||||||||
| Liabilities |
||||||||||||||||
| Derivative liabilities |
$ | — | $ | 371 | (2) | $ | — | $ | 371 | |||||||
|
|
|
|
|
|
|
|
|
|||||||||
| Total |
$ | — | $ | 371 | $ | — | $ | 371 | ||||||||
|
|
|
|
|
|
|
|
|
|||||||||
77
Table of Contents
| Fair Value Measurements at Reporting Date Using |
||||||||||||||||
| (amount in thousands) | Level 1 | Level 2 | Level 3 | Total | ||||||||||||
| As of June 27, 2014 |
||||||||||||||||
| Assets |
||||||||||||||||
| Cash equivalents |
$ | — | $ | 19,194 | $ | — | $ | 19,194 | ||||||||
| Derivative assets |
— | 135 | (3) | — | 135 | |||||||||||
|
|
|
|
|
|
|
|
|
|||||||||
| Total |
$ | — | $ | 19,329 | $ | — | $ | 19,329 | ||||||||
|
|
|
|
|
|
|
|
|
|||||||||
| Liabilities |
||||||||||||||||
| Derivative liabilities |
$ | — | $ | 1 | (4) | $ | — | $ | 1 | |||||||
|
|
|
|
|
|
|
|
|
|||||||||
| Total |
$ | — | $ | 1 | $ | — | $ | 1 | ||||||||
|
|
|
|
|
|
|
|
|
|||||||||
| (1) | Foreign currency options with notional amount of $3.0 million and forward contracts with notional amount of Canadian dollars 0.4 million. |
| (2) | Foreign currency options with notional amount of $41.0 million. |
| (3) | Foreign currency options with notional amount of $15.0 million. |
| (4) | Foreign currency forward contracts with notional amount of Canadian dollars 0.9 million. |
Derivative Financial Instruments
The Company uses foreign currency exchange contracts to manage the foreign exchange risk associated with certain foreign currency-denominated assets and liabilities and does not use derivatives for speculative purposes. As a result of foreign currency fluctuations, the U.S. dollar equivalent values of its foreign currency-denominated assets and liabilities change. The Company has not designated such foreign currency exchange contracts as hedging instruments under the accounting standard for derivatives and hedging. The forward exchange contracts and option contracts outstanding as of June 26, 2015 and June 27, 2014 had a maturity in one to six months duration. The Company minimizes the credit risk in derivative instruments by limiting its exposure to any single counterparty and by entering into derivative instruments only with counterparties that meet the Company’s minimum credit quality standard.
The derivative assets and liabilities are classified in other assets and accrued expenses, respectively, on the audited consolidated balance sheets. The change in fair value of derivatives is recorded in foreign exchange gain (loss) on the audited consolidated of operations and comprehensive income.
| 7. | Allowance for doubtful accounts |
The activities and balances for allowance for doubtful accounts were as follows:
| Years Ended | ||||||||||||
| (amount in thousands) | June 26, 2015 | June 27, 2014 | June 28, 2013 | |||||||||
| Balance, beginning of period |
$ | 37 | $ | 109 | $ | 203 | ||||||
| Charged to Expense/(Credited to Income) |
13 | (72 | ) | (94 | ) | |||||||
|
|
|
|
|
|
|
|||||||
| Balance, end of period |
$ | 50 | $ | 37 | $ | 109 | ||||||
|
|
|
|
|
|
|
|||||||
78
Table of Contents
| 8. | Inventory |
| (amount in thousands) | As of June 26, 2015 |
As of June 27, 2014 |
||||||
| Raw materials |
$ | 46,065 | $ | 40,885 | ||||
| Work in progress |
69,174 | 56,376 | ||||||
| Finished goods |
11,843 | 22,970 | ||||||
| Goods in transit |
6,488 | 6,899 | ||||||
|
|
|
|
|
|||||
| 133,570 | 127,130 | |||||||
| Less: Inventory obsolescence |
(2,957 | ) | (2,560 | ) | ||||
|
|
|
|
|
|||||
| Inventory, net |
$ | 130,613 | $ | 124,570 | ||||
|
|
|
|
|
|||||
| 9. | Property, plant and equipment, net |
The components of property, plant and equipment, net were as follows:
| (amount in thousands) | Land | Building
and Building Improvement |
Manufacturing Equipment |
Office Equipment |
Motor Vehicles |
Computers | Construction and Machinery Under Installation |
Total | ||||||||||||||||||||||||
| As of June 26, 2015 |
||||||||||||||||||||||||||||||||
| Cost |
$ | 26,672 | $ | 86,926 | $ | 79,825 | $ | 5,378 | $ | 528 | $ | 13,196 | $ | 10,198 | $ | 222,723 | ||||||||||||||||
| Less: Accumulated depreciation |
— | (21,016 | ) | (47,017 | ) | (3,343 | ) | (458 | ) | (10,235 | ) | — | (82,069 | ) | ||||||||||||||||||
|
|
|
|
|
|
|
|
|
|
|
|
|
|
|
|
|
|||||||||||||||||
| Net book value |
$ | 26,672 | $ | 65,910 | $ | 32,808 | $ | 2,035 | $ | 70 | $ | 2,961 | $ | 10,198 | $ | 140,654 | ||||||||||||||||
|
|
|
|
|
|
|
|
|
|
|
|
|
|
|
|
|
|||||||||||||||||
| As of June 27, 2014 |
||||||||||||||||||||||||||||||||
| Cost |
$ | 14,353 | $ | 73,353 | $ | 60,354 | $ | 5,376 | $ | 615 | $ | 12,044 | $ | 1,369 | $ | 167,464 | ||||||||||||||||
| Less: Accumulated depreciation |
— | (17,580 | ) | (39,100 | ) | (3,266 | ) | (608 | ) | (9,666 | ) | — | (70,220 | ) | ||||||||||||||||||
|
|
|
|
|
|
|
|
|
|
|
|
|
|
|
|
|
|||||||||||||||||
| Net book value |
$ | 14,353 | $ | 55,773 | $ | 21,254 | $ | 2,110 | $ | 7 | $ | 2,378 | $ | 1,369 | $ | 97,244 | ||||||||||||||||
|
|
|
|
|
|
|
|
|
|
|
|
|
|
|
|
|
|||||||||||||||||
On February 24, 2015, one of Fabrinet’s subsidiaries purchased a building of approximately 74,000 square feet and the associated 4.05 acres of land located in Santa Clara, California, for the purpose of expanding the Company’s manufacturing facilities in the United States. The purchase price of the land and building was $12.3 million and $13.2 million, respectively.
Depreciation expense amounted to $12.9 million, $10.6 million, and $10.0 million for the years ended June 26, 2015, June 27, 2014 and June 28, 2013, respectively and have been allocated between cost of revenues and selling, general and administrative expenses in the consolidated statements of operations and comprehensive income. During fiscal year 2014, we wrote-off all assets damaged from flood and reversed all asset impairment reserve due to we fully settled with insurance companies for our damaged assets claim.
The cost of fully depreciated property, plant and equipment written-off during the years ended June 26, 2015, June 27, 2014, and June 28, 2013 amounted to $1.1 million, $2.6 million and $0.3 million, respectively.
There was no interest expense capitalized in construction in progress during the years ended June 26, 2015 and June 27, 2014, respectively.
79
Table of Contents
| 10. | Intangibles |
The following tables present details of the Company’s intangibles:
| (amount in thousands) | Gross Carrying Amount |
Accumulated Amortization |
Net | |||||||||
| As of June 26, 2015 |
||||||||||||
| Software |
$ | 3,357 | $ | (3,220 | ) | $ | 137 | |||||
|
|
|
|
|
|
|
|||||||
| Total intangibles |
$ | 3,357 | $ | (3,220 | ) | $ | 137 | |||||
|
|
|
|
|
|
|
|||||||
| (amount in thousands) | Gross Carrying Amount |
Accumulated Amortization |
Net | |||||||||
| As of June 27, 2014 |
||||||||||||
| Software |
$ | 3,458 | $ | (3,386 | ) | $ | 72 | |||||
|
|
|
|
|
|
|
|||||||
| Total intangibles |
$ | 3,458 | $ | (3,386 | ) | $ | 72 | |||||
|
|
|
|
|
|
|
|||||||
The Company recorded amortization expense relating to intangibles of $0.1 million, $0.1 million and $0.2 million for the years ended June 26, 2015, June 27, 2014, and June 28, 2013, respectively.
Based on the carrying amount of intangibles as of June 26, 2015, and assuming no future impairment of the underlying assets, the estimated future amortization at the end of each fiscal year in June is as follows:
| (amount in thousand) | ||||
| 2016 |
$ | 32 | ||
| 2017 |
28 | |||
| 2018 |
27 | |||
| 2019 |
27 | |||
| 2020 |
23 | |||
|
|
|
|||
| Total |
$ | 137 | ||
|
|
|
|||
| 11. | Borrowings |
The Company’s total borrowing, including revolving and long-term borrowings, consisted of the following:
| (amount in thousands) | ||||||||||||||
| Rate (1) |
Conditions |
Maturity | As of June 26, 2015 |
As of June 27, 2014 |
||||||||||
| Short-term borrowing: |
||||||||||||||
| Revolving borrowing: |
||||||||||||||
| LIBOR + 1.75% per annum |
Repayable in 1 to 6 months |
July 2015 | (2) | $ | 30,000 | $ | — | |||||||
| Current portion of long-term borrowing |
6,000 | 6,000 | ||||||||||||
|
|
|
|
|
|||||||||||
| $ | 36,000 | $ | 6,000 | |||||||||||
|
|
|
|
|
|||||||||||
| Long-term borrowing: |
||||||||||||||
| LIBOR + 2.8% per annum |
Repayable in quarterly installments within 6 years | March 2017 | $ | 10,500 | $ | 16,500 | ||||||||
| Less: Current portion |
|
(6,000 | ) | (6,000 | ) | |||||||||
|
|
|
|
|
|||||||||||
| Non-current portion |
|
$ | 4,500 | $ | 10,500 | |||||||||
|
|
|
|
|
|||||||||||
80
Table of Contents
| (1) | LIBOR is London Interbank Offered Rate. |
| (2) | On July 14, 2015, the Company sent a notice to the bank to renew the maturity date of this revolving borrowing. The bank approved the notice and extended the maturity date to August 20, 2015. |
On April 25, 2014, a subsidiary of the Company entered into an amendment to the bank borrowing agreement. Under the amendment of the contract, the long-term loan is secured by certain property, plant and equipment. The carrying amount of assets secured and pledged as collateral as of June 26, 2015 and June 27, 2014 was $50.0 million and $52.3 million, respectively. This subsidiary is also required to comply with the maximum ratios of debt to equity and minimum levels of debt service coverage ratios, and Fabrinet must maintain an effective shareholding ratio. The carrying amounts of bank borrowings approximate their fair value.
As of June 26, 2015 and June 27, 2014, the Company was in compliance with its long-term bank borrowing agreement. In addition to financial ratios, certain of the Company’s credit facilities include customary events of default.
The movements of long-term loans were as follows for years ended June 26, 2015 and June 27, 2014:
| Years ended | ||||||||
| (amount in thousands) | June 26, 2015 |
June 27, 2014 |
||||||
| Opening net book amount |
$ | 16,500 | $ | 28,911 | ||||
| Repayment during the period |
(6,000 | ) | (12,411 | ) | ||||
|
|
|
|
|
|||||
| Closing net book amount |
$ | 10,500 | $ | 16,500 | ||||
|
|
|
|
|
|||||
As of June 26, 2015, future maturities of long-term debt were as follows at the end of each fiscal year below:
| (amount in thousands) | ||||
| 2016 |
$ | 6,000 | ||
| 2017 |
4,500 | |||
|
|
|
|||
| Total |
$ | 10,500 | ||
|
|
|
|||
Credit facilities:
Fabrinet entered into a syndicated senior credit facility agreement (the “Facility Agreement”) with a consortium of banks on May 22, 2014. The Facility Agreement, led by Bank of America, provides for a $200.0 million credit line, comprised of a $150.0 million revolving loan facility and a $50.0 million delayed draw term loan facility. The revolving loan facility contains an accordion feature permitting Fabrinet to request an increase in the facility up to $100.0 million subject to customary terms and conditions and provided that no default or event of default exists at the time of request. The revolving loan facility terminates and all amounts outstanding are due and payable in full on May 22, 2019. The principal amount of any drawn term loans must be repaid according to the scheduled quarterly amortization payments, with final payment of all amounts outstanding, plus accrued interest, being due May 22, 2019.
On February 26, 2015, the Company entered into the Second Amendment to the Facility Agreement. The amendment extended the availability period for draws on the term loan facility from May 21, 2015 to July 31, 2015. It also allows the Company, upon the satisfaction of certain conditions, to designate from time to time one or more of its subsidiaries as borrowers under the Facility Agreement. On July 31, 2015, the Company entered into the Third Amendment to the Facility Agreement. The amendment extended the availability period for draws on the term loan facility from July 31, 2015 to July 31, 2016. As of June 26, 2015, the outstanding revolving borrowing under the Facility Agreement was $30.0 million, resulting in available credit facilities of $170.0 million. Borrowings under the revolving credit facility are classified as
81
Table of Contents
current liabilities in the audited consolidated balance sheet as the Company has the periodic option to renew, or pay all or a portion of, the outstanding balance at the end of the maturity date, which is in the range of 1 to 6 months, without premium or penalty, upon notice to the administrative agent. On July 14, 2015, the Company sent a notice to the bank to renew the maturity date of this revolving borrowing. The bank approved the notice and extended the maturity date to August 20, 2015.
Loans under the Facility Agreement bear interest, at Fabrinet’s option, at a rate per annum equal to a LIBOR rate plus a spread of 1.75% to 2.50%, or a base rate, determined in accordance with the Facility Agreement, plus a spread of 0.75% to 1.50%, in each case with such spread determined based on Fabrinet’s consolidated total leverage ratio for the preceding four fiscal quarter period. Interest is due and payable quarterly in arrears for loans bearing interest at the base rate and at the end of an interest period (or at each three-month interval in the case of loans with interest periods greater than three months) in the case of loans bearing interest at the LIBOR rate.
Fabrinet’s obligations under the Facility Agreement are guaranteed by certain of its existing and future direct material subsidiaries. In addition, the Facility Agreement is secured by Fabrinet’s present and future accounts receivable, deposit accounts and cash, and a pledge of the capital stock of certain of Fabrinet’s direct subsidiaries. Fabrinet is required to maintain at least $40.0 million of cash, cash equivalents, and marketable securities at financial institutions located in the United States. Further, Fabrinet is required to maintain any of its deposits accounts or securities accounts with balances in excess of $10.0 million in a jurisdiction where a control agreement, or the equivalent under the local law, can be effected. The Facility Agreement contains customary affirmative and negative covenants. Negative covenants include, among other things, limitations on liens, indebtedness, investments, mergers, sales of assets, changes in the nature of the business, dividends and distributions, affiliate transactions and capital expenditures. The Facility Agreement contains financial covenants requiring Fabrinet to maintain: (i) a minimum tangible net worth of not less than $200.0 million plus 50% of quarterly net income, exclusive of quarterly losses; (ii) a minimum debt service coverage ratio of not less than 1.50:1.00; (iii) a maximum senior leverage ratio of not more than 2.50:1.00; and (iv) a minimum quick ratio of not less than 1.10:1.00. Each of these financial covenants is calculated on a consolidated basis for the consecutive four fiscal quarter period then ended. As of June 26, 2015, the Company was in compliance with all covenants under the Facility Agreement.
The Facility Agreement also contains customary events of default including, among other things, payment defaults, breaches of covenants or representations and warranties, cross-defaults with certain other indebtedness, bankruptcy and insolvency events and change in control of Fabrinet, subject to grace periods in certain instances. Upon an event of default, the lenders may terminate their commitments, declare all or a portion of the outstanding obligations payable by Fabrinet to be immediately due and payable and exercise other rights and remedies provided for under the Facility Agreement.
Fabrinet intends to use the proceeds of the credit line to finance its future manufacturing buildings in the United States and Thailand, and for general corporate purposes including mergers and acquisitions of complementary manufacturing businesses or technology, although Fabrinet has no current commitments with respect to any such acquisitions.
Undrawn available credit facilities classified by available period of future borrowing as of June 26, 2015 and June 27, 2014 were as follows:
| (amount in thousands) | June 26, 2015 |
June 27, 2014 |
||||||
| Short-term |
$ | 1,480 | $ | 1,539 | ||||
| Long-term |
$ | 170,000 | $ | — | ||||
82
Table of Contents
| 12. | Severance liabilities |
The following table provides the information of the severance liabilities:
| (amount in thousands) | As of June 26, 2015 |
As of June 27, 2014 |
||||||
| Balance, beginning of the fiscal year |
$ | 4,453 | $ | 4,382 | ||||
| Charged to consolidated statements of operations |
1,024 | 71 | ||||||
|
|
|
|
|
|||||
| Balance, end of the fiscal year |
$ | 5,477 | $ | 4,453 | ||||
|
|
|
|
|
|||||
The amount recognized in the consolidated balance sheets under non-current liabilities was determined as follows:
| (amount in thousands) | As of June 26, 2015 |
As of June 27, 2014 |
||||||
| Present value of defined benefit obligation |
$ | 5,477 | $ | 4,453 | ||||
|
|
|
|
|
|||||
| Total |
$ | 5,477 | $ | 4,453 | ||||
|
|
|
|
|
|||||
The amount recognized in the consolidated statements of operations and comprehensive income was as follows:
| Years Ended | ||||||||||||
| (amount in thousands) | June 26, 2015 |
June 27, 2014 |
June 28, 2013 |
|||||||||
| Current service cost |
$ | 360 | $ | 368 | $ | 722 | ||||||
| Interest cost |
203 | 207 | 211 | |||||||||
| Benefit paid |
(10 | ) | (223 | ) | (4 | ) | ||||||
| Actuarial loss (gain) on obligation |
471 | (281 | ) | (967 | ) | |||||||
|
|
|
|
|
|
|
|||||||
| Total |
$ | 1,024 | $ | 71 | $ | (38 | ) | |||||
|
|
|
|
|
|
|
|||||||
The principal actuarial assumptions used were as follows:
| Years Ended | ||||||||||||
| June 26, 2015 |
June 27, 2014 |
June 28, 2013 |
||||||||||
| Discount rate |
4.0 | % | 4.9 | % | 5.1 | % | ||||||
| Future salary increases |
4.2 | % | 4.2 | % | 4.4 | % | ||||||
| 13. | Share-based compensation |
Share-based compensation
In determining the grant date fair value of equity awards, the Company is required to make estimates of the fair value of Fabrinet’s ordinary shares, expected dividends to be issued, expected volatility of Fabrinet’s ordinary shares, expected forfeitures of the awards, risk free interest rates for the expected term of the awards, expected terms of the awards, and the vesting period of the respective awards. Forfeitures are estimated at the time of grant and revised if necessary in subsequent periods if actual forfeitures differ from those estimates.
83
Table of Contents
The effect of recording share-based compensation expense for the years ended June 26, 2015, June 27, 2014 and June 28, 2013 was as follows:
| Years Ended | ||||||||||||
| (amount in thousands) | June 26, 2015 | June 27, 2014 | June 28, 2013 | |||||||||
| Share-based compensation expense by type of award: |
||||||||||||
| Share options |
$ | 226 | $ | 802 | $ | 1,864 | ||||||
| Restricted share units |
7,801 | 4,745 | 3,236 | |||||||||
|
|
|
|
|
|
|
|||||||
| Total share-based compensation expense |
8,027 | 5,547 | 5,100 | |||||||||
| Tax effect on share-based compensation expense |
— | — | — | |||||||||
|
|
|
|
|
|
|
|||||||
| Net effect on share-based compensation expense |
$ | 8,027 | $ | 5,547 | $ | 5,100 | ||||||
|
|
|
|
|
|
|
|||||||
Share-based compensation expense was recorded in the consolidated statements of operations and comprehensive income as follows:
| Years Ended | ||||||||||||
| (amount in thousands) | June 26, 2015 | June 27, 2014 | June 28, 2013 | |||||||||
| Cost of revenue |
$ | 1,450 | $ | 1,182 | $ | 1,105 | ||||||
| Selling, general and administrative expense |
6,577 | 4,365 | 3,995 | |||||||||
|
|
|
|
|
|
|
|||||||
| Total share-based compensation expense |
$ | 8,027 | $ | 5,547 | $ | 5,100 | ||||||
|
|
|
|
|
|
|
|||||||
The Company did not capitalize any share-based compensation expense as part of any asset costs during the years ended June 26, 2015, June 27, 2014 and June 28, 2013.
Share-based award activity
Share options have been granted to directors and employees. As of June 26, 2015, there were 6,590 share options outstanding under the Amended and Restated 1999 Share Option Plan (the “1999 Plan”). Additional option grants may not be made under the 1999 Plan.
In March 2010, Fabrinet’s shareholders adopted the 2010 Performance Incentive Plan (the “2010 Plan”). On December 20, 2010 and December 20, 2012, the 2010 Plan was amended to increase the number of shares reserved for issuance. As of June 26, 2015, there were an aggregate of 785,429 share options outstanding, 1,140,927 restricted share units outstanding and 2,939,135 ordinary shares available for future grant under the 2010 Plan. The 1999 Plan and 2010 Plan are collectively referred to as the “Share Option Plans”.
Share options
Fabrinet’s board of directors has the authority to determine the type of option and the number of shares subject to an option. Options generally vest and become exercisable over four years and expire, if not exercised, within 7 years of the grant date. In the case of a grantee’s first grant, 25 percent of the underlying shares subject to an option vest 12 months after the vesting commencement date and 1/48 of the underlying shares vest monthly over each of the subsequent 36 months. In the case of any additional grants to a grantee, 1/48 of the underlying shares subject to an option vest monthly over four years, commencing one month after the vesting commencement date.
84
Table of Contents
The following table summarizes share options activity:
| Number of Shares |
Number of Exercisable Options |
Weighted- Average Exercise Price |
Weighted- Average Grant Date Fair Value |
|||||||||||||
| Balance as of June 29, 2012 |
1,470,290 | 532,646 | $ | 14.88 | ||||||||||||
| Granted |
— | — | — | |||||||||||||
| Exercised |
(94,188 | ) | $ | 5.96 | ||||||||||||
| Forfeited |
(44,443 | ) | $ | 17.33 | ||||||||||||
| Expired |
(54,348 | ) | $ | 16.97 | ||||||||||||
|
|
|
|||||||||||||||
| Balance as of June 28, 2013 |
1,277,311 | 750,949 | $ | 15.37 | ||||||||||||
| Granted |
— | — | — | |||||||||||||
| Exercised |
(351,435 | ) | $ | 13.00 | ||||||||||||
| Forfeited |
(26,276 | ) | $ | 15.54 | ||||||||||||
| Expired |
(33,710 | ) | $ | 16.93 | ||||||||||||
|
|
|
|||||||||||||||
| Balance as of June 27, 2014 |
865,890 | 666,305 | $ | 16.27 | ||||||||||||
| Granted |
— | — | — | |||||||||||||
| Exercised |
(56,968 | ) | $ | 14.67 | ||||||||||||
| Forfeited |
(8,347 | ) | $ | 15.90 | ||||||||||||
| Expired |
(8,556 | ) | $ | 21.44 | ||||||||||||
|
|
|
|||||||||||||||
| Balance as of June 26, 2015 |
792,019 | 758,451 | $ | 16.33 | ||||||||||||
|
|
|
|||||||||||||||
| Expected to vest as of June 26, 2015 |
789,048 | $ | 16.33 | |||||||||||||
|
|
|
|||||||||||||||
The fair value of each grant of stock options was determined by the Company using the methods and assumptions discussed below. Each of these inputs is subjective and generally requires significant judgment and management estimate to determine.
The total fair value of shares vested during the years ended June 26, 2015, June 27, 2014, and June 28, 2013 was $1.1 million, $2.0 million, and $2.4 million, respectively. The total intrinsic value of options exercised during the years ended June 26, 2015, June 27, 2014, and June 28, 2013 was $0.2 million, $2.2 million, and $0.8 million, respectively. In conjunction with these exercises, there was no tax benefit realized by the Company due to the fact that it is exempted from income tax. The amount of cash received from the exercise of share options was $0.8 million during the year ended June 26, 2015.
Valuation Method—The Company estimated the fair value of the Company’s ordinary shares to be used in the Black-Scholes-Merton (“BSM”) option-pricing formula by taking into consideration a number of assumptions.
Expected Dividend—The Company used zero as an annualized dividend yield since it did not anticipate paying any cash dividends in the near future.
Expected Volatility—The Company determined the expected volatility based on the Company’s historical volatility over the last 4 years.
Risk-Free Interest Rate—The Company based the risk-free interest rate on the implied yield currently available on U.S. Treasury zero-coupon issues with a remaining term equivalent to the expected term of the option.
Expected Term—Expected terms used in the BSM option-pricing formula represent the periods that the company’s share options are expected to be outstanding and are determined based on the Company’s historical experience of similar awards, giving consideration to the contractual terms of the share options, vesting schedules and expectations of future employee behavior.
Vesting Period—Fabrinet’s share options generally vest and become exercisable over a four-year period, and expire seven years from the date of grant. For an initial grant, 25 percent of the underlying shares
85
Table of Contents
subject to an option vest 12 months after the vesting commencement date and 1/48 of the underlying shares vest monthly over each of the subsequent 36 months. In the case of any additional grants to an optionee, 1/48 of the underlying shares subject to an option vest monthly over four years, commencing one month after the vesting commencement date.
Fair Value—The fair value of Fabrinet’s share options granted to employees was estimated using the weighted-average assumptions of expected volatility, risk-free rate of return, and expected term.
The following summarizes information for share options outstanding as of June 26, 2015 under the share options plan:
| Number of Shares Underlying Options |
Exercise Price Per Share |
Weighted Average Remaining Contractual Life (years) |
Aggregate Intrinsic Value (amount in thousands) |
|||||||||||||
| 6,590 | $ | 5.75 | 1.14 | |||||||||||||
| 8,368 | $ | 13.77 | 2.16 | |||||||||||||
| 416,526 | $ | 16.83 | 2.30 | |||||||||||||
| 30,000 | $ | 15.05 | 2.36 | |||||||||||||
| 23,844 | $ | 25.50 | 2.55 | |||||||||||||
| 7,400 | $ | 26.16 | 2.61 | |||||||||||||
| 8,300 | $ | 23.62 | 2.86 | |||||||||||||
| 66,989 | $ | 15.16 | 3.15 | |||||||||||||
| 193,521 | $ | 14.12 | 3.38 | |||||||||||||
| 22,760 | $ | 19.36 | 3.62 | |||||||||||||
| 5,550 | $ | 18.60 | 3.68 | |||||||||||||
| 2,171 | $ | 12.83 | 3.87 | |||||||||||||
|
|
|
|||||||||||||||
| Options outstanding |
792,019 | 2.69 | $ | 3,010 | ||||||||||||
|
|
|
|
|
|
|
|||||||||||
| Options exercisable |
758,451 | 2.66 | $ | 2,843 | ||||||||||||
|
|
|
|
|
|
|
|||||||||||
| Expected to vest as of June 26, 2015 |
789,048 | 2.69 | $ | 2,995 | ||||||||||||
|
|
|
|
|
|
|
|||||||||||
As of June 26, 2015, there was $0.01 million of unrecognized compensation cost related to share options under the Share Option Plans that is expected to be recognized over a weighted-average period of 0.41 years.
Restricted share units
Restricted share units are one type of share-based award that may be granted under the 2010 Plan. Restricted share units granted to non-employee directors generally cliff vest 100% on the first of January, approximately one year from the grant date, provided the director continues to serve through such date. Restricted share units granted to employees generally vest in four equal installments over four years on each anniversary of the vesting commencement date.
On May 24, 2015 the Company entered into an amended and restated employment agreement with an executive of the Company that provides for accelerated vesting of equity awards under certain circumstances. Under the agreement, any equity award granted to the executive after February 20, 2017, shall vest over a period not longer than 2 years following the applicable grant date. If the executive’s employment with the Company continues through and including February 20, 2017, any then outstanding equity award grants will become 100% vested. During the year the modification was made for the executive, the Company recalculated the share-based compensation expense, and the impact of this modification to the consolidated financial statements was $0.04 million.
86
Table of Contents
The following table summarizes restricted share unit activity:
| Number of Shares |
Weighted- Average Grant Date Fair Value Per Share |
|||||||
| Balance as of June 29, 2012 |
168,275 | $ | 14.44 | |||||
| Granted |
468,387 | $ | 12.42 | |||||
| Issued |
(71,880 | ) | $ | 14.10 | ||||
| Forfeited |
(19,114 | ) | $ | 12.78 | ||||
|
|
|
|||||||
| Balance as of June 28, 2013 |
545,668 | $ | 12.81 | |||||
| Granted |
479,894 | $ | 15.37 | |||||
| Issued |
(184,773 | ) | $ | 12.98 | ||||
| Forfeited |
(78,494 | ) | $ | 14.25 | ||||
|
|
|
|||||||
| Balance as of June 27, 2014 |
762,295 | $ | 14.23 | |||||
| Granted |
666,582 | $ | 17.53 | |||||
| Issued |
(247,593 | ) | $ | 14.44 | ||||
| Forfeited |
(40,357 | ) | $ | 16.68 | ||||
|
|
|
|||||||
| Balance as of June 26, 2015 |
1,140,927 | $ | 16.03 | |||||
|
|
|
|||||||
| Expected to vest as of June 26, 2015 |
1,039,544 | $ | 16.02 | |||||
|
|
|
|||||||
The total fair value of restricted share units vested during the year ended June 26, 2015, June 27, 2014, and June 28, 2013 was $3.6 million, $2.4, million and $1.0 million, respectively. The aggregate intrinsic value of restricted share units outstanding as of June 26, 2015 was $22.7 million.
As of June 26, 2015, there was $8.0 million of unrecognized share-based compensation expense related to restricted share units under the 2010 Plan that is expected to be recorded over a weighted-average period of 2.55 years.
For the years ended June 26, 2015 and June 27, 2014, the Company withheld an aggregate of 19,679 shares and 18,403 shares, respectively, upon the vesting of restricted share units, based upon the closing share price on the vesting date to settle the employees’ minimum statutory obligation for the applicable income and other employment taxes. For fiscal year 2015 and fiscal year 2014, the Company then remitted cash of $0.4 million and $0.3 million, respectively, to the appropriate taxing authorities, and presented it in a financing activity within the consolidated statements of cash flows. The payment had the effect on shares issued by the Company as it reduced the number of shares that would have been issued on the vesting date and was recorded as a reduction of additional paid-in capital.
| 14. | Employee benefit plans |
Employee contribution plan
The Company operates a defined contribution plan, known as a provident fund, in its Thailand subsidiary. The assets of this plan are in a separate trustee-administered fund. The provident fund is funded by matching payments from employees and by the subsidiary on a monthly basis. Current contributions to the provident fund are accrued and paid to the fund manager on a monthly basis. The Company’s contributions to the provident fund amounted to $2.3 million, $2.1 million, and $2.2 million in the years ended June 26, 2015, June 27, 2014, and June 28, 2013, respectively.
The Company sponsors the Fabrinet U.S. 401(k) Retirement Plan (the “401(k) Plan”), a Defined Contribution Plan under ERISA, at its Fabrinet USA, Inc., FBN New Jersey Manufacturing, Inc., and Fabrinet West, Inc. subsidiaries, which provides retirement benefits for its eligible employees through tax deferred salary deductions. The 401(k) Plan allows employees to contribute up to 80% of their annual
87
Table of Contents
compensation, subject to annual contributions limits established by the Internal Revenue Service. The Company provides for a 100% match of employees’ contributions to the 401(k) Plan up to the first 6% of annual compensation. All matching contributions are made in cash and vest immediately. The Company’s matching contributions to the 401(k) Plan were $0.3 million, $0.2 million, and $0.2 million in the years ended June 26, 2015, June 27, 2014, and June 28, 2013, respectively.
Executive incentive plan and employee performance bonuses
For the year ended June 26, 2015, the Company maintained an executive incentive plan with quantitative objectives, based on achieving certain revenue and non-GAAP earnings per share targets as well as qualitative objectives, based on achieving individual performance goal for the fiscal year. For the year ended June 27, 2014, the Company maintained an executive incentive plan with quantitative objectives, based on achieving certain revenue and gross margin percentage target as well as qualitative objectives, based on achieving individual performance goals for the fiscal year. For the year ended June 28, 2013, the Company maintained an executive incentive plan with quantitative objectives, based on achieving certain revenue and earnings per share milestones for the fiscal years. During the years ended June 26, 2015, June 27, 2014, and June 28, 2013, discretionary merit-based bonus awards were also available to Fabrinet’s non-executive employees.
Bonus distributions to employees were $6.0 million, $5.1 million, and $3.7 million for the years ended June 26, 2015, June 27, 2014, and June 28, 2013, respectively.
| 15. | Shareholders’ equity |
Fabrinet’s authorized share capital is 500,000,000 ordinary shares, par value of $0.01 per ordinary share, and 5,000,000 preferred shares, par value of $0.01 per preferred share.
In the year ended June 26, 2015, Fabrinet issued 56,968 ordinary shares upon the exercise of options, for cash consideration at a weighted average exercise price of $14.67 per share, and 227,914 ordinary shares upon the vesting of restricted share units, net of shares withheld.
In the year ended June 27, 2014, Fabrinet issued 351,435 ordinary shares upon the exercise of options, for cash consideration at a weighted average exercise price of $13.00 per share, and 166,370 ordinary shares upon the vesting of restricted share units, net of shares withheld.
In the year ended June 28, 2013, Fabrinet issued 94,188 ordinary shares upon the exercise of options, for cash consideration at a weighted average exercise price of $5.96 per share, and 69,950 ordinary shares upon the vesting of restricted share units, net of shares withheld.
All such issued shares are fully paid.
88
Table of Contents
| 16. | Accumulated other comprehensive loss |
The Company’s accumulated other comprehensive loss consists of the accumulated net unrealized loss and the reclassification adjustment for net loss realized and included in other expense in net income on available-for-sale securities. For the year ended June 26, 2015, the changes in accumulated other comprehensive loss, net of tax were as follows:
| (amount in thousands) | Unrealized Loss
on Available-for-Sale Securities |
|||
| Balance as of June 27, 2014 |
$ | — | ||
| Other comprehensive loss before reclassification adjustment |
(193 | ) | ||
| Less: Reclassification adjustment for net loss realized and included in other expense in net income |
149 | |||
|
|
|
|||
| Net current-period other comprehensive loss |
$ | (44 | ) | |
|
|
|
|||
| Balance as of June 26, 2015 |
$ | (44 | ) | |
|
|
|
|||
| 17. | Commitments and contingencies |
Bank guarantees
As of June 26, 2015 and June 27, 2014, there were outstanding bank guarantees given by banks on behalf of Fabrinet Thailand for electricity usage and other normal business amounting to $0.8 million and $0.3 million, respectively.
Operating lease commitments
The Company leases a portion of its capital equipment, vehicle, and certain land and buildings for its facilities in Cayman Islands, China, and New Jersey under operating lease arrangements that expire in various years through 2020. Rental expense under these operating leases amounted to $1.1 million, $0.8 million, and $0.8 million for the years ended June 26, 2015, June 27, 2014, and June 28, 2013, respectively.
As of June 26, 2015, the future minimum lease payments due under non-cancelable leases are as follows at the end of each fiscal year below:
| (amount in thousands) | ||||
| 2016 |
$ | 1,153 | ||
| 2017 |
979 | |||
| 2018 |
979 | |||
| 2019 |
489 | |||
| 2020 |
291 | |||
|
|
|
|||
| Total minimum operating lease payments |
$ | 3,891 | ||
|
|
|
|||
Purchase obligations
Purchase obligations represent legally-binding commitments to purchase inventory and other commitments made in the normal course of business to meet operational requirements. Although open purchase orders are considered enforceable and legally binding, their terms generally give the Company the option to cancel, reschedule and/or adjust its requirements based on its business needs prior to the delivery of goods or performance of services. Obligations to purchase inventory and other commitments are generally expected to be fulfilled within one year.
As of June 26, 2015, the Company had an outstanding commitment to third parties of $4.3 million.
89
Table of Contents
Indemnification of directors and officers
Cayman Islands law does not limit the extent to which a company’s memorandum and articles of association may provide for indemnification of directors and officers, except to the extent any such provision may be held by the Cayman Islands courts to be contrary to public policy, such as to provide indemnification against civil fraud or the consequences of committing a crime. Fabrinet’s amended and restated memorandum and articles of association provide for indemnification of directors and officers for actions, costs, charges, losses, damages and expenses incurred in their capacities as such, except that such indemnification does not extend to any matter in respect of any fraud or dishonesty that may attach to any of them.
In accordance with Fabrinet’s form of indemnification agreement for its directors and officers, Fabrinet has agreed to indemnify its directors and officers against certain liabilities and expenses incurred by such persons in connection with claims by reason of their being such a director or officer. Fabrinet maintains a director and officer liability insurance policy that may enable it to recover a portion of any future amounts paid under the indemnification agreements.
Contingent liability
In the first week of October 2013, the Company authorized a customer to return a number of units of its product manufactured at the Company’s Pinehurst facility, due to functional failure. After investigation, the Company found that the affected products were produced during the first quarter of fiscal year 2014. On March 28, 2014, the Company entered into a settlement agreement with the customer for the losses as a result of the product failure. The settled amount was $0.5 million and recorded in the consolidated statement of operations and comprehensive income for the year ended June 27, 2014. There was no additional expense recorded during the year ended June 26, 2015 due to this case.
| 18. | Business segments and geographic information |
Operating segments are defined as components of an enterprise for which separate financial information is available that is evaluated regularly by the chief operating decision maker in deciding how to allocate resources and in assessing performance. The Company’s chief operating decision maker is Fabrinet’s chief executive officer. As of June 26, 2015, June 27, 2014, and June 28, 2013, the Company operated and internally managed a single operating segment. Accordingly, the Company does not accumulate discrete information with respect to separate product lines and does not have separate reportable segments.
Total revenues are attributed to a particular geographic area based on the bill-to-location of the customer. The Company operates primarily in three geographic regions: North America, Asia-Pacific, and Europe. The following table presents total revenues by geographic regions:
| Years Ended | ||||||||||||
| (amount in thousands) | June 26, 2015 |
June 27, 2014 |
June 28, 2013 |
|||||||||
| North America |
$ | 370,836 | $ | 326,647 | $ | 299,510 | ||||||
| Asia-Pacific |
309,941 | 230,314 | 218,393 | |||||||||
| Europe |
92,810 | 120,893 | 123,639 | |||||||||
|
|
|
|
|
|
|
|||||||
| Total |
$ | 773,587 | $ | 677,854 | $ | 641,542 | ||||||
|
|
|
|
|
|
|
|||||||
As of June 26, 2015 and June 27, 2014, the Company had approximately $31.8 million and $0.3 million of long-lived assets based in North America, with the substantial remainder of assets based in Asia-Pacific.
90
Table of Contents
The following table presents revenues by end market:
| Years Ended | ||||||||||||
| (amount in thousands) | June 26, 2015 |
June 27, 2014 |
June 28, 2013 |
|||||||||
| Optical communications |
$ | 553,245 | $ | 484,071 | $ | 449,790 | ||||||
| Lasers, sensors, and other |
220,342 | 193,783 | 191,752 | |||||||||
|
|
|
|
|
|
|
|||||||
| Total |
$ | 773,587 | $ | 677,854 | $ | 641,542 | ||||||
|
|
|
|
|
|
|
|||||||
Significant customers
Total revenues, by percentage, from individual customers representing 10% or more of total revenues in the respective periods were as follows:
| Years Ended | ||||||||||||
| June 26, 2015 |
June 27, 2014 |
June 28, 2013 |
||||||||||
| JDS Uniphase Corporation |
20 | % | 24 | % | 22 | % | ||||||
| Oclaro, Inc. |
10 | % | 22 | % | 25 | % | ||||||
Accounts receivable from individual customers that were equal to or greater than 10% of accounts receivable as of June 26, 2015, June 27, 2014, and June 28, 2013, respectively, were as follows:
| Years Ended | ||||||||||||
| June 26, 2015 |
June 27, 2014 |
June 28, 2013 |
||||||||||
| JDS Uniphase Corporation |
19 | % | 23 | % | 17 | % | ||||||
| Valeo |
11 | % | 10 | % | * | (1) | ||||||
| Oclaro, Inc. (1) |
* | (1) | 14 | % | 31 | % | ||||||
| (1) | Less than 10% of total revenue / total accounts receivable. |
| 19. | Financial instruments |
Objectives and significant terms and conditions
The principal financial risks faced by the Company are foreign currency risk and interest rate risk. The Company borrows at floating rates of interest to finance its operations. A minority of sales and purchases and a majority of labor and overhead costs are entered into in foreign currencies. In order to manage the risks arising from fluctuations in currency exchange rates, the Company uses derivative financial instruments. Trading for speculative purposes is prohibited under Company policies.
The Company enters into short-term forward foreign currency contracts and option contracts to help manage currency exposures associated with certain assets and liabilities. The forward exchange contracts and option contracts have generally ranged from one to six months in original maturity, and no forward exchange contract or option contract has an original maturity greater than one year. All foreign currency exchange contracts and option contracts are recognized on the consolidated balance sheets at fair value. As the Company does not apply hedge accounting to these instruments, the derivatives are recorded at fair value through earnings.
The gains and losses on the Company’s derivative financial instruments generally offset losses and gains on the assets, liabilities and transactions economically hedged, and accordingly, generally do not subject the Company to risk of significant accounting losses.
91
Table of Contents
Foreign currency risk
The Company operates internationally and is exposed to foreign exchange risk arising from various currency exposures primarily with respect to the Thai Baht and the Chinese Renminbi (RMB).
As of June 26, 2015 and June 27, 2014, the Company had outstanding foreign currency assets and liabilities as follows:
| As of June 26, 2015 | As of June 27, 2014 | |||||||||||||||
| (amount in thousands, except percentages) | Currency | $ | Currency | $ | ||||||||||||
| Assets |
||||||||||||||||
| Thai Baht |
377,785 | $ | 11,596 | 1,536,887 | $ | 47,318 | ||||||||||
| RMB |
67,455 | 11,029 | 74,813 | 12,156 | ||||||||||||
|
|
|
|
|
|||||||||||||
| Total |
$ | 22,625 | $ | 59,474 | ||||||||||||
|
|
|
|
|
|||||||||||||
| Liabilities |
||||||||||||||||
| Thai Baht |
860,425 | $ | 26,410 | 735,490 | $ | 22,644 | ||||||||||
| RMB |
20,461 | 3,347 | 32,512 | 5,283 | ||||||||||||
|
|
|
|
|
|||||||||||||
| Total |
$ | 29,757 | $ | 27,927 | ||||||||||||
|
|
|
|
|
|||||||||||||
The Thai Baht assets represent cash and cash equivalents, accounts receivable, deposits and other current assets. The Thai Baht liabilities represent trade accounts payable, accrued expenses and other payables. The Company manages its exposure to fluctuations in foreign exchange rates by the use of foreign currency contracts and offsetting assets and liabilities denominated in the same currency in accordance with management’s policy. As of June 26, 2015, there was $41.0 million in option contracts outstanding on the Thai Baht payables and as of June 27, 2014, there were $15.0 million in options contracts outstanding on the Thai Baht payables.
The RMB assets represent cash and cash equivalents, accounts receivable and other current assets. The RMB liabilities represent trade accounts payable, accrued expenses and other payables. As of June 26, 2015 and June 27, 2014, there were no selling RMB to U.S. dollar forward contracts outstanding.
As of June 26, 2015 and June 27, 2014, unrealized loss from fair market value of derivatives amounted to $0.4 million and unrealized gain from fair market value of derivatives amounted to $0.1 million, respectively.
Interest Rate Risk
The Company’s principal interest bearing assets are time deposits and short-term investments less than three months held with high quality financial institutions. The Company’s principal interest bearing liabilities are bank loans which bear interest at floating rates.
| 20. | Income related to flooding |
The Company suspended production at all of its manufacturing facilities in Thailand from October 17, 2011 through November 14, 2011 due to severe flooding in Thailand. The Company never resumed, and has permanently ceased, production at its Chokchai facility. The Company submitted claims for losses to its insurance companies, all of which were settled as of the end of fiscal year 2014.
In fiscal year 2014, the Company received from its insurer a final payment of $45.2 million against its claim for owned and consigned equipment and inventory, which the Company recognized as income related to flooding. This income was offset by $0.5 million of other expenses from write-offs of advance payments to a customer due to flood-related losses.
During fiscal year 2014, the Company fulfilled its obligations to a customer in accordance with the a settlement agreement entered into during the third quarter of fiscal year 2013 by making a final cash
92
Table of Contents
payment of $5.3 million and transferring equipment with an aggregate value of $2.3 million to such customer. In addition, the Company fulfilled its obligations to a customer’s insurers in accordance with a settlement agreement entered into during the fourth quarter of fiscal 2013 by making a payment of $2.3 million.
| 21. | Expenses related to reduction in workforce |
As part of the Company’s ongoing efforts to achieve greater efficiencies in all areas of its business, during the year ended June 26, 2015 and June 28, 2013, the Company implemented a reduction in workforce and incurred expenses of approximately $1.2 million and $2.1 million, respectively, which represented severance and benefits costs incurred for the termination of approximately 100 employees and 180 employees, respectively, in accordance with contractual obligations and local regulations.
| 22. | Principal subsidiaries |
Fabrinet’s subsidiaries are:
| Name |
Business |
Country of Incorporation |
Percent interest |
|||||
| Fabrinet Co., Ltd. |
Manufacturing and assembly | Thailand | 99.99 | |||||
| Fabrinet USA, Inc. |
Marketing and administrative support services | United States of America (California) | 100 | |||||
| FBN New Jersey Manufacturing, Inc. |
Manufacturing and assembly | United States of America (Delaware) | 100 | |||||
| Fabrinet China Holdings |
Holding company | Mauritius Island | 100 | |||||
| CASIX Inc. (a wholly-owned subsidiary of Fabrinet China Holdings) |
Manufacturing and assembly | People’s Republic of China | 100 | |||||
| Fabrinet Pte., Ltd. |
Sales and administrative support services and supply chain sourcing center | Singapore | 100 | |||||
| Fabrilink SEZC |
Administrative support service | The Cayman Islands | 100 | |||||
| Fabrinet West, Inc. |
Manufacturing and assembly | United States of America (California) | 100 | |||||
| Fabritek, Inc. |
Rental service | United States of America (California) | 100 | |||||
| 23. | Subsequent events |
During the week of August 10, 2015, the Company temporary suspended production in the manufacturing facility of its subsidiary in China due to storm damage caused by Typhoon Soudelor. The Company expects to resume production at the facility in August 2015. While the Company is currently estimating its liabilities and expenses for the quarter ending September 25, 2015 in relation to this matter, the financial statements for the year ended June 26, 2015 were not affected.
93
Table of Contents
UNAUDITED QUARTERLY FINANCIAL INFORMATION
The following tables set forth a summary of the Company’s quarterly financial information for each of the four quarters in the fiscal years ended June 26, 2015 and June 27, 2014:
| Three Months Ended | ||||||||||||||||||||||||||||||||
| (in thousands, except per share data) | Jun 26, 2015 |
Mar 27, 2015 |
Dec 26, 2014 |
Sep 26, 2014 |
Jun 27, 2014 |
Mar 28, 2014 |
Dec 27, 2013 |
Sep 27, 2013 |
||||||||||||||||||||||||
| Total revenues |
$ | 206,456 | $ | 189,453 | $ | 188,353 | $ | 189,325 | $ | 160,084 | $ | 167,657 | $ | 178,562 | $ | 171,551 | ||||||||||||||||
|
|
|
|
|
|
|
|
|
|
|
|
|
|
|
|
|
|||||||||||||||||
| Gross profit |
$ | 24,549 | $ | 21,657 | $ | 21,061 | $ | 20,506 | $ | 17,775 | $ | 17,283 | $ | 20,530 | $ | 18,645 | ||||||||||||||||
|
|
|
|
|
|
|
|
|
|
|
|
|
|
|
|
|
|||||||||||||||||
| Net income |
$ | 13,035 | $ | 10,845 | $ | 8,726 | $ | 11,036 | $ | 10,333 | $ | 47,662 | $ | 14,539 | $ | 19,197 | ||||||||||||||||
|
|
|
|
|
|
|
|
|
|
|
|
|
|
|
|
|
|||||||||||||||||
| Basic net income per share: |
||||||||||||||||||||||||||||||||
| Net income |
$ | 0.37 | $ | 0.31 | $ | 0.25 | $ | 0.31 | $ | 0.29 | $ | 1.36 | $ | 0.42 | $ | 0.55 | ||||||||||||||||
|
|
|
|
|
|
|
|
|
|
|
|
|
|
|
|
|
|||||||||||||||||
| Weighted-average shares used in basic net income per share calculations |
35,431 | 35,406 | 35,349 | 35,230 | 35,117 | 35,078 | 34,882 | 34,674 | ||||||||||||||||||||||||
|
|
|
|
|
|
|
|
|
|
|
|
|
|
|
|
|
|||||||||||||||||
| Diluted net income per share: |
||||||||||||||||||||||||||||||||
| Net income |
$ | 0.36 | $ | 0.30 | $ | 0.24 | $ | 0.31 | $ | 0.29 | $ | 1.33 | $ | 0.41 | $ | 0.55 | ||||||||||||||||
|
|
|
|
|
|
|
|
|
|
|
|
|
|
|
|
|
|||||||||||||||||
| Weighted-average shares used in diluted net income per share calculations |
36,320 | 36,110 | 35,917 | 35,587 | 35,843 | 35,790 | 35,583 | 35,138 | ||||||||||||||||||||||||
|
|
|
|
|
|
|
|
|
|
|
|
|
|
|
|
|
|||||||||||||||||
| ITEM 9. | CHANGES IN AND DISAGREEMENTS WITH ACCOUNTANTS ON ACCOUNTING AND FINANCIAL DISCLOSURE. |
None.
| ITEM 9A. | CONTROLS AND PROCEDURES. |
Evaluation of Disclosure Controls and Procedures
Our management is responsible for establishing and maintaining disclosure controls and procedures designed to ensure that the information we are required to disclose in reports we file or submit under the Securities Exchange Act of 1934, as amended (“Exchange Act”), (i) is recorded, processed, summarized, and reported within time periods specified in the rules and forms of the Securities and Exchange Commission, and (ii) is accumulated and communicated to Fabrinet’s management, including our Chief Executive Officer (“CEO”) and Chief Financial Officer (“CFO”), as appropriate, to allow timely decisions regarding required disclosure.
Our management, including our CEO and CFO, evaluated the effectiveness of our disclosure controls and procedures (as defined in Rule 13a-15(e) of the Exchange Act), as of the end of the period covered by this Annual Report on Form 10-K. Based on their evaluation, our management concluded that, as of June 26, 2015, the Company’s disclosure controls and procedures were effective.
Changes in Internal Control over Financial Reporting
We have implemented policies and procedures with respect to significant customer contracts review and designed and implemented a new training program and a series of follow-up training programs concerning revenue recognition under U.S. GAAP that included engaging an external technical accounting consultant with extensive U.S. GAAP experiences to conduct a comprehensive review of significant customer contracts on a regular basis. These changes have materially affected, or are reasonably likely to materially affect, our internal
94
Table of Contents
control over financial reporting for the quarter and year ended June 26, 2015. As part of our ongoing process improvement and compliance efforts, we have performed testing procedures on the Company’s internal controls implemented during fiscal year 2015.
Management’s Annual Report on Internal Control over Financial Reporting
Management is responsible for establishing and maintaining adequate internal control over financial reporting of the Company as defined in Rule 13a-15(f) under the Exchange Act. Internal control over financial reporting is a process designed to provide reasonable assurance regarding the reliability of financial reporting and the preparation of financial statements for external purposes in accordance with generally accepted accounting principles (“GAAP”).
Our internal control over financial reporting includes those policies and procedures that (i) pertain to the maintenance of records that, in reasonable detail, accurately, and fairly reflect the transactions and dispositions of the assets of the Company; (ii) provide reasonable assurance that transactions are recorded as necessary to permit preparation of financial statements in accordance with generally accepted accounting principles, and that receipts and expenditures of the Company are being made only in accordance with authorizations of management and directors of the Company; and (iii) provide reasonable assurance regarding prevention or timely detection of unauthorized acquisition, use, or disposition of the Company’s assets that could have a material effect on the financial statements.
Because of its inherent limitations, internal control over financial reporting may not prevent or detect misstatements. Also, projections of any evaluation of effectiveness to future periods are subject to the risk that controls may become inadequate because of changes in conditions, or that the degree of compliance with the policies or procedures may deteriorate. Management has assessed the effectiveness of our internal control over financial reporting as of June 26, 2015. In making this assessment, management used the criteria described in Internal Control—Integrated Framework (2013) issued by the Committee of Sponsoring Organizations of the Treadway Commission (COSO).
Based on their assessment, management concluded that we maintained effective internal control over financial reporting at June 26, 2015, based on the criteria in Internal Control—Integrated Framework issued by COSO. The effectiveness of our internal control over financial reporting as of June 26, 2015 has been audited by PricewaterhouseCoopers ABAS Ltd., an independent registered public accounting firm, as stated in their report which appears herein.
Remediation of Prior Year Material Weakness
As disclosed in our Item 9A of the Annual Report on Form 10-K for the fiscal year ended June 27, 2014, we identified a material weakness in our internal control over financial reporting such that our disclosure controls and procedures and internal control over financial reporting were not effective. The material weakness related to us not appling appropriate U.S. GAAP knowledge and expertise when assessing the terms of volume supply arrangements with respect to when the title and risk of loss transfers to our customers.
Throughout fiscal year 2015, our management, under the supervision of our CEO and CFO, undertook the following actions intended to remedy this material weakness, and to improve our control processes and procedures with respect to revenue recognition:
| • | We conducted mandatory revenue recognition training for our management staff using third-party accounting experts. Management staff also attended follow-up training held by technical accounting specialists from large accounting firms and other professional organizations to maintain up-to-date knowledge on U.S. GAAP accounting principles with respect to the application of our policies concerning revenue recognition. |
95
Table of Contents
| • | We implemented procedures to ensure that significant customer contracts, both those in effect at the commencement of the fiscal year and those entered into during the year, are subject to a comprehensive review by appropriate management staff to ensure that the financial accounting for such contracts is in compliance with U.S. GAAP and that the contracts properly reflect our current business practices. |
| • | In addition, we engaged an external technical accounting consultant with extensive U.S. GAAP experience to conduct a comprehensive review of all contracts discussed above to ensure the correct application of U.S. GAAP standards and principles related to relevant technical accounting topics, especially for the revenue recognition and cut-off criteria. |
Management has committed to maintaining a strong internal control environment and believes that these remediation efforts represent significant improvements in our controls and would have remediated the material weaknesses found in fiscal year 2014.
Management evaluated the operating effectiveness of the remediation procedures throughout the fiscal year 2015. As of June 26, 2015, the controls and procedures implemented have been tested and determined to be operating effectively, to allow management to conclude that the material weakness has been remediated.
| ITEM 9B. | OTHER INFORMATION. |
Not applicable.
96
Table of Contents
| ITEM 10. | DIRECTORS, EXECUTIVE OFFICERS AND CORPORATE GOVERNANCE. |
Information responsive to this item is incorporated herein by reference to our definitive proxy statement with respect to our 2015 Annual Meeting of Shareholders to be filed with the SEC within 120 days after the end of the fiscal year covered by this Annual Report on Form 10-K (the “2015 Proxy Statement”).
| ITEM 11. | EXECUTIVE COMPENSATION. |
Information responsive to this item is incorporated herein by reference to our 2015 Proxy Statement.
| ITEM 12. | SECURITY OWNERSHIP OF CERTAIN BENEFICIAL OWNERS AND MANAGEMENT AND RELATED STOCKHOLDER MATTERS. |
Information responsive to this item is incorporated herein by reference to our 2015 Proxy Statement.
| ITEM 13. | CERTAIN RELATIONSHIPS AND RELATED TRANSACTIONS, AND DIRECTOR INDEPENDENCE. |
Information responsive to this item is incorporated herein by reference to our 2015 Proxy Statement.
| ITEM 14. | PRINCIPAL ACCOUNTING FEES AND SERVICES. |
Information responsive to this item is incorporated herein by reference to our 2015 Proxy Statement.
97
Table of Contents
| ITEM 15. | EXHIBITS, FINANCIAL STATEMENT SCHEDULES. |
(a) The following documents are filed as part of, or incorporated by reference into, this Annual Report on Form 10-K:
1. Financial Statements: See Index to Consolidated Financial Statements under Item 8 of this Annual Report on Form 10-K.
2. Financial Statement Schedules: All schedules are omitted because they are not required, are not applicable or the information is included in the consolidated financial statements or notes thereto.
3. Exhibits: We have filed, or incorporated by reference into this Annual Report on Form 10-K, the exhibits listed on the accompanying Exhibit Index immediately following the signature page of this Annual Report on Form 10-K.
(b) Exhibits: See Item 15(a)(3), above.
(c) Financial Statement Schedules: See Item 15(a)(2), above.
98
Table of Contents
SIGNATURES
Pursuant to the requirements of Section 13 or 15(d) of the Securities Exchange Act of 1934, the registrant has duly caused this report to be signed on its behalf by the undersigned, thereunto duly authorized, on August 19, 2015.
| FABRINET | ||
| By: | /S/ TOH-SENG NG | |
| Name: | Toh-Seng Ng | |
| Title: | Executive Vice President and Chief Financial Officer | |
POWER OF ATTORNEY
KNOW ALL PERSONS BY THESE PRESENTS, that each person whose signature appears below constitutes and appoints David T. Mitchell and Toh-Seng Ng and each of them, as his true and lawful attorney-in-fact and agent with full power of substitution, for him and in his name, place and stead, in any and all capacities, to sign any and all amendments to this Annual Report on Form 10-K and to file the same, with all exhibits thereto and all documents in connection therewith, with the Securities and Exchange Commission, granting unto said attorney-in-fact and agent full power and authority to do and perform each and every act and thing requisite and necessary to be done in connection therewith, as fully to all intents and purposes as he might or could do in person, hereby ratifying and confirming that said attorney-in-fact and agent, or his substitute, may lawfully do or cause to be done by virtue hereof.
99
Table of Contents
Pursuant to the requirements of the Securities Exchange Act of 1934, this report has been signed below by the following persons on behalf of the registrant and in the capacities and on the dates indicated.
| Signature |
Title |
Date | ||
| /S/ DAVID T. MITCHELL David T. Mitchell |
Chief Executive Officer and Chairman of the Board of Directors (Principal Executive Officer) |
August 19, 2015 | ||
| /S/ TOH-SENG NG Toh-Seng Ng |
Executive Vice President and Chief Financial Officer (Principal Financial and Accounting Officer) |
August 19, 2015 | ||
| /S/ HOMA BAHRAMI Homa Bahrami |
Director |
August 19, 2015 | ||
| /S/ THOMAS F. KELLY Thomas F. Kelly |
Director |
August 19, 2015 | ||
| /S/ FRANK H. LEVINSON Frank H. Levinson |
Director |
August 19, 2015 | ||
| /S/ ROLLANCE E. OLSON Rollance E. Olson |
Director |
August 19, 2015 | ||
| /S/ VIRAPAN PULGES Virapan Pulges |
Director |
August 19, 2015 | ||
100
Table of Contents
EXHIBIT INDEX
| Exhibit |
Incorporated by reference herein | |||||||||
| Description |
Form |
Exhibit No. |
Filing Date |
File No. | ||||||
| 3.1 | Amended and Restated Memorandum and Articles of Association | S-1/A | 3.1 | May 3, 2010 | 333-163258 | |||||
| 4.1 | Specimen Ordinary Share Certificate | S-1/A | 4.1 | June 14, 2010 | 333-163258 | |||||
| 4.2 | Registration Rights Agreement, dated June 22, 2010, by and among the registrant, Asia Pacific Growth Fund III, L.P., H&Q Asia Pacific, Ltd., the David T. Mitchell Separate Property Trust, the Gabriel T. Mitchell Trust, the Alexander T. Mitchell Trust, the Sean T. Mitchell Trust, JDS Uniphase Corporation and Shea Ventures, LLC | S-1/A | 10.26 | June 14, 2010 | 333-163258 | |||||
| 4.3 | Amendment No. 1 to Registration Rights Agreement, dated February 6, 2013, among Fabrinet, Asia Pacific Growth Fund III, L.P., H&Q Asia Pacific, Ltd., the David T. Mitchell Separate Property Trust, the Gabriel T. Mitchell Trust, the Alexander T. Mitchell Trust and the Sean T. Mitchell Trust | 8-K | 4.1 | February 8, 2013 | 001-34775 | |||||
| 10.1.1+ | Fabrinet Amended and Restated 1999 Share Option Plan | 10-K | 10.1.1 | September 8, 2010 | 001-34775 | |||||
| 10.1.2+ | Form of Share Option Agreement under the Fabrinet Amended and Restated 1999 Share Option Plan | S-1 | 10.1.2 | November 7, 2007 | 333-147191 | |||||
| 10.2.1+ | Fabrinet 2010 Performance Incentive Plan, as amended | 10-K | 10.2.1 | October 16, 2014 | 001-34775 | |||||
| 10.2.2+ | Form of Share Option Agreement under the Fabrinet 2010 Performance Incentive Plan | 10-Q | 10.2 | February 5, 2013 | 001-34775 | |||||
| 10.2.3+ | Form of Restricted Share Agreement under the Fabrinet 2010 Performance Incentive Plan | 10-Q | 10.3 | February 5, 2013 | 001-34775 | |||||
| 10.2.4+ | Form of Restricted Share Unit Agreement under the Fabrinet 2010 Performance Incentive Plan | 10-Q | 10.4 | February 5, 2013 | 001-34775 | |||||
| 10.3+ | Amended and Restated Employment Agreement, dated May 24, 2015, by and between David T. Mitchell and the registrant | |||||||||
101
Table of Contents
| Exhibit |
Incorporated by reference herein | |||||||||
| Description |
Form |
Exhibit No. |
Filing Date |
File No. | ||||||
| 10.4+ | Amended and Restated Offer Letter, dated February 5, 2015, by and between Dr. Harpal Gill and Fabrinet USA, Inc. | 8-K | 10.1 | February 12, 2015 | 001-34755 | |||||
| 10.5+ | Employment Agreement, dated July 1, 2007, by and between Dr. Harpal Gill and Fabrinet Co., Ltd. | S-1 | 10.5 | November 7, 2007 | 333-147191 | |||||
| 10.6+ | Description of Fiscal 2014 Executive Incentive Plan | 8-K, Item 5.02 | N/A | August 12, 2013 | 001-34755 | |||||
| 10.7+ | Description of Fiscal 2015 Executive Incentive Plan | 8-K, Item 5.02 | N/A | November 3, 2014 | 001-34755 | |||||
| 10.8+ | Description of Performance Share Unit Plan | 8-K, Item 5.02 | N/A | November 3, 2014 | 001-34755 | |||||
| 10.9+ | Amended and Restated Employment Offer Letter, dated November 2, 2012, between John Marchetti and Fabrinet USA, Inc. | 8-K | 10.1 | November 6, 2012 | 001-34755 | |||||
| 10.10+ | Amended and Restated Offer Letter, dated February 5, 2015, between the registrant and Toh-Seng Ng | 8-K | 10.2 | February 12, 2015 | 001-34755 | |||||
| 10.11+ | Form of Indemnification Agreement | S-1/A | 10.10 | January 28, 2010 | 333-163258 | |||||
| 10.12 | Manufacturing Agreement, dated May 29, 2005, by and between the registrant and FBN New Jersey Holdings Corp. | S-1 | 10.10 | November 7, 2007 | 333-147191 | |||||
| 10.13 | Manufacturing Agreement, dated January 2, 2000, by and between the registrant and Fabrinet Co., Ltd. | S-1 | 10.11 | November 7, 2007 | 333-147191 | |||||
| 10.14 | Administrative Services Agreement, dated January 2, 2000, by and between the registrant and Fabrinet USA, Inc. | S-1 | 10.12 | November 7, 2007 | 333-147191 | |||||
| 10.15 | Administrative Services Agreement, dated July 3, 2008, by and between the registrant and Fabrinet Pte. Ltd. | S-1 | 10.14 | November 20, 2009 | 333-163258 | |||||
| 10.16.1 | Credit Agreement, dated as of May 22, 2014, by and among Fabrinet, the guarantors from time to time party thereto, the lenders from time to time party thereto and Bank of America, N.A. as administrative agent. | 8-K | 10.1 | May 22, 2014 | 001-34775 | |||||
| 10.16.2 | First Amendment to Credit Agreement, effective as of September 25, 2014, by and among Fabrinet, the guarantors party thereto, the lenders party thereto and Bank of America, N.A. as administrative agent. | 10-Q | 10.1 | November 5, 2014 | 001-34775 | |||||
102
Table of Contents
| Exhibit |
Incorporated by reference herein | |||||||||
| Description |
Form |
Exhibit No. |
Filing Date |
File No. | ||||||
| 10.16.3 | Second Amendment to Credit Agreement, dated as of February 26, 2015, by and among Fabrinet, the guarantors party thereto, the lenders party thereto and Bank of America, N.A. as administrative agent. | 8-K | 10.1 | March 2, 2015 | 001-34775 | |||||
| 10.16.4 | Third Amendment to Credit Agreement, dated as of July 31, 2015, by and among Fabrinet, the designated borrowers party thereto, the guarantors party thereto, the lenders party thereto and Bank of America, N.A. as administrative agent. | 8-K | 10.1 | August 5, 2015 | 001-34775 | |||||
| 10.17 | Security and Pledge Agreement, dated as of May 22, 2014, by and between Fabrinet and Bank of America, N.A. as administrative agent. | 8-K | 10.2 | May 22, 2014 | 001-34775 | |||||
| 10.18 | Lease Agreement, dated July 1, 2013, by and between Donly Corporation and FBN New Jersey Manufacturing, Inc. DBA VitroCom | 10-K | 10.16 | August 16, 2013 | 001-34775 | |||||
| 10.19† | Primary Contract Manufacturing Agreement, dated January 1, 2008, by and between JDS Uniphase Corporation and the registrant | S-1/A | 10.27 | January 19, 2010 | 333-163258 | |||||
| 10.20 | Facility Agreement, dated April 25, 2014, between TMB Bank Public Company Limited, Fabrinet and Fabrinet Company Limited | 10-K | 10.21 | October 16, 2014 | 001-34775 | |||||
| 10.21 | Facility Agreement, dated May 12, 2011, between TMB Bank Public Company Limited, Fabrinet and Fabrinet Co., Ltd. | 8-K | 10.1 | August 16, 2011 | 001-34755 | |||||
| 10.22 | General Terms and Conditions of Facility, dated May 12, 2011, between TMB Bank Public Company Limited, Fabrinet and Fabrinet Co., Ltd. | 8-K | 10.2 | August 16, 2011 | 001-34755 | |||||
| 10.23 | Confirmation for Cross Currency Swap Transaction, dated May 12, 2011, between TMB Bank Public Company Limited, Fabrinet and Fabrinet Co., Ltd. | 8-K | 10.3 | August 16, 2011 | 001-34755 | |||||
| 10.24 | Sale, Purchase and Escrow Agreement, dated as of February 11, 2015, for 4900 Patrick Henry Drive, Santa Clara, California. | 10-Q | 10.4 | May 5, 2015 | 001-34775 | |||||
| 21.1 | List of Subsidiaries | |||||||||
103
Table of Contents
| Exhibit |
Incorporated by reference herein | |||||||||
| Description |
Form |
Exhibit No. |
Filing Date |
File No. | ||||||
| 23.1 | Consent of PricewaterhouseCoopers ABAS Ltd. | |||||||||
| 24.1 | Power of Attorney (incorporated by reference to the signature page of this Annual Report on Form 10-K) | |||||||||
| 31.1 | Certification of Chief Executive Officer pursuant to Exchange Act Rules 13a-14(a) and 15d-14(a), as adopted pursuant to Section 302 of the Sarbanes-Oxley Act of 2002 | |||||||||
| 31.2 | Certification of Chief Financial Officer pursuant to Exchange Act Rules 13a-14(a) and 15d-14(a), as adopted pursuant to Section 302 of the Sarbanes-Oxley Act of 2002 | |||||||||
| 32.1 | Certifications of Chief Executive Officer and Chief Financial Officer pursuant to 18 U.S.C. Section 1350, as adopted pursuant to Section 906 of the Sarbanes-Oxley Act of 2002 | |||||||||
| 101.INS | XBRL Instance | |||||||||
| 101.SCH | XBRL Taxonomy Extension Schema | |||||||||
| 101.CAL | XBRL Taxonomy Extension Calculation Linkbase | |||||||||
| 101.DEF | XBRL Taxonomy Extension Definition Linkbase | |||||||||
| 101.LAB | XBRL Taxonomy Extension Label Linkbase | |||||||||
| 101.PRE | XBRL Taxonomy Extension Presentation Linkbase | |||||||||
| + | Indicates management contract or compensatory plan. |
| † | Confidential treatment has been requested for portions of this exhibit. |
104
Exhibit 10.3
FABRINET (CAYMAN)
A CAYMAN ISLANDS CORPORATION
AMENDED AND RESTATED EMPLOYMENT AGREEMENT
THIS AMENDED AND RESTATED EMPLOYMENT AGREEMENT (the “Agreement”) is entered into effective as of May 25, 2015 by and between FABRINET (CAYMAN), a company formed under the laws of the Cayman Islands (“Employer” or “Fabrinet”), and DAVID T. MITCHELL (“Employee”).
R E C I T A L S:
A. Employee, the founding shareholder of Employer, possesses skill, experience, and knowledge in the executive management and operation of business enterprises and desires to be employed by Employer.
B. Employer is engaged in the business of providing contract manufacturing services to businesses, and desires to engage the services of Employee as its chief executive officer.
C. This Agreement amends and restates, in its entirety, that certain Employment Agreement the Employer and Employee previously entered into, effective as of January 1, 2000 and subsequently amended on December 29, 2008 (the “Prior Agreement”), in order to reflect certain agreement changes to the terms of the Prior Agreement between the Employer and Employee.
D. NOW, THEREFORE, in consideration of the mutual terms, promises, and conditions set forth in this Agreement, the parties agree as follows:
| 1. | EMPLOYMENT AND DUTIES. |
a. Employer previously hired Employee as its Chief Executive Officer, and Employee accepted that employment. Employee shall have all of the obligations, duties, and responsibilities customary for such a position, subject to the policies and directives of Employer’s Board of Directors (the “Board”) who shall have the final authority for determining the nature and scope of Employee’s duties.
b. During his employment, Employee shall devote his full energies, abilities, and professional time to the performance of his duties under this Agreement and pursuant to the provisions hereof shall not, without Employer’s prior written consent, render services to others of any kind for compensation or engage in any other business activity which would be competitive with or interfere with the performance of Employee’s duties under this Agreement.
1
| 2. | TERM OF EMPLOYMENT. |
The term of employment under this Agreement commenced as of January 1, 2000, and continues through and including March 2, 2022, unless extended by mutual agreement or terminated earlier pursuant to the provisions of Section 5 (the “Term”).
| 3. | COMPENSATION AND BENEFITS. |
a. Base Salary. Commencing as of July 1, 2014, Employer shall pay Employee, as compensation for the performance of his duties and obligations under this Agreement, a base salary at the rate of $700,000 per annum, payable in arrears not less frequently than monthly in accordance with the normal payroll practices of Employer. Such base salary shall be subject to review each year for possible increase by the Board, but shall in no event be decreased from its then-existing level during the term of this Agreement.
b. Bonus Compensation. In addition to base salary, subject to the Board’s approval, Employee shall be eligible to participate in Fabrinet’s Executive Incentive Plan, with a target bonus of One Hundred Twenty Percent (120%) of Employee’s base salary with respect to each fiscal year of Fabrinet. Any target bonus, or portion thereof, will be paid as soon as practicable after the Compensation Committee of the Board determines that the target bonus (or relevant portion thereof) has been earned, but in no event shall any such target bonus be paid later than sixty (60) days following the end of the applicable target bonus performance period.
c. Stock Options and RSUs. Provided that Employee continues to be employed by Employer, Employee shall be eligible, at the discretion of the board of directors of Employer, to receive grants of options to acquire ordinary shares of Employer pursuant to the terms and conditions of Employer’s 2010 Performance Incentive Plan. Stock options granted to Employee shall vest over a four year period and shall be governed by the terms of the 2010 Performance Incentive Plan and any award agreement thereunder. In addition, provided that Employee continues to be employed by Employer, Employee shall be eligible, at the discretion of the board of directors of Employer, to receive grants of restricted stock units (RSUs) pursuant to the terms and conditions of Employer’s 2010 Performance Incentive Plan and any award agreement thereunder; provided, however, that any RSUs granted to Employee after February 20, 2017 shall vest over a period no longer than two years following the applicable date of grant.
d. Other Benefits.
(1) The Employee shall be eligible to participate in any benefit plan made generally available to senior executives of Employer, including any such pension plan, hospitalization plan, medical and dental service plan, disability plan, life insurance plan, death benefit plan, 401(k) plan, retirement plan or any other employee benefit plan, which may be in effect at any time or from time to time during the Employee’s employment under this Agreement, subject to the amendment or termination of any such plan or benefit. During the Term, the Employer’s hospitalization plan, medical and dental service plan shall also provide hospitalization, dental and medical coverage for the Employee’s dependents, including his spouse and minor children. Commencing January 1, 2000, and continuing until such time as the
2
Employee becomes eligible for coverage under the Employer’s group health insurance plan, Employer shall make (or reimburse Employee for) the premium payments necessary to permit the Employee to continue group health insurance coverage for the Employee and his eligible dependents under Blue Cross/Blue Shield and to continue his current disability policy until coverage under Employer’s policy begins.
(2) Within such time as prescribed by the Employer, from time to time and upon presentation of receipts by the Employee, the Employer shall reimburse the Employee for all reasonable travel (including food and lodging), entertainment and other similar business expenses incurred by him in the performance of his duties hereunder in accordance with the Employer’s policies regarding such expenses. The Employer will reimburse the Employee in the amount of $2,500 per month, upon receipt of an invoice for such amount from Employee, for reasonable expenses incurred by the Employee in equipping, maintaining and operating a phone, fax and computer for the equivalent of an at-home office, payable in accordance with the Employer’s policies regarding such expenses.
(3) The Employee shall be entitled to reasonable vacations as may be consistent with the generally applicable vacation policies of the Employer, but in no event less than six (6) weeks of paid vacation per year.
(4) Provided that Employee’s employment with the Employer continues through and on February 20, 2017, the Employee shall become 100% vested on February 20, 2017 in any outstanding restricted stock, RSUs, stock appreciation rights, phantom stock or other equity based awards granted to the Employee by the Employer, which have not previously fully vested.
e. Indemnification. In connection with any threatened, pending or completed claim, demand, liability, action, suit, arbitration or proceeding, whether civil, criminal, administrative or investigative, or any appeal therefrom, whether by or in the right of Employer or otherwise, arising out of or relating to the fact that Employee is or was a director, officer, employee or agent of Employer, or is or was serving at the request of Employer in any such role for any other corporation or entity, or by reason of anything done or not done by the Employee in any such capacity, Employer hereby expressly agrees and shall indemnify and hold Employee harmless, to the fullest extent authorized by law, against any and all expenses (including, without limitation, attorneys’ fees and all other costs, expenses or obligations paid or incurred in connection with investigating, defending, being a witness in or participating in (including on appeal) any such matter), damages, judgments, fines and amounts paid in settlement, as actually and reasonably incurred by Employee in connection therewith, except where such claim or action results from the Employee’s willful misconduct or gross negligence. In the event that both Employee and Employer are made a party to the same action, complaint, suit, arbitration or proceeding, Employee shall be entitled to engage separate legal counsel and, except where such claim or action results from the Employee’s willful misconduct or gross negligence, Employer shall pay all costs, expenses or obligations paid or incurred in connection with such separate legal counsel. Further, while Employee agrees at all times to use Employee’s best efforts to discharge faithfully his duties under this Agreement, Employee cannot be held liable to Employer for a breach of his duty of care, acts or omissions made in good faith where Employee has not exhibited willful misconduct, gross neglect or performed criminal or fraudulent acts. Employer shall promptly pay (or advance to
3
Employee, to the fullest extent authorized by law) on behalf of and for Employee, upon presentation of invoices, any and all amounts for which indemnification is provided under this Section 3(e). In addition, Employer shall purchase and maintain directors’ and officers’ liability insurance in an amount and in a form customarily held by companies situated similarly to Employer, and Employee shall be a beneficiary of such policy or policies. Notwithstanding any statement contained in this Agreement to the contrary, the obligations of Employer set forth in this Section 3(e) shall survive any termination or expiration of this Agreement.
| 4. | NON-SOLICITATION, CONFIDENTIALITY AND TRADE SECRETS. |
a. The Employee acknowledges that (i) the principal business of the Employer (which expressly includes for purposes of this Section 4, its successors and assigns) is the manufacture of electronic and mechanical components for use in the assembly of disk drives and other electronic components (such businesses, and any and all other businesses that after the date hereof, and from time to time during the Term, become material with respect to the Employer’s then-overall business, herein being collectively referred to as the “Business”); (ii) the Employer’s Business is national and international in scope; (iii) the Employee’s work for the Employer has given and will continue to give him access to the confidential affairs and proprietary information of the Employer; (iv) the covenants and agreements of the Employee contained in this Section 4 are essential to the business and goodwill of the Employer; and (v) the Employer would not have entered into this Agreement but for the covenants and agreements set forth in this Section 4. Accordingly, the Employee covenants and agrees that:
(i) During the Term, the Employee will disclose to the Employer, and the Employer shall maintain such disclosure in confidence to the extent required by Section 2871 of the California Labor Code, as amended (the “CLC”), all information, ideas, discoveries, inventions, trade secrets and other intangibles developed by the Employee, either individually or with others, which relate, directly or indirectly, to the business of the Employer, including without limitation any process, method, operation, product, service or any improvements thereof, whether or not conceived or developed during the Employee’s working hours, and with respect to which the equipment, supplies, facilities or confidential information of the Employer or its affiliates was used in whole or in part (“Proprietary Information”).
During and after the Term, the Employee will not disclose any such Proprietary Information to any third party without prior written consent of the Employer except for Proprietary Information which becomes publicly known through no wrongful act of the Employee. All rights in and to all Proprietary Information shall be owned solely and exclusively by the Employer. Proprietary Information shall include, without limitation, any and all patent, trademark, copyright, trade secret and other proprietary rights of any kind whatsoever, any and all works in any medium whatsoever that refer to, relate to, incorporate, include, analyze or utilize such Proprietary Information, including, but not limited to, improvements and modifications thereto and derivations therefrom. To the extent necessary to vest such sole and exclusive ownership in the Employer, the Employee hereby irrevocably assigns to the Employer (and, as applicable, its successors and assigns) any and all rights in and to such Proprietary Information. Notwithstanding the foregoing, to the extent required by Section 2870 of the CLC, this Section 4a.(i) shall not require the Employee to assign, or offer to assign, any invention that the employee
4
developed entirely on his own time without using the Employer’s equipment, supplies, facilities or trade-secret information except for those inventions that either (A) relate at the time of conception or reduction to practice of the invention to the Employer’s business, or actual or demonstrable anticipated research or development of the Employer, or (B) results from any work performed by the Employee for the Employer.
The Employee agrees to sign, execute and acknowledge, or cause to be signed, executed or acknowledged, without cost to the Employer, any and all documents and to perform such acts as may be considered necessary, useful or convenient by the Employer for the purpose of obtaining, perfecting, recording, renewing or enforcing title to the Proprietary Information by the Employer, and all rights therein. The Employee hereby grants all such royalty-free, perpetual and assignable licenses to the Employer as may be necessary for the Employer to use, sell, reproduce, modify and otherwise exercise control over the Proprietary Information for any purpose whatsoever, without any obligation of accounting or payment of royalties or other compensation to the Employee or to any third party. Proprietary Information may be used by the Employee only in connection with performing the Employee’s responsibilities under this Agreement. Upon termination of the Employee’s employment, the Employee shall no longer use Proprietary Information for any purpose whatsoever.
(ii) During and after the Term, the Employee shall keep secret and retain in strictest confidence, and shall not use for his benefit or the benefit of others, except in connection with the business and affairs of the Employer and its affiliates, all confidential matters relating to the Employer’s Business and the business of Employer and its affiliates, learned by the Employee heretofore or hereafter, directly or indirectly, from the Employer and its affiliates (the “Confidential Employer Information”), including, without limitation, information with respect to (A) sales figures of the Employer or its affiliates, (B) profit or loss figures of the Employer or its affiliates, (C) customers, clients, suppliers and customer lists and lists of the employees of the Employer and its affiliates and (D) software now or hereafter sold or licensed by the Employer, whether or not developed by the Employer or its affiliates or by the Employee in connection with his employment, and any source code to such software or other related asset to which the Employer or its affiliates has any proprietary rights; and shall not disclose such Confidential Employer Information to anyone outside of the Employer except with the Employer’s express written consent and except for Confidential Employer Information which is at the time of receipt or thereafter becomes publicly known through no wrongful act of the Employee or is received from a third party not under an obligation to keep such information confidential and without breach of this Agreement.
b. During the Term, the Employee shall not, without the Employer’s prior written consent:
(i) solicit or encourage to leave the employment or other service of the Employer or its affiliates, any employee or independent contractor thereof or hire (on behalf of the Employee or any other person or entity) any employee or independent contractor who has left the employment or other service of the Employer or its affiliates within the one-year period which follows the termination of such employee’s or independent contractor’s employment or other service with the Employer and its affiliates; or
5
(ii) whether for his own account or for the account of any other person, firm, corporation or other business organization, intentionally interfere with the Employer’s, or any of its affiliates’ relationship with, or endeavor to entice away from the Employer or its affiliates, any person who during the Term is or was a customer or client of the Employer or its affiliates.
c. For a one-year period immediately following the termination of Employee’s employment pursuant to Sections 5(a), 5(b), 5(c) or 5(e), below, the Employee shall not, without the Employer’s prior written consent:
(i) solicit or encourage to leave the employment or other service of the Employer or its affiliates, any employee or independent contractor thereof or hire (on behalf of the Employee or any other person or entity) any employee or independent contractor who has left the employment or other service of the Employer or its affiliates within the one-year period which follows the termination of such employee’s or independent contractor’s employment or other service with the Employer and its affiliates; or
(ii) whether for his own account or for the account of any other person, firm, corporation or other business organization, intentionally interfere with the Employer’s or any of its affiliates’ relationship with, or endeavor to entice away from the Employer or its affiliates, any person who during the term of Employee’s employment or the one-year period following the expiration of the term of Employee’s employment is or was a customer or client of the Employer or its affiliates.
d. All visually perceptible or machine-readable documents and things which consist of, include, or refer or relate to Proprietary Information, and any other memoranda, notes, lists, records, property and any other tangible product and documents (and all copies thereof) made, produced or compiled by the Employee or made available to him concerning the business of the Employer or its affiliates, (i) shall at all times be the property of the Employer, and (ii) upon the Employee’s termination of employment, shall be returned to the Employer.
e. Employee acknowledges that Employer will suffer substantial damages not readily ascertainable or compensable in terms of money in the event of a breach of Employee’s obligations under this Section. The parties agree that Employer shall be entitled (without limitation of any other rights or remedies available to it) to obtain an injunction or other equitable relief from any court of competent jurisdiction prohibiting the continuance or recurrence of any such breach.
| 5. | TERMINATION OF AGREEMENT. |
a. Termination for Death, Disability or Cause. During the term of this Agreement, Employer may terminate this Agreement and Employee’s employment in any one of the following ways:
(1) Death. Automatically, upon the death of the Employee, in the event the Employee’s employment is terminated due to his death, Employer shall pay to the Employee’s legal representatives or named beneficiaries (as the Employee may designate from
6
time to time in a notice to Employer) a lump sum payment in an amount equal to the sum of (i) twenty-four (24) months of the Employee’s then present base salary, and (ii) an amount equal to the pro-rata portion of the target bonus which the Employee would have been paid for his performance for the fiscal year in which his death occurs, but in no event less than six (6) months of the then-current base salary, and such payments shall be made upon the sixtieth (60) day following the death of Employee. Additionally, Employee’s legal representatives or named beneficiaries shall receive continued tax equalization benefits under Fabrinet’s expatriate policy, as in effect on the termination date of Employee’s employment, as set forth in Section 5(d)(5) below.
(2) Disability. Automatically, upon Employee becoming unable to engage in any substantial gainful activity by reason of any medically determinable physical or mental impairment that can be expected to result in death or can be expected to last for a continuous period of not less than twelve (12) months (a “Disability”), Employee shall be eligible to receive a lump sum payment payable on the sixtieth (60) day following the date on which Employee incurs a Disability of an amount equal to twenty-four (24) months of the Employee’s then present base salary. Upon Employee receiving the payment described under this Section 5(a)(2), all obligations of the Employer hereunder shall thereupon cease. Additionally, Employee shall receive continued tax equalization benefits under Fabrinet’s expatriate policy, as in effect on the date of Employee’s Disability, as set forth in Section 5(d)(5) below.
(3) Good Cause. Employer may terminate this Agreement at any time ten (10) days after delivery of written notice to Employee for good cause, which shall be limited to the following:
(i) commission of any felony or any crime involving moral turpitude;
(ii) willful breach of Employee’s duties to Employer, including but not limited to theft from Employer and failure to fully disclose personal pecuniary interest in a transaction involving Employer.
(iii) engaging in (A) willful misconduct; (B) willful or gross neglect; (C) fraud; (D) misappropriation; or (E) embezzlement, in each case in the performance of his duties hereunder or otherwise.
b. Without Cause.
(1) At any time during the term of this Agreement, Employee may, without cause, terminate this Agreement and Employee’s employment, effective ninety (90) days after written notice is provided to Employer at which time, subject to payment of amounts due and owing to Employee pursuant to Section 5(d), all obligations of the Employer hereunder shall cease.
(2) Employee’s employment may be terminated by Employer without cause (and not as the result of death or Disability) during the term of this Agreement. In the event Employer terminates Employee’s employment without cause prior to the Transition Date (as
7
defined below), pursuant to this Section 5(b)(2), Employee shall (A) be eligible to receive a lump sum payment payable on the sixtieth (60) day following the termination date of Employee’s employment equal to the sum of (i) twenty-four (24) months of Employee’s then present base salary, and (ii) any earned but unpaid bonus as of the termination date of Employee’s employment; (B) be eligible to receive a lump sum payment payable on the sixtieth (60) day following the termination date of Employee’s employment equal to two times Employee’s cost of COBRA coverage for twelve (12) months under the Fabrinet health plans then in effect for you and your covered dependents; and (C) receive continued tax equalization benefits under Fabrinet’s expatriate policy, as in effect on the termination date of Employee’s employment, as set forth in Section 5(d)(5) below.
c. For Good Reason. In addition to Employee’s other rights set forth in this Agreement, prior to the Transition Date (as defined below) Employee may terminate this Agreement at any time thirty (30) days after delivery of notice to the Board for “good reason,” which shall be (i) a material diminution during the term of this Agreement in Employee’s office, duties or responsibilities (including following any change in control of Employer) or (ii) a material breach by Employer of this Agreement. Notwithstanding the foregoing, Employee may not terminate this Agreement for good reason without providing (x) reasonable written notice to the Board setting forth the reasons for Employee’s intention to terminate for good reason within ninety (90) days of the initial existence of the good reason condition, (y) an opportunity for the Board to meet with Employee, together with legal counsel, and an opportunity by the Board to cure such reason within thirty (30) days after receipt of such notice, and (z) delivery by Employee to the Board of a notice of termination for good reason setting forth the reasons for such termination at which time, subject to Section 5(d), all obligations of the Employer hereunder shall cease. Should Employee terminate his employment with Employer pursuant to this Section 5(c) prior to the Transition Date (as defined below), Employee shall (A) be eligible to receive a lump sum payment payable on the sixtieth (60) day following the termination date of Employee’s employment equal to the sum of (i) twenty-four (24) months of Employee’s then present base salary, and (ii) any earned but unpaid bonus as of the termination date of Employee’s employment; (B) be eligible to receive a lump sum payment payable on the sixtieth (60) day following the termination date of Employee’s employment equal to two times Employee’s cost of COBRA coverage for twelve (12) months under the Fabrinet health plans then in effect for you and your covered dependents; and (C) receive continued tax equalization benefits under Fabrinet’s expatriate policy, as in effect on the termination date of Employee’s employment, as set forth in Section 5(d)(5) below.
d. Consequences of Termination.
(1) Upon termination of this Agreement for any reason provided in Sections 5(a), 5(b) or 5(c) above or in Section 5(e) below, Employer shall pay promptly to Employee all compensation earned and all benefits and reimbursements due through the effective date of termination. Any additional payments or benefits due to Employee under Sections 5(a)(2), 5(b) or 5(c) above, in Section 5(d)(3) (unless the benefit under Section 5(d)(3) is triggered on account of Employee’s death) or in Section 5(e) below shall be conditioned upon Employee’s execution of a general release of claims in such form as provided by Fabrinet within five (5) calendar days following the termination date of this Agreement that becomes irrevocable within sixty (60) days following the termination date of this Agreement. If the foregoing release is
8
executed and delivered and no longer subject to revocation as provided in the preceding sentence, then such payments or benefits shall be made or commence upon the sixtieth (60) day following the termination date of this Agreement. The first such cash payment shall include payment of all amounts that otherwise would have been due prior thereto under the terms of this Agreement had such payments commenced immediately upon the termination date of this Agreement, and any payments made thereafter shall continue as provided herein. The delayed payments or benefits shall in any event expire at the time such benefits would have expired had such benefits commenced immediately following the termination date of this Agreement. All other rights and obligations of Employer and Employee under this Agreement shall cease as of the effective date of termination, except that Employer’s obligations under Section 3(e) hereof and Employee’s obligations under Section 4 hereof shall survive any termination or expiration of this Agreement.
(2) In the event of any termination of Employee’s employment for any reason, Employee shall be under no obligation to seek other employment and there shall be no offset against any amounts due to Employee under this Agreement on account of any remuneration attributable to any subsequent employment that Employee may obtain. Any amounts due under this Section 5 are in the nature of severance payments, or liquidated damages, or both, and are not in the nature of a penalty.
(3) Notwithstanding any statement contained in this Agreement to the contrary, upon a termination upon death of the Employee under Section 5(a)(1), upon the Employee’s Disability under Section 5(a)(2), by the Employer without cause under Section 5(b)(2), by the Employee for Good Reason under Section 5(c), or by Employee on account of his termination of employment under Section 5(e): (x) any options or rights to purchase securities of Employer shall immediately vest and remain exercisable until the earlier of (1) the four (4) year anniversary of the termination of Employee, (or in the event of Employee’s Disability, the four (4) year anniversary of the date on which Employee incurs a Disability) or (2) the date in which the options or rights to purchase securities of Employer otherwise would have expired in accordance with its terms, and (y) the Employee shall become 100% vested immediately prior to the Employee’s termination date (or in the event of Employee’s Disability, immediately prior to the date on which Employee incurs a Disability) in any outstanding restricted stock, restricted stock units, stock appreciation rights, phantom stock or other equity based awards granted to the Employee by Fabrinet, which have not previously fully vested.
(4) Notwithstanding anything to the contrary in this Agreement, no Deferred Compensation Separation Benefits (as defined below) will be considered due or payable until the Employee has incurred a “separation from service” within the meaning of Section 409A of the Internal Revenue Code of 1986, as amended, and the final regulations and any guidance promulgated thereunder (together, “Section 409A”).
(5) In addition, if Fabrinet retains its securities on a stock exchange and remains a public company prior to any termination of Employee’s employment, and at the time of such termination it is determined that Employee is a “specified employee” within the meaning of Section 409A, the severance payable to Employee, pursuant to this Agreement, when considered together with any other severance payments or separation benefits that are considered deferred compensation under Section 409A (together, the “Deferred Compensation Separation Benefits”)
9
that are payable within the first six (6) months following Employee’s termination of employment, will become payable on the first payroll date that occurs on or after the date six (6) months and one (1) day following the date of Employee’s termination of employment. Any amount paid under this Agreement that satisfies the requirements of the “short-term deferral” rule set forth in Section 1.409A-1(b)(4) of the Treasury Regulations will not constitute Deferred Compensation Separation Benefits for purposes of this Section. In addition, any amount paid under this Agreement that qualifies as a payment made as a result of an involuntary separation from service pursuant to Section 1.409A-1(b)(9)(iii) of the Treasury Regulations that does not exceed the specified limit in Section 1.409A-1(b)(9)(iii)(A) of the Treasury Regulations will not constitute Deferred Compensation Separation Benefits for purposes of this Section. Each payment and benefit payable under this Agreement is intended to constitute separate payments for purposes of Section 1.409A-2(b)(2) of the Treasury Regulations. Except to the extent any expense or reimbursement under this Agreement does not constitute a “deferral of compensation” within the meaning of Section 409A, any expense or reimbursement under this Agreement shall meet the following requirements: (i) the amount of expenses eligible for reimbursement provided to Employee during any calendar year will not affect the amount of expenses eligible for reimbursement or in-kind benefits provided to Employee in any other calendar year, (ii) the reimbursements for expenses for which Employee is entitled to be reimbursed shall be made on or before the last day of the calendar year following the calendar year in which the applicable expense is incurred, (iii) the right to payment or reimbursement on in-kind benefits hereunder may not be liquidated or exchanged for any other benefit and (iv) the reimbursements shall be made pursuant to objectively determinable and nondiscretionary Employer policies and procedures regarding such reimbursement of expenses. For purposes of this Agreement, any tax equalization benefits under Fabrinet’s expatriate policy, shall be provided for the calendar year in which the termination date of Employee’s employment occurs, and the following calendar year, with such benefits being payable as soon as practicable following the year the compensation subject to the tax equalization payment relates was paid, and in no event later than the end of Employee’s second taxable year beginning after Employee’s taxable year in which Employee’s U.S. Federal income tax return is required to be filed (including any extensions) for the year to which the compensation subject to the tax equalization payment relates, or, if later, Employee’s second taxable year beginning after the latest such taxable year in which Employee’s foreign tax return or payment is required to be filed or made for the year to which the compensation subject to the tax equalization payment relates. The foregoing provisions are intended to comply with the requirements of Section 409A so that none of the payments and benefits to be provided hereunder will be subject to the additional tax imposed under Section 409A, and any ambiguities herein will be interpreted to so comply. The parties to this Agreement agree to work together in good faith to consider amendments to this Agreement, if required, and to take such reasonable actions, which are necessary, appropriate or desirable to avoid imposition of any additional tax or income recognition prior to actual payment to Employee under Section 409A.
e. Transition Date Termination. Should Employee terminate this Agreement and Employee’s employment with Employer on February 20, 2022 (the “Transition Date”) or within ten (10) calendar days after the Transition Date, Employee shall (A) be eligible to receive a lump sum payment payable on the sixtieth (60) day following the termination date of Employee’s employment equal to the sum of (i) the product of one month’s base salary then in effect multiplied by the total number of full and fractional years of Employee’s employment with
10
Fabrinet or Fabrinet’s subsidiaries as of the termination date of Employee’s employment, and (ii) any earned but unpaid bonus as of the termination date of Employee’s employment; (B) be eligible to receive a lump sum payment payable on the sixtieth (60) day following the termination date of Employee’s employment equal to two times Employee’s cost of COBRA coverage for twelve months under the Fabrinet health plans then in effect for Employee and Employee’s covered dependents; and (C) receive continued tax equalization benefits under Fabrinet’s expatriate policy, as in effect on the termination date of Employee’s employment, as set forth in Section 5(d)(5) above (collectively, the “Retention Benefits”). Except as otherwise provided in this Agreement, in the event Employee’s employment is terminated prior to the Transition Date or more than ten (10) calendar days after the Transition Date, neither the Retention Benefits, nor the benefits available under Section 5(d)(3) hereof on account of Employee’s termination of employment under this Section 5(e), shall be due, owed, or paid to Employee. Prior to the Transition Date, the Employee shall use the Employee’s best efforts to recruit and train a successor so that a successor to the Employee’s position assumes the Employee’s position that is satisfactory to the Board upon or prior to the Transition Date.
| 6. | PROVISIONS OF GENERAL APPLICATION. |
a. Entire Agreement. This Agreement contains the entire agreement between the parties and supersedes all prior oral and written agreements, understandings, commitments and practices between the parties. No amendment to this agreement may be made except by a writing signed by both parties and approved by the Board.
b. Governing Law. The formation, construction, and performance of this Agreement shall be construed in accordance with, and governed by, the laws of the State of California, and the correct venue for purposes of any proceeding brought to enforce or interpret the provisions of this Agreement shall be deemed to be the County of Santa Clara, State of California.
c. Notices. Any notice to Employer required or permitted under this Agreement shall be given in writing to:
(1) Employer, either by personal service or by registered or certified mail, postage prepaid, addressed to the Employer’s principal place of business;
(2) H&Q Asia Pacific Limited, One Bush Street, San Francisco, California 94104, U.S.A; and
(3) H&Q (Thailand) Limited, Suite 1207, 12th Floor, Sathorn City Tower, 175 South Sathorn Road, Sathorn, Bangkok 10500, Thailand.
Any such notice to Employee shall be given in writing, and if mailed, shall be addressed to Employee at his home address then shown in Employer’s records. For purposes of determining any time limit in this Agreement, a notice shall be deemed to have been duly given (i) on the date of service, if served personally, or (ii) on the second business day after mailing.
11
d. Severability. If any provision of this Agreement is held invalid or unenforceable, the remainder of this Agreement shall nevertheless remain in full force and effect.
e. No Assignment. Neither party may transfer the rights or delegate the duties provided for under the terms of this Agreement without the prior written consent of the other party.
f. Binding Effect. This Agreement shall inure to the benefit of, and the obligations hereunder shall continue to be binding upon, the parties respective successors, assigns, heirs, and personal representatives.
g. Counterparts. This Agreement may be executed in one or more counterparts, each of which shall be deemed to be an original but all of which together will constitute one and the same instrument.
h. Enforceability; Jurisdictions. The Employer and the Employee intend to and hereby confer jurisdiction to enforce the covenants specified in Section 4 of this Agreement (the “Covenants”) upon the courts of any jurisdiction within the geographical scope of the Covenants. If the courts of any one or more of such jurisdictions hold the Covenants wholly unenforceable by reason of breadth of scope or otherwise, it is the intention of the Employer and the Employee that such determination not bar or in any way affect the Employer’s right, or the right of any of its affiliates, to the relief provided above in the courts of any other jurisdiction within the geographical scope of such Covenants, as to breaches of such Covenants in such other respective jurisdictions, such Covenants as they relate to each jurisdiction being, for this purpose, severable, diverse and independent covenants, subject, where appropriate, to the doctrine of res judicata.
i. Breach of Agreement. Employee hereby agrees and acknowledges that as of May 25, 2015, the Employer has not in any way breached any provision of this Agreement.
j. Withholding. Anything in this Agreement to the contrary notwithstanding, all payments required to be made by Fabrinet hereunder to Employee or Employee’s estate or beneficiaries shall be subject to the withholding of such amounts relating to taxes as Fabrinet may reasonably determine it should withhold pursuant to any applicable law or regulation. In lieu of withholding such amounts, in whole or in part, Fabrinet may, in its sole discretion, accept other provisions for payment of taxes and withholding as required by law, provided it is satisfied that all requirements of law affecting its responsibilities to withhold have been satisfied.
12
IN WITNESS WHEREOF, this Agreement has been executed on May 25, 2015 and is effective as of the date first set forth above.
EMPLOYER:
FABRINET (CAYMAN), a Cayman Islands corporation
| By: | /s/ Frank Levinson | |
| Frank Levinson, Chairman of the Compensation Committee of the Board of Directors | ||
EMPLOYEE:
| /s/ David T. Mitchell | ||
| David T. Mitchell | ||
13
Exhibit 21.1
List of Subsidiaries
| Name |
Country of Incorporation | |
| Fabrinet Co., Ltd. | Thailand | |
| Fabrinet USA, Inc. | California, United States of America | |
| FBN New Jersey Manufacturing, Inc. | Delaware, United States of America | |
| Fabrinet China Holdings | Mauritius Island | |
| CASIX Inc. | People’s Republic of China | |
| Fabrinet Pte., Ltd. | Singapore | |
| Fabrilink SEZC | The Cayman Islands | |
| Fabrinet West, Inc. | California, United States of America | |
| Fabritek, Inc. | California, United States of America | |
Exhibit 23.1
CONSENT OF INDEPENDENT REGISTERED PUBLIC ACCOUNTING FIRM
We hereby consent to the incorporation by reference in the Registration Statements on Form S-8 (Nos. 333-168950, 333-177853 and 333-186501) of Fabrinet of our report dated August 19, 2015 relating to the financial statements and the effectiveness of internal control over financial reporting, which appears in this Form 10-K.
/s/ PricewaterhouseCoopers ABAS Ltd.
PricewaterhouseCoopers ABAS Ltd.
Bangkok, Thailand
August 19, 2015
Exhibit 31.1
CERTIFICATION
I, David T. Mitchell, certify that:
| 1. | I have reviewed this Annual Report on Form 10-K of Fabrinet; |
| 2. | Based on my knowledge, this report does not contain any untrue statement of a material fact or omit to state a material fact necessary to make the statements made, in light of the circumstances under which such statements were made, not misleading with respect to the period covered by this report; |
| 3. | Based on my knowledge, the financial statements, and other financial information included in this report, fairly present in all material respects the financial condition, results of operations and cash flows of the registrant as of, and for, the periods presented in this report; |
| 4. | The registrant’s other certifying officer and I are responsible for establishing and maintaining disclosure controls and procedures (as defined in Exchange Act Rules 13a-15(e) and 15d-15(e)) and internal control over financial reporting (as defined in Exchange Act Rules 13a-15(f) and 15d-15(f)) for the registrant and have: |
| (a) | Designed such disclosure controls and procedures, or caused such disclosure controls and procedures to be designed under our supervision to ensure that material information relating to the registrant, including its consolidated subsidiaries, is made known to us by others within those entities, particularly during the period in which this report is being prepared; |
| (b) | Designed such internal control over financial reporting, or caused such internal control over financial reporting to be designed under our supervision, to provide reasonable assurance regarding the reliability of financial reporting and the preparation of financial statements for external purposes in accordance with generally accepted accounting principles; |
| (c) | Evaluated the effectiveness of the registrant’s disclosure controls and procedures and presented in this report our conclusions about the effectiveness of the disclosure controls and procedures, as of the end of the period covered by this report based on such evaluation; and |
| (d) | Disclosed in this report any change in the registrant’s internal control over financial reporting that occurred during the registrant’s most recent fiscal quarter (the registrant’s fourth fiscal quarter in the case of an annual report) that has materially affected, or is reasonably likely to materially affect, the registrant’s internal control over financial reporting; and |
| 5. | The registrant’s other certifying officer and I have disclosed, based on our most recent evaluation of internal control over financial reporting, to the registrant’s auditors and the audit committee of the registrant’s board of directors (or persons performing the equivalent functions): |
| (a) | All significant deficiencies and material weaknesses in the design or operation of internal control over financial reporting which are reasonably likely to adversely affect the registrant’s ability to record, process, summarize and report financial information; and |
| (b) | Any fraud, whether or not material, that involves management or other employees who have a significant role in the registrant’s internal control over financial reporting. |
Date: August 19, 2015
| /s/ DAVID T. MITCHELL |
| David T. Mitchell |
| Chief Executive Officer and Chairman of the Board of Directors (Principal Executive Officer) |
Exhibit 31.2
CERTIFICATION
I, Toh-Seng Ng, certify that:
| 1. | I have reviewed this Annual Report on Form 10-K of Fabrinet; |
| 2. | Based on my knowledge, this report does not contain any untrue statement of a material fact or omit to state a material fact necessary to make the statements made, in light of the circumstances under which such statements were made, not misleading with respect to the period covered by this report; |
| 3. | Based on my knowledge, the financial statements, and other financial information included in this report, fairly present in all material respects the financial condition, results of operations and cash flows of the registrant as of, and for, the periods presented in this report; |
| 4. | The registrant’s other certifying officer and I are responsible for establishing and maintaining disclosure controls and procedures (as defined in Exchange Act Rules 13a-15(e) and 15d-15(e)) and internal control over financial reporting (as defined in Exchange Act Rules 13a-15(f) and 15d-15(f)) for the registrant and have: |
| (a) | Designed such disclosure controls and procedures or caused such disclosure controls and procedures to be designed under our supervision, to ensure that material information relating to the registrant, including its consolidated subsidiaries, is made known to us by others within those entities, particularly during the period in which this report is being prepared; |
| (b) | Designed such internal control over financial reporting, or caused such internal control over financial reporting to be designed under our supervision, to provide reasonable assurance regarding the reliability of financial reporting and the preparation of financial statements for external purposes in accordance with generally accepted accounting principles; |
| (c) | Evaluated the effectiveness of the registrant’s disclosure controls and procedures and presented in this report our conclusions about the effectiveness of the disclosure controls and procedures, as of the end of the period covered by this report based on such evaluation; and |
| (d) | Disclosed in this report any change in the registrant’s internal control over financial reporting that occurred during the registrant’s most recent fiscal quarter (the registrant’s fourth fiscal quarter in the case of an annual report) that has materially affected, or is reasonably likely to materially affect, the registrant’s internal control over financial reporting; and |
| 5. | The registrant’s other certifying officer and I have disclosed, based on our most recent evaluation of internal control over financial reporting, to the registrant’s auditors and the audit committee of the registrant’s board of directors (or persons performing the equivalent functions): |
| (a) | All significant deficiencies and material weaknesses in the design or operation of internal control over financial reporting which are reasonably likely to adversely affect the registrant’s ability to record, process, summarize and report financial information; and |
| (b) | Any fraud, whether or not material, that involves management or other employees who have a significant role in the registrant’s internal control over financial reporting. |
Date: August 19, 2015
| /s/ TOH-SENG NG |
| Toh-Seng Ng |
| Executive Vice President and Chief Financial Officer (Principal Financial and Accounting Officer) |
Exhibit 32.1
CERTIFICATIONS OF CHIEF EXECUTIVE OFFICER AND CHIEF FINANCIAL OFFICER
PURSUANT TO
18 U.S.C. SECTION 1350,
AS ADOPTED PURSUANT TO
SECTION 906 OF THE SARBANES-OXLEY ACT OF 2002
I, David T. Mitchell, certify, pursuant to 18 U.S.C. Section 1350, as adopted pursuant to Section 906 of the Sarbanes-Oxley Act of 2002, that the Annual Report on Form 10-K of Fabrinet for the fiscal year ended June 26, 2015 fully complies with the requirements of Section 13(a) or 15(d) of the Securities Exchange Act of 1934 and that information contained in this Annual Report on Form 10-K fairly presents in all material respects the financial condition and results of operations of Fabrinet.
| By: | /s/ DAVID T. MITCHELL | |||||
| Date: August 19, 2015 | Name: | David T. Mitchell | ||||
| Title: | Chief Executive Officer and Chairman of the Board of Directors (Principal Executive Officer) |
I, Toh-Seng Ng, certify, pursuant to 18 U.S.C. Section 1350, as adopted pursuant to Section 906 of the Sarbanes-Oxley Act of 2002, that the Annual Report on Form 10-K of Fabrinet for the fiscal year ended June 26, 2015 fully complies with the requirements of Section 13(a) or 15(d) of the Securities Exchange Act of 1934 and that information contained in this Annual Report on Form 10-K fairly presents in all material respects the financial condition and results of operations of Fabrinet.
| By: | /s/ TOH-SENG NG | |||||
| Date: August 19, 2015 | Name: | Toh-Seng Ng | ||||
| Title: | Executive Vice President and Chief Financial Officer (Principal Financial and Accounting Officer) |
Serious News for Serious Traders! Try StreetInsider.com Premium Free!
You May Also Be Interested In
- Fabrinet to Announce Third Quarter Fiscal Year 2024 Financial Results on May 6, 2024
- Novo Nordisk A/S – Total number of voting rights and share capital in Novo Nordisk A/S as of 26 April 2024
- Linde Increases Production Capacity and Reduces Emissions in Florida
Create E-mail Alert Related Categories
SEC FilingsSign up for StreetInsider Free!
Receive full access to all new and archived articles, unlimited portfolio tracking, e-mail alerts, custom newswires and RSS feeds - and more!
