Form 8-K CVR PARTNERS, LP For: Dec 01
UNITED STATES
SECURITIES AND EXCHANGE COMMISSION
WASHINGTON, D.C. 20549
___________________________________
FORM 8-K
CURRENT REPORT
Pursuant to Section 13 or 15(d) of the Securities Exchange Act of 1934
___________________________________
Date of Report (Date of earliest event reported): December 1, 2016
CVR PARTNERS, LP
(Exact name of registrant as specified in its charter)
Delaware (State or other jurisdiction of incorporation) | 001-35120 (Commission File Number) | 56-2677689 (I.R.S. Employer Identification Number) |
2277 Plaza Drive, Suite 500 Sugar Land, Texas 77479 (Address of principal executive offices, including zip code) | ||
Registrant’s telephone number, including area code: (281) 207-3200
Check the appropriate box below if the Form 8-K filing is intended to simultaneously satisfy the filing obligation of the registrant under any of the following provisions:
o Written communications pursuant to Rule 425 under the Securities Act (17 CFR 230.425)
o Soliciting material pursuant to Rule 14a-12 under the Exchange Act (17 CFR 240.14a-12)
o Pre-commencement communications pursuant to Rule 14d-2(b) under the Exchange Act (17 CFR 240.14d-2(b))
o Pre-commencement communications pursuant to Rule 13e-4(c) under the Exchange Act (17 CFR 240.13e-4(c))
Item 7.01. Regulation FD Disclosure.
On December 1, 2016, CVR Partners, LP, or the “Partnership,” posted an investor presentation to its website at www.cvrpartners.com under the tab “Investor Relations”. The information included in the presentation provides an overview of the Partnership’s strategy and performance and includes, among other things, information concerning the fertilizer market. The presentation is intended to be made available to unitholders, analysts and investors, including investor groups participating in forums such as sponsored investor conferences, during the fourth quarter of 2016. The presentation is furnished as Exhibit 99.1 to this Current Report on Form 8-K.
In accordance with General Instruction B.2 of Form 8-K, the information in this Current Report on Form 8-K and Exhibit 99.1 attached hereto are being furnished pursuant to Item 7.01 of Form 8-K and will not, except to the extent required by applicable law or regulation, be deemed filed by the Partnership for purposes of Section 18 of the Securities Exchange Act of 1934, as amended, or otherwise subject to the liabilities of that Section, nor will any of such information or exhibits be deemed incorporated by reference into any filing under the Securities Act of 1933, as amended, or the Securities Exchange Act of 1934, as amended, except as expressly set forth by specific reference in such filing.
Item 9.01. Financial Statements and Exhibits
(d) Exhibits
The following exhibit is being “furnished” as part of this Current Report on Form 8-K:
99.1 Slides from management presentation.
SIGNATURES
Pursuant to the requirements of the Securities Exchange Act of 1934, the registrant has duly caused this report to be signed on its behalf by the undersigned hereunto duly authorized.
Date: December 1, 2016
CVR Partners, LP | |
By: CVR GP, LLC, its general partner | |
By: | /s/ Susan M. Ball |
Susan M. Ball | |
Chief Financial Officer and Treasurer | |
Graphics file located here:
O:\IBD_Regional_Documents_Repository_AM_Groups\Pres
Tech Graphics\Custom templates\C49E\CVR Rentech
Note:
Cover slide is a jpg requested by the banker.
0
0
0
Dark 1
255
255
255
Light 1
102
162
188
Dark 2
123
113
160
Light 2
0
56
104
Accent 1
120
152
179
Accent 2
178
194
209
Accent 3
107
113
118
Accent 4
218
219
221
Accent 5
123
124
65
Accent 6
37
91
137
Hyperlink
102
136
164
Followed
Hyperlink
CVR Partners, LP
Investor Presentation
December 2016
0
0
0
Dark 1
255
255
255
Light 1
102
162
188
Dark 2
123
113
160
Light 2
0
56
104
Accent 1
120
152
179
Accent 2
178
194
209
Accent 3
107
113
118
Accent 4
218
219
221
Accent 5
123
124
65
Accent 6
37
91
137
Hyperlink
102
136
164
Followed
Hyperlink
1
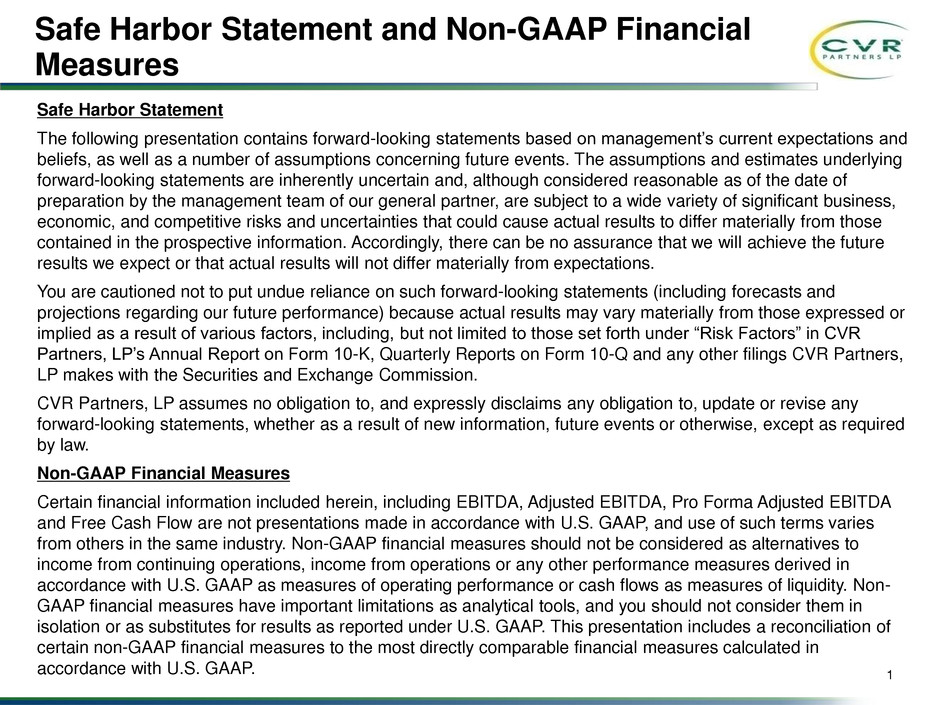
Safe Harbor Statement
The following presentation contains forward-looking statements based on management’s current expectations and
beliefs, as well as a number of assumptions concerning future events. The assumptions and estimates underlying
forward-looking statements are inherently uncertain and, although considered reasonable as of the date of
preparation by the management team of our general partner, are subject to a wide variety of significant business,
economic, and competitive risks and uncertainties that could cause actual results to differ materially from those
contained in the prospective information. Accordingly, there can be no assurance that we will achieve the future
results we expect or that actual results will not differ materially from expectations.
You are cautioned not to put undue reliance on such forward-looking statements (including forecasts and
projections regarding our future performance) because actual results may vary materially from those expressed or
implied as a result of various factors, including, but not limited to those set forth under “Risk Factors” in CVR
Partners, LP’s Annual Report on Form 10-K, Quarterly Reports on Form 10-Q and any other filings CVR Partners,
LP makes with the Securities and Exchange Commission.
CVR Partners, LP assumes no obligation to, and expressly disclaims any obligation to, update or revise any
forward-looking statements, whether as a result of new information, future events or otherwise, except as required
by law.
Non-GAAP Financial Measures
Certain financial information included herein, including EBITDA, Adjusted EBITDA, Pro Forma Adjusted EBITDA
and Free Cash Flow are not presentations made in accordance with U.S. GAAP, and use of such terms varies
from others in the same industry. Non-GAAP financial measures should not be considered as alternatives to
income from continuing operations, income from operations or any other performance measures derived in
accordance with U.S. GAAP as measures of operating performance or cash flows as measures of liquidity. Non-
GAAP financial measures have important limitations as analytical tools, and you should not consider them in
isolation or as substitutes for results as reported under U.S. GAAP. This presentation includes a reconciliation of
certain non-GAAP financial measures to the most directly comparable financial measures calculated in
accordance with U.S. GAAP.
Safe Harbor Statement and Non-GAAP Financial
Measures
0
0
0
Dark 1
255
255
255
Light 1
102
162
188
Dark 2
123
113
160
Light 2
0
56
104
Accent 1
120
152
179
Accent 2
178
194
209
Accent 3
107
113
118
Accent 4
218
219
221
Accent 5
123
124
65
Accent 6
37
91
137
Hyperlink
102
136
164
Followed
Hyperlink
2
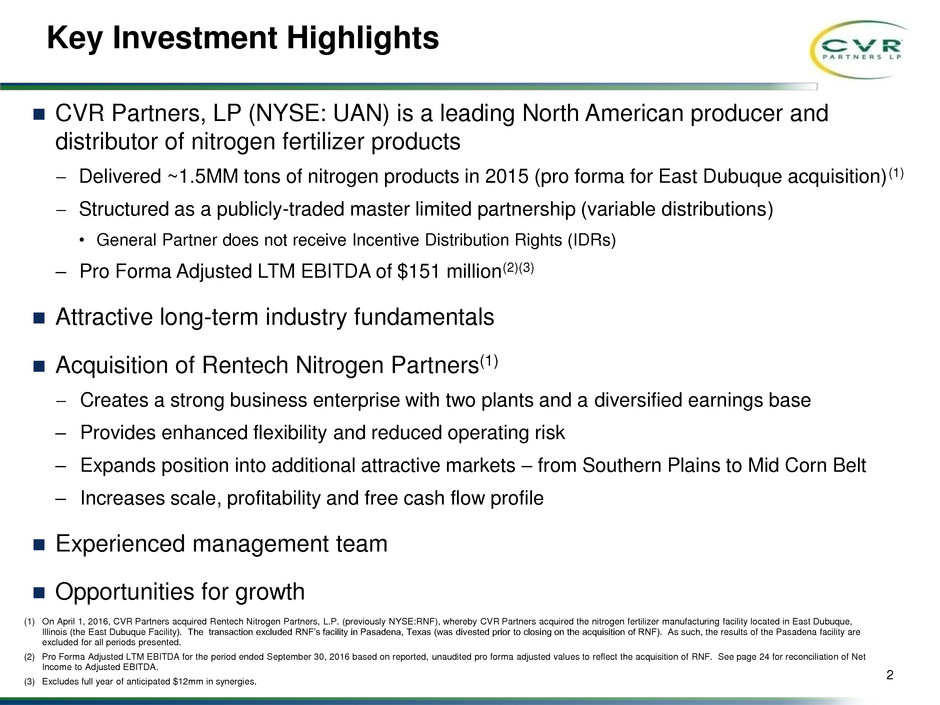
CVR Partners, LP (NYSE: UAN) is a leading North American producer and
distributor of nitrogen fertilizer products
− Delivered ~1.5MM tons of nitrogen products in 2015 (pro forma for East Dubuque acquisition)(1)
− Structured as a publicly-traded master limited partnership (variable distributions)
• General Partner does not receive Incentive Distribution Rights (IDRs)
‒ Pro Forma Adjusted LTM EBITDA of $151 million(2)(3)
Attractive long-term industry fundamentals
Acquisition of Rentech Nitrogen Partners(1)
− Creates a strong business enterprise with two plants and a diversified earnings base
‒ Provides enhanced flexibility and reduced operating risk
‒ Expands position into additional attractive markets – from Southern Plains to Mid Corn Belt
‒ Increases scale, profitability and free cash flow profile
Experienced management team
Opportunities for growth
Key Investment Highlights
(1) On April 1, 2016, CVR Partners acquired Rentech Nitrogen Partners, L.P. (previously NYSE:RNF), whereby CVR Partners acquired the nitrogen fertilizer manufacturing facility located in East Dubuque,
Illinois (the East Dubuque Facility). The transaction excluded RNF’s facility in Pasadena, Texas (was divested prior to closing on the acquisition of RNF). As such, the results of the Pasadena facility are
excluded for all periods presented.
(2) Pro Forma Adjusted LTM EBITDA for the period ended September 30, 2016 based on reported, unaudited pro forma adjusted values to reflect the acquisition of RNF. See page 24 for reconciliation of Net
Income to Adjusted EBITDA.
(3) Excludes full year of anticipated $12mm in synergies.
TBU for final structure
0
0
0
Dark 1
255
255
255
Light 1
102
162
188
Dark 2
123
113
160
Light 2
0
56
104
Accent 1
120
152
179
Accent 2
178
194
209
Accent 3
107
113
118
Accent 4
218
219
221
Accent 5
123
124
65
Accent 6
37
91
137
Hyperlink
102
136
164
Followed
Hyperlink
3
Solid Historical Fertilizer Demand Growth
0
2
4
6
8
0
50
100
150
200
Nitrogen Phosphate Potash Population (Mid-Year)
Billions of Metric Tonnes Population in Billions
Source: International Fertilizer Industry Association; U.S. Bureau of the Census (International Data Base) and USDA.
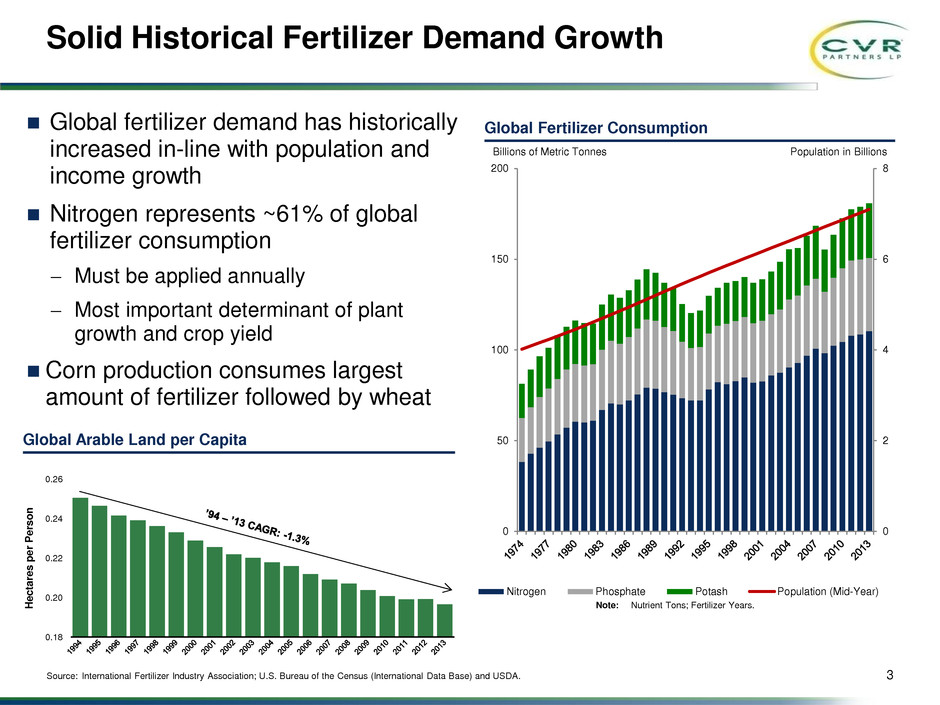
Global fertilizer demand has historically
increased in-line with population and
income growth
Nitrogen represents ~61% of global
fertilizer consumption
− Must be applied annually
− Most important determinant of plant
growth and crop yield
Corn production consumes largest
amount of fertilizer followed by wheat
Global Fertilizer Consumption
Note: Nutrient Tons; Fertilizer Years.
Global Arable Land per Capita
0.18
0.20
0.22
0.24
0.26
H
e
c
ta
re
s
pe
r
P
e
rs
o
n
0
0
0
Dark 1
255
255
255
Light 1
102
162
188
Dark 2
123
113
160
Light 2
0
56
104
Accent 1
120
152
179
Accent 2
178
194
209
Accent 3
107
113
118
Accent 4
218
219
221
Accent 5
123
124
65
Accent 6
37
91
137
Hyperlink
102
136
164
Followed
Hyperlink
4
Solid Base of Corn Demand in the U.S.
Source: USDA Economic Research Service and USDA WASDE.
(1) Based on most recent five year average.
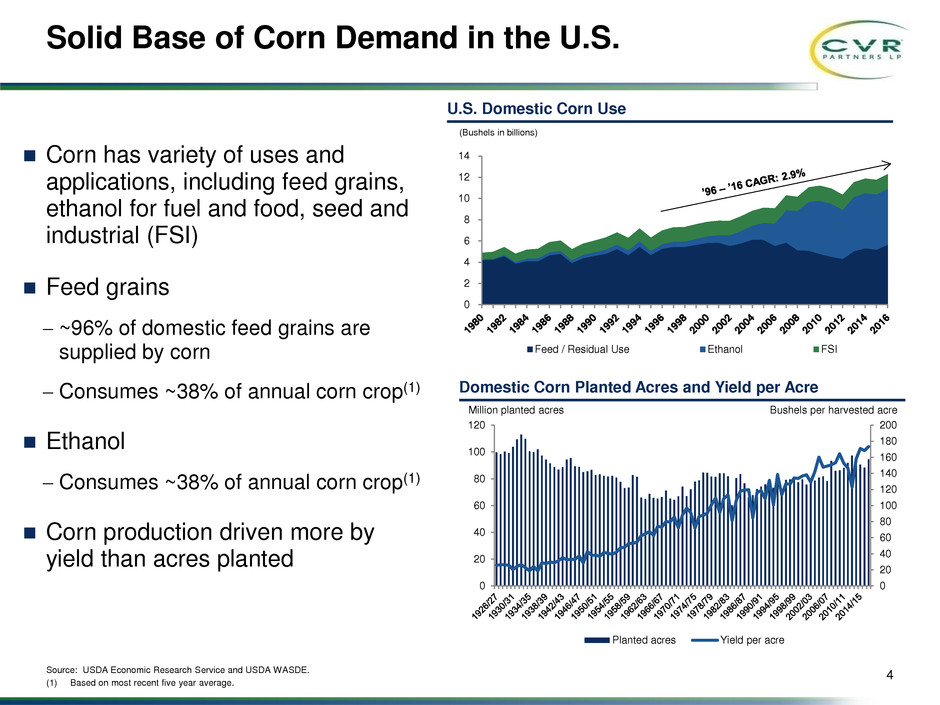
Corn has variety of uses and
applications, including feed grains,
ethanol for fuel and food, seed and
industrial (FSI)
Feed grains
− ~96% of domestic feed grains are
supplied by corn
− Consumes ~38% of annual corn crop(1)
Ethanol
− Consumes ~38% of annual corn crop(1)
Corn production driven more by
yield than acres planted
Domestic Corn Planted Acres and Yield per Acre
0
20
40
60
80
100
120
140
160
180
200
0
20
40
60
80
100
120
Planted acres Yield per acre
Million planted acres Bushels per harvested acre
U.S. Domestic Corn Use
0
2
4
6
8
10
12
14
Feed / Residual Use Ethanol FSI
(Bushels in billions)
0
0
0
Dark 1
255
255
255
Light 1
102
162
188
Dark 2
123
113
160
Light 2
0
56
104
Accent 1
120
152
179
Accent 2
178
194
209
Accent 3
107
113
118
Accent 4
218
219
221
Accent 5
123
124
65
Accent 6
37
91
137
Hyperlink
102
136
164
Followed
Hyperlink
80
90
100
110
120
130
M
il
li
o
n
T
onne
s
5
Nitrogen Demand Will Continue to Grow
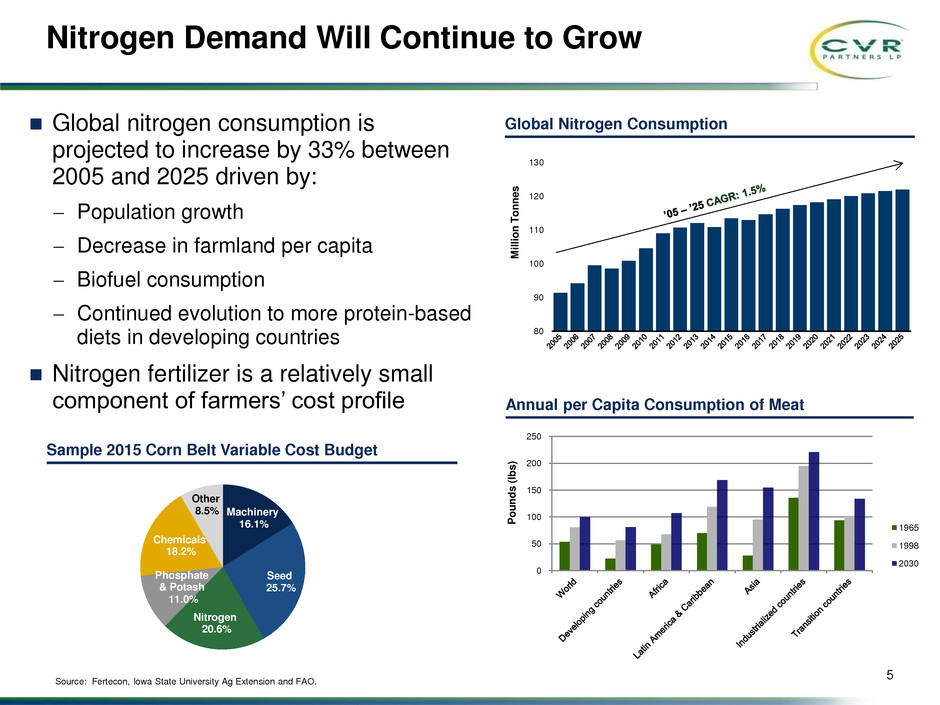
Global nitrogen consumption is
projected to increase by 33% between
2005 and 2025 driven by:
− Population growth
− Decrease in farmland per capita
− Biofuel consumption
− Continued evolution to more protein-based
diets in developing countries
Nitrogen fertilizer is a relatively small
component of farmers’ cost profile
Global Nitrogen Consumption
Source: Fertecon, Iowa State University Ag Extension and FAO.
Annual per Capita Consumption of Meat
P
oun
d
s
(
lbs
)
0
50
100
150
200
250
1965
1998
2030
Sample 2015 Corn Belt Variable Cost Budget
Machinery
16.1%
Seed
25.7%
Nitrogen
20.6%
Phosphate
& Potash
11.0%
Chemicals
18.2%
Other
8.5%
0
0
0
Dark 1
255
255
255
Light 1
102
162
188
Dark 2
123
113
160
Light 2
0
56
104
Accent 1
120
152
179
Accent 2
178
194
209
Accent 3
107
113
118
Accent 4
218
219
221
Accent 5
123
124
65
Accent 6
37
91
137
Hyperlink
102
136
164
Followed
Hyperlink
6
New U.S. Nitrogen Production Displacing Imports
-4,000
-2,000
0
2,000
4,000
6,000
8,000
10,000
12,000
14,000
16,000
18,000
20,000
22,000
Production Imports Exports Consumption
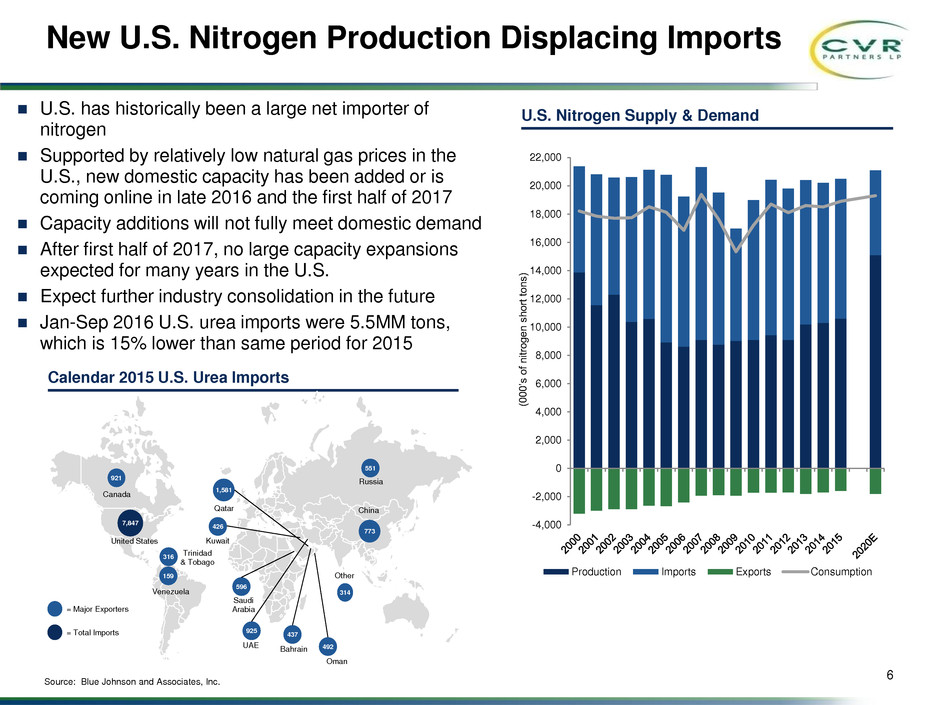
U.S. has historically been a large net importer of
nitrogen
Supported by relatively low natural gas prices in the
U.S., new domestic capacity has been added or is
coming online in late 2016 and the first half of 2017
Capacity additions will not fully meet domestic demand
After first half of 2017, no large capacity expansions
expected for many years in the U.S.
Expect further industry consolidation in the future
Jan-Sep 2016 U.S. urea imports were 5.5MM tons,
which is 15% lower than same period for 2015
U.S. Nitrogen Supply & Demand
(0
0
0
’s
o
f
n
it
ro
g
e
n
s
h
o
rt
t
o
n
s
)
Calendar 2015 U.S. Urea Imports
921
7,847
316
159
Canada
United States
Trinidad
& Tobago
Venezuela
551
Russia
773
China
596
492
437
925
UAE
Bahrain
Oman
Saudi
Arabia
1,581
Qatar
426
Kuwait
= Major Exporters
= Total Imports
Source: Blue Johnson and Associates, Inc.
314
Other
0
0
0
Dark 1
255
255
255
Light 1
102
162
188
Dark 2
123
113
160
Light 2
0
56
104
Accent 1
120
152
179
Accent 2
178
194
209
Accent 3
107
113
118
Accent 4
218
219
221
Accent 5
123
124
65
Accent 6
37
91
137
Hyperlink
102
136
164
Followed
Hyperlink
Summer
Recent Nitrogen Fertilizer Market Conditions
Fall 2015 – Present
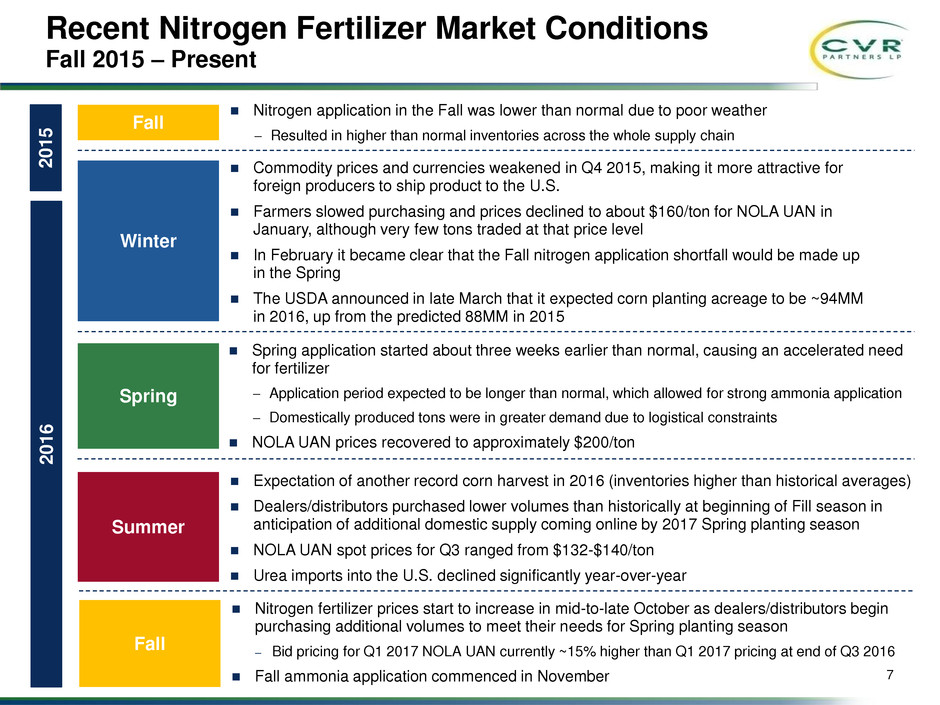
Expectation of another record corn harvest in 2016 (inventories higher than historical averages)
Dealers/distributors purchased lower volumes than historically at beginning of Fill season in
anticipation of additional domestic supply coming online by 2017 Spring planting season
NOLA UAN spot prices for Q3 ranged from $132-$140/ton
Urea imports into the U.S. declined significantly year-over-year
Nitrogen application in the Fall was lower than normal due to poor weather
− Resulted in higher than normal inventories across the whole supply chain
Commodity prices and currencies weakened in Q4 2015, making it more attractive for
foreign producers to ship product to the U.S.
Farmers slowed purchasing and prices declined to about $160/ton for NOLA UAN in
January, although very few tons traded at that price level
In February it became clear that the Fall nitrogen application shortfall would be made up
in the Spring
The USDA announced in late March that it expected corn planting acreage to be ~94MM
in 2016, up from the predicted 88MM in 2015
Spring application started about three weeks earlier than normal, causing an accelerated need
for fertilizer
− Application period expected to be longer than normal, which allowed for strong ammonia application
− Domestically produced tons were in greater demand due to logistical constraints
NOLA UAN prices recovered to approximately $200/ton
2
0
1
6
Fall
Winter
Spring
2
0
1
5
7
Nitrogen fertilizer prices start to increase in mid-to-late October as dealers/distributors begin
purchasing additional volumes to meet their needs for Spring planting season
– Bid pricing for Q1 2017 NOLA UAN currently ~15% higher than Q1 2017 pricing at end of Q3 2016
Fall ammonia application commenced in November
Fall
0
0
0
Dark 1
255
255
255
Light 1
102
162
188
Dark 2
123
113
160
Light 2
0
56
104
Accent 1
120
152
179
Accent 2
178
194
209
Accent 3
107
113
118
Accent 4
218
219
221
Accent 5
123
124
65
Accent 6
37
91
137
Hyperlink
102
136
164
Followed
Hyperlink
8
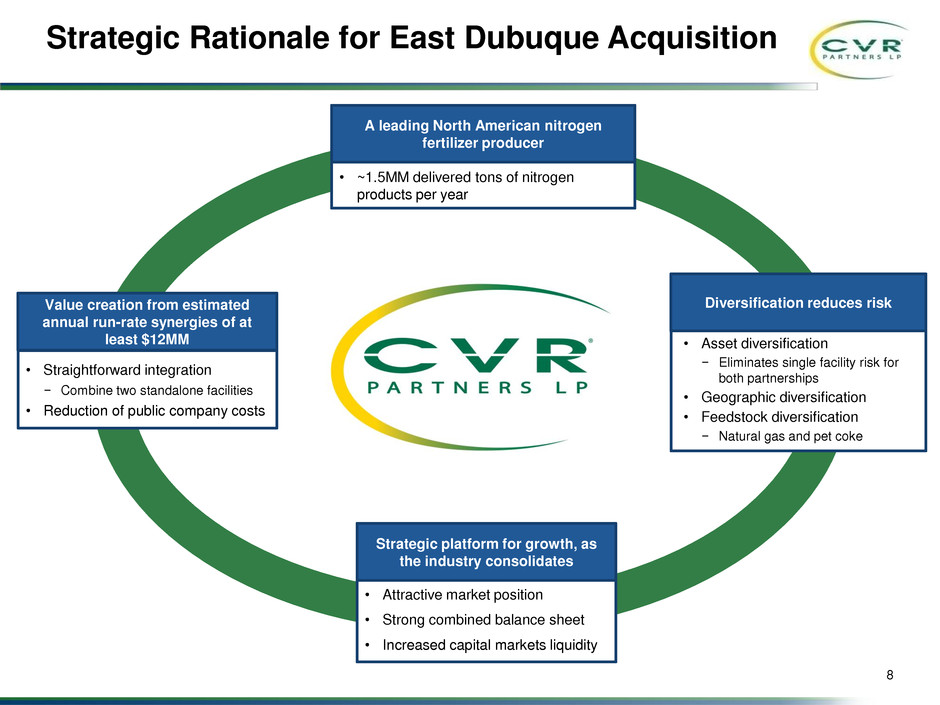
Strategic Rationale for East Dubuque Acquisition
A leading North American nitrogen
fertilizer producer
• ~1.5MM delivered tons of nitrogen
products per year
Diversification reduces risk
• Asset diversification
− Eliminates single facility risk for
both partnerships
• Geographic diversification
• Feedstock diversification
− Natural gas and pet coke
Value creation from estimated
annual run-rate synergies of at
least $12MM
• Straightforward integration
− Combine two standalone facilities
• Reduction of public company costs
Strategic platform for growth, as
the industry consolidates
• Attractive market position
• Strong combined balance sheet
• Increased capital markets liquidity
0
0
0
Dark 1
255
255
255
Light 1
102
162
188
Dark 2
123
113
160
Light 2
0
56
104
Accent 1
120
152
179
Accent 2
178
194
209
Accent 3
107
113
118
Accent 4
218
219
221
Accent 5
123
124
65
Accent 6
37
91
137
Hyperlink
102
136
164
Followed
Hyperlink
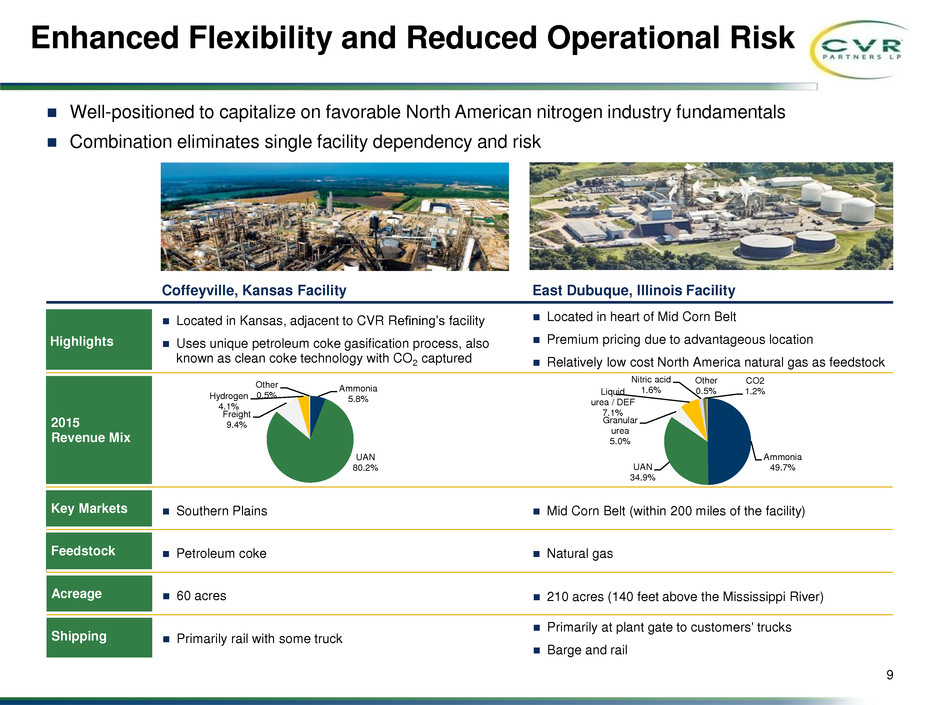
Well-positioned to capitalize on favorable North American nitrogen industry fundamentals
Combination eliminates single facility dependency and risk
9
Enhanced Flexibility and Reduced Operational Risk
Highlights
Located in Kansas, adjacent to CVR Refining’s facility
Uses unique petroleum coke gasification process, also
known as clean coke technology with CO2 captured
Located in heart of Mid Corn Belt
Premium pricing due to advantageous location
Relatively low cost North America natural gas as feedstock
2015
Revenue Mix
Key Markets Southern Plains Mid Corn Belt (within 200 miles of the facility)
Feedstock Petroleum coke Natural gas
Coffeyville, Kansas Facility East Dubuque, Illinois Facility
Acreage 60 acres 210 acres (140 feet above the Mississippi River)
Shipping Primarily rail with some truck
Primarily at plant gate to customers' trucks
Barge and rail
Ammonia
5.8%
UAN
80.2%
Freight
9.4%
Hydrogen
4.1%
Other
0.5%
Ammonia
49.7% UAN
34.9%
Granular
urea
5.0%
Liquid
urea / DEF
7.1%
Nitric acid
1.6%
CO2
1.2%
Other
0.5%

0
0
0
Dark 1
255
255
255
Light 1
102
162
188
Dark 2
123
113
160
Light 2
0
56
104
Accent 1
120
152
179
Accent 2
178
194
209
Accent 3
107
113
118
Accent 4
218
219
221
Accent 5
123
124
65
Accent 6
37
91
137
Hyperlink
102
136
164
Followed
Hyperlink
East Dubuque Facility Market Area
Company-Owned Nitrogen Fertilizer Facilities
Company-Partnered Nitrogen Fertilizer Facility
Coffeyville Facility, Kansas
Strategic location in the Southern Plains
Located on Union Pacific mainline
Transportation cost advantage to Southern Plains vs. U.S. Gulf Coast
East Dubuque Facility, Illinois
Entire market within a 200-mile radius
In the center of the Mid Corn Belt – the largest nitrogen market and top
corn producing region
Transportation cost savings compared to product shipped into region
Combined
Storage at facilities allow for better timing of product pick-up / application
by customers versus competitors located outside of the region
Region relies on imports from other parts of the U.S. to meet demand
Strong market for ammonia and UAN
10
Attractive Market Position
Attractive Location for Nitrogen Fertilizer Plants
Large geographic footprint
serving the Southern
Plains and Mid Corn Belt
markets
Product prices higher due
to advantaged cost of
freight
Competitive advantage
due to storage capabilities
at the facilities and offsite
locations
Mid-2016 addition of
marketing agreement with
Pryor, OK, for the facility’s
UAN production
Coffeyville, KS
Pryor, OK
East Dubuque, IL
0
0
0
Dark 1
255
255
255
Light 1
102
162
188
Dark 2
123
113
160
Light 2
0
56
104
Accent 1
120
152
179
Accent 2
178
194
209
Accent 3
107
113
118
Accent 4
218
219
221
Accent 5
123
124
65
Accent 6
37
91
137
Hyperlink
102
136
164
Followed
Hyperlink
11
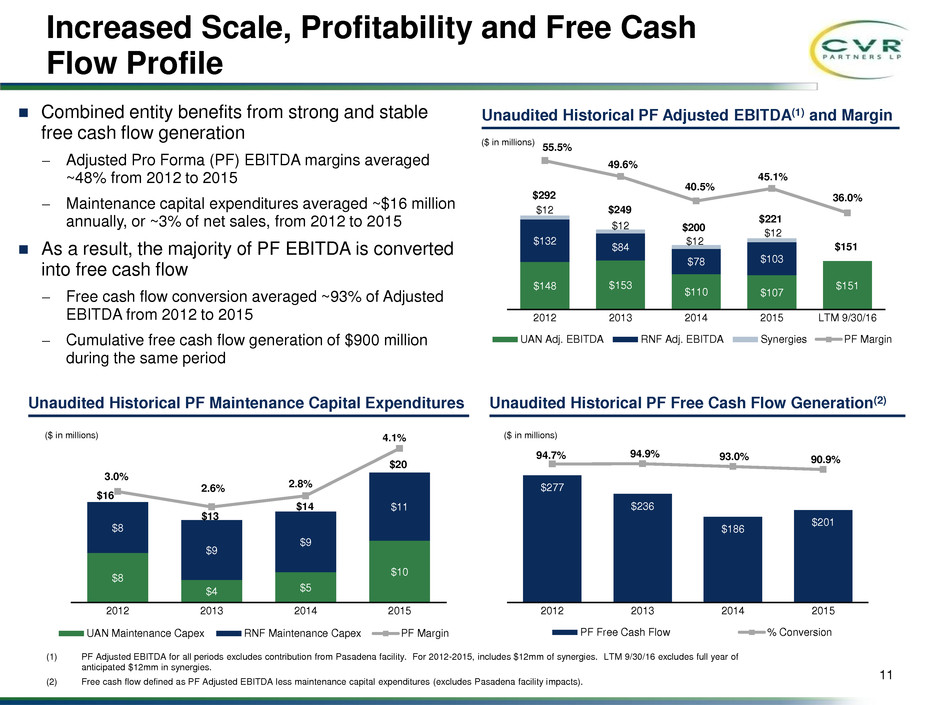
Combined entity benefits from strong and stable
free cash flow generation
− Adjusted Pro Forma (PF) EBITDA margins averaged
~48% from 2012 to 2015
− Maintenance capital expenditures averaged ~$16 million
annually, or ~3% of net sales, from 2012 to 2015
As a result, the majority of PF EBITDA is converted
into free cash flow
− Free cash flow conversion averaged ~93% of Adjusted
EBITDA from 2012 to 2015
− Cumulative free cash flow generation of $900 million
during the same period
Unaudited Historical PF Adjusted EBITDA(1) and Margin
Unaudited Historical PF Free Cash Flow Generation(2)
$148 $153
$110 $107
$151
$132
$84
$78 $103
$12
$12
$12
$12
55.5%
49.6%
40.5%
45.1%
36.0%
0.0%
10.0%
20.0%
30.0%
40.0%
50.0%
60.0%
$0
$100
$200
$300
$400
$500
2012 2013 2014 2015 LTM 9/30/16
UAN Adj. EBITDA RNF Adj. EBITDA Synergies PF Margin
($ in millions)
$292
$249
$200
$221
$277
$236
$186
$201
94.7% 94.9% 93.0% 90.9%
0.0%
25.0%
50.0%
75.0%
100.0%
$0
$50
$100
$150
$200
$250
$300
$350
2012 2013 2014 2015
PF Free Cash Flow % Conversion
($ in millions)
Unaudited Historical PF Maintenance Capital Expenditures
$8
$4 $5
$10
$8
$9
$9
$11
3.0%
2.6% 2.8%
4.1%
0.0%
1.0%
2.0%
3.0%
4.0%
$0
2012 2013 2014 2015
UAN Maintenance Capex RNF Maintenance Capex PF Margin
($ in millions)
$16
$13
$14
$20
(1) PF Adjusted EBITDA for all periods excludes contribution from Pasadena facility. For 2012-2015, includes $12mm of synergies. LTM 9/30/16 excludes full year of
anticipated $12mm in synergies.
(2) Free cash flow defined as PF Adjusted EBITDA less maintenance capital expenditures (excludes Pasadena facility impacts).
Increased Scale, Profitability and Free Cash
Flow Profile
$151
0
0
0
Dark 1
255
255
255
Light 1
102
162
188
Dark 2
123
113
160
Light 2
0
56
104
Accent 1
120
152
179
Accent 2
178
194
209
Accent 3
107
113
118
Accent 4
218
219
221
Accent 5
123
124
65
Accent 6
37
91
137
Hyperlink
102
136
164
Followed
Hyperlink
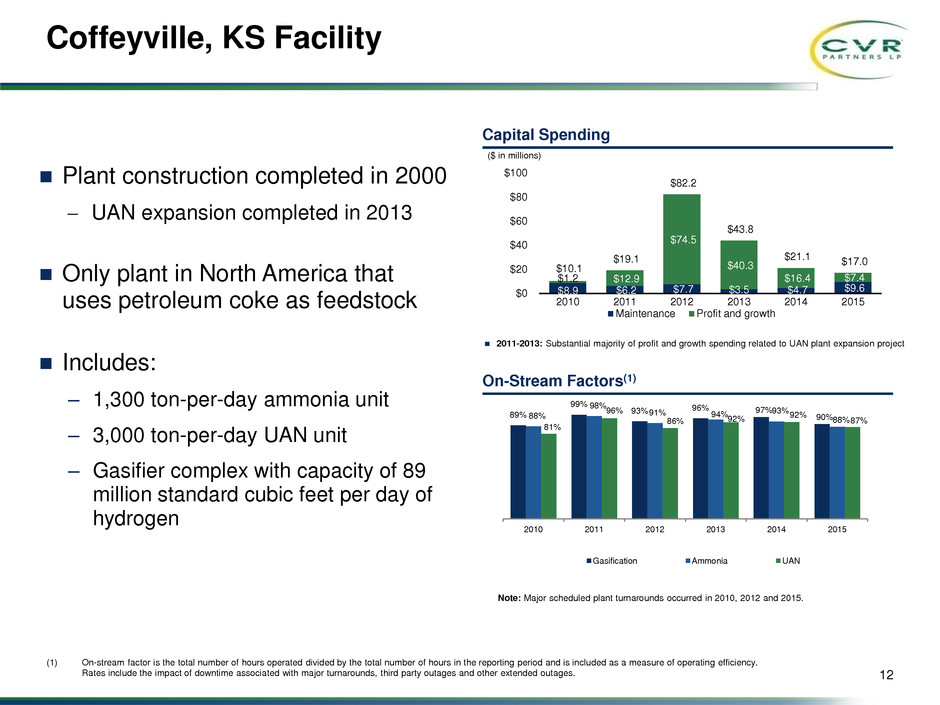
Plant construction completed in 2000
− UAN expansion completed in 2013
Only plant in North America that
uses petroleum coke as feedstock
Includes:
‒ 1,300 ton-per-day ammonia unit
‒ 3,000 ton-per-day UAN unit
‒ Gasifier complex with capacity of 89
million standard cubic feet per day of
hydrogen
12
Coffeyville, KS Facility
Capital Spending
On-Stream Factors(1)
89%
99%
93% 96% 97%
90%88%
98%
91% 94% 93%
88%
81%
96%
86% 92%
92%
87%
2010 2011 2012 2013 2014 2015
Gasification Ammonia UAN
(1) On-stream factor is the total number of hours operated divided by the total number of hours in the reporting period and is included as a measure of operating efficiency.
Rates include the impact of downtime associated with major turnarounds, third party outages and other extended outages.
$8.9 $6.2 $7.7 $3.5 $4.7 $9.6
$1.2 $12.9
$74.5
$40.3
$16.4 $7.4
$10.1
$19.1
$82.2
$43.8
$21.1 $17.0
$0
$20
$40
$60
$80
$100
2010 2011 2012 2013 2014 2015
Maintenance Profit and growth
($ in millions)
2011-2013: Substantial majority of profit and growth spending related to UAN plant expansion project
Note: Major scheduled plant turnarounds occurred in 2010, 2012 and 2015.
0
0
0
Dark 1
255
255
255
Light 1
102
162
188
Dark 2
123
113
160
Light 2
0
56
104
Accent 1
120
152
179
Accent 2
178
194
209
Accent 3
107
113
118
Accent 4
218
219
221
Accent 5
123
124
65
Accent 6
37
91
137
Hyperlink
102
136
164
Followed
Hyperlink
92% 92%
95%
84%
96%
97%
93% 93%
95%
84%
95%
98%
2010 2011 2012 2013 2014 2015
Ammonia
UAN
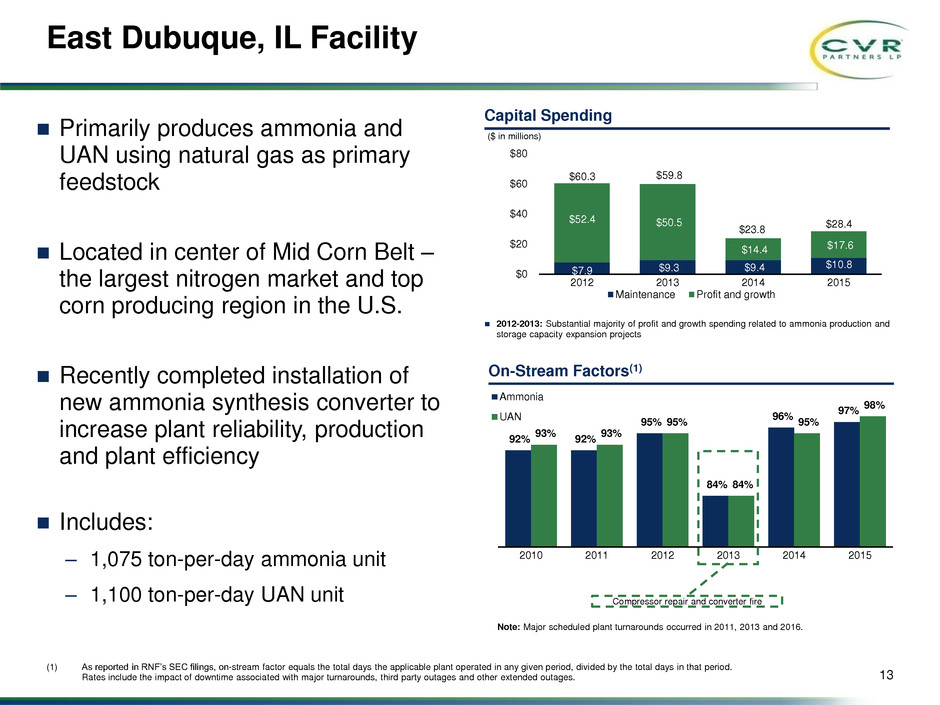
Primarily produces ammonia and
UAN using natural gas as primary
feedstock
Located in center of Mid Corn Belt –
the largest nitrogen market and top
corn producing region in the U.S.
Recently completed installation of
new ammonia synthesis converter to
increase plant reliability, production
and plant efficiency
Includes:
‒ 1,075 ton-per-day ammonia unit
‒ 1,100 ton-per-day UAN unit
13
East Dubuque, IL Facility
Capital Spending
On-Stream Factors(1)
(1) As reported in RNF’s SEC filings, on-stream factor equals the total days the applicable plant operated in any given period, divided by the total days in that period.
Rates include the impact of downtime associated with major turnarounds, third party outages and other extended outages.
Compressor repair and converter fire
$7.9 $9.3 $9.4
$10.8
$52.4 $50.5
$14.4 $17.6
$60.3 $59.8
$23.8
$28.4
$0
$20
$40
$60
$80
2012 2013 2014 2015
Maintenance Profit and growth
($ in millions)
2012-2013: Substantial majority of profit and growth spending related to ammonia production and
storage capacity expansion projects
Note: Major scheduled plant turnarounds occurred in 2011, 2013 and 2016.
0
0
0
Dark 1
255
255
255
Light 1
102
162
188
Dark 2
123
113
160
Light 2
0
56
104
Accent 1
120
152
179
Accent 2
178
194
209
Accent 3
107
113
118
Accent 4
218
219
221
Accent 5
123
124
65
Accent 6
37
91
137
Hyperlink
102
136
164
Followed
Hyperlink
14
Experienced Management Team
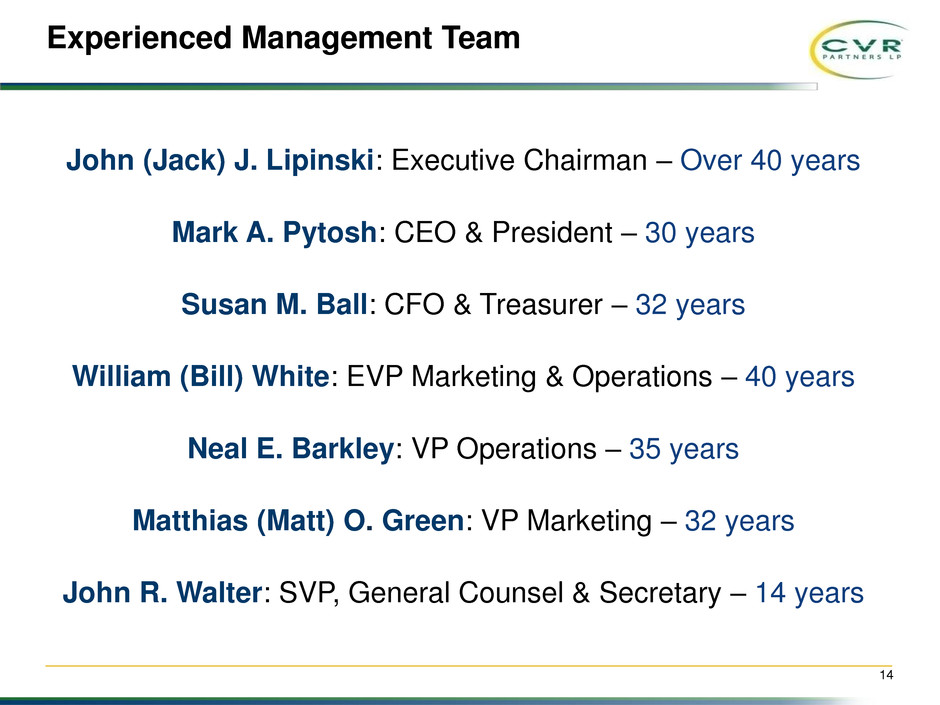
John (Jack) J. Lipinski: Executive Chairman – Over 40 years
Mark A. Pytosh: CEO & President – 30 years
Susan M. Ball: CFO & Treasurer – 32 years
William (Bill) White: EVP Marketing & Operations – 40 years
Neal E. Barkley: VP Operations – 35 years
Matthias (Matt) O. Green: VP Marketing – 32 years
John R. Walter: SVP, General Counsel & Secretary – 14 years

0
0
0
Dark 1
255
255
255
Light 1
102
162
188
Dark 2
123
113
160
Light 2
0
56
104
Accent 1
120
152
179
Accent 2
178
194
209
Accent 3
107
113
118
Accent 4
218
219
221
Accent 5
123
124
65
Accent 6
37
91
137
Hyperlink
102
136
164
Followed
Hyperlink
15
Solid Financial Profile
Cash and Cash Equivalents 65.3$
Working Capital 78.2$
Total Assets 1,326.9$
Total Debt 649.2$ (1)
Total Partners' Capital 639.5$
Net Sales 417.9$
EBITDA 145.6$ (2)(3)
Adjusted EBITDA 150.5$ (2)(3)
Net Income 11.8$ (2)
EPU - Diluted 0.10$ (2)
Weighted Average Diluted Units Outstanding 113.3
Total Debt to Pro Forma Adjus ed EBITDA 4.3 x
Net Debt to Pro Forma Adjusted EBITDA 3.9 x (4)
Total Debt to Capital 50%
Net Debt to Capital 45% (4)
Unaudited Selected Credit M trics
Unaudited Selected Balance Sheet Data
As of September 30, 2016
(in millions)
Unaudited Pro Forma Selected Income Statement Data
For the Twelve Months Ended September 30, 2016
(in millions, except per unit data)
(1) Gross debt not net of unamortized debt issuance costs or unamortized discount.
(2) Excludes full year of anticipated $12mm in synergies.
(3) See page 24 for reconciliation of Net Income to EBITDA and Adjusted EBITDA.
(4) Net Debt defined as Total Debt less Cash and Cash Equivalents.

0
0
0
Dark 1
255
255
255
Light 1
102
162
188
Dark 2
123
113
160
Light 2
0
56
104
Accent 1
120
152
179
Accent 2
178
194
209
Accent 3
107
113
118
Accent 4
218
219
221
Accent 5
123
124
65
Accent 6
37
91
137
Hyperlink
102
136
164
Followed
Hyperlink
16
CVR Partners’ 2016 Q3 and YTD Results
Three Months Ended
September 30,
Nine Months Ended
September 30,
2016 2015 2016 2015
UAN Product Price Per Ton at Gate(1) $154 $227 $187 $256
Ammonia Product Price Per Ton at Gate(1) $345 $478 $385 $529
Net Sales $78.5 $49.3 $271.4 $223.2
Net Income (Loss) ($13.4) ($13.5) ($12.4) $43.3
EBITDA(2) $18.8 ($4.3) $61.7 $69.7
Adjusted EBITDA(2) $17.4 $3.8 $74.4 $78.3
Available Cash for Distribution(2) $0.4 ($3.0) $50.8 $58.0
Distribution Declared Per Unit(3) $0.00 $0.00 $0.44 $0.84
Common Units Outstanding(3) 113.3 73.1 113.3 73.1
In millions, except product price at gate per ton and per unit data
Note: The results of our East Dubuque Facility are included for the post acquisition period beginning April 1, 2016.
(1) Product pricing at g te represents net sales less fr ight rev nue divided by product sales volumes in tons and is shown in order to provide
a pricing measure that is comparabl across the fertilizer industry.
(2) See pa e 25 for reconciliation of Net In ome (Loss) to EBITDA, Adjusted EBITDA and Available Cash for Distribution.
(3) 2016 Q3 and YTD 2016 distribution declared per unit is based on post-merger 113.3MM common unts utstanding.
0
0
0
Dark 1
255
255
255
Light 1
102
162
188
Dark 2
123
113
160
Light 2
0
56
104
Accent 1
120
152
179
Accent 2
178
194
209
Accent 3
107
113
118
Accent 4
218
219
221
Accent 5
123
124
65
Accent 6
37
91
137
Hyperlink
102
136
164
Followed
Hyperlink
17
Key Investment Highlights
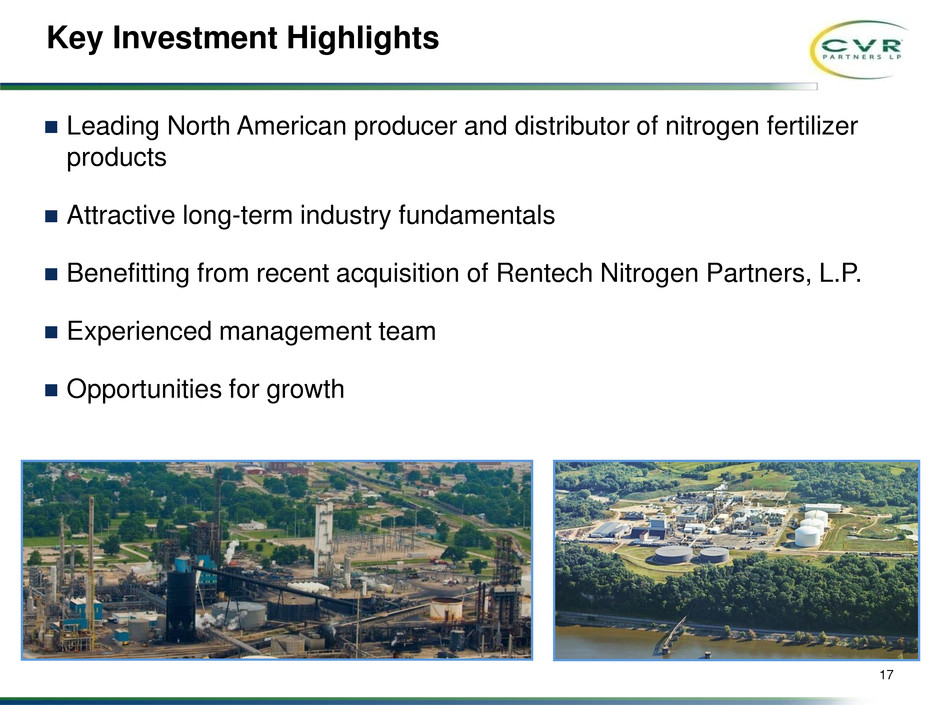
Leading North American producer and distributor of nitrogen fertilizer
products
Attractive long-term industry fundamentals
Benefitting from recent acquisition of Rentech Nitrogen Partners, L.P.
Experienced management team
Opportunities for growth
0
0
0
Dark 1
255
255
255
Light 1
102
162
188
Dark 2
123
113
160
Light 2
0
56
104
Accent 1
120
152
179
Accent 2
178
194
209
Accent 3
107
113
118
Accent 4
218
219
221
Accent 5
123
124
65
Accent 6
37
91
137
Hyperlink
102
136
164
Followed
Hyperlink
Appendix
0
0
0
Dark 1
255
255
255
Light 1
102
162
188
Dark 2
123
113
160
Light 2
0
56
104
Accent 1
120
152
179
Accent 2
178
194
209
Accent 3
107
113
118
Accent 4
218
219
221
Accent 5
123
124
65
Accent 6
37
91
137
Hyperlink
102
136
164
Followed
Hyperlink
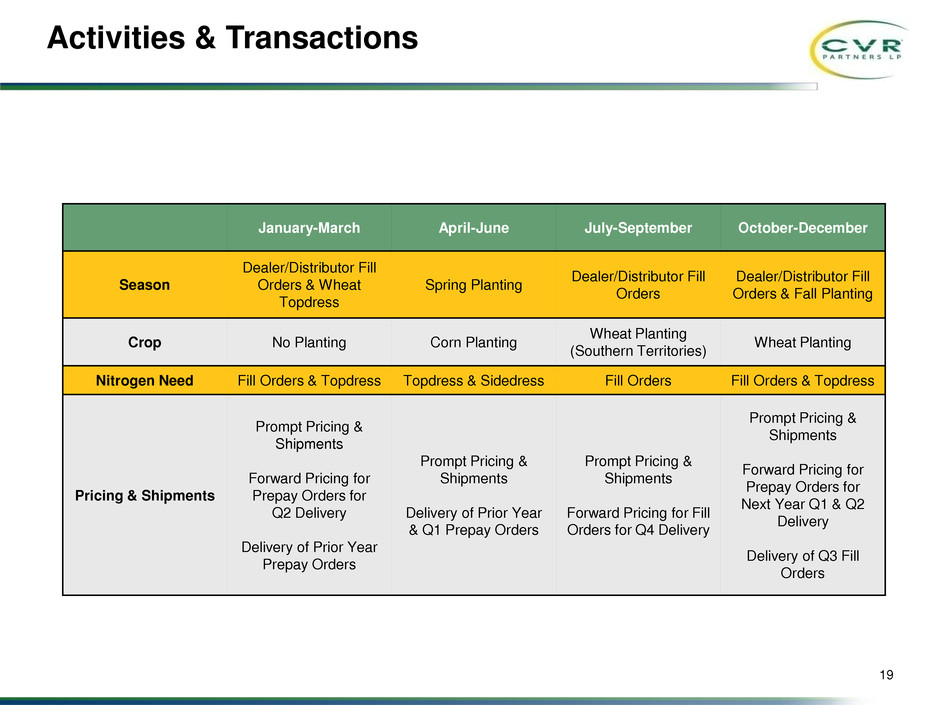
19
Activities & Transactions
January-March April-June July-September October-December
Season
Dealer/Distributor Fill
Orders & Wheat
Topdress
Spring Planting
Dealer/Distributor Fill
Orders
Dealer/Distributor Fill
Orders & Fall Planting
Crop No Planting Corn Planting
Wheat Planting
(Southern Territories)
Wheat Planting
Nitrogen Need Fill Orders & Topdress Topdress & Sidedress Fill Orders Fill Orders & Topdress
Pricing & Shipments
Prompt Pricing &
Shipments
Forward Pricing for
Prepay Orders for
Q2 Delivery
Delivery of Prior Year
Prepay Orders
Prompt Pricing &
Shipments
Delivery of Prior Year
& Q1 Prepay Orders
Prompt Pricing &
Shipments
Forward Pricing for Fill
Orders for Q4 Delivery
Prompt Pricing &
Shipments
Forward Pricing for
Prepay Orders for
Next Year Q1 & Q2
Delivery
Delivery of Q3 Fill
Orders
0
0
0
Dark 1
255
255
255
Light 1
102
162
188
Dark 2
123
113
160
Light 2
0
56
104
Accent 1
120
152
179
Accent 2
178
194
209
Accent 3
107
113
118
Accent 4
218
219
221
Accent 5
123
124
65
Accent 6
37
91
137
Hyperlink
102
136
164
Followed
Hyperlink
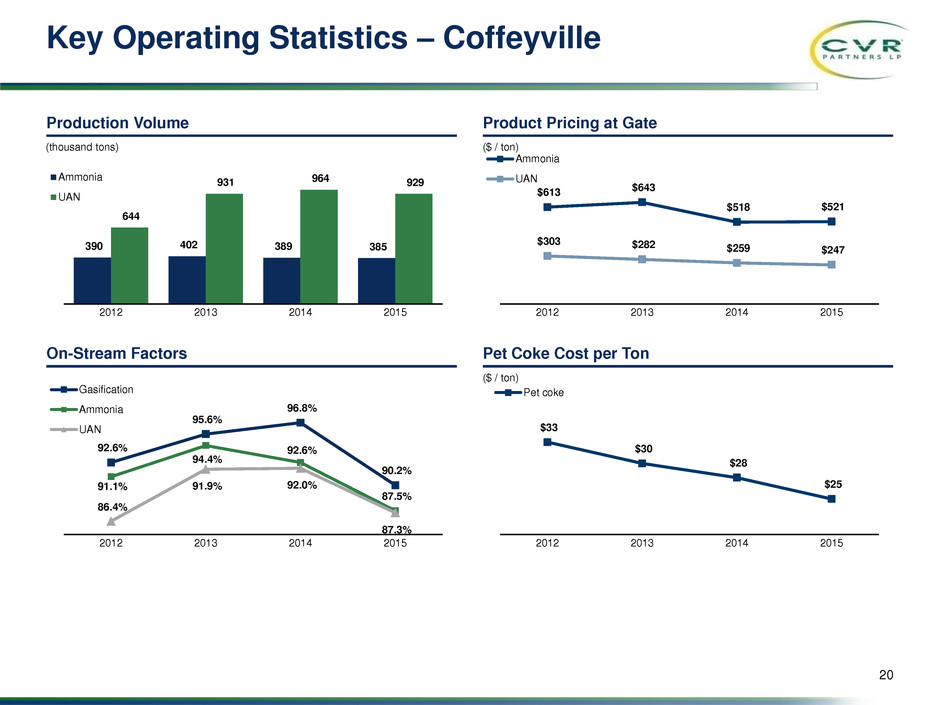
$33
$30
$28
$25
2012 2013 2014 2015
Pet coke
92.6%
95.6%
96.8%
90.2%
91.1%
94.4%
92.6%
87.5%
86.4%
91.9% 92.0%
87.3%
2012 2013 2014 2015
Gasification
Ammonia
UAN
$613 $643
$518 $521
$303 $282 $259 $247
2012 2013 2014 2015
Ammonia
UAN
20
On-Stream Factors Pet Coke Cost per Ton
Product Pricing at Gate Production Volume
Key Operating Statistics – Coffeyville
390 402 389 385
644
931 964 929
2012 2013 2014 2015
Ammonia
UAN
(thousand tons) ($ / ton)
($ / ton)
0
0
0
Dark 1
255
255
255
Light 1
102
162
188
Dark 2
123
113
160
Light 2
0
56
104
Accent 1
120
152
179
Accent 2
178
194
209
Accent 3
107
113
118
Accent 4
218
219
221
Accent 5
123
124
65
Accent 6
37
91
137
Hyperlink
102
136
164
Followed
Hyperlink
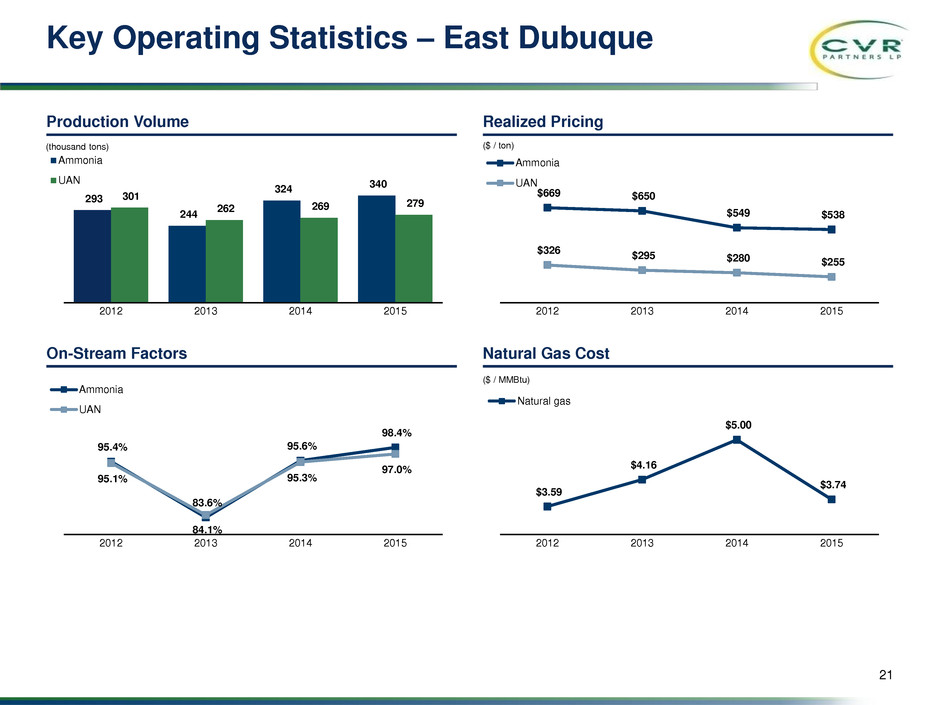
$3.59
$4.16
$5.00
$3.74
2012 2013 2014 2015
Natural gas
$669 $650
$549 $538
$326
$295 $280 $255
2012 2013 2014 2015
Ammonia
UAN
21
On-Stream Factors Natural Gas Cost
Realized Pricing Production Volume
Key Operating Statistics – East Dubuque
293
244
324 340
301
262 269
279
2012 2013 2014 2015
Ammonia
UAN
(thousand tons) ($ / ton)
($ / MMBtu)
95.4%
83.6%
95.6%
98.4%
95.1%
84.1%
95.3%
97.0%
2012 2013 2014 2015
Ammonia
UAN
0
0
0
Dark 1
255
255
255
Light 1
102
162
188
Dark 2
123
113
160
Light 2
0
56
104
Accent 1
120
152
179
Accent 2
178
194
209
Accent 3
107
113
118
Accent 4
218
219
221
Accent 5
123
124
65
Accent 6
37
91
137
Hyperlink
102
136
164
Followed
Hyperlink
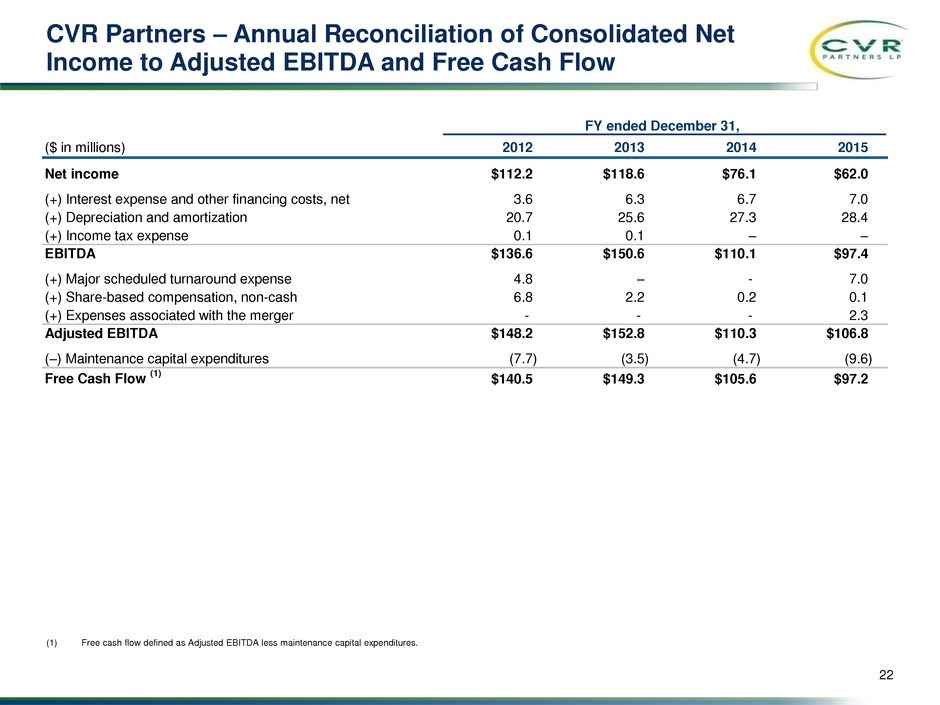
22
CVR Partners – Annual Reconciliation of Consolidated Net
Income to Adjusted EBITDA and Free Cash Flow
(1) Free cash flow defined as Adjusted EBITDA less maintenance capital expenditures.
FY ended December 31,
($ in millions) 2012 2013 2014 2015
Net income $112.2 $118.6 $76.1 $62.0
(+) Interest expense and other financing costs, net 3.6 6.3 6.7 7.0
(+) Depreciation and amortization 20.7 25.6 27.3 28.4
(+) Income tax expense 0.1 0.1 – –
EBITDA $136.6 $150.6 $110.1 $97.4
(+) Major scheduled turnaround expense 4.8 – - 7.0
(+) Share-based compensation, non-cash 6.8 2.2 0.2 0.1
(+) Expenses associated with the merger - - - 2.3
Adjusted EBITDA $148.2 $152.8 $110.3 $106.8
(–) Maintenance capital expenditures (7.7) (3.5) (4.7) (9.6)
Free Cash Flow
(1)
$140.5 $149.3 $105.6 $97.2
0
0
0
Dark 1
255
255
255
Light 1
102
162
188
Dark 2
123
113
160
Light 2
0
56
104
Accent 1
120
152
179
Accent 2
178
194
209
Accent 3
107
113
118
Accent 4
218
219
221
Accent 5
123
124
65
Accent 6
37
91
137
Hyperlink
102
136
164
Followed
Hyperlink
23
Rentech Nitrogen Partners(1) – Annual Reconciliation of
Consolidated Net Income to Adjusted EBITDA and Free Cash Flow
(1) On April 1, 2016, CVR Partners acquired Rentech Nitrogen Partners, L.P. (previously NYSE:RNF), whereby CVR Partners acquired the nitrogen fertilizer manufacturing facility located in East
Dubuque, Illinois (the East Dubuque Facility). The transaction excluded RNF’s facility in Pasadena, Texas (was divested prior to closing on the acquisition of RNF). As such, the results of the
Pasadena facility are excluded for all periods presented.
(2) Free cash flow defined as Adjusted EBITDA less maintenance capital expenditures.
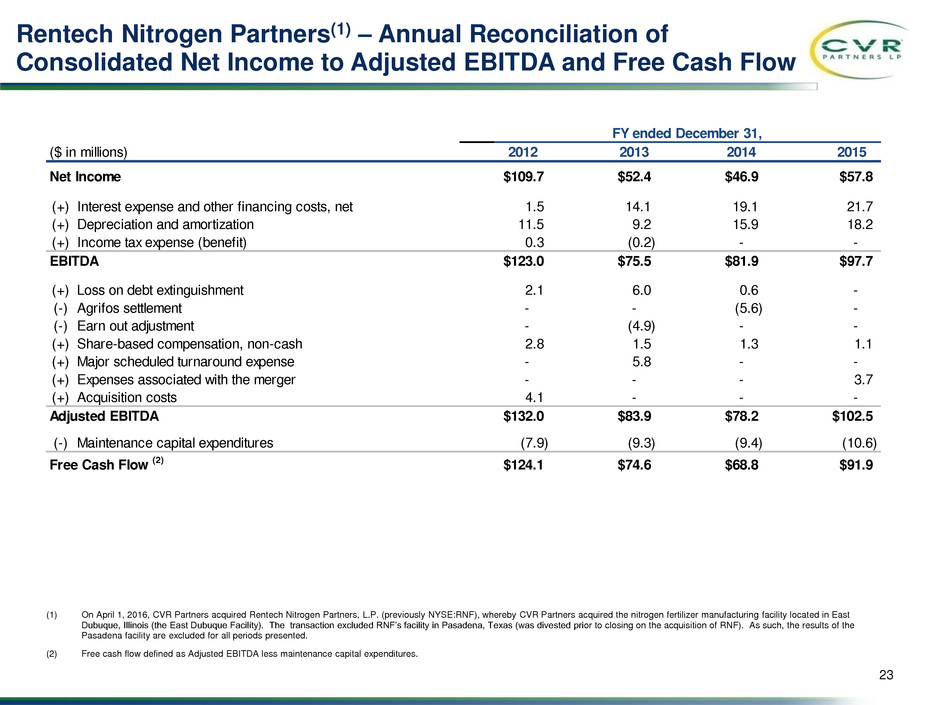
($ in millions) 2012 2013 2014 2015
Net Income 109.7$ 52.4$ 46.9$ $57.8
(+) Interest expense and other financing costs, net 1.5 14.1 19.1 21.7
(+) Depreciation and amortization 11.5 9.2 15.9 18.2
(+) Income tax expense (benefit) 0.3 (0.2) - -
EBITDA 123.0$ 75.5$ 81.9$ $97.7
(+) Loss on debt extinguishment 2.1 6.0 0.6 -
(-) Agrifos settlement - - (5.6) -
(-) Earn out adjustment - (4.9) - -
(+) Sh re-based compensation, non-cash 2.8 1.5 1.3 1.1
(+) Major scheduled turnaround expense - 5.8 - -
(+) Expenses associated with the merger - - - 3.7
(+) Acquisition costs 4.1 - - -
Adjusted EBITDA 132.0$ 83.9$ 78.2$ $102.5
(-) Maintenance capital expenditures (7.9) (9.3) (9.4) (10.6)
Free Cash Flow (2) 124.1$ 74.6$ 68.8$ $91.9
FY ended December 31,
0
0
0
Dark 1
255
255
255
Light 1
102
162
188
Dark 2
123
113
160
Light 2
0
56
104
Accent 1
120
152
179
Accent 2
178
194
209
Accent 3
107
113
118
Accent 4
218
219
221
Accent 5
123
124
65
Accent 6
37
91
137
Hyperlink
102
136
164
Followed
Hyperlink
24
Unaudited Pro Forma LTM 9/30/16(1) – Quarterly Reconciliation
of Consolidated Net Income (Loss) to Adjusted EBITDA
(1) The summary unaudited pro forma financial information for the LTM period assumes CVR Partners owned the East Dubuque Facility for all periods presented and also assumes the $645M
principal balance of the 2023 senior secured notes was outstanding for all periods presented. Pro forma net income (loss) has also been adjusted to exclude $13.0 million of nonrecurring expenses
related to the fair value adjustment to acquisition-date inventory and deferred revenue. Pro forma net income includes incremental depreciation resulting from increased fair value of the property,
plant and equipment as noted in the previously filed preliminary purchase price allocation. The summary pro forma financial information is for informational purposes only and does not purport to
represent what the Partnership's consolidated results of operations actually would have been if the East Dubuque Merger had occurred at any date, and such data does not purport to project the
Partnership's results of operations for any future period.
(2) Excludes full year of anticipated $12mm in synergies.
$ in millions
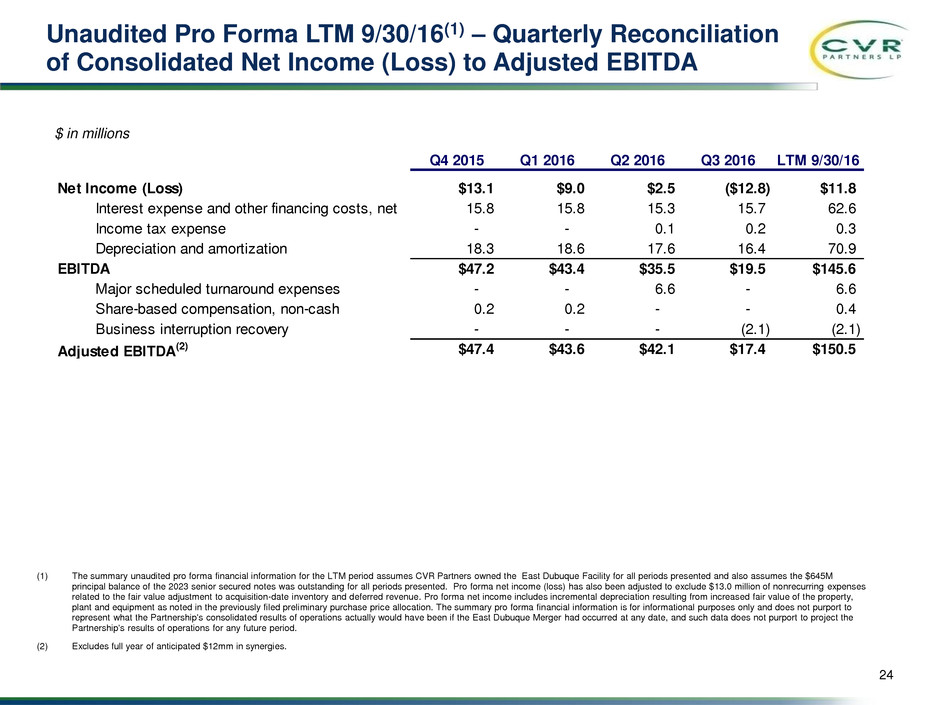
Q4 2015 Q1 2016 Q2 2016 Q3 2016 LTM 9/30/16
Net Income (Loss) $13.1 $9.0 $2.5 ($12.8) $11.8
Interest expense and other financing costs, net 15.8 15.8 15.3 15.7 62.6
Income tax expense - - 0.1 0.2 0.3
Depreciation and amortization 18.3 18.6 17.6 16.4 70.9
EBITDA $47.2 $43.4 $35.5 $19.5 $145.6
Major scheduled turnaround expenses - - 6.6 - 6.6
Share-based compensation, on-cash 0.2 0.2 - - 0.4
Business interruption recovery - - - (2.1) (2.1)
Adjusted EBITDA(2) $47.4 $43.6 $42.1 $17.4 $150.5
0
0
0
Dark 1
255
255
255
Light 1
102
162
188
Dark 2
123
113
160
Light 2
0
56
104
Accent 1
120
152
179
Accent 2
178
194
209
Accent 3
107
113
118
Accent 4
218
219
221
Accent 5
123
124
65
Accent 6
37
91
137
Hyperlink
102
136
164
Followed
Hyperlink
25
CVR Partners – Unaudited 2016 Q3/YTD Reconciliation of Net Income
(Loss) to EBITDA, Adjusted EBITDA and Cash Available for Distribution
$ in millions
Note: The results of our East Dubuque Facility are included for the post acquisition period beginning April 1, 2016.
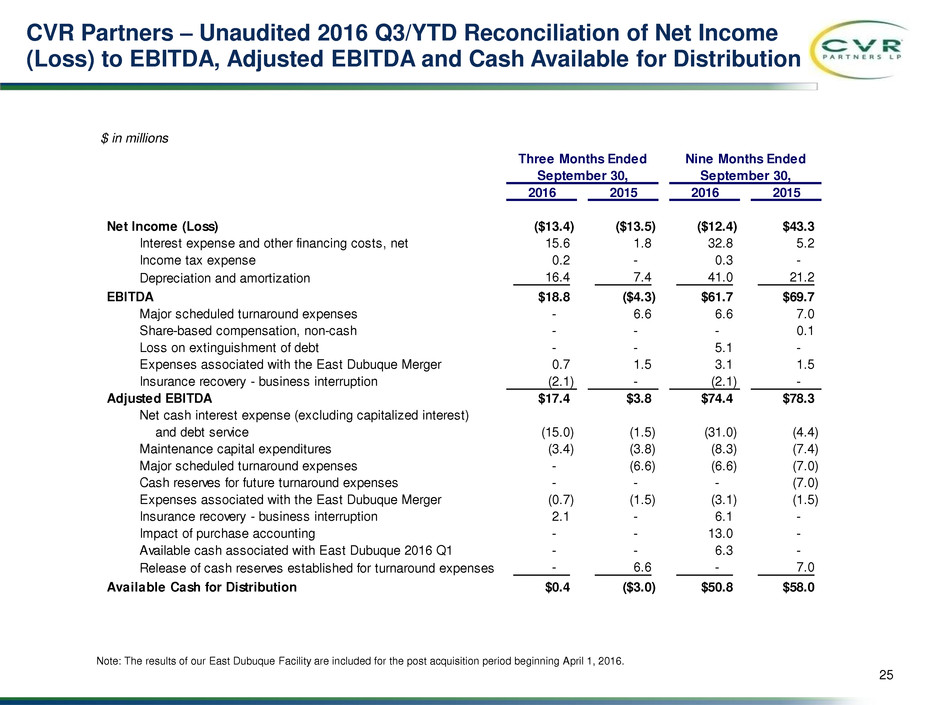
Three Months Ended Nine Months Ended
September 30, September 30,
2016 2015 2016 2015
Net Income (Loss) ($13.4) ($13.5) ($12.4) $43.3
Interest expense and other financing costs, net 15.6 1.8 32.8 5.2
Income tax expense 0.2 - 0.3 -
Depreciation and amortization 16.4 7.4 41.0 21.2
EBITDA $18.8 ($4.3) $61.7 $69.7
Major scheduled turnaround expenses - 6.6 6.6 7.0
Share-based compensation, non-cash - - - 0.1
Loss on extinguishment of debt - - 5.1 -
Expenses associated with the East Dubuque Merger 0.7 1.5 3.1 1.5
Insurance recovery - business interruption (2.1) - (2.1) -
Adjusted EBITDA $17.4 $3.8 $74.4 $78.3
Net cash interest expense (excluding capitalized interest)
and debt service (15.0) (1.5) (31.0) (4.4)
Maintenance capital expenditures (3.4) (3.8) (8.3) (7.4)
Major scheduled turnaround expenses - (6.6) (6.6) (7.0)
Cash reserves for future turnaround expenses - - - (7.0)
Expenses associated with the East Dubuque Merger (0.7) (1.5) (3.1) (1.5)
Insurance recovery - business interruption 2.1 - 6.1 -
Impact of purchase accounting - - 13.0 -
Available cash associated with East Dubuque 2016 Q1 - - 6.3 -
Release of cash reserves established for turnaround expenses - 6.6 - 7.0
Available Cash for Distribution $0.4 ($3.0) $50.8 $58.0
Serious News for Serious Traders! Try StreetInsider.com Premium Free!
You May Also Be Interested In
- ROSEN, LEADING INVESTOR COUNSEL, Encourages Equinix, Inc. Investors to Inquire About Securities Class Action Investigation – EQIX
- ADTRAN Holdings, Inc. to Meet with Investors at the German Spring Conference 2024 – Equity Forum on May 13-15, 2023
- 8PG Heats Up for DABBECUE Following Successful Inaugural Event
Create E-mail Alert Related Categories
SEC FilingsSign up for StreetInsider Free!
Receive full access to all new and archived articles, unlimited portfolio tracking, e-mail alerts, custom newswires and RSS feeds - and more!


 Tweet
Tweet Share
Share