

Form 10-Q Poshmark, Inc. For: Mar 31
 Tweet
Tweet Share
Share
UNITED STATES
SECURITIES AND EXCHANGE COMMISSION
WASHINGTON, DC 20549
FORM
(Mark One)
QUARTERLY REPORT PURSUANT TO SECTION 13 OR 15(d) OF THE SECURITIES EXCHANGE ACT OF 1934 |
For the quarterly period ended
OR
TRANSITION REPORT PURSUANT TO SECTION 13 OR 15(d) OF THE SECURITIES EXCHANGE ACT OF 1934 |
For the transition period from ______ to ______
Commission File Number:
(Exact Name of Registrant as Specified in its Charter)
( State or other jurisdiction of incorporation or organization) |
(I.R.S. Employer Identification No.) |
(Address of principal executive offices) |
(Zip Code) |
Registrant’s telephone number, including area code: (
Securities registered pursuant to Section 12(b) of the Act:
Title of each class |
|
Trading Symbol(s) |
|
Name of each exchange on which registered |
|
|
Indicate by check mark whether the registrant (1) has filed all reports required to be filed by Section 13 or 15(d) of the Securities Exchange Act of 1934 during the preceding 12 months (or for such shorter period that the registrant was required to file such reports), and (2) has been subject to such filing requirements for the past 90 days.
Indicate by check mark whether the registrant has submitted electronically every Interactive Data File required to be submitted pursuant to Rule 405 of Regulation S-T (§232.405 of this chapter) during the preceding 12 months (or for such shorter period that the registrant was required to submit such files).
Indicate by check mark whether the registrant is a large accelerated filer, an accelerated filer, a non-accelerated filer, smaller reporting company, or an emerging growth company. See the definitions of “large accelerated filer,” “accelerated filer,” “smaller reporting company,” and “emerging growth company” in Rule 12b-2 of the Exchange Act.
Large accelerated filer |
|
☐ |
|
Accelerated filer |
|
☐ |
|
|
|
|
|||
|
☒ |
|
Smaller reporting company |
|
||
|
|
|
|
|
|
|
Emerging growth company |
|
|
|
|
|
|
If an emerging growth company, indicate by check mark if the registrant has elected not to use the extended transition period for complying with any new or revised financial accounting standards provided pursuant to Section 13(a) of the Exchange Act.
Indicate by check mark whether the registrant is a shell company (as defined in Rule 12b-2 of the Exchange Act). Yes
As of May 2, 2022, the number of outstanding shares of the registrant’s Class A common stock, par value $0.0001 per share, was
Poshmark, Inc.
Table of Contents
|
|
Page |
|
3 |
|
PART I. |
|
|
Item 1. |
4 |
|
|
4 |
|
|
5 |
|
|
Condensed Consolidated Statements of Comprehensive Loss (unaudited) |
6 |
|
7 |
|
|
8 |
|
|
Notes to Condensed Consolidated Financial Statements (unaudited) |
9 |
Item 2. |
Management’s Discussion and Analysis of Financial Condition and Results of Operations |
24 |
Item 3. |
34 |
|
Item 4. |
35 |
|
PART II. |
|
|
Item 1. |
36 |
|
Item 1A. |
36 |
|
Item 2. |
36 |
|
Item 3. |
37 |
|
Item 4. |
37 |
|
Item 5. |
37 |
|
Item 6. |
38 |
|
39 |
||
2
NOTE REGARDING FORWARD-LOOKING STATEMENTS
This Quarterly Report on Form 10-Q contains forward-looking statements within the meaning of the federal securities laws, which are statements that involve substantial risks and uncertainties. Forward-looking statements generally relate to future events or our future financial or operating performance. In some cases, you can identify forward-looking statements because they contain words such as “may,” “will,” “shall,” “should,” “expects,” “plans,” “anticipates,” “could,” “intends,” “target,” “projects,” “contemplates,” “believes,” “estimates,” “predicts,” “potential,” or “continue” or the negative of these words or other similar terms or expressions that concern our expectations, strategy, plans, or intentions. Forward-looking statements contained in this Quarterly Report on Form 10-Q include, but are not limited to, statements about:
You should not rely upon forward-looking statements as predictions of future events. We have based the forward-looking statements contained in this Quarterly Report on Form 10-Q primarily on our current expectations and projections about future events and trends that we believe may affect our business, financial condition, results of operations, and prospects. The outcome of the events described in these forward-looking statements is subject to risks, uncertainties, and other factors described in the section titled “Risk Factors” and elsewhere in this Quarterly Report on Form 10-Q, as well as in our other filings with the Securities and Exchange Commission (SEC). Moreover, we operate in a very competitive and rapidly changing environment. New risks and uncertainties emerge from time to time, and it is not possible for us to predict all risks and uncertainties that could have an impact on the forward-looking statements contained in this Quarterly Report on Form 10-Q. The results, events, and circumstances reflected in the forward-looking statements may not be achieved or occur, and actual results, events, or circumstances could differ materially from those described in the forward-looking statements.
The forward-looking statements made in this Quarterly Report on Form 10-Q relate only to events as of the date on which the statements are made. We undertake no obligation to update any forward-looking statements made in this Quarterly Report on Form 10-Q to reflect events or circumstances after the date of this Quarterly Report on Form 10-Q or to reflect new information or the occurrence of unanticipated events, except as required by law. We may not actually achieve the plans, intentions, or expectations disclosed in our forward-looking statements, and you should not place undue reliance on our forward-looking statements. Our forward-looking statements do not reflect the potential impact of any future acquisitions, mergers, dispositions, joint ventures, or investments we may make.
In addition, statements that “we believe” and similar statements reflect our beliefs and opinions on the relevant subject. These statements are based upon information available to us as of the date of this Quarterly Report on Form 10-Q, and while we believe such information forms a reasonable basis for such statements, such information may be limited or incomplete, and our statements should not be read to indicate that we have conducted an exhaustive inquiry into, or review of, all potentially available relevant information. These statements are inherently uncertain and you are cautioned not to unduly rely upon these statements.
3
PART I—FINANCIAL INFORMATION
Item 1. Financial Statements.
Poshmark, Inc.
Condensed Consolidated Balance Sheets
(in thousands, except shares data)
(unaudited)
|
|
March 31, |
|
|
December 31, |
|
||
|
|
2022 |
|
|
2021 |
|
||
Assets |
|
|
|
|
|
|
||
Current assets |
|
|
|
|
|
|
||
Cash and cash equivalents |
|
$ |
|
|
$ |
|
||
Prepaid expenses and other current assets |
|
|
|
|
|
|
||
Total current assets |
|
|
|
|
|
|
||
Property and equipment, net |
|
|
|
|
|
|
||
Operating lease right-of-use assets |
|
|
|
|
|
|
||
Intangible assets, net |
|
|
|
|
|
|
||
Goodwill |
|
|
|
|
|
|
||
Other assets |
|
|
|
|
|
|
||
Total assets |
|
$ |
|
|
$ |
|
||
Liabilities and Stockholders’ Equity |
|
|
|
|
|
|
||
Current liabilities |
|
|
|
|
|
|
||
Accounts payable |
|
$ |
|
|
$ |
|
||
Funds payable to customers |
|
|
|
|
|
|
||
Operating lease liabilities, current |
|
|
|
|
|
|
||
Accrued expenses and other current liabilities |
|
|
|
|
|
|
||
Total current liabilities |
|
|
|
|
|
|
||
Operating lease liabilities, non-current |
|
|
|
|
|
|
||
Long-term portion of deferred rent and other liabilities |
|
|
|
|
|
|
||
Total liabilities |
|
|
|
|
|
|
||
|
|
|
|
|
|
|||
Stockholders’ equity |
|
|
|
|
|
|
||
Preferred Stock, $ |
|
|
|
|
|
|
||
Class A and Class B common stock, $ |
|
|
|
|
|
|
||
Additional paid-in capital |
|
|
|
|
|
|
||
Treasury stock, at cost ( |
|
|
( |
) |
|
|
( |
) |
Accumulated deficit |
|
|
( |
) |
|
|
( |
) |
Accumulated other comprehensive income |
|
|
|
|
|
|
||
Total stockholders’ equity |
|
|
|
|
|
|
||
Total liabilities and stockholders’ equity |
|
$ |
|
|
$ |
|
||
The accompanying notes are an integral part of the condensed consolidated financial statements.
4
Poshmark, Inc.
Condensed Consolidated Statements of Operations
(in thousands, except per share amounts)
(unaudited)
|
|
Three Months Ended March 31, |
|
|||||
|
|
2022 |
|
|
2021 |
|
||
Net revenue |
|
$ |
|
|
$ |
|
||
Costs and expenses: |
|
|
|
|
|
|
||
Cost of net revenue, exclusive of depreciation and amortization |
|
|
|
|
|
|
||
Operations and support |
|
|
|
|
|
|
||
Research and development |
|
|
|
|
|
|
||
Marketing |
|
|
|
|
|
|
||
General and administrative |
|
|
|
|
|
|
||
Depreciation and amortization |
|
|
|
|
|
|
||
Total costs and expenses |
|
|
|
|
|
|
||
Loss from operations |
|
|
( |
) |
|
|
( |
) |
Interest income |
|
|
|
|
|
|
||
Other income (expense), net |
|
|
|
|
|
|
||
Change in fair value of redeemable convertible preferred stock |
|
|
|
|
|
( |
) |
|
Change in fair value of the convertible notes |
|
|
|
|
|
( |
) |
|
Loss on extinguishment of the convertible notes |
|
|
|
|
|
( |
) |
|
Change in fair value of contingent consideration |
|
|
|
|
|
|
||
Other, net |
|
|
|
|
|
( |
) |
|
|
|
|
|
|
|
( |
) |
|
Loss before provision for income taxes |
|
|
( |
) |
|
|
( |
) |
Provision for income taxes |
|
|
|
|
|
|
||
Net loss |
|
$ |
( |
) |
|
$ |
( |
) |
Net loss per share attributable to common stockholders, |
|
$ |
( |
) |
|
$ |
( |
) |
Weighted-average shares used to compute net loss per share |
|
|
|
|
|
|
||
The accompanying notes are an integral part of the condensed consolidated financial statements.
5
Poshmark, Inc.
Condensed Consolidated Statements of Comprehensive Loss
(in thousands)
(unaudited)
|
|
Three Months Ended March 31, |
|
|||||
|
|
2022 |
|
|
2021 |
|
||
Net loss |
|
$ |
( |
) |
|
$ |
( |
) |
Other comprehensive (loss) income: |
|
|
|
|
|
|
||
Reclassification upon extinguishment of the fair value of the |
|
|
|
|
|
|
||
Change in foreign currency translation adjustment |
|
|
( |
) |
|
|
|
|
Change in unrealized gains on marketable securities, |
|
|
|
|
|
|
||
Total other comprehensive (loss) income |
|
|
( |
) |
|
|
|
|
Comprehensive loss |
|
$ |
( |
) |
|
$ |
( |
) |
The accompanying notes are an integral part of the condensed consolidated financial statements.
6
Poshmark, Inc.
Condensed Consolidated Statements of Redeemable Convertible Preferred Stock and Stockholders’ (Deficit) Equity
(in thousands, except share data)
(unaudited)
|
|
For the Three Months Ended March 31, 2021 |
|
||||||||||||||||||||||||||||||||||
|
|
Redeemable |
|
|
|
Class A and Class B |
|
|
Additional |
|
|
Treasury |
|
|
Accumulated |
|
|
Accumulated |
|
|
Total |
|
|||||||||||||||
|
|
Shares |
|
|
Amount |
|
|
|
Shares |
|
|
Amount |
|
|
|
|
|
|
|
|
|
|
|
|
|
|
|
|
|||||||||
Balance as of December 31, 2020 |
|
|
|
|
$ |
|
|
|
|
|
|
$ |
|
|
$ |
|
|
$ |
|
|
$ |
( |
) |
|
$ |
( |
) |
|
$ |
( |
) |
||||||
Conversion of redeemable convertible |
|
|
( |
) |
|
|
( |
) |
|
|
|
|
|
|
|
|
|
|
|
|
|
|
|
|
|
|
|
|
|
|
|||||||
Issuance of common stock upon initial public |
|
|
|
|
|
|
|
|
|
|
|
|
|
|
|
|
|
|
|
|
|
|
|
|
|
|
|
|
|||||||||
Conversion of convertible notes to common |
|
|
|
|
|
|
|
|
|
|
|
|
|
|
|
|
|
|
|
|
|
|
|
|
|
|
|
|
|||||||||
Exercise of common stock warrants |
|
|
|
|
|
|
|
|
|
|
|
|
|
|
|
|
|
|
|
|
|
|
|
|
|
|
|
|
|||||||||
Reclassification of warrant liability to additional |
|
|
|
|
|
|
|
|
|
|
|
|
|
|
|
|
|
|
|
|
|
|
|
|
|
|
|
|
|||||||||
Issuance of common stock upon vesting of |
|
|
|
|
|
|
|
|
|
|
|
|
|
|
|
|
|
|
|
|
|
|
|
|
|
|
|
|
|||||||||
Tax withholding related to vesting of restricted |
|
|
|
|
|
— |
|
|
|
|
( |
) |
|
|
|
|
|
|
|
|
( |
) |
|
|
|
|
|
|
|
|
( |
) |
|||||
Issuance of common stock upon exercise of |
|
|
|
|
|
|
|
|
|
|
|
|
|
|
|
|
|
|
|
|
|
|
|
|
|
|
|
|
|||||||||
Stock-based compensation |
|
|
|
|
|
|
|
|
|
|
|
|
|
|
|
|
|
|
|
|
|
|
|
|
|
|
|
|
|||||||||
Other comprehensive income |
|
|
|
|
|
|
|
|
|
|
|
|
|
|
|
|
|
|
|
|
|
|
|
|
|
|
|
|
|||||||||
Net loss |
|
|
|
|
|
|
|
|
|
|
|
|
|
|
|
|
|
|
|
|
|
( |
) |
|
|
|
|
|
( |
) |
|||||||
Balance as of March 31, 2021 |
|
|
|
|
$ |
|
|
|
|
|
|
$ |
|
|
$ |
|
|
$ |
( |
) |
|
$ |
( |
) |
|
$ |
|
|
$ |
|
|||||||
|
|
|
|
|
|
|
|
|
|
|
|
|
|
|
|
|
|
|
|
|
|
|
|
|
|
|
|
|
|||||||||
|
|
For the Three Months Ended March 31, 2022 |
|
|
|
|
|||||||||||||||||||||||||||||||
|
|
Redeemable |
|
|
|
Class A and Class B |
|
|
Additional |
|
|
Treasury Stock |
|
|
Accumulated |
|
|
Accumulated |
|
|
Total |
|
|||||||||||||||
|
|
Shares |
|
|
Amount |
|
|
|
Shares |
|
|
Amount |
|
|
|
|
|
|
|
|
|
|
|
|
|
|
|
|
|||||||||
Balance as of December 31, 2021 |
|
|
|
|
$ |
|
|
|
|
|
|
$ |
|
|
$ |
|
|
$ |
( |
) |
|
$ |
( |
) |
|
$ |
|
|
$ |
|
|||||||
Issuance of common stock upon vesting of restricted stock units |
|
|
|
|
|
|
|
|
|
|
|
|
|
|
|
|
|
|
|
|
|
|
|
|
|
|
|
|
|||||||||
Issuance of common stock upon exercise of stock options |
|
|
|
|
|
|
|
|
|
|
|
|
|
|
|
|
|
|
|
|
|
|
|
|
|
|
|
|
|||||||||
Stock-based compensation |
|
|
|
|
|
|
|
|
|
|
|
|
|
|
|
|
|
|
|
|
|
|
|
|
|
|
|
|
|||||||||
Other comprehensive loss |
|
|
|
|
|
|
|
|
|
|
|
|
|
|
|
|
|
|
|
|
|
|
|
|
( |
) |
|
|
( |
) |
|||||||
Net loss |
|
|
|
|
|
|
|
|
|
|
|
|
|
|
|
|
|
|
|
|
|
( |
) |
|
|
|
|
|
( |
) |
|||||||
Balance as of March 31, 2022 |
|
|
|
|
$ |
|
|
|
|
|
|
$ |
|
|
$ |
|
|
$ |
( |
) |
|
$ |
( |
) |
|
$ |
|
|
$ |
|
|||||||
The accompanying notes are an integral part of the condensed consolidated financial statements
7
Poshmark, Inc.
Condensed Consolidated Statements of Cash Flows
(in thousands)
(unaudited)
|
|
Three Months Ended March 31, |
|
|||||
|
|
2022 |
|
|
2021 |
|
||
Cash flows from operating activities |
|
|
|
|
|
|
||
Net loss |
|
$ |
( |
) |
|
$ |
( |
) |
Adjustments to reconcile net loss to net cash provided by operating activities: |
|
|
|
|
|
|
||
Depreciation and amortization |
|
|
|
|
|
|
||
Stock-based compensation |
|
|
|
|
|
|
||
Change in fair value of redeemable convertible preferred stock warrant liability |
|
|
|
|
|
|
||
Change in fair value of the convertible notes |
|
|
|
|
|
|
||
Loss on extinguishment of the convertible notes |
|
|
|
|
|
|
||
Change in fair value of contingent consideration |
|
|
( |
) |
|
|
|
|
Accretion of discounts and amortization of premiums on marketable securities, net |
|
|
|
|
|
|
||
Other |
|
|
|
|
|
|
||
Changes in operating assets and liabilities: |
|
|
|
|
|
|
||
Prepaid expenses and other assets |
|
|
( |
) |
|
|
|
|
Operating lease right-of-use assets |
|
|
( |
) |
|
|
|
|
Accounts payable |
|
|
|
|
|
|
||
Funds payable to customers |
|
|
|
|
|
|
||
Accrued expenses and other liabilities |
|
|
|
|
|
|
||
Operating lease liabilities |
|
|
|
|
|
|
||
Net cash provided by operating activities |
|
|
|
|
|
|
||
Cash flows from investing activities |
|
|
|
|
|
|
||
Purchases of property and equipment |
|
|
( |
) |
|
|
( |
) |
Maturities of marketable securities |
|
|
|
|
|
|
||
Net cash (used in) provided by investing activities |
|
|
( |
) |
|
|
|
|
Cash flows from financing activities |
|
|
|
|
|
|
||
Proceeds from initial public offering, net of underwriting discounts and commissions and |
|
|
|
|
|
|
||
Proceeds from issuance of redeemable convertible preferred stock warrants |
|
|
|
|
|
|
||
Tax withholding related to vesting of restricted stock units |
|
|
|
|
|
( |
) |
|
Proceeds from exercise of stock options |
|
|
|
|
|
|
||
Net cash provided by financing activities |
|
|
|
|
|
|
||
Effect of foreign exchange rate changes on cash and cash equivalents |
|
|
( |
) |
|
|
|
|
Net increase in cash and cash equivalents |
|
|
|
|
|
|
||
Cash and cash equivalents |
|
|
|
|
|
|
||
Beginning of period |
|
|
|
|
|
|
||
End of period |
|
$ |
|
|
$ |
|
||
Supplemental cash flow data |
|
|
|
|
|
|
||
Cash paid for income taxes |
|
$ |
|
|
$ |
|
||
Purchases of property and equipment not yet settled |
|
|
|
|
|
|
||
Stock-based compensation capitalized to internal use software |
|
|
|
|
|
|
||
Deferred offering costs included in accounts payable and accrued expenses and other |
|
|
|
|
|
|
||
Conversion of convertible notes upon initial public offering |
|
|
|
|
|
|
||
Conversion of redeemable convertible preferred stock upon initial public offering |
|
|
|
|
|
|
||
Reclassification of preferred stock warrant liability upon initial public offering |
|
|
|
|
|
|
||
The accompanying notes are an integral part of the condensed consolidated financial statements.
8
Poshmark, Inc.
Notes to Condensed Consolidated Financial Statements (unaudited)
1. Organization
Description of Business
Poshmark, Inc. (the Company) was incorporated in the state of Delaware with headquarters in Redwood City, California, and has wholly-owned subsidiaries based in Chennai, India, Vancouver, Canada, New South Wales, Australia, and London, United Kingdom. The Company is a social marketplace that combines the human connection of a physical shopping experience with the scale, reach, ease, and selection benefits of eCommerce. In doing so, the Company brings the power of community to buying and selling online. Pairing technology with the inherent human desire to socialize, the Company creates passion and personal connections among users.
The accompanying unaudited condensed financial statements have been prepared assuming the Company will continue as a going concern. Since inception, the Company has incurred cumulative net losses. The Company generated net loss of $
Initial Public Offering
On January 19, 2021, the Company completed its initial public offering (IPO). In connection with the IPO, it authorized two new classes of common stock: Class A common stock and Class B common stock. The rights of the holders of Class A and Class B common stock are identical, except with respect to voting, conversion and transfer rights. Each share of Class A common stock is entitled to
Upon completion of the IPO, $
2. Summary of Significant Accounting Policies
Basis of Presentation
The accompanying unaudited condensed consolidated financial statements and condensed footnotes have been prepared in accordance with accounting principles generally accepted in the United States (U.S. GAAP) for interim financial information as well as the instructions to Form 10-Q and the rules and regulations of the U.S. SEC. Certain information and disclosures normally included in the financial statements prepared in accordance with U.S. GAAP have been condensed or omitted pursuant to such rules and regulations. The condensed consolidated balance sheet as of December 31, 2020, included herein, was derived from the audited financial statements as of that date but does not include all disclosures, including notes required by U.S. GAAP. In the opinion of management, the accompanying unaudited condensed consolidated financial statements reflect all adjustments, which include only normal recurring adjustments, necessary for the fair statement of the financial position, results of operations and cash flows for the interim periods. The results of operations for the three months ended March 31, 2022 are not necessarily indicative of the results of operations expected for the entire year ending December 31, 2022 or for any other future annual or interim periods. These condensed consolidated financial statements should be read in conjunction with the consolidated financial statements and related notes included in the Company’s Annual Report on Form 10-K (2021 Annual Report) for the year ended December 31, 2021, filed with the SEC on March 30, 2022.
9
For the foreign subsidiaries where the local currency is the functional currency, translation adjustments of foreign currency financial statements into U.S. dollars are recorded as a separate component of accumulated other comprehensive income (loss). Foreign currency transaction gains and losses have not been material for all periods presented.
Use of Estimates
The preparation of condensed consolidated financial statements in conformity with U.S. GAAP requires management to make certain estimates, judgments and assumptions that affect the reported amounts of assets and liabilities and the related disclosures of contingent assets and liabilities at the date of the financial statements, as well as the reported amounts of revenue and expenses during the periods presented. Estimates include the fair value of financial instruments, the incremental borrowing rate (IBR) applied in lease accounting, capitalization and estimated useful life of internal-use software, allowance for expected chargeback losses, estimates related to credits, incentives and refunds issued to customers, valuation of the convertible notes preceding its IPO, valuation of the redeemable convertible preferred stock warrant liability preceding its IPO, stock-based compensation, valuation of the Company’s common stock preceding its IPO, and valuation of deferred income tax assets and the uncertain tax positions. To the extent there are material differences between these estimates, judgments or assumptions and actual results, the condensed consolidated financial statements will be affected.
The World Health Organization declared in March 2020 that the outbreak of the coronavirus disease (COVID-19) constituted a pandemic. The COVID-19 pandemic has caused general business disruption worldwide beginning in January 2020. The global impact of COVID-19 continues to rapidly evolve, and the Company will continue to monitor the situation and the effects on its business and operations closely. The Company does not yet know the full extent of potential impacts on its business or operations or on the global economy as a whole, particularly if the COVID-19 pandemic continues and persists for an extended period of time. Given the uncertainty, the Company cannot reasonably estimate the impact on its future results of operations, cash flows, or financial condition. As of the date of issuance of the condensed consolidated financial statements, the Company is not aware of any specific event or circumstance that would require it to update its estimates, judgments or the carrying value of its assets or liabilities. These estimates may change, as new events occur and additional information is obtained, and are recognized in the condensed consolidated financial statements as soon as they become known. Actual results could differ from those estimates, and any such differences may be material to the Company’s condensed consolidated financial statements.
Revenue Recognition
The Company recognizes revenue when it satisfies its performance obligations. The Company considers both sellers and buyers to be customers. The Company generates revenue from sellers for fees earned when sellers sell items they have listed on the Company’s platform to buyers. The Company generates revenue from buyers for fees earned when they purchase shipping labels used for delivery of the items purchased. The Company periodically reassesses its revenue recognition policies as new offerings become material, and business models evolve. The Company recognizes revenue net of estimated returns and cancellations based on its historical experience. Transactions may be cancelled by a buyer or seller in certain circumstances.
The Company enters into the Terms of Service (TOS) with buyers and sellers to use the Company’s technology platform. The TOS governs these parties’ use of the platform, including payment terms for the buyer and the seller and services to be provided by the Company. Under the TOS, upon the buyer’s purchase from the seller, the Company, buyer, and seller are committed to perform and enforceable rights and obligations are established.
Sellers
Sellers are able to list their items for sale on the Company’s platform at no charge. The Company charges a fee upon the sale of items listed on its platform. The fee is a fixed dollar amount for orders under a certain value, and a fixed percentage of the final sales price of the item for orders greater than that. The service that the Company provides to sellers includes the facilitation of the sale of their items as well as certain ancillary activities such as payment processing and authentication (for certain luxury items). These activities comprise a single performance obligation to sellers, which is to facilitate the sale of the listed items between sellers and buyers on the Company’s platform (sale facilitation).
The Company evaluates the presentation of revenue from sellers on a gross or net basis based on whether it acts as a principal or an agent in the sale of listed items between sellers and buyers. The Company does not control the listed items at any time prior to the transfer of such items to buyers. The Company acts as an agent in facilitating the sale of items from sellers to buyers by allowing them to connect and interact on the Company’s platform. The Company is not primarily responsible for fulfillment of purchased items, does not have inventory risk, and does not set the price for the listed item. As such, the Company reports revenue from sellers on a net basis to reflect the fees received from sellers.
10
Revenue is recognized at the point in time the Company satisfies its performance obligation to facilitate the sale of a listed item. This occurs when both the seller and the buyer agree to a sale and the payment is processed on the Company’s platform. For luxury items authenticated by the Company, sale facilitation revenue is recognized when the Company authenticates and arranges for shipment of the items to the buyer, as this is the point in time a sale is finalized and the Company has satisfied its performance obligation.
Buyers
When a sale is finalized, the buyer purchases a shipping label from United States Postal Service (USPS), or the relevant shipping provider for the Canada, Australia and India marketplaces, through the Poshmark platform. The Company emails the shipping label to the seller and the seller ships the item to the buyer through the shipping provider. The Company does not purchase the shipping label on behalf of the buyer until after the buyer has purchased an item and has remitted payment. As a result, the Company has one performance obligation to buyers, which is to facilitate the sale of shipping labels to buyers for delivery of items purchased on the Company’s platform (shipping facilitation).
The Company evaluates the presentation of revenue from buyers on a gross or net basis based on whether it acts as a principal or an agent in shipment of listed items between sellers and buyers. The Company does not control the shipping service, which is provided by the shipping provider. The Company is not primarily responsible for shipping and it does not assume any of the risks for the items shipped such as risk of damage or loss during shipping. The Company acts as an agent of the buyer in facilitating the shipping. As such, the Company reports revenue on a net basis which is the difference between the shipping fee paid by the buyer and the cost of shipping labels paid to the shipping provider.
Revenue from shipping facilitation is recognized upon transfer of the shipping label to the seller on behalf of the buyer.
The Company estimates chargebacks based on historical collectability rates. The Company records a reserve for chargebacks in accrued expenses and other accrued liabilities with an offset to general and administrative expenses.
Sales tax and other amounts collected on behalf of third parties are excluded from the transaction price.
Incentives
Under the referral program, an existing user (the referrer) earns an incentive (Posh Credit) when a new user (the referee) first buys an item on the Company’s platform. Posh Credits are not redeemable for cash and can only be applied for purchases on the Company’s platform. The Company records the incentive to the referrer, which is in exchange for a distinct referral service, as a liability at the time the incentive is earned by the referrer with a corresponding charge recorded to marketing expense in the condensed consolidated statements of operations. Credits and incentives issued to existing users for referring new users are contingent upon a new user completing an initial purchase on the Company’s platform and represent an incremental cost of obtaining a contract with a customer. The Company expenses such new user referral incentives as marketing expense when the referral incentives are earned because the amortization period would be one year or less.
The Company has several buyer incentive programs, which are offered to encourage buyer activity on the Company’s platform. These promotions reduce the fees for shipping facilitation charged by the Company. Accordingly, the Company records these incentives as a reduction to revenue from the buyer when the incentive is used by the buyer. Amounts in excess of cumulative shipping facilitation revenue earned are presented as marketing expense in the condensed consolidated statements of operations.
The Company participates in certain joint incentive programs with sellers that are recorded as a reduction to the fees received from the seller.
11
The Company may elect to issue incentives to buyers for customer satisfaction purposes or for refunds. These incentives (which are in the form of Posh Credits) can be applied towards future orders and, thereby, results in a reduced fee earned by the Company from the buyer, or redeemable credits that can also be redeemed for cash. In cases where the seller performed as required by the Company’s TOS, the Company reduces shipping facilitation revenue earned on the transaction and any cumulative revenue earned from the same buyer for Posh Credits and redeemable credits granted. If the amount of the incentive exceeds cumulative revenues from the buyer, then the excess is presented as operations and support expense in the consolidated statements of operations. If refunds are provided in a case where the seller did not perform and the amount cannot be recovered from the seller, the refund is presented as a reduction of revenue.
|
|
Three Months Ended March 31, |
|
|||||
|
|
2022 |
|
|
2021 |
|
||
Reduction to net revenue |
|
$ |
|
|
$ |
|
||
Operations and support |
|
|
|
|
|
|
||
Marketing |
|
|
|
|
|
|
||
|
|
$ |
|
|
$ |
|
||
Cost of Net Revenue
Cost of net revenue consists of costs associated with credit card processing, order transaction fees and hosting expenses associated with operating the Company’s platform. Cost of net revenue does not include depreciation and amortization.
Stock-Based Compensation
The Company has granted stock-based awards consisting of stock options and restricted stock units (RSUs) to employees and consultants.
RSUs granted prior to the occurrence of a Qualified IPO vest upon the satisfaction of both time-based service and performance-based conditions. The time-based vesting condition for the majority of these awards is satisfied over
The Company estimates the fair value of stock options granted to employees and directors using the Black-Scholes option-pricing model. The Black-Scholes model considers several variables and assumptions in estimating the fair value of stock-based awards. These variables include:
For all stock options granted, the expected term is calculated using the simplified method. The Company does not have sufficient historical transactions in its own shares on which to base expected volatility and, therefore, uses the historical volatility of the stock price of similar publicly traded peer companies to estimate volatility of equity awards granted. The risk-free interest rate is based on the yield available on U.S. Treasury zero-coupon issues similar in duration to the expected term of the equity-settled award.
12
Prior to the completion of the IPO, the fair value of the shares of common stock underlying the stock options has been determined by the board of directors as there was no public market for the common stock. The board of directors determined the fair value of the Company’s common stock by considering a number of objective and subjective factors including: contemporaneous third-party valuations of the Company’s common stock, the valuation of comparable companies, sales of redeemable convertible preferred stock to unrelated third-parties, the Company’s operating and financial performance, the lack of liquidity of common stock, and general and industry specific economic outlook, amongst other factors. After the completion of the IPO, the fair value of the Company’s common stock is determined by the closing price, on the date of grant, of its common stock, which is traded on the Nasdaq Global Select Market.
Leases
Prior to the adoption of ASC 842
The Company leases office space under non-cancelable operating lease agreements. Certain of these arrangements have free rent, escalating rent payment provisions, and landlord funded leasehold incentives. Rent expense is recorded on a straight-line basis over the lease term. If a lease provides for fixed escalations of the minimum rental payments, the difference between the straight-line rent charged to expense and the amount payable under the lease is recorded as deferred rent in accrued expenses and other current liabilities, and other liabilities. Landlord funded leasehold incentives are recorded as deferred rent in accrued expenses and other current liabilities, and long-term portion of deferred rent and other liabilities and are recognized as an offset to rent expense using the straight-line method over the lease term.
Subsequent to the adoption of ASC 842
The Company determines if an arrangement is a lease at inception. Lease agreements generally contain lease and non-lease components. The Company combines fixed payments for non-lease components with lease payments and account for them together as a single lease component which increases the amount of its lease assets and liabilities. Certain lease agreements contain variable payments, which are expensed as incurred and not included in the lease assets and liabilities. These amounts include payments for common area maintenance and utilities. Lease assets and liabilities are recognized at the present value of the future lease payments at the lease commencement date. As the interest rate implicit in lease contracts is typically not readily determinable, the Company utilizes the appropriate incremental borrowing rate, which is the rate incurred to borrow on a collateralized basis over a similar term an amount equal to the lease payments in a similar economic environment. The lease terms may include options to extend or terminate the lease when it is reasonably certain that the Company will exercise that option. The Company generally uses the base, non-cancelable, lease term when determining the lease assets and liabilities. Lease assets also include any prepaid lease payments and lease incentives. Short-term leases are leases having a term of twelve months or less. The Company recognizes short-term leases on a straight-line basis and does not record a related lease asset or liability for such leases.
Operating lease assets and liabilities are recognized on the condensed consolidated balance sheet as operating lease right-of-use assets (ROU), operating lease liabilities, current and operating lease liabilities, noncurrent. Operating lease expense (excluding variable lease costs) is recognized on a straight-line basis over the lease term.
Concentrations of Risk
The Company currently uses
The majority of the Company’s cash and cash equivalents are held by one high-credit quality financial institution within the United States with balances maintained in excess of the FDIC insurance limits.
13
Recently Adopted Accounting Pronouncements
In February 2016, the FASB issued ASU 2016-02, Leases (Topic 842) and since that date, has issued several ASUs to further clarify certain aspects of ASU 2016-02 and provide entities with practical expedients that may be elected upon adoption. This standard requires lessees to recognize all leases, including operating leases, on the balance sheet as a right-of-use (ROU) asset and lease liability, unless the lease is a short-term lease. In July 2018, the FASB issued ASU 2018-11, Targeted Improvements – Leases (Topic 842). This update provides an alternative transition method that allows entities to elect to apply the standard prospectively at its effective date, versus recasting the prior periods presented. In June 2020, the FASB issued ASU 2020-05, deferring the effective date for one year for all other entities. The Company adopted this standard using the alternative transition method on January 1, 2022 and recorded $
In June 2016, the FASB issued ASU 2016-13, Financial Instruments-Credit Losses (Topic 326): Measurement of Credit Losses on Financial Instruments. This standard amended guidance on reporting credit losses for assets held at amortized cost basis and available for sale debt securities. For available for sale debt securities, credit losses will be presented as an allowance rather than as a write-down. In November 2019, the FASB issued ASU 2019-10, amending the effective dates. The Company adopted this standard on January 1, 2022. The adoption of this standard did not have a material impact on its condensed consolidated financial statements and related disclosures.
In October 2021, the FASB issued ASU 2021-08, Business Combinations (Topic 805): Accounting for Contract Assets and Contract Liabilities from Contracts with Customers. This standard requires entities to recognize and measure contract assets and contract liabilities acquired in a business combination in accordance with ASC 2014-09, Revenue from Contracts with Customers (Topic 606). The update will generally result in an entity recognizing contract assets and contract liabilities at amounts consistent with those recorded by the acquiree immediately before the acquisition date rather than at fair value. The Company early adopted this standard on January 1, 2022 on a prospective basis. The adoption of this standard did not have a material impact on its condensed consolidated financial statements and related disclosures.
Recently Issued Accounting Pronouncements
In August 2020, the FASB issued ASU 2020-06, Debt with Conversion and Other Options (Subtopic 470-20) and Derivatives and Hedging—Contracts in Entity’s Own Equity (Subtopic 815-40). This standard eliminates the beneficial conversion and cash conversion accounting models for convertible instruments. It also amends the accounting for certain contracts in an entity’s own equity that are currently accounted for as derivatives because of specific settlement provisions. In addition, the new guidance modifies how particular convertible instruments and certain contracts that may be settled in cash or shares impact the diluted EPS computation. Additionally, the amended guidance requires the application of the if-converted method for calculating diluted earnings per share and the treasury stock method will be no longer available. This new standard will be effective for the Company for fiscal years beginning after December 15, 2023, including interim periods within those fiscal years using the fully retrospective or modified retrospective method. Early adoption is permitted. The Company is currently evaluating the effect that implementation of this standard will have on its consolidated financial statements upon adoption.
3. Revision of Prior Periods' Financial Statement
As previously disclosed in the Company’s 2021 Annual Report, during 2021, the Company identified prior period errors in its previously issued financial statements as of December 31, 2020 and for the years ended December 31, 2020 and 2019, as well as the first three quarters of 2021. These errors primarily related to the Company's calculation and recording of credit card chargebacks from one of its payment processors, which resulted in the overstatement of general and administrative expenses. The corresponding impact was an understatement of cash and cash equivalents and an overstatement of accrued expenses and other liabilities.
The Company evaluated the effect of these errors on prior periods under the guidance of Securities and Exchange Commission (SEC) Staff Accounting Bulletin (SAB) Topic 1.M, Materiality, codified in ASC 250, Accounting Changes and Error Corrections, and concluded that the errors were not material to the prior annual or interim periods. However, the Company determined it was appropriate to revise its previously issued financial statements. In connection with such revision, the Company also correcting for other immaterial misstatements, primarily related to the recording of income taxes and misclassification of marketing expenses and net revenue.
Accordingly, in connection with the filing of this Quarterly Report on Form 10-Q, the Company has revised the accompanying Condensed Consolidated Statements of Operations and Comprehensive Loss, Changes in Stockholders’ Equity, and Cash Flows for the three months ended March 31, 2021, and the related notes to revise for those errors. The Company will revise the remaining 2021 previously issued quarterly financial statements in connection with future 2022 filings on Form 10-Q.
14
The following table presents the effect of the correction of the misstatements and the resulting revision on the Condensed Consolidated Statements of Operations and Comprehensive Loss:
|
|
Three Months Ended March 31, 2021 |
|
|||||||||
|
|
As Previously Reported |
|
|
Adjustments |
|
|
As Revised |
|
|||
|
|
(in thousands, except per share data) |
|
|||||||||
Net revenue |
|
$ |
|
|
$ |
( |
) |
|
$ |
|
||
Marketing |
|
|
|
|
|
( |
) |
|
|
|
||
General and administrative |
|
|
|
|
|
( |
) |
|
|
|
||
Total costs and expenses |
|
|
|
|
|
( |
) |
|
|
|
||
Loss from operations |
|
|
( |
) |
|
|
|
|
|
( |
) |
|
Loss before benefit for income taxes |
|
|
( |
) |
|
|
|
|
|
( |
) |
|
(Benefit) provision for income taxes |
|
|
( |
) |
|
|
|
|
|
|
||
Net loss |
|
|
( |
) |
|
|
|
|
|
( |
) |
|
Comprehensive loss |
|
|
( |
) |
|
|
|
|
|
( |
) |
|
Net loss per share attributable to common stockholders, basic and diluted |
|
$ |
( |
) |
|
$ |
|
|
$ |
( |
) |
|
The following table presents the effect of the correction of the misstatements on the Condensed Consolidated Statements of Changes in Stockholders' Equity (in thousands):
|
|
As Previously Reported |
|
|
Adjustments |
|
|
As Revised |
|
|||
As of January 1, 2021 |
|
|
|
|
|
|
|
|
|
|||
Accumulated deficit |
|
$ |
( |
) |
|
$ |
|
|
$ |
( |
) |
|
Total stockholders' deficit |
|
|
( |
) |
|
|
|
|
|
( |
) |
|
As of and for the three months ended March 31, 2021 |
|
|
|
|
|
|
|
|
|
|||
Net loss attributable to common stockholders |
|
|
( |
) |
|
|
|
|
|
( |
) |
|
Accumulated deficit |
|
|
( |
) |
|
|
|
|
|
( |
) |
|
Total stockholders' equity |
|
|
|
|
|
|
|
|
|
|||
The following table presents the effect of the correction of the misstatements on the Condensed Consolidated Statements of Cash Flows (in thousands):
|
|
Three Months Ended March 31, 2021 |
|
|||||||||
|
|
As Previously Reported |
|
|
Adjustments |
|
|
As Revised |
|
|||
Net loss |
|
$ |
( |
) |
|
$ |
|
|
$ |
( |
) |
|
Changes in operating assets and liabilities: |
|
|
|
|
|
|
|
|
|
|||
Accrued expenses and other liabilities |
|
|
|
|
|
|
|
|
|
|||
Net cash provided by operating activities |
|
|
|
|
|
|
|
|
|
|||
Cash and cash equivalents: |
|
|
|
|
|
|
|
|
|
|||
Beginning of year |
|
|
|
|
|
|
|
|
|
|||
End of year |
|
|
|
|
|
|
|
|
|
|||
4. Supplemental Financial Statement Information
Cash Equivalents
The following tables summarize the cost or amortized cost, gross unrealized gains, gross unrealized losses and fair value of the cash equivalents as of March 31, 2022 and December 31, 2021 (in thousands):
|
|
March 31, 2022 |
|
|||||||||||||
|
|
Cost or |
|
|
Unrealized |
|
|
Estimated |
|
|||||||
|
|
Cost |
|
|
Gains |
|
|
Losses |
|
|
Value |
|
||||
Cash equivalents(1) |
|
|
|
|
|
|
|
|
|
|
|
|
||||
Money market funds |
|
$ |
|
|
$ |
|
|
$ |
|
|
$ |
|
||||
Total |
|
$ |
|
|
$ |
|
|
$ |
|
|
$ |
|
||||
15
(1) Included in cash and cash equivalents on the consolidated balance sheet as of March 31, 2022.
|
|
December 31, 2021 |
|
|||||||||||||
|
|
Cost or |
|
|
Unrealized |
|
|
Estimated |
|
|||||||
|
|
Cost |
|
|
Gains |
|
|
Losses |
|
|
Value |
|
||||
Cash equivalents(1) |
|
|
|
|
|
|
|
|
|
|
|
|
||||
Money market funds |
|
$ |
|
|
$ |
|
|
$ |
|
|
$ |
|
||||
Total |
|
$ |
|
|
$ |
|
|
$ |
|
|
$ |
|
||||
Property and Equipment, Net
Property and equipment, net consisted of the following as of the dates indicated (in thousands):
|
|
March 31, |
|
|
December 31, |
|
||
Computer equipment and software |
|
$ |
|
|
$ |
|
||
Developed website and software |
|
|
|
|
|
|
||
Furniture and fixtures |
|
|
|
|
|
|
||
Leasehold improvements and incentives |
|
|
|
|
|
|
||
Total property and equipment, gross |
|
|
|
|
|
|
||
Less accumulated depreciation |
|
|
( |
) |
|
|
( |
) |
Property and equipment, net |
|
$ |
|
|
$ |
|
||
Accrued Expenses and Other Current Liabilities
Accrued expenses and other current liabilities consisted of the following as of the dates indicated (in thousands):
|
|
March 31, |
|
|
December 31, |
|
||
Accrued advertising |
|
$ |
|
|
$ |
|
||
Accrued sales tax |
|
|
|
|
|
|
||
Accrued compensation and benefits |
|
|
|
|
|
|
||
Contingent consideration |
|
|
|
|
|
|
||
Other accrued and other current liabilities |
|
|
|
|
|
|
||
Accrued expenses and other current liabilities |
|
$ |
|
|
$ |
|
||
5
The following tables set forth the financial instruments that were measured at fair value on a recurring basis by level within the fair value hierarchy as of March 31, 2022 and December 31, 2021 (in thousands):
|
|
March 31, 2022 |
|
|||||||||||||
|
|
Level 1 |
|
|
Level 2 |
|
|
Level 3 |
|
|
Total |
|
||||
Assets |
|
|
|
|
|
|
|
|
|
|
|
|
||||
Cash equivalents(1) |
|
|
|
|
|
|
|
|
|
|
|
|
||||
Money market funds |
|
$ |
|
|
$ |
|
|
$ |
|
|
$ |
|
||||
Total |
|
$ |
|
|
$ |
|
|
$ |
|
|
$ |
|
||||
Liabilities |
|
|
|
|
|
|
|
|
|
|
|
|
||||
Contingent consideration(2) |
|
$ |
|
|
$ |
|
|
$ |
|
|
$ |
|
||||
Total |
|
$ |
|
|
$ |
|
|
$ |
|
|
$ |
|
||||
16
|
|
December 31, 2021 |
|
|||||||||||||
|
|
Level 1 |
|
|
Level 2 |
|
|
Level 3 |
|
|
Total |
|
||||
Assets |
|
|
|
|
|
|
|
|
|
|
|
|
||||
Cash equivalents(1) |
|
|
|
|
|
|
|
|
|
|
|
|
||||
Money market funds |
|
$ |
|
|
$ |
|
|
$ |
|
|
$ |
|
||||
Total |
|
$ |
|
|
$ |
|
|
$ |
|
|
$ |
|
||||
Liabilities |
|
|
|
|
|
|
|
|
|
|
|
|
||||
Contingent consideration(2) |
|
$ |
|
|
$ |
|
|
$ |
|
|
$ |
|
||||
Total |
|
$ |
|
|
$ |
|
|
$ |
|
|
$ |
|
||||
The following table represents the change in the contingent consideration (in thousands):
|
|
Level 3 |
|
|
Balance as of December 31, 2021 |
|
$ |
|
|
Change in fair value |
|
|
( |
) |
Balance as of March 31, 2022 |
|
$ |
|
|
There were
6. Commitments and Contingencies
Purchase Commitments
As of March 31, 2022 and December 31, 2021, the Company has non-cancelable contractual commitments of $
Litigation and Loss Contingencies
The Company accrues estimates for resolution of legal and other contingencies when losses are probable and estimable. From time to time, the Company may become a party to litigation and subject to claims incident to the ordinary course of business, including intellectual property claims, labor and employment claims, and threatened claims, breach of contract claims, tax and other matters. The Company currently has
Indemnifications
The Company enters into indemnification provisions under agreements with other parties in the ordinary course of business, including business partners, investors, contractors and the Company’s officers, directors and certain employees. The Company has agreed to indemnify and defend the indemnified party claims and related losses suffered or incurred by the indemnified party from actual or threatened third-party claim because of the Company’s activities or non-compliance with certain representations and warranties made by the Company. It is not possible to determine the maximum potential loss under these indemnification provisions due to the Company’s limited history of prior indemnification claims and the unique facts and circumstances involved in each particular provision. To date, losses recorded in the condensed consolidated statements of operations in connection with the indemnification provisions have not been material.
7. Business Combination
On
17
date fair value of this contingent consideration liability was $
The acquisition was accounted for under the acquisition method of accounting. Accordingly, the purchase price was allocated to the assets acquired and liabilities assumed based upon their estimated fair values as of the date of the acquisition. The excess of the purchase price over the estimated fair value of the net assets acquired was recorded as goodwill. The Company recognized intangible assets of $
Subsequent to the acquisition, the Company recorded a $
The following table summarizes the allocation of the purchase price to the fair value of the assets acquired and liabilities assumed of Suede One, Inc. (in thousands):
Acquiree |
|
Purchase |
|
|
Net Tangible |
|
|
Purchased |
|
|
Goodwill |
|
||||
Suede One, Inc. |
|
$ |
|
|
$ |
( |
) |
|
$ |
|
|
$ |
|
|||
8. Goodwill and Intangible Assets
Goodwill, which is not subject to amortization, totaled $
Intangible assets consist of developed technology and customer relationships in business combination. Acquired intangibles are amortized on a straight-line basis over the respective estimated useful lives of the assets.
As of March 31, 2022 and December 31, 2021, the carrying values of intangible assets are as follows (in thousands):
|
|
March 31, 2022 |
|
|||||||||
|
|
Gross Book |
|
|
Accumulated |
|
|
Net Book |
|
|||
Developed technology |
|
$ |
|
|
$ |
( |
) |
|
$ |
|
||
Customer relationships |
|
|
|
|
|
( |
) |
|
|
|
||
Intangible assets, net |
|
$ |
|
|
$ |
( |
) |
|
$ |
|
||
|
|
December 31, 2021 |
|
|||||||||
|
|
Gross Book |
|
|
Accumulated |
|
|
Net Book |
|
|||
Developed technology |
|
$ |
|
|
$ |
( |
) |
|
$ |
|
||
Customer relationships |
|
|
|
|
|
( |
) |
|
|
|
||
Intangible assets, net |
|
$ |
|
|
$ |
( |
) |
|
$ |
|
||
As of March 31, 2022, developed technology and customer relationships have remaining useful lives of
As of March 31, 2022, the Company estimates future amortization expense of intangible assets as follows (in thousands):
2022 (remaining nine months) |
|
$ |
|
|
2023 |
|
|
|
|
2024 |
|
|
|
|
2025 and thereafter |
|
|
|
|
Total amortization expense |
|
$ |
|
18
9. Leases
The Company has entered into various non-cancelable operating lease agreements for its offices facilities with contractual lease periods expiring between
The components of operating lease expense were as follows (in thousands):
|
|
Three Months Ended |
|
|
|
|
March 31, 2022 |
|
|
Operating lease cost |
|
$ |
|
|
Variable lease cost |
|
|
|
|
Short term lease cost |
|
|
|
|
Total operating lease cost |
|
$ |
|
|
Rent expense was $
Future minimum lease payments under operating leases as of March 31, 2022 were as follows (in thousands):
|
|
Operating Leases |
|
|
2022 (remaining nine months) |
|
$ |
|
|
2023 |
|
|
|
|
2024 |
|
|
|
|
2025 |
|
|
|
|
2026 and thereafter |
|
|
|
|
Total future minimum lease payments |
|
|
|
|
Less imputed interest |
|
|
( |
) |
Total future minimum lease payments |
|
$ |
|
|
Prior to the adoption of ASC 842, future minimum payments for noncancellable operating leases as of December 31, 2021 were as follows (in thousands):
2022 |
|
$ |
|
|
2023 |
|
|
|
|
2024 |
|
|
|
|
2025 |
|
|
|
|
Total minimum lease payments |
|
$ |
|
10. Common Stock
Common stock reserved for future issuance was as follows as of March 31, 2022 and December 31, 2021:
|
|
March 31, |
|
|
December 31, |
|
||
2011 Stock Option and Grant Plan: |
|
|
|
|
|
|
||
Options issued and outstanding |
|
|
|
|
|
|
||
RSUs issued and outstanding |
|
|
|
|
|
|
||
2021 Stock Option and Grant Plan: |
|
|
|
|
|
|
||
Options issued and outstanding |
|
|
|
|
|
|
||
RSUs issued and outstanding |
|
|
|
|
|
|
||
Shares available for future grants |
|
|
|
|
|
|
||
2021 Employee Stock Purchase Plan |
|
|
|
|
|
|
||
Total shares of common stock reserved for |
|
|
|
|
|
|
||
19
11. Stock-Based Compensation Plan
2011 Stock Option and Grant Plan
In 2011, the Company adopted the 2011 Stock Option and Grant Plan, or the 2011 Plan. The 2011 Plan provides for the granting of stock options and restricted stock units to employees and non-employees of the Company. Options granted under the 2011 Plan may be either incentive stock options or non-qualified stock options. Incentive stock options (ISO) may be granted only to the Company’s employees (including officers and directors who are also employees). Non-qualified stock options (NSO) may be granted to the Company’s employees and non-employees.
Options issued under the 2011 Plan are granted at an exercise price of not less than
The 2011 Plan has been replaced by the 2021 Plan as defined below.
2021 Stock Option and Incentive Plan
In connection with the Company’s IPO, the Company adopted the 2021 Stock Option and Incentive Plan, or the 2021 Plan, in January 2021. The 2021 Plan replaced the 2011 Plan, as the Company’s board of directors determined not to make additional awards under the 2011 Plan following the completion of the Company’s IPO. The Company has initially reserved
Options issued under the 2021 Plan are granted at an exercise price of not less than
Employee Stock Purchase Plan
In connection with the Company’s IPO, the Company adopted the 2021 Employee Stock Purchase Plan (ESPP) in January 2021. Under the ESPP, the Company will make one or more offerings to its employees to purchase shares under the ESPP. The first offering will begin and end on dates to be determined by the plan administrator. The Company has initially reserved
20
Option to Purchase Common Stock
The following table summarizes option activity for the three months ended March 31, 2022:
|
|
Outstanding |
|
|
Weighted- |
|
|
Weighted- |
|
|
Aggregate |
|
||||
Balances at December 31, 2021 |
|
|
|
|
$ |
|
|
|
|
|
$ |
|
||||
Granted |
|
|
|
|
|
|
|
|
|
|
|
|
||||
Exercised |
|
|
( |
) |
|
|
|
|
|
|
|
|
|
|||
Forfeited and cancelled |
|
|
( |
) |
|
|
|
|
|
|
|
|
|
|||
Balances at March 31, 2022 |
|
|
|
|
$ |
|
|
|
|
|
$ |
|
||||
Vested and expected to vest as of March 31, 2022 |
|
|
|
|
$ |
|
|
|
|
|
$ |
|
||||
Vested and exercisable as of March 31, 2022 |
|
|
|
|
$ |
|
|
|
|
|
$ |
|
||||
The stock price per share that was used to determine the aggregate intrinsic value of outstanding stock options as of March 31, 2022 and December 31, 2021 was $
There were
As of March 31, 2022, the total unrecognized stock-based compensation cost related to unvested options outstanding was $
Restricted Stock Units
RSUs issued prior to the IPO had both time-based service and performance-based conditions. The performance-based vesting condition is satisfied upon the occurrence of a qualifying event, which is generally defined as a change in control transaction or the effective date of a Qualified IPO. Upon the effectiveness of the IPO, the performance-based vesting condition was satisfied, and therefore, the Company recognized a one-time cumulative stock-based compensation expense of $
The following table summarizes RSU activity for the three months ended March 31, 2022:
|
|
Number of |
|
|
Weighted- |
|
||
Nonvested as of December 31, 2021 |
|
|
|
|
$ |
|
||
Granted |
|
|
|
|
|
|
||
Vested |
|
|
( |
) |
|
|
|
|
Forfeited and cancelled |
|
|
( |
) |
|
|
|
|
Nonvested as of March 31, 2022 |
|
|
|
|
$ |
|
||
As of March 31, 2022, the total unrecognized stock-based compensation expense related to unvested options and RSUs was $
21
Stock-Based Compensation
The assumptions used to value stock options granted for the periods indicated were as follows:
|
|
Three Months Ended March 31, |
||
|
|
2022 |
|
2021 |
Expected dividend yield |
|
|
||
Expected volatility |
|
|
||
Risk-free rate |
|
|
||
Expected term (in years) |
|
|
||
Stock-based compensation expense is recorded in the condensed consolidated statements of operations as follows for the periods indicated (in thousands):
|
|
Three Months Ended March 31, |
|
|||||
|
|
2022 |
|
|
2021 |
|
||
Operations and support |
|
$ |
|
|
$ |
|
||
Research and development |
|
|
|
|
|
|
||
Marketing |
|
|
|
|
|
|
||
General and administrative |
|
|
|
|
|
|
||
Total |
|
$ |
|
|
$ |
|
||
12. Net Loss Per Share Attributable to Common Stockholders
Basic and diluted net loss per share attributable to common stockholders is presented in conformity with the two-class method required for participating securities. In connection with the IPO, the Company established two classes of authorized common stock: Class A common stock and Class B common stock. As a result, all then-outstanding shares of common stock were converted into shares of Class B common stock. Each share of Class A common stock is entitled to one vote per share and each share of Class B common stock is entitled to ten votes per share. Each share of Class B common stock is convertible at any time at the option of the stockholder into one share of Class A common stock.
The rights, including the liquidation and dividend rights, of the holders of Class A and Class B common stock were identical, except with respect to voting. As the liquidation and dividend rights were identical, the undistributed earnings were allocated on a proportionate basis and the resulting net loss per share attributable to common stockholders were, therefore, the same for both Class A and Class B common stock on an individual or combined basis.
The following table sets forth the computation of basic and diluted net loss per share attributable to common stockholders for the periods indicated (in thousands, except share and per share data):
|
|
Three Months Ended March 31, |
|
|||||
|
|
2022 |
|
|
2021 |
|
||
Numerator: |
|
|
|
|
|
|
||
Net loss attributable to common stockholders, basic and diluted |
|
$ |
( |
) |
|
$ |
( |
) |
Denominator: |
|
|
|
|
|
|
||
Weighted-average shares used to compute net loss per share attributable to |
|
|
|
|
|
|
||
Net loss per share attributable to common stockholders, basic and diluted |
|
$ |
( |
) |
|
$ |
( |
) |
The following outstanding shares of potentially dilutive securities were excluded from the computation of diluted net loss per share for the dates indicated because including them would have had an anti-dilutive effect (in thousands):
|
|
Three Months Ended March 31, |
|
|||||
|
|
2022 |
|
|
2021 |
|
||
RSUs |
|
|
|
|
|
|
||
Stock options |
|
|
|
|
|
|
||
Total |
|
|
|
|
|
|
||
22
13. Income Taxes
The following table summarizes the Company’s effective tax rate from loss for the periods presented (in thousands):
|
|
Three Months Ended March 31, |
|
|||||
|
|
2022 |
|
|
2021 |
|
||
Loss before income taxes |
|
$ |
( |
) |
|
$ |
( |
) |
Provision for income taxes |
|
|
|
|
|
|
||
Effective tax rate |
|
|
( |
)% |
|
|
( |
)% |
The tax expense for the three months ended March 31, 2022 and 2021 was primarily attributable to pre-tax foreign earnings.
The Company’s effective tax rate for all periods presented differs from the U.S. statutory tax rate primarily due to valuation allowance recorded against domestic losses and the tax rate differences between the United States and foreign countries.
The Company has a full valuation allowance on its U.S. federal and state deferred tax assets. A valuation allowance is provided when it is more likely than not that some portion of the deferred tax assets will not be realized through future operations. As a result of the Company’s analysis of all available objective evidence, both positive and negative, as of March 31, 2022 and December 31, 2021, management believes it is more likely than not that the deferred tax assets will not be fully realizable. Accordingly, the Company has provided a full valuation allowance against its deferred tax assets.
14. Subsequent Event
In May 2022, the Company granted
23
Item 2. Management’s Discussion and Analysis of Financial Condition and Results of Operations.
The following discussion of our financial condition and results of operations should be read together with our condensed financial statements and related notes thereto included elsewhere in this Quarterly Report on Form 10-Q and our audited financial statements and related notes and our Annual Report on Form 10-K filed with the SEC on March 30, 2022. The following discussion contains forward-looking statements that reflect our plans, estimates and beliefs. See the discussion under “Note Regarding Forward-Looking Statements” elsewhere in this Quarterly Report on Form 10-Q for more information. Our actual results could differ materially from those discussed in the forward-looking statements. Factors that could cause or contribute to these differences include those discussed below and particularly in the section titled “Risk Factors” and elsewhere in this Quarterly Report on Form 10-Q, as well as in our other filings with the SEC. Our historical results are not necessarily indicative of the results that may be expected for any period in the future, and our interim results are not necessarily indicative of the results we expect for the full calendar year or any other period. The unaudited condensed consolidated interim financial statements for the quarter ended March 30, 2021 have been revised to correct prior period errors as discussed in Note 3 “Revision of Prior Periods' Financial Statement” to our unaudited condensed consolidated financial statements included in this Quarterly Report on Form 10-Q. Accordingly, this Management’s Discussion and Analysis of Financial Condition and Results of Operations reflects the effects of the revisions.
Overview
We are a social marketplace that combines the human connection of a physical shopping experience with the scale, reach, ease, and selection benefits of eCommerce. In doing so, we bring the power of community to buying and selling online. We created Poshmark in 2011 to make buying and selling simple, social, and fun. Pairing technology with the inherent human desire to socialize, our marketplace creates passion and personal connections among users. We dynamically curate our marketplace into lifestyle categories that our users love, including apparel, accessories, footwear, home, beauty, and pets. Powered by our proprietary technology, our social marketplace is purpose-built to enable simple transactions, seamless logistics, and an engaging experience at scale. As of March 31, 2022, we had 7.8 million Active Buyers.
We empower people to sell a few items or to become successful entrepreneurs by providing them with end-to-end seller tools. We refer to this as “making selling a superpower.” Our comprehensive infrastructure makes it easy for sellers to build their businesses with seamless listing, merchandising, promotion, pricing, and shipping. Sellers use content, inventory selection, and social interactions to monetize their listings and drive growth. Our transparent fee structure aligns our success with the success of our sellers. Our fee is 20% of the final price for sales $15 and over, or a flat rate of $2.95 for sales under $15. We attract, engage, and retain sellers by offering the community the benefits of social connection with the ability to combine personal passion and economic empowerment. We do not own or manage inventory as products are listed, managed, sold, and shipped by our sellers, utilizing our transaction tool that makes the selling process seamless and easy. This asset-light model creates scalability and favorable working capital dynamics.
Our social features make the discovery and purchase process simple and enticing for buyers, fostering high engagement and retention. The engagement of our community has fueled strong growth in our business, supported by attractive unit economics and efficient user acquisition. We enable buyers to discover, connect, and curate their network and news feed with that of other users who share similar styles and personal preferences, creating a fun shopping experience. Our marketplace is vast, with sellers listing millions of secondhand and new items across multiple categories. We use data-driven personalization to customize each user’s feed to feature the most relevant listings and make it easy to quickly search for and find products of interest. Furthermore, sellers list a variety of items across all price points, with the added benefit of being able to negotiate offers directly with buyers seeking to optimize their budget, allowing sellers to manage their listings to achieve their individual objectives. Because our marketplace features a massive selection of secondhand items, buyers are also able to support their personal style while minimizing their environmental impact.
As of March 31, 2022, our community has generated over $6.7 billion in GMV since 2011 with $493.4 million in the three months ended March 31, 2022 and $441.0 million in the three months ended March 31, 2021, representing a 12% growth rate. In the three months ended March 31, 2022 and 2021, we had revenue of $90.9 million and $80.7 million, respectively, representing a 13% growth rate. In the three months ended March 31, 2022, we generated a net loss of $14.0 million and Adjusted EBITDA of $(4.7) million compared to a net loss of $74.1 million and Adjusted EBITDA of $4.8 million in the three months ended March 31, 2021.
Key Operating and Non-GAAP Financial Metrics
We collect and analyze operating and financial data to evaluate the health of our community, allocate our resources (such as capital, time, and technology investments), and assess the performance of our business. In addition to revenue, net (loss) income, and other results under GAAP, the key operating and financial metrics we use are GMV, Active Buyers, and Adjusted EBITDA.
24
Gross Merchandise Value. Our gross merchandise value, or GMV, is the total dollar value of transactions on our platform in a given period, prior to returns and cancellations, and excluding shipping and sales taxes. GMV is a measure of the total economic activity generated by our marketplace, and an indicator of the scale and growth of our marketplace and the health of our marketplace ecosystem.
GMV
($ in millions)
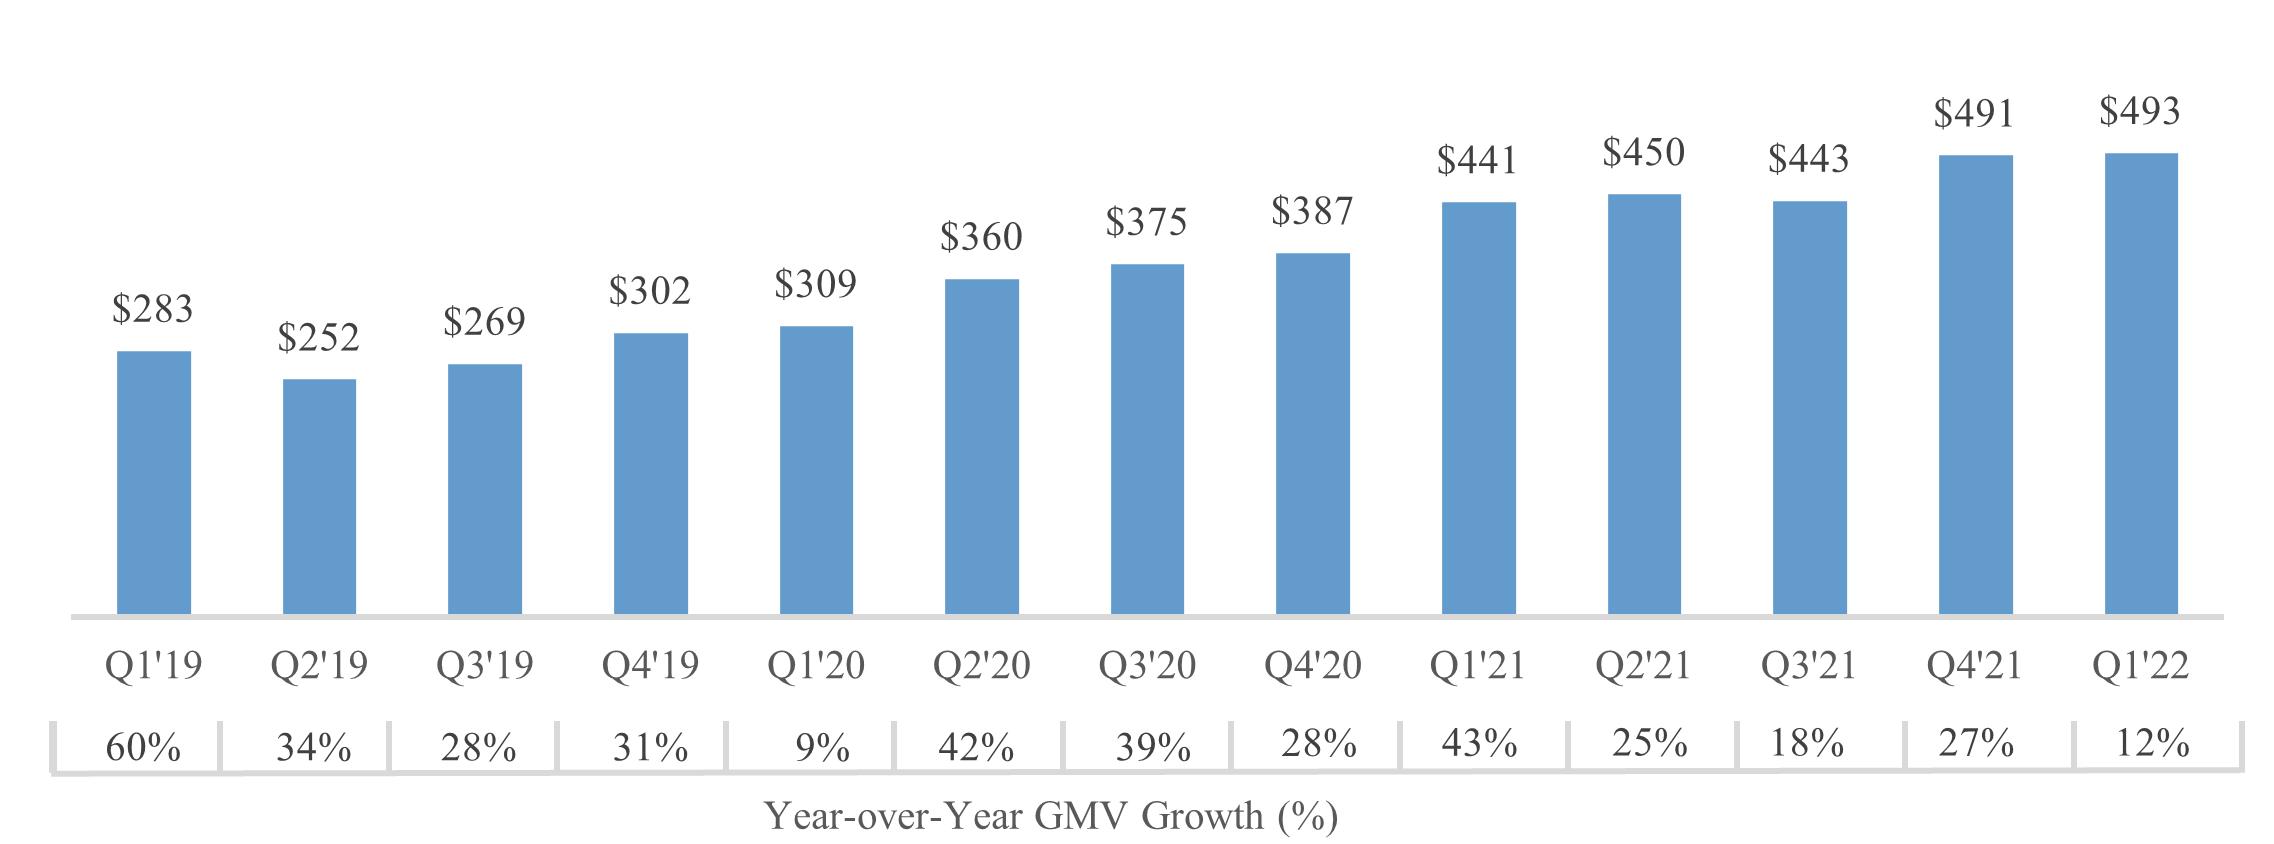
Our GMV grew 12% from $441.0 million in the three months ended March 31, 2021 to $493.4 million in the three months ended March 31, 2022. Our quarterly GMV has increased year-over-year for the past seventeen quarters. We have continued to add users and enhance our social marketplace with various initiatives and product updates, including the redesign of our Feed and Shop tabs to modernize our UX, the launch of Trends, a curated daily trends feed, the relaunch of Posh N Coffee in-person in the U.S., and the rollout of Post Order Buyer-Seller Messaging to empower sellers and buyers to independently and privately resolve order related issues.
Active Buyers. Active Buyers are unique users who have purchased at least one item on our platform in the trailing 12 months preceding the measurement date, regardless of returns and cancellations. An Active Buyer could have more than one account if they were to use a separate unique email address to set up each account. The number of Active Buyers is a key driver of GMV and revenue, as well as a measure of the scale and growth of our buyer community. We believe it is also an important indicator of our ability to convert user activity on our marketplace into transactions. The number of Active Buyers has increased steadily every quarter as we attract and retain users. Active Buyers can be new users to our marketplace who make a purchase, existing users who convert into buyers for the first time as our marketplace strengthens with more sellers and items, or repeat buyers.
Active Buyers
(in thousands)
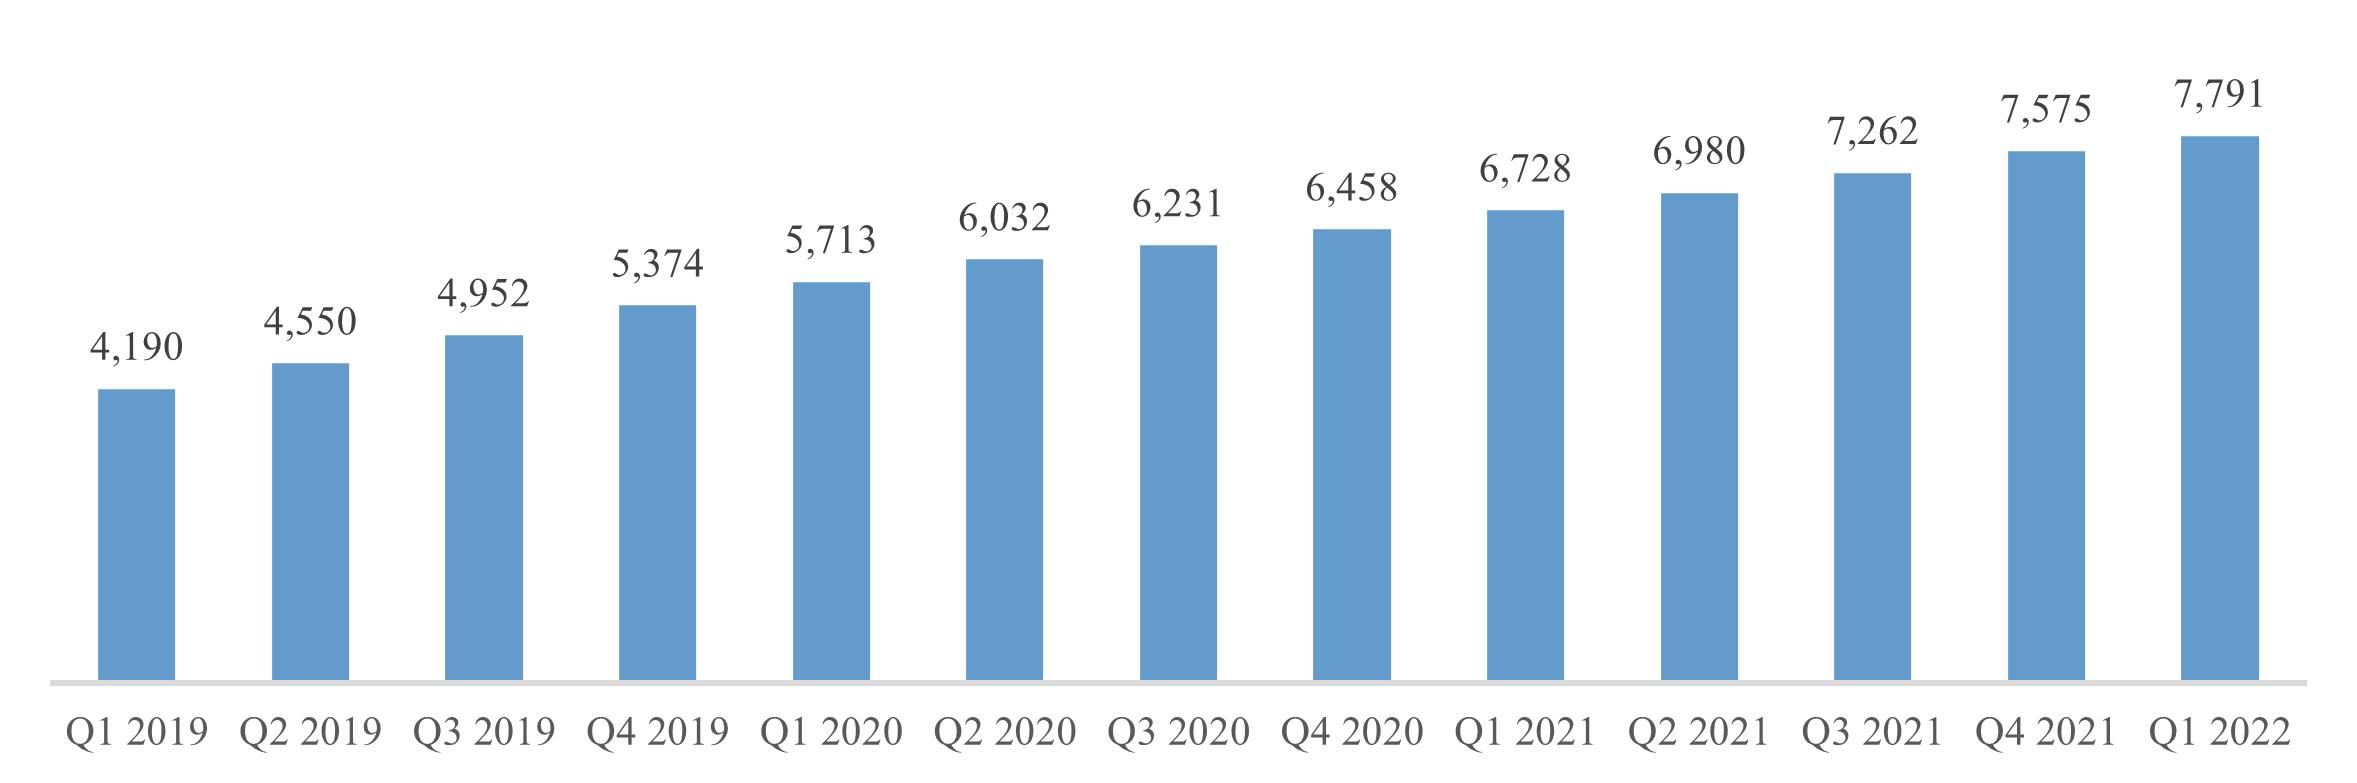
5,713 6,032 6,231 5,374 4,952 4,550 4,190 3,734 3,345 2,953 2,657 Q1 Q2 Q3 Q4 Q1 Q2 Q3 Q4 Q1 Q2 Q3 2018 2018 2018 2018 2019 2019 2019 2019 2020 2020 2020 Active Buyers measured as of the last day of the quarter presented
Active Buyers measured as of the last day of the quarter presented
25
Adjusted EBITDA. We define Adjusted EBITDA as net (loss) income attributable to common stockholders, excluding depreciation and amortization, stock-based compensation expense, interest income, other income (expense), net, change in accrued sales tax, provision (benefit) for income taxes, and undistributed earnings attributable to participating securities. Adjusted EBITDA is a key performance measure used by our management and board of directors to assess our operating performance and the operating leverage in our business. We believe that Adjusted EBITDA helps identify underlying trends in our business that could otherwise be masked by the effect of the income and expenses that we exclude in Adjusted EBITDA. Accordingly, we believe that Adjusted EBITDA provides useful information to investors and others in understanding and evaluating our operating results, enhances the overall understanding of our past performance and future prospects, and allows for greater transparency with respect to key financial metrics used by our management in its financial and operational decision-making. See “—Reconciliation of Non-GAAP Financial Measures” for more information and for a reconciliation of net (loss) income, the most directly comparable financial measure calculated and presented in accordance with GAAP, to Adjusted EBITDA.
Adjusted EBITDA
($ in millions)
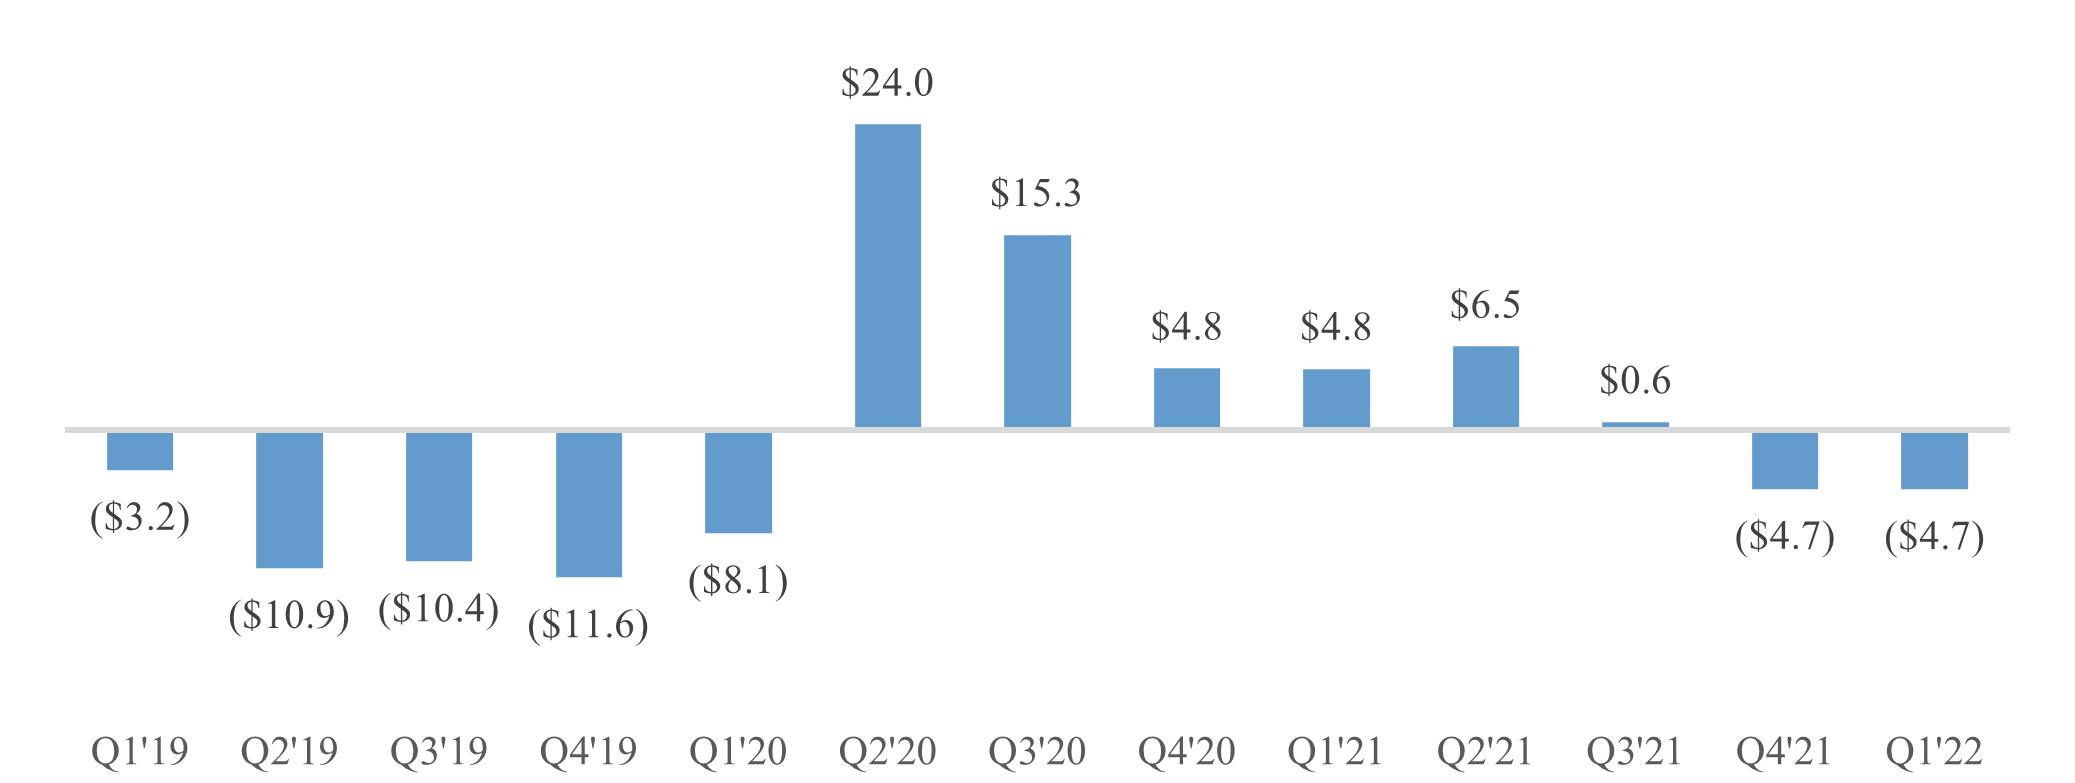
Key Factors Affecting Our Performance
Growth and Retention of Users. We focus on attracting new users and retaining existing users. New users and the social and transactional activities they contribute help keep existing users more active, increasing their lifetime value over time. Users engage in many ways on our social marketplace: they connect, they browse, they buy, and they sell. The positive relationship between new users and existing users illustrates the network effects of our marketplace. As of March 31, 2022, we had 7.8 million Active Buyers.
User Engagement. The engagement of our community has fueled strong growth in our business, supported by attractive unit economics and efficient user acquisition. We believe that cultivating a robust network of users over the longer-term is crucial to bolstering broader community engagement, growing social interactions, and increasing GMV. Users can engage on our marketplace in a variety of activities that range from shopping and social interactions to buying and selling. The continuous increase in users, social interactions, and listings has led to steady activations of buyers and sellers across cohorts, resulting in increasing GMV for these cohorts.
Investments in Growing Our User Community. We have invested substantially in marketing to grow our user community and drive further awareness of our brand. These investments have enabled us to grow our base of new users, buyers, and sellers while continuing to retain buyers and sellers, resulting in strong growth of our GMV and revenue. Marketing expenses represented 47% and 44% of revenue in the three months ended March 31, 2022 and 2021, respectively. We intend to manage our marketing spend to balance growth and profitability. While we have seen fluctuations and uncertainty in user acquisition costs, partially due to Apple's recent policy change that limits the ability of advertisers to collect user data, we will continue to invest in user acquisition and retention while the underlying user unit economics indicate the return on investment is strong.
Investments in Platform Innovation. We invest in both the people and technology behind our platform. We also intend to continue to make significant investments in the technology and infrastructure of our platform to attract and retain buyers and sellers, expand the capabilities and scope of our platform, and enhance the user experience. We expect to continue to make significant investments to attract and retain employees, particularly engineers, data scientists, designers, product management, and operations personnel. All functions
26
are important, and we intend to invest in our people to help us drive additional efficiencies across our marketplace. In addition, we may invest in new and existing businesses that may lower our margins temporarily but may enhance our platform capabilities, deliver revenue growth, and enable us to achieve and maintain long-term profitability.
International Expansion. We began operations in Canada, the first country we expanded to after the United States, in May 2019. In February 2021, we expanded our operations to Australia. In September 2021, we launched operations in India. International expansion may impact our financial performance in the short term. As we continue our global expansion, we believe international demand for our platform will develop and increase. Accordingly, we believe there is a significant opportunity to grow our international business. We have invested, and plan to continue to invest, in the adoption of our platform and solutions internationally, including localization of our platform and the addition of critical capabilities to our platform required to serve those local markets.
Impact of the COVID-19 Pandemic. The COVID-19 pandemic has impacted our business to date and may continue to impact our business in ways that remain unpredictable. In early 2020, the COVID-19 pandemic impacted our business and operations, in which we experienced lower year-over-year GMV growth for the quarter ended March 31, 2020. We have since seen our GMV growth rebound as buyer and seller activity resumed, but, such trends may not continue and could be reversed. While COVID-related restrictions have eased throughout 2021 and 2022, there remains substantial uncertainty about the pandemic’s impact on the global economy, e-commerce, and global macroeconomic conditions that impact consumer spending. In particular, as federal and state governmental aid programs initiated in connection with the pandemic are reduced or terminated, and as inflationary pressures rise, consumer discretionary spending would likely decrease, which would have a negative impact on our business.
As of March 31, 2022, substantially all of our employees are working remotely, temporarily lowering our operating expenses. As the pandemic subsides, we are opening our offices in accordance with local guidelines and regulations. Future developments, such as new virus variants, actions to contain the pandemic or treat its impact, or a resurgence of offline shopping demand could adversely affect our business, results of operations, liquidity, and financial condition in future periods. The conditions caused by the pandemic are still evolving and we will continue to evaluate the potential impact of the pandemic on our business. See the sections titled “Risk Factors” in our Annual Report on Form 10-K filed with the SEC on March 30, 2022 for further discussion of the possible impact of the COVID-19 pandemic on our business, operations and financial condition.
Seasonality. Our business is seasonal in nature as it is affected by the cyclicality of the consumer as well as broader market conditions. Historically, we have often seen both stronger growth in the number of Active Users and Active Buyers and in engagement during the first quarter of the year. In addition, we have seen higher GMV in the fourth quarter of the year, followed by the third quarter, which we believe is due in part to the higher price points of seasonal apparel and footwear and the holiday season. We believe the recent growth in our business, as well as the recent effects of sales taxes and the COVID-19 pandemic, have partially masked these trends to date, and we expect the impact of seasonality to be more pronounced in our future quarterly results as our business matures.
Initial Public Offering
Our registration statement on Form S-1 related to our initial public offering (IPO) was declared effective on January 13, 2021, and our Class A common stock began trading on the Nasdaq Global Select Market on January 14, 2021. On January 19, 2021, we closed our IPO, in which we issued and sold 6,600,000 shares plus an additional 990,000 shares subject to the underwriters’ over-allotment option of our Class A common stock at the public offering price of $42.00 per share. We received net proceeds of $292.3 million after deducting underwriting discounts and commissions and offering expenses.
Components of Results of Operations
Net Revenue
We generate revenue from sellers for fees earned when they sell items they have listed on our social marketplace to buyers (20% of the final price for sales $15 and over, or a flat rate of $2.95 for sales under $15). The buyer also pays a shipping label fee as part of their order. On some orders, the shipping label fee exceeds our shipping label cost, which we record as revenue. For the three months ended March 31, 2022 and 2021, this revenue was 4% and 5%, respectively, of our total net revenue. Our revenue is recognized when we satisfy our performance obligations. We report both revenue from buyers and revenue from sellers based upon the net amount earned, which is reduced by certain buyer and seller incentives.
Costs and Expenses
Cost of Net Revenue. Cost of net revenue primarily consists of costs associated with credit card processing, transaction fees for order related payments, and hosting expenses associated with operating our platform. Cost of net revenue does not include depreciation and amortization.
27
We expect cost of net revenue to increase in absolute dollars in future periods and to vary from period to period as a percentage of net revenue for the foreseeable future as we grow our platform by increasing Active Buyers and generating higher GMV.
Operations and Support. Operations and support expense primarily consists of personnel-related compensation costs, including stock-based compensation, incurred in providing support to users of our platform including authentication services that we provide. This expense also includes postage and shipping costs that we incur primarily from order losses and cancellations, and credits and incentives issued to buyers for customer satisfaction purposes in excess of shipping facilitation revenue.
We expect that operations and support expenses will increase in absolute dollars for the foreseeable future as we continue to grow our operations and hire additional employees to support the scaling of our business. To the extent we are successful in becoming more efficient in supporting our users, we would expect operations and support expenses as a percentage of revenue to decrease over the long term.
Research and Development. Research and development expense consist primarily of compensation expenses for engineering, product development, and design employees, including stock-based compensation, expenses associated with ongoing improvements to and maintenance and testing of our platform offerings including website, mobile apps, and other products, and other research and development programs. Research and development expenses are expensed as incurred. We capitalize certain costs associated with website development and software for internal use.
We expect that research and development expenses will increase in absolute dollars and vary from period to period as a percentage of revenue for the foreseeable future as we continue to invest in research and development activities relating to ongoing improvements to and maintenance and testing of our platform offerings including website, mobile apps, and other products, and other research and development programs, including the hiring of engineering, product development, and design employees to support these efforts.
Marketing. Marketing expense primarily consists of expenses associated with personnel-related compensation costs, including stock-based compensation, and costs related to user acquisition, public relations, marketing events such as Posh Parties, and business development. User acquisition costs primarily consist of costs associated with acquiring new users by spend on advertising channels such as television, Google, Facebook, Instagram, Snapchat, and TikTok. These marketing expenses also include promotional credits and incentives issued to buyers to encourage buyer activity on our platform in excess of shipping facilitation revenue and cost of referral incentives for new user acquisition. We plan to continue to invest in our marketing efforts, including hiring additional employees, in order to attract new users.
We expect that marketing expenses will increase in absolute dollars and vary from period to period as a percentage of revenue for the foreseeable future as we plan to continue to invest in marketing to grow the number of Active Users and Active Buyers and increase our brand awareness. The trend and timing of our brand marketing expenses will depend in part on the timing of marketing campaigns.
General and Administrative. General and administrative expense consists primarily of employee related costs including stock-based compensation for those employees associated with administrative services such as legal, human resources, information technology, accounting, and finance, and all related costs associated with our facilities, such as rent and office administration. These expenses also include certain third-party consulting services, facilities, IT services, meals and other corporate costs not allocated to other expense categories.
We expect that general and administrative expenses will increase in absolute dollars and vary from period to period as a percentage of revenue for the foreseeable future as we continue to invest in personnel, corporate infrastructure, and systems required to support our strategic initiatives, the growth of our business, and our compliance and reporting obligations, and controls to enable our internal support functions to scale with the growth of our business. We expect to incur additional expenses as a result of operating as a public company, including expenses to comply with the rules and regulations applicable to companies listed on a national securities exchange, expenses related to compliance and reporting obligations pursuant to the rules and regulations of the SEC, and expenses for general and director and officer insurance, investor relations, and professional services. We also expect rent expense and other facilities related costs to continue to increase in the future.
Depreciation and Amortization. Depreciation and amortization expense primarily consists of depreciation of computer equipment and software, furniture and fixtures, leasehold improvements, website development and software for internal use and amortization of intangible assets.
We expect that depreciation and amortization expense will increase in absolute dollars as we continue to build out our network infrastructure, recognize amortization expense from acquired intangible assets resulting from acquisitions and establish new office locations to support our growth.
28
Interest Income
Interest income primarily relates to amounts earned on our cash and cash equivalents.
Other Income (Expense), Net
Other income (expense), net mainly relates to changes in fair value of the Convertible Notes, redeemable convertible preferred stock warrants and contingent consideration relating to acquisition, and foreign exchange remeasurement gains and losses recorded from consolidating our foreign subsidiaries at each period end.
Provision for Income Taxes
Our provision for income taxes consists primarily of foreign taxes and state minimum taxes in the United States. As we expand the scale of our international business activities, any changes in the U.S. and foreign taxation of such activities may increase our overall provision for income taxes in the future. We have established a valuation allowance for our U.S. deferred tax assets, including federal and state net operating losses.
We expect to maintain this valuation allowance until it becomes more likely than not that the benefit of our federal and state deferred tax assets will be realized by way of expected future taxable income in the United States.
Results of Operations
The following tables set forth our condensed consolidated results of operations data and such data as a percentage of net revenue for the periods presented:
|
|
Three Months Ended March 31, |
|
|||||
|
|
2022 |
|
|
2021 |
|
||
|
|
(in thousands) |
|
|||||
Net revenue |
|
$ |
90,899 |
|
|
$ |
80,727 |
|
Costs and expenses (1): |
|
|
|
|
|
|
||
Cost of net revenue, exclusive of depreciation and |
|
|
15,031 |
|
|
|
12,970 |
|
Operations and support |
|
|
15,353 |
|
|
|
14,894 |
|
Research and development |
|
|
16,056 |
|
|
|
18,800 |
|
Marketing |
|
|
42,847 |
|
|
|
35,249 |
|
General and administrative |
|
|
15,036 |
|
|
|
18,152 |
|
Depreciation and amortization |
|
|
1,020 |
|
|
|
790 |
|
Total costs and expenses |
|
|
105,343 |
|
|
|
100,855 |
|
Loss from operations |
|
|
(14,444 |
) |
|
|
(20,128 |
) |
Interest income |
|
|
51 |
|
|
|
86 |
|
Other income, net |
|
|
|
|
|
|
||
Change in fair value of redeemable convertible preferred |
|
|
— |
|
|
|
(2,816 |
) |
Change in fair value of the convertible notes |
|
|
— |
|
|
|
(49,481 |
) |
Loss on extinguishment of the convertible notes |
|
|
— |
|
|
|
(1,620 |
) |
Change in fair value of contingent consideration |
|
|
437 |
|
|
|
— |
|
Other, net |
|
|
66 |
|
|
|
(42 |
) |
|
|
|
503 |
|
|
|
(53,959 |
) |
Loss before provision for income taxes |
|
|
(13,890 |
) |
|
|
(74,001 |
) |
Provision for income taxes |
|
|
132 |
|
|
|
140 |
|
Net loss attributable to common stockholders |
|
$ |
(14,022 |
) |
|
$ |
(74,141 |
) |
29
|
|
Three Months Ended March 31, |
|
|||||
|
|
2022 |
|
|
2021 |
|
||
|
|
(in thousands) |
|
|||||
Operations and support |
|
$ |
1,040 |
|
|
$ |
2,218 |
|
Research and development |
|
|
4,506 |
|
|
|
10,641 |
|
Marketing |
|
|
1,378 |
|
|
|
3,289 |
|
General and administrative |
|
|
1,811 |
|
|
|
7,993 |
|
Total |
|
$ |
8,735 |
|
|
$ |
24,141 |
|
Comparison of Three Months Ended March 31, 2022 and 2021
Net Revenue
|
|
Three Months Ended March 31, |
|
|
Change |
|
||||||||||
|
|
2022 |
|
|
2021 |
|
|
$ |
|
|
% |
|
||||
|
|
(dollars in thousands, except percentages) |
|
|||||||||||||
Net revenue |
|
$ |
90,899 |
|
|
$ |
80,727 |
|
|
$ |
10,172 |
|
|
|
13 |
% |
Net revenue increased $10.2 million for the three months ended March 31, 2022 compared to the same period in 2021. This growth was primarily due to an increase in the volume of GMV on our marketplace to a total of $493.4 million, an increase of 12%. The increase in GMV was substantially driven by the increase in Active Buyers on the platform to 7.8 million for the trailing 12 months ended March 31, 2022, a 16% increase compared to the same period in 2021.
Cost of Net Revenue
|
|
Three Months Ended March 31, |
|
|
Change |
|
||||||||||
|
|
2022 |
|
|
2021 |
|
|
$ |
|
|
% |
|
||||
|
|
(dollars in thousands, except percentages) |
|
|||||||||||||
Cost of net revenue |
|
$ |
15,031 |
|
|
$ |
12,970 |
|
|
$ |
2,061 |
|
|
|
16 |
% |
Percentage of revenue |
|
|
17 |
% |
|
|
16 |
% |
|
|
|
|
|
|
||
Cost of net revenue increased $2.1 million for three months ended March 31, 2022 compared to the same period in 2021. The increase was driven by a $1.1 million increase in data hosting costs to support the increased usage of our platform and upgrades we made to our systems which were required to support our growth, and a $1.0 million increase in costs related to overall volume increases on our marketplace, including increased credit card processing fees and associated expenses.
Operations and Support
|
|
Three Months Ended March 31, |
|
|
Change |
|
||||||||||
|
|
2022 |
|
|
2021 |
|
|
$ |
|
|
% |
|
||||
|
|
(dollars in thousands, except percentages) |
|
|||||||||||||
Operations and support |
|
$ |
15,353 |
|
|
$ |
14,894 |
|
|
$ |
459 |
|
|
|
3 |
% |
Percentage of revenue |
|
|
17 |
% |
|
|
18 |
% |
|
|
|
|
|
|
||
Operations and support expense increased $0.5 million for the three months ended March 31, 2022 compared to the same period in 2021. The increase was primarily driven by a $0.4 million increase in net shipping costs as a result of our growth.
Research and Development
|
|
Three Months Ended March 31, |
|
|
Change |
|
||||||||||
|
|
2022 |
|
|
2021 |
|
|
$ |
|
|
% |
|
||||
|
|
(dollars in thousands, except percentages) |
|
|||||||||||||
Research and development |
|
$ |
16,056 |
|
|
$ |
18,800 |
|
|
$ |
(2,744 |
) |
|
|
(15 |
)% |
Percentage of revenue |
|
|
18 |
% |
|
|
23 |
% |
|
|
|
|
|
|
||
Research and development expense decreased $2.7 million for the three months ended March 31, 2022 compared to the same period in 2021. The decrease was primarily due to a $3.2 million decrease in engineering personnel costs attributable to a one-time cumulative stock-based compensation recognized due to the satisfaction of the performance-based vesting condition for our outstanding RSUs upon the effectiveness of our IPO in January 2021, partially offset by a $0.3 million increase in development-related services.
30
Marketing
|
|
Three Months Ended March 31, |
|
|
Change |
|
||||||||||
|
|
2022 |
|
|
2021 |
|
|
$ |
|
|
% |
|
||||
|
|
(dollars in thousands, except percentages) |
|
|||||||||||||
Marketing |
|
$ |
42,847 |
|
|
$ |
35,249 |
|
|
$ |
7,598 |
|
|
|
22 |
% |
Percentage of revenue |
|
|
47 |
% |
|
|
44 |
% |
|
|
|
|
|
|
||
Marketing expense increased $7.6 million for the three months ended March 31, 2022 compared to the same period in 2021. The increase was primarily due to a $8.2 million in spending on marketing programs, including increased spending on television ad campaigns and digital marketing, partially offset by a $0.6 million decrease in marketing personnel costs attributable to a one-time cumulative stock-based compensation recognized due to the satisfaction of the performance-based vesting condition for our outstanding RSUs upon the effectiveness of our IPO in January 2021.
General and Administrative
|
|
Three Months Ended March 31, |
|
|
Change |
|
||||||||||
|
|
2022 |
|
|
2021 |
|
|
$ |
|
|
% |
|
||||
|
|
(dollars in thousands, except percentages) |
|
|||||||||||||
General and administrative |
|
$ |
15,036 |
|
|
$ |
18,152 |
|
|
$ |
(3,116 |
) |
|
|
(17 |
)% |
Percentage of revenue |
|
|
17 |
% |
|
|
22 |
% |
|
|
|
|
|
|
||
General and administrative expense decreased $3.1 million for the three months ended March 31, 2022 compared to the same period in 2021. This decrease was primarily driven by a $4.3 million decrease in personnel costs attributable to a one-time cumulative stock-based compensation recognized due to the satisfaction of the performance-based vesting condition for our outstanding RSUs upon the effectiveness of our IPO in January 2021, partially offset by a $1.0 million increase in legal and consulting fees required to support our public company transition, increased IT services of $0.2 million to support the growth of our business, and increased insurance costs of $0.2 million required as a result of becoming a public company.
Depreciation and Amortization
|
|
Three Months Ended March 31, |
|
|
Change |
|
||||||||||
|
|
2022 |
|
|
2021 |
|
|
$ |
|
|
% |
|
||||
|
|
(dollars in thousands, except percentages) |
|
|||||||||||||
Depreciation and amortization |
|
$ |
1,020 |
|
|
$ |
790 |
|
|
$ |
230 |
|
|
|
29 |
% |
Percentage of revenue |
|
|
1 |
% |
|
|
1 |
% |
|
|
|
|
|
|
||
Depreciation and amortization expense increased $0.2 million for the three months ended March 31, 2022 compared to the same period in 2021. The increase was primarily driven by an increase in amortization of intangible assets, with no comparable activity in the same period in 2021.
Interest Income
|
|
Three Months Ended March 31, |
|
|
Change |
|
||||||||||
|
|
2022 |
|
|
2021 |
|
|
$ |
|
|
% |
|
||||
|
|
(dollars in thousands, except percentages) |
|
|||||||||||||
Interest income |
|
$ |
51 |
|
|
$ |
86 |
|
|
$ |
(35 |
) |
|
|
(41 |
)% |
Percentage of revenue |
|
|
0 |
% |
|
|
0 |
% |
|
|
|
|
|
|
||
Interest income change was nominal for the three months ended March 31, 2022 compared to the same period in 2021. Interest income decreased for the three months ended March 31, 2022 compared to the same period in 2021, primarily driven by the interest earned from our marketable securities in 2021, with no comparable activity in the same period in 2022.
Other Income (Expense), Net
|
|
Three Months Ended March 31, |
|
|
Change |
|
||||||||||
|
|
2022 |
|
|
2021 |
|
|
$ |
|
|
% |
|
||||
|
|
(dollars in thousands, except percentages) |
|
|||||||||||||
Other income (expense), net |
|
$ |
503 |
|
|
$ |
(53,959 |
) |
|
$ |
54,462 |
|
|
|
(101 |
)% |
Percentage of revenue |
|
|
1 |
% |
|
|
(67 |
)% |
|
|
|
|
|
|
||
31
Other income (expense), net increased $54.5 million for the three months ended March 31, 2022 compared to the same period in 2021. The increase was primarily due to a change in fair value of the convertible notes, and the change in fair value of the redeemable convertible preferred stock warrant liability, with no comparable activity in the same period in 2022.
Provision for Income Taxes
|
|
Three Months Ended March 31, |
|
|
Change |
|
||||||||||
|
|
2022 |
|
|
2021 |
|
|
$ |
|
|
% |
|
||||
|
|
(dollars in thousands, except percentages) |
|
|||||||||||||
Provision for income taxes |
|
$ |
132 |
|
|
$ |
140 |
|
|
$ |
(8 |
) |
|
|
(6 |
)% |
Percentage of revenue |
|
|
0 |
% |
|
|
0 |
% |
|
|
|
|
|
|
||
The change in our provision for income taxes was primarily attributable to pre-tax foreign earnings.
GAAP and Non-GAAP Financial Measures
We also review the following GAAP and non-GAAP financial measures to evaluate our business, measure our performance, identify trends affecting our business, formulate business plans, and make strategic decisions.
|
|
Three Months Ended March 31, |
|
|||||
|
|
2022 |
|
|
2021 |
|
||
|
|
(in thousands) |
|
|||||
Net Loss |
|
$ |
(14,022 |
) |
|
$ |
(74,141 |
) |
Net Loss Margin(1) |
|
|
(15 |
)% |
|
|
(92 |
)% |
Adjusted EBITDA |
|
$ |
(4,689 |
) |
|
$ |
4,803 |
|
Adjusted EBITDA Margin(2) |
|
|
(5 |
)% |
|
|
6 |
% |
Adjusted EBITDA
Adjusted EBITDA is a key performance measure that we use to assess our operating performance and the operating leverage in our business. Because Adjusted EBITDA facilitates internal comparisons of our historical operating performance on a more consistent basis, we use this measure for business planning purposes.
We calculate Adjusted EBITDA as net loss attributable to common stockholders, adjusted to exclude:
Reconciliation of Non-GAAP Financial Measures
We use Adjusted EBITDA and Adjusted EBITDA Margin in conjunction with GAAP measures as part of our overall assessment of our performance, including the preparation of our annual operating budget and quarterly forecasts, and to evaluate the effectiveness of our business strategies. Our definition may differ from the definitions used by other companies and therefore comparability may be limited. In addition, other companies may not publish similar metrics. Furthermore, this metric has certain limitations in that it does not include the impact of certain expenses that are reflected in our condensed consolidated statements of operations that are necessary to run our business. Thus, our Adjusted EBITDA and Adjusted EBITDA Margin should be considered in addition to, not as a substitute for, or in isolation from, measures prepared in accordance with GAAP.
We compensate for these limitations by providing a reconciliation of Adjusted EBITDA and Adjusted EBITDA Margin to the related GAAP financial measure, net loss attributable to common stockholders. We encourage investors and others to review our financial information in its entirety, not to rely on any single financial measure, and to view Adjusted EBITDA and Adjusted EBITDA Margin in conjunction with their respective related GAAP financial measures.
32
The following table provides a reconciliation of net loss to Adjusted EBITDA:
|
|
Three Months Ended March 31, |
|
|||||
|
|
2022 |
|
|
2021 |
|
||
|
|
(in thousands) |
|
|||||
Net loss attributable to common stockholders |
|
$ |
(14,022 |
) |
|
$ |
(74,141 |
) |
Adjusted to exclude the following: |
|
|
|
|
|
|
||
Depreciation and amortization |
|
|
1,020 |
|
|
|
790 |
|
Stock-based compensation |
|
|
8,735 |
|
|
|
24,141 |
|
Interest income |
|
|
(51 |
) |
|
|
(86 |
) |
Other (income) expense, net |
|
|
(503 |
) |
|
|
53,959 |
|
Provision for income taxes |
|
|
132 |
|
|
|
140 |
|
Adjusted EBITDA |
|
$ |
(4,689 |
) |
|
$ |
4,803 |
|
Liquidity and Capital Resources
As of March 31, 2022, our principal sources of liquidity were cash and cash equivalents of $596.6 million. Cash equivalents consisted of institutional money market funds, and cash in transit from third-party credit card providers that we receive within approximately three to five business days from the date of the underlying transaction.
As of March 31, 2022, our cash and cash equivalents held by our foreign subsidiaries were not material.
Since our inception, we have most often generated negative cash flows from operations and as of March 31, 2022, we had an accumulated deficit of $235.9 million, and we have financed our operations primarily through private sales of equity securities, payments received through our platform, and the issuance of convertible debt. Upon the closing of our IPO in January 2021, we received net proceeds of $292.3 million after deducting underwriting discounts and commissions and offering expenses. We believe our existing cash and cash equivalents will be sufficient to meet our working capital and capital expenditures needs over at least the next 12 months. However, our liquidity assumptions may prove to be incorrect, and we could exhaust our available financial resources sooner than we currently expect. We may seek to raise additional funds at any time through the issuance of debt, equity, and equity-linked arrangements.
Condensed Consolidated Statements of Cash Flows Data
|
|
Three Months Ended March 31, |
|
|||||
|
|
2022 |
|
|
2021 |
|
||
|
|
(in thousands) |
|
|||||
Net cash provided by (used in): |
|
|
|
|
|
|
||
Operating activities |
|
$ |
14,152 |
|
|
$ |
20,271 |
|
Investing activities |
|
|
(264 |
) |
|
|
2,461 |
|
Financing activities |
|
|
1,280 |
|
|
|
293,234 |
|
Effect of foreign exchange rate changes on cash and cash equivalents |
|
|
(92 |
) |
|
|
6 |
|
Net increase in cash and cash equivalents |
|
$ |
15,076 |
|
|
$ |
315,972 |
|
Cash Flows from Operating Activities
For the three months ended March 31, 2022, net cash provided by operating activities was $14.2 million which consisted of a net loss of $14.0 million, adjusted by non-cash charges of $9.3 million and net cash inflows from the change in net operating assets and liabilities of $18.8 million. The non-cash charges were primarily comprised of stock-based compensation of $8.7 million, and depreciation and amortization of $1.0 million. The net cash inflows from the change in our net operating assets and liabilities was primarily due to a $11.4 million increase in our accounts payable attributable to the timing of payments, a $3.3 million increase in our funds payable to customers as a result of our growth, and a $4.8 million increase in our net operating lease obligations.
For the three months ended March 31, 2021, net cash provided by operating activities was $20.3 million, which consisted of a net loss of $74.1 million, adjusted by non-cash charges of $78.9 million and net cash inflows from the change in net operating assets and liabilities of $15.5 million. The non-cash charges were primarily comprised of the change in fair value of convertible notes of $51.1 million, stock-based compensation of $24.1 million, change in fair value of redeemable convertible preferred stock warrant liability of $2.8 million, and depreciation and amortization of $0.8 million. The net cash inflows from the change in our net operating assets and liabilities was primarily due to a $10.5 million increase in our funds payable to customers as a result of our growth, and a $3.1 million increase in our accounts payable attributable to the timing of payments.
Cash Flows from Investing Activities
For the three months ended March 31, 2022, net cash used in investing activities of $0.3 million, was attributable to the purchase of property and equipment.
33
For the three months ended March 31, 2021, net cash provided by investing activities of $2.5 million, was mainly attributable to the proceeds from the maturities of marketable securities.
Cash Flows from Financing Activities
For the three months ended March 31, 2022, cash provided by financing activities was $1.3 million, which consisted of proceeds from the exercise of stock options.
For the three months ended March 31, 2021, cash provided by financing activities was $293.2 million, which consisted primarily of net proceeds from our IPO.
Concentration of Credit Risk
We are subject to concentration of credit risk principally from cash and cash equivalents. We reduce credit risk by placing our cash and cash equivalents with major financial institutions with high credit ratings. No customer accounted for 10% or more of our net revenue as of and for the three months ended March 31, 2022 and 2021.
Contractual Obligations and Commitments
As of March 31, 2022, there were no material changes outside the ordinary course of business to the contractual obligations, as disclosed in our Annual Report on Form 10-K for the year ended December 31, 2021.
Critical Accounting Policies and Estimates
Our condensed consolidated financial statements and accompanying notes have been prepared in accordance with GAAP. The preparation of these condensed consolidated financial statements requires us to make estimates and assumptions that affect the amounts reported amounts of assets, liabilities, revenue and expenses, and related disclosures. We base our estimates on historical experience and on various other assumptions that we believe are reasonable under the circumstances. We evaluate our estimates and assumptions on an ongoing basis. Actual results may differ from these estimates. To the extent that there are material differences between these estimates and our actual results, our future financial statements will be affected.
For additional information about our critical accounting policies and estimates, see the disclosure included in our Annual Report on Form 10-K as well as Note 2 – Summary of Significant Accounting Policies in the Notes to Condensed Consolidated Financial Statements (unaudited) included in Part I, Item 1, of this Quarterly Report on Form 10-Q.
Recent Accounting Pronouncements
See “Note 2 — Summary of Significant Accounting Policies — Recently Issued Accounting Pronouncements” in the Notes to Condensed Consolidated Financial Statements (unaudited).
Item 3. Quantitative and Qualitative Disclosures About Market Risk.
We are exposed to market risks in the ordinary course of our business. Market risk represents the risk of loss that may impact our financial position due to adverse changes in financial market prices and rates. Our market risk exposure is primarily the result of fluctuations in interest rates and foreign currency exchange rates.
Interest Rate Risk
As of March 31, 2022, we had cash and cash equivalents of $596.6 million, which consisted primarily of cash held in one high-credit quality financial institution within the United States, cash in transit from third-party credit card providers, and institutional money market funds, which each carry a degree of interest rate risk. Changes in interest rates affect the interest income we earn on our cash and cash equivalents, and the fair value of our cash equivalents. A hypothetical 10% change in interest rates would not have a material impact on our financial condition or results of operations due to the short-term nature of our investment portfolio as of March 31, 2022.
Foreign Currency Exchange Risk
Our revenue is denominated in U.S. dollars. Our expenses are primarily denominated in U.S. dollars, except for our non-U.S. operations, which are denominated in the local currency. As our operations in countries outside of the United States grow, our results of operations and cash flows may be subject to fluctuations due to changes in foreign currency exchange rates. To date, these fluctuations have not been material. As exchange rates vary, our operating loss may differ from expectations. To date, we have not entered into any
34
foreign currency hedging contracts, although we may do so in the future. A hypothetical 10% increase or decrease in the relative value of the U.S. dollar to other currencies would not have a material effect on our operating results as of March 31, 2022.
Item 4. Controls and Procedures.
Evaluation of Disclosure Controls and Procedures
Our management, with the participation of our Chief Executive Officer and Chief Financial Officer, evaluated the effectiveness of our disclosure controls and procedures defined in Rules 13a-15(e) and 15d-15(e) under the Securities Exchange Act of 1934, as amended (“Exchange Act”) as of March 31, 2022. Based on this evaluation, our Chief Executive Officer and Chief Financial Officer concluded that, as of March 31, 2022, our disclosure controls and procedures were not effective due to a material weakness in internal control over financial reporting, as described in Item 9A. “Controls and Procedures–Management’s Annual Report on Internal Control Over Financial Reporting” of our Annual Report on Form 10-K for the year ended December 31, 2021.
Remediation Plan to Address Material Weakness
Our management is taking steps to enhance our internal control over financial reporting and remediate the material weakness identified during the year ended December 31, 2021 related to the completeness and accuracy of third-party data used to calculate and record chargebacks. During the quarter ended March 31, 2022, we made progress in our remediation of the material weakness noted above by designing new procedures to obtain completeness and accuracy of third-party data used to calculate and record chargebacks. To assess our remediation progress, during the second quarter of 2022, we plan to test the implementation of our redesigned process using financial information of the first quarter of 2022. These controls will not be deemed effective until performed effectively for the year ended December 31, 2022.
We believe the measures described above will remediate the material weakness we have identified, however we cannot provide any assurance that our remediation efforts will be successful or that our internal control over financial reporting will be effective as a result of these efforts. We are committed to continuing to improve our internal control processes and will continue to review, optimize, and enhance our financial reporting controls and procedures. As we continue to evaluate and work to improve our internal control over financial reporting, we may take additional measures to address control deficiencies, or we may modify certain of the remediation measures described above. The material weakness will not be considered remediated until the applicable controls operate for a sufficient period of time and management has concluded, through testing, that these controls are operating effectively.
Changes in Internal Control Over Financial Reporting
There have been no changes in our internal control over financial reporting during the quarter ended March 31, 2022 that have materially affected, or are reasonably likely to materially affect, our internal control over financial reporting.
Inherent Limitations on Effectiveness of Controls
Our management, including our Chief Executive Officer and our Chief Financial Officer, believes that our disclosure controls and procedures and internal control over financial reporting are designed to provide reasonable assurance of achieving their objectives and are effective at the reasonable assurance level. However, our management does not expect that our disclosure controls and procedures or our internal control over financial reporting will prevent all errors and all fraud. A control system, no matter how well conceived and operated, can provide only reasonable, not absolute, assurance that the objectives of the control system are met. Further, the design of a control system must reflect the fact that there are resource constraints, and the benefits of controls must be considered relative to their costs. Because of the inherent limitations in all control systems, no evaluation of controls can provide absolute assurance that all control issues and instances of fraud, if any, have been detected. These inherent limitations include the realities that judgments in decision making can be faulty, and that breakdowns can occur because of a simple error or mistake. Additionally, controls can be circumvented by the individual acts of some persons, by the collusion of two or more people or by management override of controls. The design of any system of controls is also based in part upon certain assumptions about the likelihood of future events, and there can be no assurance that any design will succeed in achieving its stated goals under all potential future conditions; over time, controls may become inadequate because of changes in conditions, or the degree of compliance with policies or procedures may deteriorate. Because of the inherent limitations in a cost-effective control system, misstatements due to error or fraud may occur and not be detected.
35
PART II—OTHER INFORMATION
Item 1. Legal Proceedings.
See “Note 6 — Commitments and Contingencies — Litigation and Loss Contingencies” of the Notes to Condensed Consolidated Financial Statements included in Part I, Item 1 of this Quarterly Report on Form 10-Q, which is incorporated herein by reference.
Item 1A. Risk Factors.
Risk factors affecting our business are discussed in Item 1A of our Annual Report on Form 10-K for the year ended December 31, 2021, filed with the SEC on March 30, 2022. Except as presented below, there have been no material changes to our risk factors as disclosed in the Annual Report on Form 10-K for the year ended December 31, 2021.
The dual class structure of our common stock has the effect of concentrating voting control with certain stockholders, which will limit your ability to influence the outcome of important transactions, including a change in control.
Our Class B common stock has ten votes per share, and our Class A common stock have one vote per share. The holders of our Class B common stock, certain of whom are our founders, executive officers and directors, together hold approximately 82.1% of the voting power of our outstanding capital stock as of May 2, 2022. Of this 82.1% voting power, entities affiliated with Mayfield hold approximately 57.6% of the voting power of our outstanding capital stock as of May 2, 2022.
Holders of our Class B common stock collectively control a majority of the combined voting power of our share capital even if their stock holdings represent less than 50% of the outstanding shares of our common stock. Because of the 10-to-1 voting ratio between our Class B and Class A common stock, the holders of our Class B common stock collectively control a majority of the combined voting power of our common stock even if the shares of Class B common stock were to represent as little as 10% of the combined voting power of all outstanding shares of our Class A and Class B common stock. Therefore, holders of Class B common stock will likely be able to control substantially all matters submitted to our stockholders for approval until the ten-year anniversary of the closing of our initial public offering when the Class B common stock class sunsets and converts into Class A common stock, or such other date as described in our amended and restated certificate of incorporation that may cause the Class B common stock class to convert into Class A common stock. These holders of our Class B common stock may also have interests that differ from yours and may vote in a way with which you disagree and which may be adverse to your interests. This concentrated control may have the effect of delaying, preventing, or deterring a change in control of our company, could deprive our stockholders of an opportunity to receive a premium for their shares as part of a sale of our company and might ultimately affect the market price of our Class A common stock.
Future transfers by holders of our Class B common stock will generally result in those shares converting into our Class A common stock, subject to limited exceptions, such as certain transfers effected for estate planning purposes. The conversion of our Class B common stock into our Class A common stock will have the effect, over time, of increasing the relative voting power of those holders of Class B common stock who retain their shares in the long term. If, for example, Mr. Chandra retains a significant portion of his holdings of Class B common stock for an extended period of time, he could, in the future, control a majority of the combined voting power of our Class A and Class B common stock. As a board member, Mr. Chandra owes a fiduciary duty to our stockholders and must act in good faith in a manner he reasonably believes to be in the best interests of our stockholders. As a stockholder, even a controlling stockholder, Mr. Chandra is entitled to vote his shares in his own interests, which may not always be in the interests of our stockholders generally.
Item 2. Unregistered Sales of Equity Securities and Use of Proceeds.
(a) Recent Sales of Unregistered Equity Securities
None.
(b) Use of Proceeds from our IPO
The offer and sale of the shares in the IPO was registered under the Securities Act pursuant to a registration statement on Form S-1 (File No. 333-251427), which was declared effective by the SEC on January 13, 2021. Pursuant to such registration statement, we issued and sold an aggregate of 7,590,000 shares of our common stock at a price of $42.00 per share for aggregate cash proceeds of approximately $292.3 million, net of underwriting discounts and commissions and offering costs, which includes the full exercise by the underwriters of their option to purchase additional shares of common stock. None of the underwriting discounts and commissions or offering expenses were incurred or paid, directly or indirectly, to any of our directors or officers or their associates or to persons owning 10% or more of our common stock or to any of our affiliates.
There has been no material change in the expected use of the net proceeds from our IPO, as described in our final prospectus filed with the SEC on January 14, 2021 pursuant to Rule 424(b) under the Securities Act of 1933.
36
Item 3. Defaults Upon Senior Securities.
None.
Item 4. Mine Safety Disclosures.
None.
Item 5. Other Information.
None.
37
Item 6. Exhibits.
Exhibit Number |
|
Description |
|
|
|
31.1* |
|
|
|
|
|
31.2* |
|
|
|
|
|
32.1* |
|
|
|
|
|
32.2* |
|
|
|
|
|
101.INS |
|
Inline XBRL Instance Document – the instance document does not appear in the Interactive Data File because its XBRL tags are embedded within the Inline XBRL document. |
101.SCH |
|
Inline XBRL Taxonomy Extension Schema Document |
101.CAL |
|
Inline XBRL Taxonomy Extension Calculation Linkbase Document |
101.DEF |
|
Inline XBRL Taxonomy Extension Definition Linkbase Document |
101.LAB |
|
Inline XBRL Taxonomy Extension Label Linkbase Document |
101.PRE |
|
Inline XBRL Taxonomy Extension Presentation Linkbase Document |
104 |
|
Cover Page Interactive Data File (formatted as Inline XBRL and contained in Exhibit 101) |
* Filed herewith.
38
SIGNATURES
Pursuant to the requirements of the Securities Exchange Act of 1934, the registrant has duly caused this report to be signed on
its behalf by the undersigned thereunto duly authorized.
|
|
Poshmark, Inc. |
|
|
|
|
|
Date: May 13, 2022 |
|
By: |
/s/ Manish Chandra |
|
|
|
Manish Chandra |
|
|
|
Co-Founder, President, Chief Executive Officer, and Chairman of the Board |
|
|
|
|
Date: May 13, 2022 |
|
By: |
/s/ Rodrigo Brumana |
|
|
|
Rodrigo Brumana |
|
|
|
Chief Financial Officer |
39
Serious News for Serious Traders! Try StreetInsider.com Premium Free!
You May Also Be Interested In
- RiverNorth Opportunities Fund, Inc., RiverNorth/DoubleLine Strategic Opportunity Fund, Inc. and RiverNorth Capital and Income Fund, Inc. Announce Preferred Dividends
- NLS Pharmaceutics Announces Receipt of Staff Delisting Determination from Nasdaq; Intends to Request Hearing
- I'm Breaking New Ground at CNH - Katie Hoare
Create E-mail Alert Related Categories
SEC FilingsSign up for StreetInsider Free!
Receive full access to all new and archived articles, unlimited portfolio tracking, e-mail alerts, custom newswires and RSS feeds - and more!
